measurement of complex refractive index of human blood by low-coherence interferometry
TRANSCRIPT
Eur. Phys. J. Special Topics 222, 2367–2372 (2013)c© EDP Sciences, Springer-Verlag 2013DOI: 10.1140/epjst/e2013-02018-7
THE EUROPEANPHYSICAL JOURNALSPECIAL TOPICS
Regular Article
Measurement of complex refractive index ofhuman blood by low-coherence interferometry
M. Jedrzejewska-Szczerskaa
Department of Metrology and Optoelectronics, Gdansk University of Technology, 11/12 G.Narutowicza Str., 80-233 Gdansk, Poland
Received 8 June 2013 / Received in final form 9 August 2013Published online 23 October 2013
Abstract. In this article, the usefulness of the optical technique formeasurements of blood complex refractive index has been examined.Measurement of optical properties of human blood is difficult to per-form because of its nonuniform nature. However, results of my inves-tigation have shown the usefulness of low-coherence interferometry formeasurement complex refractive index of human blood. Furthermore,mathematical analysis of spectrum of measured signal have made pos-sible to determined relationship between complex refractive index andhematocrit level in human blood.
1 Introduction
Blood is one of the most important tissues of human body. Its analysis is the most fre-quently performed procedure in medical diagnosis, because it gives information aboutpatients’ condition. Typically, several quantities are measured in a lab. This requirestaking a sample, sending it to the lab and performing a series of tests, which maytakes even a few hours [1,2]. However, for daily life diagnosis it is often sufficient tomeasure one or only few parameters in a continuous manner. This creates a demandfor specialized measuring devices that can determine the value of one or a few para-meters preferably without resorting to laboratory diagnostic and without the need forconventional sample processing, such as centrifuging and adding reagents, in a non- orminimally-invasive way and almost instantly. Optoelectronic measurement methodshave gained popularity in medicine, health monitoring and telemedicine because oftheir unique advantages: good metrological parameters and potentially low cost [3–5].However, optical blood measurements are difficult to perform because of the natureof blood. Optical properties of blood can be consider in the micro- and macroscopicway. As a microscopic object, blood can be treated as a medium having scatteringcenters. It is a heterogeneous medium consists of plasma and blood cells, as shownin Fig. 1. Blood plasma contains almost 90% of water and 10% of protein. Bloodcells consist primarily of erythrocytes (almost 99%), leukocytes (1%) and platelets.Erythrocytes have the biggest geometrical dimensions, typically: 6.2–8.2μm [6,7].The microscopic approach of optical parameters of blood depend mainly on its
components’ optical properties: the scattering and absorbing capacity of optical
a e-mail: [email protected]

2368 The European Physical Journal Special Topics
Fig. 1. The picture of human blood sample. Darker areas are blood cells, lighter are plasma.
radiation, but also on their size and shape. On the other hand, treating blood asa macroscopic object, its optical properties become those of a homogeneous scatter-ing medium. Mainly: scattering coefficient, absorption coefficient and refractive index.In this case, the complex refractive index can be introduced as [8]:
n = n(1 + jκ) (1)
where: n – real part of complex refractive index: n = c/v ; κ – attenuation index.The absorption coefficient
χ =4π
λκ (2)
where: λ – wavelength in the medium.Equations (1) and (2) are correct if the wave equation is shown as:
E = E0 exp(kz − ωt) (3)
where: k – the wave vector; t – the phase.The complex refractive index described by equation (1) is an adequate parameter
to characterize blood as a homogeneous dispersion medium.
2 Low-coherence interferometry
The complex refractive index of blood samples has been investigated by means of low-coherence interferometry. The measurement system consists of a broadband source,a sensing interferometer and an optical processor. The light from the broadbandsource is transmitted to the sensing interferometer where the amplitude of light isdivided into two components. An optical path difference (OPD), which depends onthe instantaneous value of the measurand, is introduced between them. The measuredsignal from the sensing interferometer is transmitted back to the optical processor.[10,11]
Advances in Atomic and Molecular Spectroscopy 2369
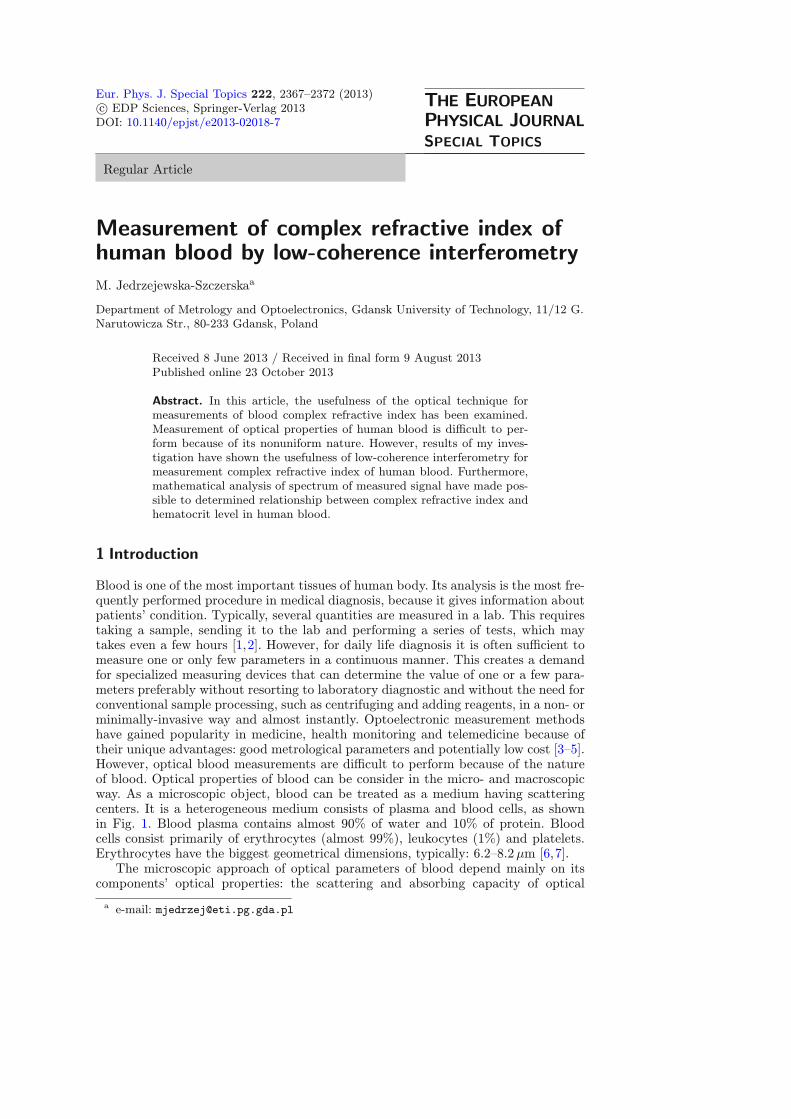
Fig. 2. Measurement set-up: a) layout; b) photography.
Because the system works in the phase domain, an optical processor spectralanalyser has been used as the detector set-up. Since the spectral signal processing isutilized, the measurement signal can be described as [12]:
Iout(ν) = S(ν)[1 + V0 cos(ΔΦ(ν))] (4)
where: S(ν) – the spectral distribution of the light source; V0 – visibility of interfer-ence fringes, ΔΦ(ν) – the phase difference between interfering beams: Φ(ν) = 2πνδ/c,δ – optical path difference, c – velocity of the light in vacuum.In the spectral domain signal processing the modulation frequency of the measure-
ment signal gives information about the measurand (Eq. (4)) [13]. It occurs in changeof modulation frequency of spectrum what can be easily observed by controlling thenumber of maximums in the measured spectrum. In this article I used terminologyborrowed from time domain signal processing and in this case the name number offringes means those maximums in the spectra of measured signal.
3 Measurement set-up
The measurements have been conducted with the use of a low-coherence optical fibreinterferometry set-up developed at our laboratory (Fig. 2). As an optical processorOptical Spectrum Analyzer Ando AQ6319 (wavelength resolution of 1 nm, wavelengthaccuracy of ±50 pm) has been used. As a low-coherence source a super lumines-cent diode Superlum Broadlighter S1300-G-I-20 with following optical parameters:λ0 = 1290 nm, δλ = 50nm has been applied. In order to find out whether proposedmethod has sufficient accuracy to monitor the blood parameters, series of in-vitromeasurements were carried out.During experimental work about 100 samples of the whole human blood has been
used for tests. Sets of 2ml blood samples with various blood parameters, such as hema-tocrit and hemoglobine, level have been provided by the Gdansk Blood Donor Centre.Samples have been taken from rather healthy volunteers and therefore measurementrange of the blood parameters has been limited to the value of blood parameters ofhealthy persons. However, the use of those samples has allowed me to investigate therelationship between measured quantities and the output of the measurement system.
2370 The European Physical Journal Special Topics
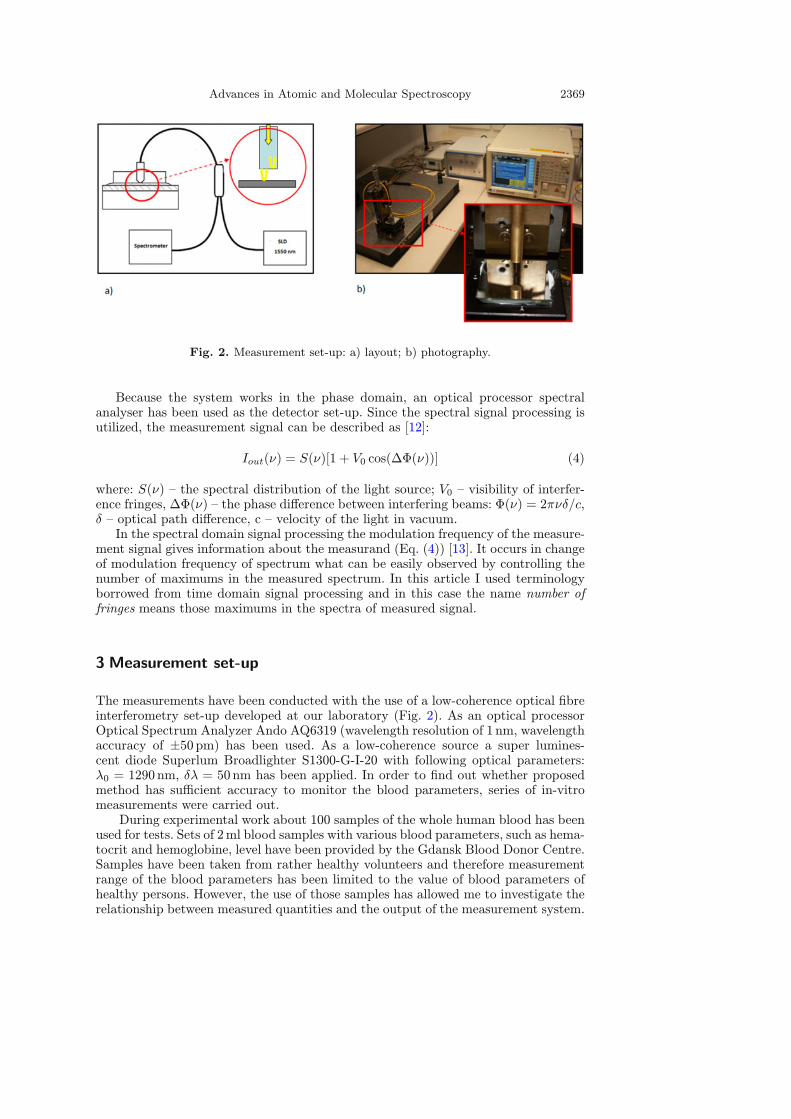
Fig. 3. Measured signal: a) for low complex refractive index, b) for high complex refractiveindex.
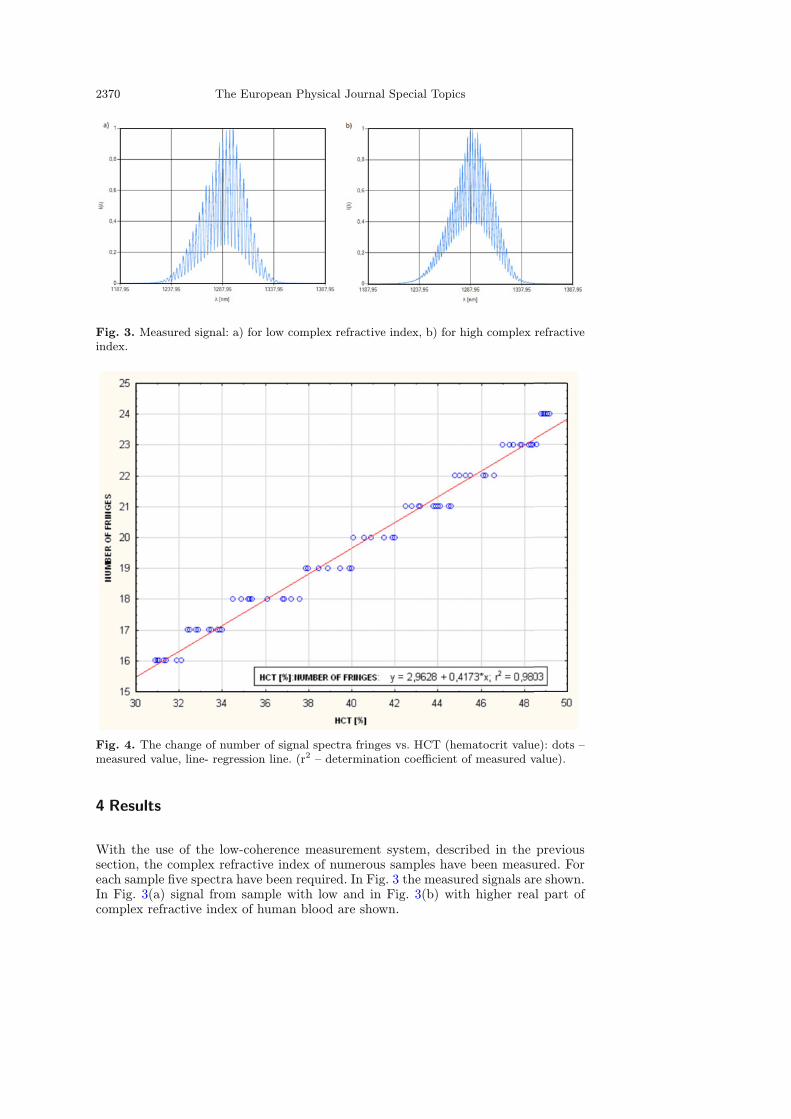
Fig. 4. The change of number of signal spectra fringes vs. HCT (hematocrit value): dots –measured value, line- regression line. (r2 – determination coefficient of measured value).
4 Results
With the use of the low-coherence measurement system, described in the previoussection, the complex refractive index of numerous samples have been measured. Foreach sample five spectra have been required. In Fig. 3 the measured signals are shown.In Fig. 3(a) signal from sample with low and in Fig. 3(b) with higher real part ofcomplex refractive index of human blood are shown.

Advances in Atomic and Molecular Spectroscopy 2371
It can be noted that the change in the real part of complex refractive index ofmeasured sample changes the modulation frequency of measured spectra, which influ-ences the number of fringes in measured spectra. On the other hands, the imaginarypart influences the value of visibility of measured signal, what is shown in Fig. 3. Theanalysis of measured signal has been focused on finding correlation between analyticblood parameters used in medicine such as hematocrit and complex refractive indexwhich can be measured by the use of low-coherence methods. Obtained results havebeen used as an input data to the model that determines the level hematocrit inblood. (Fig. 4).Investigation of this method confirms its ability to determine hematocrit value
(defined as the ratio of packed red blood cells volume to whole blood volume [14])with appropriate measurement parameters. The best configuration of the sensor headhas yielded sensitivity of measurement at the value of 2.963%/nm; and correlation co-efficient at the value of 0,98 was obtained from the approximation of the measurementseries (Fig. 4).
5 Conclusion
The complex refractive index contains important information about optical proper-ties of investigated object. In this paper low-coherent technique of measurement ofcomplex refractive index of human blood has been described. The low-coherence in-terferometer, which was designed and elaborated at our laboratory, has been shown.The theoretical analysis and experimental results made it possible to select best con-struction, which was implemented in low-coherence fibre-optic sensors of refractiveindex.Results of investigation showed the usefulness of low-coherence interferometry for
measurement of complex refractive index of human blood. Furthermore, mathematicalanalysis of spectrum of measured signal made possible to determined relationshipbetween complex refractive index and hematocrit of human blood.This preliminary study can gives opportunity to elaborate non- or minimally-
invasive diagnostic method.
This study was partially supported by the National Science Center under the grantno.2011/03/D/ST7/03540, titled: “Investigation of the relationship between the spectrumof optical signal and blood properties” as well as DS Programs of the Faculty of Electronics,Telecommunications and Informatics, Gdansk University of Technology.
References
1. R. Handin, S. Lux, T. Stosselr, Blood: Principles & Practice of Hematology (LippincottWilliams & Wilkins, Philadelphia, 2003)
2. J. Greer, J. Foerrster, G. Rodgers, F. Paraskevas, B. Glader, D. Arber, R. Means,Wintrobe’s Clinical Hematology (Lippincott Williams & Wilkins, Philadelphia, 2008)
3. J. Lopez-Higuera (ed.), Handbook of optical fiber sensing technology (John Wiley & SonsLtd., Chichester, 2002), p. 705
4. V. Prosolovska, Proc. SPIE, 77971C, 7797 (2010)5. P. Wierzba, B. Kosmowski, Optica Applicata 35, 171 (2005)6. J. Heijmans, L. Cheng, F. Wieringa, IFMBE Proc. 22, 2330 (2009)7. V. Tuchin, Optical clearing of tissue and blood (SPIE, Washington, 2006)8. V. Tuchin, Handbook of Optical Biomedical Diagnostics (SPIE Press, Washington, 2002),p. 173

2372 The European Physical Journal Special Topics
9. M. Born, E. Wolf, Principles of Optics (Pergamon Press, Oxford, 1993), p. 61310. P. Hlubina, T. Martnkien, W. Urbaczyk, Optics Express 11, 2793 (2003)11. M. Jdrzejewska-Szczerska, M. Gnyba, B. Kosmowski, Acta Physica Polonica A 120, 621(2011)
12. S. Egorov, A. Mamaev, I. Likhachiev, Proc. SPIE 1972, 362 (1999)13. P. Hlubina, Optik 114, 185 (2003)14. M. Jdrzejewska-Szczerska, M. Gnyba, Acta Physica Polonica A (2011)