measurement and evaluation of reliability, availability ... · pdf filemeasurement and...
TRANSCRIPT

International Journal of Scientific and Research Publications, Volume 3, Issue 9, September 2013 1 ISSN 2250-3153
www.ijsrp.org
Measurement and Evaluation of Reliability, Availability
and Maintainability of a Diesel Locomotive Engine
D.Bose1, G.Ghosh
2, K.Mandal
3, S.P.Sau
4, S.Kunar
5
1, 2,3
Mechanical Engineering & 4Computer Science and Technology, NITTTR, India
5Production Engineering, Jadavpur University, India
Abstract- The growing complexity of equipments and systems often lead to failures and as a consequence the aspects of reliability,
maintainability and availability have come into forefront. The failure of machineries and equipments causes disruption in production
resulting from a loss of availability of the system and also increases the cost of maintenance. The present study deals with the
determination of reliability and availability aspects of one of the significant constituent in a Railway Diesel Locomotive Engine. In
order to assess the availability performance of these components, a broad set of studies has been carried out to gather accurate
information at the level of detail considered suitable to meet the availability analysis target. The Reliability analysis is performed
using the Weibull Distribution and the various data plots as well as failure rate information help in achieving results that may be
utilized in the near future by the Railway Locomotive Engines for reducing the unexpected breakdowns and will enhance the
reliability and availability of the Engine. In this work, ABC analysis has been used for the maintenance of spare parts inventory. Here,
compressor and vehicle and structures are used to focus on the reliability, maintainability and availability aspects.
Index Terms- Availability, ABC analysis, compressor, maintainability, reliability, vehicle and structures, Weibull Distribution.
I. INTRODUCTION
The Reliability of an item is the probability that the item will perform a specific function under specified operational and
environmental conditions at end throughout a specified time [1].Reliability must have certain criteria. It depends on numerous factors,
most of which are random. It is difficult to measure reliability since there is no instrument by means of which this may be done for
particular equipment. The respective reliabilities of the various components of complex equipment depend on the technology of their
production, the quality of materials used in their manufacture, the conditions or environment in which they operate and so on. In view
of these considerations, the reliability of equipment is closely related to several uncertainty factors. The Quantitative study of
uncertainty, therefore, forms the starting point for a quantitative analysis of reliability. The theory which deals with the study of
uncertainty is the probability theory. The maintenance policy will cover issues regarding general repairs, repair or discard policies,
emergency recorder policies, inventory control, provisioning of spares, etc. It is possible to define some of the maintenance policies in
advance and take design decision accordingly. The process of designing involves decision regarding module size, test procedures,
built-in-redundancies, and degree of automation, inspection intervals, special test equipment, and safety requirements and so on
Availability is a performance criterion for repairable systems that accounts for both the reliability and maintainability properties of a
component or system. ABC analysis helps segregating the item from one another and fells how much valued the item is and
controlling if to what extent is in the interest of the organization [2].
II. RAILWAY DIESEL LOCOMOTIVE ENGINE AND ITS COMPONENTS
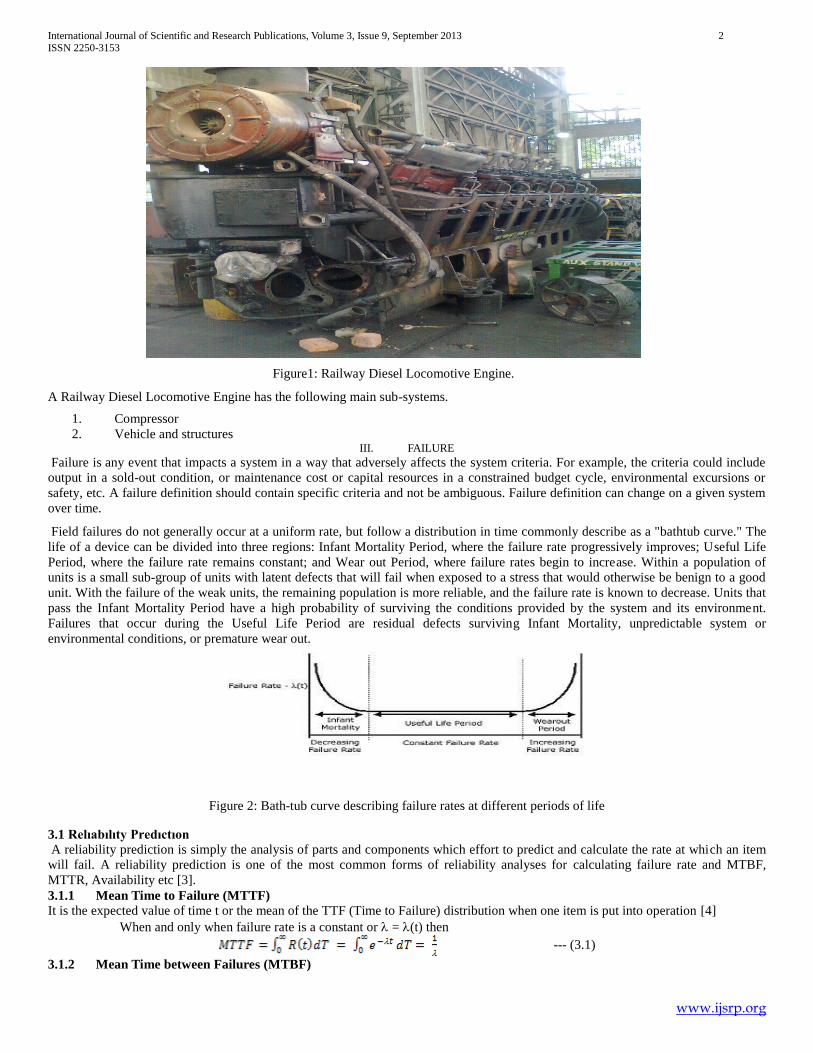
The following fig 1 shows a Railway Diesel Locomotive Engine. The engine is of ‘V’ design, and is manufactured in 16
cylinders. The cylinders are arranged into pairs of cylinders, each pair using a common throw on the crankshaft. The cylinders
are divided into two banks, left and right.
International Journal of Scientific and Research Publications, Volume 3, Issue 9, September 2013 2 ISSN 2250-3153
www.ijsrp.org
Figure1: Railway Diesel Locomotive Engine.
A Railway Diesel Locomotive Engine has the following main sub-systems.
1. Compressor
2. Vehicle and structures III. FAILURE
Failure is any event that impacts a system in a way that adversely affects the system criteria. For example, the criteria could include
output in a sold-out condition, or maintenance cost or capital resources in a constrained budget cycle, environmental excursions or
safety, etc. A failure definition should contain specific criteria and not be ambiguous. Failure definition can change on a given system
over time.
Field failures do not generally occur at a uniform rate, but follow a distribution in time commonly describe as a "bathtub curve." The
life of a device can be divided into three regions: Infant Mortality Period, where the failure rate progressively improves; Useful Life
Period, where the failure rate remains constant; and Wear out Period, where failure rates begin to increase. Within a population of
units is a small sub-group of units with latent defects that will fail when exposed to a stress that would otherwise be benign to a good
unit. With the failure of the weak units, the remaining population is more reliable, and the failure rate is known to decrease. Units that
pass the Infant Mortality Period have a high probability of surviving the conditions provided by the system and its environment.
Failures that occur during the Useful Life Period are residual defects surviving Infant Mortality, unpredictable system or
environmental conditions, or premature wear out.
Figure 2: Bath-tub curve describing failure rates at different periods of life
3.1 Relıabılıty Predıctıon
A reliability prediction is simply the analysis of parts and components which effort to predict and calculate the rate at which an item
will fail. A reliability prediction is one of the most common forms of reliability analyses for calculating failure rate and MTBF,
MTTR, Availability etc [3].
3.1.1 Mean Time to Failure (MTTF)
It is the expected value of time t or the mean of the TTF (Time to Failure) distribution when one item is put into operation [4]
When and only when failure rate is a constant or = (t) then
--- (3.1)
3.1.2 Mean Time between Failures (MTBF)

International Journal of Scientific and Research Publications, Volume 3, Issue 9, September 2013 3 ISSN 2250-3153
www.ijsrp.org
It is the expected average time between failure events that cause the item to go down. Therefore MTBF can be defined as the average
time (generally expressed in hours) that a component works without failure If and only if the item has constant failure rate then,
--- (3.2)
3.2 Failure Distribution
The goal of system modeling is to provide quantitative forecasts of various system performance measures such as downtime,
availability, and number of failures, capacity, and cost. Evaluation of these measures is important to make optimal decisions when
designing a system to either minimize overall cost or maximize a system performance measure within the allowable budget and other
performance-based constraints.
Two important factors taken into account in the analysis of a system are the failure and repair behaviors of the system components.
The failure and repair rates of components are often defined in terms of distributions, or how the failures and repairs occur during the
time period the system is operational. Therefore, selecting the appropriate distributions for these failure and repair times is critical to
analyze system metrics accurately.
A useful way to easily visualize the characteristics of a failure or repair distribution is through the use of Probability Density
Functions (PDF) [5]. In general, the shape or type of failure distribution depends upon the component's failure mechanisms. Similarly,
the shape or type of repair distribution depends upon several factors associated with component repairs. Several methods are used to
determine the distribution that best fits a given failure or repair pattern. Or, if failures or repairs are known to follow a particular
distribution, the specific parameters that define this pattern can be determined by using the known failure and repair times.
If the type of distribution is not known in advance, then the distribution that best fits the failure or repair times can be found using
statistical methods. To find the best distribution manually, probability plot papers are used. Alternatively, engineering software
products can also be used to generate probability plots and determine best-fit distributions. In general, it is better to use available
software tools because best-fit distributions are determined using scientific analysis rather than human judgment, which must be used
when manually creating probability plots. Such engineering software products are commonly referred to as "Weibull" analysis tools,
simply because Weibull is a widely accepted, commonly used distribution for describing failure and repair rates.
Determining the failure and repair distributions of a system and its components is a significant part of evaluating the reliability of the
design. Distributions may be referred to as single-parameter or two-parameter distributions. For single-parameter distributions, only
one variable is used to define the shape of the curve. Two-parameter distributions require two variables to accurately model the
distribution.
3.3 Collection of Data
The most essential precondition for reliability and failure analysis or maintenance planning is the availability of relevant data. For the
present analysis, data related to Railway Diesel Locomotive Engine, its Mechanical system and Electrical system failures during last
five years [2007 January to 2011 December] are collected. The database includes no. of breakdowns related to different types of
systems or components failures of Diesel Locomotive Engine and their monthly or year wise available No. of failure of a component
or system, cause of failure and corrective action taken previously.
The documentation of failure data (table 1 and fig.3) on Diesel Locomotive Engine, daily breakdown record has been collected from
the daily maintenance statistics lab in the DEISEL SHED.
Table 1:No. of Failures of different components
Sl. No. Name of Different Components No. of Failures
1 Compressor 04
2 Vehicle and structures
05

International Journal of Scientific and Research Publications, Volume 3, Issue 9, September 2013 4 ISSN 2250-3153
www.ijsrp.org
Figure 3:No. of Failures of different components
3.4 Failures of Compressor/Exhauster/ Brake system
In analyzing the various causes of failure in Compressor/Exhauster and Brake system it has been noticed in Fig.4 that the expresser 1st
coupling gasket damaged as well as air leakage from expresser side cover gasket each comprises the 50% of the total failure.
1. Expresser 1
st coupling gasket damaged
2. Air leakage from Expresser side cover
Figure 4: Failures of Compressor
3.5 Failures of vehicle and structures
The various failure components of vehicle and structures are illustrated in figure3 wherein trolley side bearer rubber loading pad
displaced damage and Brake rigging damage equally contribute.
1. 1Fro 01 NT trolley side bearer rubber loading pad displaced damage
–
2. Brake rigging damage.
3. Gear box problem
Figure 5: Failures of vehicle and structures
IV. RELIABILITY ANALYSIS
The Locomotive Engine under investigation is composed three components. The components are compressor, vehicle and structures.
4.1 Hazard Model & Probability Distribution

International Journal of Scientific and Research Publications, Volume 3, Issue 9, September 2013 5 ISSN 2250-3153
www.ijsrp.org
The initial stage of reliability analysis is to predict the hazard model of the failures and to choose a distribution among various
probability distributions like Normal distribution, Exponential distribution, Poison distribution, Weibull distribution etc. The
probability distributions are grouped as follows:
Hazard model with constant failure rate can be followed by normal, exponential distributions.
Hazard model with increasing or decreasing failure rates can be followed by Weibull distribution.
4.2 Graphical Evaluation for Reliability Prediction
There are generally two ways for graphical evaluation visualizes -Exponential plot and Weibull Plot. When the failure rate is constant,
the distribution follows exponential probability law and when failure rate is not constant i.e. non-linear hazard model follows Weibull
distribution.
4.3 Linear Regression Analysis: Selection of Distribution The observed data regarding the failures of different components of the Railway Diesel Locomotive Engine shows that the failure
rates of the components are not constant. So the Weibull distribution model can be adopted. Moreover the technique of linear
regression analysis confirms the suitability to use Weibull distribution for the different components of the Railway Diesel Locomotive
Engine. The analysis determines the best-fit line in the least square sense. The least square test has been performed to obtain the
increasing/decreasing rate of failures [6].
Linear regression analysis has been carried out by using the Probability equation.
(4.1)
Where,
x = Breakdown hours
Y = f(x) = Cumulative % failures
N = number of trials
Rx, f(x) = Correlation coefficient
Failure data of the different components of the Diesel Locomotive Engine is used for determining the correlation co-efficient (Table
2). From the concept of probability, we know that the correlation coefficient must be in between -1.0 to +1.0. If the correlation
coefficient is positive, then the failure rate is increasing, otherwise the rate is decreasing. The correlation coefficients of the different
components of the Railway Diesel Locomotive Engine under study shows increasing rate of failures. Weibull distribution can be
applied for the estimation of reliability of the different components of the Railway Diesel Locomotive Engine.
Table 2: Correlation Coefficient
Name of Components Correlation Coefficient
Compressor 0.783
Vehicle and Structures 0.741
4.4 Weibull Distribution
About all the distributions available for reliability calculations, the Weibull distribution [7] is the only unique to the field. Allodia
Weibull (1887-1979) pointed out that normal distributions are not applicable for characterizing initial metallurgical strengths during
his study on metallurgical failures. He then introduced a function that could embrace a great variety of distributions and used seven
different case studies to demonstrate how this function allowed the data to select the most appropriate distribution from a broad family
of Weibull distributions. Probably the most widely used distribution in reliability engineering, the Weibull distribution can model
failures caused by fatigue, corrosion, mechanical abrasion, diffusion and other degradation processes.
The two parameter Weibull distribution requires characteristic life (η) and shape factor (β) values. Beta (β) determines the shape of the
distribution. If β is greater than 1, the failure rate is increasing. If β is less than 1, the failure rate is decreasing. If β is equal to 1, the
failure rate is constant. There are several ways to check whether data follows a Weibull distribution, the best choice is to use a Weibull
analysis software product. If such a tool is not available, data can be manually plotted on a Weibull probability plot to determine if it
follows a straight line. A straight line on the probability plot indicates that the data is following a Weibull distribution.
Rx, f(x) =

International Journal of Scientific and Research Publications, Volume 3, Issue 9, September 2013 6 ISSN 2250-3153
www.ijsrp.org
Figure 6: Weibull Distribution
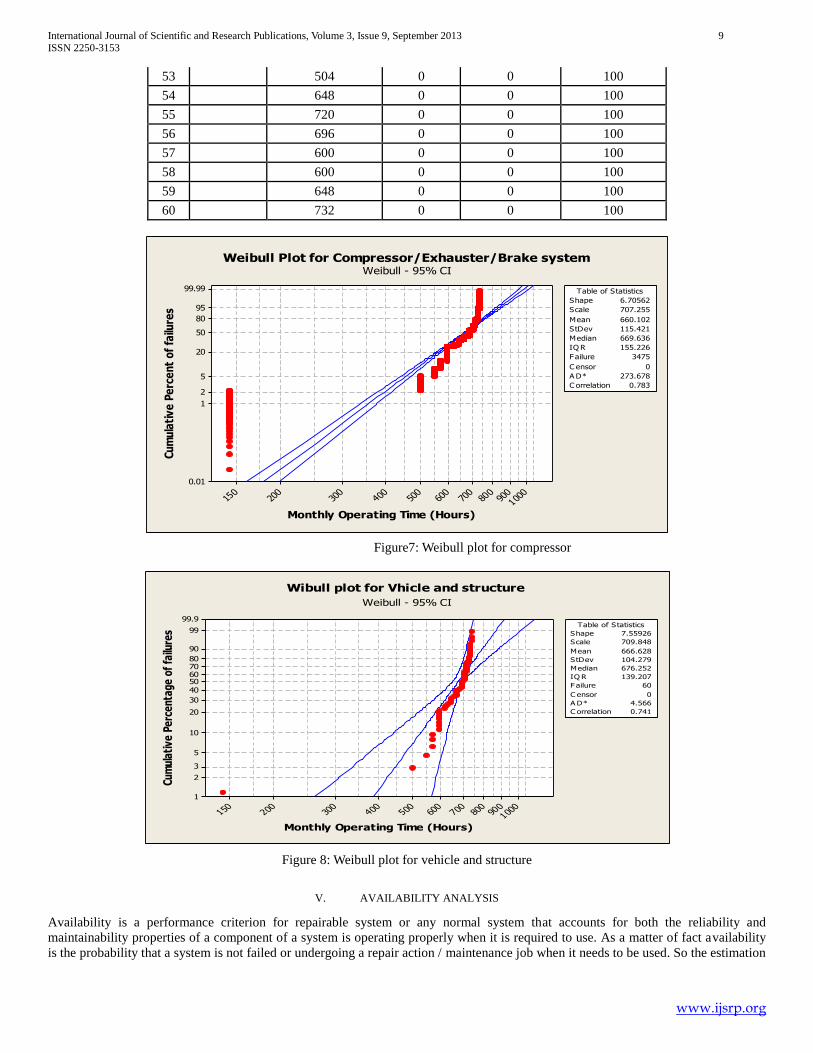
Reliability analysis of the selected components of the Railway Locomotive Engine has been carried out with due consideration of
failure as an indication of the underlying cause of failure has been summarized in term of Weibull shape parameter. Weibull shape
parameter also indicates whether the failure rate is constant or increasing or decreasing if = 1.0, >1.0, <1.0 respectively. The
cumulative % failures versus operating time data are plotted on Weibull graph [Fig.12 & 13] and the values of the parameters are
obtained using the statistical software ‘MINITAB15.
Table 3: Weibull plot for Compressor
Sl.
No Month
Monthly
Operating
Time(Hours)
No of
Failures
Percentage
Failures
Cumulative
% Failures
1 January'07 720 0 0 0
2 620 0 0 0
3 576 0 0 0
4 600 0 0 0
5 708 0 0 0
6 700 1 25 25
7 734 0 0 25
8 734 0 0 25
9 648 0 0 25
10 734 0 0 25
11 672 0 0 25
12 670 1 25 50
13 January'08 724 0 0 50
14 686 0 0 50
15 732 0 0 50
16 638 0 0 50
17 734 0 0 50
18 710 0 0 50
19 660 0 0 50
20 710 0 0 50
21 708 0 0 50
22 744 0 0 50
International Journal of Scientific and Research Publications, Volume 3, Issue 9, September 2013 7 ISSN 2250-3153
www.ijsrp.org
23 624 0 0 50
24 734 0 0 50
25 January'09 696 0 0 50
26 600 0 0 50
27 733 0 0 50
28 708 0 0 50
29 720 0 0 50
30 696 0 0 50
31 734 0 0 50
32 718 0 0 50
33 710 0 0 50
34 672 0 0 50
35 710 1 25 75
36 744 0 0 75
37 January'10 600 0 0 75
38 600 0 0 75
39 720 0 0 75
40 576 0 0 75
41 744 0 0 75
42 696 0 0 75
43 600 0 0 75
44 720 0 0 75
45 720 0 0 75
46 696 0 0 75
47 672 0 0 75
48 734 0 0 75
49 January'11 732 0 0 75
50 576 0 0 75
51 144 0 0 75
52 552 1 25 100
53 504 0 0 100
54 648 0 0 100
55 720 0 0 100
56 696 0 0 100
57 600 0 0 100
58 600 0 0 100
59 648 0 0 100
60 732 0 0 100
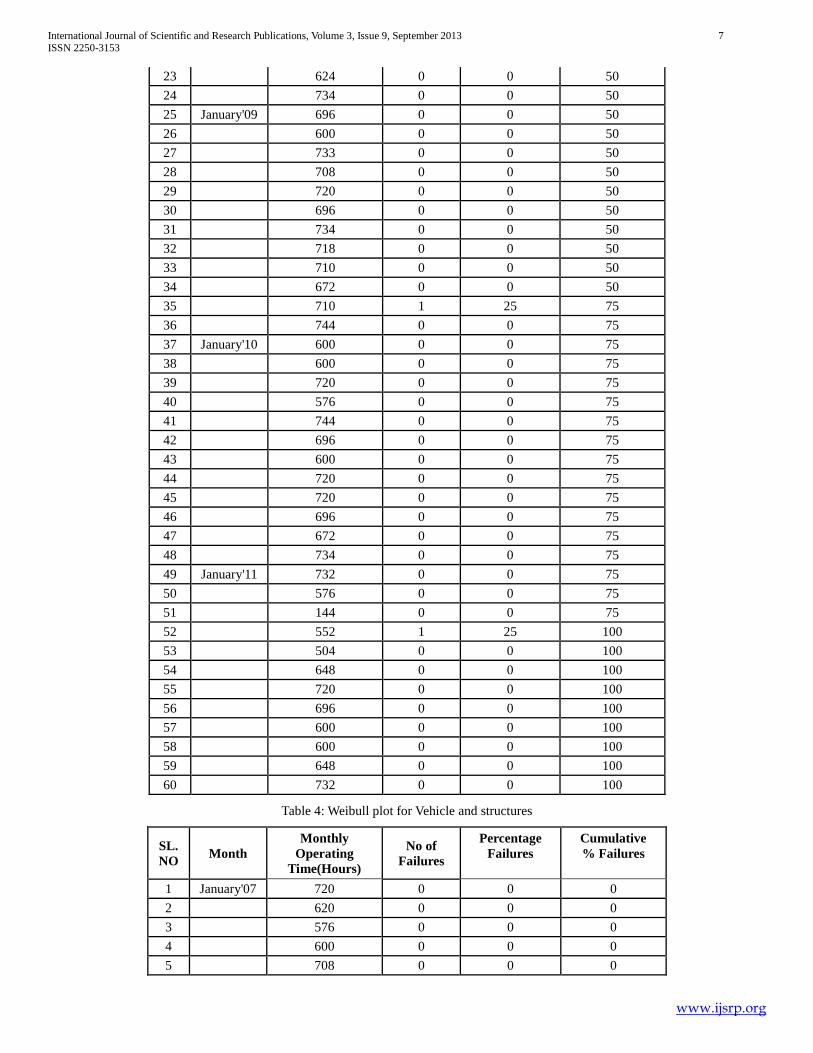
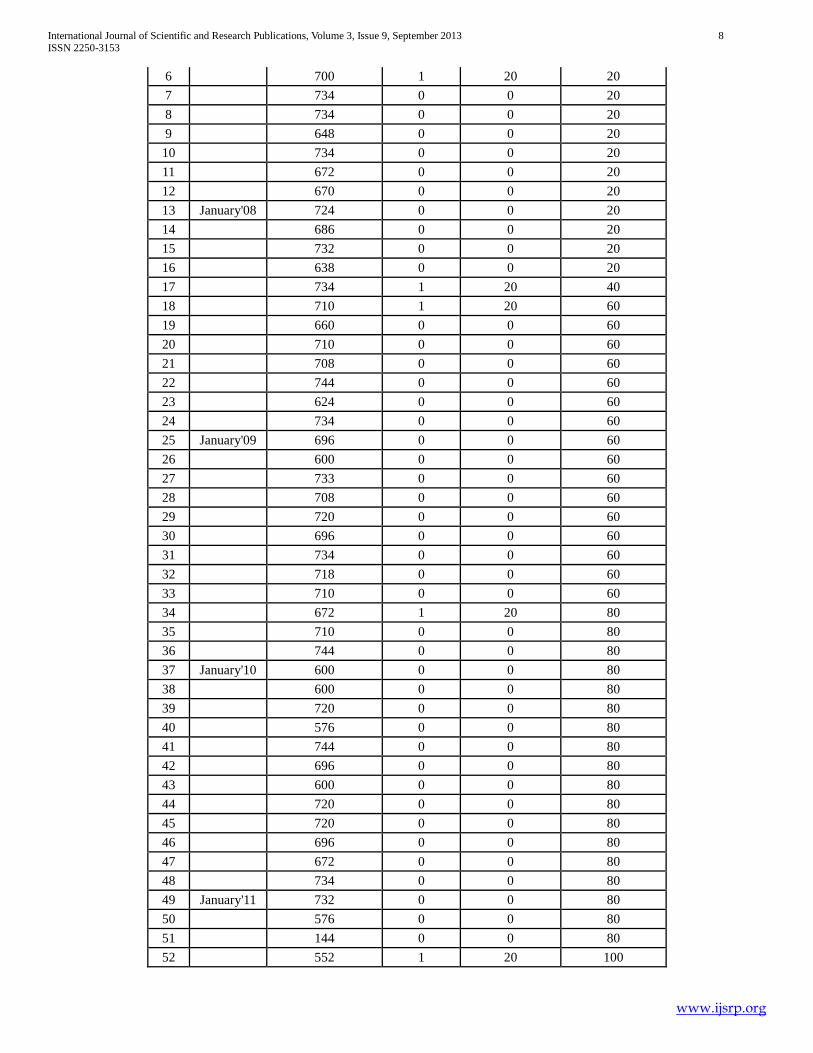
Table 4: Weibull plot for Vehicle and structures
SL.
NO Month
Monthly
Operating
Time(Hours)
No of
Failures
Percentage
Failures
Cumulative
% Failures
1 January'07 720 0 0 0
2 620 0 0 0
3 576 0 0 0
4 600 0 0 0
5 708 0 0 0
International Journal of Scientific and Research Publications, Volume 3, Issue 9, September 2013 8 ISSN 2250-3153
www.ijsrp.org
6 700 1 20 20
7 734 0 0 20
8 734 0 0 20
9 648 0 0 20
10 734 0 0 20
11 672 0 0 20
12 670 0 0 20
13 January'08 724 0 0 20
14 686 0 0 20
15 732 0 0 20
16 638 0 0 20
17 734 1 20 40
18 710 1 20 60
19 660 0 0 60
20 710 0 0 60
21 708 0 0 60
22 744 0 0 60
23 624 0 0 60
24 734 0 0 60
25 January'09 696 0 0 60
26 600 0 0 60
27 733 0 0 60
28 708 0 0 60
29 720 0 0 60
30 696 0 0 60
31 734 0 0 60
32 718 0 0 60
33 710 0 0 60
34 672 1 20 80
35 710 0 0 80
36 744 0 0 80
37 January'10 600 0 0 80
38 600 0 0 80
39 720 0 0 80
40 576 0 0 80
41 744 0 0 80
42 696 0 0 80
43 600 0 0 80
44 720 0 0 80
45 720 0 0 80
46 696 0 0 80
47 672 0 0 80
48 734 0 0 80
49 January'11 732 0 0 80
50 576 0 0 80
51 144 0 0 80
52 552 1 20 100
International Journal of Scientific and Research Publications, Volume 3, Issue 9, September 2013 9 ISSN 2250-3153
www.ijsrp.org
53 504 0 0 100
54 648 0 0 100
55 720 0 0 100
56 696 0 0 100
57 600 0 0 100
58 600 0 0 100
59 648 0 0 100
60 732 0 0 100
1000
900
800
700
600
500
400300
200
150
99.99
95
80
50
20
5
2
1
0.01
Monthly Operating Time (Hours)
Cu
mu
lati
ve
Pe
rce
nt
of
failu
res
C orrelation 0.783
Shape 6.70562
Scale 707.255
Mean 660.102
StDev 115.421
Median 669.636
IQ R 155.226
Failure 3475
C ensor 0
A D* 273.678
Table of Statistics
Weibull Plot for Compressor/Exhauster/Brake systemWeibull - 95% CI
Figure7: Weibull plot for compressor
1000
900
800
700600
500400300
200150
99.9
99
90
8070605040
30
20
10
5
3
2
1
Monthly Operating Time (Hours)
Cum
ulat
ive
Perc
enta
ge o
f fa
ilure
s
C orrelation 0.741
Shape 7.55926
Scale 709.848
Mean 666.628
StDev 104.279
Median 676.252
IQ R 139.207
Failure 60
C ensor 0
A D* 4.566
Table of Statistics
Wibull plot for Vhicle and structure
Weibull - 95% CI
Figure 8: Weibull plot for vehicle and structure
V. AVAILABILITY ANALYSIS
Availability is a performance criterion for repairable system or any normal system that accounts for both the reliability and
maintainability properties of a component of a system is operating properly when it is required to use. As a matter of fact availability
is the probability that a system is not failed or undergoing a repair action / maintenance job when it needs to be used. So the estimation

International Journal of Scientific and Research Publications, Volume 3, Issue 9, September 2013 10 ISSN 2250-3153
www.ijsrp.org
of availability plays vital role of both reliability and maintainability aspects are considered for a system or components under
investigation.
5.1 Availability
Availability is a performance criterion for repairable systems that accounts for both the reliability and maintainability properties of a
component or system. It is defined as the probability that the system is operating properly when it is requested for use. That is
availability is the probability that a system is not failed or undergoing repair action when it needs to be used [2].
AIN = MTBF / (MTBF+MTTR) --- (5.1)
It is possible to define three types of availability depending on the time elements we consider.
5.1.1 Inherent Availability
This is a probability that a system or equipment shall operate satisfactorily when used under stated conditions in an ideal support
environment, without consideration for any scheduled or preventive maintenance at any given time. Mathematically it is expressed [2]
as
AIN =MTBF/ (MTBF+MTTR) --- (5.2)
5.1.2 Achieved Availability
This is a probability that a system or equipment shall operate satisfactorily when used under stated conditions in an ideal support
environment at any given time. It may be expressed as [2]
Aa = MTBM / (MTBM+MDT) --- (5.3)
Where, MTBM is the mean active-maintenance down time resulting from both preventive and corrective maintenance.
5.1.3 Operational Availability
In any real operation, we cannot reduce administrative down time and supply downtime to zero. A certain amount of delay will
always be caused by time elements such as these and if they are taken into account then we obtain the operational availability. It may
be defined as the probability that a system or equipment shall operate satisfactorily when used under stated conditions and in an actual
supply environment at any given time. It may be expressed [2] as
AOP = MTBF/ (MTBF+MDT) --- (5.4)
In general the availability of a system is a complex function of reliability maintainability and supply effectiveness. This can be
expressed as
As = f (Rs, Ms, Ss) --- (5.5)
Where, As = System Availability, Ss = Supply Effectiveness, Rs= System Reliability,
Ms= System Maintainability.
Table 5: Estimation of availability of Compressor
Sl.
No
.
Month
Upti
me
(hou
rs)
Downtim
e (hours)
No. of
failure
s
MTB
F
(hour
)
Hazard
rate
MDT
(hours) AOP
MTT
R
(hours
)
AIN
1 January'07 720 24 0 *** 0 *** 1 0 1
2 620 12 0 *** 0 *** 1 0 1
3 576 144 0 *** 0 *** 1 0 1
4 600 120 0 *** 0 *** 1 0 1
5 708 36 0 *** 0 *** 1 0 1
6 700 20 1 700 0.0011 26 0.964 7.8 0.988
7 734 10 0 0 0 *** 1 0 1
8 734 10 0 0 0 *** 1 0 1
9 648 72 0 0 0 *** 1 0 1
10 734 10 0 0 0 *** 1 0 1
11 672 48 0 0 0 *** 1 0 1
12 670 24 1 0 744 1 223.2 1
13 January'08 724 10 0 0 0 *** 1 0 1
14 686 10 0 0 0 *** 1 0 1
15 732 12 0 0 0 *** 1 0 1
16 638 82 0 0 0 *** 1 0 1
17 734 10 0 0 0 *** 1 0 1
International Journal of Scientific and Research Publications, Volume 3, Issue 9, September 2013 11 ISSN 2250-3153
www.ijsrp.org
18 710 10 0 0 0 *** 1 0 1
19 660 84 0 0 0 *** 1 0 1
20 710 10 0 0 0 *** 1 0 1
21 708 12 0 0 0 *** 1 0 1
22 744 0 0 0 0 *** 1 0 1
23 624 72 0 0 0 1 0 1
24 734 10 0 0 0 1 0 1
25 January'09 696 48 0 0 0 1 0 1
26 600 72 0 0 0 1 0 1
27 733 10 0 0 0 1 0 1
28 708 12 0 0 0 1 0 1
29 720 0 0 0 0 1 0 1
30 696 24 0 0 0 1 0 1
31 734 10 0 0 0 1 0 1
32 718 26 0 0 0 1 0 1
33 710 10 0 0 0 1 0 1
34 672 72 0 0 0 1 0 1
35 710 10 1 710 0.0014 10 0.986 3 0.995
36 744 0 0 0 0 *** 1 0 1
37 January'10 600 120 0 0 0 1 0 1
38 600 48 0 0 0 1 0 1
39 720 24 0 0 0 1 0 1
40 576 144 0 0 0 1 0 1
41 744 0 0 0 0 1 0 1
42 696 24 0 0 0 1 0 1
43 600 120 0 0 0 1 0 1
44 720 24 0 0 0 1 0 1
45 720 24 0 0 0 1 0 1
46 696 0 0 0 0 1 0 1
47 672 24 0 0 0 1 0 1
48 734 48 0 0 0 1 0 1
49 January'11 732 12 0 0 0 1 0 1
50 576 120 0 0 0 1 0 1
51 144 192 0 0 0 1 1 1
52 552 168 1 552 0.0018 168 0.767 50.4 0.916
53 504 216 0 0 0 1 1 1
54 648 72 0 0 0 1 1 1
55 720 24 0 0 0 1 0 1
56 696 48 0 0 0 1 0 1
57 600 120 0 0 0 1 0 1
58 600 120 0 0 0 1 0 1
59 648 72 0 0 0 1 0 1
60 732 12 0 0 0 1 0 1
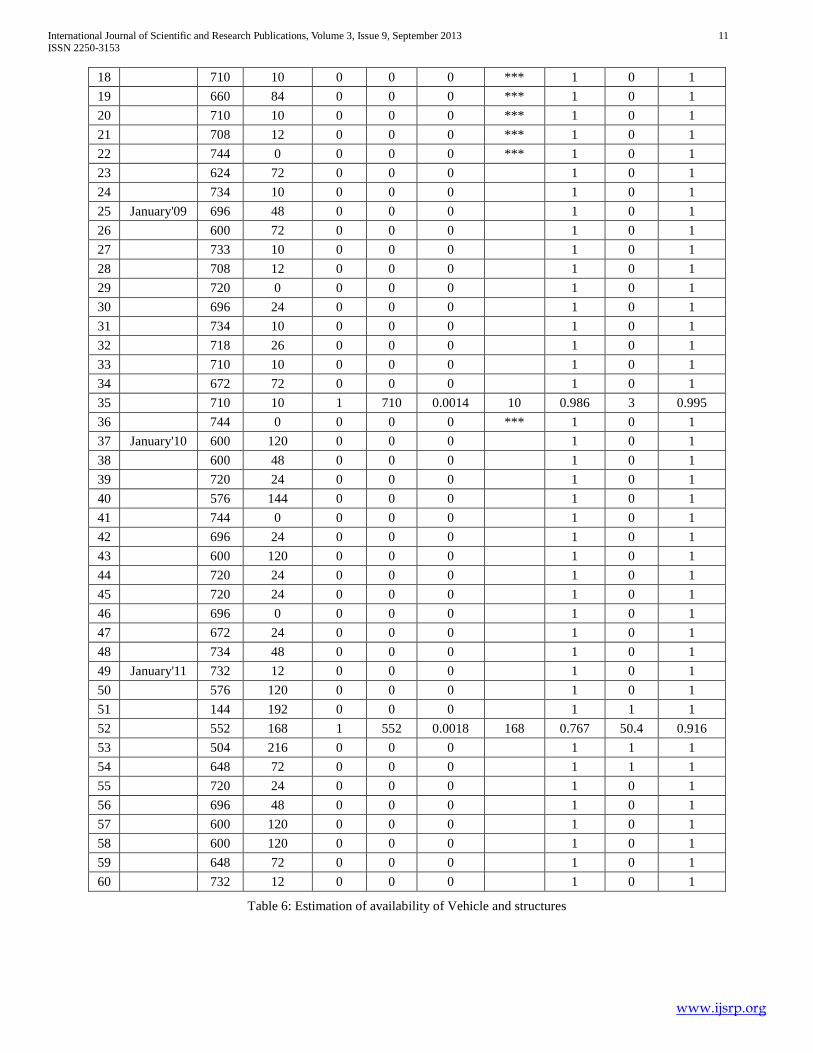
Table 6: Estimation of availability of Vehicle and structures

International Journal of Scientific and Research Publications, Volume 3, Issue 9, September 2013 12 ISSN 2250-3153
www.ijsrp.org
Sl.
No.
Month Uptime
(hours)
Down
time
(hours)
No. of
failures
MTBF
(hours)
Hazard
rate
MDT
(hours) AOP
MTTR
(hours) AIN
1 January'07 720 24 0 *** 0 *** 1 **** 1
2 620 12 0 *** 0 *** 1 1
3 576 144 0 *** 0 * 1 1
4 600 120 0 *** 0 1 1
5 708 36 0 *** 0 1 1
6 700 20 1 700 0.0014 20 0.972 6 0.999
7 734 10 0 *** 0 1 1
8 734 10 0 *** 0 1 *** 1
9 648 72 0 **** 0 1 1
10 734 10 0 **** 0 1 1
11 672 48 0 *** 0 1 1
12 670 24 0 *** 0 1 *** 1
13 January'08 724 10 0 *** 0 1 1
14 686 10 0 0 1 1
15 732 12 0 0 1 1
16 638 82 0 0 1 *** 1
17 734 10 1 734 0.0013 10 0.986 3 0.995
18 710 10 1 710 0.0014 10 0.986 3 0.995
19 660 84 0 *** 0 1 1
20 710 10 0 **** 0 1 1
21 708 12 0 *** 0 1 *** 1
22 744 0 0 0 1 1
23 624 72 0 0 1 1
24 734 10 0 0 1 1
25 January'09 696 48 0 0 1 1
26 600 72 0 0 1 1
27 733 10 0 0 1 1
28 708 12 0 0 1 1
29 720 0 0 0 1 1
30 696 24 0 0 1 1
31 734 10 0 0 1 1
32 718 26 0 *** 0 1 1
33 710 10 0 0 1 1
34 672 72 1 672 0.0014 72 0.903 21.6 0.968
35 710 10 0 *** 0 1 1
36 744 0 0 0 1 1
37 January'1
0 600 120 0 0 1 1
38 600 48 0 0 1 *** 1
39 720 24 0 0 1 1
40 576 144 0 0 1 1
41 744 0 0 0 1 1
42 696 24 0 0 **** 1 1
43 600 120 0 0 1 1
44 720 24 0 0 1 1

International Journal of Scientific and Research Publications, Volume 3, Issue 9, September 2013 13 ISSN 2250-3153
www.ijsrp.org
45 720 24 0 0 1 1
46 696 0 0 0 1 1
47 672 24 0 0 1 1
48 734 48 0 0 1 1
49 January'1
1 732 12 0 0 1 1
50 576 120 0 0 *** 1 1
51 144 192 0 *** 0 1 1
52 552 168 1 552 0.0018 168 0.767 50.04 0.916
53 504 216 0 *** 0 1 1
54 648 72 0 0 1 1
55 720 24 0 0 1 1
56 696 48 0 0 1 1
57 600 120 0 0 **** 1 1
58 600 120 0 0 *** 1 1
59 648 72 0 0 1 1
60 732 12 0 0 1 1
Table 7: Availability of different components of the Railway Diesel Locomotive Engine
Sl. No. Name of the Different Components Availability
1 Compressor 0.998
2 Vehicle and structures 0.997
Figure 9: Availability graph for different components

International Journal of Scientific and Research Publications, Volume 3, Issue 9, September 2013 14 ISSN 2250-3153
www.ijsrp.org
Figure 10: Availability of compressor
Figure 11: Availability of vehicle and structure
VI. DEVELOPMENT OF SPARES PLANNING AND CONTROL SYSTEM
6.1 Maintenance
The definition often stated maintenance as an activity carried out for any equipment to ensure its reliability to perform its functions
[8].Maintenance to most people is any activity carried out on an asset in order to ensure that the asset continues to perform its intended
functions or to repair any equipment that has failed or to keep the equipment running or to restore to its favorable operating condition.
Over the years, many new strategies have been implemented as maintenance strategies which are intended to overcome the problems
which are related to equipment breakdown. Some of the common maintenance strategies [9] are as follows:-
Table 8: Maintenance Strategy
MAINTENANCE
STRATEGY
MAINTENANCE
APPROACH SIGNIFICATION
Corrective Maintenance Fix it when broke Large maintenance budget.

International Journal of Scientific and Research Publications, Volume 3, Issue 9, September 2013 15 ISSN 2250-3153
www.ijsrp.org
Preventive Maintenance Scheduled Maintenance Periodic component replacement.
Predictive Maintenance Condition based Monitoring Maintenance decision based on
equipment condition.
Proactive Maintenance Detection of sources of
failures.
Monitoring and correcting root causes of
failure.
6.2 Classification for selective control of spare parts inventory- ABC Analysis
The objective of carrying out ABC analysis is to develop policy guidelines for selective controls of spare parts. The ABC classification
of the spare parts of Railway Diesel Engine has been performed on the basis of their annual consumption in rupees. The entire
procedure for making ABC analysis is summarized in the following steps:
i) Annual consumptions in rupees have been calculated for each spare part.
ii) The sorting of spare parts has been performed on the basis of annual consumptions in rupees in descending order.
iii) Cumulative annual usage and cumulative % usage are estimated which are shown in Table 9 .The parts are categorized
considering the cumulative % usage.
iv) The Pareto chart figure 12 is obtained for the spare parts by plotting cumulative percentage usage against the ranks of the
parts in descending order to visualize the ABC categories.
Table 9: ABC Analysis of the spare parts
Rank Spare Part Annual Usage [In
Rupees.]
Cumulative
Annual Usage
Cumulative %
Usage Category
1 Compressor 104,17,910.00 104,17,910.00 27.211 A
2 Vehicle and structures 11,97,653.00 38193075.32 99.760 C
Figure 12: Paratoo chart
VII. RESULTS & DISCUSSIONS
7.1 Reliability Estimation
Reliability estimation of the different components of the Locomotive Engine of Railways provides the values of shape parameters as
well as reliability (Table 10) which focuses on the performance of the components of the Locomotive Engine during the period of
January, 2007 to December, 2011.
Table 10: Reliability of the Railway Locomotive Engine components

International Journal of Scientific and Research Publications, Volume 3, Issue 9, September 2013 16 ISSN 2250-3153
www.ijsrp.org
Sl.
No. Name Of The Different
Components
Shape Parameter (Β)
(From Weibull Plot)
Mean
Operating
Hour
(In Hours)
Reliability
Failure
Probability
Failure
Probability
1 Compressor
6.705 660.102 64.621 35.378
2 Vehicle and structure 7.559 666.628 59.998 40.001
Figure 13: Reliability of different components for Locomotive Engine
From Fig.13, it is found that the estimated Reliability of the different components of the “Railway Diesel Locomotive Engine” is in
the range of 59% to 68%. The minimum (59.9987%) reliability is for the vehicle and structure.
Figure 14: Shape parameter of different components
Weibull shape parameter is the indicative of the possible failure mechanism and the causes of failures of any component. Table 11
shows the classification of shape parameters according to their values indicating possible failure mechanism and cause of failure.
Table 11: Classification of shape parameter
Shape Parameter Value Possible Failure Mechanism Causes Of Failure
β >2 Age related pattern Accelerated wear and tear of
components.
β≈ 1 Time independent pattern Process error, design fault, mal
operation
β < 1 Early failure Manufacturing failure, and
reconditioning fault.

International Journal of Scientific and Research Publications, Volume 3, Issue 9, September 2013 17 ISSN 2250-3153
www.ijsrp.org
The values of the shape parameters of the different components of the Railway Diesel Locomotive engine are given in Table 10 &
Fig.13. It is evident that the possible failure mechanism of various components falls into the category of age related pattern and
failures occur due to accelerated wear and tear of components (Table 11).
7.2 Availability of Different Components of the Railway Locomotive Engine
As per the definition of operational availability, the availability of different components of the Railway Diesel Locomotive Engine is
calculated for a particular month starting from January, 2007 to December, 2011. After that the average operational availability of
each component is calculated. A detailed average operational availability of different components of the Railway Diesel Locomotive
Engine is given Table 12 and Fig.15.
Table 12: Estimated Operational Availability of the Railway Diesel Locomotive Engine components
Sl. No. Name of the Different Components Average Operational
Availability
1 Compressor 0.995
2 Vehicle And Structures 0.993
Figure 15: Operational availability of different components
Considering operational availability and inherent availability vs. time period for different components of the Railway Diesel
Locomotive Engine (Fig.10 to11) show the availability patterns of Railway Diesel Engine during the period under study (January,
2007 to December, 2011).
Figure.10: shows that for, Compressor/Exhauster/Brake system both inherent and operational availability are closer to each other for
very short periods.
Figure.11: shows that the Vehicle and structures undergoes preventive maintenance and overhauling for shorter period during the
months of April 11 to May, 11, as both the inherent and operational availability are coinciding with each other.
7.3 Analyses of the Major Causes of Failures and Recommendations for Their Remedies
After analyzing the failures of the Railway Diesel Locomotive Engine components, the major causes of failures include careless
and inexperienced handling, improper and excessive loading, environmental, careless operation, degradation etc
7.4 Proposed Maintenance Schedule It is true that the failures of the engine parts cannot be fully prevented i.e. 100% availability cannot be achieved, but the probability of
failure and frequency of failures, and thus risk can be checked or lowered through proper condition monitoring of the Railway Diesel
Locomotive Engine components.
Following are the causes and the recommended preventive measures to be taken for the major components of the engine.
Table 13: Compressor/ exhauster/ brake system
Causes Corrective actions
Expresser 1st coupling gasket damaged
Extra care should be taken during major schedule for
fitment of 1st coupling gasket.
International Journal of Scientific and Research Publications, Volume 3, Issue 9, September 2013 18 ISSN 2250-3153
www.ijsrp.org
Air leakage from expresser side cover gasket due to three nos.
over size bolt fitted, caused cover was not tightened properly. Fitment of standard size bolt should be ensured.
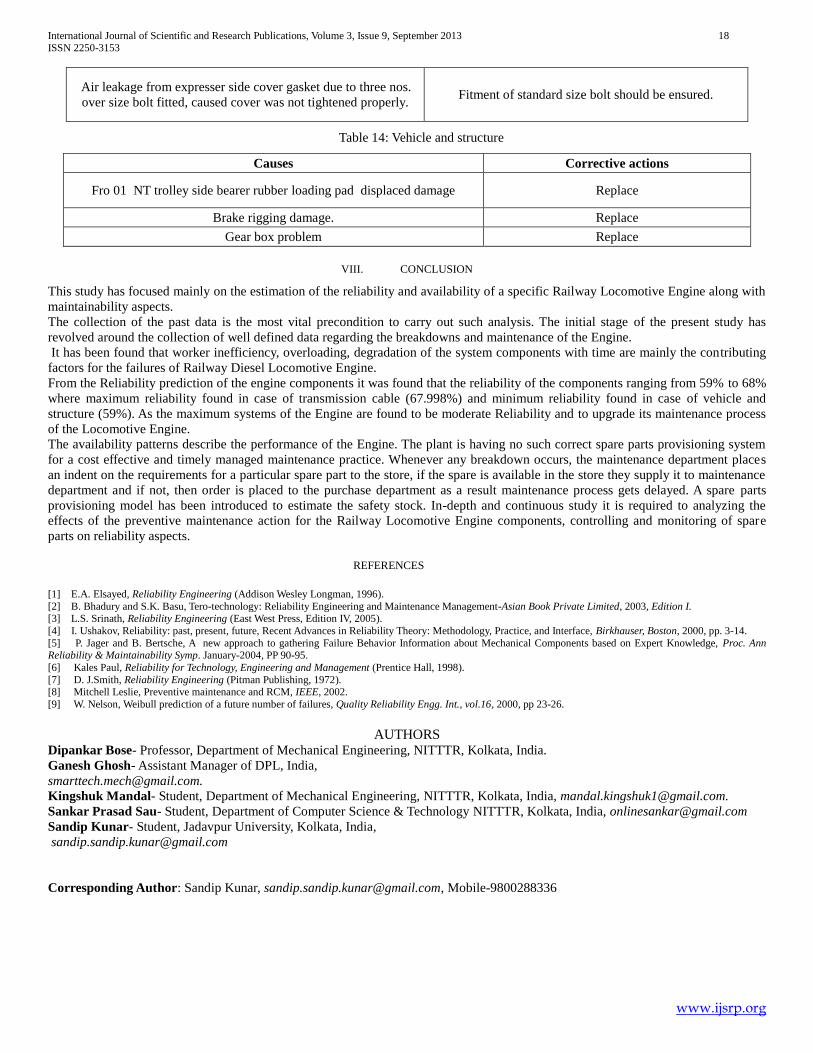
Table 14: Vehicle and structure
Causes Corrective actions
Fro 01 NT trolley side bearer rubber loading pad displaced damage Replace
Brake rigging damage. Replace
Gear box problem Replace
VIII. CONCLUSION
This study has focused mainly on the estimation of the reliability and availability of a specific Railway Locomotive Engine along with
maintainability aspects.
The collection of the past data is the most vital precondition to carry out such analysis. The initial stage of the present study has
revolved around the collection of well defined data regarding the breakdowns and maintenance of the Engine.
It has been found that worker inefficiency, overloading, degradation of the system components with time are mainly the contributing
factors for the failures of Railway Diesel Locomotive Engine.
From the Reliability prediction of the engine components it was found that the reliability of the components ranging from 59% to 68%
where maximum reliability found in case of transmission cable (67.998%) and minimum reliability found in case of vehicle and
structure (59%). As the maximum systems of the Engine are found to be moderate Reliability and to upgrade its maintenance process
of the Locomotive Engine.
The availability patterns describe the performance of the Engine. The plant is having no such correct spare parts provisioning system
for a cost effective and timely managed maintenance practice. Whenever any breakdown occurs, the maintenance department places
an indent on the requirements for a particular spare part to the store, if the spare is available in the store they supply it to maintenance
department and if not, then order is placed to the purchase department as a result maintenance process gets delayed. A spare parts
provisioning model has been introduced to estimate the safety stock. In-depth and continuous study it is required to analyzing the
effects of the preventive maintenance action for the Railway Locomotive Engine components, controlling and monitoring of spare
parts on reliability aspects.
REFERENCES
[1] E.A. Elsayed, Reliability Engineering (Addison Wesley Longman, 1996).
[2] B. Bhadury and S.K. Basu, Tero-technology: Reliability Engineering and Maintenance Management-Asian Book Private Limited, 2003, Edition I. [3] L.S. Srinath, Reliability Engineering (East West Press, Edition IV, 2005).
[4] I. Ushakov, Reliability: past, present, future, Recent Advances in Reliability Theory: Methodology, Practice, and Interface, Birkhauser, Boston, 2000, pp. 3-14.
[5] P. Jager and B. Bertsche, A new approach to gathering Failure Behavior Information about Mechanical Components based on Expert Knowledge, Proc. Ann Reliability & Maintainability Symp. January-2004, PP 90-95.
[6] Kales Paul, Reliability for Technology, Engineering and Management (Prentice Hall, 1998).
[7] D. J.Smith, Reliability Engineering (Pitman Publishing, 1972). [8] Mitchell Leslie, Preventive maintenance and RCM, IEEE, 2002.
[9] W. Nelson, Weibull prediction of a future number of failures, Quality Reliability Engg. Int., vol.16, 2000, pp 23-26.
AUTHORS Dipankar Bose- Professor, Department of Mechanical Engineering, NITTTR, Kolkata, India.
Ganesh Ghosh- Assistant Manager of DPL, India,
Kingshuk Mandal- Student, Department of Mechanical Engineering, NITTTR, Kolkata, India, [email protected].
Sankar Prasad Sau- Student, Department of Computer Science & Technology NITTTR, Kolkata, India, [email protected]
Sandip Kunar- Student, Jadavpur University, Kolkata, India,
Corresponding Author: Sandip Kunar, [email protected], Mobile-9800288336