measurement and determinants of international stock market ...€¦ · 1 measurement and...
TRANSCRIPT
Measurement and Determinants of International Stock Market Efficiency+
John M. Griffina,*, Patrick J. Kellyb, and Federico Nardaric
a University of Texas at Austin, McCombs School of Business, Austin, TX 78712, USA b University of South Florida, Tampa, FL 33620, USA
c Arizona State University, W. P. Carey School of Business, Tempe, AZ 85287, USA
Draft: June 6, 2006
Preliminary, please do not quote
+ We thank Keith Brown, Owen Lamont, Toby Moskowitz, Paul Tetlock, Laura Starks, and Sheridan Titman and other brown bag participants at Baruch University, George Mason University, the Federal Reserve in D.C., the University of Texas at Austin, for helpful discussion and Nick Hirschey, Sriram Villupuram, Chishen Wei, Hanjiang Zhang, and Chia-Wei Chen for research assistance. Email addresses: [email protected] (J.M. Griffin), [email protected] (P. Kelly), and [email protected] (F. Nardari).
1
Measurement and Determinants of International Stock Market Efficiency
Abstract
We propose measures of both public and private information incorporation and investigate the efficiency of 55 individual equity markets using daily and weekly data from 1994 to the present. We examine the distinction between private and public information by studying the reaction of firm returns to earnings announcements and find that the average emerging market exhibits no reaction to earnings announcements. Markets with high levels of investor protection and progressive security laws such as the allowance of short sales exhibit more reaction to earnings events. For public information incorporation, we examine the speed at which public information is incorporated into prices and surprisingly find that many emerging markets are remarkably efficient at incorporating market-wide information. We also examine the R2 measure of informational efficiency as proposed in Morck, Yeung, and Yu (2000) and find that it is not related to regulatory variables like investor protection, but it is related to transactions costs in a manner inconsistent with information efficiency. Overall, our research supports using new and separate measures of public and private information incorporation.

2
Informational efficiency refers to the extent to which a market incorporates all available information
into prices quickly and correctly. The literature examining information efficiency within the U.S. is
large and generally concludes that information is incorporated into markets quickly and reasonably
correctly. However, relatively little is known about differences in the degree of efficiency across
markets and what legal, institutional, and developmental characteristics are associated with greater
efficiency. This paper contributes to the literature by providing a broad examination of information
efficiency across 33 emerging and 22 developed markets.
Information can be broadly classified into two types: public and private. Public information
is known and understood by all market participants, while private information is known and/or
understood by few. Testing for the incorporation of private information is more challenging since
such information is typically unobservable. Markets where insiders cannot trade on private
information may foster greater incentives for other investors to invest in producing information and,
hence, lead to more efficient long-run pricing. Thus we study the incorporation of private
information by examining if additional information is contained in prices around earnings
announcements or if (possibly due to information leakage) this information is already contained in
prices ex ante. To examine efficiency with respect to public information, we analyze the ability of a
market to incorporate the most basic form of public information in prices—information contained
in the market index. We calculate measures of market efficiency for 55 international markets and
study the relation between these measures of efficiency with each other, with market frictions, and
with cross-country regulatory and market quality proxies.
To study private informational efficiency, we use the approach pioneered by Bhattacharya,
Daouk, Jorgenson, and Kehr (2000) in a case study of Mexico, but we apply it to a wide variety of
markets. This approach is used by Bailey, Karolyi, and Salva (2005) to study the change in a firm’s
information environment before and after cross-listing in an array of markets. DeFond, Hung, and

3
Trezevant (2005) study the informativeness of earnings announcements in 26 countries. Due to
differences in methodologies, focus, and our larger sample of earnings announcements from 49
markets, our approach leads to different conclusions regarding the facets facilitating the separation
of public and private information. We find that most developed markets experience much higher
return variation around earnings announcements, while the typical emerging market sees no
abnormal return moves around earnings announcements. The exception is a handful of emerging
markets (China, Hong Kong, India, Malaysia, and Singapore). Our cross-country analysis indicates
that earnings announcements are more informative in markets with good investor protection, that
allow short-selling, and where analysts are able to more accurately forecast earnings.
It is not completely obvious how to interpret the lack of price responses around earnings
announcements. Assuming the lack of response is because the information was already impounded
in stock prices, it is unclear whether this pre-announcement information leakage results in prices that
are overall more or less efficient. Leland (1992) argues that private information leakage improves the
efficiency of prices and induces a welfare improvement. On the other hand, Fishman and Hagerty
(1992) and Brunnermeier (2005), among others, argue that insider trading crowds out outside
informed trading because it lowers the profitability of information gathering by outside investors
and results in less efficient prices in the long run.
To measure the public aspect of information efficiency, we examine the fraction of variation
in returns explained by past weekly market returns as compared to the variation explained solely by
contemporaneous market returns. This is similar to the delay measure used by Hou and Moskowitz
(2005). The measure relies on the basic principles of market efficiency. A security price that is slow
to incorporate simple information, such as that contained in the market index movements, is less
efficient than a security price which rapidly incorporates publicly available information. Hou and
Moskowitz (2005) use delay to measure efficiency in stocks within the U.S. and then focus on the

4
premium to bearing stocks with high delay. In contrast, our approach in this international study is to
propose and evaluate delay as a measure of public informational efficiency rather than focusing on
delay as a source of undiversifiable risk. Surprisingly, we find that the typical emerging market has
less information delay than developed markets.
Our paper is not the first to study informational efficiency across markets. In a thorough and
original study, Morck, Yeung, and Yu (2000), proposes the average market model R2 across firms as
a measure of how much firm-specific information production occurs. We also examine R2 and its
relation to the two previously discussed measures of efficiency. We find several results that contrast
with earlier work. First, within country [as the measure has been applied in the U.S. by Durnev,
Morck, Yeung, and Zarowin (2003) and Durnev, Morck, and Yeung (2004)], smaller stocks have
much lower R2s on average (Roll (1988)). Under the interpretation of low R2 as a proxy for higher
informational efficiency, this evidence conflicts with a multitude of other evidence showing that less
information is available for small stocks [Atiase (1985), Arbel and Strebel (1982), and Collins,
Kothari, Rayburn (1987), among others]. Second, the measure is negatively related to transactions
costs both within and across countries, which is also inconsistent with a low R2 proxying for higher
market efficiency. Third, the Morck, Yeung, and Yu (2000) interpretation of the R2 as related to
investor protection does not hold up over our longer and more recent 1994 to 2005 sample period.
Indeed, investor protection is never significant in either simple or multiple specifications. Instead,
cross-country regression evidence indicates that the strongest determinants of a high R2
(informationally inefficient) market are low transactions costs, high levels of market volatility, and
markets with high analyst forecasts errors. Overall, it is not clear what the Morck, Yeung, and Yu R2
is proxying for.1
1 Our conclusions are consistent with Kelly (2006) who examines the relation between R2 and various proxies for information production across firms within the U.S.

5
Our findings indicate that measuring market efficiency is a complex task and that measures
of public and private information incorporation may provide different assessments about the
efficiency of an equity market. Security laws and investor protection help foster a market where
inside information is kept private, but these same factors have little to do with the ability of a market
to efficiently incorporate publicly available information into prices. For this aspect, low transactions
costs are crucial.
The paper outline is as follows. Section II describes our sample size and the construction of
our efficiency and transactions costs measures. Section III displays empirical estimates of our
efficiency measures: delay, abnormal earnings returns, and market-model R2; and examines simple
correlations both within and across countries, among these measures as well as transactions costs.
Section IV examines multiple regressions of the efficiency measures on cross-country variables that
help to disentangle the economic meaning of the efficiency measures. Section V concludes.
II. Data and Methodology
A. Data
We collect market data from 1994 through 2005 for 33 emerging markets and 22 developed
markets. Countries are classified as developed/emerging based on World Bank income
classifications near the end of our period (as of November 2005). Daily price, return, volume, and
market capitalization are from CRSP for the United States and from Thomson Datastream for the
rest of the world. Daily and weekly Wednesday-to-Wednesday returns are adjusted for dividends and
stock splits from Datastream. Assets representing preferred stock, warrants, unit or investment
trusts, ADRs, duplicates, or cross-listings are excluded from the sample. With Datastream data this
requires an extensive screening process described in detail in the appendix.

6
Because we are not confident in Datastream volume data, we use changes in price as a proxy
for trading activity, although in some cases we use volume as an additional screen. We require
evidence of trading activity on at least 30% of the days when the market is open to mitigate the
appearance of market inefficiency solely as a function of infrequent trading.2
Impediments to information incorporation may plausibly be associated with size. Small firms
are more likely to be neglected and have higher trading costs. To avoid results that are driven by
market capitalization differences across countries, we sort all stocks that pass the above criteria into
five equally weighted size portfolios based on US-dollar break points.
In June of each year, all US common equity are sorted into five portfolios with the same
number of securities. Using end of June exchange rates from Datastream, we convert each asset’s
market capitalization into US dollars and use these breakpoints when forming the quintile portfolios
within each country. The portfolios are held for one year from July to June and rebalanced at the
end of June. To be included in our analysis a portfolio must have five or more companies with June
market capitalization that also pass the criteria listed above. Market returns are computed from
Datastream total return indices.3 The individual stock returns are in local currency, as is the local
market return. For our event study, we collect earnings reporting dates from IBES as a proxy for
earnings announcement dates.
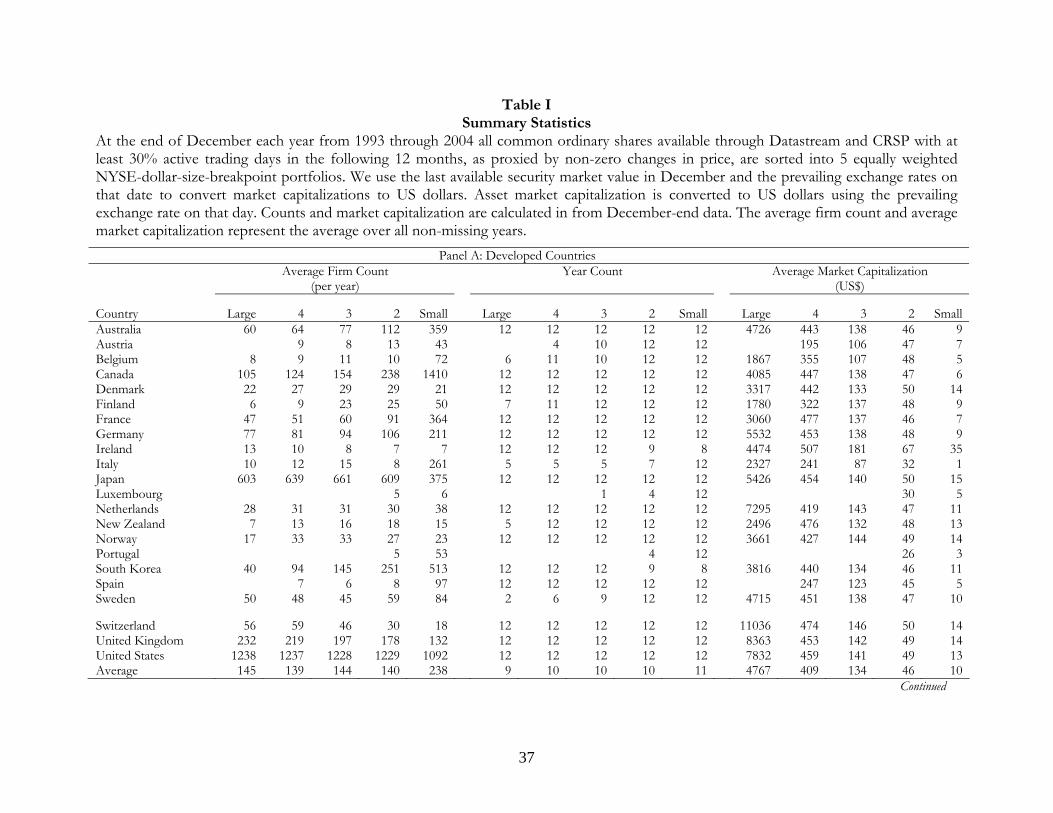
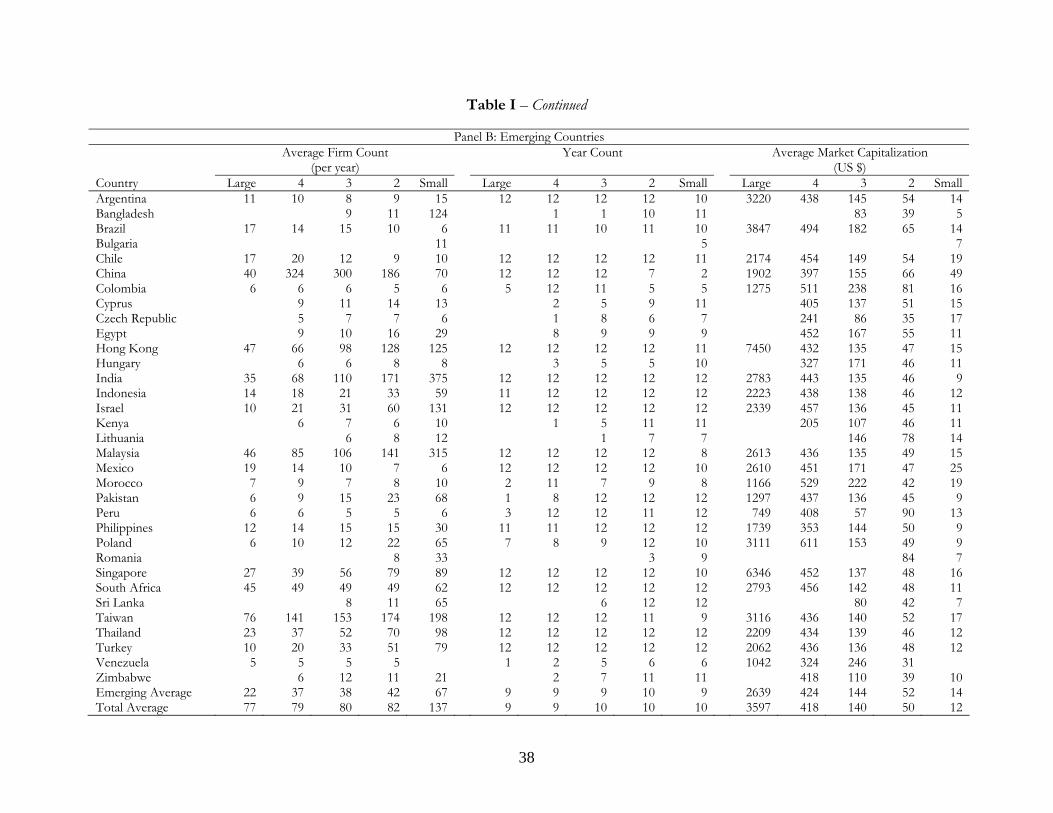
Table I presents the average number of firms in each portfolio at the end of each June, the
number of the eleven years for which we have returns for that portfolio, and the total June-end
market capitalization for the portfolio expressed in US dollars both for developed (Panel A) and
emerging (Panel B) portfolios. Both in terms of the average number of firms in each portfolio as
2 If a stock were to trade only once per month, then lagged weekly returns ought to be related to the current stock return as they contain information about the change in the fundamental value of the asset during the period it did not trade. If this were the case, delay would not be an indicator of information efficiency, but merely a sign of illiquidity. 3 In the six markets where Datastream indices are not available, we compute our own value-weighted index.

7
well as the number of years with representation, most markets have broad coverage with the
exception of some smaller emerging markets and Portugal. The average market capitalization for
each portfolio is fairly homogenous across countries for each size group indicating that the simple
size groupings are effective at controlling for size differences in firms across countries. It is also
somewhat surprising that many emerging markets have reasonable coverage in the large cap group.
B. Methodology
We use several methods to explore market efficiency. As a measure of private information
incorporation we use differences in the level of abnormal volatility around earnings announcements
using a methodology proposed by Bhattacharya, Daouk, Jorgenson, and Kehr (2000). To examine
the incorporation of public information, we use levels and differences of the Hou and Moskowitz
(2005) delay measure. To measure trading cost across portfolios and across countries, we use trading
cost estimates at the firm level using methodologies from Hasbrouck (2005) and Lesmond, Ogden,
and Trzinka (1999).
B.1. Abnormal Event Volatility
Following Bhattacharya, Daouk, Jorgenson and Kehr (2000), we use a test of abnormal
volatility to detect the extent to which private information is incorporated in stocks’ prices prior to
the earnings announcement date. Absence of an event day movement in the absolute return suggests
that either the information contained in the announcement is already impounded in the stock’s price
or that there was no value relevant information.
Whether or not private information leakage improves the overall level of market efficiency is
a question of some debate. Private information leakage increases the informativeness of prices in the
short-run. However, Easley and O’Hara (2004) point out that greater private-information based
trading reduces the level of liquidity trading and causes the market maker to set wider bid-ask
spreads to compensate for the risk of trading against the informed. Brunnermeier (2005) argues that

8
increased insider trading reduces the profitability of information gathering and leads to less trading
by outsiders and less informative prices in the long-run.
To gauge the economic magnitude of the event day returns, we simply calculate the
difference between the average absolute returns during the announcement window (-1 to +2) and
the average absolute non-event day return during the testing window (-55 to -2 and +3 to +10). To
assess significance, we use a non-parametric rank-deviation test for differences in abnormal absolute
returns first proposed by Corrado (1989) and as implemented by Bhattacharya, el al (2000). For
each event, we sort and rank the absolute market model excess return over the -55 to +10 testing
window from lowest to highest. We choose to extend the testing window no longer than 55 days
prior to the event in order to avoid including other earnings announcements in the event window.
The mean rank deviation is a measure of how much higher in order (not magnitude) volatility is. It is
calculated over the -1 to +2 event window as:
∑ ∑= −=
⎟⎠
⎞⎜⎝
⎛−=
N
i ttiK
Nk
1
2
1, 5.33(1)(μ (1)
Where K is the rank of the absolute excess return for event i on day t and N is the number of events
in the sample. 33.5 is the mean rank for our 66 day testing window. The standard deviation of the
mean rank deviation is:
∑ ∑+
−= =
⎟⎠
⎞⎜⎝
⎛−=
10
55 1, 5.33(1
664)(
t
N
itiK
NKσ . (2)
The test statistic for the test that volatility is significantly different from normal is:
)()(
KKt
σμ
= . (3)

9
Similar to the requirements in Bhattacharya, et al (2000), an event must have at least 30 trading days
during the 66 day testing window to be included.4
B.2. Delay
The second measure we use to explore market efficiency is Hou and Moskowitz (2005) delay,
which measures the sensitivity of current stock returns to 4 weeks of lagged market returns. We use
the local market index because Griffin (2002) shows that individual stocks are much more
responsive to local market factors than to global factors. To ensure that the delay measure is not
purely a function of infrequent trading, only stocks trading on at least 30% of the trading days in
each year are included in our analysis. Like Hou and Moskowitz (2005), we find that delay on
individual firms is extremely noisy, but the formation of portfolios substantially reduces the
estimation error with delay. We form five equal-weighted size portfolios within each country.
For each country/size portfolio, we estimate the restricted and the unrestricted models
below over the entire July 1994 to June 2005 sample period5. The unrestricted model is:
titmitmitmitmitmiiti rrrrrr ,4,43,32,21,1,0,ˆˆˆˆˆˆ εβββββα ++++++= −−−− . (4)
The restricted model constraints the coefficients on the lagged market returns to zero.
titmiiti rr ,,0,ˆˆ εβα ++= . (5)
The R2s from these regressions are used to calculate delay as follows:
22 .. restrictededunrestrict RAdjRAdjDelay −= . (6)
4 A daily return is considered missing or inactive if it has no price change and also no volume. We also require an event of have trading on at least 15 of the 20 days from -9 to +10, similar to the procedure used by Brown and Warner (1985). We treat missing returns in the testing window as low absolute return days. This has the possible effect of overstating event day volatility. However, this overstatement should be more severe in portfolios with a large fraction of missing returns, such as occurs in emerging markets. However, emerging markets are typically characterized by low absolute returns. 5 On the other hand, calculating delay at the firm level and then averaging across portfolios does not solve problems with estimation error but merely aggregates the errors.

10
Delay is simply the incremental explanatory power due to lagged factors. To control for explanatory
power simply due to increased regressors, adjusted R2 are used. Delay is a measure of weak form
efficiency similar in spirit to the variance ratio test.
Our measure of delay is slightly different from the measure calculated in Hou and
Moskowitz. Their measure is:
2
2
1edunrestrict
restricted
RR
Delay −= . (7)
Using this measure a market could have high delay but if it is scaled by a large adjusted R2 ,
(as it may happen in some emerging markets), then the size of the delay is reduced. Nevertheless, we
find that our inferences are similar if using the scaled Hou and Moskowitz measure.
To avoid spurious overstatement of delay for mechanical reasons, we de-mean (or de-bias)
our delay measure by subtracting a bootstrapped version of the same measure. This bootstrapped
adjustment factor should have no lagged explanatory power because through random sampling, the
bootstrap destroys any existing autocorrelative structure. Therefore, the adjusted delay measure
should reflect delay solely as a function of sensitivity to past returns, and not measure error.
B.3. Trading Costs
Inefficient incorporation of information may be a function of impediments to trading. For
instance, bid-ask spreads, trading commissions, and lack of liquidity undermine the ability of
arbitrageurs to exploit deviations from efficient pricing. Unfortunately, intraday transaction costs
measures are not available for a broad number of countries. Hence, we use two different estimates
of transactions costs that are derived from daily data and capture slightly different aspects of the
costs involved in trade.
11
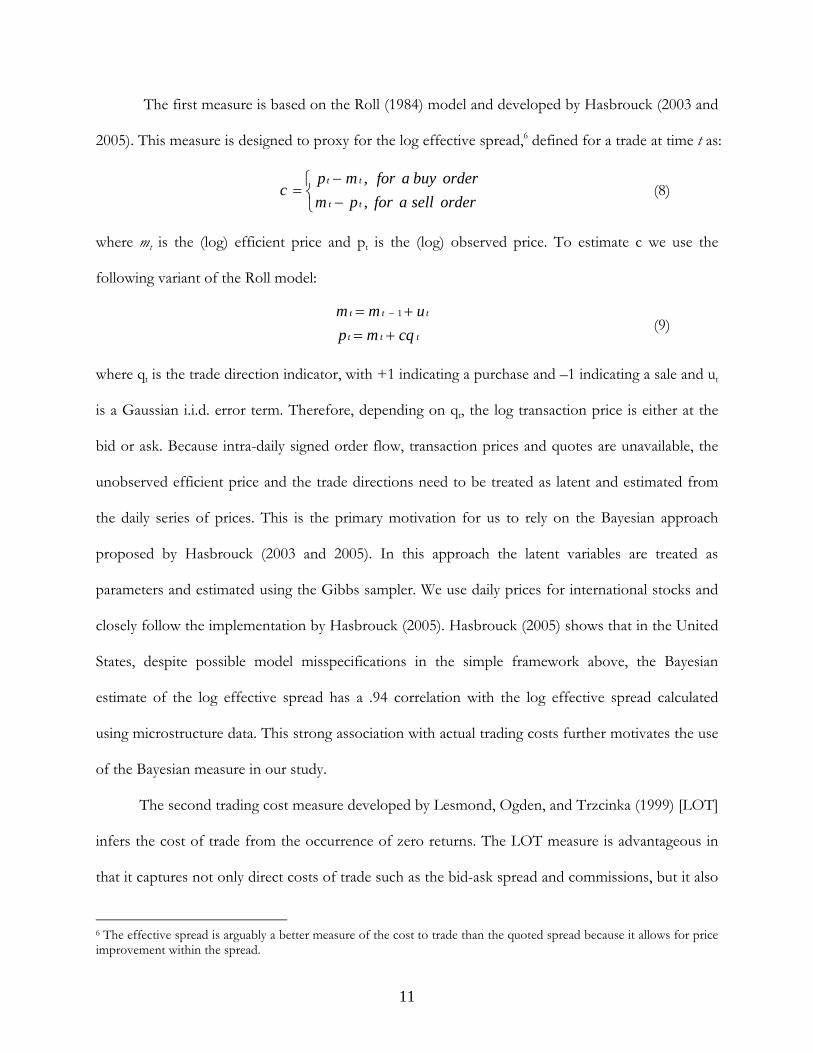
The first measure is based on the Roll (1984) model and developed by Hasbrouck (2003 and
2005). This measure is designed to proxy for the log effective spread,6 defined for a trade at time t as:
⎩⎨⎧
−−
=ordersellaforpmorderbuyaformp
ctt
tt
,,
(8)
where mt is the (log) efficient price and pt is the (log) observed price. To estimate c we use the
following variant of the Roll model:
ttt
ttt
cqmpumm
+=+= − 1
(9)
where qt is the trade direction indicator, with +1 indicating a purchase and –1 indicating a sale and ut
is a Gaussian i.i.d. error term. Therefore, depending on qt, the log transaction price is either at the
bid or ask. Because intra-daily signed order flow, transaction prices and quotes are unavailable, the
unobserved efficient price and the trade directions need to be treated as latent and estimated from
the daily series of prices. This is the primary motivation for us to rely on the Bayesian approach
proposed by Hasbrouck (2003 and 2005). In this approach the latent variables are treated as
parameters and estimated using the Gibbs sampler. We use daily prices for international stocks and
closely follow the implementation by Hasbrouck (2005). Hasbrouck (2005) shows that in the United
States, despite possible model misspecifications in the simple framework above, the Bayesian
estimate of the log effective spread has a .94 correlation with the log effective spread calculated
using microstructure data. This strong association with actual trading costs further motivates the use
of the Bayesian measure in our study.
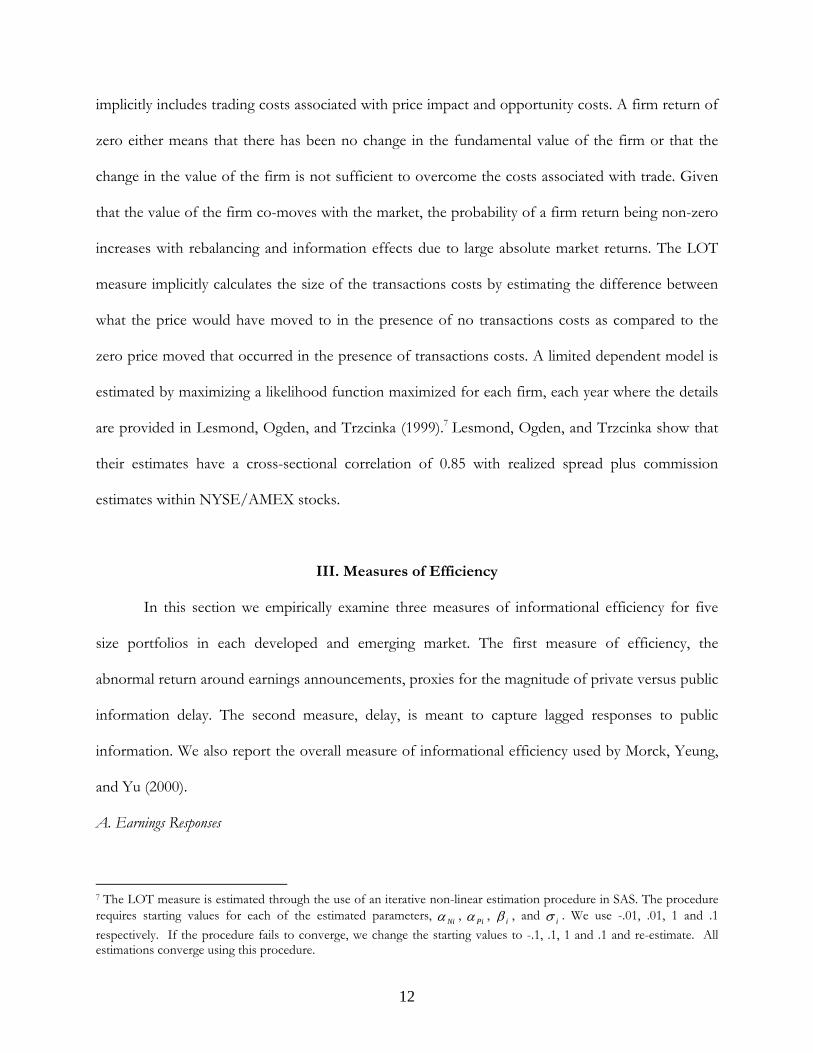
The second trading cost measure developed by Lesmond, Ogden, and Trzcinka (1999) [LOT]
infers the cost of trade from the occurrence of zero returns. The LOT measure is advantageous in
that it captures not only direct costs of trade such as the bid-ask spread and commissions, but it also
6 The effective spread is arguably a better measure of the cost to trade than the quoted spread because it allows for price improvement within the spread.
12
implicitly includes trading costs associated with price impact and opportunity costs. A firm return of
zero either means that there has been no change in the fundamental value of the firm or that the
change in the value of the firm is not sufficient to overcome the costs associated with trade. Given
that the value of the firm co-moves with the market, the probability of a firm return being non-zero
increases with rebalancing and information effects due to large absolute market returns. The LOT
measure implicitly calculates the size of the transactions costs by estimating the difference between
what the price would have moved to in the presence of no transactions costs as compared to the
zero price moved that occurred in the presence of transactions costs. A limited dependent model is
estimated by maximizing a likelihood function maximized for each firm, each year where the details
are provided in Lesmond, Ogden, and Trzcinka (1999).7 Lesmond, Ogden, and Trzcinka show that
their estimates have a cross-sectional correlation of 0.85 with realized spread plus commission
estimates within NYSE/AMEX stocks.
III. Measures of Efficiency
In this section we empirically examine three measures of informational efficiency for five
size portfolios in each developed and emerging market. The first measure of efficiency, the
abnormal return around earnings announcements, proxies for the magnitude of private versus public
information delay. The second measure, delay, is meant to capture lagged responses to public
information. We also report the overall measure of informational efficiency used by Morck, Yeung,
and Yu (2000).
A. Earnings Responses
7 The LOT measure is estimated through the use of an iterative non-linear estimation procedure in SAS. The procedure requires starting values for each of the estimated parameters, Niα , Piα , iβ , and iσ . We use -.01, .01, 1 and .1 respectively. If the procedure fails to converge, we change the starting values to -.1, .1, 1 and .1 and re-estimate. All estimations converge using this procedure.

13
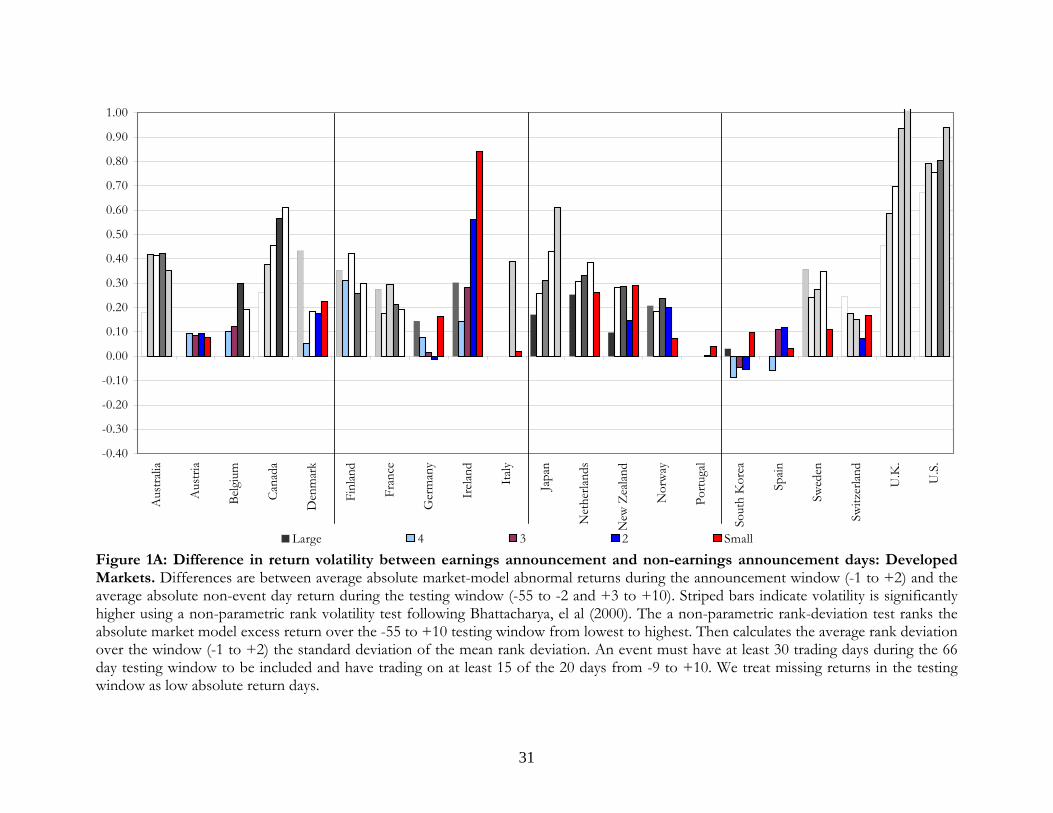
First, we examine the volatility of returns around earnings announcements. Figure 1 reports
the average absolute value of the event day abnormal return as compared to the average absolute
non-event period market-adjusted return. Cross-firm averages are reported for firms in each size
quintile. Since returns are in absolute value a positive number indicates that returns are more
responsive around the earnings announcement. Significant bars are stripped where significance is
determined with the Corrado test as discussed above. Panel A is for developed markets and Panel B
is for emerging markets.
Earnings responsiveness varies drastically across markets and developed markets generally
exhibit much larger earnings response than emerging markets. First, there are only a few developed
markets that have economically small and statistically insignificant responses to earnings (Austria,
Portugal, South Korea, and Spain).8 Second, even within developed markets responses vary widely
with some U.S. and U.K. portfolios experiencing abnormal daily absolute returns close to one
percent more than non-event days, whereas the magnitude is much lower in smaller developed
markets. Third, within most developed markets earnings announcements seem to be more
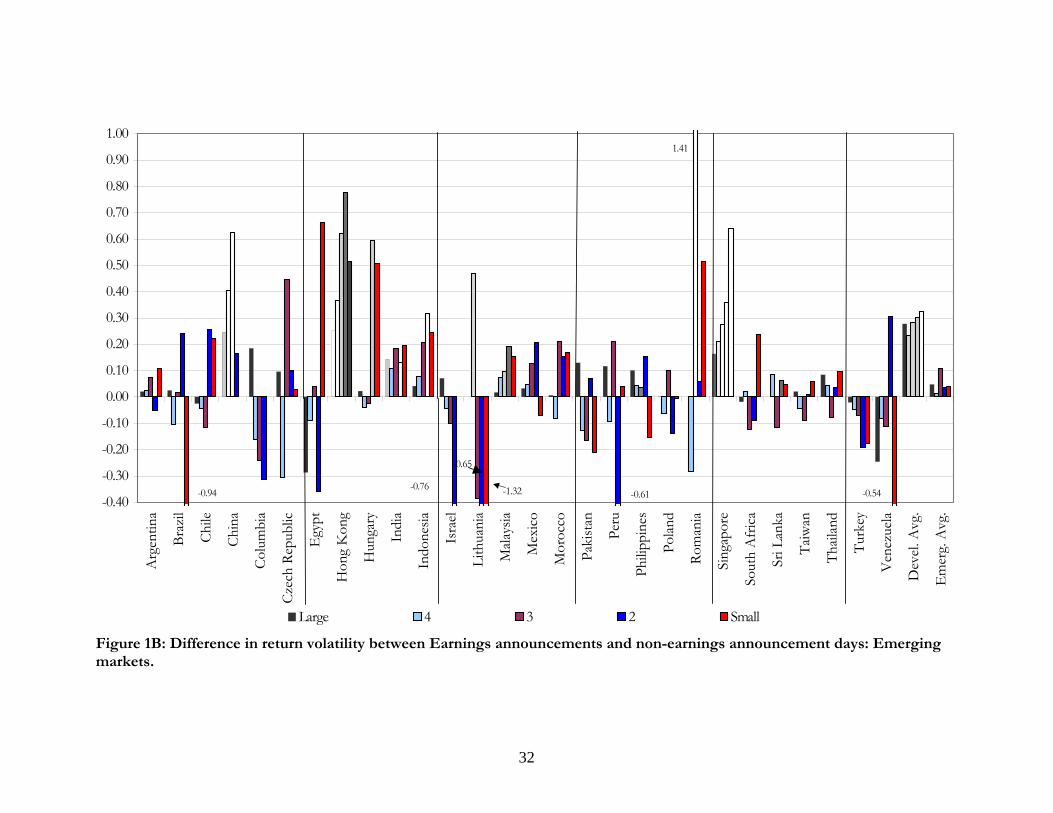
informative for small firms. In contrast, there are a few emerging markets that have economically
large and/or statistically significant positive abnormal returns around earnings announcements.
Namely, only in China, Hong Kong, India, Malaysia, and Singapore do we see reliably positive
excess return responses in two or more portfolios. It is interesting that except for Hong Kong and
India the other countries are arguably Asian dictatorships. Hungary, Indonesia, Lithuania, the
Philippines, Romania, and Sri Lanka all have one portfolio with significant reactions around the
announcement but the other portfolios are insignificant and the differences are economically quite
small. The other 17 emerging markets have no portfolio with significant reactions around earnings
8 Some markets like Ireland exhibit large earnings responses in the smaller cap portfolios but low significance likely due to a low number of earnings events.

14
announcements. This lack of response to earning announcements in emerging markets parallels the
findings of Bhattacharya, et al (2000) for Mexico.
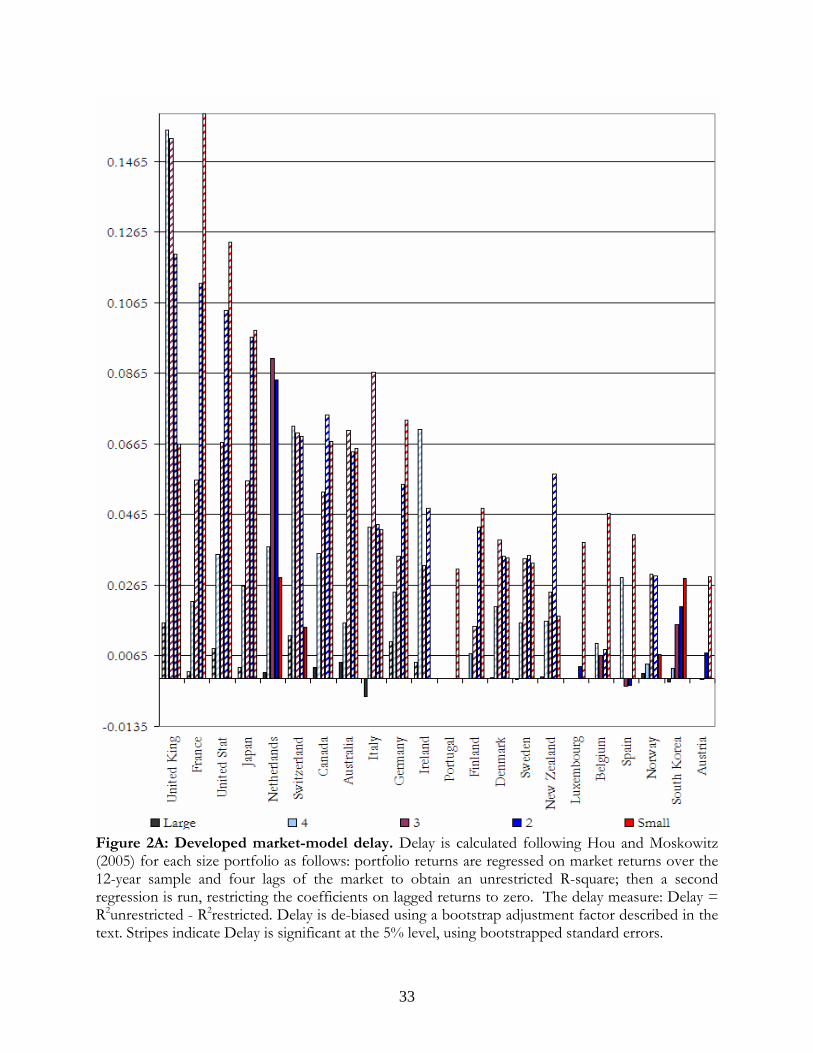
B. Delay
As described above, delay is calculated for size portfolios over the July, 1994 to June, 2005
period. Figure 2 displays the magnitude of delay for each of the five size portfolios within each of
the 55 countries. Stripped bars represent significant delay coefficients and solid bars are insignificant.
Although five or more stocks are required to form delay portfolios, it is important to note that
significance may be less in some emerging markets due to the smaller number of stocks leading to
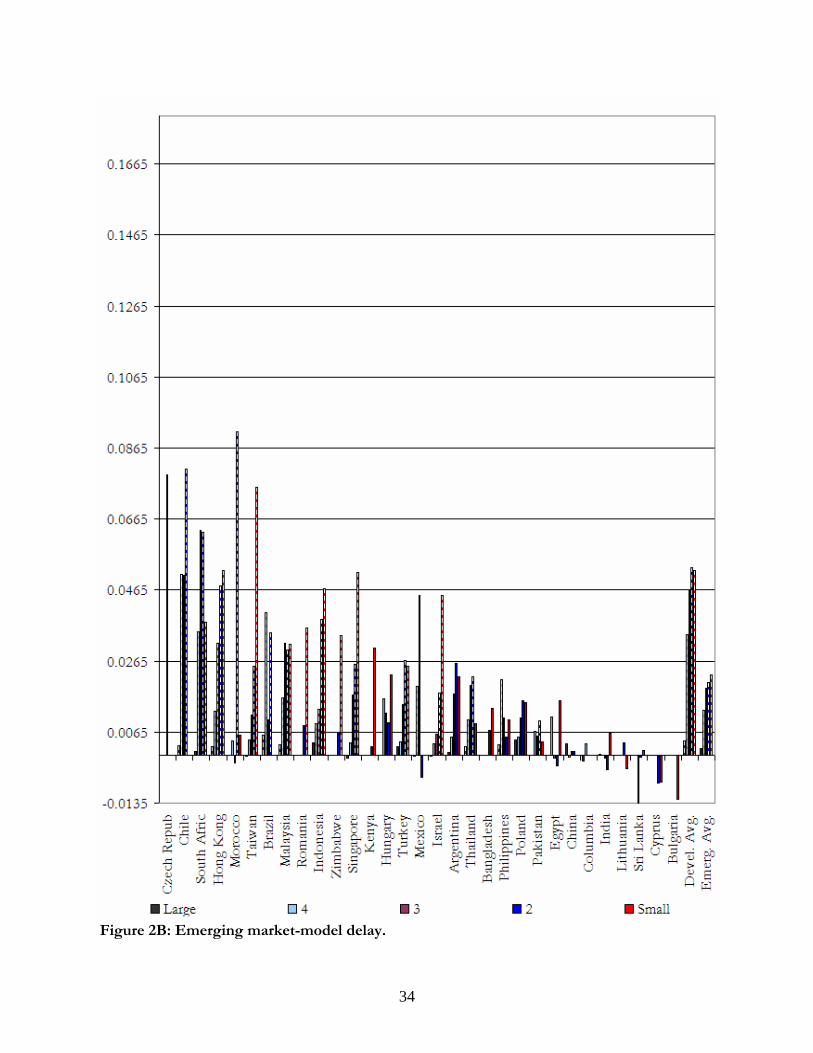
more volatile portfolios. Panel A shows delay for developed markets and Panel B is for emerging
markets. Figure 2 displays several interesting findings. First, delay is universally low in large cap
stocks. Second, within most countries, delay is generally decreasing in firm size. In almost all
markets delay for the largest two portfolios is extremely small. However, delay for most small cap
portfolios is much larger. In countries where delay is not monotonically increasing in firm size there
are typically fewer stocks in the portfolios and the differences between portfolios may reflect noise
in delay. This first finding is perhaps not surprising in that one expects large cap stocks to be more
efficient than small cap stocks and Hou and Moskowitz find more delay among small cap stocks in
the U.S.
Second, delay estimates fluctuate widely across countries. Third, countries with high delay
for the smallest cap portfolio typically have higher delay for the quintile two or three portfolio as
well, indicating that delay contains a country-specific component. Fourth, delay is generally larger in
developed markets. In comparing size quintiles, emerging markets have significantly less delay in all

15
but the largest size quintile. In terms of their ability to incorporate market information into prices,
the average emerging market is every bit as effective as the developed markets.9
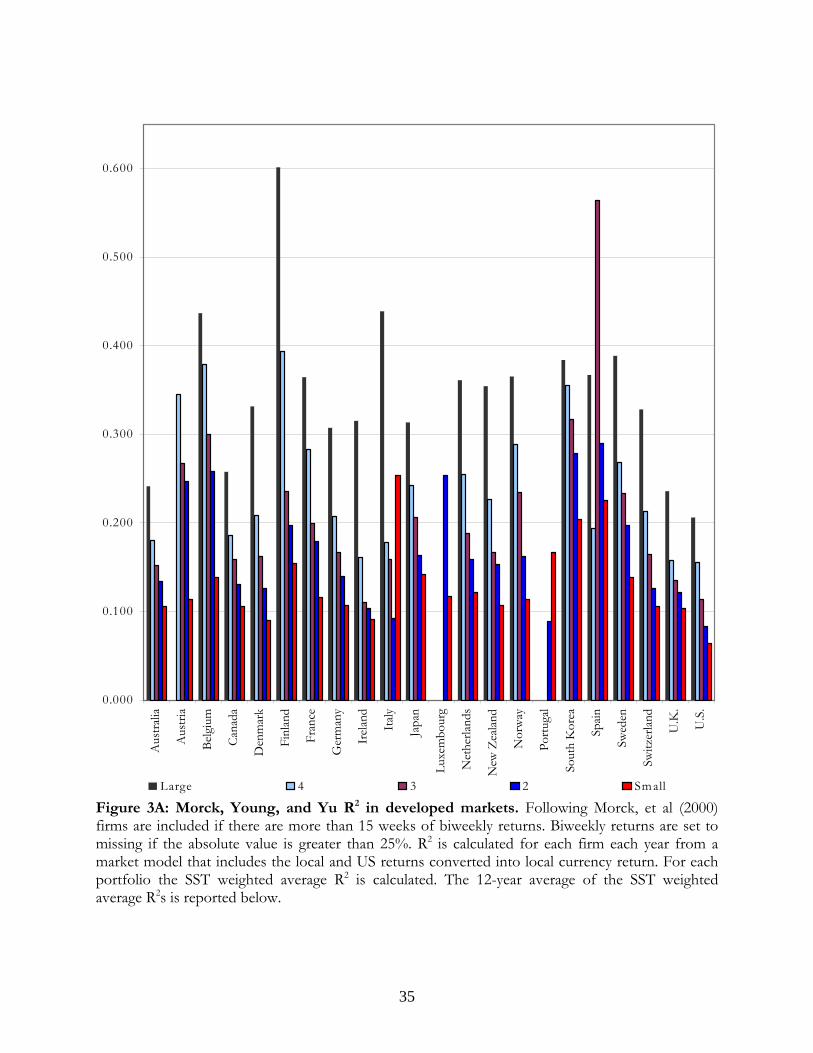
C. Average R2
To examine R2, as a measure of efficiency, we estimate market model regressions like those
in Morck, Yeung, and Yu (2000) on individual securities and then aggregate the R2 for different
portfolios. Figure 3 displays the average R2s for each quintile portfolio for developed markets in
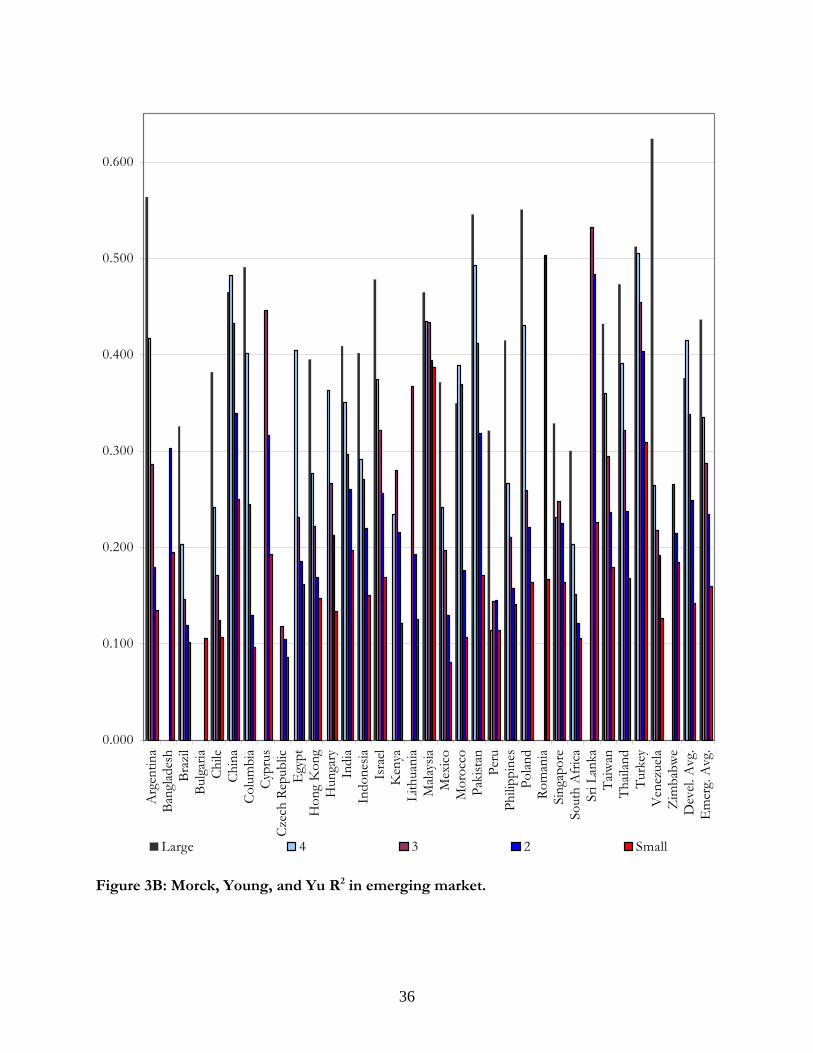
Panel A and emerging markets in Panel B. We first observe that like Morck, Yeung, and Yu, R2s are
generally larger for emerging markets. Second, a consistent pattern that emerges is that within each
country R2s are nearly monotonically decreasing with firm size. Morck, Yeung, and Yu conclude
that high R2 firms are less informationally efficient, yet it seems counterintuitive that large cap firms
are less informationally efficient than small cap firms. Third, a rough inspection of the level of the R2
across markets appears to yield quite different inferences than examining delay or earnings responses.
For example, China has quite high adjusted R2s which Morck et al (2000) argue indicates inefficiency,
but low delay (indicating more efficiency), and significant earnings responses (possibly indicating
more long-run efficiency).
D. Comparing Measures
We now turn to comparing the measures of efficiency both within and across countries.
Transactions costs are a barrier to efficient incorporation of information. Additionally, holding
constant other features of spreads, securities with rampant insider trading must have higher
transactions costs to compensate the market maker for adverse selection risk. While low transactions
costs may not be sufficient to guarantee informationally efficient pricing, investors facing low
9 In unreported results we also calculate the delay with respect to a global market portfolio that is beyond the delay to local market factors. Global market delay varies widely across countries, generally decreasing with firm size, and much smaller than local market delay. Given the smaller magnitudes of global market delay and how these magnitudes are likely influenced by a countries’ foreign sales activity or foreign listings, we choose to focus on the cleaner domestic delay measures but see global delay as an interesting area for further investigation.

16
transactions costs can more readily (profitably) trade on incremental information, thereby increasing
efficiency.
We examine correlations between delay, excess absolute return moves (as compared to non-
event times), and R2. We also correlate these measures to both the Hasbrouck (2005) and Lesmond,
Ogden, and Trzcinka (1999) trading costs measures. To compare within countries we take the time-
series average value of each variable within each country for each portfolio and then calculate a
Spearman rank correlation across the five portfolios within each country. We then average the
correlation estimates across countries and report the values in the upper diagonal of the correlation
matrix in Table II. We also compute cross-country correlations. To do so we take the average delay
and abnormal earnings return across the five portfolios within each country to obtain a country
average delay, abnormal earnings return, or transactions costs and then we compute cross-country
correlations using those numbers.10
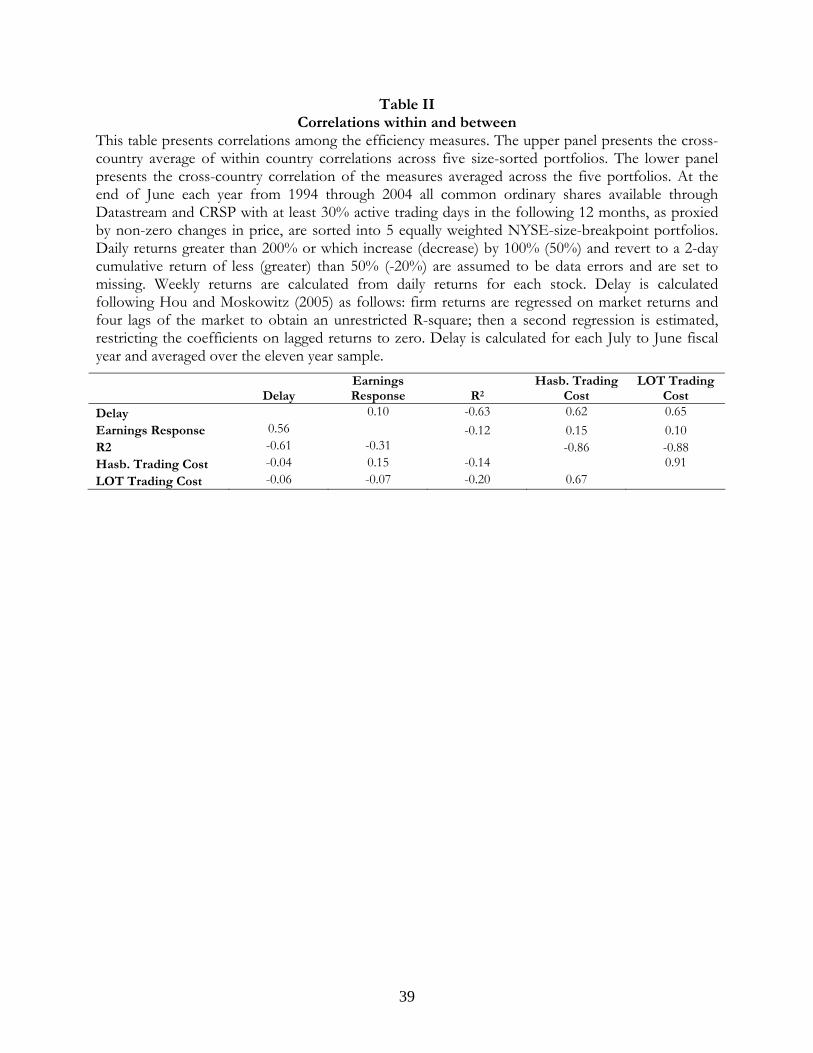
Our comparison of the three measures of efficiency leads us to three interesting findings.
First, delay and R2 are strongly inversely related; an association that is somewhat weaker across
countries than within. R2 has a correlation of -0.81 with delay within country, and correlation of -
0.51 across countries. This finding is notable, because it suggests that delay and R2 may actually work
in opposite directions in measuring efficiency. Second, within each country, the upper diagonal
elements of Table II show that delay has an average correlation of 0.09 with abnormal absolute
earning announcement returns and this correlation is 0.35 across countries. This tells us that delay, a
measure of public informational efficiency, is not associated with the presence of information
leakage. Third, R2 has a correlation of -0.12 with abnormal absolute earnings announcement returns
within country, and a correlation of -0.36 across countries. Although the evidence within countries is
10 To be consistent with Morck, Yeung, and Yu (2000), we compute our average R2 by averaging across all stocks each year and not taking the average across five size groups. However, using average R2s that are calculated as the average across five size groups yields extremely similar inferences.

17
weak, across countries it seems to be the case that markets with restrictions on trading based on
private information have a lower R2. If abnormal volatility surrounding earnings announcements is
indeed indicative of more accurate incorporation of private information in the long-run, then these
findings are consistent with the Morck, Yeung, and Yu (2000) interpretation of low R2 as a measure
for private information incorporation.
We also examine the relation between trading costs and our measures of efficiency. Delay is
strongly positively associated with trading costs within countries and weakly positively associated
across countries. This relation is consistent with more efficient incorporation of information into
prices of securities with low transactions costs. Abnormal event returns exhibit weak relations to
transactions costs indicating that private information trading is not the main driver of trading costs.
Conversely, R2 is negatively associated with both trading costs measures across and especially within
countries. High R2 is associated greater efficiency not less.
There is mixed and weak evidence on the relation between abnormal announcement returns
and transactions costs. Taken together, the positive relation of transactions costs with delay and the
negative relation with R2 suggestive that delay works much better than R2 as a measure of efficiency.
The weak relations between delay and earnings responses suggest that private information trading is
generally not associated with efficiency with respect to public information. We now turn to an
analysis of the economic drivers behind the various measures of efficiency.
IV. The Determinants of Efficiency Measures
A. Cross-Country Data
There are a multitude of cross-country variables that may be related to our measures of stock
market efficiency. While many international papers focus on a narrow set of cross-country variables,
we follow Griffin, Nardari, and Stulz (2006) and use a broad set of variables that have been shown

18
to have a priori appeal for various facets of stock market activity. These variables can be roughly
grouped into regulatory, economic/financial development, informational environment, economic
risk, and properties of market returns. Variables are constructed at the annual frequency from 1994
to 2005 when possible, but when taken from other papers are limited to the sample period therein.
Possible interpretations of most of these variables are discussed in Griffin, Nardari, and Stulz, but
we also discuss interpretations of the relevant variables below. We examine whether efficiency is
associated with these country-level characteristics first with correlation analysis, then through
multiple regression analysis.
A. Simple Relations
For each country and year, we construct average delay by taking the equal-weighted average
delay across five portfolios and then the average across time. We also compute this average delay
across the bottom two size portfolios. Pearson correlations between these variables and twenty
cross-country time averaged variables are reported in the first and second column of Table III. The
abnormal absolute return around earnings announcements in excess of the average non-event
absolute return is the variable in the third column and the average R2 for a country (computed
following Morck, Yeung, and Yu (2000) and not at the portfolio level) is reported in the fourth
column. Spearman correlation coefficients and p-values are also reported.
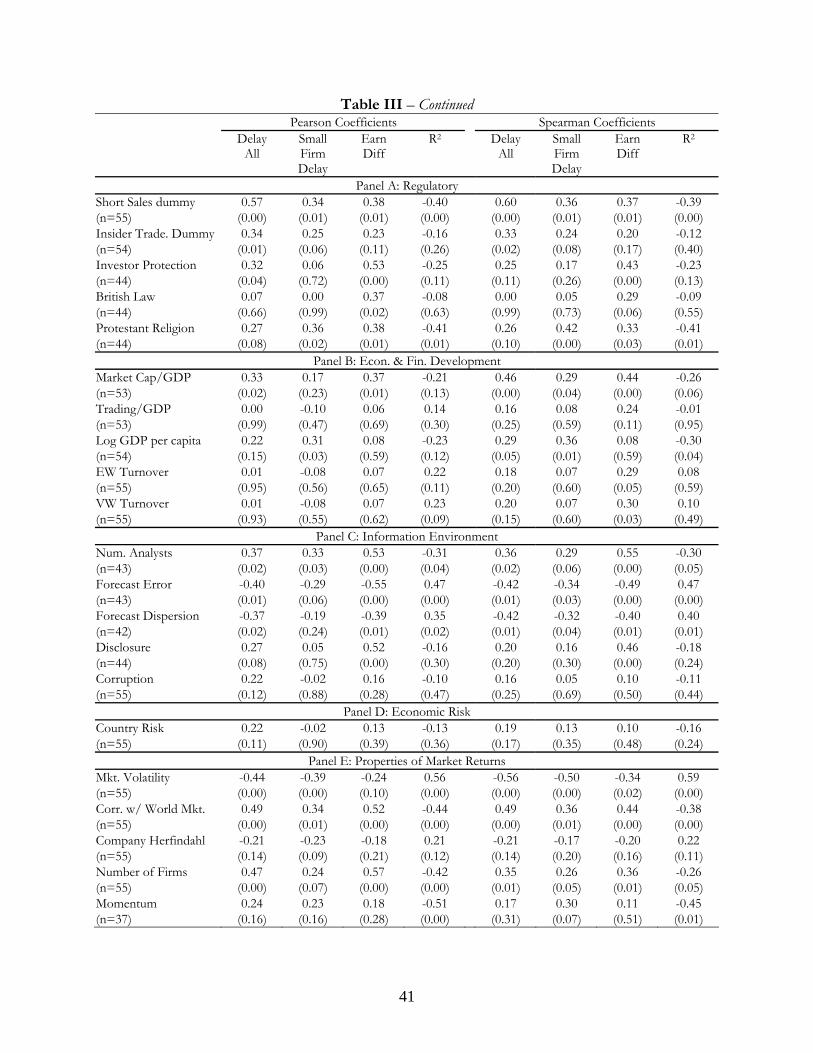
Table III shows that for both delay averaged across all five portfolios and for delay across
the bottom two portfolios, there are a few cross-country variables that are significantly related to
them. Market volatility is strongly negatively related to delay, and there is some evidence that short-
sale restrictions may be positively related to delay.
Regulatory, development, informational accounting variables, and market return variables are
all related to the measure of abnormal volatility around earnings announcements. R2 is significantly
related to trading-volume-to-GDP, turnover, forecast errors, forecast dispersion, market volatility,

19
and momentum. We need to examine specifications with multiple variables to disentangle the role of
competing cross-sectional variables.
B. Multiple Regressions
We now turn to examining abnormal event returns, cross-country determinants of delay, and
the Morck, Yeung, and Yu R2. Table V presents the results from regressing the average absolute
abnormal return on various combinations of most of the variables from Table III.11 We compute
GMM heteroskedasticity consistent standard errors.
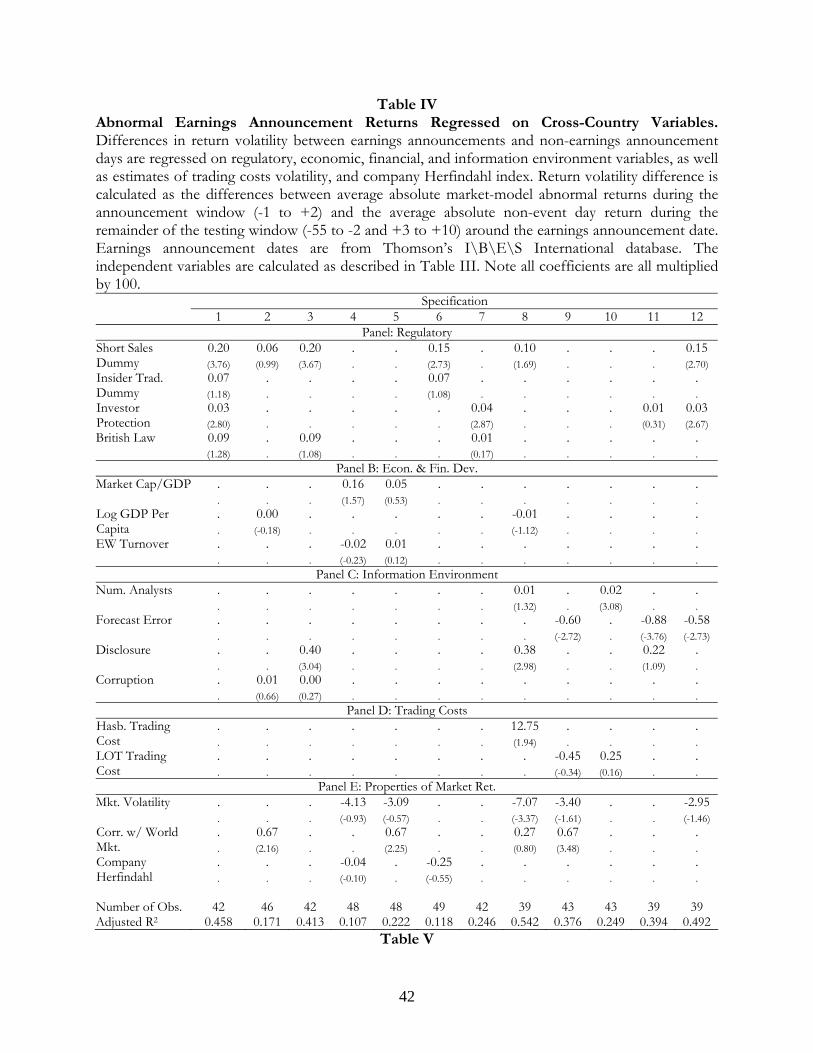
There is reliable evidence that short sales, investor protection (except in one specification),
and analysts forecast errors are significantly related to excess return movement around earnings
announcements. In unreported analysis we also estimate a host of other cross-sectional regressions
that confirm these predictions. The positive coefficients on the short sale variable means that
countries that both allow and experience short-sale activity exhibit more stock price movements
around earnings announcements. While there are clearly direct relations between short-sales and
price informativeness, we believe that the short sales variable is likely proxying for a correctly
functioning stock market. Markets that allow for short selling activity are also more likely to prohibit
investors from trading on private information. The insider trading variable of Bhattacharya and
Daouk (2002) captures whether a market has and enforces insider trading laws. In unreported
specifications we find that the variable is significant in one-variable regressions but rendered
insignificant in two-variable regressions either by including the short-sales variable or by investor
protection, indicating that short-sales and investor protection sufficiently capture the effect of a
good regulatory environment. The positive coefficient on investor protection in most of the
specifications indicates that good governance is associated with more informative earnings
11 For ease of presentation, several of the variables from Table III that were generally unimportant are excluded. However, we also estimated regressions with all of the excluded variables in various multivariate specifications where they rendered insignificant coefficients.

20
announcements. The negative coefficient on forecast error indicates that announcements are more
informative in countries where analysts provide more accurate earnings estimates. One
interpretation is that if analysts’ forecasts are extremely noisy, then earnings announcements are so
noisy that investors pay little attention to them. With a smaller set of 26 markets, DeFond, Hung,
and Trezevant (2005) perform a similar cross-sectional analysis and find that insider trading laws are
positively related to reactions around earnings announcements. Overall, we find that the regulatory
environment is extremely important for a distinction between private and public information.
Table V shows the cross-sectional relation between delay and the same variables displayed in
Table IV. Out of the sixteen cross-country variables, there is evidence in some specifications that
short-sales, insider trading, and investor protection, are often significant. However, the relations are
positive suggesting that the allowance and practice of short-sales, the protection of insider trading,
and good governance lead to more, not less delay.
Table VI uses the average delay for the smallest two portfolios as the regressand and
estimates similar cross-sectional regressions. Because delay is for the smallest two quintile portfolios,
we include the average transactions costs for the bottom two portfolios. Inferences are similar to
Panel A, more developed markets with better security laws have more variation explained by lagged
market returns.
We now turn our attention to examining the relation between the Morck, Yeung, and Yu R2
with the cross-country variables. Table VII shows that analysts forecast error, trading costs, and
especially market volatility are highly associated with a countries’ average market model R2. Market
volatility drastically increases the explanatory power of the regressions. The positive coefficient on
market volatility indicates that markets that fluctuate more have a stronger proportion of variation
explained by market forces. The positive coefficient on forecast error indicates that in countries
where analysts’ forecasts are poor predictors of earnings markets exhibit high R2. The negative

21
coefficient on the trading costs measures is inconsistent with the interpretation of R2 as a proxy for
informational efficiency, since markets should incorporate information better with lower
transactions costs. Morck, Yeung, and Yu (2000) find strong evidence from their cross-sectional
regressions that good governance is significant in 1993, 1994, and 1995. Over our 1994 to 2005
period however, the regression evidence confirms the univariate relations in Table III showing that
R2 is not related to investor protection or other regulatory variables. In unreported specifications we
replicate Morck’s finding in their sample period but not with R2 over an extended period and we also
find insignificant relations with five other governance variables. Overall, our regression evidence
finds that the Morck, Yeung, and Yu (2000) R2 is driven mainly by the volatility of the market and
inversely related to other efficiency proxies such as transactions costs.
V. Conclusion
This paper examines pricing efficiency with respect to public and private information. To
proxy for the leakage in private information, we examine absolute abnormal return movements
around earnings announcements. Return volatility around earnings announcements varies
dramatically across countries, with the average emerging market exhibiting no responsiveness to
earnings announcements. In cross-country analyses we find that the regulatory climate such as the
allowance of short-sales and good investor protection is strongly associated with informative
earnings announcements. We find almost no correlation between the response to earnings
announcements and delay, indicating that private information leakage is not broadly associated with
the incorporation of public information. We find that delay, our measure of public information
incorporation, indicates that the average emerging market is somewhat better than a developed
markets at incorporating market-wide information into prices. Our cross-sectional regression

22
analysis yields puzzling results that markets with poor security laws actually have more variation
explained by lagged market returns.
We also examine the commonly used market model R2 as a measure of informational
efficiency and find that it is largely driven by the volatility of a market. Additionally, a country’s
average R2 is unrelated to the regulatory variables previously emphasized and related to transactions
costs in a manner suggesting that a low R2 proxies for an inefficient (not efficient) market.
Measuring informational efficiency is a complex task but one worth addressing given that the
information environment is crucial for a stock market to efficiently allocate capital. Our findings
suggest that, in terms of incorporating public information, many emerging markets are more
efficient than some developed markets and, hence, point to benefits of local stock markets not
previously recognized. Our findings strongly point to the use of separate measures of efficiency for
public and private information. A policy implication is that governance and security laws are
effective in fostering a more efficient transmission of private information but not useful for the
ability of prices to incorporate public information.
Capturing the efficiency of a stock market is useful for many important questions not
examined here such as whether stock market efficiency fosters economic development. We hope our
examination of stock market efficiency will spawn future research exploring the importance of these
efficiency measures for a variety of economic and financial issues.

23
Appendix
In this appendix we describe the data collection and filtering procedures used to collect and develop
the dataset of 22 developed markets and 33 emerging.
A.1 United States Daily data for the United States are collected from CRSP. We restrict our analysis to common
equity,by selecting only stocks with SHRCD=10 or 11. Delisting returns are used when necessary
and when available through CRSP. Following Shumway (1997), if a firm delists for performance
related reasons, we set the delisting return to -30%.
A.2 Rest of World Daily data for all countries except the US are collected from Thomson Datastream International. We
restrict our analysis to domestic common equity. We first collected lists of both active and inactive
assets and collect the cross-section of assets. We eliminate stocks which are cross-listed; that is
where their “home country” is different from that of the market list used to pull the asset data.
The particular challenge when using Datastream data is that there is no consistent way to
restrict the sample to common equity only. Ince and Porter (2004, forthcoming in Journal of Financial
Research) is a useful reference. Additional criteria are as follows. We eliminate assets which:
1) Datastream codes as non-equity 2) Are duplicates or have the following words in the name field:
− DUPLICATE, DUPL, DUP, DUPE, 1000DUP 3) Have an industry code that indicates the asset is non-common equity:
ITSPL 73 SPLIT CAPITAL INV.TST ITVNT 76 INV.TST.VENTURE + DEV INVNK 77 INVESTMENT COS.(6) ITGSP 88 INV.TST.GEOG.SPECLSTS IVTUK 89 INVESTMENT TRUST UK
96 INVESTMENT TRUST - OLD
ITINT 109 INV.TST INTERNATIONAL
UNITS 110 AUTH. UNIT TRUSTS

24
RLDEV 112 REAL ESTATE DEV. CURFD 121 CURRENCY FUNDS INVCO 124 INVESTMENT COS. (UK) INSPF 125 INS.+ PROPERTY FUNDS OFFSH 136 OFFSHORE FUNDS INVTO 137 OTHER INV. TRUSTS
ITEMG 145 INV.TST.EMERGING MKTS
OEINC 148 OPEN ENDED INV. COS.
ITVCT 149 VENTURE CAPITAL TRUST
154 REAL ESTATE
EXTRF 159 EXCHANGE TRADED FUNDS
The name field of each asset is searched in order to identify non-common equity. We eliminate
assets with the following words in the name field:
1) ADR or GDR 2) Preferred stock: PREFERRED, PF, PFD, PREF, and ‘PF’ 3) Warrants: WARRANT, WARRANTS, WTS, WTS2, WARRT 4) Debt securities: DEBENTURE, DEBT 5) Investment trusts, real estate trusts, and limited partnerships: INV TST, RLST IT, UNT
TST, INVESTMENT TRUST, UNIT TRUST, and L P 6) Following Ince and Porter (2004) we use the following codes to eliminate mutual funds,
index funds, and partnerships: UT IT. .IT 500 BOND DEFER DEP DEPY ELKS ETF FUND FD IDX INDEX LP MIPS MITS MITT MPS NIKKEI NOTE PERQS PINES PRTF PTNS PTSHP QUIBS QUIDS RATE RCPTS RECEIPTS REIT RETUR SCORE SPDR STRYPES TOPRS UNIT UNT UTS WTS XXXXX YIELD YLD
7) EXPIRED, EXPIRY and EXPY In addition we have a number of country specific filters. We only list a country if country specific filters were applied.
1) Brazil: a. Preferred Shares (Ação Preferencial): PN, PNA, PNB, PNC, PNC, PNE, PNF,
PNG, PNDEAD, PNADEAD, PNBDEAD, PNCDEAD, PNDDEAD, PNEDEAD, PNFDEAD, PNGDEAD
b. Selected Share Portfolio receipts: RCSA c. Other Portfolio Receipts: RCTB
2) Columbia: preferred class: PFCL 3) China: we restrict the analysis to A shares only (tradable by domestic investors) 4) Sri Lanka:
a. Non-Voting Shares: NON VOTING or NONVTG b. RIGHTS or RTS
5) Ecuador: Not ranking for dividend: NRFD 6) Greece: Preferred Registered Shares and Preferred Bearer: PR and PB
25
7) Hungary: osztalékelsőbbségi (preferred share) OE 8) Indonesia:
a. RIGHTS RTS b. foreign board listings: FB and FB DEAD
9) India: delete stocks which trade on XNH 10) Isreal:
a. Cumulative preferred stocks P1 b. Assets with par values indicated 1 or 5
11) South Korea: a. Preferred shares: 1P, 1PB, 2PB, 3PB, 4PB, 5PB, 1PFD, 1PF, PF2, 2P, 3P
12) Lithuania: PREFERNCE 13) Mexico:
a. Delete the following classes: C, L, CPO, ACP, and BCP b. Multiclass shares: UB, UBC, UBD
14) Malaysia: a. assets indicated XCO b. A shares c. Foreign board: FB
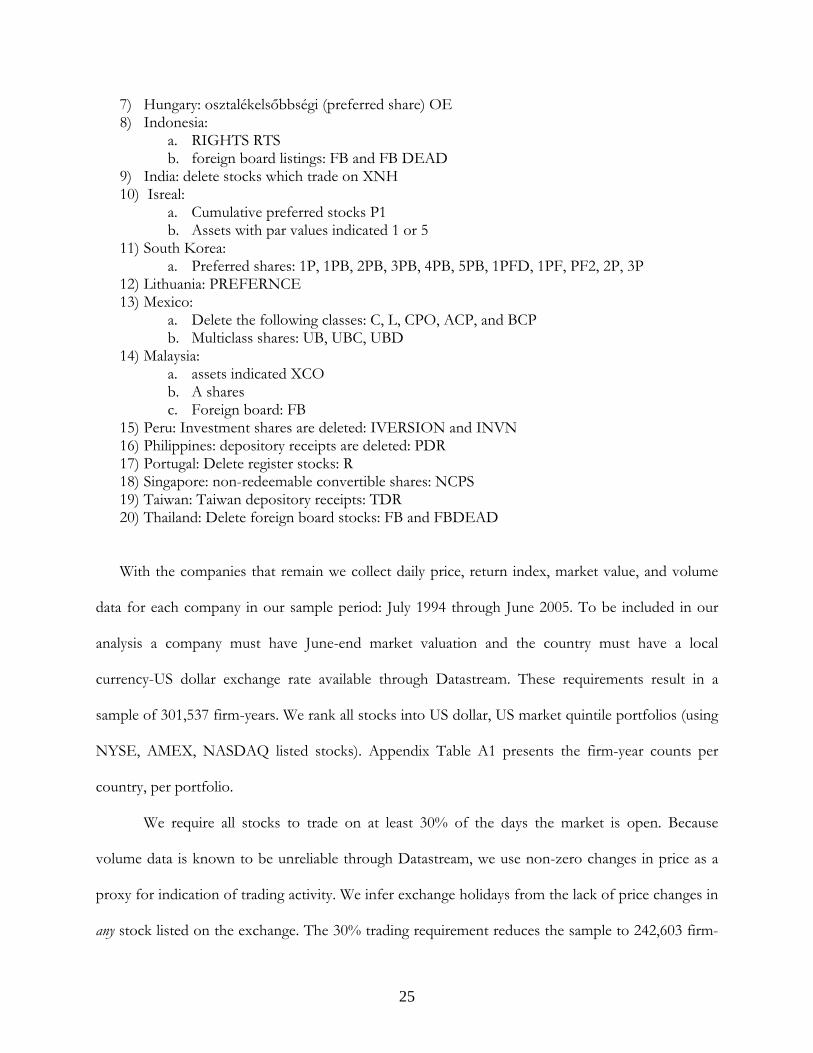
15) Peru: Investment shares are deleted: IVERSION and INVN 16) Philippines: depository receipts are deleted: PDR 17) Portugal: Delete register stocks: R 18) Singapore: non-redeemable convertible shares: NCPS 19) Taiwan: Taiwan depository receipts: TDR 20) Thailand: Delete foreign board stocks: FB and FBDEAD
With the companies that remain we collect daily price, return index, market value, and volume
data for each company in our sample period: July 1994 through June 2005. To be included in our
analysis a company must have June-end market valuation and the country must have a local
currency-US dollar exchange rate available through Datastream. These requirements result in a
sample of 301,537 firm-years. We rank all stocks into US dollar, US market quintile portfolios (using
NYSE, AMEX, NASDAQ listed stocks). Appendix Table A1 presents the firm-year counts per
country, per portfolio.
We require all stocks to trade on at least 30% of the days the market is open. Because
volume data is known to be unreliable through Datastream, we use non-zero changes in price as a
proxy for indication of trading activity. We infer exchange holidays from the lack of price changes in
any stock listed on the exchange. The 30% trading requirement reduces the sample to 242,603 firm-

26
years. Appendix Table A1 presents the firm-year counts per country, per portfolio. The last panel
presents the average market capitalization of the stocks passing the 30% filter listed in the portfolio
as a percentage of the total (unfiltered market capitalization).

27
REFERENCES
Atiase, Rowland Kwame, 1985, Predisclosure information, firm capitalization, and security price
behavior around earnings announcements, Journal of Accounting Research 23(1), 21-36.
Arbel, A., and P. Strebel, 1982, The neglected and small firm effects, The Financial Review 17, 201-218.
Bailey, W., Y. Gao, and C. X. Mao, 2004, Business, government, and the information environment:
Stock trading and earnings shocks in China, Indonesia, and Singapore, Annals of Economics and
Finance 5, 165-195.
Bailey, W., G. A. Karolyi, and C. Salva, 2005, The economic consequences of increased disclosure:
Evidence from international cross-listings, Working paper, Cornell University.
Bhattacharya, U., and H. Daouk, 2002, The world price of insider trading, The Journal of Finance 57,
75-108.
Bhattacharya, U., H. Daouk, B. Jorgenson, and C. Kehr, 2000, When an event is not an event: The
curious case of an emerging market, Journal of Financial Economics 55, 69-101.
Bris, A., 2005, Do insider trading laws work? European Financial Management 3, 267-312.
Bris, A., W. Goetzmann, and N. Zhu, 2003, Efficiency and the bear: Short-sales and markets around
the world, Working paper, Yale University.
Brown, S. J., and J. B. Warner, 1985, Using daily stock returns – The case of event studies, Journal of
Financial Economics 14, 3-31.
Brunnermeier, M. K., 2005, Information leakage and market efficiency, Review of Financial Studies 18,
417-457.
Campbell, J. Y., S. J. Grossman, and J. Wang, 1993, Trading volume and serial correlation in stock
returns, Quarterly Journal of Economics 108, 905–939.
Chang, J. J., T. Khanna, and K. Palepu, 2000, Analyst activity around the world, Working paper,
Harvard University.

28
Collins, Daniel W., S. P. Kothari, Judy Dawson Rayburn. 1987, Firm size and the information
content of prices with respect to earnings, Journal of Accounting and Economics 9(2), 111-138.
Corrado, C. J., 1989, A non-parametric test for abnormal security-price performance in event studies,
Journal of Financial Economics 23, 385-395.
DeFond, M., M. Hung, and R. Trezevant, 2005, Investor protection and the information content of
annual earnings announcements: International evidence, Working paper, University of Southern
California.
Durnev, A., R. Morck, and B. Yeung, 2004, Value-enhancing capital budgeting and firm-specific
stock return variation, The Journal of Finance 59, 65-105.
Durnev, A., R. Morck, B. Yeung, and P. Zarowin, 2003, Does greater firm-specific return variation
mean more or less informed stock pricing? Journal of Accounting Research 41, 797-836.
Easley, D., and M. O’Hara, 2004, Information and the cost of capital, The Journal of Finance 59, 1553-
1583.
Erb, C. B, C. R. Harvey, and T. E. Viskanta, 1996, Political risk, economic risk, and financial risk,
Financial Analysts Journal 52, 29-46.
Fishman, M. J., and K. M. Hagerty, 1992, Insider trading and the efficiency of stock prices, The
RAND Journal of Economics 23, 106-122.
Foerster, S. R., and G. A. Karolyi, 1999, The effects of market segmentation and investor
recognition on asset prices: Evidence from foreign stocks listing in the U.S., The Journal of Finance
54, 981-1013.
Griffin, J. M., 2002, Are the Fama and French factors global or country-specific? Review of Financial
Studies 10, 783-803.
Griffin, J. M., X. Ji, and J. S. Martin, 2003, Momentum investing and business cycle risk: Evidence
from pole to pole, The Journal of Finance 58, 2525-2547.
29
Griffin, J. M., F. Nardari and R. M. Stulz, 2006, Stock market trading and market conditions,
forthcoming, Review of Financial Studies.
Hasbrouck, J., 2003, Intraday price formation in the market for U.S. equity indexes, The Journal of
Finance, 58, 2375-2400.
Hasbrouck, K., 2005, Trading costs and returns for US equities: The evidence from daily data,
Working paper, New York University.
Hou, K. and T. J. Moskowitz, 2005, Market frictions, price delay, and the cross-section of expected
returns, forthcoming, Review of Financial Studies.
Jin, L., and S. C. Myers, 2006, R-squared around the world: New theory and new tests, Journal of
Financial Economics forthcoming.
Kelly, Patrick J., 2006, Information Efficiency and Firm-Specific Return Variation, Working Paper,
University of South Florida.
La Porta, P., F. Lopez-de-Silanes, and A. Shleifer, 2006, What works in securities law? forthcoming
in The Journal of Finance.
Leland, H. E., 1992, Insider trading: should it be prohibited?, Journal of Political Economy 100, 859-887.
Lesmond, D. A., J. P. Ogden, and C. A. Trzcinka, 1999, A new estimate of transaction costs, The
Review of Financial Studies 12, 1113-1141.
Lo, A. W., and J., Wang, 2000, Trading volume: Definitions, data analysis, and implications of
portfolio theory, Review of Financial Studies 13, 257-300.
Morck, R., B. Yeung, and W. Yu, 2000, The information content of stock markets: Why do
developing markets have synchronous stock price movements? Journal of Financial Economics 58,
215-260.
Roll, R., 1984, A simple implicit measure of the effective bid-ask spread in an efficient market, The
Journal of Finance 39, 1127-1139.

30
Roll, R., 1988, R2, The Journal of Finance, 43, 541-566.
31
Figure 1A: Difference in return volatility between earnings announcement and non-earnings announcement days: Developed Markets. Differences are between average absolute market-model abnormal returns during the announcement window (-1 to +2) and the average absolute non-event day return during the testing window (-55 to -2 and +3 to +10). Striped bars indicate volatility is significantly higher using a non-parametric rank volatility test following Bhattacharya, el al (2000). The a non-parametric rank-deviation test ranks the absolute market model excess return over the -55 to +10 testing window from lowest to highest. Then calculates the average rank deviation over the window (-1 to +2) the standard deviation of the mean rank deviation. An event must have at least 30 trading days during the 66 day testing window to be included and have trading on at least 15 of the 20 days from -9 to +10. We treat missing returns in the testing window as low absolute return days.
-0.40
-0.30
-0.20
-0.10
0.00
0.10
0.20
0.30
0.40
0.50
0.60
0.70
0.80
0.90
1.00
Aus
tralia
Aus
tria
Belg
ium
Cana
da
Den
mar
k
Finl
and
Fran
ce
Ger
man
y
Irela
nd
Italy
Japa
n
Net
herla
nds
New
Zea
land
Nor
way
Portu
gal
Sout
h K
orea
Spain
Swed
en
Switz
erlan
d
U.K
.
U.S
.
Large 4 3 2 Small
32
Figure 1B: Difference in return volatility between Earnings announcements and non-earnings announcement days: Emerging markets.
-0.61
-0.65
-0.76-0.54-0.94
-0.40
-0.30
-0.20
-0.10
0.00
0.10
0.20
0.30
0.40
0.50
0.60
0.70
0.80
0.90
1.00A
rgen
tina
Braz
il
Chile
Chin
a
Colu
mbi
a
Czec
h Re
publ
ic
Egy
pt
Hon
g K
ong
Hun
gary
Indi
a
Indo
nesia
Isra
el
Lith
uani
a
Mala
ysia
Mex
ico
Mor
occo
Paki
stan
Peru
Phili
ppin
es
Polan
d
Rom
ania
Sing
apor
e
Sout
h A
frica
Sri L
anka
Taiw
an
Thail
and
Turk
ey
Ven
ezue
la
Dev
el. A
vg.
Em
erg.
Avg
.
Large 4 3 2 Small
-1.32
1.41
33
Figure 2A: Developed market-model delay. Delay is calculated following Hou and Moskowitz (2005) for each size portfolio as follows: portfolio returns are regressed on market returns over the 12-year sample and four lags of the market to obtain an unrestricted R-square; then a second regression is run, restricting the coefficients on lagged returns to zero. The delay measure: Delay = R2unrestricted - R2restricted. Delay is de-biased using a bootstrap adjustment factor described in the text. Stripes indicate Delay is significant at the 5% level, using bootstrapped standard errors.
34
Figure 2B: Emerging market-model delay.
35
Figure 3A: Morck, Young, and Yu R2 in developed markets. Following Morck, et al (2000) firms are included if there are more than 15 weeks of biweekly returns. Biweekly returns are set to missing if the absolute value is greater than 25%. R2 is calculated for each firm each year from a market model that includes the local and US returns converted into local currency return. For each portfolio the SST weighted average R2 is calculated. The 12-year average of the SST weighted average R2s is reported below.
0.000
0.100
0.200
0.300
0.400
0.500
0.600A
ustra
lia
Aus
tria
Belg
ium
Cana
da
Den
mar
k
Finl
and
Fran
ce
Ger
man
y
Irel
and
Italy
Japa
n
Luxe
mbo
urg
Net
herla
nds
New
Zea
land
Nor
way
Portu
gal
Sout
h K
orea
Spain
Swed
en
Switz
erlan
d
U.K
.
U.S
.
Large 4 3 2 Small
36
Figure 3B: Morck, Young, and Yu R2 in emerging market.
0.000
0.100
0.200
0.300
0.400
0.500
0.600A
rgen
tina
Bang
lades
hBr
azil
Bulg
aria
Chile
Chin
aCo
lum
bia
Cypr
usCz
ech
Repu
blic
Egy
ptH
ong
Kon
gH
unga
ryIn
dia
Indo
nesia
Isra
elK
enya
Lith
uani
aM
alays
iaM
exico
Mor
occo
Paki
stan
Peru
Phili
ppin
esPo
land
Rom
ania
Sing
apor
eSo
uth
Afr
icaSr
i Lan
kaTa
iwan
Thail
and
Turk
eyV
enez
uela
Zim
babw
eD
evel.
Avg
.E
mer
g. A
vg.
Large 4 3 2 Small
37
Table I Summary Statistics
At the end of December each year from 1993 through 2004 all common ordinary shares available through Datastream and CRSP with at least 30% active trading days in the following 12 months, as proxied by non-zero changes in price, are sorted into 5 equally weighted NYSE-dollar-size-breakpoint portfolios. We use the last available security market value in December and the prevailing exchange rates on that date to convert market capitalizations to US dollars. Asset market capitalization is converted to US dollars using the prevailing exchange rate on that day. Counts and market capitalization are calculated in from December-end data. The average firm count and average market capitalization represent the average over all non-missing years.
Panel A: Developed Countries Average Firm Count
(per year) Year Count Average Market Capitalization
(US$)
Country Large 4 3 2 Small Large 4 3 2 Small Large 4 3 2 SmallAustralia 60 64 77 112 359 12 12 12 12 12 4726 443 138 46 9Austria 9 8 13 43 4 10 12 12 195 106 47 7Belgium 8 9 11 10 72 6 11 10 12 12 1867 355 107 48 5Canada 105 124 154 238 1410 12 12 12 12 12 4085 447 138 47 6Denmark 22 27 29 29 21 12 12 12 12 12 3317 442 133 50 14Finland 6 9 23 25 50 7 11 12 12 12 1780 322 137 48 9France 47 51 60 91 364 12 12 12 12 12 3060 477 137 46 7Germany 77 81 94 106 211 12 12 12 12 12 5532 453 138 48 9Ireland 13 10 8 7 7 12 12 12 9 8 4474 507 181 67 35Italy 10 12 15 8 261 5 5 5 7 12 2327 241 87 32 1Japan 603 639 661 609 375 12 12 12 12 12 5426 454 140 50 15Luxembourg 5 6 1 4 12 30 5Netherlands 28 31 31 30 38 12 12 12 12 12 7295 419 143 47 11New Zealand 7 13 16 18 15 5 12 12 12 12 2496 476 132 48 13Norway 17 33 33 27 23 12 12 12 12 12 3661 427 144 49 14Portugal 5 53 4 12 26 3South Korea 40 94 145 251 513 12 12 12 9 8 3816 440 134 46 11Spain 7 6 8 97 12 12 12 12 12 247 123 45 5Sweden 50 48 45 59 84 2 6 9 12 12 4715 451 138 47 10
Switzerland 56 59 46 30 18 12 12 12 12 12 11036 474 146 50 14United Kingdom 232 219 197 178 132 12 12 12 12 12 8363 453 142 49 14United States 1238 1237 1228 1229 1092 12 12 12 12 12 7832 459 141 49 13Average 145 139 144 140 238 9 10 10 10 11 4767 409 134 46 10 Continued
38
Table I – Continued
Panel B: Emerging Countries Average Firm Count
(per year) Year Count Average Market Capitalization
(US $) Country Large 4 3 2 Small Large 4 3 2 Small Large 4 3 2 SmallArgentina 11 10 8 9 15 12 12 12 12 10 3220 438 145 54 14Bangladesh 9 11 124 1 1 10 11 83 39 5Brazil 17 14 15 10 6 11 11 10 11 10 3847 494 182 65 14Bulgaria 11 5 7Chile 17 20 12 9 10 12 12 12 12 11 2174 454 149 54 19China 40 324 300 186 70 12 12 12 7 2 1902 397 155 66 49Colombia 6 6 6 5 6 5 12 11 5 5 1275 511 238 81 16Cyprus 9 11 14 13 2 5 9 11 405 137 51 15Czech Republic 5 7 7 6 1 8 6 7 241 86 35 17Egypt 9 10 16 29 8 9 9 9 452 167 55 11Hong Kong 47 66 98 128 125 12 12 12 12 11 7450 432 135 47 15Hungary 6 6 8 8 3 5 5 10 327 171 46 11India 35 68 110 171 375 12 12 12 12 12 2783 443 135 46 9Indonesia 14 18 21 33 59 11 12 12 12 12 2223 438 138 46 12Israel 10 21 31 60 131 12 12 12 12 12 2339 457 136 45 11Kenya 6 7 6 10 1 5 11 11 205 107 46 11Lithuania 6 8 12 1 7 7 146 78 14Malaysia 46 85 106 141 315 12 12 12 12 8 2613 436 135 49 15Mexico 19 14 10 7 6 12 12 12 12 10 2610 451 171 47 25Morocco 7 9 7 8 10 2 11 7 9 8 1166 529 222 42 19Pakistan 6 9 15 23 68 1 8 12 12 12 1297 437 136 45 9Peru 6 6 5 5 6 3 12 12 11 12 749 408 57 90 13Philippines 12 14 15 15 30 11 11 12 12 12 1739 353 144 50 9Poland 6 10 12 22 65 7 8 9 12 10 3111 611 153 49 9Romania 8 33 3 9 84 7Singapore 27 39 56 79 89 12 12 12 12 10 6346 452 137 48 16South Africa 45 49 49 49 62 12 12 12 12 12 2793 456 142 48 11Sri Lanka 8 11 65 6 12 12 80 42 7Taiwan 76 141 153 174 198 12 12 12 11 9 3116 436 140 52 17Thailand 23 37 52 70 98 12 12 12 12 12 2209 434 139 46 12Turkey 10 20 33 51 79 12 12 12 12 12 2062 436 136 48 12Venezuela 5 5 5 5 1 2 5 6 6 1042 324 246 31 Zimbabwe 6 12 11 21 2 7 11 11 418 110 39 10Emerging Average 22 37 38 42 67 9 9 9 10 9 2639 424 144 52 14Total Average 77 79 80 82 137 9 9 10 10 10 3597 418 140 50 12
39
Table II Correlations within and between
This table presents correlations among the efficiency measures. The upper panel presents the cross-country average of within country correlations across five size-sorted portfolios. The lower panel presents the cross-country correlation of the measures averaged across the five portfolios. At the end of June each year from 1994 through 2004 all common ordinary shares available through Datastream and CRSP with at least 30% active trading days in the following 12 months, as proxied by non-zero changes in price, are sorted into 5 equally weighted NYSE-size-breakpoint portfolios. Daily returns greater than 200% or which increase (decrease) by 100% (50%) and revert to a 2-day cumulative return of less (greater) than 50% (-20%) are assumed to be data errors and are set to missing. Weekly returns are calculated from daily returns for each stock. Delay is calculated following Hou and Moskowitz (2005) as follows: firm returns are regressed on market returns and four lags of the market to obtain an unrestricted R-square; then a second regression is estimated, restricting the coefficients on lagged returns to zero. Delay is calculated for each July to June fiscal year and averaged over the eleven year sample.
Delay Earnings Response R2
Hasb. Trading Cost
LOT Trading Cost
Delay 0.10 -0.63 0.62 0.65 Earnings Response 0.56 -0.12 0.15 0.10 R2 -0.61 -0.31 -0.86 -0.88 Hasb. Trading Cost -0.04 0.15 -0.14 0.91 LOT Trading Cost -0.06 -0.07 -0.20 0.67
40
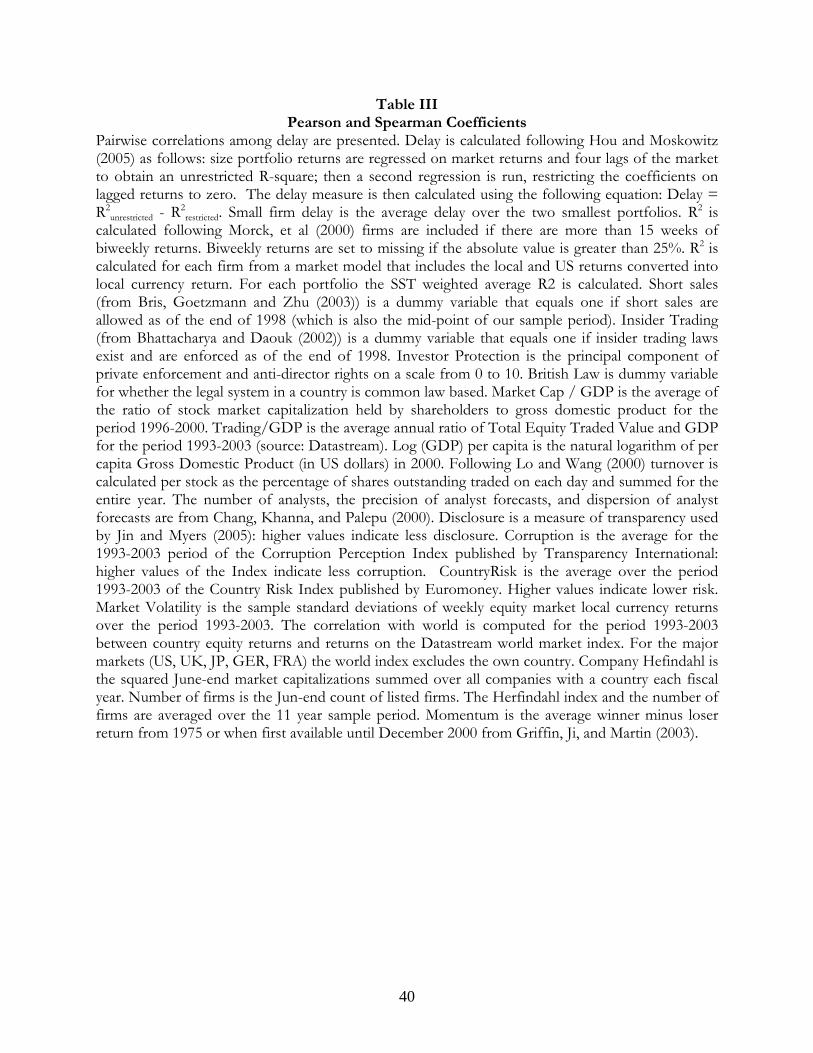
Table III Pearson and Spearman Coefficients
Pairwise correlations among delay are presented. Delay is calculated following Hou and Moskowitz (2005) as follows: size portfolio returns are regressed on market returns and four lags of the market to obtain an unrestricted R-square; then a second regression is run, restricting the coefficients on lagged returns to zero. The delay measure is then calculated using the following equation: Delay = R2
unrestricted - R2restricted. Small firm delay is the average delay over the two smallest portfolios. R2 is
calculated following Morck, et al (2000) firms are included if there are more than 15 weeks of biweekly returns. Biweekly returns are set to missing if the absolute value is greater than 25%. R2 is calculated for each firm from a market model that includes the local and US returns converted into local currency return. For each portfolio the SST weighted average R2 is calculated. Short sales (from Bris, Goetzmann and Zhu (2003)) is a dummy variable that equals one if short sales are allowed as of the end of 1998 (which is also the mid-point of our sample period). Insider Trading (from Bhattacharya and Daouk (2002)) is a dummy variable that equals one if insider trading laws exist and are enforced as of the end of 1998. Investor Protection is the principal component of private enforcement and anti-director rights on a scale from 0 to 10. British Law is dummy variable for whether the legal system in a country is common law based. Market Cap / GDP is the average of the ratio of stock market capitalization held by shareholders to gross domestic product for the period 1996-2000. Trading/GDP is the average annual ratio of Total Equity Traded Value and GDP for the period 1993-2003 (source: Datastream). Log (GDP) per capita is the natural logarithm of per capita Gross Domestic Product (in US dollars) in 2000. Following Lo and Wang (2000) turnover is calculated per stock as the percentage of shares outstanding traded on each day and summed for the entire year. The number of analysts, the precision of analyst forecasts, and dispersion of analyst forecasts are from Chang, Khanna, and Palepu (2000). Disclosure is a measure of transparency used by Jin and Myers (2005): higher values indicate less disclosure. Corruption is the average for the 1993-2003 period of the Corruption Perception Index published by Transparency International: higher values of the Index indicate less corruption. CountryRisk is the average over the period 1993-2003 of the Country Risk Index published by Euromoney. Higher values indicate lower risk. Market Volatility is the sample standard deviations of weekly equity market local currency returns over the period 1993-2003. The correlation with world is computed for the period 1993-2003 between country equity returns and returns on the Datastream world market index. For the major markets (US, UK, JP, GER, FRA) the world index excludes the own country. Company Hefindahl is the squared June-end market capitalizations summed over all companies with a country each fiscal year. Number of firms is the Jun-end count of listed firms. The Herfindahl index and the number of firms are averaged over the 11 year sample period. Momentum is the average winner minus loser return from 1975 or when first available until December 2000 from Griffin, Ji, and Martin (2003).
41
Table III – Continued Pearson Coefficients Spearman Coefficients Delay
All Small Firm Delay
Earn Diff
R2 Delay All
Small Firm Delay
Earn Diff
R2
Panel A: Regulatory Short Sales dummy 0.57 0.34 0.38 -0.40 0.60 0.36 0.37 -0.39 (n=55) (0.00) (0.01) (0.01) (0.00) (0.00) (0.01) (0.01) (0.00) Insider Trade. Dummy 0.34 0.25 0.23 -0.16 0.33 0.24 0.20 -0.12 (n=54) (0.01) (0.06) (0.11) (0.26) (0.02) (0.08) (0.17) (0.40) Investor Protection 0.32 0.06 0.53 -0.25 0.25 0.17 0.43 -0.23 (n=44) (0.04) (0.72) (0.00) (0.11) (0.11) (0.26) (0.00) (0.13) British Law 0.07 0.00 0.37 -0.08 0.00 0.05 0.29 -0.09 (n=44) (0.66) (0.99) (0.02) (0.63) (0.99) (0.73) (0.06) (0.55) Protestant Religion 0.27 0.36 0.38 -0.41 0.26 0.42 0.33 -0.41 (n=44) (0.08) (0.02) (0.01) (0.01) (0.10) (0.00) (0.03) (0.01)
Panel B: Econ. & Fin. Development Market Cap/GDP 0.33 0.17 0.37 -0.21 0.46 0.29 0.44 -0.26 (n=53) (0.02) (0.23) (0.01) (0.13) (0.00) (0.04) (0.00) (0.06) Trading/GDP 0.00 -0.10 0.06 0.14 0.16 0.08 0.24 -0.01 (n=53) (0.99) (0.47) (0.69) (0.30) (0.25) (0.59) (0.11) (0.95) Log GDP per capita 0.22 0.31 0.08 -0.23 0.29 0.36 0.08 -0.30 (n=54) (0.15) (0.03) (0.59) (0.12) (0.05) (0.01) (0.59) (0.04) EW Turnover 0.01 -0.08 0.07 0.22 0.18 0.07 0.29 0.08 (n=55) (0.95) (0.56) (0.65) (0.11) (0.20) (0.60) (0.05) (0.59) VW Turnover 0.01 -0.08 0.07 0.23 0.20 0.07 0.30 0.10 (n=55) (0.93) (0.55) (0.62) (0.09) (0.15) (0.60) (0.03) (0.49)
Panel C: Information Environment Num. Analysts 0.37 0.33 0.53 -0.31 0.36 0.29 0.55 -0.30 (n=43) (0.02) (0.03) (0.00) (0.04) (0.02) (0.06) (0.00) (0.05) Forecast Error -0.40 -0.29 -0.55 0.47 -0.42 -0.34 -0.49 0.47 (n=43) (0.01) (0.06) (0.00) (0.00) (0.01) (0.03) (0.00) (0.00) Forecast Dispersion -0.37 -0.19 -0.39 0.35 -0.42 -0.32 -0.40 0.40 (n=42) (0.02) (0.24) (0.01) (0.02) (0.01) (0.04) (0.01) (0.01) Disclosure 0.27 0.05 0.52 -0.16 0.20 0.16 0.46 -0.18 (n=44) (0.08) (0.75) (0.00) (0.30) (0.20) (0.30) (0.00) (0.24) Corruption 0.22 -0.02 0.16 -0.10 0.16 0.05 0.10 -0.11 (n=55) (0.12) (0.88) (0.28) (0.47) (0.25) (0.69) (0.50) (0.44)
Panel D: Economic Risk Country Risk 0.22 -0.02 0.13 -0.13 0.19 0.13 0.10 -0.16 (n=55) (0.11) (0.90) (0.39) (0.36) (0.17) (0.35) (0.48) (0.24)
Panel E: Properties of Market Returns Mkt. Volatility -0.44 -0.39 -0.24 0.56 -0.56 -0.50 -0.34 0.59 (n=55) (0.00) (0.00) (0.10) (0.00) (0.00) (0.00) (0.02) (0.00) Corr. w/ World Mkt. 0.49 0.34 0.52 -0.44 0.49 0.36 0.44 -0.38 (n=55) (0.00) (0.01) (0.00) (0.00) (0.00) (0.01) (0.00) (0.00) Company Herfindahl -0.21 -0.23 -0.18 0.21 -0.21 -0.17 -0.20 0.22 (n=55) (0.14) (0.09) (0.21) (0.12) (0.14) (0.20) (0.16) (0.11) Number of Firms 0.47 0.24 0.57 -0.42 0.35 0.26 0.36 -0.26 (n=55) (0.00) (0.07) (0.00) (0.00) (0.01) (0.05) (0.01) (0.05) Momentum 0.24 0.23 0.18 -0.51 0.17 0.30 0.11 -0.45 (n=37) (0.16) (0.16) (0.28) (0.00) (0.31) (0.07) (0.51) (0.01)
42
Table IV Abnormal Earnings Announcement Returns Regressed on Cross-Country Variables. Differences in return volatility between earnings announcements and non-earnings announcement days are regressed on regulatory, economic, financial, and information environment variables, as well as estimates of trading costs volatility, and company Herfindahl index. Return volatility difference is calculated as the differences between average absolute market-model abnormal returns during the announcement window (-1 to +2) and the average absolute non-event day return during the remainder of the testing window (-55 to -2 and +3 to +10) around the earnings announcement date. Earnings announcement dates are from Thomson’s I\B\E\S International database. The independent variables are calculated as described in Table III. Note all coefficients are all multiplied by 100. Specification 1 2 3 4 5 6 7 8 9 10 11 12
Panel: Regulatory 0.20 0.06 0.20 . . 0.15 . 0.10 . . . 0.15 Short Sales
Dummy (3.76) (0.99) (3.67) . . (2.73) . (1.69) . . . (2.70) 0.07 . . . . 0.07 . . . . . . Insider Trad.
Dummy (1.18) . . . . (1.08) . . . . . . 0.03 . . . . . 0.04 . . . 0.01 0.03 Investor
Protection (2.80) . . . . . (2.87) . . . (0.31) (2.67) British Law 0.09 . 0.09 . . . 0.01 . . . . .
(1.28) . (1.08) . . . (0.17) . . . . . Panel B: Econ. & Fin. Dev.
Market Cap/GDP . . . 0.16 0.05 . . . . . . . . . . (1.57) (0.53) . . . . . . . . 0.00 . . . . . -0.01 . . . . Log GDP Per
Capita . (-0.18) . . . . . (-1.12) . . . . EW Turnover . . . -0.02 0.01 . . . . . . . . . . (-0.23) (0.12) . . . . . . .
Panel C: Information Environment Num. Analysts . . . . . . . 0.01 . 0.02 . .
. . . . . . . (1.32) . (3.08) . . Forecast Error . . . . . . . . -0.60 . -0.88 -0.58
. . . . . . . . (-2.72) . (-3.76) (-2.73) Disclosure . . 0.40 . . . . 0.38 . . 0.22 .
. . (3.04) . . . . (2.98) . . (1.09) . Corruption . 0.01 0.00 . . . . . . . . .
. (0.66) (0.27) . . . . . . . . . Panel D: Trading Costs
. . . . . . . 12.75 . . . . Hasb. Trading Cost . . . . . . . (1.94) . . . .
. . . . . . . . -0.45 0.25 . . LOT Trading Cost . . . . . . . . (-0.34) (0.16) . .
Panel E: Properties of Market Ret. Mkt. Volatility . . . -4.13 -3.09 . . -7.07 -3.40 . . -2.95
. . . (-0.93) (-0.57) . . (-3.37) (-1.61) . . (-1.46)
. 0.67 . . 0.67 . . 0.27 0.67 . . . Corr. w/ World Mkt. . (2.16) . . (2.25) . . (0.80) (3.48) . . .
. . . -0.04 . -0.25 . . . . . . Company Herfindahl . . . (-0.10) . (-0.55) . . . . . .
Number of Obs. 42 46 42 48 48 49 42 39 43 43 39 39 Adjusted R2 0.458 0.171 0.413 0.107 0.222 0.118 0.246 0.542 0.376 0.249 0.394 0.492
Table V
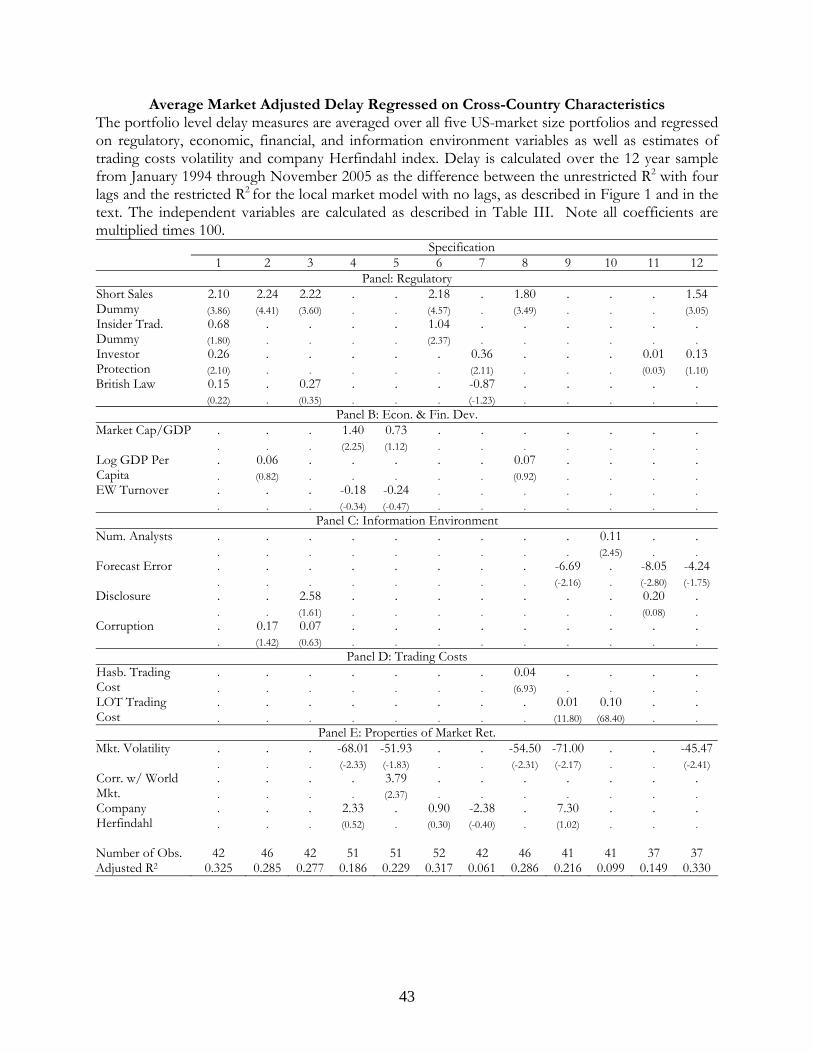
43
Average Market Adjusted Delay Regressed on Cross-Country Characteristics The portfolio level delay measures are averaged over all five US-market size portfolios and regressed on regulatory, economic, financial, and information environment variables as well as estimates of trading costs volatility and company Herfindahl index. Delay is calculated over the 12 year sample from January 1994 through November 2005 as the difference between the unrestricted R2 with four lags and the restricted R2 for the local market model with no lags, as described in Figure 1 and in the text. The independent variables are calculated as described in Table III. Note all coefficients are multiplied times 100. Specification 1 2 3 4 5 6 7 8 9 10 11 12
Panel: Regulatory 2.10 2.24 2.22 . . 2.18 . 1.80 . . . 1.54 Short Sales
Dummy (3.86) (4.41) (3.60) . . (4.57) . (3.49) . . . (3.05) 0.68 . . . . 1.04 . . . . . . Insider Trad.
Dummy (1.80) . . . . (2.37) . . . . . . 0.26 . . . . . 0.36 . . . 0.01 0.13 Investor
Protection (2.10) . . . . . (2.11) . . . (0.03) (1.10) British Law 0.15 . 0.27 . . . -0.87 . . . . .
(0.22) . (0.35) . . . (-1.23) . . . . . Panel B: Econ. & Fin. Dev.
Market Cap/GDP . . . 1.40 0.73 . . . . . . . . . . (2.25) (1.12) . . . . . . . . 0.06 . . . . . 0.07 . . . . Log GDP Per
Capita . (0.82) . . . . . (0.92) . . . . EW Turnover . . . -0.18 -0.24 . . . . . . . . . . (-0.34) (-0.47) . . . . . . .
Panel C: Information Environment Num. Analysts . . . . . . . . . 0.11 . .
. . . . . . . . . (2.45) . . Forecast Error . . . . . . . . -6.69 . -8.05 -4.24
. . . . . . . . (-2.16) . (-2.80) (-1.75) Disclosure . . 2.58 . . . . . . . 0.20 .
. . (1.61) . . . . . . . (0.08) . Corruption . 0.17 0.07 . . . . . . . . .
. (1.42) (0.63) . . . . . . . . . Panel D: Trading Costs
. . . . . . . 0.04 . . . . Hasb. Trading Cost . . . . . . . (6.93) . . . .
. . . . . . . . 0.01 0.10 . . LOT Trading Cost . . . . . . . . (11.80) (68.40) . .
Panel E: Properties of Market Ret. Mkt. Volatility . . . -68.01 -51.93 . . -54.50 -71.00 . . -45.47
. . . (-2.33) (-1.83) . . (-2.31) (-2.17) . . (-2.41)
. . . . 3.79 . . . . . . . Corr. w/ World Mkt. . . . . (2.37) . . . . . . .
. . . 2.33 . 0.90 -2.38 . 7.30 . . . Company Herfindahl . . . (0.52) . (0.30) (-0.40) . (1.02) . . .
Number of Obs. 42 46 42 51 51 52 42 46 41 41 37 37 Adjusted R2 0.325 0.285 0.277 0.186 0.229 0.317 0.061 0.286 0.216 0.099 0.149 0.330
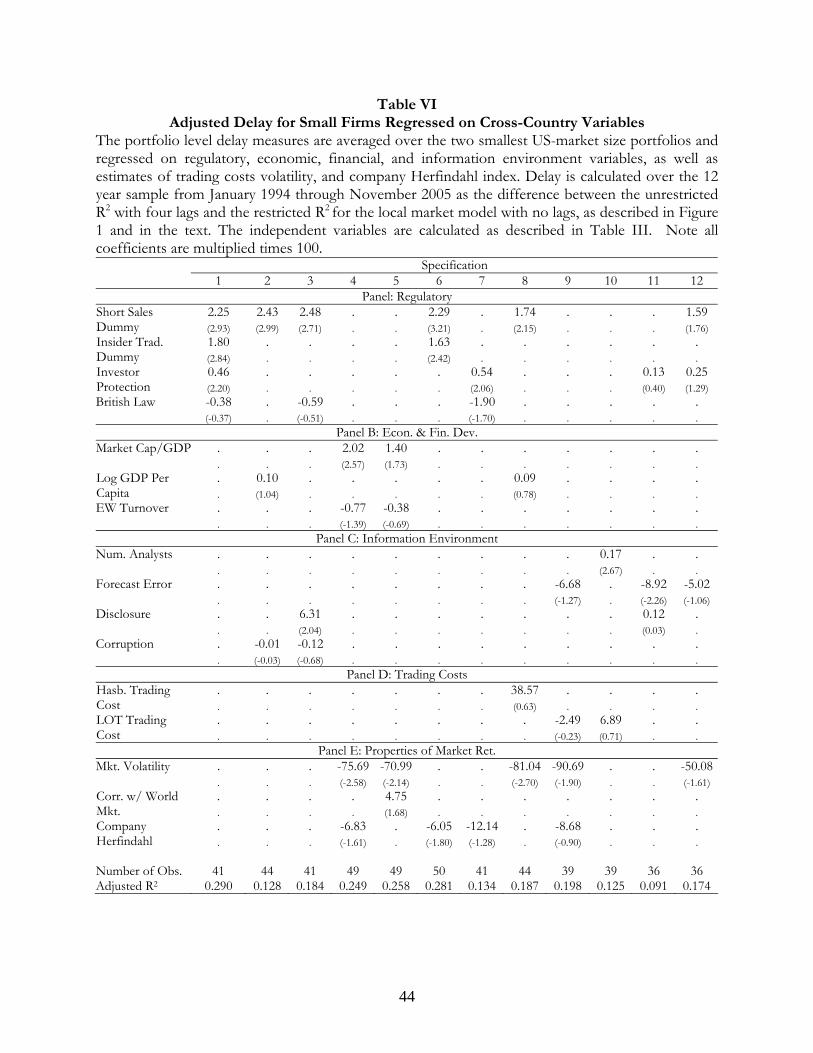
44
Table VI Adjusted Delay for Small Firms Regressed on Cross-Country Variables
The portfolio level delay measures are averaged over the two smallest US-market size portfolios and regressed on regulatory, economic, financial, and information environment variables, as well as estimates of trading costs volatility, and company Herfindahl index. Delay is calculated over the 12 year sample from January 1994 through November 2005 as the difference between the unrestricted R2 with four lags and the restricted R2 for the local market model with no lags, as described in Figure 1 and in the text. The independent variables are calculated as described in Table III. Note all coefficients are multiplied times 100. Specification 1 2 3 4 5 6 7 8 9 10 11 12
Panel: Regulatory 2.25 2.43 2.48 . . 2.29 . 1.74 . . . 1.59 Short Sales
Dummy (2.93) (2.99) (2.71) . . (3.21) . (2.15) . . . (1.76) 1.80 . . . . 1.63 . . . . . . Insider Trad.
Dummy (2.84) . . . . (2.42) . . . . . . 0.46 . . . . . 0.54 . . . 0.13 0.25 Investor
Protection (2.20) . . . . . (2.06) . . . (0.40) (1.29) British Law -0.38 . -0.59 . . . -1.90 . . . . .
(-0.37) . (-0.51) . . . (-1.70) . . . . . Panel B: Econ. & Fin. Dev.
Market Cap/GDP . . . 2.02 1.40 . . . . . . . . . . (2.57) (1.73) . . . . . . . . 0.10 . . . . . 0.09 . . . . Log GDP Per
Capita . (1.04) . . . . . (0.78) . . . . EW Turnover . . . -0.77 -0.38 . . . . . . . . . . (-1.39) (-0.69) . . . . . . .
Panel C: Information Environment Num. Analysts . . . . . . . . . 0.17 . .
. . . . . . . . . (2.67) . . Forecast Error . . . . . . . . -6.68 . -8.92 -5.02
. . . . . . . . (-1.27) . (-2.26) (-1.06) Disclosure . . 6.31 . . . . . . . 0.12 .
. . (2.04) . . . . . . . (0.03) . Corruption . -0.01 -0.12 . . . . . . . . .
. (-0.03) (-0.68) . . . . . . . . . Panel D: Trading Costs
. . . . . . . 38.57 . . . . Hasb. Trading Cost . . . . . . . (0.63) . . . .
. . . . . . . . -2.49 6.89 . . LOT Trading Cost . . . . . . . . (-0.23) (0.71) . .
Panel E: Properties of Market Ret. Mkt. Volatility . . . -75.69 -70.99 . . -81.04 -90.69 . . -50.08
. . . (-2.58) (-2.14) . . (-2.70) (-1.90) . . (-1.61)
. . . . 4.75 . . . . . . . Corr. w/ World Mkt. . . . . (1.68) . . . . . . .
. . . -6.83 . -6.05 -12.14 . -8.68 . . . Company Herfindahl . . . (-1.61) . (-1.80) (-1.28) . (-0.90) . . .
Number of Obs. 41 44 41 49 49 50 41 44 39 39 36 36 Adjusted R2 0.290 0.128 0.184 0.249 0.258 0.281 0.134 0.187 0.198 0.125 0.091 0.174
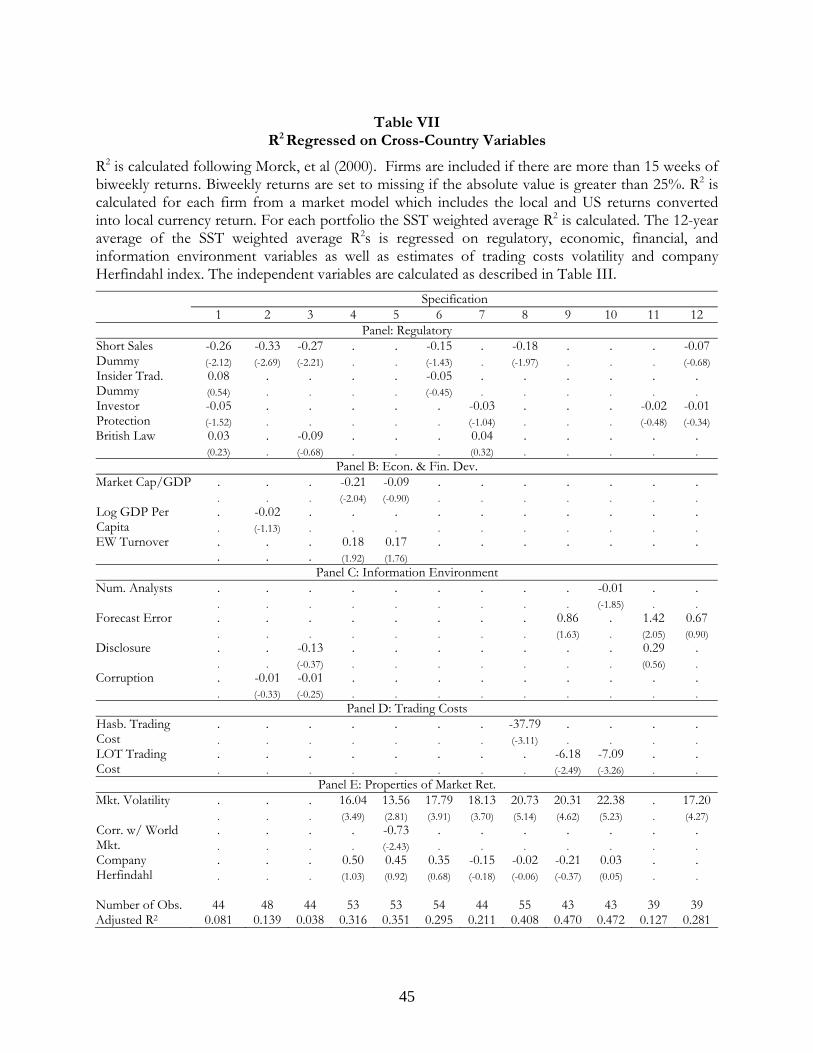
45
Table VII
R2 Regressed on Cross-Country Variables
R2 is calculated following Morck, et al (2000). Firms are included if there are more than 15 weeks of biweekly returns. Biweekly returns are set to missing if the absolute value is greater than 25%. R2 is calculated for each firm from a market model which includes the local and US returns converted into local currency return. For each portfolio the SST weighted average R2 is calculated. The 12-year average of the SST weighted average R2s is regressed on regulatory, economic, financial, and information environment variables as well as estimates of trading costs volatility and company Herfindahl index. The independent variables are calculated as described in Table III. Specification 1 2 3 4 5 6 7 8 9 10 11 12
Panel: Regulatory -0.26 -0.33 -0.27 . . -0.15 . -0.18 . . . -0.07Short Sales
Dummy (-2.12) (-2.69) (-2.21) . . (-1.43) . (-1.97) . . . (-0.68) 0.08 . . . . -0.05 . . . . . . Insider Trad.
Dummy (0.54) . . . . (-0.45) . . . . . . -0.05 . . . . . -0.03 . . . -0.02 -0.01Investor
Protection (-1.52) . . . . . (-1.04) . . . (-0.48) (-0.34) British Law 0.03 . -0.09 . . . 0.04 . . . . .
(0.23) . (-0.68) . . . (0.32) . . . . . Panel B: Econ. & Fin. Dev.
Market Cap/GDP . . . -0.21 -0.09 . . . . . . . . . . (-2.04) (-0.90) . . . . . . . . -0.02 . . . . . . . . . . Log GDP Per
Capita . (-1.13) . . . . . . . . . . EW Turnover . . . 0.18 0.17 . . . . . . . . . . (1.92) (1.76)
Panel C: Information Environment Num. Analysts . . . . . . . . . -0.01 . .
. . . . . . . . . (-1.85) . . Forecast Error . . . . . . . . 0.86 . 1.42 0.67
. . . . . . . . (1.63) . (2.05) (0.90) Disclosure . . -0.13 . . . . . . . 0.29 .
. . (-0.37) . . . . . . . (0.56) . Corruption . -0.01 -0.01 . . . . . . . . .
. (-0.33) (-0.25) . . . . . . . . . Panel D: Trading Costs
. . . . . . . -37.79 . . . . Hasb. Trading Cost . . . . . . . (-3.11) . . . .
. . . . . . . . -6.18 -7.09 . . LOT Trading Cost . . . . . . . . (-2.49) (-3.26) . .
Panel E: Properties of Market Ret. Mkt. Volatility . . . 16.04 13.56 17.79 18.13 20.73 20.31 22.38 . 17.20
. . . (3.49) (2.81) (3.91) (3.70) (5.14) (4.62) (5.23) . (4.27)
. . . . -0.73 . . . . . . . Corr. w/ World Mkt. . . . . (-2.43) . . . . . . .
. . . 0.50 0.45 0.35 -0.15 -0.02 -0.21 0.03 . . Company Herfindahl . . . (1.03) (0.92) (0.68) (-0.18) (-0.06) (-0.37) (0.05) . .
Number of Obs. 44 48 44 53 53 54 44 55 43 43 39 39 Adjusted R2 0.081 0.139 0.038 0.316 0.351 0.295 0.211 0.408 0.470 0.472 0.127 0.281

46
Appendix Table A Firm-Year Counts and Percent of Market
The left most panel presents firm-year counts for each USD-US Market break-point quintile portfolio. The break points are calculated each June by sorting all stocks listed on NSADAQ, AMEX and NYSE into quintiles. The dollar market cap breakpoints are converted to local currency using the prevailing exchange rate. The middle panel presents the count of the firm-years that remain after requiring stocks have non-zero price changes for at least 30% of all trading days. The last panel present the average over the 11 year sample of the June-end market capitalizations as a percent of total market cap.
Panel A: Developed Countries Firm-Year Count
(no screens) Firm-Year Count
(with trading screens) Percent of Market
(%) Country Large 4 3 2 Small Large 4 3 2 Small Large 4 3 2 SmallAustralia 646 707 927 1246 6177 621 658 816 1046 4150 82.2 8.5 3.3 1.4 1.0Austria 9 38 87 151 834 15 79 133 477 0.0 18.7 25.8 14.4 8.6Belgium 35 93 106 121 1226 23 66 85 107 803 69.4 34.6 14.5 6.8 7.0Canada 1172 1388 1865 2736 22670 1143 1336 1761 2521 15585 79.7 10.3 4.2 2.1 1.6Denmark 254 322 457 544 899 234 290 327 310 229 70.5 12.3 4.4 1.6 0.4Finland 45 92 257 308 850 11 81 248 272 585 55.2 14.5 14.2 5.5 2.3France 600 743 894 1185 6355 510 545 670 927 4148 67.5 11.2 4.2 2.1 1.5Germany 961 1171 1510 1736 4503 854 870 1087 1098 2427 70.9 6.0 2.3 0.8 0.4Ireland 15 23 12 9 18 137 111 59 30 11 83.0 8.5 1.8 0.6 0.2Italy 142 152 145 103 134 23 46 40 19 2865 76.7 7.5 3.5 0.6 47.2Japan 42 58 63 54 3147 6980 7091 7634 6109 3680 85.1 7.9 3.1 1.0 0.2Luxembourg 7094 7470 8461 7518 5006 11 46 0.0 0.0 0.0 12.7 4.8Netherlands 6 3 19 37 178 316 331 352 311 420 88.4 5.5 2.0 0.6 0.2New Zealand 334 359 371 342 626 32 128 151 206 183 74.7 24.7 9.2 4.7 1.1Norway 54 135 159 247 420 176 343 387 317 245 60.9 17.8 6.8 1.9 0.5Portugal 200 393 502 494 546 593 0.0 0.0 0.0 0.0 43.3South Korea 3 5 5 34 1098 416 988 1738 2753 5412 61.4 17.7 10.1 6.1 3.2Spain 422 1004 1772 2839 5803 26 25 78 1078 0.0 30.0 38.7 12.8 17.4Sweden 12 42 54 84 1182 552 494 509 699 963 79.2 7.8 2.4 1.2 0.4Switzerland 600 529 568 744 1248 622 649 516 290 172 88.9 4.2 1.1 0.2 0.0United Kingdom 667 738 643 514 532 2537 2328 2209 1816 1446 83.5 4.5 1.4 0.4 0.1United States 2640 2663 3223 3541 5906 13492 13473 13670 13517 12619 89.1 5.3 1.7 0.6 0.2
Continued

47
Appendix Table A – Continued
Panel B: Emerging Countries Firm-Year Count
(no screens) Firm-Year Count
(with trading screens) Percent of Market
(%) Country Large 4 3 2 Small Large 4 3 2 Small Large 4 3 2 SmallArgentina 128 119 143 157 293 108 86 106 51 71 79.3 11.2 4.1 1.1 1.4Bangladesh 1 9 20 95 1931 74 1411 0.0 0.0 0.0 22.8 36.4Brazil 245 302 432 369 849 167 148 105 55 60 40.1 7.1 2.1 0.7 0.1Bulgaria 2 3 2 3 118 36 0.0 0.0 0.0 0.0 15.1Chile 206 299 322 348 551 190 208 143 61 17 61.2 14.7 3.4 0.7 0.3China 513 3964 3358 817 20 513 3959 3338 801 20 28.3 46.9 21.5 5.0 0.2Colombia 35 93 117 105 288 22 40 22 5 6 66.4 28.7 19.6 4.5 1.2Cyprus 13 28 61 130 397 39 74 84 0.0 0.0 20.2 9.9 3.9Czech Republic 26 21 70 65 115 30 24 28 0.0 0.0 15.7 4.8 1.0Egypt 16 78 99 163 313 68 78 132 244 0.0 38.5 15.1 9.0 3.6Hong Kong 515 708 1183 1627 1881 507 683 1088 1362 1300 85.2 7.2 3.5 1.6 0.5Hungary 31 34 51 56 130 15 37 30 59 0.0 18.1 7.8 3.3 0.8India 389 685 1172 1860 5760 378 662 1137 1772 4481 61.4 17.4 9.8 5.5 2.8Indonesia 165 247 362 564 1301 146 200 237 348 581 60.0 15.8 7.0 4.1 2.1Israel 113 212 326 673 2745 112 212 315 593 1541 55.3 21.4 9.7 6.1 4.2Kenya 17 55 88 288 5 28 58 89 0.0 59.6 41.6 25.3 7.9Lithuania 1 8 24 40 195 5 18 80 0.0 0.0 55.4 16.7 8.5Malaysia 520 938 1300 1515 2554 517 927 1274 1439 2269 58.8 21.3 10.6 5.1 4.5Mexico 265 248 216 175 250 202 167 96 39 27 59.1 9.7 2.5 0.5 0.2Morocco 32 97 62 109 109 13 73 38 39 28 61.2 43.2 12.5 3.4 1.6Pakistan 25 67 204 293 1890 5 46 165 204 787 49.2 20.9 21.7 8.9 7.7Peru 42 72 79 104 274 12 29 12 11 25 48.2 15.8 4.8 3.5 0.5Philippines 126 163 266 334 1036 124 129 175 158 325 62.0 15.6 8.1 2.4 1.2Poland 44 74 111 171 664 31 72 100 165 627 62.3 25.2 9.2 6.3 4.1Romania 3 4 12 28 352 22 254 0.0 0.0 0.0 12.7 22.6Singapore 302 450 727 915 1070 289 422 672 835 764 79.9 8.6 4.5 2.3 0.8South Africa 572 698 754 728 1980 502 532 558 489 731 68.1 14.5 5.3 1.5 0.6Sri Lanka 4 45 138 1970 32 119 673 0.0 0.0 32.1 26.2 25.5Taiwan 864 1556 1845 1767 1409 859 1544 1822 1746 1345 70.3 18.3 7.5 2.9 0.9Thailand 267 436 669 935 1823 250 376 554 701 1123 54.8 19.6 11.1 5.1 2.4Turkey 127 246 434 627 1067 110 218 380 580 1016 50.5 21.3 11.1 6.2 2.8Venezuela 19 35 46 57 127 5 11 11 5 88.2 56.5 24.5 6.5 0.0Zimbabwe 3 19 69 106 334 53 78 251 0.0 0.0 31.6 16.2 15.7
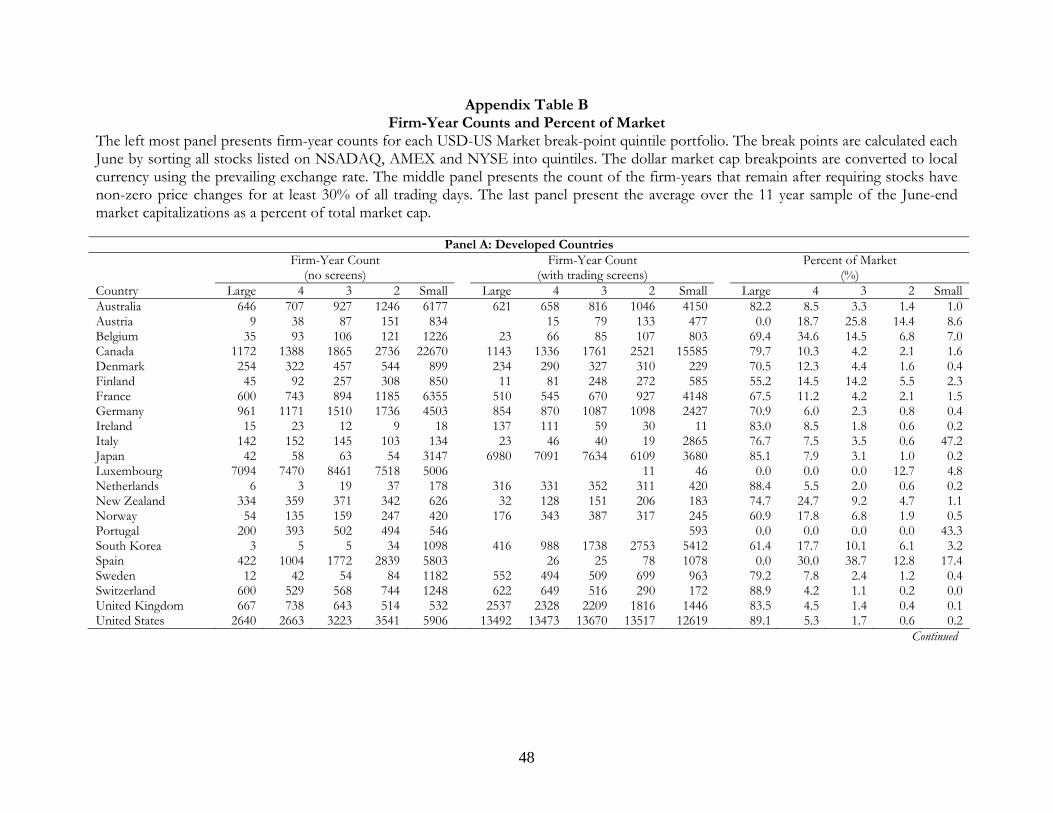
48
Appendix Table B Firm-Year Counts and Percent of Market
The left most panel presents firm-year counts for each USD-US Market break-point quintile portfolio. The break points are calculated each June by sorting all stocks listed on NSADAQ, AMEX and NYSE into quintiles. The dollar market cap breakpoints are converted to local currency using the prevailing exchange rate. The middle panel presents the count of the firm-years that remain after requiring stocks have non-zero price changes for at least 30% of all trading days. The last panel present the average over the 11 year sample of the June-end market capitalizations as a percent of total market cap.
Panel A: Developed Countries Firm-Year Count
(no screens) Firm-Year Count
(with trading screens) Percent of Market
(%) Country Large 4 3 2 Small Large 4 3 2 Small Large 4 3 2 SmallAustralia 646 707 927 1246 6177 621 658 816 1046 4150 82.2 8.5 3.3 1.4 1.0Austria 9 38 87 151 834 15 79 133 477 0.0 18.7 25.8 14.4 8.6Belgium 35 93 106 121 1226 23 66 85 107 803 69.4 34.6 14.5 6.8 7.0Canada 1172 1388 1865 2736 22670 1143 1336 1761 2521 15585 79.7 10.3 4.2 2.1 1.6Denmark 254 322 457 544 899 234 290 327 310 229 70.5 12.3 4.4 1.6 0.4Finland 45 92 257 308 850 11 81 248 272 585 55.2 14.5 14.2 5.5 2.3France 600 743 894 1185 6355 510 545 670 927 4148 67.5 11.2 4.2 2.1 1.5Germany 961 1171 1510 1736 4503 854 870 1087 1098 2427 70.9 6.0 2.3 0.8 0.4Ireland 15 23 12 9 18 137 111 59 30 11 83.0 8.5 1.8 0.6 0.2Italy 142 152 145 103 134 23 46 40 19 2865 76.7 7.5 3.5 0.6 47.2Japan 42 58 63 54 3147 6980 7091 7634 6109 3680 85.1 7.9 3.1 1.0 0.2Luxembourg 7094 7470 8461 7518 5006 11 46 0.0 0.0 0.0 12.7 4.8Netherlands 6 3 19 37 178 316 331 352 311 420 88.4 5.5 2.0 0.6 0.2New Zealand 334 359 371 342 626 32 128 151 206 183 74.7 24.7 9.2 4.7 1.1Norway 54 135 159 247 420 176 343 387 317 245 60.9 17.8 6.8 1.9 0.5Portugal 200 393 502 494 546 593 0.0 0.0 0.0 0.0 43.3South Korea 3 5 5 34 1098 416 988 1738 2753 5412 61.4 17.7 10.1 6.1 3.2Spain 422 1004 1772 2839 5803 26 25 78 1078 0.0 30.0 38.7 12.8 17.4Sweden 12 42 54 84 1182 552 494 509 699 963 79.2 7.8 2.4 1.2 0.4Switzerland 600 529 568 744 1248 622 649 516 290 172 88.9 4.2 1.1 0.2 0.0United Kingdom 667 738 643 514 532 2537 2328 2209 1816 1446 83.5 4.5 1.4 0.4 0.1United States 2640 2663 3223 3541 5906 13492 13473 13670 13517 12619 89.1 5.3 1.7 0.6 0.2
Continued
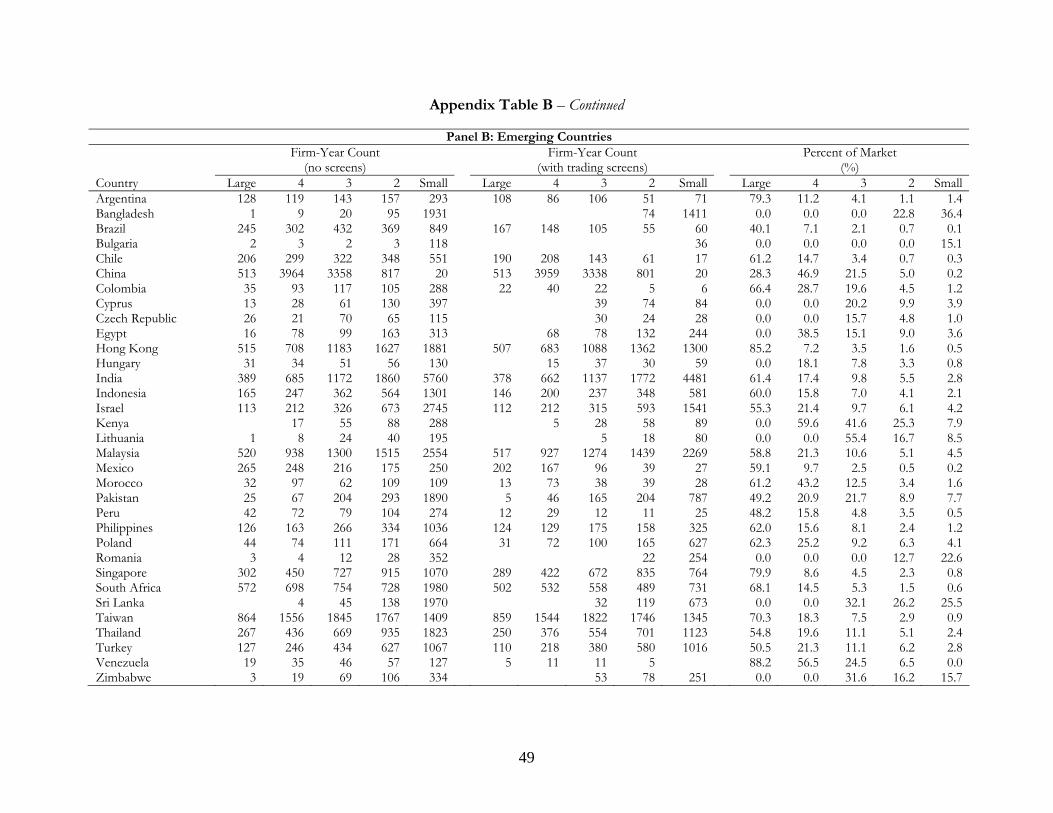
49
Appendix Table B – Continued
Panel B: Emerging Countries Firm-Year Count
(no screens) Firm-Year Count
(with trading screens) Percent of Market
(%) Country Large 4 3 2 Small Large 4 3 2 Small Large 4 3 2 SmallArgentina 128 119 143 157 293 108 86 106 51 71 79.3 11.2 4.1 1.1 1.4Bangladesh 1 9 20 95 1931 74 1411 0.0 0.0 0.0 22.8 36.4Brazil 245 302 432 369 849 167 148 105 55 60 40.1 7.1 2.1 0.7 0.1Bulgaria 2 3 2 3 118 36 0.0 0.0 0.0 0.0 15.1Chile 206 299 322 348 551 190 208 143 61 17 61.2 14.7 3.4 0.7 0.3China 513 3964 3358 817 20 513 3959 3338 801 20 28.3 46.9 21.5 5.0 0.2Colombia 35 93 117 105 288 22 40 22 5 6 66.4 28.7 19.6 4.5 1.2Cyprus 13 28 61 130 397 39 74 84 0.0 0.0 20.2 9.9 3.9Czech Republic 26 21 70 65 115 30 24 28 0.0 0.0 15.7 4.8 1.0Egypt 16 78 99 163 313 68 78 132 244 0.0 38.5 15.1 9.0 3.6Hong Kong 515 708 1183 1627 1881 507 683 1088 1362 1300 85.2 7.2 3.5 1.6 0.5Hungary 31 34 51 56 130 15 37 30 59 0.0 18.1 7.8 3.3 0.8India 389 685 1172 1860 5760 378 662 1137 1772 4481 61.4 17.4 9.8 5.5 2.8Indonesia 165 247 362 564 1301 146 200 237 348 581 60.0 15.8 7.0 4.1 2.1Israel 113 212 326 673 2745 112 212 315 593 1541 55.3 21.4 9.7 6.1 4.2Kenya 17 55 88 288 5 28 58 89 0.0 59.6 41.6 25.3 7.9Lithuania 1 8 24 40 195 5 18 80 0.0 0.0 55.4 16.7 8.5Malaysia 520 938 1300 1515 2554 517 927 1274 1439 2269 58.8 21.3 10.6 5.1 4.5Mexico 265 248 216 175 250 202 167 96 39 27 59.1 9.7 2.5 0.5 0.2Morocco 32 97 62 109 109 13 73 38 39 28 61.2 43.2 12.5 3.4 1.6Pakistan 25 67 204 293 1890 5 46 165 204 787 49.2 20.9 21.7 8.9 7.7Peru 42 72 79 104 274 12 29 12 11 25 48.2 15.8 4.8 3.5 0.5Philippines 126 163 266 334 1036 124 129 175 158 325 62.0 15.6 8.1 2.4 1.2Poland 44 74 111 171 664 31 72 100 165 627 62.3 25.2 9.2 6.3 4.1Romania 3 4 12 28 352 22 254 0.0 0.0 0.0 12.7 22.6Singapore 302 450 727 915 1070 289 422 672 835 764 79.9 8.6 4.5 2.3 0.8South Africa 572 698 754 728 1980 502 532 558 489 731 68.1 14.5 5.3 1.5 0.6Sri Lanka 4 45 138 1970 32 119 673 0.0 0.0 32.1 26.2 25.5Taiwan 864 1556 1845 1767 1409 859 1544 1822 1746 1345 70.3 18.3 7.5 2.9 0.9Thailand 267 436 669 935 1823 250 376 554 701 1123 54.8 19.6 11.1 5.1 2.4Turkey 127 246 434 627 1067 110 218 380 580 1016 50.5 21.3 11.1 6.2 2.8Venezuela 19 35 46 57 127 5 11 11 5 88.2 56.5 24.5 6.5 0.0Zimbabwe 3 19 69 106 334 53 78 251 0.0 0.0 31.6 16.2 15.7