mbl biology investigations - jbs science...
TRANSCRIPT

Teacher Edition
MBLBIOLOGY
INVESTIGATIONS
by
Bruce D. WestlingEdited by Biology Teachers of John Burroughs School
Margaret Bahe (Chair) Scott Deken, Deena Goran, Scott Heinzel, Hazel Jensen
JBS Teacher MBL Manual Page - 1 -

To the Teacher
This laboratory manual was written, based on the premise, that much of the study of biology should occur in the laboratory. Common sense, if not empirical evidence, tells a biology teacher that students become more interested and more knowledgeable of what science “is all about “ if they have the opportunity to work extensively in a laboratory setting.
The writing of the manual was also biased by the belief that biology, as much as possible, should be taught to the student and experienced by the student as a quantitative science. Biology as well as chemistry and physics should ask the students to use their mathematics training in practical ways. What better opportunity is there for data manipulation, graphing practice and inference development than in the biology laboratory?
I also believe that computers have functions in the school beyond word processing, book keeping, and information retrieval. CD ROMS and web sites are great but where did the information stored in them come from? How was the information on the computer screen acquired initially? How valid is the information? Using present knowledge is important but if we expect to have another generation of scientists they will need to be taught how to evaluate and generate new knowledge.
The laboratory investigations were also written with the intention of fostering the development of student team work. Skills associated with team work are critical in the modern work place as well as in the scientific laboratories of the country. Student teams need to be assigned initially by the teacher so that they include a leader as well as willing workers.
I have used most of the investigations included in this manual many times in my biology classes. Originally different measurement systems were used. With the advent of microcomputers and computer interfaces I modified these time tested laboratory studies for use on our computers at John Burroughs School. This manual is a fourth revision of the experiments adapting the procedures for use on the LabPro and Data Logger system developed by Vernier Software and Technology of Beaverton, Oregon.
The computer commands used in this manual are of a generic form applicable to both Macintosh and IBM systems. To understand the generic commands used, the teacher and student must be familiar with the Data Logger software. There is a learning curve to be expected.
It is the author’s sincere hope that you and your students will find Microcomputer Based Laboratory (MBL) work interesting, informative and challenging. I also invite you to share your criticism and suggestions for the improvement of these laboratory investigations with me.
Bruce D. WestlingSt. Louis, Missouri
JBS Teacher MBL Manual Page - 2 -

Contents
1. Hydrogen Ion Concentration, A Critical Life Condition - Students investigate the pH of some common biological and non biological substances. The wide pH variability of these substances is seen. Next they inquire into the effect of adding acids to liquids such as water and milk. Finally, the buffering action of antacids is observed and a strength comparison is made among them. PAGE 5
2. The Breakdown of Hydrogen Peroxide by Catalase - Students investigate the properties of the enzyme catalase as it breaks down hydrogen peroxide into water and oxygen. Evidence is collected showing the rate of the reaction is directly related to the enzyme concentration and pH of the reactants. PAGE 9
3. Diffusion Through a Dialysis Membrane - Students discover a relationship between temperature, concentration, and the rate of diffusion through a membrane. Using a conductivity probe and a sealed dialysis bag containing salt water, evidence is collected to show that temperature and the concentration of salt water in the bag increases the rate of diffusion of salt through the membrane of the bag. PAGE 19
4. Why Are Cells So Small? Students find the surface to volume ratio of several sizes of agar blocks. They then determine the rate of diffusion of salt from the different sized blocks. Evidence is collected to show that the rate of diffusion from the block increases as the surface area to volume ratio increases. PAGE 27
5. Light and Photosynthesis - Students measure the rate of carbon dioxide uptake by spinach leaves. When light is sufficient, carbon dioxide disappears from a sealed container surrounding the leaves. A carbon dioxide sensor is used to monitor the change in carbon dioxide concentration. Carbon dioxide concentration is found to vary with time and with light intensity. PAGE 32
6. A Study of Yeast Fermentation - Students measure the fermentation rate of yeast. Evidence is collected showing the rate of the reaction is related to the yeast concentration, ph and the type of sugar fermented. PAGE 40
7. Vertebrate Respiration - In this investigation students find the respiration rate of two vertebrate animals. Team data are pooled and average respiration rate values are calculated.
PAGE 48
8. Seed Respiration - Students measure and compare the oxygen consumption of dormant and germinating seeds. Results suggest that plant seeds not only use oxygen but that they increase their use of the substance during periods of rapid growth. PAGE 54
9. Plant Transpiration - Students use a humidity sensor to investigate the release of water vapor from the leaves of bean plants. The bean plants are housed within a sealed glass jar containing the sensor. A plot of humidity change with time is made. Knowing the slope of the humidity plot it is possible to estimate the plant’s transpiration rate. The rate is found to decrease as the stomata of the plant are sealed with petroleum jelly. PAGE 61
JBS Teacher MBL Manual Page - 3 -

10. Reaction Time - Students measure their reaction time using their dominant and non dominant hands. Comparisons of reaction time to light and sound are made. Sexual differences in reaction time are evaluated using statistical methods. PAGE 67
11. Exercise, Conditioning and Pulse Rate - Students measure their pulse rate before exercise and during their recovery from exercise. These values are used to predict individual physical fitness. PAGE 70
12. ECG - Students obtain a personal ECG. The wave form of the ECG is examined and the P, QRS. and T portions of the wave are identified and heart rate is calculated. PAGE 73
13. Human Breathing Rate- Students find their breathing rate at rest and after a period of exercise. Differences in both the rate and depth of breathing are found to be related to physical activity and to the sex of the individual. PAGE 77
14. The Digestion of Protein by Pepsin - Students study the action of the enzyme pepsin on a suspension of cooked egg white. Evidence for the occurrence of digestion is derived from the optical clearing of the solution and from the disappearance of the egg particles. The concentration of the enzyme is varied to show changes in the rate of digestion of the egg white.
PAGE 79
15. The Digestion of Starch by Amylase - Students measure the rate of the digestion of starch by fungal amylase. Evidence of the digestive process is shown by the clearing of the starch, amylase, iodine solution. The option of investigating the influence of temperature, pH and enzyme concentration on the rate of the reaction is also open to the student. PAGE 85
16. Large Calories, small calories and Food - Students measure the energy content of marshmallows and walnuts using a temperature sensor and simple calorimeter. Individual team measurements are compared with the class average and with published information. PAGE 89
17. The Growth of a Population of Yeast - Students measure the growth, under ideal conditions, of a population of yeast. Evidence is collected showing an exponential growth of the population.
PAGE 92
18. Biochemical Oxygen Demand - Students discover a relationship between decomposers (bacteria), organic matter, and the level of oxygen in aquatic environments. Using closed systems, evidence is gathered to show increasing amounts of organic matter correlates with decreasing levels of oxygen. A point is reached where the BOD exceeds the oxygen supply.
PAGE 99
19. pH An Environmental Limitig Factor - Students measure the pH of several components of the earth’s natural abiotic environment. These measurements lead to further optional inquires of acid rain and the chemical pollution of soil and water. PAGE 103
JBS Teacher MBL Manual Page - 4 -
LABORATORYINVESTIGATION
EXPLORING PH:Hydrogen Ion Concentration, A Critical Life Condition - Teacher Instructions
Students investigate the pH of some common biological and non biological substances. The wide pH variability of these substances is seen. Next they examine the effect of adding acids to liquids such as water and milk. Finally, the buffering action of antacids is observed and a strength comparison is made among them. Skills associated with graphing are developed through the construction of line and bar graphs.
Time Two laboratory periods, one class period - Two lab periods to run the experiment and to graph the data; one class period to compare data and to respond to questions rising from the observations made.
Vernier EquipmentpH sensor, LabPro interface
Materials (per team, 5 teams per class)Rinse bottle, goggles, lab aprons, graduated cylinders 20 ml. and 50 ml., beakers 50 ml., beakers 150 ml., dropping pipettes, buffer, pH 7, HCl 0.1 M, distilled water, vinegar, orange juice, 2% milk, cola, Tums suspension, Rolaids suspension, Gaviscon suspension, Biological and non biological samples from home
SafetySafety goggles must be worn and aprons are recommended to be worn. Hydrochloric acid 0.1 M has a pH of approximately 1. This is as strong or stronger than stomach acid. Students should be instructed to report spills and how to prevent spills. Beakers of 50 ml. size will tip if the probe is not hand held. Hazardous materials should not be brought from home for testing (ie. Drano etc.).
Preparations1. The pH probes should be tested for calibration before the laboratory. Probes out of adjustment, a
very infrequent occurrence, will need to be recalibrated following the procedure described in the Vernier pH sensor manual.
2. Buffer pH 7 is available as a dry powder from biological supply companies. The Chemenvelope brand comes packaged as 5 envelopes in a carton. Each envelope makes 500 ml. of buffer when mixed with distilled water.
3. Purchase the antacids at your local pharmacy. Mix 2.0 grams of powdered antacid with 150 ml. of distilled water. Crush the tablet into a powder before mixing it with water. Extensive mixing and blending is necessary to get some powder into solution. Mix the antacids a day ahead of time. Store the mixture in a closed bottle over the evening. Remove the suspension of buffer and water for student use. Buffer that does not dissolve should be left in the bottom of the storage bottle. The suspension will be saturated with the buffering chemicals.
JBS Teacher MBL Manual Page - 5 -

4. Each student of the team should bring something from home for testing. Food substances are obvious choices but encourage the students to be creative in their selections. Oils and fatty liquids are poor choices for testing as it is difficult to clean the sensor after it has been placed in liquids of this kind.
5. The pH probes are expensive, fragile and easily contaminated by oils etc. They also dry out if they are exposed to the air for long periods of time. Instruct the students on the loving care of these devices. Probes must always be rinsed in distilled water before they are moved from one test solution to another. Rinsing is most easily done using a rinse bottle and a beaker to catch the rinse water. Store the sensors for the short term in pH 7 buffer, for the long term return them to their permanent storage bottle. Never store the sensor in distilled water.
6. Students should not expect instantaneous readings from the pH probe. Instead, they should expect that some readings will drift over time. When is the reading stable? Usually it is stable whenever they say it is, but urge them to be consistent and to allow at least 30 seconds for stability to develop. Sample experimental results follow.
9.32.32.26.49
6.23.3
1.63.36.29
6.42.2
TABLE 1: BIOLOGICAL AND COMMON SUBSTANCE pH
OtherBleach
Diet CokeCola (Coke)
Distilled WaterTap Water
MilkOrange Juice
VinegarpH MeasuredpH PredictedBiological Substance
JBS Teacher MBL Manual Page - 6 -

Table 3 Change of pH with BuffersTable 2 Buffering Action by Antacids Table 2 Buffering Action by Antacids Table 2 Buffering Action by Antacids Table 2 Buffering Action by Antacids
pH After Adding Drops of Acid pH After Adding Drops of Acid pH After Adding Drops of Acid pH After Adding Drops of Acid Substance 0 Drops 5 Drops 10 Drops 15 Drops 20 Drops
Distilled Water 6.5 2.1 1.7 1.5 1.5Mi lk 6.8 6.1 5.9 5.7 5.6Gaviscon 8.3 7 6.3 5.9 5.5Tums 7.1 4.2 2.1 1.8 1.6Rolaids 8.8 2.9 2.1 1.8 1.6
9876543210
pH
Substances TestedVinegar Orange Juice Mi lk Tap Water Distilled Water Cola
pH of Selected Substances
pH Measured
7
6
5
4
3
2
1
pH
Number of Drops of 0.1 M HCl Added0 Drops 5 Drops 10 Drops 15 Drops 20 Drops
Buffering Capacity of Two Common Substances
Distilled Water
Mi lk
JBS Teacher MBL Manual Page - 7 -

987654321
pH
Drops of 0.1 M HCl Added0 Drops 5 Drops 10 Drops 15 Drops 20 Drops
Buffering Capacity of Three Antacids
Gaviscon
Tums
Rolaids
JBS Teacher MBL Manual Page - 8 -

LABORATORYINVESTIGATION
The Breakdown of Hydrogen Peroxide by CatalaseTeacher Instructions
In this investigation students study the chemical breakdown of hydrogen peroxide by the enzyme catalase and acquire practice using the methods of science. Both experiences are enriched by microcomputer based data collection. Teams of 3 students are preferable.
TimeOne double lab perioid to run the experiment and to print out the data for analysis outside of the laboratory.
Vernier EquipmentPressure Sensor and LabPro interface
Materials per Class safety goggles, 5 beakers (50 ml.), 1 liter of 1.5% hydrogen peroxide (ph 7), 1/4 lb. chopped liver, 1 apple sliced, 1/4 lb. ground hamburger, 1 pkg. of splints, 5 packages of safety matches, 5 16-mm. X 150-mm. test tubes, test tube brush (5), syringe 10 ml. (5) , 500 ml. of (400 unit / ml.) catalase solution, syringe 1 ml, (5), 125 ml Erlenmeyer flask (5), 1 liter of distilled water, 500 ml. of buffer pH 7.
SafetyIt is necessary for students to wear safety goggles always. The catalase - hydrogen peroxide reaction generates considerable pressure in the reaction vessel. This vessel should never be charged with more than the recommended volume of hydrogen peroxide. Also, do not use concentrations of hydrogen peroxide above 1.5 %. The usual precautions when using matches and splints should be followed.
Preparations1. Catalase can be purchased as a dessicated powder from biological supply companies (See
Appendix A). Store the substance, as received, in a freezer until used. The catalase enzyme stock solution is prepared on the day of the laboratory using the following general formula:
(concentration needed) X (volume needed) / ( # units / mg.) = X mg. catalase
(400 unit / ml. ) X ( 200 ml. ) / (from bottle label) = X mg. catalase
2. Dissolve the X mg. of catalase powder in 200 ml. of pH 7 buffer. This stock solution is the 100% enzyme concentration used in the investigation. Store the stock solution in a refrigerator when not being used. Distribute 50 ml. of stock solution to each team at the beginning of the laboratory period.
3. Fresh 1.5% hydrogen peroxide is needed for this investigation. Three percent concentrations of hydrogen peroxide can be purchased close to the time of use from any local pharmacy. Dilute
JBS Teacher MBL Manual Page - 9 -

500 ml. of 3% hydrogen peroxide with 500 ml. of buffer (pH 7) to make 1 liter of 1.5% solution.
4. A common source of error is incomplete mixing of the enzyme and the hydrogen peroxide solution. Remind the students to follow carefully the procedural steps as given in the laboratory. To ensure thorough mixing, the reaction chamber should be swirled slowly during the data recording period. The chamber should not be shaken as some solution could get into the rubber hose leading to the pressure sensor.
5. Another error is introduced if the temperature of the gas in the reaction chamber is increased or decreased. Tell the students to hold only the top of the flask when it is being swirled. They should not cover the flask with their hand when swirling it.
6. After the students have printed their graphs, it will be important to help them firm up in their minds the chain of events that are represented by the line on the graph. They will need to associate mentally the graph's line with the increasing pressure, and the increasing pressure with the release of oxygen from the hydrogen peroxide. In addition, the slope of the line must be seen to represent the rapidity (rate) of the enzyme's action on the hydrogen peroxide. They should observe that the rate is constant and the slope of the line linear, only during a short initial period. As time progresses, they should see that the line of the graph flattens out and that this shows the enzyme is working less efficiently. Student discussion of limiting factors and identification of the limiting factor in this chemical reaction should then be undertaken to complete the data analysis. In advanced classes, the teacher may want to help the students find the initial rate of the reaction by dividing the rise of the linear portion of the graph by its run. This rate value allows the student to make a quantitative comparison of the different experimental runs of the investigation.
7. It is recommended that each class also complete item 2 of the Going Further section of the investigation. This added investigation will show the importance of pH in enzymatic regulated reactions. To complete this part of the investigation prepare buffers of pH 3, 5, 7, 9 and 11. Use these buffers to dilute the 3% hydrogen peroxide to 1.5% solutions.
8. Working enzyme solutions of pH 3,5,7,9,and 11 are made from a 800 unit / ml. stock solution. Make the stock solution using distilled water. Working solutions of the enzyme are prepared by diluting the stock solution with equal volumes of a specific buffer.
9. The reaction chamber is made from a 125 ml. Erlenmeyer flask (See figure 1). The flask is fitted with a #5 two hole rubber stopper with two Luer-lock adaptors. A 2-way valve is connected to one of the adaptors. The second adaptor is jointed to a section of plastic tubing with two Luer-lock connectors One connector is joined to the rubber stopper and the other end is joined to the pressure sensor. A discarded plastic or metal culture tube cap serves as the enzyme vessel.
10. The program, Logger Pro, collects the data samples, stores them and plots them. For this experiment it will be necessary to change the graph X -Y scales. S tart by clicking on the Logger Pro icon to load the program. This brings up the chart and graph with default scaling. Set the scale of the Y axis by double clicking on one of the numbers alone the Y axis. This step opens the Y-axis option dialog box. Move the pointer to the autoscale button, click and drag to the manual choice, release. Two boxes appear containing default values for the Y-axis scale. Highlight the top value (100) and type in the new scale value (120). Move the pointer to the bottom box. Highlight the value and type in the new choice (100). Next, click OK to complete the Y-axis changes.
11. Set the scale of the X-axis (time). Double click on one of the numbers along the X-axis. The X-axis diolog box opens. Move the pointer to the autoscale button. Click and drag to the manual
JBS Teacher MBL Manual Page - 10 -

choice and release. Highlight the number in the right scale box. Type in the new value (200). Close the X-axis optiion box by clicking OK.
12. Make a test run of the investigation following preparation of the experiment’s reagent. Use 1 ml of enzyme and 10 ml. of 1.5% hydrogen peroxide for the test run. The pressure curve should rise rapidly and level off near the top of the computer graph.
13. If the curve is too steep or too flat change the range of the Y- axis. Compressing the range increases the slope of the graph. Increasing the range decreases the slope of the graph. The test run above (step 14) should produce the greatest rate of change (100% conc.). Collect data for the remaining tests using the new range. Readings for the remaining concentrations should all fall within the new Y axis range of values.
14. Quantifiying the rate of the reaction by finding the slope of the linear portion of each graph is a useful application of mathematics. Demonstrate the following steps to the class. First, construct a straight “best fit” line along the linear section of the graph (See figure 2 below). Next, select two points, one near each end of the linear section. Draw a line through the first point that is parallel to the X axis. Draw a line through the second point that is parallel to the Y axis. T hese lines should intersect at a right angle. Measure the distance from the second point to the point of intersection. Call this distance the rise. Measure the distance from the first point to the point of intersection. Call this distance the run. Find the slope of the linear section of the line by dividing the rise by the run. This slope value is an estimate of the true rate of the reaction when limiting factors are absent.
15. To save time and to provide a single focus for this laboratory you might want to complete step 16 of the procedure as either a demonstration or as a separate laboratory activity.
16. Sample test run data for enzyme concentrations of 100%, 75%, 50%, 25% and 0% follow. The reaction rates are calculted from the slope of the linear portion of each pressure graph.
JBS Teacher MBL Manual Page - 11 -

15.65.42.981.25
0
100755025
0
5432
1Reactiion Rate ( kPa/Min)Enzyme Conc.%Run
Table 1 Catalase Reaction Rate
JBS Teacher MBL Manual Page - 12 -

20
10
0
Rate kPa/min
Enzyme Conc. (0, 25, 50, 75, 100)%
Reaction Rate Change with Enzyme Concentration
Series 1
JBS Teacher MBL Manual Page - 13 -

JBS Teacher MBL Manual Page - 14 -

JBS Teacher MBL Manual Page - 15 -

JBS Teacher MBL Manual Page - 16 -

JBS Teacher MBL Manual Page - 17 -

JBS Teacher MBL Manual Page - 18 -

LABORATORYINVESTIGATION
Diffusion Through a Dialysis Membrane - Teacher Instructions
In this investigation students measure the rate of diffusion of sodium and chloride ions through a dialysis membrane. The rate of diffusion is seen to be changed by the concentration of the ions in the solution and by the temperature of the solutions. Time One double laboratory period to run the investigation and to complete the analysis and any necessary data exchange between teams.
Vernier EquipmentLabPro Interface, conductivity sensor
Materials (per team)safety goggles, laboratory aprons, beaker (400 ml.), beaker (50 ml.), graduated cylinder (100 ml.), alcohol thermometer, dialysis tubing (20 cm. long by 4 cm. flat width) 68-4224 Carolina, 0.5 M sodium chloride solution, distilled water
SafetyIt is necessary to wear safety goggles. Remind students to wipe up any spills.
JBS Teacher MBL Manual Page - 19 -
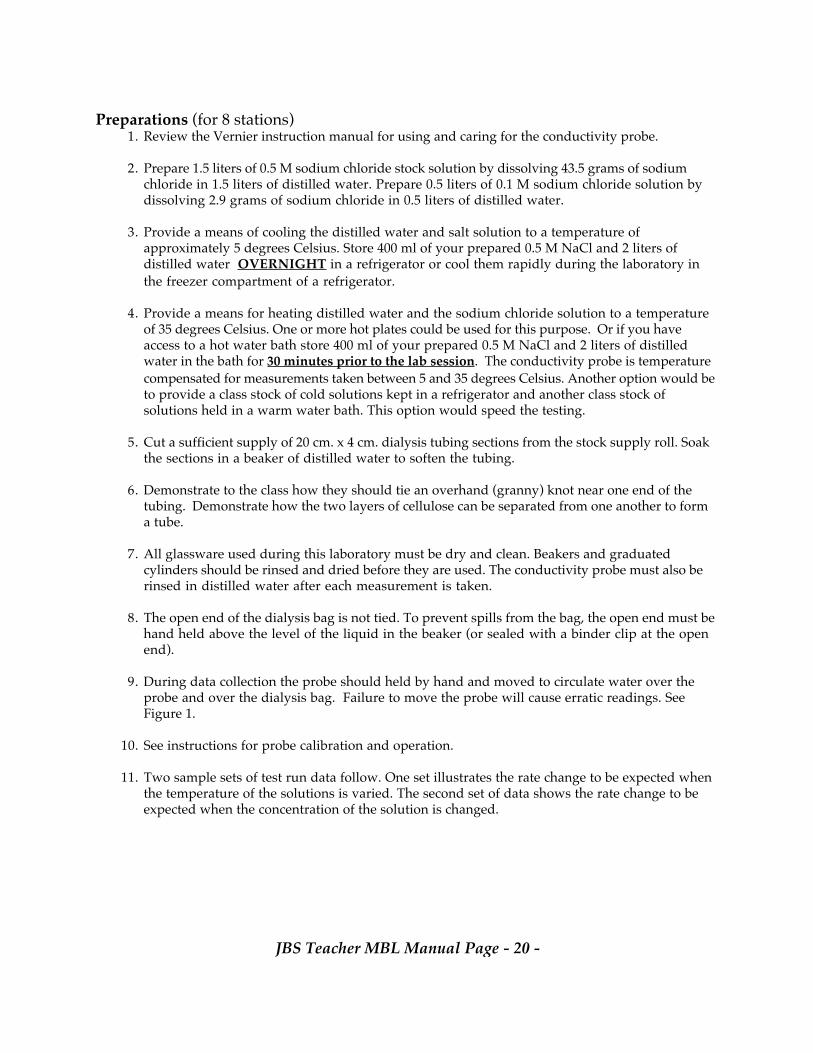
Preparations (for 8 stations)1. Review the Vernier instruction manual for using and caring for the conductivity probe.
2. Prepare 1.5 liters of 0.5 M sodium chloride stock solution by dissolving 43.5 grams of sodium chloride in 1.5 liters of distilled water. Prepare 0.5 liters of 0.1 M sodium chloride solution by dissolving 2.9 grams of sodium chloride in 0.5 liters of distilled water.
3. Provide a means of cooling the distilled water and salt solution to a temperature of approximately 5 degrees Celsius. Store 400 ml of your prepared 0.5 M NaCl and 2 liters of distilled water OVERNIGHT in a refrigerator or cool them rapidly during the laboratory in the freezer compartment of a refrigerator.
4. Provide a means for heating distilled water and the sodium chloride solution to a temperature of 35 degrees Celsius. One or more hot plates could be used for this purpose. Or if you have access to a hot water bath store 400 ml of your prepared 0.5 M NaCl and 2 liters of distilled water in the bath for 30 minutes prior to the lab session. The conductivity probe is temperature compensated for measurements taken between 5 and 35 degrees Celsius. Another option would be to provide a class stock of cold solutions kept in a refrigerator and another class stock of solutions held in a warm water bath. This option would speed the testing.
5. Cut a sufficient supply of 20 cm. x 4 cm. dialysis tubing sections from the stock supply roll. Soak the sections in a beaker of distilled water to soften the tubing.
6. Demonstrate to the class how they should tie an overhand (granny) knot near one end of the tubing. Demonstrate how the two layers of cellulose can be separated from one another to form a tube.
7. All glassware used during this laboratory must be dry and clean. Beakers and graduated cylinders should be rinsed and dried before they are used. The conductivity probe must also be rinsed in distilled water after each measurement is taken.
8. The open end of the dialysis bag is not tied. To prevent spills from the bag, the open end must be hand held above the level of the liquid in the beaker (or sealed with a binder clip at the open end).
9. During data collection the probe should held by hand and moved to circulate water over the probe and over the dialysis bag. Failure to move the probe will cause erratic readings. See Figure 1.
10. See instructions for probe calibration and operation.
11. Two sample sets of test run data follow. One set illustrates the rate change to be expected when the temperature of the solutions is varied. The second set of data shows the rate change to be expected when the concentration of the solution is changed.
JBS Teacher MBL Manual Page - 20 -

0.2545
0.10730.1964
35205
Rate of Diffusion of NaCl (microsiemens/cm/sec)
Temperature (Degrees C.)
Table 1. Change of the Rate of Diffusion with Temperature
0.035860.1964
o.1 Molar0.5 Molar
Rate of Diffusion of NaCl (microsiemens/cm/sec)
Concentration
Table 2. Change of Rate of Diffusion With Concentration
JBS Teacher MBL Manual Page - 21 -

0.2
0.1
0
microsiemens/cm/sec)
Solute Concentration (0.1M, 0.5M)
Graph 1. Rate of Diffusion
Series 1
JBS Teacher MBL Manual Page - 22 -
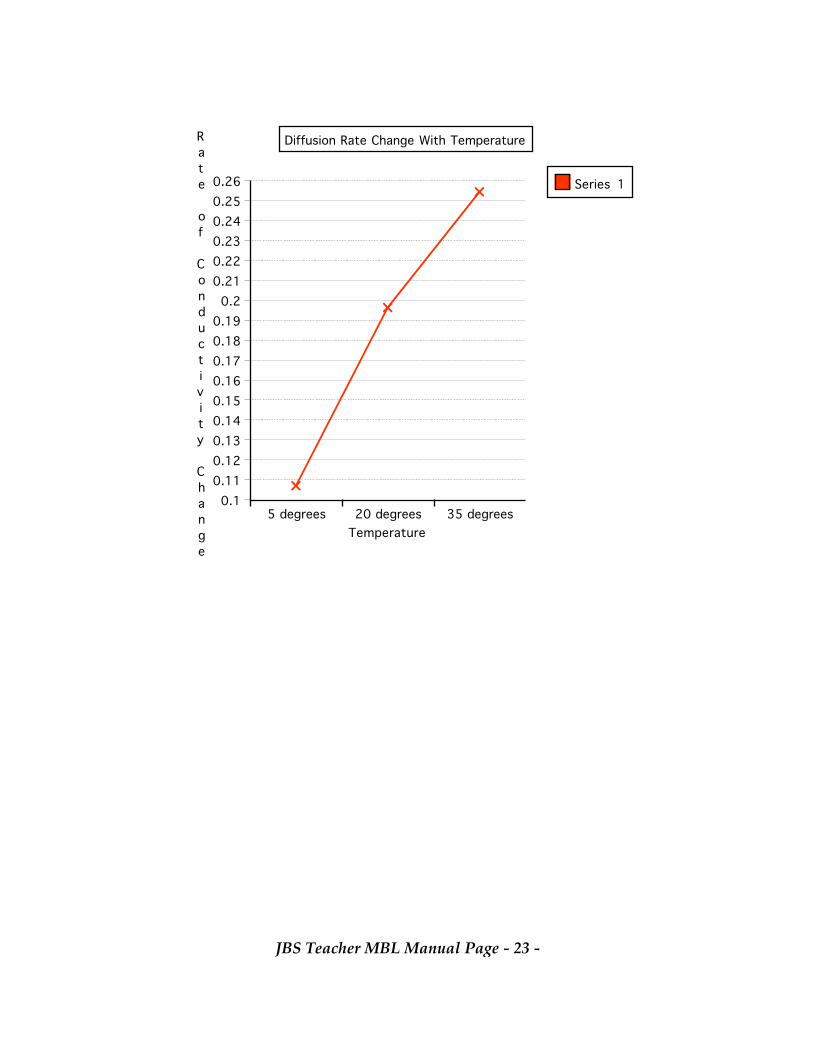
0.260.250.240.230.220.21
0.20.190.180.170.160.150.140.130.120.11
0.1
Rate of Conductivity Change
Temperature5 degrees 20 degrees 35 degrees
Diffusion Rate Change With Temperature
Series 1
JBS Teacher MBL Manual Page - 23 -

JBS Teacher MBL Manual Page - 24 -

JBS Teacher MBL Manual Page - 25 -

JBS Teacher MBL Manual Page - 26 -

LABORATORYINVESTIGATION
Why Are Cells So Small? - Teacher InstructionsIn this investigation students measure the rate of diffusion of salt from a series of agar cubes of
different sizes. The agar cubes model the transport of cellular substances into and out of the cell across a boundary membrane. Conductivity measurements show that the agar blocks with the largest surface area to volume ratio have the highest diffusion rates.
Time One double laboratory period to run the investigation and to complete the analysis and any necessary data exchange between teams.
Vernier EquipmentConductivity sensor, LabPro interface
MaterialsPer laboratory Team, safety goggles, laboratory apron, 500 ml. beaker, distilled water,scalpel, 5 agar cubes, calculator, metric ruler, rinse bottle.
JBS Teacher MBL Manual Page - 27 -

SafetyWear safety goggles at all times during the investigation. Wipe up any spills of materials.
Preparations
1. Review the Vernier instruction manual for using and caring for the conductivity probe.
2. Make sure the selector switch is set to the 0 - 200 range.
3. Prepare the agar agar cubes by dissolving 15 grams of agar and 1 gram of salt in 1 liter of distilled water. Bring the mixture to a boil and then pour into a dish to a depth of 2.5centimeters. When the agar has cooled and jelled cut the agar into 2.5 cm cubes. Each team will need 5 agar cubes.
4. All glassware used during this laboratory must be dry and clean. Beakers and graduated cylinders should be rinsed and dried before they are used. The conductivity probe must also be rinsed in distilled water after each measurement is taken.
5. During data collection the probe should held by hand and moved to circulate water over the probe and over the agar cubes. Failure to move the probe will cause erratic readings. See figure 1.
6. Students may not always make the connection between a real cell and the agar block simulation. Help them associate the surface area of the cube with the cell membrane surface area and the volume of the contents of the cube with the cytoplasmic contents of a cell. Help them see that the contents of the cell place a demand on the surface membrane for transport. Relate how demand may grow faster than supply as cell size increases.
7. Sample sets of test run data follow.
0.31030.2265
0.31230.4251
0.55269.3 to 1.00.262.420.635
6.4 to 1.00.99 6.311.25 and 0.6354.8 to 1.01.959.41.253.2 to 1.07.8252.5 and 1.252.4 to 1.015.637.52.5
Rate of Diffusionmicrosiemens per centimeter/sec
Ratio surface/volume
Volume cm3
Surface Area cm2
Agar Dimension cm
Table 1. Cell Surface to Volume Relationships
JBS Teacher MBL Manual Page - 28 -

JBS Teacher MBL Manual Page - 29 -

JBS Teacher MBL Manual Page - 30 -

JBS Teacher MBL Manual Page - 31 -

LABORATORYINVESTIGATION
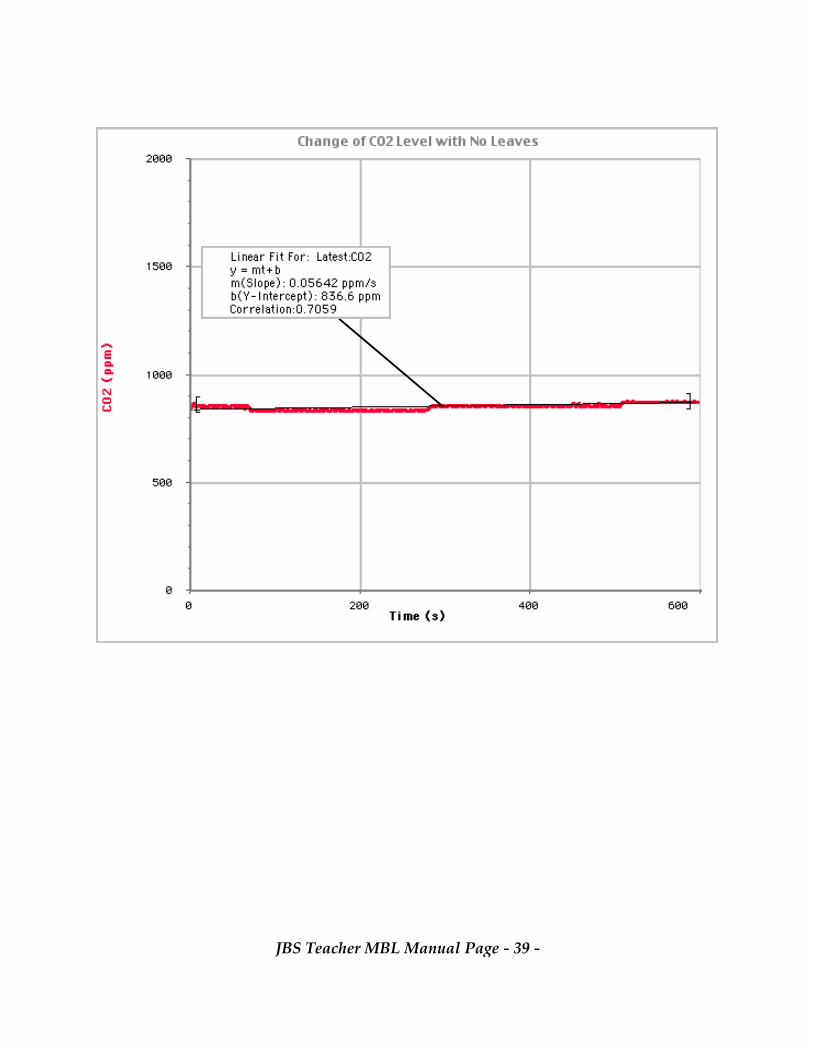
Light and Photosynthesis - Teacher InstructionsThe Light and Photosynthesis experiment demonstrates how light intensity alters the rate of photosynthesis in spinach leaves. Spinach leaves exposed to light remove carbon dioxide from the air in a closed container. During each test run a carbon dioxide sensor measures the level of carbon dioxide in the container’s air once every two seconds for ten minutes. Results show that the carbon dioxide level of the chamber’s air decreased more rapidly when the light intensity is high. The carbon dioxide content of the air does not change when there is no plant in the chamber (control run).
Time One double lab period - includes pre-lab activities, setup of the experiment, data collection, and post lab activities.
Vernier EquipmentCO2 sensor, LabPro interface
MaterialsSpinach leaves, plastic screens, aluminum foil, 100 watt soft white flood lamp, photosynthesis chamber, 500 ml beaker, Ziploc 1 pint freezer bag, paper towels.
SafetyIt is necessary for students to wear safety goggles and the wearing of aprons is recommended. The lamp gets hot and students should be told to avoid burns from it. Teacher Instructions
1. A supply of vigorous, healthy and dark green spinach is one key to the success of this laboratory investigation.
2. Spinach should be obtained from a market or grocery where the product is kept chilled and not allowed to age before sold. Store the leaves in a refrigerator when not being used in the laboratory. Keep the leaves moist but not submerged in water. Exposing the leaves to a cool (fluorescent) bright light for a few minutes before the laboratory also helps condition the leaves.
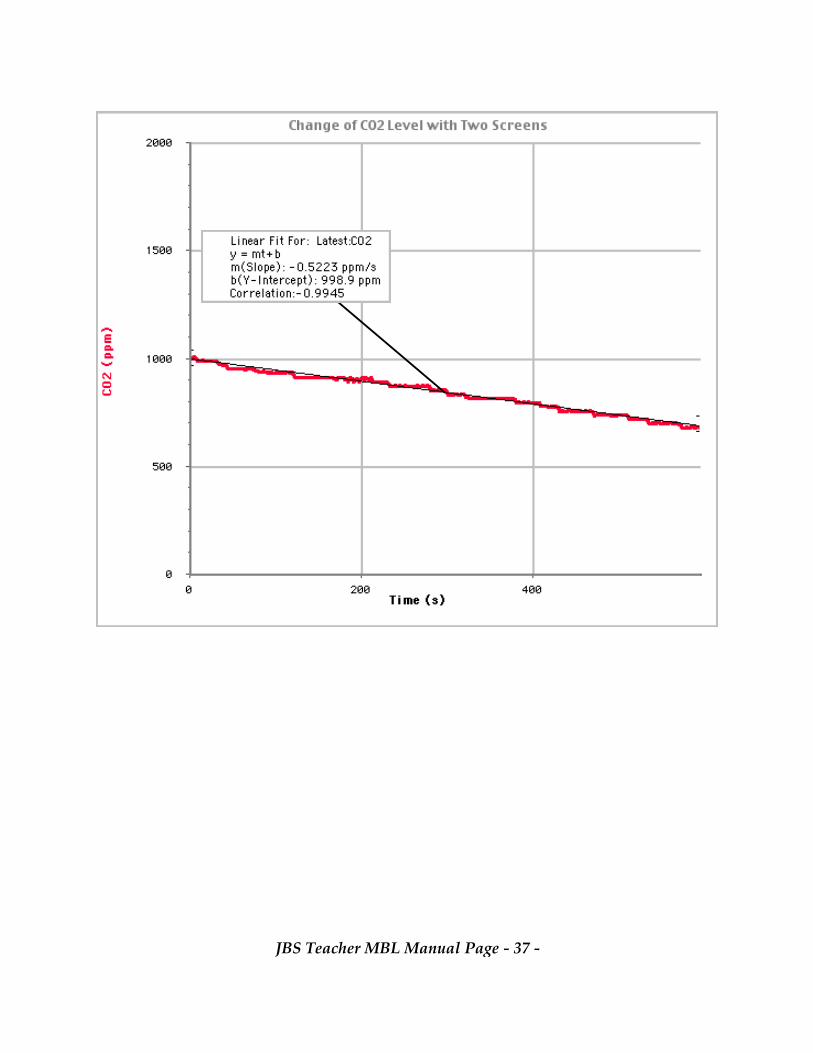
3. Plastic window screening works well as a light filter. One screen results in a light intensity of approximately 65%. Two screens approximately 40%, three screens approximately 25%, and four screens approximately 15%. Two layers will reduce the carbon dioxide rate of change by nearly 50%.
4. One pint plastic freezer bags when filled with 400 ml of tap water will filter out most of the heat produced by the lamp during each test run. The water should be changed for each new run.
5. The photosynthesis chamber is made from a Rubbermaid food storage box. See Figure 1. A one inch hole is drilled into the side of the box to receive the sensor probe and rubber stopper. The
JBS Teacher MBL Manual Page - 32 -

hole might need some enlargement to fit the stopper. An oval file works well when enlarging the opening.
6. The carbon dioxide probe needs a “warm-up” interval before the readings are stable. Three minutes of warm-up is just sufficient. If the Logger Pro program is interrupted a new warm-up period is needed.
7. It is necessary to fan fresh air into the chamber and sensor probe between tests. This can be done using the chamber cover as the fan. Failure to clear the chamber and probe of stale air will result in readings that start at different levels. Two to three minutes of fanning is sufficient.
8. Some confusion and misunderstandings could result from data that shows the plant leaves producing carbon dioxide when there is no light present. Many students will need help understanding the interplay between photosynthesis in the light and respiration in both the light and dark.
9. Encourage the students to learn and demonstrate to them some of the Logger Pro software commands that are used regularly. Some of these commands include: changing the sample rate. changing the scale of the X and Y axes, and adding text to the graph.
10. The equipment should be set up and tested prior to the laboratory. Students will have difficulty making the connections without a lot of help. It is probably a good idea to also leave the equipment assembled after use. However, students should be required to leave their workspace in good condition.
11. Remind the students to convert their data from ppm/sec to ppm/min. before they construct their bar graphs.
12. Warn the students not to twist the head of the carbon dioxide sensor as it could be damaged. Use the rubber stopper as the handle when inserting the probe into the chamber opening.
13. Remind the students of the importance of keeping the geometry of the lamp and photosynthesis chamber constant. The distance between the two objects is especially critical.
14. Sample results follow.
JBS Teacher MBL Manual Page - 33 -

JBS Teacher MBL Manual Page - 34 -

3.3852
59.388-31.338-59.646
0.05642
0.9898-0.5223-0.9941
Leaves Removed(100 watts)
Aluminum Foil Filter (no light)
2 Screen Filter (100 watts)Full Illumination (100 watts)
CO2 Change (ppm/min.)CO2 Change (ppm/sec)Light Conditions
Table 1.
605040302010
0-10-20-30-40-50-60
CO2 Rate of Change
Full , 2 Filters,No light, No Leaves
CO2 Change with Light Intensity
Series 1
JBS Teacher MBL Manual Page - 35 -

JBS Teacher MBL Manual Page - 36 -
JBS Teacher MBL Manual Page - 37 -

JBS Teacher MBL Manual Page - 38 -
JBS Teacher MBL Manual Page - 39 -

LABORATORYINVESTIGATION
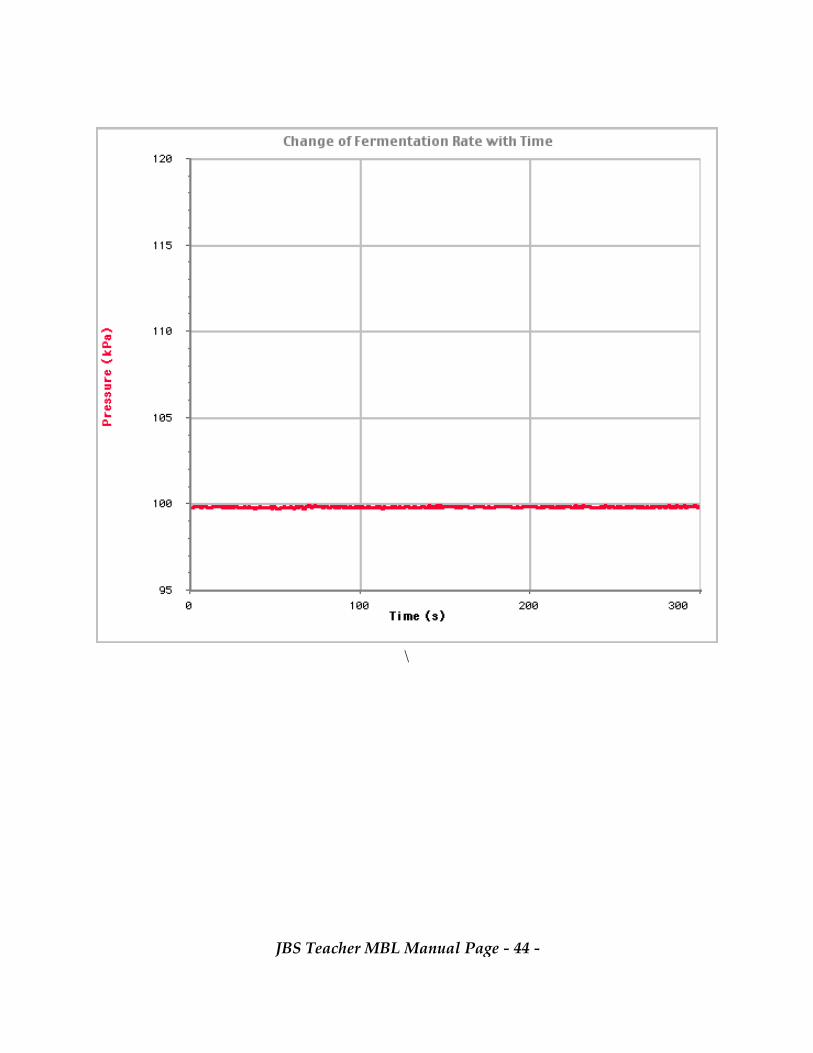
A Study of Yeast Fermentation - Teacher InstructionsIn this laboratory investigation, students measure the rate of fermentation in yeast cells. Data
are collected showing that the rate is altered by:1. The pH of the reaction mixture.2. The amount of yeast added to the reaction mixture.3. The type of sugar added to the reaction mixture.
As part of the laboratory, students are forced to think about the design and execution of an experiment. They experience the need to control all conditions but the experimental variable. They practice using new terminology, (independent and dependent variables), and they gain in their ability to work cooperatively with others on a group task. The final oral report provides another opportunity to develop "higher order" thinking and presentation skills.
One way to approach this laboratory is to inform the class that they are part of a large research group. The task of the group is to determine the optimal conditions for a new fermentation process to be used at the local brewery or bakery. The only given is the process must be run at 25 degrees Celsius. They, as members of small teams, must find the optimum yeast concentration, pH and type of sugar to use with the new process. The team oral reports become the avenue for sharing their newly discovered information with the entire research group.
Time Three classes - two periods to run the experiment and to complete the data analysis, one period to present team reports.
Vernier EquipmentPressure sensor, LabPro interface, gas pressure accessories kit
Materials(All Teams) Clock with second hand, water bath, reaction flask with valve and tubing, turkey baster, thermometer, source of hot and cold water, balance (decigram), 25 mL graduated cylinder, buffer pH 7, yeast, and sucrose.
(Research Groups): yeast as needed; buffer ph 3, 5, 7, 9 11; various monosaccharides (glucose, galactose, fructose); and various disaccharides (sucrose, maltose, lactose)
SafetyIt is necessary for students to wear safety glasses as the reaction in the vessel will generate pressure. It is generally advisable to open the pressure valve if the reading reaches 120 kPa. If the pinch clamp is not removed promptly after each run, the carbon dioxide could cause the rubber stopper and hose to be ejected from the flask.
Preparations: 1. Rapid rising yeast, when used with this experiment, gives the most consistent results. It can be
purchased as needed from local supermarkets. Sucrose is also less expensive when purchased
JBS Teacher MBL Manual Page - 40 -

locally. The other sugars are all listed and sold by many scientific supply companies.
2. It is important to wait exactly 10 minutes for the yeast, buffer, and sugar mixture to become active before starting data recording. Control this time interval for all experimental runs as the fermentation rate will be related to the incubation time as well as to other variables. The yeast mixture and flask should be incubated in the water bath at 25 degrees C.
3. The Vernier accessories kit contains all of the connectors needed to join the reaction vessel to the pressure sensor. The reaction chamber is made from a 125 ml. Erlenmeyer flask (See figure 1). The flask is fitted with a #5 two hole rubber stopper with two Luer-lock adaptors. A 2-way valve is connected to one of the adaptors. The second adaptor is jointed to a section of plastic tubing with two Luer-lock connectors. One connector is joined to the rubber stopper and the other end is joined to the pressure sensor. A large 2 liter beaker works well as a constant temperature water bath container.
4. Buffers are available from scientific suppliers and come packaged in envelopes as dry powders. The Chemenvelope brand is convenient to mix and produces a clear solution. This brand is packaged as 5 envelopes in a carton. Each envelope makes 500 ml. of buffer when mixed with distilled water. Recipes are available for mixing your own buffers but the cost of the chemicals plus the preparation time exceeds the price of the pre-packaged buffer.
5. To get consistency between the different experimental runs it is necessary to hold the temperature of the water bath to 25 degrees Celsius +/- 2 degrees. The team member responsible for the water bath should always bring the temperature up to the desired level before the start of each run. It should not be necessary to adjust the temperature during the run. For consistant results it also important for the students to constantly swirl the reaction flask.
6. The program, Logger Pro, collects the data samples, stores them and plots them. For this experiment it will be necessary to change the graph X -Y scales and it might be necessary to help one or more of the student groups with this task. To begin, ask the team to start by clicking on the Logger Pro icon to load the program. This brings up the table and graph with default scaling. Clicking on collect will start a plot of the rooms air pressure and new readings will appear in the table every second. Demonstrate how to move the plot line to the bottom of the graph by changing the scale of the Y axis. This is accomplish ed by moving the pointer over the number zero at the bottom of the Y axis. This causes the outline of a box to appear. Clicking in the box. causes it to be highlighted. Type in the new starting value of the axis, in this case 95. Click somewhere in the graph to shift the axis downward. Change the upper most value of the Y axis by moving the pointer over the top number of the Y axis. A new box appears. Click in the box in highlight it. Type in the new value 120. Click somewhere in the graph to change the upper scale value. Change the data collection time by moving the pointer over the last number of the X axis. A box appears. Click in the box to highlight it. Type in the new collection time (300). Click somewhere in the graph to change the X axis scale. At this point the pressure sensor is in proper adjustment and should not be changed during the experiment.
7. It will be necessary to review the procedure for determining the slopes of the graphs produced. You may wish to refer the students to the procedure used in Seed Respiration Experiment or just go over the entire process again. Making of a graph from a series of other graphs is always a conceptual leap and may need further explanation and discussion. Slope values should be converted from kPa/sec to kPa/min before they are recorded in the data table.
8. It is assumed that each class will be broken into five teams. With five teams one variable will
JBS Teacher MBL Manual Page - 41 -

be replicated twice. For reporting purposes, consideration could be given to either; (1) asking each to team report their findings or (2) combining the findings of the two teams into one report.
9. It is possible to scale down the quantity of reagents used in this experiment in order to cut costs. If the teacher decides to scale down everything down by 50% expect the reactions to run slower and for the laboratory investigation to take a longer period of time.
10. Sample test runs and a graphs showing change associated with the amount of yeast used follow.
JBS Teacher MBL Manual Page - 42 -

4.803.131.120.0
3 grams2 grams1 gram0 grams
Fermentation Rate (kPa)/min.Variable (Amount of Yeast)
Table 1. Student Team 1.
5
4
3
2
1
0
Fermentation Rate (kPa/min)
Yeast Amount (0, 1, 2, 3, grams)
Change of Fermentation Rate with Yeast Amount
Series 1
JBS Teacher MBL Manual Page - 43 -
\
JBS Teacher MBL Manual Page - 44 -

JBS Teacher MBL Manual Page - 45 -

JBS Teacher MBL Manual Page - 46 -

JBS Teacher MBL Manual Page - 47 -

LABORATORYINVESTIGATION
Vertebrate Respiration - Teacher InstructionsIn this investigation students find the respiration rate, shown by carbon dioxide production, of two vertebrate animals. Team data are pooled and average respiration rate values are calculated.
TimeTwo laboratory periods, one and 1/2 periods to collect the data and the remaining 1/2 period to exchange information and to answer student questions.
Vernier EquipmentLabPro Interface, Carbon dioxide sensor
Materials safety goggles, lab aprons, respiration chamber with restraining cage, mice, frogs,laboratory balance, small electric fan, leather gloves
SafetyIt is necessary for students to wear safety glasses. Special instructions should be given to the students informing them of the handling techniques for the mice and frogs.
Preparations1. The carbon dioxide sensor has a warm up requirement after it is turned on. After the warn up
period the sensor readings should stabilize around the 1000 ppm level. The manual explains the operation of the sensor and this information should be familiar to the teacher.
2. The Y axis of the graph is scaled to plot carbon dioxide levels from 0 ppm to 5000 ppm. This range is adequate to show the changes in levels required for this investigation. The rate of change of carbon dioxide will be fairly rapid for the mouse and much slower for the frog.
3. Purchase mice from local pet stores and frogs from local fishing bait stores. Other vertebrates can be substituted if necessary. A biological supply company is another supply choice if convenience rather than cost is important. 6 animals of each type should be adequate for a class of 5 laboratory groups.
4. Mice will readily enter the restraining cage if it is covered with a paper towel to darken its interior. Place the animal near the cage opening and it will enter the dark tunnel willingly.
5. Pooling of laboratory results is a teacher option. As always, pooling of data is an effective way of illustrating variability and the errors associated with experimentation. Table 4 provides space for pooling five sets of data.
6. It is important to keep the animals calm and quiet. Covering the chamber with a paper towel during the test helps to calm the animal. It is important to obtain the basal rate of respiration rather than an elevated rate caused by distress and excitement.
JBS Teacher MBL Manual Page - 48 -

7. The Phipps-Bird respiration chamber used in this investigation has been modified to accept the Vernier carbon dioxide sensor. See figure 1 for alterations.
8. Sample sets of data and sample calculations follow.
JBS Teacher MBL Manual Page - 49 -
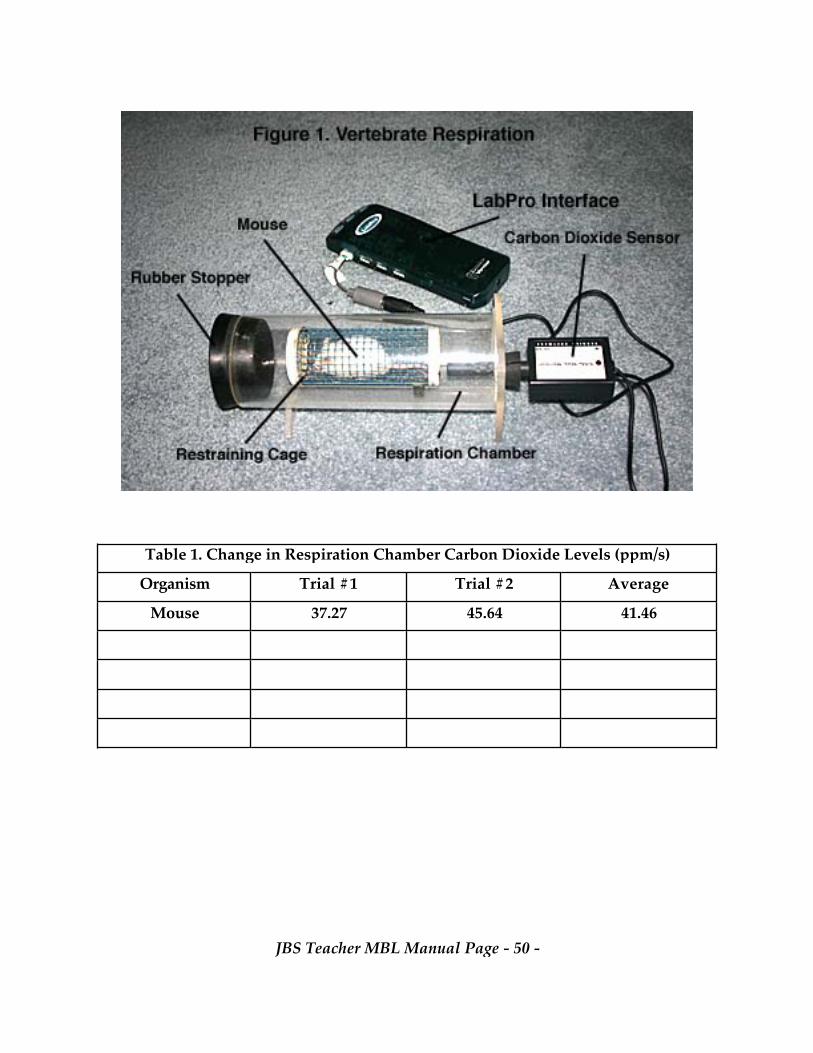
41.4645.6437.27
AverageTrial #2Trial #1
Mouse
Organism
Table 1. Change in Respiration Chamber Carbon Dioxide Levels (ppm/s)
JBS Teacher MBL Manual Page - 50 -

41.4645.64 ppm/s37.27 ppm/s
FrogMouse
Average
2
1
Trial
Table 1. Change in Respiration Chamber Carbon Dioxide Levels (ppm/s)
33209176
Weight of AnimalWeight of Cage and Animal
Weight of Cage
Mouse
Organism
Table 2: Animal Weight Information (grams)
1.263341.46
ppm/second/gWeight (g)Average ppm/ Second
Mouse
Organism
Table 3: Team Respsiration Rate Summary
1.2633
41.46
ppm/Sec/Gram
Weight (grams)
Ave. ppm/Sec
FrogMouse
Table 3. Team Respiration Rate Summary
JBS Teacher MBL Manual Page - 51 -

1.26
Average
Team 8
Team 7
Team 6
Team 5
Team 4
Team 3
Team 2
Team 1
MouseOrganisms ----------->
Table 4: Class Respiratory Rate Summary
JBS Teacher MBL Manual Page - 52 -

JBS Teacher MBL Manual Page - 53 -

LABORATORYINVESTIGATION
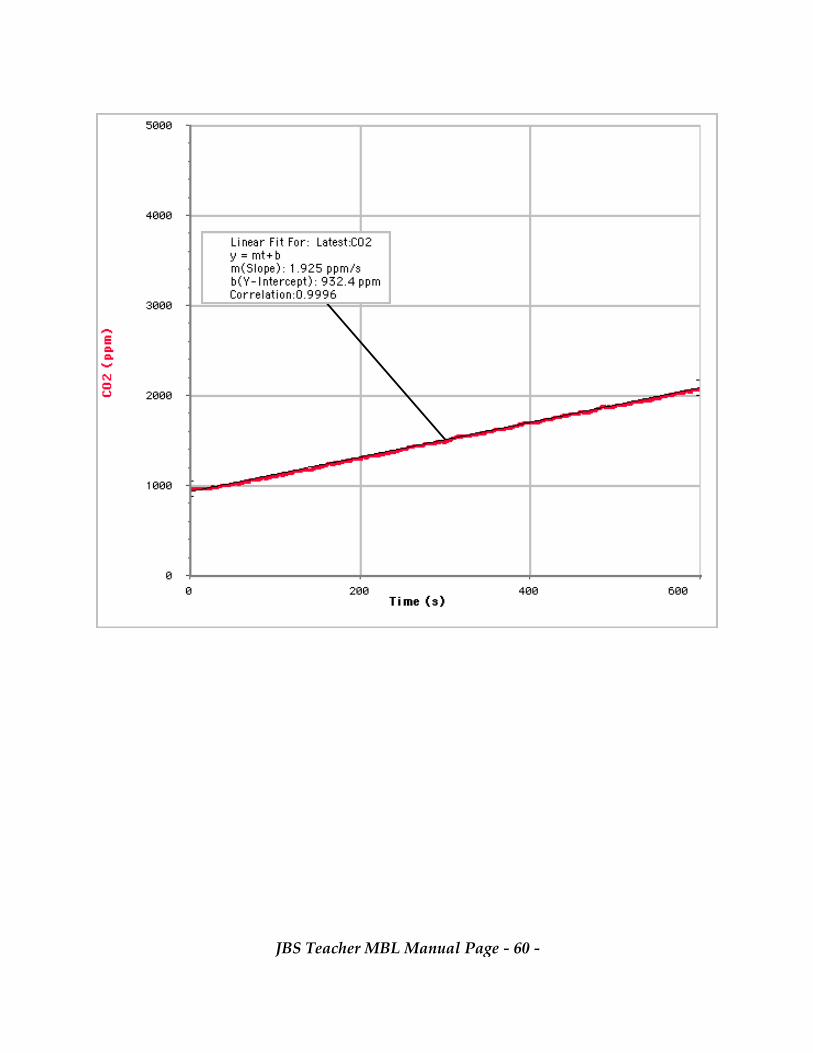
Seed Respiration - Teacher InstructionsIn this experiment, students measure the respiration rates of dormant and germinating pea seeds.
Respiration rates are found for seeds that have been germinating for 48 hours, 24 hours and 0 hours using glass beads as a negative control. Data resulting from the experimental runs suggest that seeds release increasing amounts of carbon dioxide as their germination age increases.
Time One double lab period - one period to run the investigation, one period to complete the data analysis and to discuss the results of the experiment.
Vernier EquipmentLabPro interface, carbon dioxide sensor, and respiration chamber
Materials per lab group safety goggles, lab aprons, 40 small glass beads, 40 dormant (dry) pea seeds, 40 pea seeds 24 hour germination, 40 pea seeds 72 hour germination, paper towels, ruler, calculator
JBS Teacher MBL Manual Page - 54 -

SafetyIt is necessary for students to wear safety goggles and the wearing of laboratory aprons is suggested.
Preparations1. Start the seed germination 24 and 48 hours before the day of the lab. Remind the students to
keep the germinating seeds on moist paper until they are returned to the supply table.
2. It may be necessary for the teacher to review the procedure for calculating the slope of the “best fit line”. Some students might also need help deciding what is a best fit line.
3. If each student needs a graph of the data for their report it will be necessary to tell them to print one graph for each team member rather than just printing one graph.
4. Students should be shown how to insert the test probe into the respiration chamber by using only the rubber stopper as the grip. Twisting the CO2 probe into the chamber using the body of the sensor is likely to break it. Replacements cost $250 so this is a very worth while demonstration to make.
5. The carbon dioxide sensor requires a one to two minute warm up period. Following warm up, the power to the LabPro and sensor must remain on. When the sensor is first turned on the readings will be high and over scale. As the sensor warms the readings decline in value eventually becoming level at what ever carbon dioxide concentration is present around the sensor.
6. The sensor determines the amount of carbon dioxide in the air by measuring the absorption of infrared radiation by carbon dioxide molecules inside the shaft of the sensor Air containing carbon dioxide diffuses in and out though the openings in the shaft. As the rate of air exchange between the interior of the shaft and the outside air is slow some residual carbon dioxide from a completed test could remain inside the shaft. Exchange of fresh air from the outside to the inside the sensor can be increased by fanning air around the shaft. Do not blow air around the shaft as this will only increase the amount of carbon dioxide present.
7. New Vernier sensors have auto-ID capability and automatically set up an experiment. Older sensors lack this feature and must be manually set up using the Logger Pro software. One or more of your lab groups might need additional help with the manual task. See the student lab experiment steps, 2, 3, and 4 for manual instructions.
8. The seeds should be germinated and held in a warm environment (25 degrees C.). It is important that the seeds in each test group are near the same temperature as this variable changes the metabolic rate.
JBS Teacher MBL Manual Page - 55 -

0.00Dry Glass Beads1.92572 hours germination1.2330.020
24 hours germinationDry - 0 hours germination
Respiration Rate (ppm/sec)Condition
Table 1. The Respiration Rate of Seeds Germinating for Various Lengths of Time
JBS Teacher MBL Manual Page - 56 -

2
1
0
Respiration Rate
Germination Time (0, 24, 72 hours)
Respiration Rate of Germinating Pea Seeds
Series 1
JBS Teacher MBL Manual Page - 57 -

JBS Teacher MBL Manual Page - 58 -

JBS Teacher MBL Manual Page - 59 -
JBS Teacher MBL Manual Page - 60 -

LABORATORYINVESTIGATION
Plant Transpiration - Teacher InstructionsIn this investigation students use a humidity probe to investigate the release of water vapor
from the leaves of bean plants. The bean plants are housed within a sealed glass jar containing the probe. Measurements of the humidity change with time are made. Knowing the slope of the humidity data plot it is possible to estimate the plant’s transpiration rate.
Given the information that water vapor escapes from the plant through its stomata, the students are next asked to measure the transpiration rate when the upper surface of the plant's leaves are covered with petroleum jelly and when both upper and lower surfaces are covered. This leads to the discovery of where the plant's stomata are located.
TimeOne double laboratory period is needed to run the experiment, to print out the data and to exchange data with the other teams.
Vernier EquipmentLabPro Interface, humidity sensor
JBS Teacher MBL Manual Page - 61 -

Materials (per lab team)safety goggles, laboratory apron, 1 young, healthy bean plant, 1 wide mouth gallon jar, 1 Lucite support platform, 1 ring tripod, 1 or more support blocks, 1 package of modeling clay, 1 container of petroleum jelly
SafetyWear safety goggles and lab apron. Tie back long hair and roll up long loose sleeves. The glass jar is large and heavy. It needs a strong and sturdy support.
Preparations 1. The modeling clay must not contain water or it will add to the humidity of the jar. The slot of
the Lucite support platform could be sealed with masking tape if an oil containing version of modeling clay is not available.
2. Cut the support platform from any rigid plastic material. Plastic at least 0.5 cm. thick should be used.
3. The bean plants should be healthy and growing. Select a variety that grows bush like rather than tall and climbing. It is important that they are housed in an area with intense light as
JBS Teacher MBL Manual Page - 62 -

stomata may partially close if the light is dim. Similarly, the pot soil must be kept moist to prevent stomate closure. As a green thumb experience, have the students grow their test plants.
4. Cut a supply of support blocks from 2" x 4" and 1" x 4" boards.
5. The petroleum jelly should be soft when used to prevent leaf damage. It works best to rub the jelly onto the leaf with one finger while supporting the leaf from below with the opposite hand. Keep the jelly layer thin.
6. An informative article describing the measurement of plant transpiration can be found in The American Biology Teacher, Volume 51, NO. 8, November/December 1989. In this article, the authors, Seligmann and Thompson, describe a procedure for converting humidity and temperature readings into an actual transpiration rate.
7. This investigation continues to emphasize data pooling, averaging, and graphing. Encourage spreadsheet usage and utility program graphing.
8. Sample test results are shown below in table 1.
0.00
0.16
No plant in JarTop and Bottom Surfaces Covered
Top Covered with VaselineNo cover ,Stomata Open
Rate of ChangeLeaf Condition
Table 1. Jar Humidity Change with Time
JBS Teacher MBL Manual Page - 63 -

JBS Teacher MBL Manual Page - 64 -

JBS Teacher MBL Manual Page - 65 -

0.6
0.5
0.4
0.3
0.2
0.1
0
Rate of Change
Experimental VariableControl Top Surface Covered Both Surfaces Covered
Change of Humidity With Plant Stomate Condition
Series 1
JBS Teacher MBL Manual Page - 66 -

LABORATORYINVESTIGATION
Reaction Time Teacher InstructionsIn this investigation students measure their reaction time using their dominant and non dominant hands to both light and sound when distractions are and are not present. Comparisons of control reaction times with experimental reaction times are made to evaluate the effect of stimulus type, gender, hand dominance, and distraction on rates of response.Time Two laboratory periods to run the investigation and to complete the data analysis. Data analysis can be completed rapidly if a spreadsheet is used for recording, summing and averaging the data collected.
Reaction time software
MaterialTeams of 3 ( 1 team per computer with software)
Safety Students should be encouraged to click the mouse swiftly but gently.
Preparations1. Assign a single team to each computer.
2. This laboratory generates a monstrous pile of raw data. To avoid student frustration with the numbers and also to improve accuracy in handling the numbers a spreadsheet should be used. One option, among several, is to provide each student with a spread sheet template that only requires data entry. Another method would be to have a single class spreadsheet and all data would accumulate in this master. After all data is entered the sheet could be printed and made available to each student or team for review and analysis.
3. It is possible that there could be some improvement in the reaction time as a result of practice. If each member of the class starts at the same place in the instructions and completes the tasks sequentially bias due to practice could result. To compensate for bias resulting from practice ask different teams to start the test series at different places in the instructions. Also, have one team member start by using their dominant hand and the other start by using their non dominant hand.
4. When differences are found between the averages (means) of the variables tested it becomes necessary to have some procedure or method for deciding if the differences are real or just the result of chance variation. This decision is often made using statistical methods. One simple test, Student’s “t”, is used to determine the significance of the difference between two mean values. Calculation of the “t” value is easily accomplished using the same spreadsheet as was used for tabulating class data. The Reaction Time laboratory may be an appropriate place to introduce class members to the impartial decision making methods of statistics.
5. This laboratory investigation also lends itself to the teaching of graphing and the presentation of visual comparisons for others to observe. A graphing utilities program would be very helpful
JBS Teacher MBL Manual Page - 67 -

to have for each student team to use when they complete their data analysis.
6. This laboratory could be used as an introductory activity leading to the study of the nervous system. Questions such as, “Why is there an interval between the presentation of a stimulus and the organisms response?”, could cause the student to reflect on the chemical nature of the nerve impulse and synaptic transmission. The lab also provides background experience related to the discussion of receptors, sense organs and muscle contraction.
7. It is not necessary to complete all parts of this investigation in order to determine that reaction time is variable between individuals. If time is short, eliminate the section dealing with shape identification. Comparison of the dominant and non- dominant hand could also be eliminated if time is a major problem.
8. Throughout this experiment, the instructions state that to react to the stimulus you should click the mouse button. You may also press Return or Enter to react to the stimulus. Everyone taking the test should respond using the same key. Select one response method, preferably the mouse, for all class members to use.
9. At various times throughout this experiment, the instructions state that to perform a particular function, such as Start the Game or Try Again , you should press Return. On extended keyboards with Return or Enter, or two Enters, you may press any of these keys to perform the function.
10. To get more accurate readings of the reaction times use the Advanced Levels option. Pull down the program’s screen File menu and select Allow Advanced Levels. This will still allow levels 1 and 2, but will add levels 3 and 4 and increase timing accuracy on all levels. The accuracy of the timing will be increased to 4 decimals on all levels.
11. Level 1 provides a stationary picture with no other visual stimuli to distract the subject. Level 2 brings changing shapes onto the screen from the left side. Level 3 brings changing shapes onto the screen from both the left and right sides. Level 4 brings changing shapes onto the screen from the left, right, top and bottom of the screen.
12. Sample class data follows
JBS Teacher MBL Manual Page - 68 -

A B C D E F G123456789
1 01 11 21 31 41 51 61 71 81 92 02 12 22 32 42 52 62 72 82 93 03 13 2
Table 3 Class Reaction Time Results Table 3 Class Reaction Time Results Table 3 Class Reaction Time Results Table 3 Class Reaction Time Results Table 3 Class Reaction Time Results Table 3 Class Reaction Time ResultsL ight Sound Dominant Non dominant L ight
Name S e x S t imu l u s S t imu l u s Hand Hand Mixed StimulusF 0.25 0.05 0.28F 0.29 0.07 0.34M 0.23 0.28M 0.21 0.2F 0.2 0.01 0.24M 0.25M 0.2 0.06 0.24M 0.26 0.02 0.32F 0.22 0.02 0.27M 0.2 0.01 0.27F 0.21 0.27M 0.21 0.24M 0.21 0.02 0.26M 0.19 0.02 0.25M 0.21 0.05 0.28F 0.27 0.31F 0.35 0.4F 0.25 0.33M 0.18 0.02 0.22M 0.25 0.02 0.32M 0.23 0.01 0.28M 0.14 0.01 0.25F 0.2 0.02 0.27F 0.2 0.02 0.27F 0.21 0.01 0.36M 0.21 0.01 0.3
Average AllAverage All 0.22 0.03 0.29Ave. BoysAve. Boys 0.21 0.02 0.26Ave. GirlsAve. Girls 0.24 0.03 0.34
JBS Teacher MBL Manual Page - 69 -

LABORATORYINVESTIGATION
Exercise, Conditioning and Pulse Rate
In this investigation students measure their pulse rate before a period of controlled exercise and during the recovery from this exercise. These pulse values are used to derive both a personal aerobic fitness inventory score and a target training pulse rate. Students should be encouraged to complete the first Going Further activity in order to use the target training pulse rate value during a period of physical activity.
Teachers may want to consult standard references on the subject of estimating physical aerobic fitness. The Harvard Step Test is described in "Physiological Measurements of Metabolic Functions in Man," Consolazio, Johnson and Pecora, McGraw-Hill. The Kasch step test is described in "The Y's way to physical fitness," (3rd. ed.), Golding, et al. (1986), YMCA of the USA, 101 N. Wacker Drive, Chicago, IL 60606.
Time Two laboratory periods - one and one half periods to run the experiment and one half period to exchange data with other teams and to discuss the data collected.
Vernier EquipmentPulse sensor, LabPro interface
Materials per team, 1 step bench, 1 metronome per class or tape recording , 1 opaque cloth per team, spreadsheet and graphing software
SafetyAll activities in this laboratory need to be closely monitored in order to avoid falls or spills associated with stepping onto the bench. The sub maximal step test used in this laboratory presents no danger to the normal healthy individual. Individuals with prior health conditions, especially those involving the cardiovascular or skeletal systems, should not participate in the physical part of this laboratory.
Preparations1. The instructor should assemble the equipment and check the operation of the pulse transducer
before the laboratory. It is far more efficient of time if the students measure their pulse by palpation. Each student should still have the opportunity to have their resting pulse measured electronically and to see their pulse plotted on the computer screen.
2. Do not expect the pulse transducer to read all students equally well. Skin color, finger size and skin thickness will all cause differences. Finger nail polish also reflects light so individuals with painted nails may have trouble obtaining a strong signal from the pulse transducer. Try moving the transducer to fingers other than the index finger if the subject has difficulty obtaining a good trace.
3. The ear lobe is another region of the body that produces a good pulse wave with the sensor. Try both lobes if difficulty is encountered.
JBS Teacher MBL Manual Page - 70 -

4. Teach the class, as a group, how to take their pulse by palpation. Palpation of the radial artery usually gives most satisfactory results for beginners. Students may need to be shown the correct positioning of the flat portion of his/her fingers on the artery (See figure 2).
5. Step benches should be solidly constructed and 12 inches high. For stability, they should be at least 18 inches wide and 18 inches deep. Use a good grade of wood in their construction as the benches will receive heavy use over several years.
6. You will need a metronome for accurate pacing at a rate of 96 beats (24 stepping cycles) per minute. It works well to borrow a metronome and record three minutes of accurate pacing followed by one minute of recovery. The tape is then played on a small player at a volume sufficient to be heard by the test subjects. The pacing or rhythm is up..up..down..down. On the first up the subject places either foot on the bench, on the second up the subject brings the other foot onto the bench. At this point the subject should be standing erect on the bench. On the first down the subject returns one foot to the floor. The remaining foot is returned to the floor on the second down. Now the subject is standing erect on the floor. This cycle is repeated 24 times each minute for 3 minutes. After three minutes the subject is seated and his/her pulse is recorded for 1 minute. No time should elapse between the end of stepping and the taking of the pulse.
7. The sub maximal step test of aerobic fitness is the creation of Dr. Fred Kasch of San Diego State University. He developed the test by modifying, the more famous but more difficult, Harvard step test. The Kasch test is used by the YMCA for the mass screening of subjects. Its weaknesses include, relative inaccuracy, and a lack of standards for individuals younger than 18. We must assume, for the purposes of this laboratory, that the 18 year old standard is also appropriate for those in the 14-17 year old range. Therefore, the student PFI scores value should be considered only a crude estimate of individual fitness. Hopefully the score, inaccurate as it may be, will cause the student to act more responsibly in those areas of his/her life that contribute to cardiovascular health.
8. Sharing of the data to arrive at a class standard is important. Summation and averaging is most easily done if a spreadsheet is prepared ahead of time for data entry. If a computer is available, students should be encouraged to enter their personal data into the spreadsheet as it is obtained. Average resting pulse rate values for both sexes are needed. Bar graphs of average pulse rates by sex and fitness distribution by category complete the student analysis requirements.
Norms for 3 minute step test Norms for 3 minute step testFitness Category Male Pulse Female PulseExcellent <79 <85Good 79-89 85-98Above Average 90-99 99-108Average 100-105 109-117Below Average 106-116 118-126Poor 117-128 127-140Very Poor >128 >140
JBS Teacher MBL Manual Page - 71 -

JBS Teacher MBL Manual Page - 72 -

LABORATORYINVESTIGATION
Recording Electrocardiograms - Teacher InstructionsIn this investigation students record an electrocardiogram and make an analysis of the ECG wave
form generated by the polarization and depolarization of the heart muscle. From the ECG waves the students are also able to calculate the rate of the subject’s heart beat.
Time One double laboratory period is sufficient to collect electrocardiograms and complete the analysis of the ECG.
Vernier EquipmentLabPro Interface, EKG sensor
Materials (per team)Electrode tabs, work area with a horizontal surface for the test subject to recline.
SafetyThe ECG sensor is to be used for educational activities only. It is not designed for medical or research purposes. Do not make a diagnosis from the information generated by this ECG sensor.
Preparations1. The teacher should be very familiar with the information contained in the manual
accompanying the ECG sensor.
JBS Teacher MBL Manual Page - 73 -

2. ECG recordings should be taken with the subject in a reclining position when ever possible. The subject should also be relaxed and any form of muscle activity should be avoided during the recording of the ECG.
3. The ECG recording only takes 3 seconds so there is time to make several runs to get a satisfactory ECG.
4. The electrodes must make a good contact with the skin. Make sure the skin is dry and not oily before appying the electrode. Apply the electrode to the skin so that the tab of the electrode points in the direction of the patients feet. Electrodes should be applied to the arm below and to the inside of the elbow.
5. The teacher should be familiar with the process of manually loading the ECG sensor program.
6. The teacher may need to review with the students the procedure for moving the cursor along the wave form and then reading the X (time) values shown in the window below the graph.
7. The ECG sensor could possibly pick up electrical interference from appliances in the room, lights etc. If the ECG is “noisy” you might improve the ECG by turning off some or all of the room’s lights.
8. There are several web sites online that show abnormal ECG recordings. Encourage your students to search the web for these and to report on there findings.
9. Again, caution the students not to make a diagnosis of their hearts condition based on the ECG recorded in the laboratory.
10. Two sample normal electrocardiograms of a 77 year old man follow.
JBS Teacher MBL Manual Page - 74 -

JBS Teacher MBL Manual Page - 75 -

JBS Teacher MBL Manual Page - 76 -

LABORATORYINVESTIGATION
Human Breathing - Teacher InstructionsIn this investigation students measure their breathing rate and depth of breathing. With this
task they also acquire practice using the methods of science. Both experiences are enriched by microcomputer based data collection.
Time One double lab period - one period to run the experiment and to print out the data; one period to exchange data with other teams and to discuss the data collected.
Vernier EquipmentLabPro interface, respiration monitor belt, pressure sensor
MaterialsMetric ruler, 10 gallon garbage bag, calculator, drinking glass
SafeHyperventilation, breath holding and breathing recycled air can cause dizziness. Complete these steps of the procedure while seated. Stop the procedure immediately if a sensation of dizziness occurs.
Preparations 1. The instructor should assemble the equipment and check the operation of the respiratory belt
and pressure sensor before the laboratory (See figure 1 on the student’s instructions).
2. The positioning of the respiratory belt on the patient's chest is sometimes a matter of trial and error. For most people the best position is on a line with the arm pits. For girls it is best to start with the belt high in order prevent it form slipping down during the test. Test subjects should sit upright and still with their backs away from the chair and not in contact with it. The belt should be pulled tight when it is placed in position on the subject’s chest. It is a good idea to demonstrate to the class how the belt is to be applied and inflated.
3. The position of the trace on the graph can be altered by changing the Y axis of the graph. Clicking on the top and lower numbers create a window where the new values are to be typed. Also the amplitude of the tracing can be increased by reducing the range of upper and lower Y axis values. Because the data is being pooled it is important that all lab groups use the same Y axis range.
4. It is also possible to change the sample rate and the duration of sampling by following the instructions in the student lab guide. A rate of 5 samples a second is more than adequate to show the full curve of the respiratory cycle.
5. After the students have printed their breathing rate graphs, it will be important to help them firm up in their minds the chain of events that are represented by the wave form on the graph. They will need to associate mentally the wave shape with the change of pressure in the belt
JBS Teacher MBL Manual Page - 77 -

and the change in belt pressure with the rise and fall of the chest. They should observe that the wave on the graph rises during inhalation and falls during exhalation. The amplitude of the wave reflects the tidal volume of gas exchanged when the test subject is at rest. For adult males, the tidal volume averages 500 milliliters.
6. The Going Further activities are all fun and as many should be attempted as time allows. Different laboratory teams also could investigate a single activity and then report their findings to the class at large. This latter procedure would help the students develop skills in reporting and speaking.
7. Teachers of advanced classes could extent the use of the data and ask the students to determine the significance of the difference between the average rate of breathing of the males and females. Student’s T test is easy to use for this purpose and the formula for the test of significance could be entered into the data table.
8. A sample graph follows.
JBS Teacher MBL Manual Page - 78 -

LABORATORYINVESTIGATION
The Digestion of Protein by PepsinTeacher Instructions
In this investigation students observe the digestion of protein by the enzyme pepsin and acquire practice using the methods of science. Both experiences are enriched by microcomputer based data collection.
Time One double lab period - 1 and 1/2 periods to run the experiment and to print out the data; 1/2 period to exchange data with other teams and to begin analysis of the data collected.
Vernier EquipmentLabPro Interface, Colorimeter
Materialssafety goggles. 5 vials pHydrion Papers (range 1 - 11), dilute HCl, I hard boiled egg, 4 grams (1:10000) pepsin, 1 blender (Waring type), 5 4" X 4" glass plates, 5 glass stirring rod, distilled water, 5 rinse bottles, 5 graduates 10 ml, 10 beakers (50 ml), 5 ml pipettes. 1 ml pipettes
SafetyIt is necessary for students to wear safety goggles when working with the liquids in this laboratory. Tell the students to be especially careful when working with the hydrochloric acid. Any spills or drops on the table surfaces must be cleaned up immediately. Students also need to be reminded to wash their hands each day before leaving the laboratory.
Preparations1. The pepsin stock solution is prepared on the day of the laboratory by dissolving 4 grams of
pepsin powder (1:10000) in 200 ml. of distilled water. This stock solution is the 100% enzyme concentration used in the investigation. Dilute 50 ml. of stock solution with 25 ml. of distilled water to make 75 ml. of 66% enzyme solution. Dilute 25 ml. of stock solution with 50 ml. of distilled water to make 75 ml. of 33 % enzyme solution. Distilled water (100 ml.) is used as the 0% enzyme solution. These solutions should be stored in a refrigerator when not being used. Distribute 10 ml. of each solution ( 100%, 66%, 33%, and 0%) to each laboratory team as needed during the laboratory class period.
2. One hard boiled egg is sufficient to prepare 800 ml. of protein suspension. Boil the egg to hardness, remove the shell, cut the egg in half and throw away the yolk. Place the hard egg white (albumin) in a blender with 100 ml. of distilled water. Blend the mixture at low speed and then high speed. Add another 100 ml. of distilled water and blend for several minutes. The blending should produce a suspension of very fine egg white particles and water. Filter the suspension through several layers of cheesecloth to remove any large particles of egg white. Add distilled water to the filtrate to make a volume of 800 ml. of suspension. The absorbance of this solution should be between 0.9 and 1.0 when the wavelength of light is set to 430 nm. The egg white suspension should be at room temperature when it is used but keep it refrigerated at
JBS Teacher MBL Manual Page - 79 -

other times.
3. Dilute hydrochloric acid is made by mixing 25 ml. of concentrated HCl with 150 ml. of distilled water. The acid is used to set the pH of the egg white solution to 2. This usually takes about 5 drop of dilute acid for each 100 ml. of egg white. The teacher should prepare the egg white acid stock solution before the laboratory. It is also necessary to have a second stock solutioin of egg white without the acid. 400 ml of each should be more than sufficient for a single laboratory.
4. See the Vernier rmanual for general information about the colorimeter. It is necessary to calibrate the colorimeter before it is used (see manual page 4 item 3). It is also necessary to select the wavelength of the light. For the egg white solution select 430 nm. The absorbance of the acid and egg white solution at zero time should read between 0.80 and 0.95. If the reading is greater than 0.95 dilute the egg white stock solution with distilled water. If the absorbance is less than 0.80 add more egg white to the solutiion. If the egg white solution is too concentrated the colorimeter will be unable to detect changes in absorbance. This will delay the start of the instrument's ability to detect the clearing process and result in an extention of the time needed to complete the laboratory.
5. Students should be cautioned not to spill liquids into the colorimeter’s sample cell. The cuvette must always be covered before it is placed in the sample cell. Also, one of the clear sides of the cuvette must face the arrow above the sample cell. It is good practice to place a small mark on the top edge of one of the clear sides of the sample cell. Always face the side of the cuvette with the mark towards the arrow.
6. Laboratory time is valuable and some of it could be saved by having one person or team complete steps 5, 7 and 8 for the class. These steps were included to draw attention to the conditions of the experiment held constant. Shared data may serve the same purpose!
7. A common source of error is incomplete mixing of the enzyme and the egg white solution. Remind the students to follow carefully the procedural steps as given in the laboratory. To ensure thorough mixing, the egg white-acid solution is always poured into the cuvette containing the enzyme. To avoid foaming, the substances are never shaken.
8. After the students have printed their graphs, it will be important to help them firm up in their minds the chain of events that are represented by the line on the graph. They will need to associate mentally the graph's line with the clearing of the solution and the clearing with the digestion of the egg white by the enzyme. In addition, the slope of the line must be seen to represent the rapidity (rate) of the enzyme's action on the egg white. They should observe that the rate is constant and the slope of the line linear, only during a short initial time period. As time progresses, they should see that the line of the graph curves and that this shows the enzyme is working less efficiently. Student discussion of limiting factors and identification of the limiting factor in this chemical reaction should then be undertaken to complete the data analysis.
9. It will be necessary to review the procedure for determining the slopes of the graphs produced. You may wish to refer the students to the procedure used in the Fermentatioin Lab or just go over the entire process again. The making of a graph from a series of other graphs is always a conceptual leap and may need further explanation and discussion.
10. Sample sets of data follow.
JBS Teacher MBL Manual Page - 80 -

0.00430.04310.07110.0723
0.0043660.0431000.0011850.001205
0%33%66%100%
Absorbance/minAbsorbance/secEnzyme Concentration %
Table 2. Rate of Protein Digestion
JBS Teacher MBL Manual Page - 81 -

Table 1. Protein Digestion
pH
Pepsin
Dilute HCl
Egg White
Acid - Egg White mixture
Temperature
Air
Acid - Egg White mixture
Appearance
Acid - Egg White mixture before digestion
Acid - Egg White mixture after digestion
JBS Teacher MBL Manual Page - 82 -
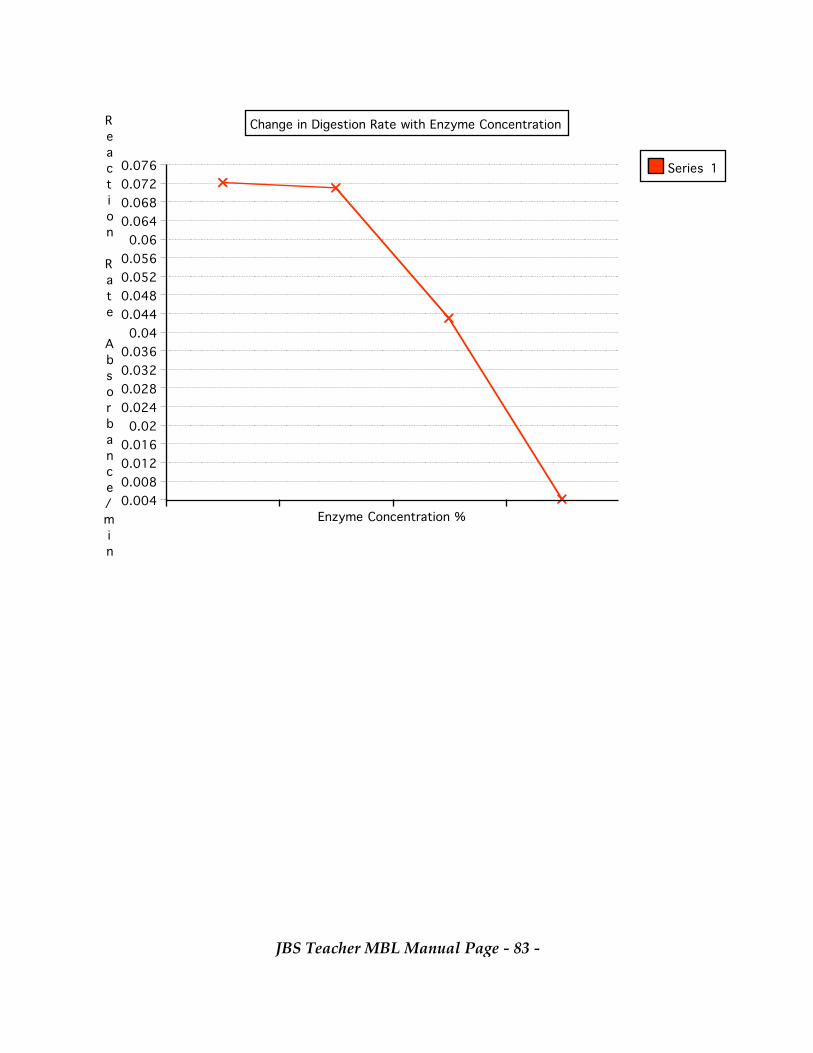
0.0760.0720.0680.064
0.060.0560.0520.0480.044
0.040.0360.0320.0280.024
0.020.0160.0120.0080.004
Reaction Rate Absorbance/min
Enzyme Concentration %
Change in Digestion Rate with Enzyme Concentration
Series 1
JBS Teacher MBL Manual Page - 83 -

JBS Teacher MBL Manual Page - 84 -

LABORATORYINVESTIGATION
The Digestion of Starch by AmylaseTeacher Instructions
In this investigation students measure the rate of digestion of starch by fungal amylase. Evidence supporting the conversion of starch to maltose by amylase is derived from the clearing of an iodine stained starch-amylase solution. Clearing time is measured using the Vernier colorimeter sensor. The option of studying the affect of temperature and pH on the rate of the reaction is also open to the student investigator.
TimeOne double laboratory period is needed to run the experiment, to print out the data and to exchange data with the other teams.
Vernier EquipmentLabPro Interface, Colorimeter, cuvette and cover
Materials (per lab team) safety goggles, beakers 50 ml., graduated cylinder 10 ml., graduated cylinder 25 ml. dropping bottle containing IKI solution, marking pencil, 10 ml. of stock 1% amylase solution, 25 ml. of 0.2% starch solution, distilled water sufficient to prepare the solutions, 1 ml. syringe, 3 ml. syringe.
SafetyWear safety goggles and lab apron. Wipe up and spills with paper toweling and report the accident to your teacher.
Preparations1. Prepare a solution of 0.2% starch by dissolving 1.0 grams of soluble starch in 5 ml of cold
distilled water. Use starch for iodometry. This form of starch is sold by scientific supply companies. Corn, rice or wheat starch does not work with this experiment. Only soluble potato powder for iodometry gives satisfactory results. Bring 500 ml of distilled water to a slow boil and then add the starch paste prepared previously to the water. Quickly stir the starch paste into the boiling water for 2 minutes. The solution may be a little cloudy but not milky. Chill the starch solution to room temperature. Test a small volume of the chilled solution with iodine for the blue violet color reaction. Refrigerate the solution if it is to be stored over night.
2. Prepare the stock solution of 1% amylase by dissolving 2.0 grams of fungal amylase in 200 ml of pH 7 buffer. Refrigerate this solution if it is to be stored over night. The amylase powder dissolves slowly in the buffer so allow amply time for a solution to form. Commercial fungalamylase, when used with this experiment, gives consistent and reproducible results while human saliva does not. In addition, the sanitation problems associated with the collection of saliva makes the use of human amylase disgusting for many students.
3. The student instructions are written so students will make their own dilutions of the stock amylase solution. However, the teacher may also prepare them ahead of time. Dilute 3
JBS Teacher MBL Manual Page - 85 -

volumes of the stock solution with one volume of distilled water to make the 75% amylase solution. Dilute the 100% amylase solution with an equal volume of distilled water to make the 50% amylase solution. Dilute the 50% amylase solution with an equal amount of distilled water to make the 25% amylase solution. Use distilled water as the 0% solution. Boil 100% amylase solution for 5 minutes to make the boiled enzyme solution. On the day of the investigation allow the working solutions to come to room temperature before use.
4. Prepare the stock iodine solution by dissolving 6.5 g potassium iodide in 25-30 ml. of distilled water. Add 3.18 g of iodine to the previously prepared IKI solution and shake to dissolve. Slowly dilute with distilled water to a final volume of 500 ml. Pour this solution into dropping bottles for student use.
5. The computer program Logger Pro collects and plots the data as the starch is digested by the amylase enzyme. The plot should be linear when the amount of substrate is not limiting. Because only the linear portion of the graph is used, it is of little value to collect data past that region of the curve. Students can save a lot of time and also run additional samples by stopping data collection after the slope of the curve changes. Remember the command Stop halts data collection at any time.
6. It is not necessary to calibrate the colorimeter for this experiment.
7. A test run of the 100% enzyme starch reaction should be made before the investigation is attempted by the students. Expect a possible surprise. The reaction may run too fast or too slow. If a linear graph of the reaction is not produced consider changing either the concentration of the enzyme or the starch. For low reaction rates, consider reducing the scale of the Y axis of the graph. Instructions for changing the scale of the Y axis have been given in previous teacher instructions.
8. Students should be encouraged to study variables other than enzyme concentration. If pH is of interest mix the starch and enzymes in buffers of the appropriate values. Because some reactions may be very slow at high or low pH values students should be encouraged to investigate ranges close to pH 7 before attempting extreme values.
9. If temperature is of interest, place the colorimeter in an incubator or refrigerator along with the solutions. After the required temperature is reached, run the reaction.
10. If substrate concentration is of interest select an enzyme concentration near the midpoint of the concentration study. The enzyme concentration selected should give a moderate reaction rate. Do not use a weak or concentrated enzyme solution. Vary the concentration of the starch solution from a value of 100% (the strength of the original solution) through 80%, 60%, and 40%. Concentrations of starch below the 40% value may not stain blue with iodine. Plot a graph of reaction rate on the Y axis and the reciprocal of the concentration on the X axis. If everything works the plot should be linear!
11. Sample test run data for enzyme concentrations of 100%, 75%, 50%, 25%, and 0% follow.
12. Students must be cautioned not to spill liquids into the colorimeter sample well. This is unlikely to happen if the cuvette is covered before it is set into the well.
JBS Teacher MBL Manual Page - 86 -

-0.0001-0.0720-0.1024-0.1461-0.2635-0.2908
Boiled enzyme0% enzyme25% enzyme50% enzyme75% enzyme100% enzyme
Slope (absorbance/min.)
Color after Digestion
Initial ColorEnzyme Concentration
Data Table 1.
0.3
0.2
0.1
0
Reaction Rate (ab/min)
Enzyme Concentration (%)100 % 75 % 50 % 25 % 0 %
Reaction Rate Change With Enzyme Concentration
Series 1
JBS Teacher MBL Manual Page - 87 -
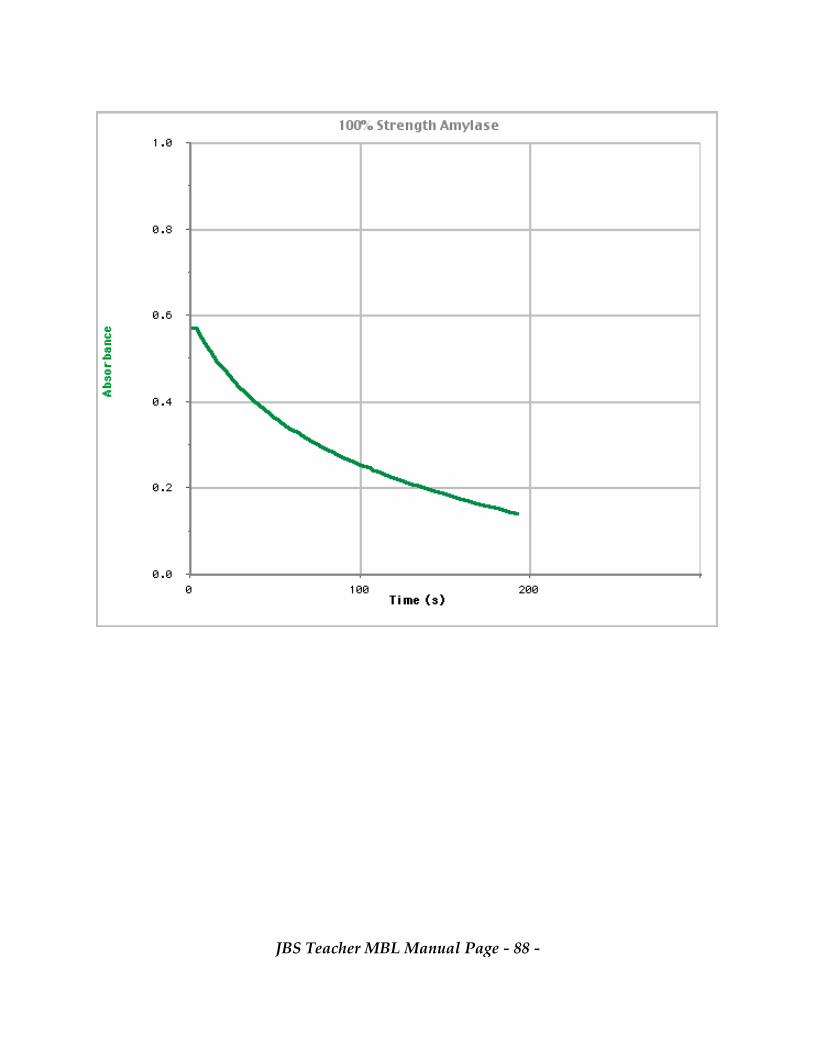
JBS Teacher MBL Manual Page - 88 -

LABORATORYINVESTIGATION
Large Calories, Small Calories and Food Teacher Instructions
In this investigation students measure the energy content of marshmallows and walnuts using a temperature sensor and simple calorimeter. Individual team measurements are obtained. Class averages are calculated and compared with team results and with published results.
This laboratory could be used as a lead into the study of nutrition or to the study of cellular respiration. In either case it would be very beneficial to have the students keep a record of their food intake (food type and weight) for one day. There are also several computer programs available that predict one's daily caloric, mineral and vitamin needs based on age, weight, sex, and activity level. These programs also compute how well an individual is satisfying their needs based on the recorded daily food intake record.
This laboratory continues to develop data analysis processes. Students should be required to design their spreadsheet format and to enter formulas for calculation. It would be very helpful to have programs for graphing, spreadsheet calculations and word processing on each laboratory computer.
Time Two laboratory periods to collect, pool and discuss the data.
Vernier EquipmentLabPro interface and temperature sensor
MaterialsSafety goggles, aprons, calorimeter, 25 ml graduated cylinder, 100 ml beaker, balance, forceps, pot holder, kitchen matches, small piece of sandpaper, aluminum foil, non=absorbent cotton, marshmallow, walnut meat.
SafetyStudents must wear safety goggles. The wearing of laboratory aprons is desirable. Long hair should be tied back. Review the location of the fire extinguishers with the class. Remove all combustible materials from the work spaces.
Preparations1. Calorimeters can be purchased or made from discarded metal cans by the teacher.
Sargent=Welch VWR Scientific is the supplier of the calorimeter shown in Figure 1.
2. A less expensive approach is to make your own calorimeters from 16 oz. tin cans (See figure 3). A bottle opener is used to punch out 4 holes in the top of each can and two on the side near the top. Tin snips should be used to cut out a viewing hole large enough to admit the burning food sample and its support. Cover the raw edges of each can with duct tape.
3. Most kinds of nuts will burn, but, as a rule oil roasted nuts burn better than those that have been dry roasted. Ignition is likely to be a problem and it often takes several matches to set fire to the nut. Some procedures suggest supporting the nut on a pin or bent paper clip that has been
JBS Teacher MBL Manual Page - 89 -

pushed through a cork (see figure 2). This technique exposes the nut to the air on all sides. The distance between the bottom of the test tube and the burning food substances should be constant between tests. If the support system is modified for one food, it also should be modified for the other.
4. Marshmallows must be dried at a low temperature for at least 12 hours before they burn well. The estimated caloric value of marshmallows is 325 kcal. per 100 grams. Walnuts, (625 kcal. per 100 grams), Pecans, (696 kcal. per 100 grams) and Peanuts, (576 kcal. per 100 grams) have similar caloric content.
5. Food sample size should be approximately 0.5 grams. This size will prevent the water temperatures from rising higher than 75o Centigrade. Above 75 degrees heat begins to be lost because of vaporization.
6. Sample data and results follow.
JBS Teacher MBL Manual Page - 90 -

Table 2 Food Energy Value Calculations
Name of Food _______Walnut________Weight of Food (grams) _______0.65__________Volume of Water (ml.) ________20___________Initial Water Temperature _______21.4_________Final Water Temperature ________70.8_________Temperature Increase ________49.4_________Volume of Water X Temperature Increase = Food Energy Released
_____20.0_____ X ____49.4_________ = _____988 calories
calories released / 1000 = Kilo calories of Energy Released
___988___calories / 1000 = ___.988_________ Kilo calories
Kilo calories released / Weight of Food = Kilo calories of Energy Released
___.988__ kilo calories / _0.65_ grams = _1.52___ Kcal. per gram
Kilo calories per gram X 100 = Kilo calories of Energy Released
_1.52_Kcal. per gram X 100 grams = __152_Kcal per 100 grams
JBS Teacher MBL Manual Page - 91 -

Table 2 Food Energy Value Calculations (Continued)
Name of Food ________Marshmallow___________________Weight of Food (grams) ________0.46_____________Volume of Water (ml.) ________20__________Initial Water Temperature _______24.2___________Final Water Temperature ________30.7___________Temperature Increase ________6.5_____________
Volume of Water X Temperature Increase = Kilo calories of Energy Released
__20________X ____6.5__________ = _130__ calories
calories released / 1000 = Kilo calories of Energy Released
_130___calories / 1000 = _0.13_Kilocalories
Kilo calories released / Weight of Food =Kilo calories of Energy Released
__0.13_ kilo calories / __0.46_grams = __0.283____ Kcal. per gram
Kilo calories per gram X 100 = Kilo calories of Energy Released
__0.283__ Kcal. per gram X 100 grams = _28.3_ Kcal per 100 grams
JBS Teacher MBL Manual Page - 92 -

LABORATORYINVESTIGATION
The Growth of a Population of Yeast Teacher Instructions
In this investigation students observe and measure the growth of two populations of yeast. One population is incubated at room temperature. The other population is incubated at or near 5 degrees Celsius. Evidence is collected showing an exponential growth of the population incubated at room temperature. Little growth in the refrigerated population is observed.
Time3 class periods, 2 double laboratory periods - two periods to start the investigation and to take the initial cell counts and absorbency readings; after that, 30 minutes on day 2 and 4, 15 minutes on day 1 and 3. One final day may be needed for data pooling and discussion.
Vernier EquipmentLabPro Interface, Colorimeter, cuvette and cover Materials (per lab team)safety goggles, microscope, microscope counting slide, cover slips, lens paper, sterile 5 ml. pipettes, 2 sterile 250 ml Erlenmeyer flasks continuing 95 ml of pure apple juice without additives, sterile medicine dropper
SafetyIt is always necessary for students to wear safety goggles. Students should be warned about the possibility of cuts from broken cover slips.
Preparations1. Prepare a stock yeast solution by dissolving one package of active dry yeast in one liter of
sterile water. Stir the solution to obtain a uniform suspension of yeast cells in water. Transfer 1 ml. of the 1 to 1000 solution into a flask containing one liter of sterile water. This mixture will be called the working solution and its dilution is 1 to 1,000,000. Students will transfer 5 ml. of the working solution into each flask containing 95 ml. of growth medium. After inoculation each ml. of the apple juice medium will contain 1 / 20,000,000 part of the original package of yeast.
2. Pure apple juice without additives works well as a growth medium. Sterilize 250 ml beakers in boiling water. After cooling add 95 ml of apple juice to the flask. Cover the flask opening with aluminum foil. Each laboratory team will need 2 flasks of apple juice medium. Use 250 ml flasks as swirling the flask’s contents will be easier. Expect some foaming when the flask is swirled.
3. Counting chambers are made by gluing 18 mm. X 18 mm. cover slips to 25 mm. X 75 mm. glass microscope slides (See figure 2). Miracle Glue is perfect for this job. The spacing between the two cover slips should be approximately 5 mm. When a cover slip is placed over the space created (see figure 2) the depth of the reservoir is between .18 - .25 mm. For counting purposes,
JBS Teacher MBL Manual Page - 93 -

assume the reservoir depth is 0.25 mm. Make one counting chamber for each student.
4. Counting chambers should be filled after the upper cover slip is placed on the supporting cover slips. A small drop of yeast is placed at the entrance to the reservoir and this drop will be drawn back into the reservoir by capillary attraction (See figure 3). This procedure will give a 0.25 mm. layer of yeast solution for counting. Use sterile droppers for the yeast transfer.
5. A magnification of 430X is needed for counting the yeast cell solution. It is also necessary to know the field diameter of the lens system used. If the high power lens is 43X and the eyepiece is 10X and Huygenian, the field diameter is 0.35 mm. If the high power lens is 43X and the eyepiece is 10X and wide field, the field diameter is 0.42 mm. Most microscope reference manuals provide field diameter information. Refer to these if your instruments are not of the type described above.
6. Using the field diameter information provided it is possible to calculate the volume of yeast observed in a single high power (430X) field.
7. Wide field area = pi X (radius)2 = 3.1416 X (0.21)2 = 3.1416 X 0.0441 = 0.139 mm.2
8. Huygenian area = pi X (radius)2 = 3.1416 X (0.175)2 = 3.1416 X 0.0306 = 0.096 mm.2
9. Wide field Volume = pi X (radius)2 X h = 0.139 mm.2 X 0.25 mm. = 0.035 mm.3
10. Huygenian Volume = pi X (radius)2 X h = 0.096 mm.2 X 0.25 mm. = 0.024 mm.3
11. Each time a student counts all the cells in a single high power field, the volume of the sample counted is known from the information provided. Use your discretion in deciding if the students need to know how the high power field volume was determined.
12. Experience dictates that it is hard to count the cells in the field with any accuracy when the number exceeds 100. Twenty five to fifty cells per field is ideal. Make a 9 to 1 dilution of the culture when the number approaches or exceeds fifty cells per high power field. The dilution need not be sterile.
13. Counting errors are to be expected. Many can be reduced or eliminated by carefully mixing the culture medium before the sample drop is withdrawn. Stress to the students how important it is that the sample drop be representative of the entire culture. Pooling of the data to obtain class averages also will help to smooth out the counting errors generated by student inexperience.
14. Set the wave length of the colorimeter to 565 nm. which is in the green region of the spectrum. Calibration of the colorimeter using distilled water is necessary. Review with the students the proper method of handling the cuvette and its insertion into the colorimeter well.
15. It is also important to go over the sterile techniques that will be used in transferring the yeast into the culture flask, in transferring yeast solution into the cuvette, and in filling the counting chamber.
16. Class data should be collected and averaged in a spreadsheet. Individual team data should be compared to the class averages. Students should be encouraged to speculate about the cause of any differences found between the data of individual teams.
JBS Teacher MBL Manual Page - 94 -

17. Students may need a lesson on graphing with semi log graph paper. Graphing with this paper is necessary because it ties in with the important concept of exponential growth.
18. Allow five consecutive days for this investigation. Start the work on Monday and complete the work on Friday. If the absorbance of the yeast culture incubated at room temperature does not reach .80 or higher continue the investigation over the weekend and take final measurements the following Monday.
19. It is not necessary that each team has its own colorimeter and computer. Because the measurements are rapid only one or two sets of equipment will be needed per class.
20. Sample sets of data and results follow.
JBS Teacher MBL Manual Page - 95 -

10000000
1000000
100000
Population Size
100500Turbidity
Change of Population Size With Turbidity
Series 1
JBS Teacher MBL Manual Page - 96 -
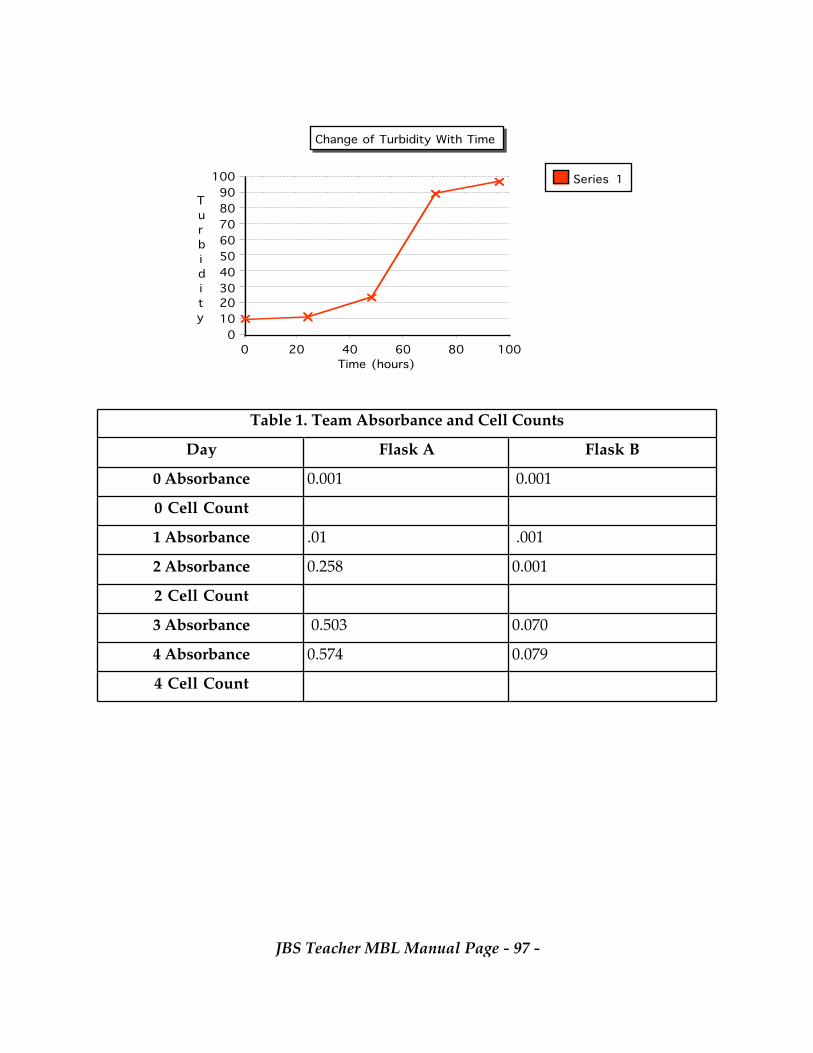
100908070605040302010
0
Turbidity
100806040200Time (hours)
Change of Turbidity With Time
Series 1
0.0790.5740.070
0.0010.258.01
0.001
0.503
.001
0.001
4 Cell Count
4 Absorbance
3 Absorbance
2 Cell Count
2 Absorbance
1 Absorbance
0 Cell Count
0 Absorbance
Flask BFlask ADay
Table 1. Team Absorbance and Cell Counts
JBS Teacher MBL Manual Page - 97 -

0.6
0.5
0.4
0.3
0.2
0.1
0
Absorbence
Time (days)
Absorbency Change With Time
Absorb. 22C
Absorb 4C
JBS Teacher MBL Manual Page - 98 -

LABORATORYINVESTIGATION
Biochemical Oxygen Demand - Teacher InstructionsIn investigation 20 students discover a relationship between decomposers (bacteria), organic
matter, and the level of oxygen in aquatic environments. Using closed systems evidence is gathered to show increasing amounts of organic matter is related to decreasing levels of dissolved oxygen.
Time One full laboratory period, 3 partial days. One period to discuss the experiment, to set up the experiment and to begin data collection. Three partial class periods to collect data and to disassemble the apparatus.
Vernier EquipmentDissolved oxygen sensor, LabPro interface
Materials Per laboratory team, goggles, aprons, 10 ml graduated cylinder, 2 BOD bottles with glass stoppers, aluminum foil to wrap the BOD bottles, milk, clean lake, river, or stream water, 2 nutrient buffer powder pillows, scissors, plastic milk container with cap.
SafetyStudents must wear safety glasses in the laboratory. The wearing of laboratory aprons is desirable.
Preparations1. Standard BOD tests are run at 20 degrees C. for 5 days. The procedure for this laboratory
assumes that the results obtained using an incubation temperature of 30 degrees Celsius for 3 days approximates the results one would obtain if standard conditions were used.
2. Some waters do not contain a sufficient population of bacteria to oxidize the organic matter added to the sample bottle. To avoid this problem add 1 gram of rich garden soil to 10 ml. of water. Shake the water and soil, then add 1 drop of the water from above the soil to the BOD bottle.
3. The nutrient buffer pillow is used to provide sufficient inorganic nutrients to support the growth of bacteria. It does not contribute to the BOD of the sample solution. Some waters, but not all, contain enough nutrient material that the buffer pillow is not required. Purchase powder pillows from Hach Chemicals.
4. The student laboratory guide calls for the addition of 5 ml. of milk to the water sample. This amount of organic material will produce a high BOD. Another choice is to assign different amounts of milk to each laboratory group. The BOD should vary depending on the amount of milk added to the water sample. Zero, one, two, three, four, and 5 ml. volumes are possible amounts of milk to add.
5. If the BOD is very high the dissolved oxygen level could fall below the 0.0 mg./L level before day 3. This possibility is prevented by measuring the DO level each day. Following the initial DO measurement the sample solution is aerated followed by a second DO measurement.
JBS Teacher MBL Manual Page - 99 -

The sample is then sealed and set aside for another 24 hours. The small errors introduced by this procedure will not alter the final results to any great degree.
6. BOD bottles (300 ml. ) with ground glass stoppers should be used with this experiment. Other bottles with screw caps could be used but care must be taken to avoid introducing an air bubble into the system when it is sealed.
7. Water for the experiment should be collected no more than one or two days before it is used. Store the water in a refrigerator until the day of the laboratory.
8. Used, but clean, plastic 1/2 gallon milk containers work well for shaking the water during aeration. Water containing milk may foam during shaking. Allow bubbles to break up before the BOD bottles containing milk are sealed.
9. The 30 degree incubation temperature is not critical but some form of temperature enhancement speeds bacterial growth and increases the biochemical oxygen demand.
10. Discuss with the students why it is necessary to wrap the BOD bottles in aluminum foil.
11. One dissolved oxygen sensor and one test station per class of 15 students is recommended. Students will be able to get the job done with one sensor in a reasonable amount of time. Using a single sensor also reduces the variation stemming from calibration errors of additional sensors.
12. Follow the instructions included with the dissolved oxygen sensor for its use and for checking its calibration. Students should be warned not to damage the membrane covering the tip of the probe.
13. Incubate the BOD solutions in darkness to prevent the release of oxygen by algae during photosynthesis.
14. Each test station should have one computer, one LapPro interface and one DO sensor. Provide paper towels at each station for wiping up water that overflows from the BOD bottle. The operation of the sensor should be checked each day before the start of class. A sample set of test results follow.
JBS Teacher MBL Manual Page - 100 -

JBS Teacher MBL Manual Page - 101 -

13.84.41.66
4.41.96.35
1.76.7
2.60.46.16.51.35.26.50,95.86.7
Total mg/L D.O.Difference72 Hour48 Hour AeratedDifference48 Hour24 Hour AeratedDifference24 Hour0 Hour Aerated
Experimental BottleControl BottleTime (Hours)Table 1. Dissolved Oxygen Readings (mg/L)
20
10
0
BOD
Change of BOD With Organic Matter
Control
Experimental
JBS Teacher MBL Manual Page - 102 -

LABORATORYINVESTIGATION
Biochemical Oxygen Demand - Teacher InstructionsIn investigation 20 students discover a relationship between decomposers (bacteria), organic
matter, and the level of oxygen in aquatic environments. Using closed systems evidence is gathered to show increasing amounts of organic matter is related to decreasing levels of dissolved oxygen.
Time One full laboratory period, 3 partial days. One period to discuss the experiment, to set up the experiment and to begin data collection. Three partial class periods to collect data and to disassemble the apparatus.
Vernier EquipmentDissolved oxygen sensor, LabPro interface
Materials Per laboratory team, goggles, aprons, 10 ml graduated cylinder, 2 BOD bottles with glass stoppers, aluminum foil to wrap the BOD bottles, milk, clean lake, river, or stream water, 2 nutrient buffer powder pillows, scissors, plastic milk container with cap.
SafetyStudents must wear safety glasses in the laboratory. The wearing of laboratory aprons is desirable.
Preparations1. Standard BOD tests are run at 20 degrees C. for 5 days. The procedure for this laboratory
assumes that the results obtained using an incubation temperature of 30 degrees Celsius for 3 days approximates the results one would obtain if standard conditions were used.
2. Some waters do not contain a sufficient population of bacteria to oxidize the organic matter added to the sample bottle. To avoid this problem add 1 gram of rich garden soil to 10 ml. of water. Shake the water and soil, then add 1 drop of the water from above the soil to the BOD bottle.
3. The nutrient buffer pillow is used to provide sufficient inorganic nutrients to support the growth of bacteria. It does not contribute to the BOD of the sample solution. Some waters, but not all, contain enough nutrient material that the buffer pillow is not required. Purchase powder pillows from Hach Chemicals.
4. The student laboratory guide calls for the addition of 5 ml. of milk to the water sample. This amount of organic material will produce a high BOD. Another choice is to assign different amounts of milk to each laboratory group. The BOD should vary depending on the amount of milk added to the water sample. Zero, one, two, three, four, and 5 ml. volumes are possible amounts of milk to add.
5. If the BOD is very high the dissolved oxygen level could fall below the 0.0 mg./L level before day 3. This possibility is prevented by measuring the DO level each day. Following the initial DO measurement the sample solution is aerated followed by a second DO measurement.
JBS Teacher MBL Manual Page - 103 -
The sample is then sealed and set aside for another 24 hours. The small errors introduced by this procedure will not alter the final results to any great degree.
6. BOD bottles (300 ml. ) with ground glass stoppers should be used with this experiment. Other bottles with screw caps could be used but care must be taken to avoid introducing an air bubble into the system when it is sealed.
7. Water for the experiment should be collected no more than one or two days before it is used. Store the water in a refrigerator until the day of the laboratory.
8. Used, but clean, plastic 1/2 gallon milk containers work well for shaking the water during aeration. Water containing milk may foam during shaking. Allow bubbles to break up before the BOD bottles containing milk are sealed.
9. The 30 degree incubation temperature is not critical but some form of temperature enhancement speeds bacterial growth and increases the biochemical oxygen demand.
10. Discuss with the students why it is necessary to wrap the BOD bottles in aluminum foil.
11. One dissolved oxygen sensor and one test station per class of 15 students is recommended. Students will be able to get the job done with one sensor in a reasonable amount of time. Using a single sensor also reduces the variation stemming from calibration errors of additional sensors.
12. Follow the instructions included with the dissolved oxygen sensor for its use and for checking its calibration. Students should be warned not to damage the membrane covering the tip of the probe.
13. Incubate the BOD solutions in darkness to prevent the release of oxygen by algae during photosynthesis.
14. Each test station should have one computer, one LapPro interface and one DO sensor. Provide paper towels at each station for wiping up water that overflows from the BOD bottle. The operation of the sensor should be checked each day before the start of class. A sample set of test results follow.
JBS Teacher MBL Manual Page - 104 -

JBS Teacher MBL Manual Page - 105 -

13.84.41.66
4.41.96.35
1.76.7
2.60.46.16.51.35.26.50,95.86.7
Total mg/L D.O.Difference72 Hour48 Hour AeratedDifference48 Hour24 Hour AeratedDifference24 Hour0 Hour Aerated
Experimental BottleControl BottleTime (Hours)Table 1. Dissolved Oxygen Readings (mg/L)
20
10
0
BOD
Change of BOD With Organic Matter
Control
Experimental
JBS Teacher MBL Manual Page - 106 -