maverick capital q4 2009 letter
TRANSCRIPT
Maverick Capital 300 Crescent Court 18th Floor Dallas, TX 75201 (214) 880-4000 Phone (214) 880-4020 Fax
Maverick
Maverick Performance Fourth Three Years Ten Years Since Since Quarter Year Ended Ended 3/1/95 3/1/95 Net Performance 2009 2009 12/31/09 12/31/09 Annualized Cumulative
Maverick Fund 3.7% 23.6% 5.0% 8.1% 14.2% 618.4% Maverick Levered 7.4 51.7 5.5 11.0 22.2 1,855.1 Maverick Neutral (0.5) (1.2) 5.6 5.8 10.3 327.0 Maverick Neutral Levered (0.9) (2.6) 9.0 8.1 16.1 814.8 Maverick Long 5.6 56.9 1.6 5.6 13.5 551.5 Maverick Long Enhanced 5.7 55.8 3.2 7.1 16.2 832.5 S&P 500 Index 6.0 26.5 (5.6) (0.9) 7.7 199.4 Morgan Stanley World Index 4.1 30.0 (5.6) (0.2) 6.1 140.7
The above results should only be read in conjunction with the Maverick Disclosure Statement found at the end of this letter.
February 5, 2010
Maverick Fund 2009 Year End Letter
A Decalogue of Canons for observation in practical life.
1) Never put off until to-morrow what you can do to-day. 2) Never trouble another for what you can do yourself. 3) Never spend your money before you have it. 4) Never buy what you don’t want, because it is cheap; it will be dear to you. 5) Pride costs us more than hunger, thirst and cold. 6) We never repent of having eaten too little. 7) Nothing is troublesome that we do willingly. 8) How much pain have cost us the evils which have never happened. 9) Take things always by the smooth handle. 10) When angry, count ten before you speak; if very angry, an hundred.
Thomas Jefferson, 1825
2
Like many graduates of the University of Virginia, I am an ardent admirer of Thomas Jefferson. My wife recently came across this list of “Jefferson’s Ten Rules”, as they have become known, which he included in a letter to his namesake, Thomas Jefferson Smith.1 While perhaps his “Decalogue of Canons” title proved a bit anachronistic, each of his rules strikes me as exceptionally apt and thoughtful today – even 185 years after they were penned. As referenced below, I believe a couple are particularly relevant to today’s investment environment.
Through the ups and downs of the tumultuous equity markets in 2009, Maverick Fund enjoyed a rewarding year. Maverick’s returns were strong in the US and in Japan last year, but disappointing in both Europe and emerging markets. From an industry perspective the technology and media & telecom sectors were significant contributors to our performance, and our credit, small cap and private equity efforts each generated terrific returns on smaller capital bases. Consumer and healthcare were the only industry sectors in which our returns were disappointing. As you may surmise, our long investments generated positive results in every industry and region in which we invest. We eked out slight gains in our short investments in Japan and the credit space, but otherwise shorting was extremely challenging last year.
As the above results of Maverick Long demonstrate, our long performance was quite strong on
both a relative and absolute basis and was the driver of Maverick’s core funds’ performance. However, the S&P 500 index did not provide very stiff competition last year, as it is a market-cap weighted index. As discussed below, in 2009 riskier stocks were far better performers, leaving behind more stable, large-cap companies. As a result, last year the average stock in the S&P 500 outperformed the index itself by an astounding 20% – the largest such outperformance in over forty years.
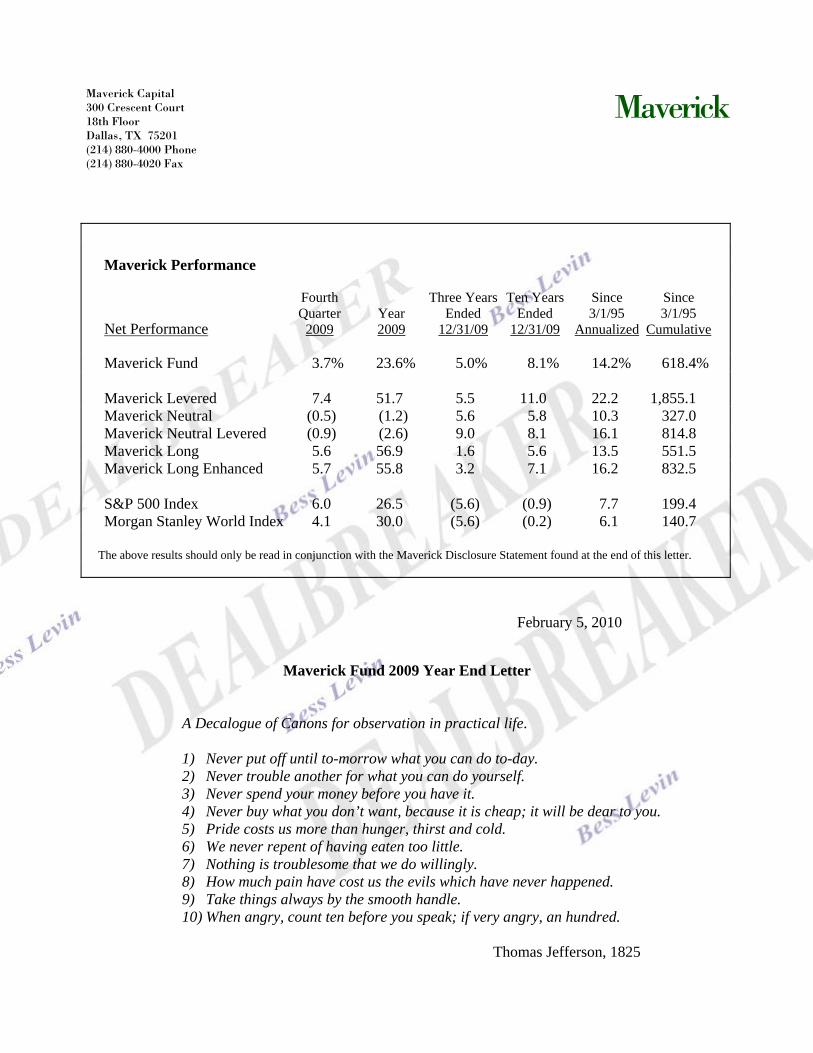
Throughout 2009 fundamental stock-picking was a challenging endeavor as equity markets
opened the year with the continuation of last year’s collapse (the S&P 500 index declined 25% from the beginning of the year through March 9th resulting in a total decline of 55% from October 9th, 2007) and subsequently exploded for the next ten months (the S&P 500 appreciated 68% from its March lows through year end.) As the first chart below shows, in 2008 more than 80% of equities around the world declined by more than 10% – the highest percentage in the last twenty years – reflecting the indiscriminate nature of the market decline. Likewise, the soaring markets of 2009 took most stocks along for the ride as you can see in the chart on the right.
% of Companies in the MSCI World Down 10% or more
0%
10%
20%
30%
40%
50%
60%
70%
80%
90%
100%
1990
1991
1992
1993
1994
1995
1996
1997
1998
1999
2000
2001
2002
2003
2004
2005
2006
2007
2008
2009
% of Companies in the MSCI World Up 10% or more
0%
10%
20%
30%
40%
50%
60%
70%
80%
1990
1991
1992
1993
1994
1995
1996
1997
1998
1999
2000
2001
2002
2003
2004
2005
2006
2007
2008
2009
1 I believe this is the first footnote I have used in seventeen years of writing these letters, but I found the opening of Jefferson’s letter sublime and wanted to share it with you: “This letter will, to you, be as one from the dead. The writer will be in the grave before you can weigh its counsels. Your affectionate and excellent father has requested that I would address to you something which might possibly have a favorable influence on the course of life you have to run, and I too, as a namesake, feel an interest in that course.”
3
Even more dramatically, 84% of the equities in the Morgan Stanley World index appreciated by this level over the last ten months of the year, which would be a higher percentage than any full year since 1958. The odds of facing another one-way market in 2010 are quite small, and having a more normal range of dispersion will be a welcome change for long/short equity investors.
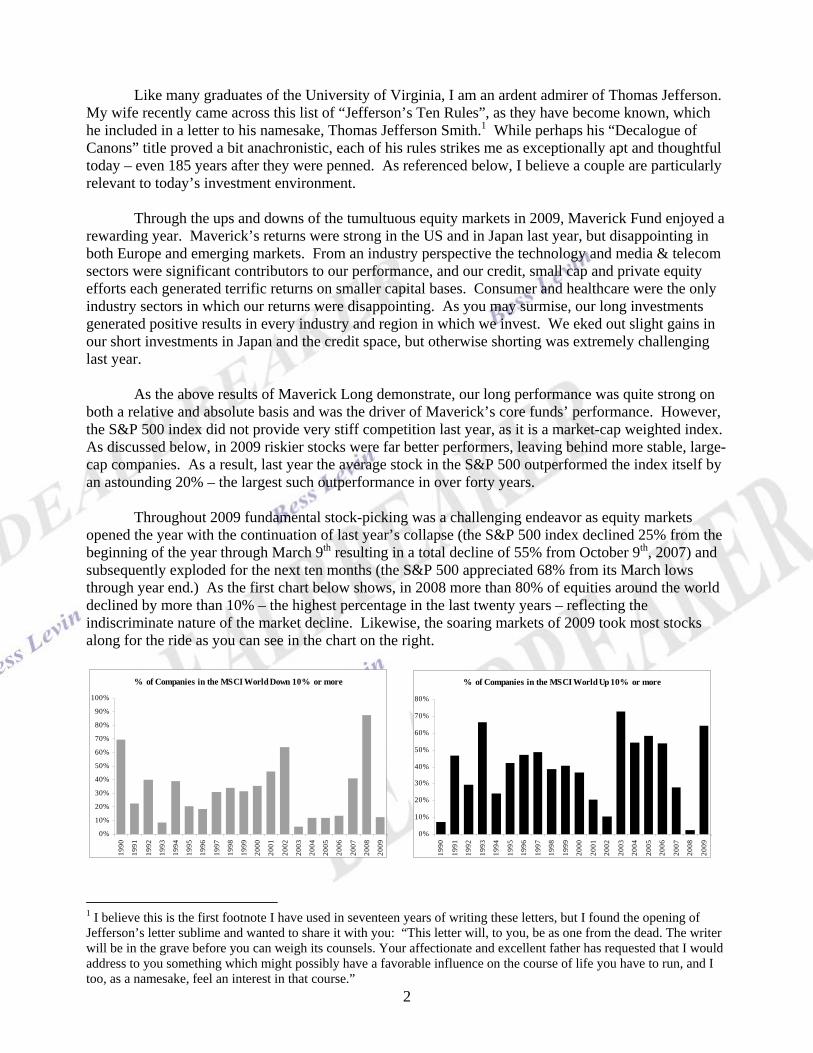
This lack of dispersion over the last couple of years can be demonstrated in several ways. The below chart shows the average multiple next year’s earnings of the 100 companies in the S&P 500 index with the highest growth rate compared to the average multiple of the 100 companies in the index with the lowest growth rates.
S&P 500: Average P/E of High and Low Growth Stocks
05
101520253035
90 92 94 96 98 00 02 04 06 08
Highest Growth Companies Lowest Growth Companies One would normally expect the higher-growth stocks to enjoy a significant valuation premium to the lowest-growth stocks, and over time that has certainly been the case. But in the unidirectional markets of 2008 and 2009, these rational valuation differences collapsed.
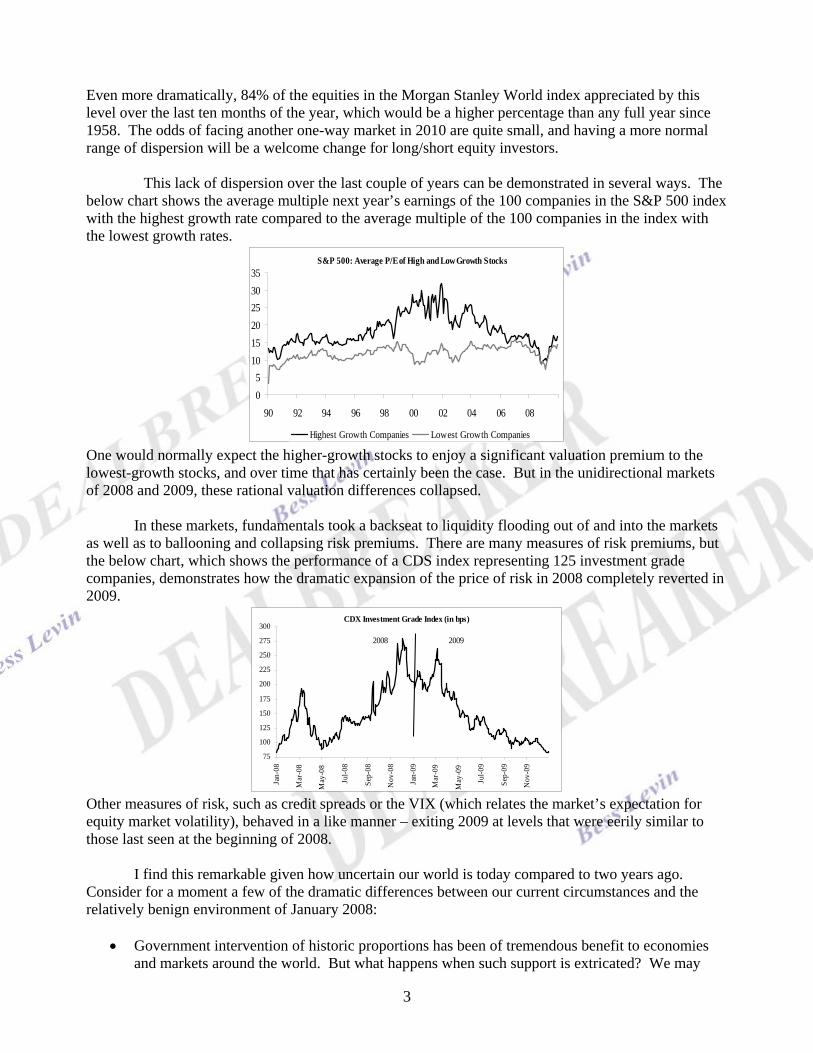
In these markets, fundamentals took a backseat to liquidity flooding out of and into the markets
as well as to ballooning and collapsing risk premiums. There are many measures of risk premiums, but the below chart, which shows the performance of a CDS index representing 125 investment grade companies, demonstrates how the dramatic expansion of the price of risk in 2008 completely reverted in 2009.
CDX Investment Grade Index (in bps)
75
100
125
150
175
200
225
250
275
300
Jan-
08
Mar
-08
May
-08
Jul-0
8
Sep-
08
Nov
-08
Jan-
09
Mar
-09
May
-09
Jul-0
9
Sep-
09
Nov
-09
2008 2009
Other measures of risk, such as credit spreads or the VIX (which relates the market’s expectation for equity market volatility), behaved in a like manner – exiting 2009 at levels that were eerily similar to those last seen at the beginning of 2008.
I find this remarkable given how uncertain our world is today compared to two years ago. Consider for a moment a few of the dramatic differences between our current circumstances and the relatively benign environment of January 2008:
• Government intervention of historic proportions has been of tremendous benefit to economies
and markets around the world. But what happens when such support is extricated? We may
4
soon have a test as GSE (Fannie Mae and Freddie Mac) mortgage-backed securities will no longer be purchased by the Fed as of March (although this deadline may well be pushed back). Mortgage rates are currently at all time lows, but if the largest purchaser of mortgages effectively disappears that may end quickly. Oh and by the way, US housing prices would likely then resume their tumble as a result. This is just one of a myriad of government programs and support mechanisms that exist around the world today.
• The regulatory environment is arguably now more unpredictable than anytime since the 1930’s
introducing an unprecedented level of uncertainty for a wide range of businesses. A few months ago it appeared that managed care companies may cease to exist as we know them. More recently proposals have been floated that could force major financial institutions to change their business models significantly – in some cases unwinding major portions of shotgun marriages that the same government strongly encouraged less than eighteen months ago.
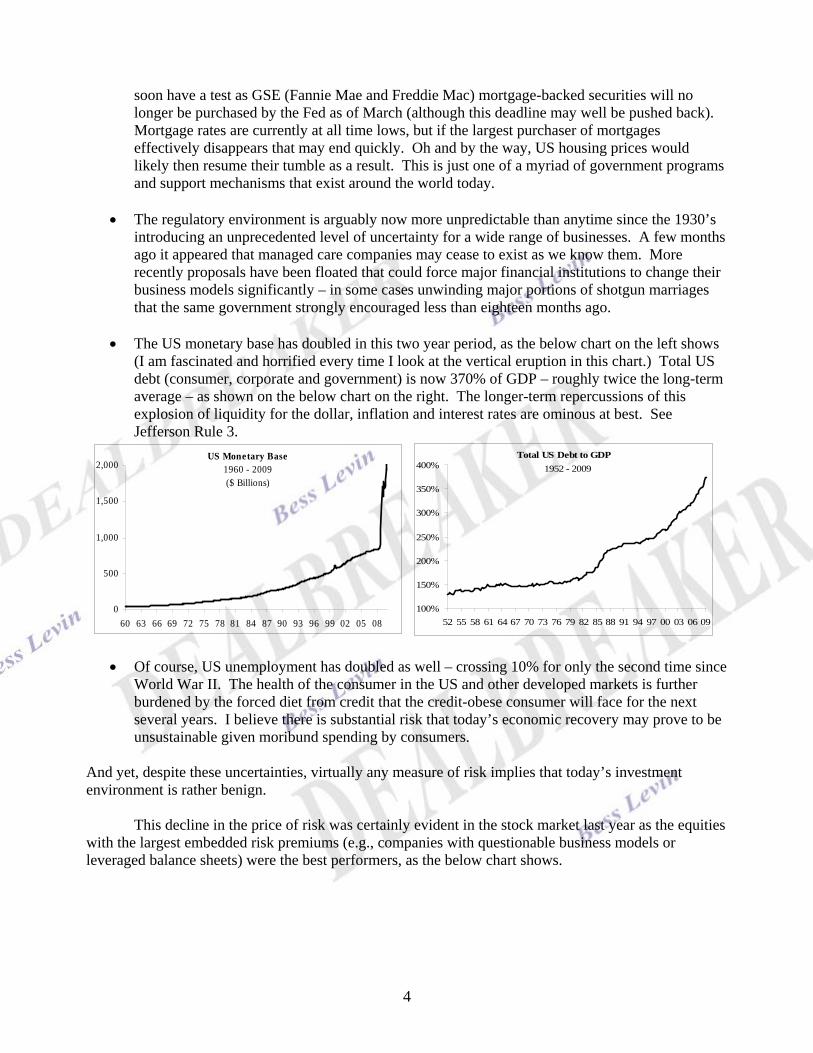
• The US monetary base has doubled in this two year period, as the below chart on the left shows
(I am fascinated and horrified every time I look at the vertical eruption in this chart.) Total US debt (consumer, corporate and government) is now 370% of GDP – roughly twice the long-term average – as shown on the below chart on the right. The longer-term repercussions of this explosion of liquidity for the dollar, inflation and interest rates are ominous at best. See Jefferson Rule 3.
US Monetary Base
0
500
1,000
1,500
2,000
60 63 66 69 72 75 78 81 84 87 90 93 96 99 02 05 08
1960 - 2009 ($ Billions)
Total US Debt to GDP
100%
150%
200%
250%
300%
350%
400%
52 55 58 61 64 67 70 73 76 79 82 85 88 91 94 97 00 03 06 09
1952 - 2009
• Of course, US unemployment has doubled as well – crossing 10% for only the second time since World War II. The health of the consumer in the US and other developed markets is further burdened by the forced diet from credit that the credit-obese consumer will face for the next several years. I believe there is substantial risk that today’s economic recovery may prove to be unsustainable given moribund spending by consumers.
And yet, despite these uncertainties, virtually any measure of risk implies that today’s investment environment is rather benign.
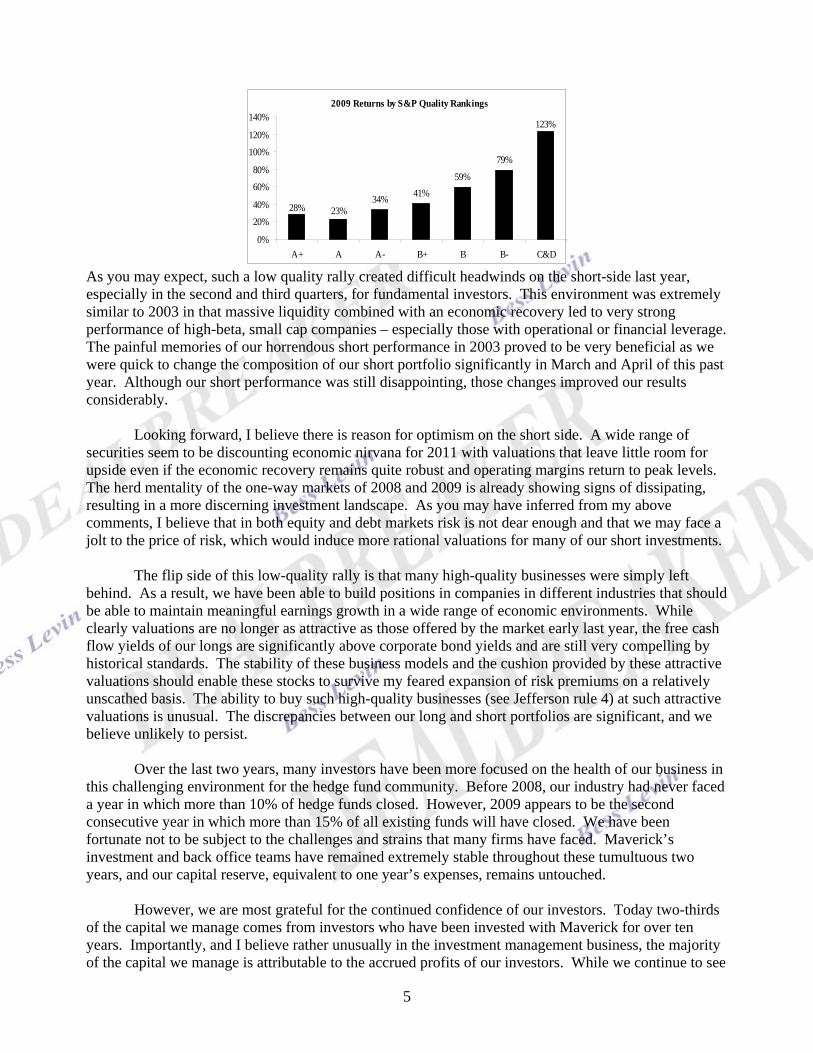
This decline in the price of risk was certainly evident in the stock market last year as the equities with the largest embedded risk premiums (e.g., companies with questionable business models or leveraged balance sheets) were the best performers, as the below chart shows.
5
2009 Returns by S&P Quality Rankings
41%59%
79%
123%
34%23%28%
0%
20%
40%
60%
80%
100%
120%
140%
A+ A A- B+ B B- C&D As you may expect, such a low quality rally created difficult headwinds on the short-side last year, especially in the second and third quarters, for fundamental investors. This environment was extremely similar to 2003 in that massive liquidity combined with an economic recovery led to very strong performance of high-beta, small cap companies – especially those with operational or financial leverage. The painful memories of our horrendous short performance in 2003 proved to be very beneficial as we were quick to change the composition of our short portfolio significantly in March and April of this past year. Although our short performance was still disappointing, those changes improved our results considerably.
Looking forward, I believe there is reason for optimism on the short side. A wide range of securities seem to be discounting economic nirvana for 2011 with valuations that leave little room for upside even if the economic recovery remains quite robust and operating margins return to peak levels. The herd mentality of the one-way markets of 2008 and 2009 is already showing signs of dissipating, resulting in a more discerning investment landscape. As you may have inferred from my above comments, I believe that in both equity and debt markets risk is not dear enough and that we may face a jolt to the price of risk, which would induce more rational valuations for many of our short investments.
The flip side of this low-quality rally is that many high-quality businesses were simply left
behind. As a result, we have been able to build positions in companies in different industries that should be able to maintain meaningful earnings growth in a wide range of economic environments. While clearly valuations are no longer as attractive as those offered by the market early last year, the free cash flow yields of our longs are significantly above corporate bond yields and are still very compelling by historical standards. The stability of these business models and the cushion provided by these attractive valuations should enable these stocks to survive my feared expansion of risk premiums on a relatively unscathed basis. The ability to buy such high-quality businesses (see Jefferson rule 4) at such attractive valuations is unusual. The discrepancies between our long and short portfolios are significant, and we believe unlikely to persist.
Over the last two years, many investors have been more focused on the health of our business in
this challenging environment for the hedge fund community. Before 2008, our industry had never faced a year in which more than 10% of hedge funds closed. However, 2009 appears to be the second consecutive year in which more than 15% of all existing funds will have closed. We have been fortunate not to be subject to the challenges and strains that many firms have faced. Maverick’s investment and back office teams have remained extremely stable throughout these tumultuous two years, and our capital reserve, equivalent to one year’s expenses, remains untouched.
However, we are most grateful for the continued confidence of our investors. Today two-thirds
of the capital we manage comes from investors who have been invested with Maverick for over ten years. Importantly, and I believe rather unusually in the investment management business, the majority of the capital we manage is attributable to the accrued profits of our investors. While we continue to see
6
strong demand from institutional investors, our funds have not accepted contributions in excess of redemptions in over a decade. This discipline has led to unusual stability in our asset base that we believe is a critical advantage in our investment activities.
One of Maverick’s greatest strengths is the fact that the senior leaders of our investment and
back office efforts are equity owners of the firm, creating an alignment of interests that has proven both fruitful and durable. This year Bates Brown, who runs Maverick Stable, Donald Devine, who heads our trading efforts, and Alex Rafal, who serves as Co-Sector Head of the consumer team, have each joined the partnership, bringing the total number of Partners to eighteen. Each of these three individuals consistently live up to Mr. Jefferson’s canons (o.k., maybe not the “eaten too little” or the “smooth handle” ones) and have made significant contributions to Maverick over the years.
Since 1993 our letters have always included a table showing Maverick’s industry and regional
exposures. However, we have decided instead to attach more comprehensive disclosure regarding our exposures, performance and other statistics that we believe you will find helpful in evaluating and understanding our portfolio. If you have any questions regarding this disclosure, or further suggestions for this disclosure, please be quick to let us know. Finally, I hope you will be able to join us in New York for our 17th Annual Meeting this year on Thursday, October 21st. As always, I ask that you please call me if you have any thoughts that you would like to discuss.
Sincerely,
Lee S. Ainslie III
Managing Partner
MAVERICK DISCLOSURE STATEMENT
All performance figures shown are calculated by Maverick Capital, Ltd., investment manager of each of Maverick Fund USA, Ltd. ("USA"), Maverick Fund, L.D.C. ("LDC"), Maverick Fund II, Ltd. ("Levered"), Maverick Neutral Fund, Ltd. ("Neutral"), Maverick Neutral Levered Fund, Ltd. ("Neutral Levered"), Maverick Long Fund, Ltd. ("Long") and Maverick Long Enhanced Fund, Ltd. ("Long Enhanced") (collectively, the "Portfolio Funds"). Investment in the Portfolio Funds (other than USA) is effected through investment in intermediate investment vehicles. In addition to managing the Portfolio Funds, Maverick Capital, Ltd. also manages a fund of funds, Maverick Stable, and certain separately managed accounts.
Unless otherwise indicated, Maverick returns are those of Hedged Equity Strategy ("HES") which became the total management style of USA and LDC as of March 1, 1995. The portfolios of Levered, Neutral, Neutral Levered, Long and Long Enhanced are comprised substantially of the same asset allocations as HES, weighted in accordance with the respective fund's long/short exposure targets. Neutral, Neutral Levered, Long and Long Enhanced do not participate in private or credit investments. Neutral and Long generally do not incur substantial amounts of margin debt. USA, LDC, Levered, Neutral Levered and Long Enhanced incur margin debt in varying amounts as described in their respective Offering Memoranda. While the "investment mix" of the Funds may change over time, they have never been limited as to a specific type, quality or quantity of investment in which they may invest.
Net returns for the Funds (unless noted otherwise) are for March 1, 1995 through December 31, 2009. The returns of each of the Funds are computed on a time-weighted total return basis and include the reinvestment of all income derived from, and gains from the sale of, assets in the Funds' underlying portfolios. Ernst & Young LLP has audited the financial statements of USA, LDC, Neutral, Neutral Levered, Long and their respective gross monthly and net year-to-date returns from commencement of operations through December 2008. Ernst & Young LLP has audited Levered’s financial statements and its intermediate investment vehicles from commencement of operations through June 2009, and has examined their gross monthly and net year-to-date returns through that date. Ernst & Young LLP has audited the financial statements and gross returns of Long Enhanced and its offshore investment vehicle through June 2009. Except as stated, data contained herein is unaudited. Performance, exposure and portfolio information relates to HES unless otherwise indicated.
Unless otherwise indicated, net returns shown for the Funds reflect the deduction of all operational expenses (including brokerage commissions) and for the Funds other than Long Enhanced, a 1.5% management fee calculated on invested equity (including the proceeds of actual or deemed borrowings as described in the relevant Offering Memoranda) and, for the Funds other than Long and Long Enhanced, a 15% performance allocation calculated on net profits (also as described in the Offering Memoranda). In the case of Long Enhanced, unless otherwise indicated, the management fee is 1% and performance allocations are calculated at a rate of 10% of net profits in excess of a return equal to the average of the S&P 500 and the MS World Indices (as defined below). Performance allocations for the Funds are only charged on net profits in excess of losses from any prior period. Net returns would be reduced from those shown if an investor selected alternative fee structures offering greater liquidity at higher fee levels. Actual returns will vary from one investor to the next taking into consideration factors described in the respective Funds' Offering Memoranda. For example, annualized returns for the Funds other than Long and Long Enhanced from March 1, 1995 through December 31, 2009 reflecting a 2% management fee and a 20% performance allocation or fee are: Maverick 12.9%; Levered 19.6%; Neutral 9.2%; Neutral Levered 14.0%; the annualized returns for Long and Long Enhanced for the same period reflecting a 1% management fee and a 20% performance fee charged on net profits in excess of a return equal to the average of the Indices are: Long 12.6%; Long Enhanced 15.2%. Net returns of the funds and HES for other periods and under different fee assumptions are available upon request.
Levered commenced operations on July 1, 1998, and its performance returns related to periods commencing prior to July 1, 1998 are modeled by Maverick Capital, Ltd. on results of the HES portfolio for the period through June 30, 1998 and the actual experience of Levered for the remainder of the period indicated. Levered return data assumes estimated interest expense associated with modeled borrowings for the period through June 30, 1998 and actual interest expense associated with Leverage Feature borrowing (as described in the related Offering Memoranda) for the remainder of the period indicated. Neutral, Neutral Levered and Long commenced operations on January 1, 2005, and their return data is based on results for corresponding segments of the HES portfolio for the period through December 31, 2004 and the actual results of the respective fund for the remainder of the period indicated. Neutral Levered return data assumes estimated interest expense on modeled borrowings equal to investor capital for the period through December 31, 2004 and the interest expense on fund borrowings (as described in the related Offering Memoranda) for the remainder of the period indicated. Although Long Enhanced commenced operations on July 1, 2005, it changed its long/short exposure targets and fee structure as of October 1, 2007; its return data is based on results for corresponding segments of the HES portfolio for the period through September 30, 2007, adjusted to reflect its revised exposure targets and fee structure, and its actual results for the remainder of the period indicated.
The S&P 500 Index and the MS World Index (together, the "Indices"), are generally considered appropriate benchmarks for various equity markets. The S&P 500 Index assumes dividends are reinvested unless otherwise noted. The MS World Index is the MSCI World Daily Total Return Index (USD with dividends reinvested after deduction of applicable withholding taxes). The Funds' portfolio of securities varies significantly from those in the Indices. Accordingly, comparing the results shown to the Indices may be of limited use.
Maverick Capital, Ltd. makes no representation, and it should not be assumed, that future investment performance will conform to past performance. Additionally, there is the possibility for loss when investing in the Funds.