matilda larsson - diva-portal.org280838/fulltext01.pdf · matilda larsson doctoral thesis division...
TRANSCRIPT
QUANTIFICATION AND VISUALIZATION
OF CARDIOVASCULAR FUNCTION
USING ULTRASOUND
Matilda Larsson
Doctoral Thesis
Division of Medical Engineering,
School of Technology and Health,
Royal Institute of Technology

Trita-STH Report 2009:6 ISSN: 1653-3836 ISRN: KTH/STH/--09:6--SE ISBN: 978-91-7415-524-2
© Matilda Larsson, Stockholm, 2009
i
PREFACE
This thesis is submitted to the KTH (Royal Institute of Technology) in partial fulfillment of the requirement for the Doctoral degree in Technology. The work has mainly been performed at KTH, School of Technology and Health in Huddinge, Sweden, with Professor Lars-Åke Brodin (KTH) as main supervisor and MD. PhD Reidar Winter from the Department of Clinical Physiology, Karolinska University Hospital, Huddinge, Sweden as co-supervisor. One semester was spent at the Department of Cardiovascular Diseases, Catholic University of Leuven, Belgium, where Study V was performed supervised by Professor Jan D’hooge. The research project was supported by grants from the Swedish Heart Lung Foundation, Swedish Society for Medical Research and the Knut and Alice Wallenberg Foundation. The thesis will be publically defended at 8:30, 22 January 2010 in the lecture hall 3-221, Alfred Nobels Allé 10, Huddinge, Sweden.

ii
iii
ABSTRACT
There is a large need for accurate methods detecting cardiovascular diseases, since they are one of the leading causes of mortality in the world, accounting for 29.3% of all deaths. Due to the complexity of the cardiovascular system, it is very challenging to develop methods for quantification of its function in order to diagnose, prevent and treat cardiovascular diseases. Ultrasound is a technique allowing for inexpensive, noninvasive imaging, but requires an experienced echocardiographer. Nowadays, methods like Tissue Doppler imaging (TDI) and Speckle tracking imaging (STI), measuring motion and deformation in the myocardium and the vessel walls, are getting more common in routine clinical practice, but without a proper visualization of the data provided by these methods, they are time-consuming and difficult to interpret. Thus, the general aim of this thesis was to develop novel ultrasound-based methods for accurate quantification and easily interpretable visualization of cardiovascular function.
Five methods based on TDI and STI were developed in the present studies. The first study comprised development of a method for generation of bull’s-eye plots providing a color-coded two-dimensional visualization of myocardial longitudinal velocities. The second study proposed the state diagram of the heart as a new circular visualization tool for cardiac mechanics, including segmental color-coding of cardiac time intervals. The third study included development of a method describing the rotation pattern of the left ventricle by calculating rotation axes at different levels of the left ventricle throughout the cardiac cycle. In the fourth study, deformation data from the artery wall were tested as input to wave intensity analysis providing information of the ventricular – arterial interaction. The fifth study included an in-silico feasibility study to test the assessment of both radial and longitudinal strain in a kinematic model of the carotid artery.
The studies showed promising results indicating that the methods have potential for the detection of different cardiovascular diseases and are feasible for use in the clinical setting. However, further development of the methods and both quantitative comparison of user dependency, accuracy and ease of use with other established methods evaluating cardiovascular function, as well as additional testing of the clinical potential in larger study populations, are needed.
Keywords: Ultrasound, Tissue Doppler imaging, Speckle tracking imaging, cardiovascular function, visualization, quantification

iv

v
ACKNOWLEDGMENT
The acknowledgment is the most important and fun part of this thesis, since this is where I have the opportunity to thank all wonderful people, who have contributed to make this thesis possible. I want to start to thank Anna Bjällmark, my friend and stable-mate. I think none of us could imagine that we would end up side by side in doctor hats when our friendship started some years ago by drinking Sturm and eating curved fries at Molly Malone’s in Graz. It has been a great pleasure for me to work with you during these years and your contributions are a great part of this thesis. Thank you for many funny times both at work and in life outside of work, for your support, for being such a good friend and for the fun conference trips. I could never be grateful enough to you!
I would like to express my sincere gratitude and appreciation to Lars-Åke Brodin, my main supervisor, for believing in me, introducing me to a very interesting research area and providing me with work that has been important for my development and progress as a researcher. Thank you for always being kind and caring, seeing solutions instead of problems and for your ability to share your excitement and visions about science. I am also very grateful to Reidar Winter, my co-supervisor who, despite his busy schedule, always has time to read and discuss my work and give a clinical perspective to my research. The greatest of thanks for all the help with writing this thesis!
I wish to thank Mattias for being a good friend and person to work with. Thank you for exciting discussions, many clever answers and for providing champagne for my birthday. Special thanks also to Frida, Dennis, Nina and to all other friends and colleges at ANA 10 for your support during the years and for creating a wonderful atmosphere at work! Michael Peolsson, thank you for introducing me to KTH and for being always supportive. Britta Lind, thank you for sharing your expertise in ultrasound imaging and for being a funny friend and travel mate. I also want to thank Kambiz Shahgaldi, Aristomenis Manouras and Jacek Nowak for their contributions and interest in my research and for being such nice travel company. I am thankful for administrative help from Gunilla, Karl-Erik and Monika and I am most grateful to Peta Sjölander who kindly helped me to improve my written English and guided me in the jungle of research foundations.
I also wish to thank Jan D’hooge for an inspiring collaboration and for kindly welcoming me to your research group in Leuven. I am impressed at how you always have time for everybody, including me; encouraging and motivating your students to perform a good job. Further I want to thank all colleges

vi
in the Lab on cardiovascular imaging & dynamics in Leuven for a friendly working environment and funny lab drinks. Especially, I want to send warm thanks to Florence Kremer for being available to help me all the time, always taking care of me and for being a good friend at work every day. My time in Leuven would not have been the same without you!
I want to direct a warm thank you to Stig Lundbäck for making us laugh, for your never ending energy and for always being so enthusiastic and full of ideas. Special thanks also to Jonas Johnson for your technical guidance and for all your support and friendship during the years, to Shirley and Marcelo for the incredible working days we spent in Brazil, to Torbjörn Falkmer for introducing me to research, helping me to take the first steps to become a PhD-student and for a fantastic trip to South-Africa, and to Ulf Gustafsson for an inspiring and enjoyable collaboration with Paper III and for always being positive and friendly. Warm thanks also to Anders Waldenström and Per Lindqvist, co-authors of Paper III.
Many thanks also to Malin, Johan, Isabel, Martin and Mattias for all valuable comments and advice to improve my thesis and to Daniele for all help with the figures to my thesis, merci beaucoup!
Finally, my thanks go to my beloved family, relatives and friends. To my parents, Kersti and Per-Arne, for your love, abundant support and for always letting me realize my crazy ideas. To my brother Martin and sister Malin, for always being there for me when I need you. To you, and to all my friends, thank you for many enjoyable moments!
Lieber Daniele, thank you for being you and for all your love, encouragement and support.
Matilda Larsson,
Östervåla, 8 November 2009

vii
ABBREVIATIONS
2D Two-dimensional
3D Three-dimensional
2CH Apical two-chamber view
4HC Apical four-chamber view
3CH/APLAX Apical long-axis view
A’ Late diastolic tissue velocity
AV Atrioventricular
AVC Aortic valve closure
AVO Aortic valve opening
A-wave Atrial diastolic wave
CAD Coronary artery disease
CCA Common carotid artery
CFM Color Flow Mapping
CV Coefficient of variation
CW Continuous wave
E Early diastolic blood flow velocity
E’ Early diastolic tissue velocity
ECG Electrocardiogram
EF Ejection fraction
E-wave Early diastolic wave
viii
IMT Intima-media thickness
IVCT Isovolumic contraction time
IVRT Isovolumic relaxation time
LAD Left anterior descending coronary artery
LCX Left circumflex coronary artery
LV Left ventricle
MRI Magnetic resonance imaging
MVO Mitral valve opening
NA Negative area
NSTEMI Non-ST Segment Elevation Myocardial Infarction
PSF Point spread function
PSV Peak systolic tissue velocity
PW Pulsed wave
RCA Right coronary artery
RF Radiofrequency
RMS Root mean square
ROI Region of interest
RV Right ventricle
SAD Sum of absolute differences
SD Standard deviation
STI Speckle tracking imaging
TDI Tissue Doppler imaging
VeT Velocity tracking
WI Wave intensity
WIWA Wave Intensity Wall Analysis
WMSI Wall motion score index

ix
TABLE OF CONTENTS
Preface ................................................................................................................... i
Abstract ............................................................................................................... iii
Acknowledgment .................................................................................................. v
Abbreviations ..................................................................................................... vii
Table of Contents ................................................................................................. ix
1 Introduction .................................................................................................... 1 1.1 Thesis outlook ......................................................................................................................... 3
2 Aims ............................................................................................................... 5
3 List of included papers ................................................................................... 7
4 The cardiovascular system .............................................................................. 9 4.1 Anatomy of the heart ............................................................................................................... 9 4.2 The cardiac cycle ................................................................................................................... 10 4.3 Cardiac pumping function ..................................................................................................... 11 4.4 Vascular anatomy and function ............................................................................................. 12 4.5 Coronary artery disease ......................................................................................................... 13 4.6 Heart failure ........................................................................................................................... 14
5 Ultrasound imaging ...................................................................................... 15 5.1 Ultrasound ............................................................................................................................. 15 5.2 The pulse-echo technique ...................................................................................................... 15
x
5.3 The imaging system .............................................................................................................. 16 5.4 Quantification of motion and deformation using ultrasound ................................................ 18
6 Evaluation of cardiovascular function .......................................................... 23 6.1 Cardiovascular ultrasound ..................................................................................................... 23 6.2 Evaluation of cardiac function .............................................................................................. 24 6.3 Evaluation of vascular function ............................................................................................. 27 6.4 Ventricular-arterial coupling ................................................................................................. 30
7 Methodology ................................................................................................. 33 7.1 Study subjects ........................................................................................................................ 33 7.2 Image acquisition .................................................................................................................. 34 7.3 Offline analysis ..................................................................................................................... 35 7.4 Software development ........................................................................................................... 36 7.5 Simulation of ultrasound images ........................................................................................... 36 7.6 Statistical analysis ................................................................................................................. 37
8 Contributions ................................................................................................ 39 8.1 Ultrasound-based methods for the quantification and visualization of cardiac function ...... 39 8.2 Ultrasound-based methods for the quantification of vascular function and ventricular-
arterial coupling ..................................................................................................................... 46 8.3 Division of work between authors ........................................................................................ 48
9 Discussion .................................................................................................... 49 9.1 Velocity Tracking .................................................................................................................. 50 9.2 State diagrams of the heart .................................................................................................... 51 9.3 Rotation pattern of the left ventricle ..................................................................................... 52 9.4 Wave Intensity Wall Analysis ............................................................................................... 53 9.5 Strain assessment in the carotid artery .................................................................................. 55 9.6 General limitations ................................................................................................................ 56 9.7 Future potential of the developed methods ........................................................................... 57
10 Conclusions ................................................................................................ 59
11 Future work ................................................................................................ 61
12 Other scientific contributions ..................................................................... 63
13 References .................................................................................................. 65
1
1 INTRODUCTION
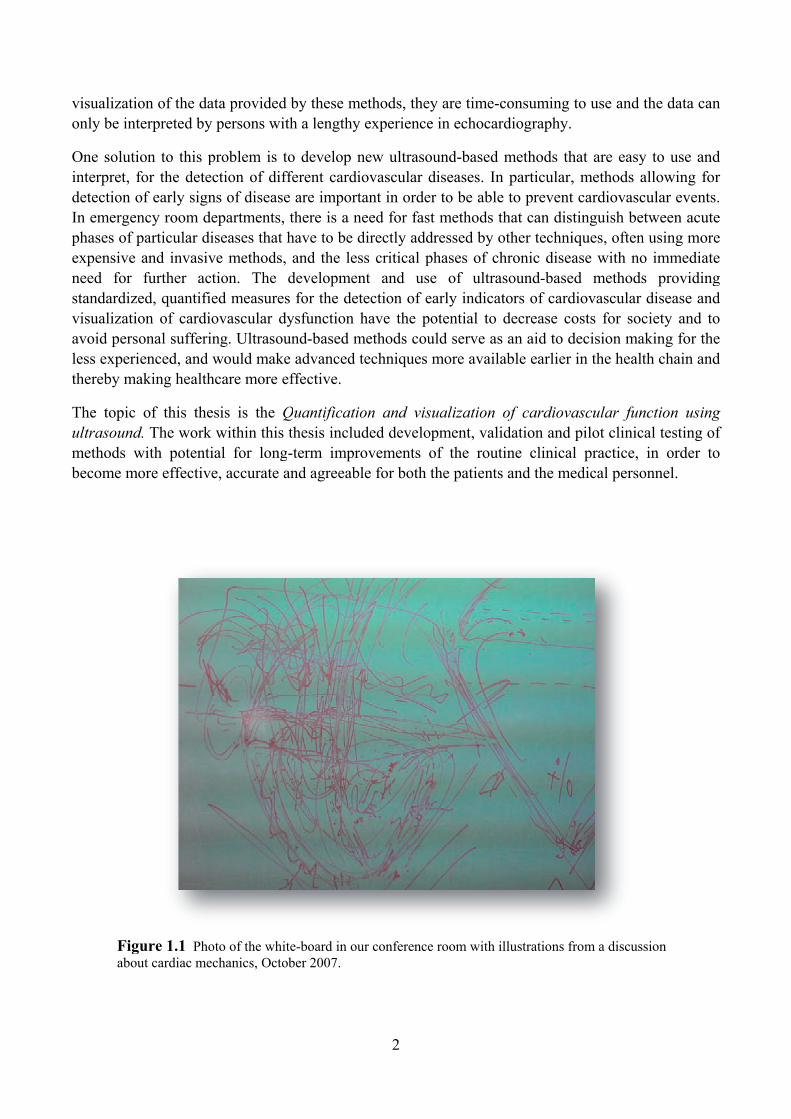
I wish to start this thesis referring to a photo of the white-board in our conference room (Figure 1.1). The illustration in the photo, which is taken after one of several long and intensive discussions about cardiovascular mechanics, looks chaotic and very complex. I believe I can with certainty claim that this is not only the case for our discussions, but also for the understanding of cardiovascular mechanics in general. The cardiovascular system is complex. This complexity has frequently been addressed in the literature and depends foremost on multiple regulatory mechanisms and both linear and nonlinear relationships among a large number of cardiovascular variables [1]. There is a considerable amount of publications in this field and cardiac mechanics and the pumping function of the heart have been differently described over the years. However, the function of this substantial organ, which averagely has to perform over 100.000 heartbeats every day and in total pump more than 400 million liters of blood during a lifetime without any rest, is still not fully understood [2].
Since cardiovascular disease is one of the leading causes of mortality in the world, accounting for 29.3% of all deaths [3], there is a large need for quantitative and accurate methods for the early detection of cardiovascular diseases. In developed countries, ischemic heart disease and cerebrovascular disease are together responsible for 36% of all deaths [4]. Moreover, the mortality and burden resulting from cardiovascular diseases are rapidly increasing in developing regions and population growth, ageing and globalized lifestyle changes combine to make cardiovascular disease an increasingly important cause of morbidity and mortality [5].
Due to the complexity of the cardiovascular system, it is very challenging to develop methods for quantification of its function in order to diagnose, prevent and treat cardiovascular diseases. Ultrasound is a technique allowing for inexpensive, noninvasive imaging of the heart and the vessels. The technique was applied to cardiac applications for the first time in 1954 by Edler and Hertz [6], and has during recent years, grown in importance within cardiovascular imaging. Traditionally, a diagnosis was obtained by the visual interpretation of gray-scale sequences. Nowadays, methods like Tissue Doppler imaging (TDI) and Speckle tracking imaging (STI), measuring motion and deformation in the myocardium and the vessel walls, are getting more common in routine clinical practice. This leads to a decreased user dependency but gives us a large set of parameters that are difficult to overview. First, the most important data have to be extracted from the large number of different signals, and then they must be visualized in an easily interpretable way. Without a proper
visualizatioonly be inte
One solutiointerpret, fodetection oIn emergenphases of pexpensive aneed for standardizevisualizatioavoid persoless experiethereby ma
The topic ultrasound.methods wbecome mo
Figuabou
on of the daterpreted by
on to this por the detecf early sign
ncy room departicular diand invasivfurther act
ed, quantifieon of cardioonal sufferinenced, and waking health
of this thes. The work
with potentiore effective
ure 1.1 Phout cardiac mec
ta providedpersons wit
problem is tction of dif
ns of diseaseepartments, seases that
ve methods,tion. The ed measuresovascular dng. Ultrasouwould makecare more e
sis is the Qwithin this al for longe, accurate a
to of the whitchanics, Octo
d by these mth a lengthy
to develop nfferent cardie are importthere is a nhave to be and the ledevelopmes for the de
dysfunction und-based me advanced effective.
Quantificatithesis inclu
g-term imprand agreeab
te-board in ouober 2007.
2
methods, they experience
new ultrasoiovascular dtant in ordeneed for fasdirectly addss critical pnt and us
etection of ehave the p
methods coutechniques
ion and visuded develorovements ble for both
ur conference
ey are time-ce in echocar
ound-baseddiseases. In
er to be ablest methods tdressed by ophases of chse of ultraearly indicapotential to uld serve asmore availa
sualization opment, valiof the routthe patients
e room with i
consuming rdiography.
methods thn particular,e to preventthat can disother technihronic disea
asound-baseators of card
decrease cos an aid to dable earlier
of cardiovaidation and tine clinicas and the me
illustrations f
to use and
hat are easy, methods at cardiovasctinguish beiques, oftenase with no
ed methodsdiovascular osts for socdecision main the healt
ascular funpilot clinic
al practice, edical perso
from a discus
the data can
y to use andallowing forcular eventstween acute
n using moreo immediates providingdisease and
ciety and toaking for theth chain and
nction usingcal testing o
in order toonnel.
sion
n
d r
s. e e e g d o e d
g f o

3
1.1 Thesis outlook
The thesis is organized into 13 chapters followed by the five included papers, on which this thesis is based on. After this short introduction, the aims are stated. Thereafter, the list of included papers is presented. The cardiovascular system and the techniques that have been used during this thesis work are described in Chapters 4 and 5. Chapter 6 provides a literature review of methods to evaluate cardiovascular function. The following two chapters, Chapters 7 and 8, present used methodologies and research contributions within this thesis work. The results from the studies are discussed in Chapter 9 and the conclusions are presented in Chapter 10. Finally, future work, other scientific contributions by the author and references are presented.

4
5
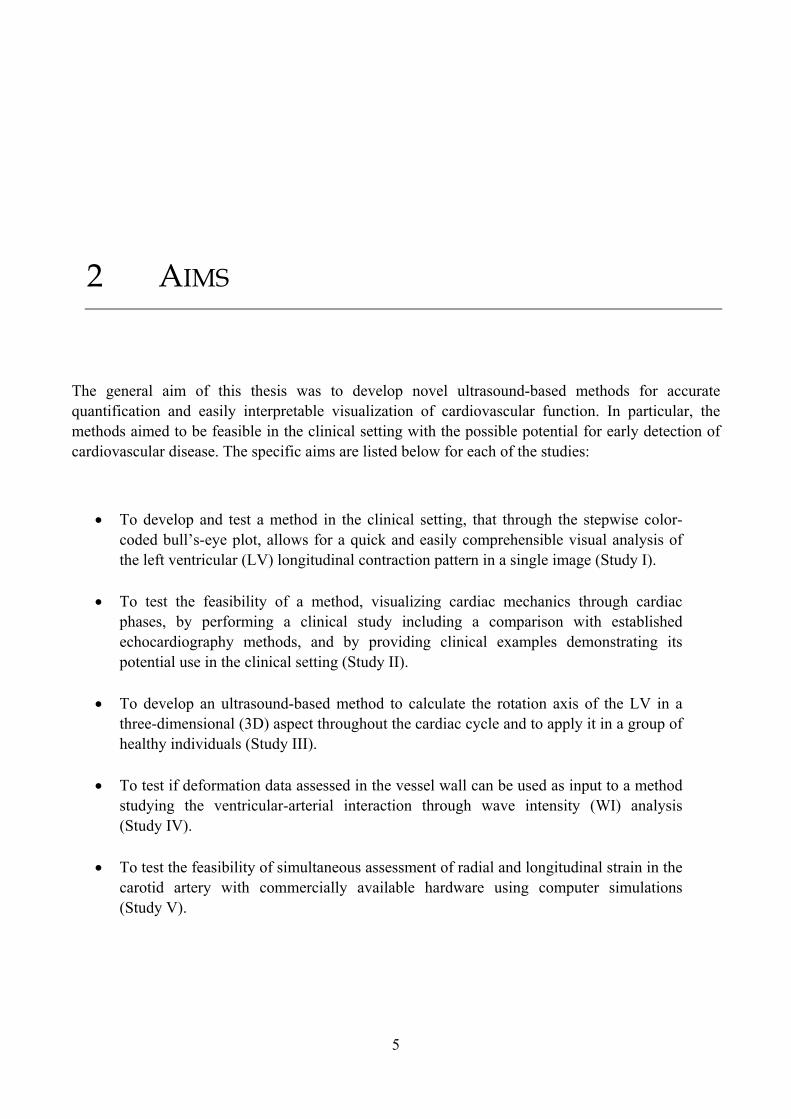
2 AIMS
The general aim of this thesis was to develop novel ultrasound-based methods for accurate quantification and easily interpretable visualization of cardiovascular function. In particular, the methods aimed to be feasible in the clinical setting with the possible potential for early detection of cardiovascular disease. The specific aims are listed below for each of the studies:
• To develop and test a method in the clinical setting, that through the stepwise color-coded bull’s-eye plot, allows for a quick and easily comprehensible visual analysis of the left ventricular (LV) longitudinal contraction pattern in a single image (Study I).
• To test the feasibility of a method, visualizing cardiac mechanics through cardiac phases, by performing a clinical study including a comparison with established echocardiography methods, and by providing clinical examples demonstrating its potential use in the clinical setting (Study II).
• To develop an ultrasound-based method to calculate the rotation axis of the LV in a three-dimensional (3D) aspect throughout the cardiac cycle and to apply it in a group of healthy individuals (Study III).
• To test if deformation data assessed in the vessel wall can be used as input to a method studying the ventricular-arterial interaction through wave intensity (WI) analysis (Study IV).
• To test the feasibility of simultaneous assessment of radial and longitudinal strain in the carotid artery with commercially available hardware using computer simulations (Study V).

6

7
3 LIST OF INCLUDED PAPERS
The thesis is based on the five following papers. The papers and the study conducted in each paper will be referred to by their Roman numerals. The papers in their full format are attached as appendices at the end of the thesis.
I. Velocity tracking – a novel method for quantitative analysis of longitudinal myocardial function. A. Bjällmark, M. Larsson, R. Winter, C. Westholm, P. Jacobsen, B. Lind, L. Å. Brodin. Journal of the American Society of Echocardiography, vol 7, pp. 847-56, 2007.
II. State diagrams of the heart - a new approach to describing cardiac
mechanics. M. Larsson, A. Bjällmark, J. Johnson, R. Winter, L. Å. Brodin, S. Lundbäck. Cardiovascular Ultrasound, vol 7:22, 2009.
III. The rotation axis of the left ventricle - A new concept derived from
ultrasound data in healthy individuals. U. Gustafsson, M. Larsson, P. Lindquist, L. Å. Brodin, A. Waldenström, manuscript.
IV. Wave Intensity Wall Analysis – a novel noninvasive method to
measure Wave Intensity. M. Larsson, A. Bjällmark, B. Lind, R. Balzano, M. Peolsson, R. Winter, L. Å. Brodin. Heart and Vessels, vol 24, pp. 357–365, 2009.
V. Ultrasound-based 2D Strain Estimation of the Carotid Artery: an
in-silico feasibility study, M. Larsson, F. Kremer, P. Claus, L. Å. Brodin, J. D’hooge. Conference proceedings at Ultrasonics Symposium IEEE 2009, Rome.

8
9
4 THE CARDIOVASCULAR SYSTEM
This chapter contains an overview of the anatomy and the function of the cardiovascular system and provides brief descriptions of some of the most common cardiovascular diseases, all of which occur in the study populations included in this thesis. The cardiovascular system consists of the heart, blood vessels and blood, and is responsible for the transportation of gases, nutrients, hormones and blood cells throughout the body. Additional functions of the cardiovascular system are to regulate body temperature and acid-base balance.
4.1 Anatomy of the heart
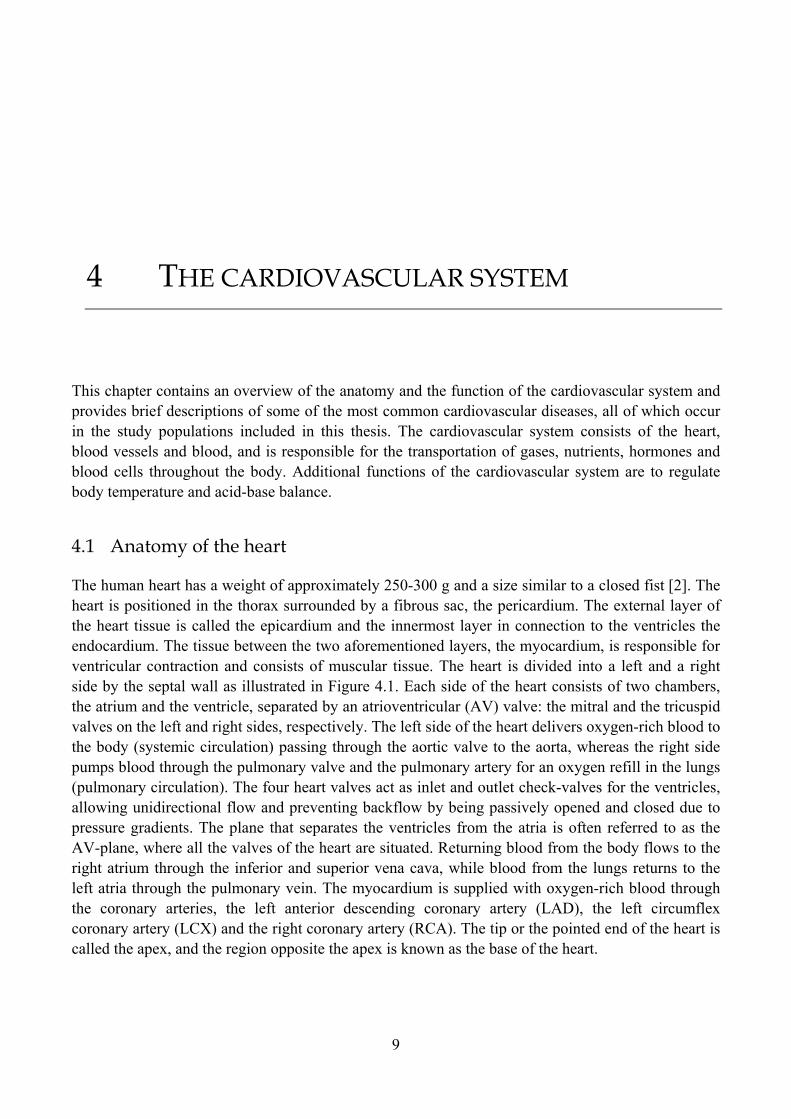
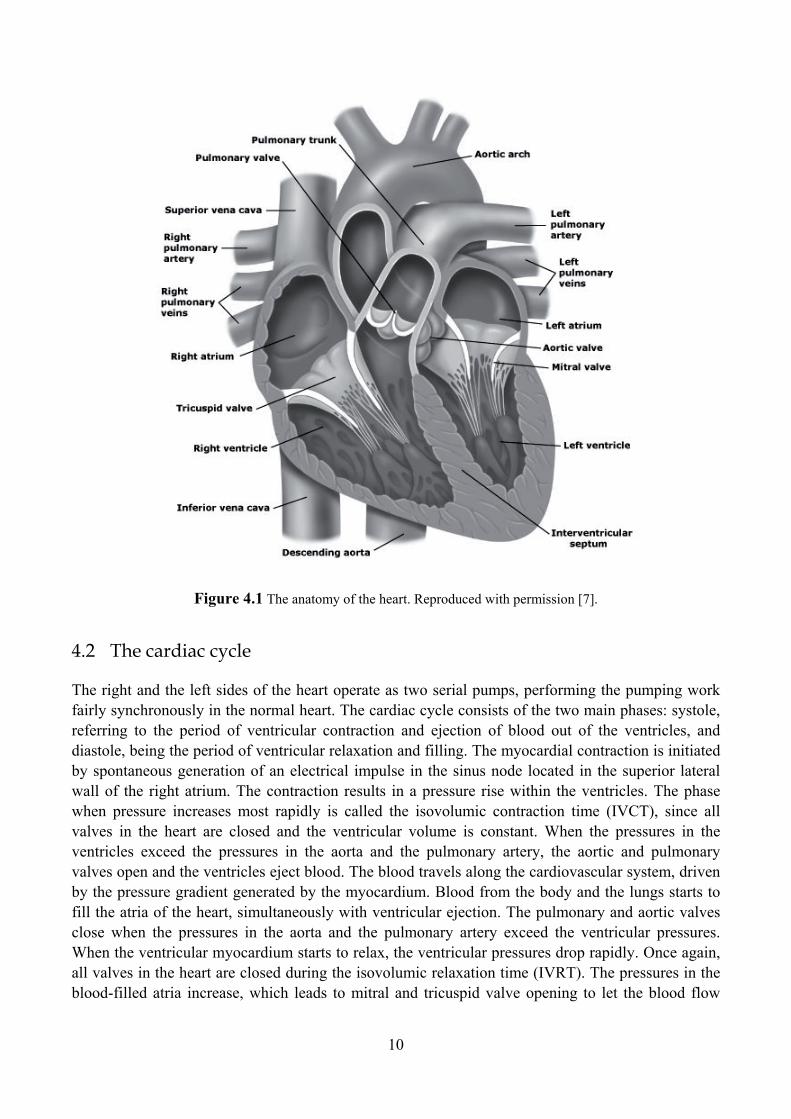
The human heart has a weight of approximately 250-300 g and a size similar to a closed fist [2]. The heart is positioned in the thorax surrounded by a fibrous sac, the pericardium. The external layer of the heart tissue is called the epicardium and the innermost layer in connection to the ventricles the endocardium. The tissue between the two aforementioned layers, the myocardium, is responsible for ventricular contraction and consists of muscular tissue. The heart is divided into a left and a right side by the septal wall as illustrated in Figure 4.1. Each side of the heart consists of two chambers, the atrium and the ventricle, separated by an atrioventricular (AV) valve: the mitral and the tricuspid valves on the left and right sides, respectively. The left side of the heart delivers oxygen-rich blood to the body (systemic circulation) passing through the aortic valve to the aorta, whereas the right side pumps blood through the pulmonary valve and the pulmonary artery for an oxygen refill in the lungs (pulmonary circulation). The four heart valves act as inlet and outlet check-valves for the ventricles, allowing unidirectional flow and preventing backflow by being passively opened and closed due to pressure gradients. The plane that separates the ventricles from the atria is often referred to as the AV-plane, where all the valves of the heart are situated. Returning blood from the body flows to the right atrium through the inferior and superior vena cava, while blood from the lungs returns to the left atria through the pulmonary vein. The myocardium is supplied with oxygen-rich blood through the coronary arteries, the left anterior descending coronary artery (LAD), the left circumflex coronary artery (LCX) and the right coronary artery (RCA). The tip or the pointed end of the heart is called the apex, and the region opposite the apex is known as the base of the heart.
10
Figure 4.1 The anatomy of the heart. Reproduced with permission [7].
4.2 The cardiac cycle
The right and the left sides of the heart operate as two serial pumps, performing the pumping work fairly synchronously in the normal heart. The cardiac cycle consists of the two main phases: systole, referring to the period of ventricular contraction and ejection of blood out of the ventricles, and diastole, being the period of ventricular relaxation and filling. The myocardial contraction is initiated by spontaneous generation of an electrical impulse in the sinus node located in the superior lateral wall of the right atrium. The contraction results in a pressure rise within the ventricles. The phase when pressure increases most rapidly is called the isovolumic contraction time (IVCT), since all valves in the heart are closed and the ventricular volume is constant. When the pressures in the ventricles exceed the pressures in the aorta and the pulmonary artery, the aortic and pulmonary valves open and the ventricles eject blood. The blood travels along the cardiovascular system, driven by the pressure gradient generated by the myocardium. Blood from the body and the lungs starts to fill the atria of the heart, simultaneously with ventricular ejection. The pulmonary and aortic valves close when the pressures in the aorta and the pulmonary artery exceed the ventricular pressures. When the ventricular myocardium starts to relax, the ventricular pressures drop rapidly. Once again, all valves in the heart are closed during the isovolumic relaxation time (IVRT). The pressures in the blood-filled atria increase, which leads to mitral and tricuspid valve opening to let the blood flow
11
into the ventricles. During the first part of the ventricular filling phase, the blood flows as a result of the pressure gradient between the atria and the ventricles. This phase is called the fast filling phase or the early diastolic wave (E-wave). The filling continues after the E-wave, but at a reduced rate during the phase called the diastasis [8]. This phase is followed by atrial contraction during the atrial diastolic wave (A-wave), contributing to the ventricular filling by lifting the AV-plane. The pressures inside the ventricles rise with the increased filling and, finally, the blood is pushed up against the mitral and tricuspid valves, forcing them to shut. Thereafter a new cardiac cycle can begin. Myocardial perfusion mainly occurs during diastole, as a consequence of increasing resistance in the coronary arteries during systole.
4.3 Cardiac pumping function
Cardiac mechanics and the pumping physiology of the heart have been differently described during the years and are still not fully understood [9-13]. Principally, the motion of the LV during systole can be described by a longitudinal motion moving the base closer to the apex, a radial reduction of the inner diameter and a rotational movement [12, 14]. The longitudinal contraction of the ventricle was described by Leonardo da Vinci in the 15th century [13] and thereafter by Harvey in the 17th century, who also showed a radial shortening of the ventricles during systole [11]. The concept of active systolic filling of the atria was introduced in 1883 by Jager who described the heart as a pressure suction pump [15]. In 1932, a study by Hamilton and Rompf stated that the heart pumps with long-axis contractions and remains relatively constant in volume throughout the cardiac cycle [10], which was contradicted by results presented two decades later by Gauer, who concluded that the heart volume changes during the cardiac cycle [9].
The general belief has been that the heart pumps and regulates blood flow by radial squeezing motions, a theory that is still described and illustrated in modern textbooks on cardiac physiology [8, 16]. However, a squeezing motion pattern of the heart would result in a large change in the total heart volume and thereby induce displacement of the surrounding tissues. This way of pumping is very energy-consuming and thus likely an inadequate description of the pumping function of the heart. Recent research has shown that the outer volume of the heart is more or less constant throughout the cardiac cycle and suggests that previous findings showing large differences in outer volume originate from measurement errors when using two-dimensional (2D) imaging techniques [12].
During the two last decades, there has been an obvious increase in interest in the longitudinal motion of the ventricle, as it has been seen to strongly correlate with LV function [17, 18]. In 1986 Lundbäck suggested that the heart appears in its pumping function like a piston pump [12], performing the pumping work with back-and-forth going longitudinal movements of a piston-like unit referred to as the spherical AV-plane, or the ΔV-piston. The heart is, according to this theory, controlled by inflow and the external volume of the heart is more or less unchanged during the heart cycle. When the AV-plane moves back and forth, volumes are generated in the heart due to diameter differences of the spherical AV-plane up towards the atria and down towards the ventricles. These volumes (ΔV-volumes) enable the AV-plane to hydraulically return to its upper position during diastole, forced by pressure gradients generated by the inflow to the pump [12]. This way of pumping is energy saving and maintains the muscle dynamics throughout the cardiac cycle and
12
during critical events such as acceleration, retardation and direction changes of the AV-plane. Lundbäck also constructed a mechanical pump on the basis of the pumping principles found in the human heart, known as the dynamic displacement pump, or ΔV-pump, with similarities to both dynamic and displacement pumps. The importance of AV-plane displacement as a contributor to the cardiac pumping function was confirmed in studies published a few years ago [19, 20].
There has been a growing interest in the function of LV twisting or torsion during the last several decades [21]. In systole there is a twisting motion of the ventricle, which is maximal at the apex (counterclockwise) and minimal at the base (clockwise), as viewed from the apex. This motion possibly originates from the helical orientation of the myocardial fibers and has been suggested to contribute to cardiac pumping by, for example, creating a suction effect during elastic recoil to help the ventricular relaxation and filling [21].
4.4 Vascular anatomy and function
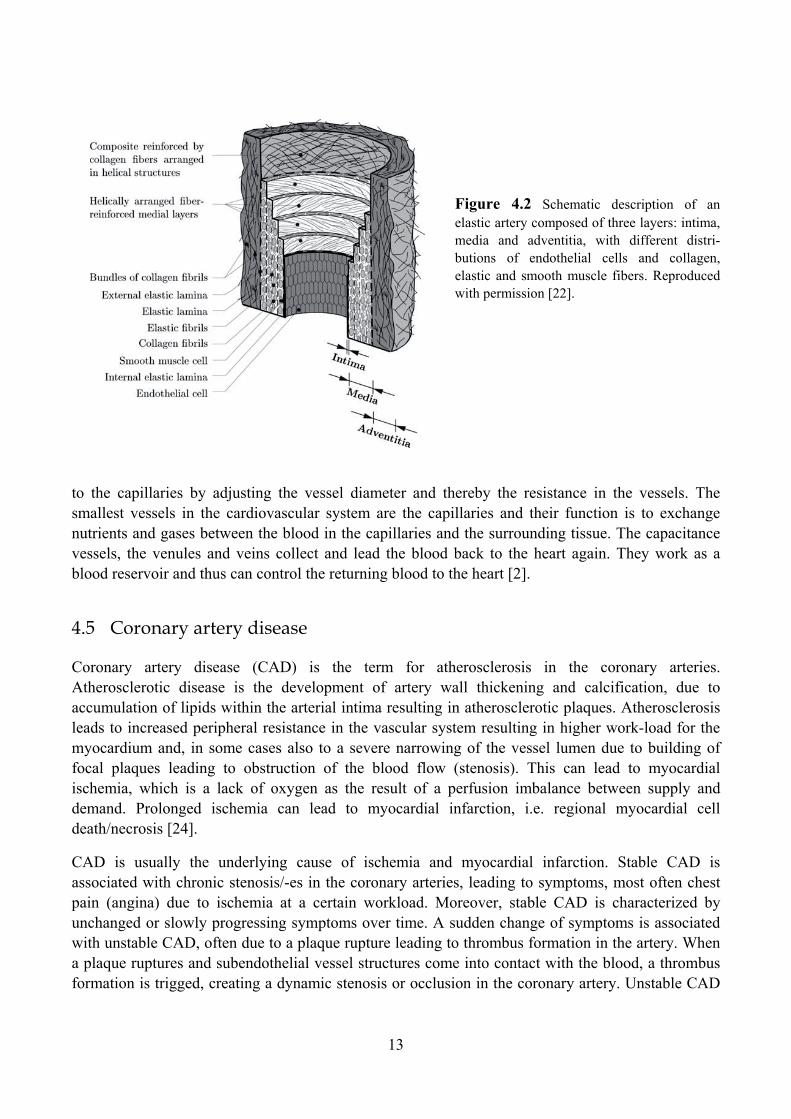
The blood vessels in the cardiovascular system, estimated to have a total length of 100.000 km [2], can be classified according to their functions into elastic and muscular arteries, and resistance, exchange and capacitance vessels. All vessels, except for the exchange vessels, the capillaries, have the same basic structure as illustrated for an elastic artery in Figure 4.2. Only the composition of the layers, and the fraction of different cells in the layers, are dependent on vessel type. The vessel wall is arranged in three layers; tunica intima, tunica media and tunica adventitia. The tunica intima is the innermost layer, which is in direct contact with the blood. This layer consists of endothelial cells surrounded by a thin layer of connective tissue, providing the vessel with a smooth inner surface. In a young healthy individual, the intima does not contribute to the mechanical properties of the vessel. However, this can change with age, when the intima gets thicker and stiffer [22].
The tunica media is the middle layer of the vessel wall, consisting of smooth muscle and elastic and collagen fibers in helically arranged medial layers. Tunica media is the principal determinant of the mechanical properties of the arteries. The media is connected to the intima and adventitia with elastic membranes, the internal and external elastic lamina [23]. The vessel is covered by loose connective tissue in its third layer, the adventitia. This layer consists of thick bundles of collagen fibrils arranged in helical structures which stabilize and strengthen the vessel. In larger arteries, this layer also contains a network of small blood vessels supplying the vessel, the vasa vasorum.
The elastic arteries are the largest arteries, i.e. the pulmonary artery, the aorta and their major branches. They are termed elastic arteries because elastic fibers are dominant in their vessel walls. The function of the elastic arteries is to transform the accumulated potential energy from the ejection phase into kinetic energy during diastole, in order to keep up a more continuous flow in the arteries. This function, called the Windkessel effect, is possible because the walls of an elastic artery easily expand and recoil. Arterial compliance is defined as the change in arterial volume divided by the associated distending pressure. Muscular arteries are located at more peripheral parts of the circulatory system and their main function is to distribute blood to different parts of the body. They are called muscular arteries, since they contain more smooth muscles and less elastic tissue than the elastic arteries. Small arteries and arterioles are termed resistance vessels, since they account for the greatest part of the resistance in the vasculature. The arterioles distribute and regulate the blood flow
13
Figure 4.2 Schematic description of an elastic artery composed of three layers: intima, media and adventitia, with different distri-butions of endothelial cells and collagen, elastic and smooth muscle fibers. Reproduced with permission [22].
to the capillaries by adjusting the vessel diameter and thereby the resistance in the vessels. The smallest vessels in the cardiovascular system are the capillaries and their function is to exchange nutrients and gases between the blood in the capillaries and the surrounding tissue. The capacitance vessels, the venules and veins collect and lead the blood back to the heart again. They work as a blood reservoir and thus can control the returning blood to the heart [2].
4.5 Coronary artery disease
Coronary artery disease (CAD) is the term for atherosclerosis in the coronary arteries. Atherosclerotic disease is the development of artery wall thickening and calcification, due to accumulation of lipids within the arterial intima resulting in atherosclerotic plaques. Atherosclerosis leads to increased peripheral resistance in the vascular system resulting in higher work-load for the myocardium and, in some cases also to a severe narrowing of the vessel lumen due to building of focal plaques leading to obstruction of the blood flow (stenosis). This can lead to myocardial ischemia, which is a lack of oxygen as the result of a perfusion imbalance between supply and demand. Prolonged ischemia can lead to myocardial infarction, i.e. regional myocardial cell death/necrosis [24].
CAD is usually the underlying cause of ischemia and myocardial infarction. Stable CAD is associated with chronic stenosis/-es in the coronary arteries, leading to symptoms, most often chest pain (angina) due to ischemia at a certain workload. Moreover, stable CAD is characterized by unchanged or slowly progressing symptoms over time. A sudden change of symptoms is associated with unstable CAD, often due to a plaque rupture leading to thrombus formation in the artery. When a plaque ruptures and subendothelial vessel structures come into contact with the blood, a thrombus formation is trigged, creating a dynamic stenosis or occlusion in the coronary artery. Unstable CAD
14
carries a high risk of cardiac death and/or myocardial infarction and requires urgent medical treatment.
Ongoing ischemia can usually be detected by changes in the electrocardiogram (ECG). The changes are dependent on the extent of the myocardial ischemia. A transmural ischemia, i.e. ischemia through the wall including both subendocardial and subepicardial parts of the myocardium, can be detected by an elevation of the ST-segment in the ECG curve, whereas subendocardial ischemia causes more subtile changes in the ECG. Myocardial ischemia with ST elevation will result in a possibly large myocardial infarct if left untreated. A myocardial infarction without ST elevation is referred to as Non-ST Segment Elevation Myocardial Infarction (NSTEMI). NSTEMI often affects a smaller portion of LV myocardium and leads therefore more seldom to cardiac dysfunction and heart failure, whereas ST segment elevation myocardial infarct more often leads to heart failure.
4.6 Heart failure
Heart failure is a condition of the heart characterized by insufficient blood supply to the body due to cardiac dysfunction. Heart failure can be a result of systolic and/or diastolic dysfunction. Systolic dysfunction refers to impaired ventricular contraction characterized by a reduced myocardial contractility, resulting in a decreased cardiac output. Diastolic dysfunction refers to failure of ventricular relaxation and/or increased filling resistance causing inadequate filling of the ventricle during diastole. Typically, the end-diastolic pressures increase and the stroke volume decreases. Both systolic and diastolic dysfunction eventually lead to symptoms such as fatigue and shortness of breath with typical signs of heart failure as pulmonary and peripheral edema.
Common causes of heart failure are CAD, hypertension (elevated blood pressure) and valvular heart disease [25], leading to decreased cardiac output due to different mechanisms. CAD can lead to myocardial damage from myocardial infarcts, as described above, and result in decreased systolic function of the LV. An increased workload due to prolonged hypertension will stimulate hypertrophy of the myocardium, which can lead to increased filling pressures due to myocardial stiffening and decreased compliance and distensibility of the LV. This leads primary to diastolic dysfunction when compensatory mechanisms fail and eventually to decreased contractility and systolic heart failure. Valvular heart disease leads either to pressure overload due to stenotic valves with insufficient opening, or volume overload from valve regurgitation in valves with defect valve closure. Both valvular stenosis and insufficiency will, if left untreated, lead to heart failure in severe cases.
Cardiac dyssynchrony is the term for an asynchronous contraction pattern of the ventricular walls. Dyssynchrony can be divided into two types: interventricular dyssynchrony between the LV and the right ventricle (RV) and intraventricular dyssynchrony within the LV. Cardiac dyssynchrony is characterized by reduced stroke volume because blood moves around the LV from early activated segments to late activated segments. This can lead to decreased efficiency in contraction, reduced systolic function and thus heart failure [26].
15
5 ULTRASOUND IMAGING
This chapter presents fundamental physics on ultrasound imaging and introduces the different ultrasound techniques, commonly used in echocardiography, i.e. cardiac ultrasound imaging, and vascular imaging.
5.1 Ultrasound
Sound is a mechanical wave which is an oscillation of pressure in gases, liquids and solids. Ultrasound is defined as sound waves of such high frequency that they are not detectable to the human ear, i.e. above 20 kHz. The speed at which the ultrasound wave travels depends on the density, compressibility and temperature of the medium through which it travels. For example, the velocity of ultrasound in fatty tissue is about 1460 m/s and, in bone, 3500 m/s [27]. Ultrasound waves are generated and detected by a transducer consisting of piezoelectric crystals with the ability to convert electrical energy into mechanical energy and vice versa. When an electrical field is applied over the crystal it begins to vibrate and produce mechanical waves, i.e. ultrasound pulses. Conversely, when applying a mechanical stress in the receiving mode an electrical potential is generated. Ultrasound is used in different applications, such as automated tracking of objects, echo-sounding, submarine detection and material for testing in industry. Additionally, ultrasound is a frequently used modality in medical imaging (sonography). Common for all ultrasound applications is the use of the pulse-echo technique to obtain the required information.
5.2 The pulse-echo technique
The pulse-echo technique is explained here in the context of medical imaging of the human body. The principle of the pulse-echo technique is to utilize the reflected parts of the transmitted ultrasound pulse to build an image. First, a brief ultrasound pulse is transmitted into the body. At borders between two media with difference in acoustic impedance (Z), parts of the pulse will be reflected back to the transducer. The acoustic impedance is dependent on the speed of sound ( ), the density
and the compressibility (ĸ) of the medium according to (5-1).
16
(5-1) ĸ
The fraction of the pulse that is reflected depends on the angle of incidence and the difference in acoustic impedance between the media. The greater the difference, the greater the fraction of the pulse that is reflected. The distance to the boundary, from where the reflected waves originate can be determined by measuring the time elapsed from transmission to reception of the pulse. The time multiplied by the speed of sound divided by two is equal to the distance between the transducer and the boundary. When using ultrasound to acquire images of the human body, the speed of sound is assumed to be constant at 1540 m/s [28]. The distance to all boundaries along the transmitted pulse is determined in this way and, by repeating this procedure for several beams next to one another, an image can be generated. Every pixel in the image is assigned a specific brightness relative to the strength of the corresponding echo.
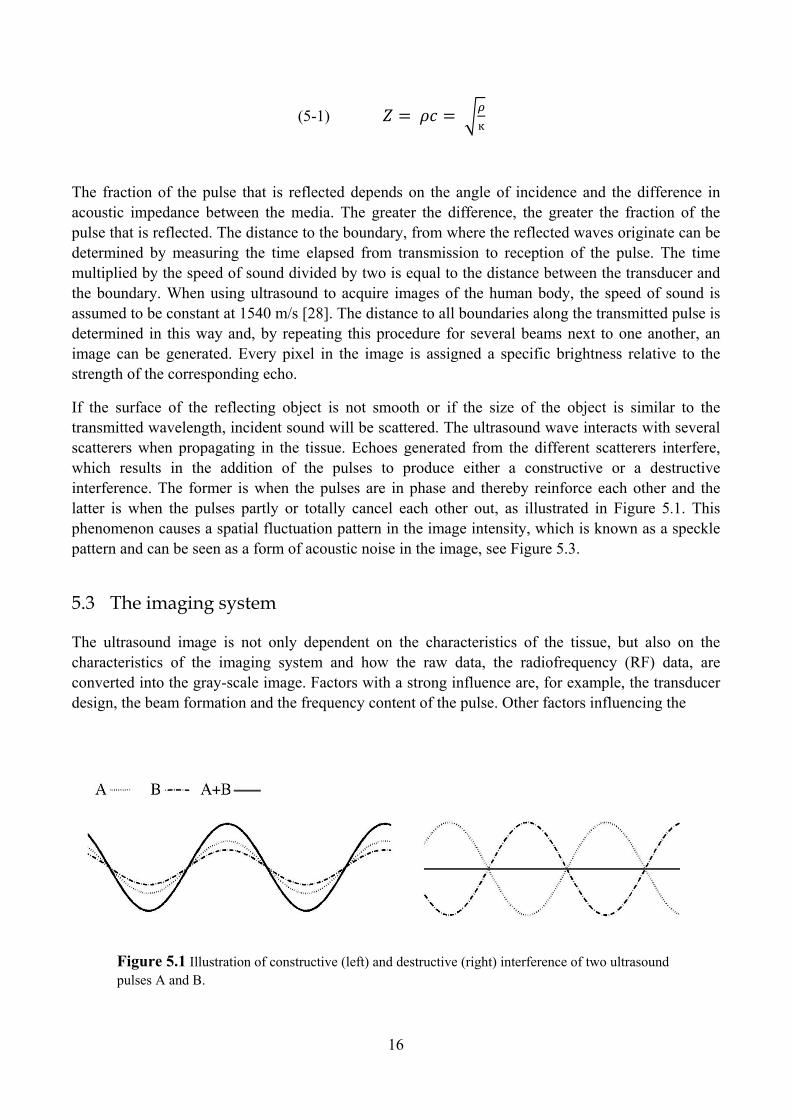
If the surface of the reflecting object is not smooth or if the size of the object is similar to the transmitted wavelength, incident sound will be scattered. The ultrasound wave interacts with several scatterers when propagating in the tissue. Echoes generated from the different scatterers interfere, which results in the addition of the pulses to produce either a constructive or a destructive interference. The former is when the pulses are in phase and thereby reinforce each other and the latter is when the pulses partly or totally cancel each other out, as illustrated in Figure 5.1. This phenomenon causes a spatial fluctuation pattern in the image intensity, which is known as a speckle pattern and can be seen as a form of acoustic noise in the image, see Figure 5.3.
5.3 The imaging system
The ultrasound image is not only dependent on the characteristics of the tissue, but also on the characteristics of the imaging system and how the raw data, the radiofrequency (RF) data, are converted into the gray-scale image. Factors with a strong influence are, for example, the transducer design, the beam formation and the frequency content of the pulse. Other factors influencing the
Figure 5.1 Illustration of constructive (left) and destructive (right) interference of two ultrasound pulses A and B.
17
image quality are different focusing, aperture and apodization techniques and compensation for attenuation through time gain compensation. However, these settings will not be discussed in detail in this thesis.
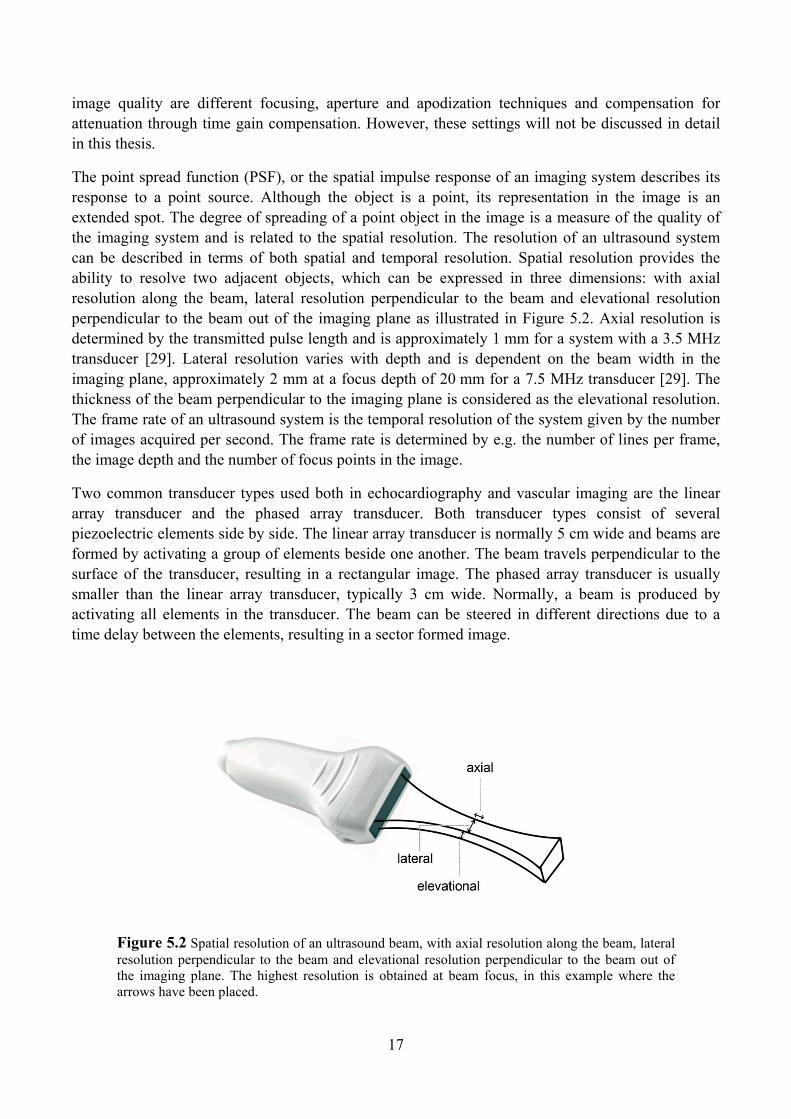
The point spread function (PSF), or the spatial impulse response of an imaging system describes its response to a point source. Although the object is a point, its representation in the image is an extended spot. The degree of spreading of a point object in the image is a measure of the quality of the imaging system and is related to the spatial resolution. The resolution of an ultrasound system can be described in terms of both spatial and temporal resolution. Spatial resolution provides the ability to resolve two adjacent objects, which can be expressed in three dimensions: with axial resolution along the beam, lateral resolution perpendicular to the beam and elevational resolution perpendicular to the beam out of the imaging plane as illustrated in Figure 5.2. Axial resolution is determined by the transmitted pulse length and is approximately 1 mm for a system with a 3.5 MHz transducer [29]. Lateral resolution varies with depth and is dependent on the beam width in the imaging plane, approximately 2 mm at a focus depth of 20 mm for a 7.5 MHz transducer [29]. The thickness of the beam perpendicular to the imaging plane is considered as the elevational resolution. The frame rate of an ultrasound system is the temporal resolution of the system given by the number of images acquired per second. The frame rate is determined by e.g. the number of lines per frame, the image depth and the number of focus points in the image.
Two common transducer types used both in echocardiography and vascular imaging are the linear array transducer and the phased array transducer. Both transducer types consist of several piezoelectric elements side by side. The linear array transducer is normally 5 cm wide and beams are formed by activating a group of elements beside one another. The beam travels perpendicular to the surface of the transducer, resulting in a rectangular image. The phased array transducer is usually smaller than the linear array transducer, typically 3 cm wide. Normally, a beam is produced by activating all elements in the transducer. The beam can be steered in different directions due to a time delay between the elements, resulting in a sector formed image.
Figure 5.2 Spatial resolution of an ultrasound beam, with axial resolution along the beam, lateral resolution perpendicular to the beam and elevational resolution perpendicular to the beam out of the imaging plane. The highest resolution is obtained at beam focus, in this example where the arrows have been placed.
18
5.4 Quantification of motion and deformation using ultrasound
Commonly used variables to quantify motion and deformation in cardiovascular applications using ultrasound are: displacement (m), velocity (m/s), strain (%), strain rate (1/s) and rotation (º). Strain or deformation can be calculated as in (5-2) or (5-3), where is the current length of a segment and its initial length. Lagrangian strain ( ) is dependent on the initial length of the object, whereas natural strain describes the instantaneous strain. Positive strain is stretching and negative strain is shortening. Strain rate can be calculated in two ways, either by temporal derivation of strain or by spatial derivation of velocity as in (5-4).
(5-2)
(5-3)
(5-4)
Rotation is defined as the angular displacement of the LV around its central axis in a transverse plane of the heart. Motion and deformation variables are commonly estimated with the two ultrasound-based techniques, Doppler imaging and STI.
Doppler imaging If an imaging object moves relative to the transducer, a difference in frequency between the transmitted and the observed ultrasound wave occurs. This is what is referred to as the Doppler effect. The difference in frequency is the Doppler frequency ( ) and can be used to estimate the velocity of an object relative to the transducer, according to (5-5),
(5-5) | |
where is the frequency of the transmitted pulse, | | is the size of the velocity vector of the reflected object, is the speed of sound, the angle between the transmitted ultrasound pulse and the velocity vector of the reflected object [30].
There are three different Doppler techniques to estimate blood and tissue velocities: Continuous wave (CW) Doppler, Pulsed wave (PW) Doppler and Color flow mapping (CFM) or color Tissue Doppler imaging (hereinafter referred to as TDI). Common to all techniques is that velocity estimation is only possible along the imaging line. CW Doppler detects the frequency shift according to (5-5) along the imaging line. Since the pulse is continuous, all velocities along the imaging line are detected, resulting in a lack of spatial depth information. PW Doppler uses the Doppler shift only
19
indirectly. In PW Doppler short pulses are transmitted at a constant rate. Each signal is sampled at a fixed time interval after transmission, depending on the desired depth [30]. The velocity of the object at this depth can be determined by measuring the phase shift between the different signals to construct the Doppler frequency signal. The CW and PW Doppler techniques are foremost established methods for the estimation of blood flow velocities in vessels and over valves of the heart. CFM and TDI are techniques to estimate and visualize blood and tissue velocities in an entire 2D image. Their principles are basically the same but their filtering functions differ. Tissue velocities are of higher amplitude and lower frequency than the blood velocities. This section concentrates on TDI, since this is the Doppler technique most used during this thesis work.
If TDI was to use the same technique as PW Doppler, the acquisition would be at a very low frame rate because TDI requires velocity information over the whole image. Instead, the phase shift between some pulses along the image line is subsequently estimated in real time [30]. This is done by autocorrelation between two samples of each received pulse. The estimated phase shift ∆ is approximately related to the velocity as in (5-6),
(5-6) ∆
where is the speed of sound, is the transmitted frequency, and is the time between the transmitted pulses. The TDI modality includes tissue velocity, displacement, strain and strain rate imaging. By using the velocity information, the motion and deformation variables, described in the previous section can be calculated. The variables are normally continuously color-coded and superimposed in the conventional gray-scale 2D images. Figure 6.3 shows an example of color-coded longitudinal tissue velocities using TDI.
Nowadays, TDI is a well-established method for the quantitative analysis of longitudinal myocardial motion and deformation [31]. The technique was introduced by Isaaz et al. in 1989 [32], but the technique gained broader clinical use first after further refinement of the algorithms [33, 34]. TDI is also known as Doppler tissue imaging (DTI), which is the name used in Paper I.
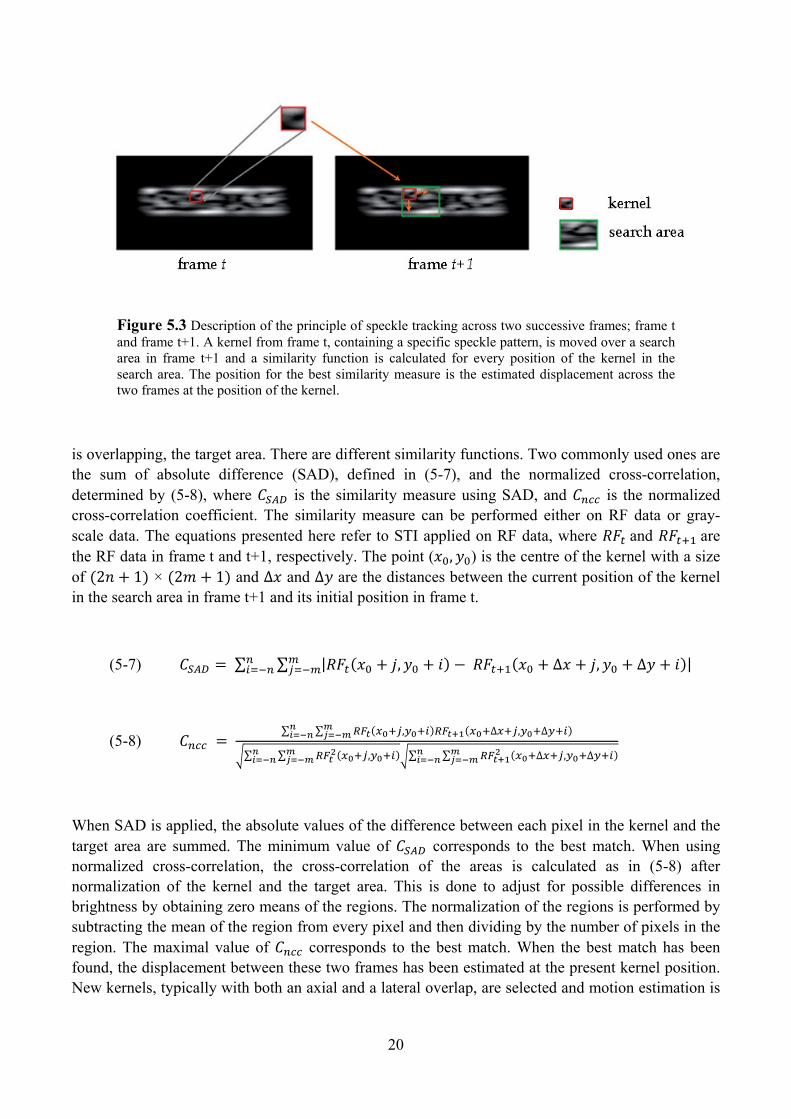
Speckle tracking imaging The speckle tracking imaging (STI) technique utilizes, as the name indicates, tracking of the speckle patterns (described in Section 5.2) to estimate motion in the gray-scale images. The technique is based on block-matching of small regions, kernels, in the image across frames. The technique in general will be explained according to the example in Figure 5.3. The motion estimation is performed across two successive frames, frame t and frame t+1. A kernel (marked in red in Figure 5.3) is selected in frame t and is moved over the image in frame t+1 in a specified area, the search area (marked in green in Figure 5.3), the size of which is determined typically by the maximal velocity of the objects in the image. For every position in which the kernel is placed on in the search area, a similarity function is used to estimate the correlation of the kernel and the area that the kernel
20
Figure 5.3 Description of the principle of speckle tracking across two successive frames; frame t and frame t+1. A kernel from frame t, containing a specific speckle pattern, is moved over a search area in frame t+1 and a similarity function is calculated for every position of the kernel in the search area. The position for the best similarity measure is the estimated displacement across the two frames at the position of the kernel.
is overlapping, the target area. There are different similarity functions. Two commonly used ones are the sum of absolute difference (SAD), defined in (5-7), and the normalized cross-correlation, determined by (5-8), where is the similarity measure using SAD, and is the normalized cross-correlation coefficient. The similarity measure can be performed either on RF data or gray-scale data. The equations presented here refer to STI applied on RF data, where and are the RF data in frame t and t+1, respectively. The point ( , ) is the centre of the kernel with a size of 2 1 × 2 1 and ∆ and ∆ are the distances between the current position of the kernel in the search area in frame t+1 and its initial position in frame t.
(5-7) ∑ ∑ | , ∆ , ∆ |
(5-8) ∑ ∑ , ∆ , ∆
∑ ∑ , ∑ ∑ ∆ , ∆
When SAD is applied, the absolute values of the difference between each pixel in the kernel and the target area are summed. The minimum value of corresponds to the best match. When using normalized cross-correlation, the cross-correlation of the areas is calculated as in (5-8) after normalization of the kernel and the target area. This is done to adjust for possible differences in brightness by obtaining zero means of the regions. The normalization of the regions is performed by subtracting the mean of the region from every pixel and then dividing by the number of pixels in the region. The maximal value of corresponds to the best match. When the best match has been found, the displacement between these two frames has been estimated at the present kernel position. New kernels, typically with both an axial and a lateral overlap, are selected and motion estimation is

21
performed until the total region of interest, is covered. The same procedure is then repeated between all successive frames in the cycle. The displacement is estimated throughout the cardiac cycle and, finally, the other motion and deformation variables can be calculated.
Several STI approaches have been developed and a number of validation studies in different applications have been reported in the literature [35-37]. The advantage with the STI technique in comparison with the Doppler based techniques is foremost that the motion and deformation variables can be estimated in two directions, or even in three directions if a full volume of ultrasound data is acquired.

22
23
6 EVALUATION OF CARDIOVASCULAR FUNCTION
The aim of this chapter is to present common methods to evaluate cardiovascular anatomy and function and to review performed research from this field. The main focus of this chapter is ultrasound-based methods for evaluation of the cardiovascular system, while acknowledging that other techniques and imaging modalities are important for research purposes and in routine clinical practice to investigate its function and anatomy. Magnetic resonance imaging (MRI), angiography and methods within nuclear medicine are good examples in this respect.
6.1 Cardiovascular ultrasound
Ultrasound is inexpensive, easy to use and carries no procedural risk, unlike X-ray based and radionuclide imaging modalities. For these reasons cardiovascular ultrasound has grown to be perhaps the most important diagnostic tool in cardiovascular medicine today. Ultrasound imaging in cardiovascular applications requires frequencies in a range of 2-14 MHz. The frequency is selected depending on the application and the imaging depth required. Higher frequencies are more absorbed in the tissue and do not reach deeper positioned objects, as e.g. the heart. In general, phased array transducers with frequencies of 2-4 MHz are used in echocardiography, whereas vascular applications typically use linear array transducers with higher frequencies, around 10-14 MHz.
The conventional method of using ultrasound as a modality for cardiovascular imaging is to obtain a sequence of 2D gray-scale images in different scan planes or projections of the heart and the vessels, and to combine these with Doppler-based measurements for functional analysis of cardiac valves and stenotic vessels. To avoid total acoustic reflection, an ultrasound gel is applied on the transducer resulting in exclusion of all air between the transducer and the skin of the patient. Images are recorded at a specified frame rate, selected to catch the motion of interest. Relatively recently, three dimensional ultrasound imaging was developed and currently this technique is gaining more interest. The technique allows for a 3D overview of the imaging object, with possibilities to estimate function in an arbitrary direction and to obtain different projections from the same cardiac cycle.
24
6.2 Evaluation of cardiac function
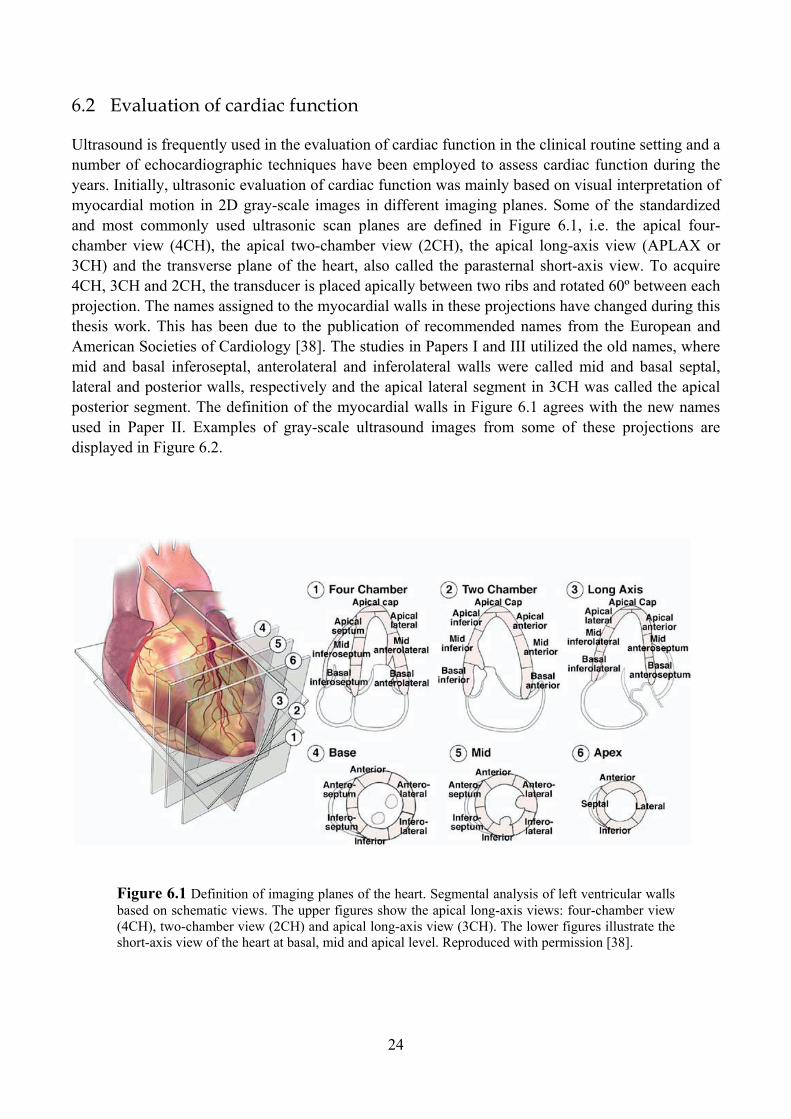
Ultrasound is frequently used in the evaluation of cardiac function in the clinical routine setting and a number of echocardiographic techniques have been employed to assess cardiac function during the years. Initially, ultrasonic evaluation of cardiac function was mainly based on visual interpretation of myocardial motion in 2D gray-scale images in different imaging planes. Some of the standardized and most commonly used ultrasonic scan planes are defined in Figure 6.1, i.e. the apical four-chamber view (4CH), the apical two-chamber view (2CH), the apical long-axis view (APLAX or 3CH) and the transverse plane of the heart, also called the parasternal short-axis view. To acquire 4CH, 3CH and 2CH, the transducer is placed apically between two ribs and rotated 60º between each projection. The names assigned to the myocardial walls in these projections have changed during this thesis work. This has been due to the publication of recommended names from the European and American Societies of Cardiology [38]. The studies in Papers I and III utilized the old names, where mid and basal inferoseptal, anterolateral and inferolateral walls were called mid and basal septal, lateral and posterior walls, respectively and the apical lateral segment in 3CH was called the apical posterior segment. The definition of the myocardial walls in Figure 6.1 agrees with the new names used in Paper II. Examples of gray-scale ultrasound images from some of these projections are displayed in Figure 6.2.
Figure 6.1 Definition of imaging planes of the heart. Segmental analysis of left ventricular walls based on schematic views. The upper figures show the apical long-axis views: four-chamber view (4CH), two-chamber view (2CH) and apical long-axis view (3CH). The lower figures illustrate the short-axis view of the heart at basal, mid and apical level. Reproduced with permission [38].
25
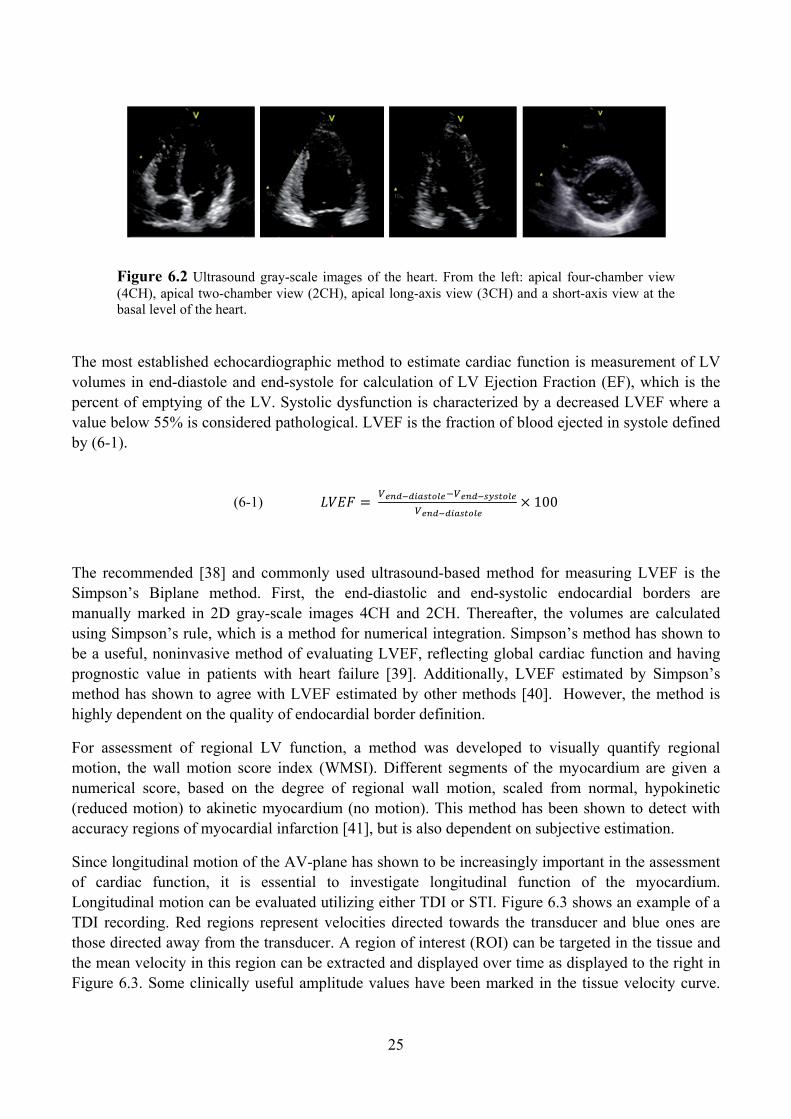
Figure 6.2 Ultrasound gray-scale images of the heart. From the left: apical four-chamber view (4CH), apical two-chamber view (2CH), apical long-axis view (3CH) and a short-axis view at the basal level of the heart.
The most established echocardiographic method to estimate cardiac function is measurement of LV volumes in end-diastole and end-systole for calculation of LV Ejection Fraction (EF), which is the percent of emptying of the LV. Systolic dysfunction is characterized by a decreased LVEF where a value below 55% is considered pathological. LVEF is the fraction of blood ejected in systole defined by (6-1).
(6-1)
100
The recommended [38] and commonly used ultrasound-based method for measuring LVEF is the Simpson’s Biplane method. First, the end-diastolic and end-systolic endocardial borders are manually marked in 2D gray-scale images 4CH and 2CH. Thereafter, the volumes are calculated using Simpson’s rule, which is a method for numerical integration. Simpson’s method has shown to be a useful, noninvasive method of evaluating LVEF, reflecting global cardiac function and having prognostic value in patients with heart failure [39]. Additionally, LVEF estimated by Simpson’s method has shown to agree with LVEF estimated by other methods [40]. However, the method is highly dependent on the quality of endocardial border definition.
For assessment of regional LV function, a method was developed to visually quantify regional motion, the wall motion score index (WMSI). Different segments of the myocardium are given a numerical score, based on the degree of regional wall motion, scaled from normal, hypokinetic (reduced motion) to akinetic myocardium (no motion). This method has been shown to detect with accuracy regions of myocardial infarction [41], but is also dependent on subjective estimation.
Since longitudinal motion of the AV-plane has shown to be increasingly important in the assessment of cardiac function, it is essential to investigate longitudinal function of the myocardium. Longitudinal motion can be evaluated utilizing either TDI or STI. Figure 6.3 shows an example of a TDI recording. Red regions represent velocities directed towards the transducer and blue ones are those directed away from the transducer. A region of interest (ROI) can be targeted in the tissue and the mean velocity in this region can be extracted and displayed over time as displayed to the right in Figure 6.3. Some clinically useful amplitude values have been marked in the tissue velocity curve.
26
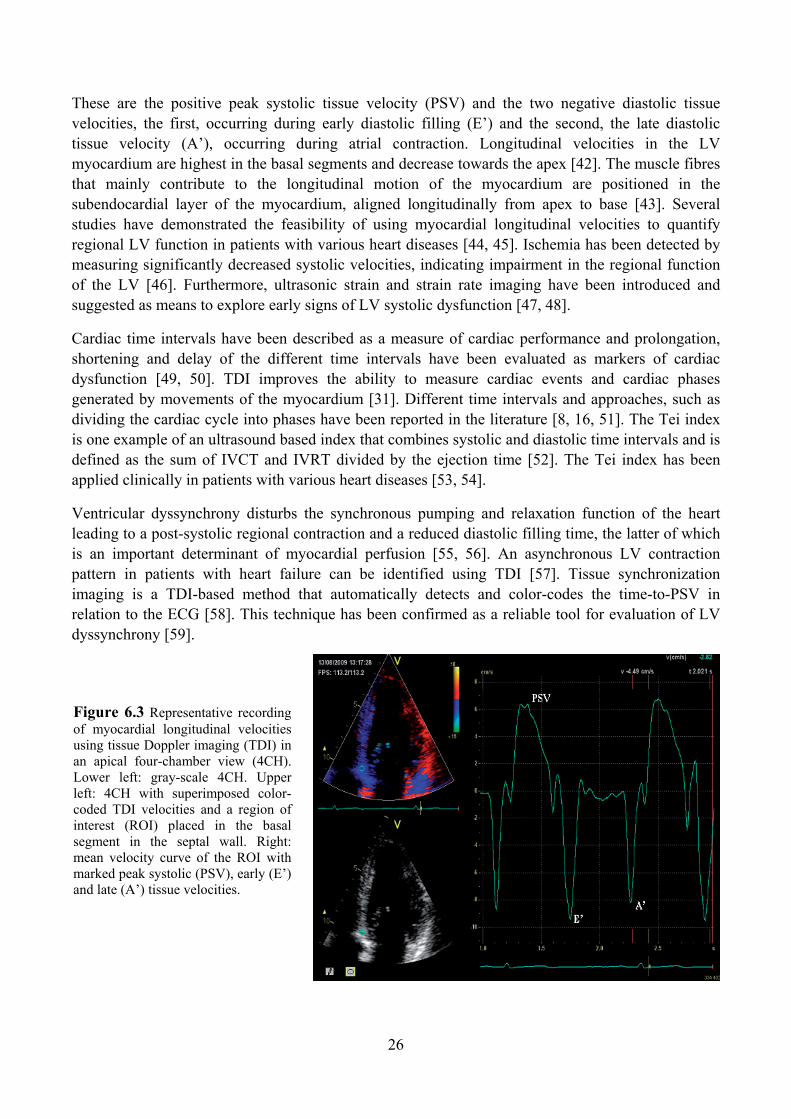
Figure 6.3 Representative recording of myocardial longitudinal velocities using tissue Doppler imaging (TDI) in an apical four-chamber view (4CH). Lower left: gray-scale 4CH. Upper left: 4CH with superimposed color-coded TDI velocities and a region of interest (ROI) placed in the basal segment in the septal wall. Right: mean velocity curve of the ROI with marked peak systolic (PSV), early (E’) and late (A’) tissue velocities.
These are the positive peak systolic tissue velocity (PSV) and the two negative diastolic tissue velocities, the first, occurring during early diastolic filling (E’) and the second, the late diastolic tissue velocity (A’), occurring during atrial contraction. Longitudinal velocities in the LV myocardium are highest in the basal segments and decrease towards the apex [42]. The muscle fibres that mainly contribute to the longitudinal motion of the myocardium are positioned in the subendocardial layer of the myocardium, aligned longitudinally from apex to base [43]. Several studies have demonstrated the feasibility of using myocardial longitudinal velocities to quantify regional LV function in patients with various heart diseases [44, 45]. Ischemia has been detected by measuring significantly decreased systolic velocities, indicating impairment in the regional function of the LV [46]. Furthermore, ultrasonic strain and strain rate imaging have been introduced and suggested as means to explore early signs of LV systolic dysfunction [47, 48].
Cardiac time intervals have been described as a measure of cardiac performance and prolongation, shortening and delay of the different time intervals have been evaluated as markers of cardiac dysfunction [49, 50]. TDI improves the ability to measure cardiac events and cardiac phases generated by movements of the myocardium [31]. Different time intervals and approaches, such as dividing the cardiac cycle into phases have been reported in the literature [8, 16, 51]. The Tei index is one example of an ultrasound based index that combines systolic and diastolic time intervals and is defined as the sum of IVCT and IVRT divided by the ejection time [52]. The Tei index has been applied clinically in patients with various heart diseases [53, 54].
Ventricular dyssynchrony disturbs the synchronous pumping and relaxation function of the heart leading to a post-systolic regional contraction and a reduced diastolic filling time, the latter of which is an important determinant of myocardial perfusion [55, 56]. An asynchronous LV contraction pattern in patients with heart failure can be identified using TDI [57]. Tissue synchronization imaging is a TDI-based method that automatically detects and color-codes the time-to-PSV in relation to the ECG [58]. This technique has been confirmed as a reliable tool for evaluation of LV dyssynchrony [59].
27
Diastolic function can be determined by echocardiography through measurement of various variables. As such, the myocardial velocities E’ and A’, IVRT and the ratio of early diastolic blood flow velocity (E) and E’. Diastolic variables are often dependent on preload, i.e. end-diastolic ventricular filling pressure, which makes it difficult to detect LV diastolic dysfunction solely from the ventricular relaxation pattern [60]. TDI measurement of myocardial diastolic movement pattern is today recommended for use in combination of blood flow Doppler filling pattern and pulmonary vein inflow pattern in the assessment of LV diastolic function [61].
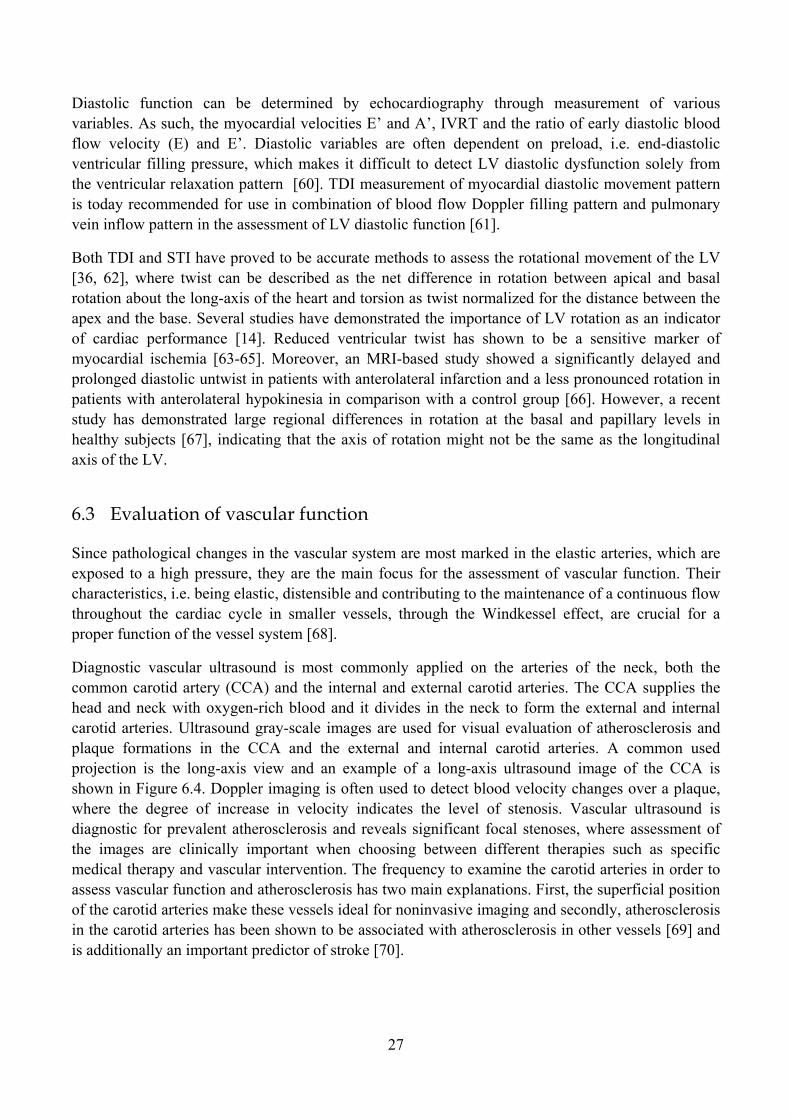
Both TDI and STI have proved to be accurate methods to assess the rotational movement of the LV [36, 62], where twist can be described as the net difference in rotation between apical and basal rotation about the long-axis of the heart and torsion as twist normalized for the distance between the apex and the base. Several studies have demonstrated the importance of LV rotation as an indicator of cardiac performance [14]. Reduced ventricular twist has shown to be a sensitive marker of myocardial ischemia [63-65]. Moreover, an MRI-based study showed a significantly delayed and prolonged diastolic untwist in patients with anterolateral infarction and a less pronounced rotation in patients with anterolateral hypokinesia in comparison with a control group [66]. However, a recent study has demonstrated large regional differences in rotation at the basal and papillary levels in healthy subjects [67], indicating that the axis of rotation might not be the same as the longitudinal axis of the LV.
6.3 Evaluation of vascular function
Since pathological changes in the vascular system are most marked in the elastic arteries, which are exposed to a high pressure, they are the main focus for the assessment of vascular function. Their characteristics, i.e. being elastic, distensible and contributing to the maintenance of a continuous flow throughout the cardiac cycle in smaller vessels, through the Windkessel effect, are crucial for a proper function of the vessel system [68].
Diagnostic vascular ultrasound is most commonly applied on the arteries of the neck, both the common carotid artery (CCA) and the internal and external carotid arteries. The CCA supplies the head and neck with oxygen-rich blood and it divides in the neck to form the external and internal carotid arteries. Ultrasound gray-scale images are used for visual evaluation of atherosclerosis and plaque formations in the CCA and the external and internal carotid arteries. A common used projection is the long-axis view and an example of a long-axis ultrasound image of the CCA is shown in Figure 6.4. Doppler imaging is often used to detect blood velocity changes over a plaque, where the degree of increase in velocity indicates the level of stenosis. Vascular ultrasound is diagnostic for prevalent atherosclerosis and reveals significant focal stenoses, where assessment of the images are clinically important when choosing between different therapies such as specific medical therapy and vascular intervention. The frequency to examine the carotid arteries in order to assess vascular function and atherosclerosis has two main explanations. First, the superficial position of the carotid arteries make these vessels ideal for noninvasive imaging and secondly, atherosclerosis in the carotid arteries has been shown to be associated with atherosclerosis in other vessels [69] and is additionally an important predictor of stroke [70].
28
Another term connected to vascular disease is arterial stiffness, which describes the rigidity of the arterial walls and is a consequence of ageing and atherosclerosis. Arterial stiffness can either be seen as a marker for the development of future atherosclerotic disease, or as more directly involved in the atherosclerotic process [71]. The main part of the research focuses on measurements of arterial stiffness to be able to detect, predict and prevent cardiovascular disease, as changes in arterial stiffness can be detected before the appearance of clinically apparent vascular disease (subclinical disease). Furthermore, risk assessment of plaque rupture in atherosclerosis has gained much interest in recent years [72]. Arterial stiffness and atherosclerosis may be measured using a variety of different techniques. The following is a description of some of the most common noninvasive research techniques used to measure vascular function, along with results from studies were they have been applied.
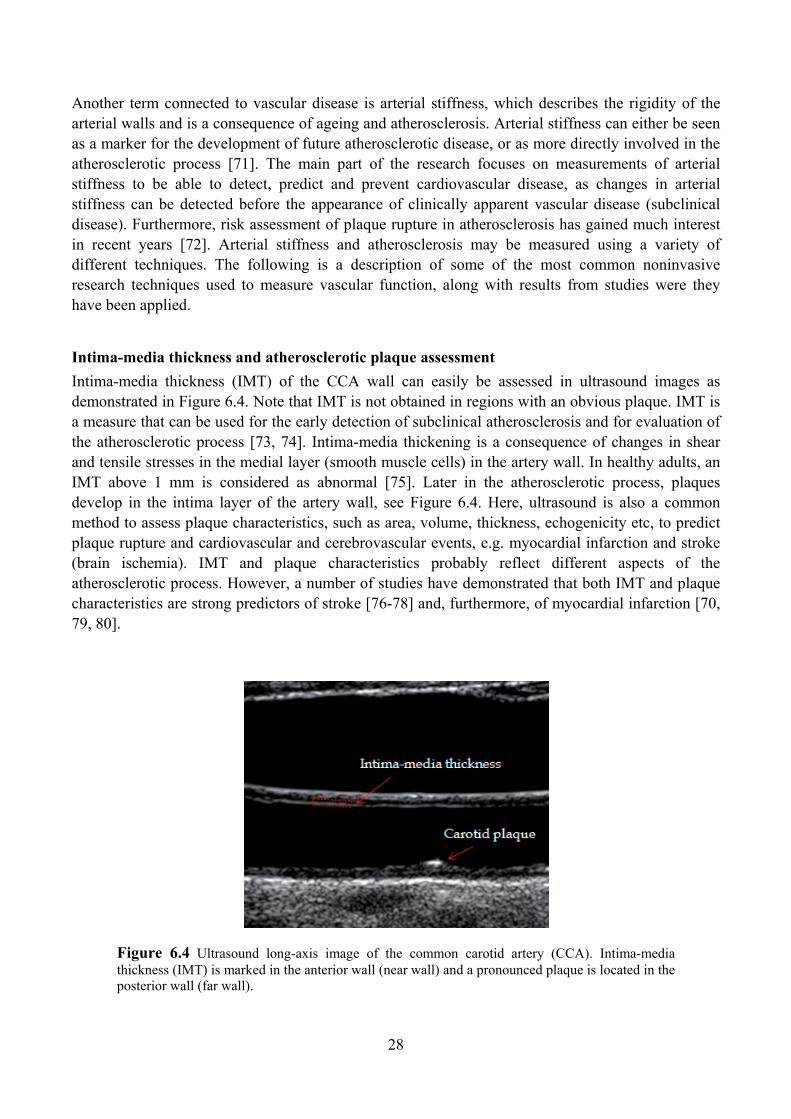
Intima-media thickness and atherosclerotic plaque assessment Intima-media thickness (IMT) of the CCA wall can easily be assessed in ultrasound images as demonstrated in Figure 6.4. Note that IMT is not obtained in regions with an obvious plaque. IMT is a measure that can be used for the early detection of subclinical atherosclerosis and for evaluation of the atherosclerotic process [73, 74]. Intima-media thickening is a consequence of changes in shear and tensile stresses in the medial layer (smooth muscle cells) in the artery wall. In healthy adults, an IMT above 1 mm is considered as abnormal [75]. Later in the atherosclerotic process, plaques develop in the intima layer of the artery wall, see Figure 6.4. Here, ultrasound is also a common method to assess plaque characteristics, such as area, volume, thickness, echogenicity etc, to predict plaque rupture and cardiovascular and cerebrovascular events, e.g. myocardial infarction and stroke (brain ischemia). IMT and plaque characteristics probably reflect different aspects of the atherosclerotic process. However, a number of studies have demonstrated that both IMT and plaque characteristics are strong predictors of stroke [76-78] and, furthermore, of myocardial infarction [70, 79, 80].
Figure 6.4 Ultrasound long-axis image of the common carotid artery (CCA). Intima-media thickness (IMT) is marked in the anterior wall (near wall) and a pronounced plaque is located in the posterior wall (far wall).
29
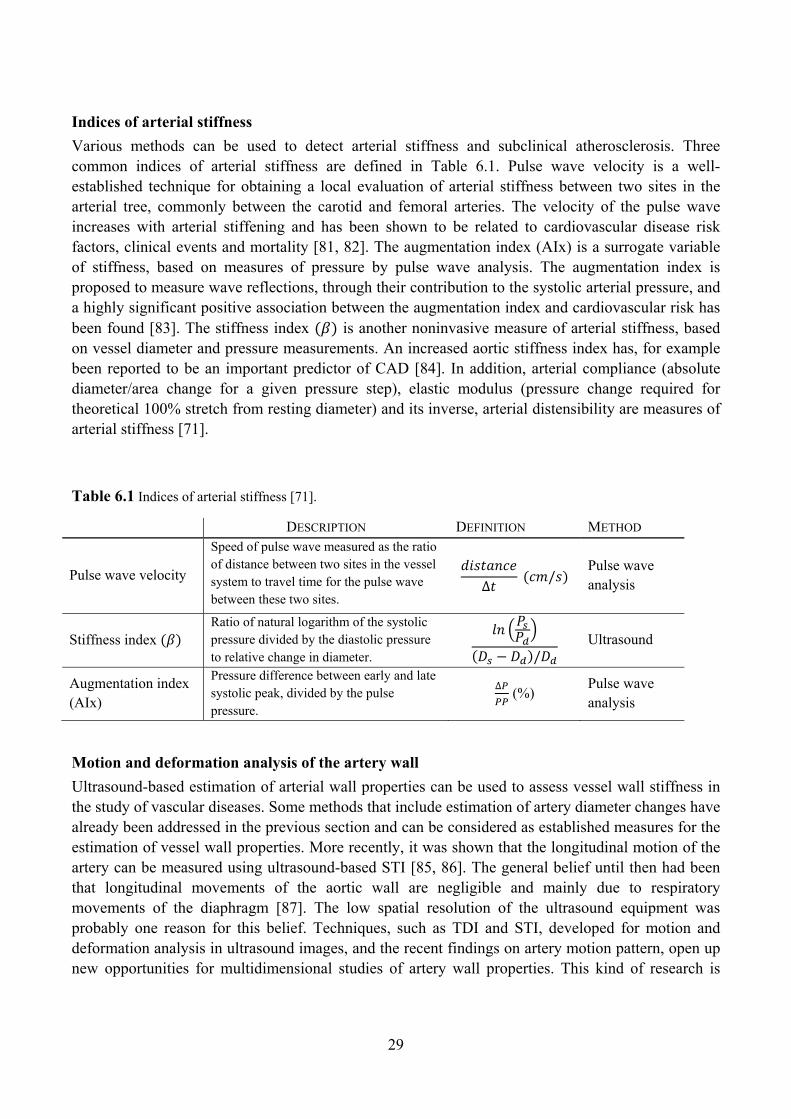
Indices of arterial stiffness Various methods can be used to detect arterial stiffness and subclinical atherosclerosis. Three common indices of arterial stiffness are defined in Table 6.1. Pulse wave velocity is a well-established technique for obtaining a local evaluation of arterial stiffness between two sites in the arterial tree, commonly between the carotid and femoral arteries. The velocity of the pulse wave increases with arterial stiffening and has been shown to be related to cardiovascular disease risk factors, clinical events and mortality [81, 82]. The augmentation index (AIx) is a surrogate variable of stiffness, based on measures of pressure by pulse wave analysis. The augmentation index is proposed to measure wave reflections, through their contribution to the systolic arterial pressure, and a highly significant positive association between the augmentation index and cardiovascular risk has been found [83]. The stiffness index is another noninvasive measure of arterial stiffness, based on vessel diameter and pressure measurements. An increased aortic stiffness index has, for example been reported to be an important predictor of CAD [84]. In addition, arterial compliance (absolute diameter/area change for a given pressure step), elastic modulus (pressure change required for theoretical 100% stretch from resting diameter) and its inverse, arterial distensibility are measures of arterial stiffness [71].
Table 6.1 Indices of arterial stiffness [71].
DESCRIPTION DEFINITION METHOD
Pulse wave velocity
Speed of pulse wave measured as the ratio of distance between two sites in the vessel system to travel time for the pulse wave between these two sites.
∆/
Pulse wave analysis
Stiffness index Ratio of natural logarithm of the systolic pressure divided by the diastolic pressure to relative change in diameter. /
Ultrasound
Augmentation index (AIx)
Pressure difference between early and late systolic peak, divided by the pulse pressure.
∆ (%) Pulse wave analysis
Motion and deformation analysis of the artery wall Ultrasound-based estimation of arterial wall properties can be used to assess vessel wall stiffness in the study of vascular diseases. Some methods that include estimation of artery diameter changes have already been addressed in the previous section and can be considered as established measures for the estimation of vessel wall properties. More recently, it was shown that the longitudinal motion of the artery can be measured using ultrasound-based STI [85, 86]. The general belief until then had been that longitudinal movements of the aortic wall are negligible and mainly due to respiratory movements of the diaphragm [87]. The low spatial resolution of the ultrasound equipment was probably one reason for this belief. Techniques, such as TDI and STI, developed for motion and deformation analysis in ultrasound images, and the recent findings on artery motion pattern, open up new opportunities for multidimensional studies of artery wall properties. This kind of research is
30
currently gaining interest. However, most STI algorithms have been developed for cardiac applications, where they principally have been applied and validated.
Radial motion and strain of the artery wall have commonly been used and validated in phantom setups and in vivo [88-93]. Also Doppler-based studies to estimate elastic properties of the artery wall have been performed and a study showed that reduced radial systolic aortic velocity is an important predictor of CAD [84]. As mentioned above, some studies have reported feasibility to measure longitudinal motion of the artery wall using STI algorithms [85, 86, 92]. However, the assessment of longitudinal strain in the artery wall has been less investigated than the assessment of radial strain. An attempt to measure longitudinal strain in vessel phantoms has been described, but lack of longitudinal stretch in the phantom setup resulted in strain values around zero [92]. Shear strain between the different layers in the artery wall can also be considered when evaluating artery wall properties. The results of a study performing validation in simulations and phantoms showed good accuracy for longitudinal shear strain measurements and the method was also preliminary tested in vivo [94]. Additionally, another study reported some values on longitudinal strain measured in patients with plaque [95].
6.4 Ventricular-arterial coupling
The performance of the cardiovascular system is dependent on the interaction of the heart and the vessel system and an appropriate ventricular-arterial coupling optimizes its function. Different methods have been proposed to analyze the ventricular-arterial coupling, e.g. the ratio of LV systolic elastance to arterial elastance. The LV and the arterial system are optimally coupled to produce stroke work when this ratio equals one [96]. The method described in the next section is another approach that has been suggested for this purpose.
Wave intensity analysis Wave intensity (WI) analysis is a method to study cardiovascular dynamics and ventricular – arterial interaction. The concept is based on forward and backward travelling waves in the arteries and was originally defined as the product of changes in pressure ∆ and flow velocity ∆ during a small time interval. This gives the energy flux per area unit ⁄ and describes the energy transported by the waves in the blood [97]. The clinical use of this method is limited, since it demands simultaneous invasive measurements of pressure and flow. Hence, a noninvasive WI method was developed, where the pressure waveform was obtained by measuring the diameter changes of the artery using an ultrasound-based echo-tracking technique and the flow component by using Doppler velocity measurements [98]. The maximal and minimal values of changes in diameter of the artery were calibrated by systolic and diastolic blood pressures measured with a cuff-type manometer applied to the upper arm. By measuring the variables in the derivative domain, the new noninvasive technique acquired time-normalized WI values ⁄ ⁄ ). The adjusted expression has the advantage of being frame rate independent but, as its unit is ⁄ , it has no real physical meaning [99].
WI values can be separated into forward and backward propagating waves, but only the net WI will be addressed here. The sign of the net WI reveals whether forward or backward waves are dominant
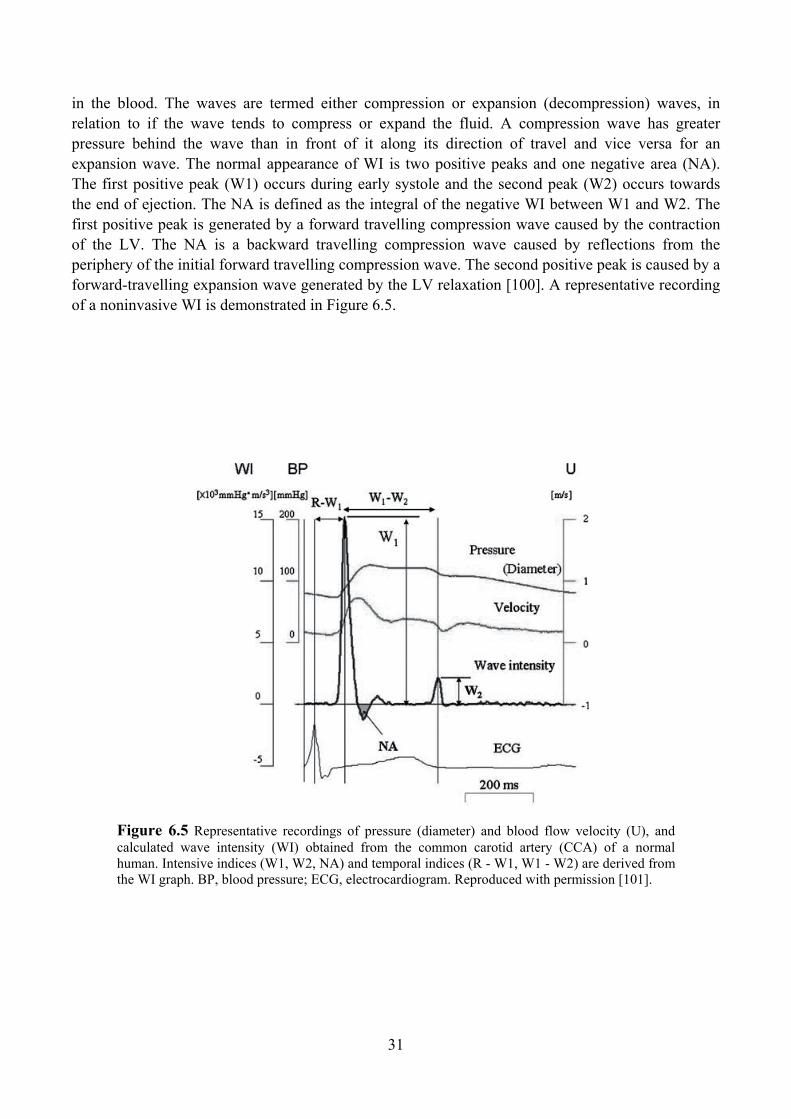
31
in the blood. The waves are termed either compression or expansion (decompression) waves, in relation to if the wave tends to compress or expand the fluid. A compression wave has greater pressure behind the wave than in front of it along its direction of travel and vice versa for an expansion wave. The normal appearance of WI is two positive peaks and one negative area (NA). The first positive peak (W1) occurs during early systole and the second peak (W2) occurs towards the end of ejection. The NA is defined as the integral of the negative WI between W1 and W2. The first positive peak is generated by a forward travelling compression wave caused by the contraction of the LV. The NA is a backward travelling compression wave caused by reflections from the periphery of the initial forward travelling compression wave. The second positive peak is caused by a forward-travelling expansion wave generated by the LV relaxation [100]. A representative recording of a noninvasive WI is demonstrated in Figure 6.5.
Figure 6.5 Representative recordings of pressure (diameter) and blood flow velocity (U), and calculated wave intensity (WI) obtained from the common carotid artery (CCA) of a normal human. Intensive indices (W1, W2, NA) and temporal indices (R - W1, W1 - W2) are derived from the WI graph. BP, blood pressure; ECG, electrocardiogram. Reproduced with permission [101].
32
WI is a concept providing information about the interaction between the heart and the arterial system with the potential to detect subclinical cardiovascular disease. The clinical usefulness, however, is still under discussion [102]. The WI method has been tested in several studies using different patient materials. The amplitude of W2 has shown to increase with LV max dP/dt in a group with CAD, whereas the amplitude of W2 decreased with prolonged LV pressure decay [103]. This designates W1 to be dependent on LV contractility and W2 on LV relaxation. The magnitudes of W1 and W2 have been shown to be reduced by decreased preload [104]. However, this was not verified by Niki et al. who studied the hemodynamic effects of nitroglycerin and found that the changes in W1 was not caused by preload changes [101]. Moreover, W1 has shown to be lower in a group of patients with dilated cardiomyopathy compared with a control group, and a greater W2 has been found in a hypertrophic cardiomyopathy group compared with controls [102]. In a study where WI was measured in a group of hypertensive patients and in a control group, NA was significantly greater in the hypertensive group than in the control group [102]. The noninvasive WI method still has some limitations, by being operator dependent and time-consuming at bedside. Further limitations of the method are its dependence on a relatively large sample volume and the inability to measure within all vessels due to low flow.
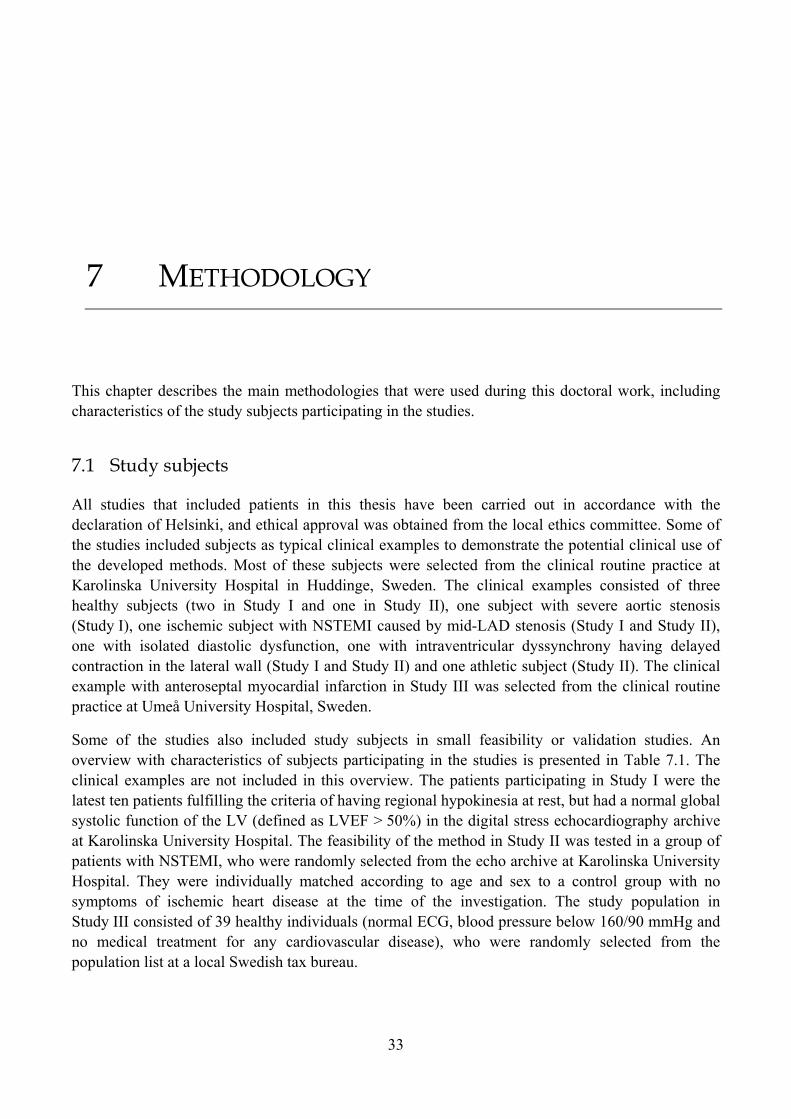
33
7 METHODOLOGY
This chapter describes the main methodologies that were used during this doctoral work, including characteristics of the study subjects participating in the studies.
7.1 Study subjects
All studies that included patients in this thesis have been carried out in accordance with the declaration of Helsinki, and ethical approval was obtained from the local ethics committee. Some of the studies included subjects as typical clinical examples to demonstrate the potential clinical use of the developed methods. Most of these subjects were selected from the clinical routine practice at Karolinska University Hospital in Huddinge, Sweden. The clinical examples consisted of three healthy subjects (two in Study I and one in Study II), one subject with severe aortic stenosis (Study I), one ischemic subject with NSTEMI caused by mid-LAD stenosis (Study I and Study II), one with isolated diastolic dysfunction, one with intraventricular dyssynchrony having delayed contraction in the lateral wall (Study I and Study II) and one athletic subject (Study II). The clinical example with anteroseptal myocardial infarction in Study III was selected from the clinical routine practice at Umeå University Hospital, Sweden.
Some of the studies also included study subjects in small feasibility or validation studies. An overview with characteristics of subjects participating in the studies is presented in Table 7.1. The clinical examples are not included in this overview. The patients participating in Study I were the latest ten patients fulfilling the criteria of having regional hypokinesia at rest, but had a normal global systolic function of the LV (defined as LVEF > 50%) in the digital stress echocardiography archive at Karolinska University Hospital. The feasibility of the method in Study II was tested in a group of patients with NSTEMI, who were randomly selected from the echo archive at Karolinska University Hospital. They were individually matched according to age and sex to a control group with no symptoms of ischemic heart disease at the time of the investigation. The study population in Study III consisted of 39 healthy individuals (normal ECG, blood pressure below 160/90 mmHg and no medical treatment for any cardiovascular disease), who were randomly selected from the population list at a local Swedish tax bureau.
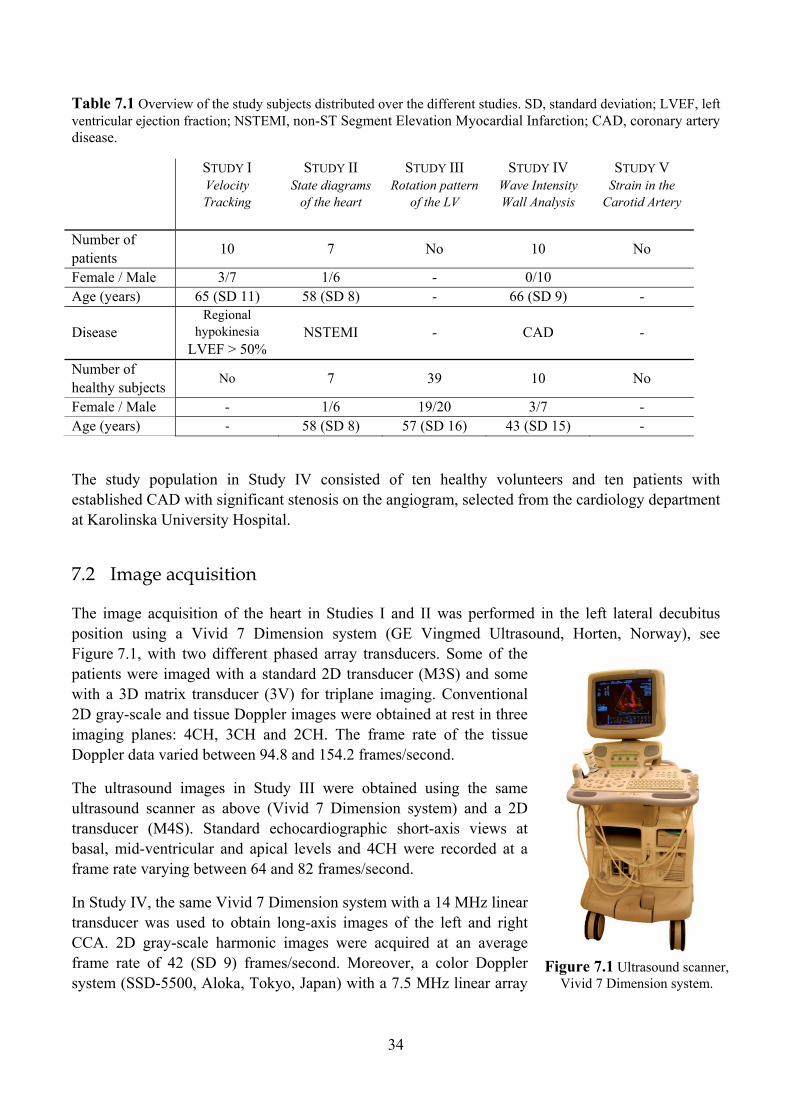
34
Table 7.1 Overview of the study subjects distributed over the different studies. SD, standard deviation; LVEF, left ventricular ejection fraction; NSTEMI, non-ST Segment Elevation Myocardial Infarction; CAD, coronary artery disease.
STUDY I Velocity Tracking
STUDY II State diagrams
of the heart
STUDY III Rotation pattern
of the LV
STUDY IV Wave Intensity Wall Analysis
STUDY V Strain in the
Carotid Artery
Number of patients 10 7 No 10 No
Female / Male 3/7 1/6 - 0/10 Age (years) 65 (SD 11) 58 (SD 8) - 66 (SD 9) -
Disease Regional
hypokinesia LVEF > 50%
NSTEMI - CAD -
Number of healthy subjects
No 7 39 10 No
Female / Male - 1/6 19/20 3/7 - Age (years) - 58 (SD 8) 57 (SD 16) 43 (SD 15) -
The study population in Study IV consisted of ten healthy volunteers and ten patients with established CAD with significant stenosis on the angiogram, selected from the cardiology department at Karolinska University Hospital.
7.2 Image acquisition
The image acquisition of the heart in Studies I and II was performed in the left lateral decubitus position using a Vivid 7 Dimension system (GE Vingmed Ultrasound, Horten, Norway), see Figure 7.1, with two different phased array transducers. Some of the patients were imaged with a standard 2D transducer (M3S) and some with a 3D matrix transducer (3V) for triplane imaging. Conventional 2D gray-scale and tissue Doppler images were obtained at rest in three imaging planes: 4CH, 3CH and 2CH. The frame rate of the tissue Doppler data varied between 94.8 and 154.2 frames/second.
The ultrasound images in Study III were obtained using the same ultrasound scanner as above (Vivid 7 Dimension system) and a 2D transducer (M4S). Standard echocardiographic short-axis views at basal, mid-ventricular and apical levels and 4CH were recorded at a frame rate varying between 64 and 82 frames/second.
In Study IV, the same Vivid 7 Dimension system with a 14 MHz linear transducer was used to obtain long-axis images of the left and right CCA. 2D gray-scale harmonic images were acquired at an average frame rate of 42 (SD 9) frames/second. Moreover, a color Doppler system (SSD-5500, Aloka, Tokyo, Japan) with a 7.5 MHz linear array
Figure 7.1 Ultrasound scanner, Vivid 7 Dimension system.
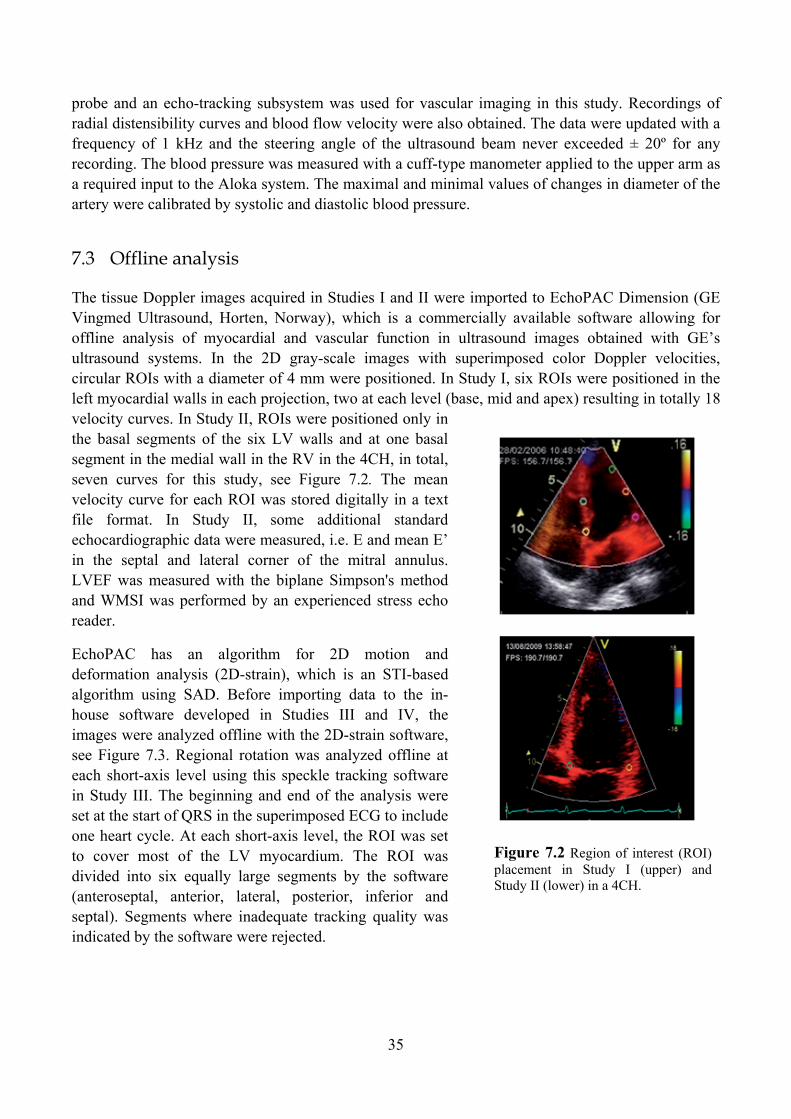
35
probe and an echo-tracking subsystem was used for vascular imaging in this study. Recordings of radial distensibility curves and blood flow velocity were also obtained. The data were updated with a frequency of 1 kHz and the steering angle of the ultrasound beam never exceeded ± 20º for any recording. The blood pressure was measured with a cuff-type manometer applied to the upper arm as a required input to the Aloka system. The maximal and minimal values of changes in diameter of the artery were calibrated by systolic and diastolic blood pressure.
7.3 Offline analysis
The tissue Doppler images acquired in Studies I and II were imported to EchoPAC Dimension (GE Vingmed Ultrasound, Horten, Norway), which is a commercially available software allowing for offline analysis of myocardial and vascular function in ultrasound images obtained with GE’s ultrasound systems. In the 2D gray-scale images with superimposed color Doppler velocities, circular ROIs with a diameter of 4 mm were positioned. In Study I, six ROIs were positioned in the left myocardial walls in each projection, two at each level (base, mid and apex) resulting in totally 18 velocity curves. In Study II, ROIs were positioned only in the basal segments of the six LV walls and at one basal segment in the medial wall in the RV in the 4CH, in total, seven curves for this study, see Figure 7.2. The mean velocity curve for each ROI was stored digitally in a text file format. In Study II, some additional standard echocardiographic data were measured, i.e. E and mean E’ in the septal and lateral corner of the mitral annulus. LVEF was measured with the biplane Simpson's method and WMSI was performed by an experienced stress echo reader.
EchoPAC has an algorithm for 2D motion and deformation analysis (2D-strain), which is an STI-based algorithm using SAD. Before importing data to the in-house software developed in Studies III and IV, the images were analyzed offline with the 2D-strain software, see Figure 7.3. Regional rotation was analyzed offline at each short-axis level using this speckle tracking software in Study III. The beginning and end of the analysis were set at the start of QRS in the superimposed ECG to include one heart cycle. At each short-axis level, the ROI was set to cover most of the LV myocardium. The ROI was divided into six equally large segments by the software (anteroseptal, anterior, lateral, posterior, inferior and septal). Segments where inadequate tracking quality was indicated by the software were rejected.
Figure 7.2 Region of interest (ROI) placement in Study I (upper) and Study II (lower) in a 4CH.
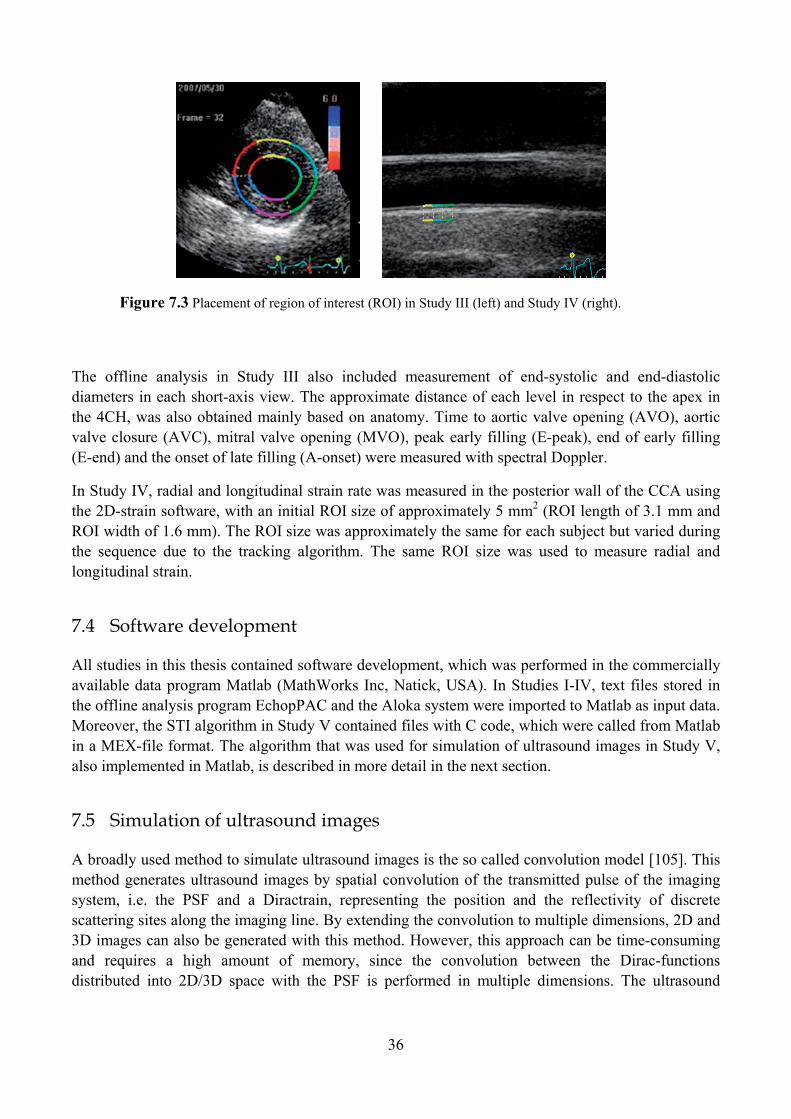
36
Figure 7.3 Placement of region of interest (ROI) in Study III (left) and Study IV (right).
The offline analysis in Study III also included measurement of end-systolic and end-diastolic diameters in each short-axis view. The approximate distance of each level in respect to the apex in the 4CH, was also obtained mainly based on anatomy. Time to aortic valve opening (AVO), aortic valve closure (AVC), mitral valve opening (MVO), peak early filling (E-peak), end of early filling (E-end) and the onset of late filling (A-onset) were measured with spectral Doppler.
In Study IV, radial and longitudinal strain rate was measured in the posterior wall of the CCA using the 2D-strain software, with an initial ROI size of approximately 5 mm2 (ROI length of 3.1 mm and ROI width of 1.6 mm). The ROI size was approximately the same for each subject but varied during the sequence due to the tracking algorithm. The same ROI size was used to measure radial and longitudinal strain.
7.4 Software development
All studies in this thesis contained software development, which was performed in the commercially available data program Matlab (MathWorks Inc, Natick, USA). In Studies I-IV, text files stored in the offline analysis program EchopPAC and the Aloka system were imported to Matlab as input data. Moreover, the STI algorithm in Study V contained files with C code, which were called from Matlab in a MEX-file format. The algorithm that was used for simulation of ultrasound images in Study V, also implemented in Matlab, is described in more detail in the next section.
7.5 Simulation of ultrasound images
A broadly used method to simulate ultrasound images is the so called convolution model [105]. This method generates ultrasound images by spatial convolution of the transmitted pulse of the imaging system, i.e. the PSF and a Diractrain, representing the position and the reflectivity of discrete scattering sites along the imaging line. By extending the convolution to multiple dimensions, 2D and 3D images can also be generated with this method. However, this approach can be time-consuming and requires a high amount of memory, since the convolution between the Dirac-functions distributed into 2D/3D space with the PSF is performed in multiple dimensions. The ultrasound
37
images in Study V were simulated using a generalized convolution model COLE, developed at the Catholic University of Leuven [106]. Using this methodology, image data were produced by multiple 1D convolution, one for each imaging line. The scatterer distribution function , , is determined by (7-1), where is the axial location, the lateral location and the elevation location. Every scatterer, q (N scatterer in total) is projected on the imaging line, where is a Diracfunction, and and the projection factor and the echogenicity of scatterer q, respectively. The RF signal , , is calculated as a conventional 1D convolution between the axial PSF,
and the modified distribution function , , according to (7-2).
(7-1) , , ∑
(7-2) , , , ,
The distance of the scatterer from the image line relative to the lateral/elevation PSF characteristics was taking into account when projecting the scatterer. This can be realized in different ways and was, in this study, realized from an analytical expression of the beam profile. The Gaussian PSF was defined as:
(7-3) exp
where and are the variances of the lateral and elevation PSF respectively. This method has been shown to generate anatomically plausible images at improved calculation time [106].
7.6 Statistical analysis
The main part of all statistical analyses was performed using the standard statistical software SPSS (SPSS inc., Chicago, USA). Student’s t-test was used to compare if a mean value of two groups differed significantly. For individually matched couples, a paired t-test was performed to detect significant differences. Bland-Altman plots were used to illustrate agreement between two methods in Study IV [107]. The difference between the methods was plotted against the mean of both methods for every set of measured values. The limits of agreement were marked as lines in the plot, specified as the average difference ± 1.96 SD of the difference. Another method that was used to express agreement between two methods or variables was Pearson correlation coefficient, which was obtained by dividing the covariance of the two variables by the product of their SD. This method

38
provides a value of linear correlation (r) where r values near 1 represent a strong increasing linear relationship and values near -1 represent a strong decreasing linear relationship. In the case of independent variables, the r-value is equal to zero.
Study III included analysis of circular data, which was performed using the statistical software for circular statistics Oriana 3 (Kovach Computing Services, Anglesey, Wales). Rayleigh’s test of uniformity was used to test if significant mean directions were present. The reproducibility and validation measures of the circular data were analyzed by the correlation between two repeated measurements in Oriana. Excel (Microsoft Corporation, Redmond, USA) was used for analysis of the noncircular data in this study. Reproducibility was calculated using the method of agreement presented as the coefficient of variation (CV), defined as the ratio of the SD to the mean. Cubic regression was applied to demonstrate the relationship between two variables. If nothing else is stated, reported values in this thesis are presented as means and SD. P-values lower or equal to 0.05 were considered significant.
39
8 CONTRIBUTIONS
This chapter contains descriptions of both the methods and the results of the studies that were performed during this doctoral work. The studies were validation, reproducibility and/or clinical feasibility studies of methods quantifying and/or visualizing cardiovascular function. An overview of the studies is provided in Table 8.1. Studies I and II included development of new methods to present information obtained from TDI. Study I focused on amplitude values with detection and visualization of longitudinal velocities in parametric tomograms, whereas Study II contained development of a new approach to describe cardiac mechanics through time intervals. The method in Study III was based on STI and presented a novel concept to describe the rotation pattern of the LV. Study IV introduced a new method to evaluate vascular function and the ventricular – arterial interaction through WI analysis and Study V described an in-silico feasibility study to test the assessment of both radial and longitudinal strain in the CCA. All studies are further described in the papers, attached as appendices of this thesis. The division of work between authors is specified in the last section of this chapter.
8.1 Ultrasound-based methods for the quantification and visualization of cardiac function
Study I comprised development of the Velocity Tracking (VeT) method for the generation of bull’s-eye plots providing a color-coded 2D visualization of longitudinal velocities of the LV walls at specific time points in the cardiac cycle. A bull’s-eye plot is a polar tomogram, which gives a 3D understanding of the function of the LV through color-coding and flattening of the ventricle into a filled circle, see Figure 8.1. An algorithm for the automated detection of PSV, E’ and A’ in TDI velocity curves was implemented and applied on velocity curves from apical, mid and basal segments of the myocardium in three apical projections of the heart. The velocity values were color-coded according to the scale in Figure 8.1 and positioned in the bull’s-eye plot with the same orientation of the myocardial walls as in a conventional short-axis view of the LV. This was followed by linear interpolation to fill the entire plot with velocity values.
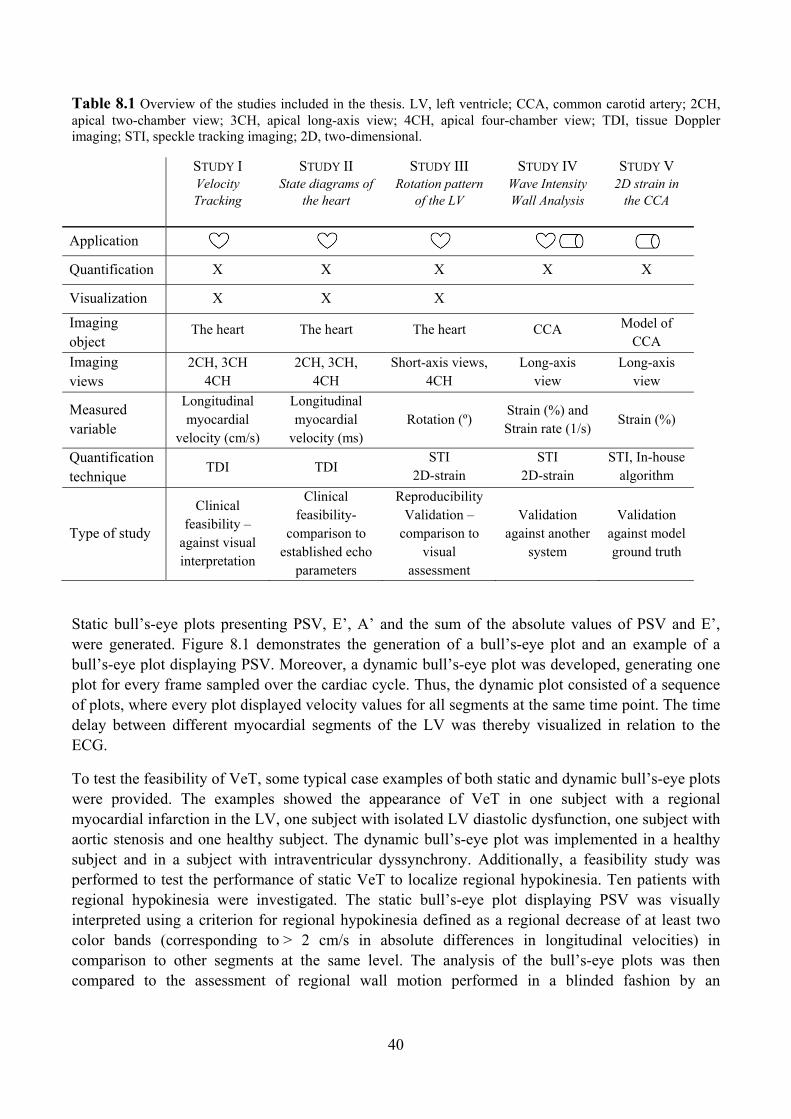
40
Table 8.1 Overview of the studies included in the thesis. LV, left ventricle; CCA, common carotid artery; 2CH, apical two-chamber view; 3CH, apical long-axis view; 4CH, apical four-chamber view; TDI, tissue Doppler imaging; STI, speckle tracking imaging; 2D, two-dimensional.
STUDY I Velocity Tracking
STUDY II State diagrams of
the heart
STUDY III Rotation pattern
of the LV
STUDY IV Wave Intensity Wall Analysis
STUDY V 2D strain in
the CCA
Application
Quantification X X X X X
Visualization X X X
Imaging object
The heart The heart The heart CCA Model of CCA
Imaging views
2CH, 3CH 4CH
2CH, 3CH, 4CH
Short-axis views, 4CH
Long-axis view
Long-axis view
Measured variable
Longitudinal myocardial
velocity (cm/s)
Longitudinal myocardial
velocity (ms)
Rotation (º)
Strain (%) and Strain rate (1/s)
Strain (%)
Quantification technique
TDI TDI STI
2D-strain STI
2D-strain STI, In-house
algorithm
Type of study
Clinical feasibility –
against visual interpretation
Clinical feasibility-
comparison to established echo
parameters
Reproducibility Validation –
comparison to visual
assessment
Validation against another
system
Validation against model ground truth
Static bull’s-eye plots presenting PSV, E’, A’ and the sum of the absolute values of PSV and E’, were generated. Figure 8.1 demonstrates the generation of a bull’s-eye plot and an example of a bull’s-eye plot displaying PSV. Moreover, a dynamic bull’s-eye plot was developed, generating one plot for every frame sampled over the cardiac cycle. Thus, the dynamic plot consisted of a sequence of plots, where every plot displayed velocity values for all segments at the same time point. The time delay between different myocardial segments of the LV was thereby visualized in relation to the ECG.
To test the feasibility of VeT, some typical case examples of both static and dynamic bull’s-eye plots were provided. The examples showed the appearance of VeT in one subject with a regional myocardial infarction in the LV, one subject with isolated LV diastolic dysfunction, one subject with aortic stenosis and one healthy subject. The dynamic bull’s-eye plot was implemented in a healthy subject and in a subject with intraventricular dyssynchrony. Additionally, a feasibility study was performed to test the performance of static VeT to localize regional hypokinesia. Ten patients with regional hypokinesia were investigated. The static bull’s-eye plot displaying PSV was visually interpreted using a criterion for regional hypokinesia defined as a regional decrease of at least two color bands (corresponding to > 2 cm/s in absolute differences in longitudinal velocities) in comparison to other segments at the same level. The analysis of the bull’s-eye plots was then compared to the assessment of regional wall motion performed in a blinded fashion by an
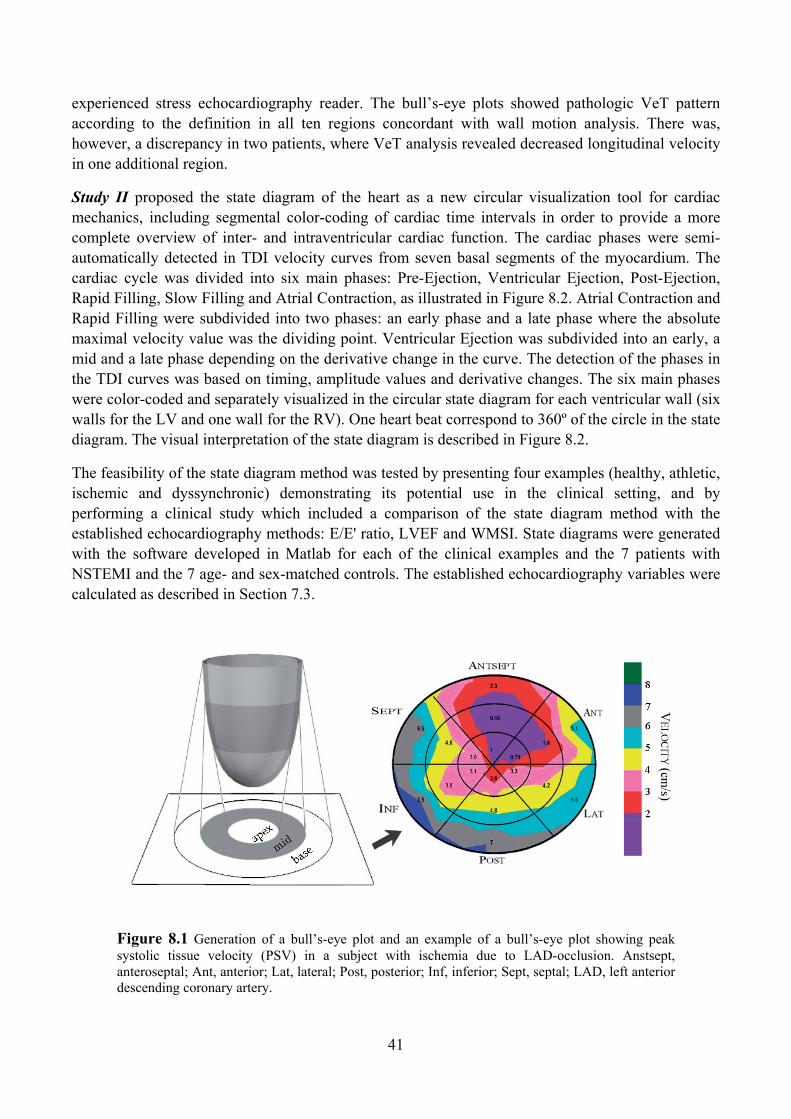
41
experienced stress echocardiography reader. The bull’s-eye plots showed pathologic VeT pattern according to the definition in all ten regions concordant with wall motion analysis. There was, however, a discrepancy in two patients, where VeT analysis revealed decreased longitudinal velocity in one additional region.
Study II proposed the state diagram of the heart as a new circular visualization tool for cardiac mechanics, including segmental color-coding of cardiac time intervals in order to provide a more complete overview of inter- and intraventricular cardiac function. The cardiac phases were semi-automatically detected in TDI velocity curves from seven basal segments of the myocardium. The cardiac cycle was divided into six main phases: Pre-Ejection, Ventricular Ejection, Post-Ejection, Rapid Filling, Slow Filling and Atrial Contraction, as illustrated in Figure 8.2. Atrial Contraction and Rapid Filling were subdivided into two phases: an early phase and a late phase where the absolute maximal velocity value was the dividing point. Ventricular Ejection was subdivided into an early, a mid and a late phase depending on the derivative change in the curve. The detection of the phases in the TDI curves was based on timing, amplitude values and derivative changes. The six main phases were color-coded and separately visualized in the circular state diagram for each ventricular wall (six walls for the LV and one wall for the RV). One heart beat correspond to 360º of the circle in the state diagram. The visual interpretation of the state diagram is described in Figure 8.2.
The feasibility of the state diagram method was tested by presenting four examples (healthy, athletic, ischemic and dyssynchronic) demonstrating its potential use in the clinical setting, and by performing a clinical study which included a comparison of the state diagram method with the established echocardiography methods: E/E' ratio, LVEF and WMSI. State diagrams were generated with the software developed in Matlab for each of the clinical examples and the 7 patients with NSTEMI and the 7 age- and sex-matched controls. The established echocardiography variables were calculated as described in Section 7.3.
Figure 8.1 Generation of a bull’s-eye plot and an example of a bull’s-eye plot showing peak systolic tissue velocity (PSV) in a subject with ischemia due to LAD-occlusion. Anstsept, anteroseptal; Ant, anterior; Lat, lateral; Post, posterior; Inf, inferior; Sept, septal; LAD, left anterior descending coronary artery.
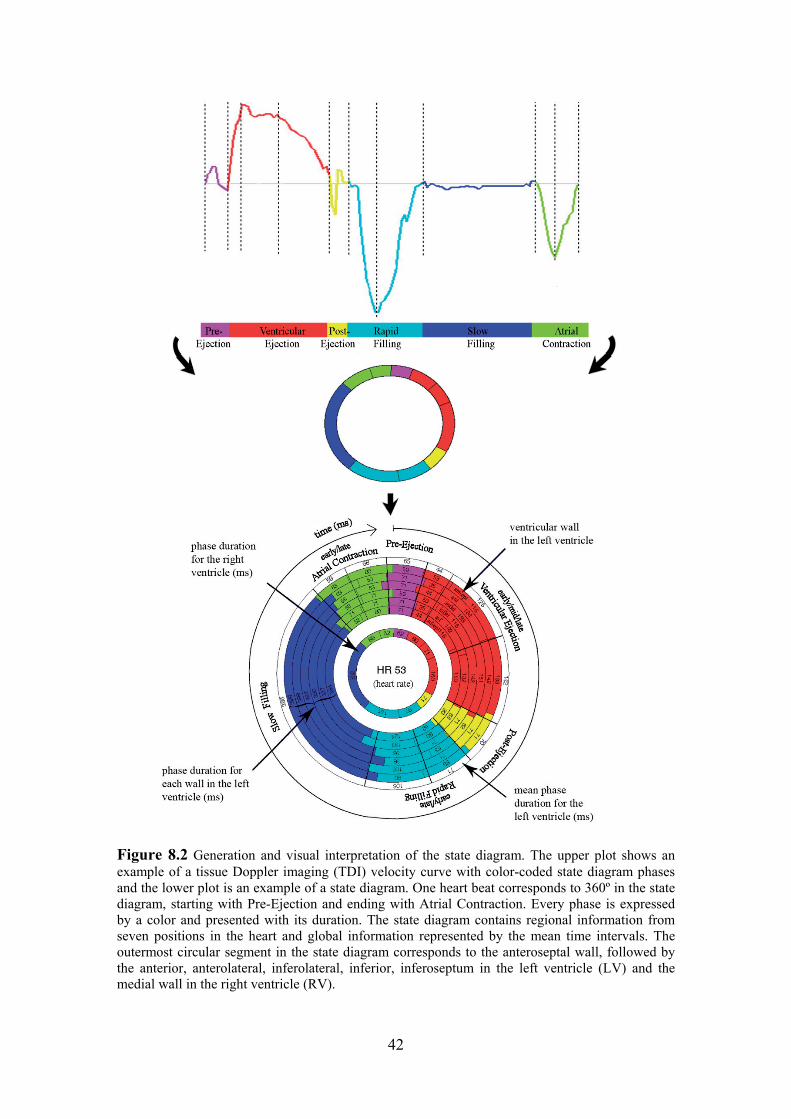
42
Figure 8.2 Generation and visual interpretation of the state diagram. The upper plot shows an example of a tissue Doppler imaging (TDI) velocity curve with color-coded state diagram phases and the lower plot is an example of a state diagram. One heart beat corresponds to 360º in the state diagram, starting with Pre-Ejection and ending with Atrial Contraction. Every phase is expressed by a color and presented with its duration. The state diagram contains regional information from seven positions in the heart and global information represented by the mean time intervals. The outermost circular segment in the state diagram corresponds to the anteroseptal wall, followed by the anterior, anterolateral, inferolateral, inferior, inferoseptum in the left ventricle (LV) and the medial wall in the right ventricle (RV).
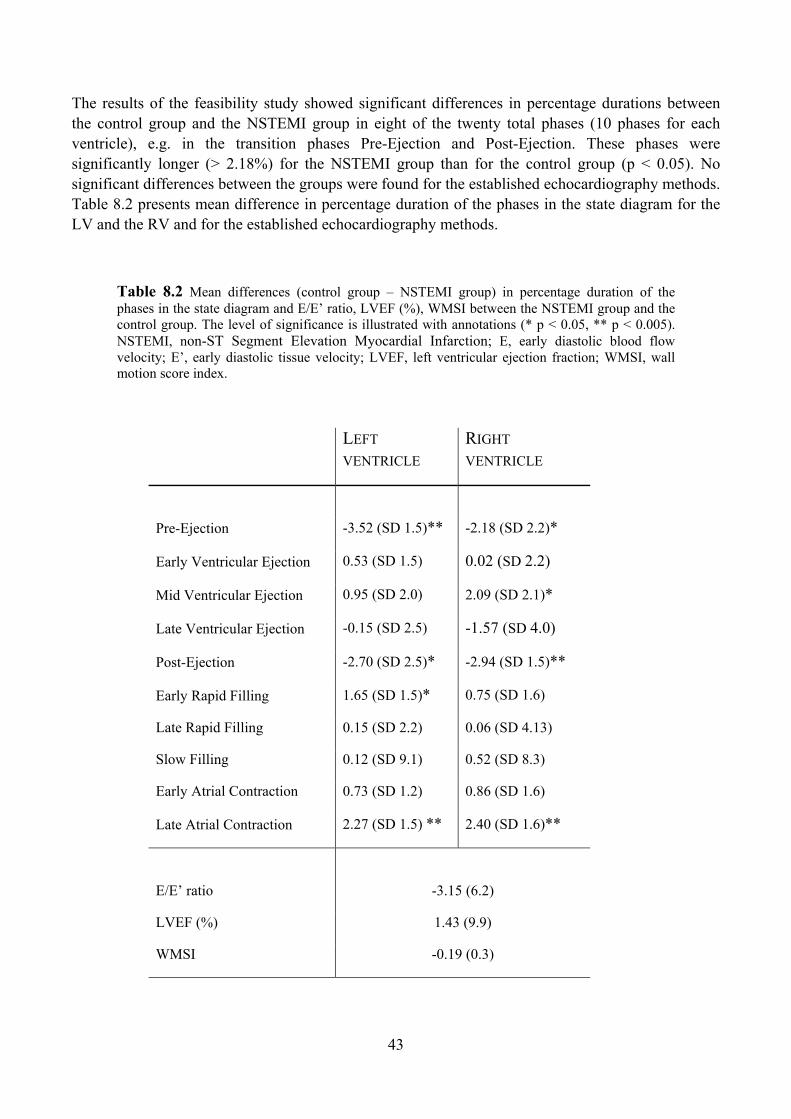
43
The results of the feasibility study showed significant differences in percentage durations between the control group and the NSTEMI group in eight of the twenty total phases (10 phases for each ventricle), e.g. in the transition phases Pre-Ejection and Post-Ejection. These phases were significantly longer (> 2.18%) for the NSTEMI group than for the control group (p < 0.05). No significant differences between the groups were found for the established echocardiography methods. Table 8.2 presents mean difference in percentage duration of the phases in the state diagram for the LV and the RV and for the established echocardiography methods.
Table 8.2 Mean differences (control group – NSTEMI group) in percentage duration of the phases in the state diagram and E/E’ ratio, LVEF (%), WMSI between the NSTEMI group and the control group. The level of significance is illustrated with annotations (* p < 0.05, ** p < 0.005). NSTEMI, non-ST Segment Elevation Myocardial Infarction; E, early diastolic blood flow velocity; E’, early diastolic tissue velocity; LVEF, left ventricular ejection fraction; WMSI, wall motion score index.
LEFT VENTRICLE
RIGHT VENTRICLE
Pre-Ejection -3.52 (SD 1.5)** -2.18 (SD 2.2)*
Early Ventricular Ejection 0.53 (SD 1.5) 0.02 (SD 2.2)
Mid Ventricular Ejection 0.95 (SD 2.0) 2.09 (SD 2.1)*
Late Ventricular Ejection -0.15 (SD 2.5) -1.57 (SD 4.0)
Post-Ejection -2.70 (SD 2.5)* -2.94 (SD 1.5)**
Early Rapid Filling 1.65 (SD 1.5)* 0.75 (SD 1.6)
Late Rapid Filling 0.15 (SD 2.2) 0.06 (SD 4.13)
Slow Filling 0.12 (SD 9.1) 0.52 (SD 8.3)
Early Atrial Contraction 0.73 (SD 1.2) 0.86 (SD 1.6)
Late Atrial Contraction 2.27 (SD 1.5) ** 2.40 (SD 1.6)**
E/E’ ratio
-3.15 (6.2)
1.43 (9.9)
-0.19 (0.3)
LVEF (%)
WMSI
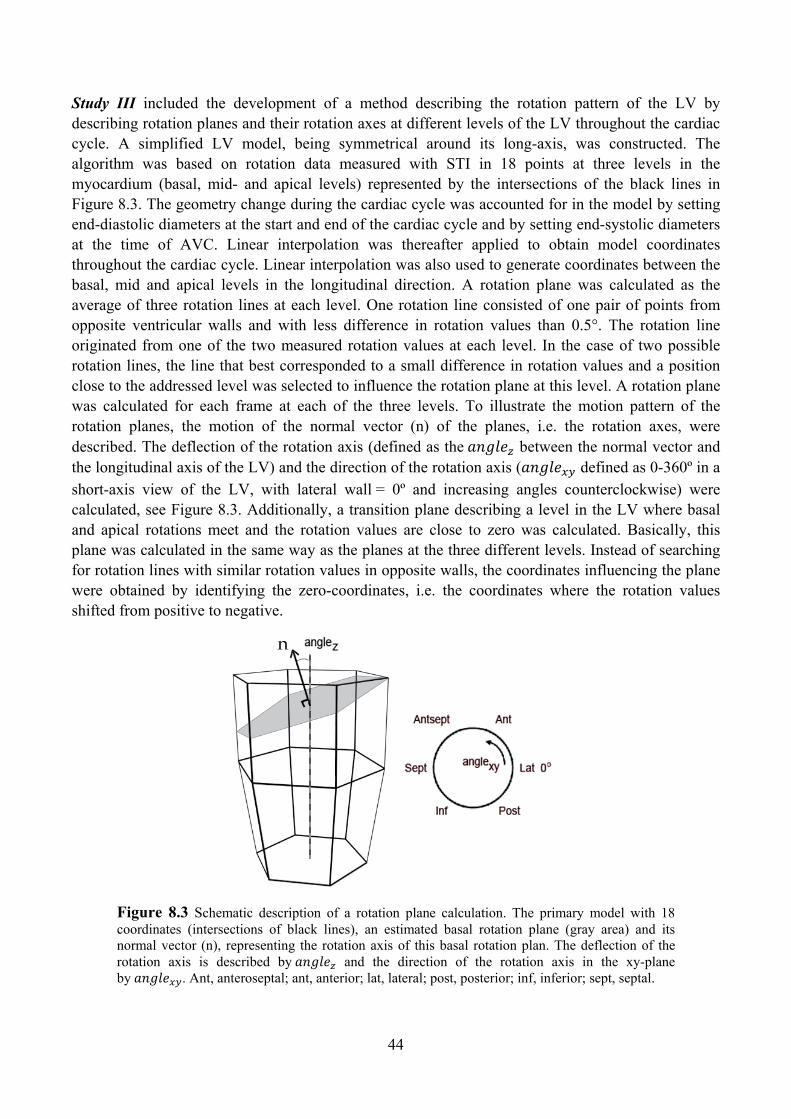
44
Study III included the development of a method describing the rotation pattern of the LV by describing rotation planes and their rotation axes at different levels of the LV throughout the cardiac cycle. A simplified LV model, being symmetrical around its long-axis, was constructed. The algorithm was based on rotation data measured with STI in 18 points at three levels in the myocardium (basal, mid- and apical levels) represented by the intersections of the black lines in Figure 8.3. The geometry change during the cardiac cycle was accounted for in the model by setting end-diastolic diameters at the start and end of the cardiac cycle and by setting end-systolic diameters at the time of AVC. Linear interpolation was thereafter applied to obtain model coordinates throughout the cardiac cycle. Linear interpolation was also used to generate coordinates between the basal, mid and apical levels in the longitudinal direction. A rotation plane was calculated as the average of three rotation lines at each level. One rotation line consisted of one pair of points from opposite ventricular walls and with less difference in rotation values than 0.5°. The rotation line originated from one of the two measured rotation values at each level. In the case of two possible rotation lines, the line that best corresponded to a small difference in rotation values and a position close to the addressed level was selected to influence the rotation plane at this level. A rotation plane was calculated for each frame at each of the three levels. To illustrate the motion pattern of the rotation planes, the motion of the normal vector (n) of the planes, i.e. the rotation axes, were described. The deflection of the rotation axis (defined as the between the normal vector and the longitudinal axis of the LV) and the direction of the rotation axis ( defined as 0-360º in a short-axis view of the LV, with lateral wall = 0º and increasing angles counterclockwise) were calculated, see Figure 8.3. Additionally, a transition plane describing a level in the LV where basal and apical rotations meet and the rotation values are close to zero was calculated. Basically, this plane was calculated in the same way as the planes at the three different levels. Instead of searching for rotation lines with similar rotation values in opposite walls, the coordinates influencing the plane were obtained by identifying the zero-coordinates, i.e. the coordinates where the rotation values shifted from positive to negative.
Figure 8.3 Schematic description of a rotation plane calculation. The primary model with 18 coordinates (intersections of black lines), an estimated basal rotation plane (gray area) and its normal vector (n), representing the rotation axis of this basal rotation plan. The deflection of the rotation axis is described by and the direction of the rotation axis in the xy-plane by . Ant, anteroseptal; ant, anterior; lat, lateral; post, posterior; inf, inferior; sept, septal.
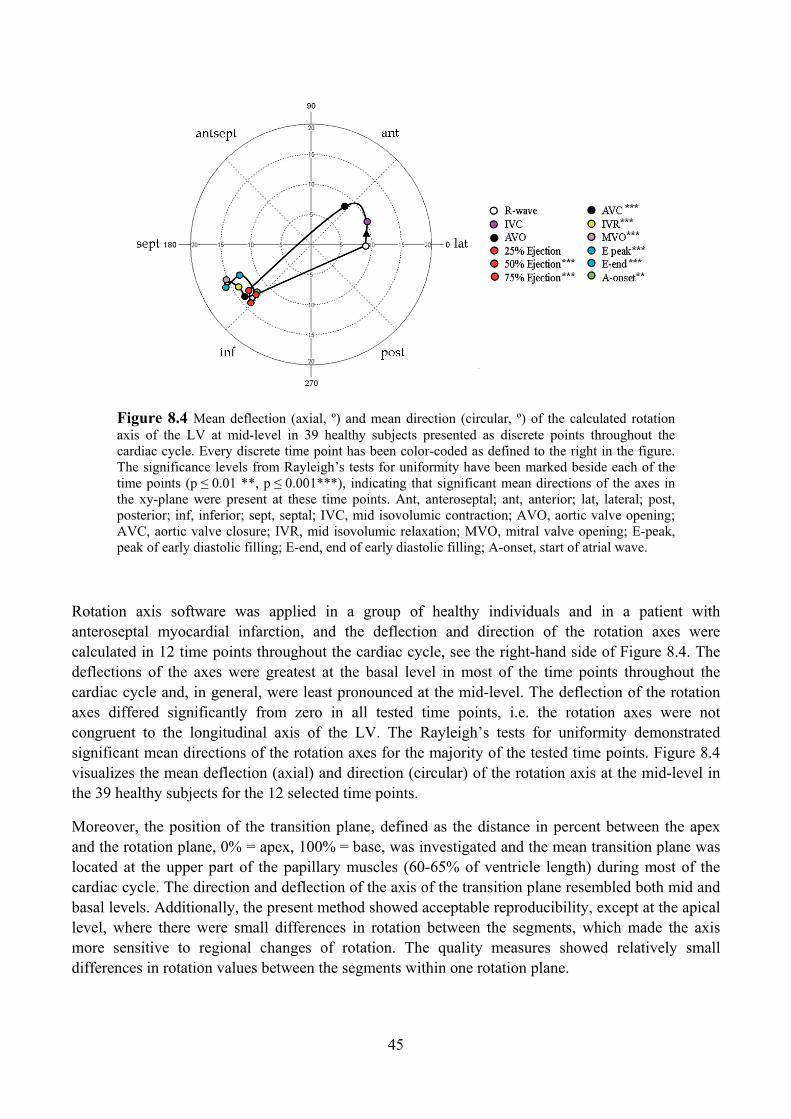
45
Figure 8.4 Mean deflection (axial, º) and mean direction (circular, º) of the calculated rotation axis of the LV at mid-level in 39 healthy subjects presented as discrete points throughout the cardiac cycle. Every discrete time point has been color-coded as defined to the right in the figure. The significance levels from Rayleigh’s tests for uniformity have been marked beside each of the time points (p ≤ 0.01 **, p ≤ 0.001***), indicating that significant mean directions of the axes in the xy-plane were present at these time points. Ant, anteroseptal; ant, anterior; lat, lateral; post, posterior; inf, inferior; sept, septal; IVC, mid isovolumic contraction; AVO, aortic valve opening; AVC, aortic valve closure; IVR, mid isovolumic relaxation; MVO, mitral valve opening; E-peak, peak of early diastolic filling; E-end, end of early diastolic filling; A-onset, start of atrial wave.
Rotation axis software was applied in a group of healthy individuals and in a patient with anteroseptal myocardial infarction, and the deflection and direction of the rotation axes were calculated in 12 time points throughout the cardiac cycle, see the right-hand side of Figure 8.4. The deflections of the axes were greatest at the basal level in most of the time points throughout the cardiac cycle and, in general, were least pronounced at the mid-level. The deflection of the rotation axes differed significantly from zero in all tested time points, i.e. the rotation axes were not congruent to the longitudinal axis of the LV. The Rayleigh’s tests for uniformity demonstrated significant mean directions of the rotation axes for the majority of the tested time points. Figure 8.4 visualizes the mean deflection (axial) and direction (circular) of the rotation axis at the mid-level in the 39 healthy subjects for the 12 selected time points.
Moreover, the position of the transition plane, defined as the distance in percent between the apex and the rotation plane, 0% = apex, 100% = base, was investigated and the mean transition plane was located at the upper part of the papillary muscles (60-65% of ventricle length) during most of the cardiac cycle. The direction and deflection of the axis of the transition plane resembled both mid and basal levels. Additionally, the present method showed acceptable reproducibility, except at the apical level, where there were small differences in rotation between the segments, which made the axis more sensitive to regional changes of rotation. The quality measures showed relatively small differences in rotation values between the segments within one rotation plane.
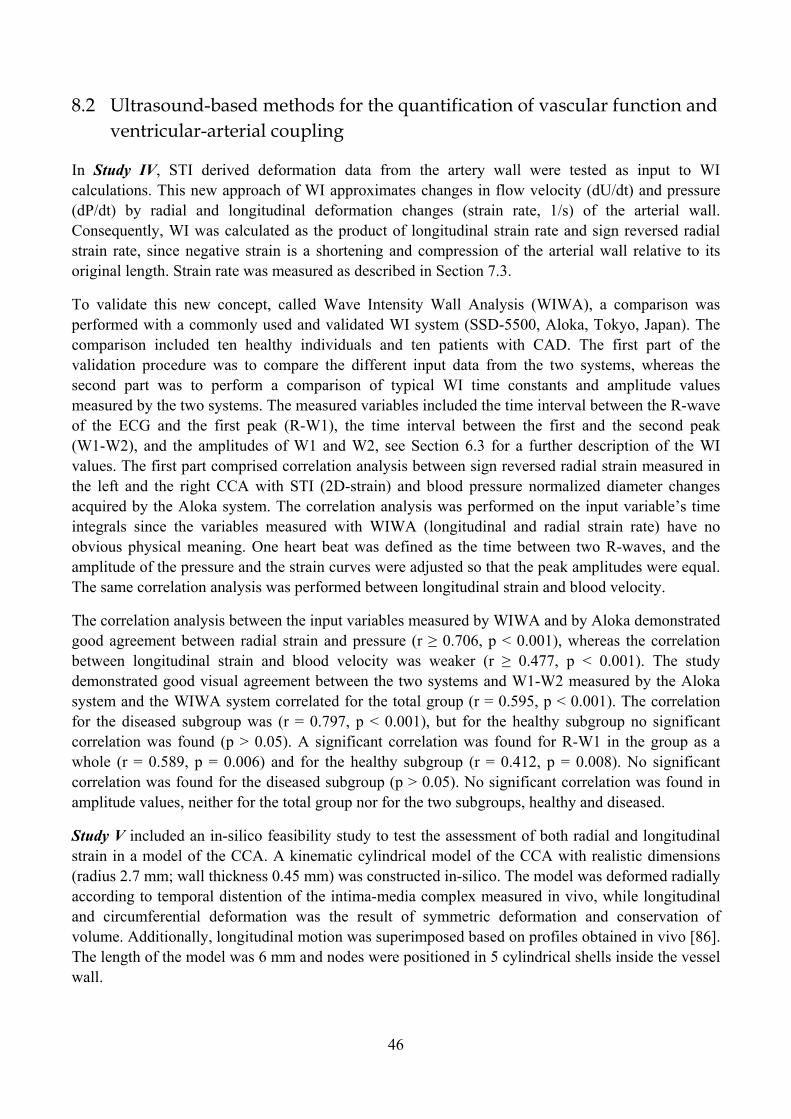
46
8.2 Ultrasound-based methods for the quantification of vascular function and ventricular-arterial coupling
In Study IV, STI derived deformation data from the artery wall were tested as input to WI calculations. This new approach of WI approximates changes in flow velocity (dU/dt) and pressure (dP/dt) by radial and longitudinal deformation changes (strain rate, 1/s) of the arterial wall. Consequently, WI was calculated as the product of longitudinal strain rate and sign reversed radial strain rate, since negative strain is a shortening and compression of the arterial wall relative to its original length. Strain rate was measured as described in Section 7.3.
To validate this new concept, called Wave Intensity Wall Analysis (WIWA), a comparison was performed with a commonly used and validated WI system (SSD-5500, Aloka, Tokyo, Japan). The comparison included ten healthy individuals and ten patients with CAD. The first part of the validation procedure was to compare the different input data from the two systems, whereas the second part was to perform a comparison of typical WI time constants and amplitude values measured by the two systems. The measured variables included the time interval between the R-wave of the ECG and the first peak (R-W1), the time interval between the first and the second peak (W1-W2), and the amplitudes of W1 and W2, see Section 6.3 for a further description of the WI values. The first part comprised correlation analysis between sign reversed radial strain measured in the left and the right CCA with STI (2D-strain) and blood pressure normalized diameter changes acquired by the Aloka system. The correlation analysis was performed on the input variable’s time integrals since the variables measured with WIWA (longitudinal and radial strain rate) have no obvious physical meaning. One heart beat was defined as the time between two R-waves, and the amplitude of the pressure and the strain curves were adjusted so that the peak amplitudes were equal. The same correlation analysis was performed between longitudinal strain and blood velocity.
The correlation analysis between the input variables measured by WIWA and by Aloka demonstrated good agreement between radial strain and pressure (r ≥ 0.706, p < 0.001), whereas the correlation between longitudinal strain and blood velocity was weaker (r ≥ 0.477, p < 0.001). The study demonstrated good visual agreement between the two systems and W1-W2 measured by the Aloka system and the WIWA system correlated for the total group (r = 0.595, p < 0.001). The correlation for the diseased subgroup was (r = 0.797, p < 0.001), but for the healthy subgroup no significant correlation was found (p > 0.05). A significant correlation was found for R-W1 in the group as a whole (r = 0.589, p = 0.006) and for the healthy subgroup (r = 0.412, p = 0.008). No significant correlation was found for the diseased subgroup (p > 0.05). No significant correlation was found in amplitude values, neither for the total group nor for the two subgroups, healthy and diseased.
Study V included an in-silico feasibility study to test the assessment of both radial and longitudinal strain in a model of the CCA. A kinematic cylindrical model of the CCA with realistic dimensions (radius 2.7 mm; wall thickness 0.45 mm) was constructed in-silico. The model was deformed radially according to temporal distention of the intima-media complex measured in vivo, while longitudinal and circumferential deformation was the result of symmetric deformation and conservation of volume. Additionally, longitudinal motion was superimposed based on profiles obtained in vivo [86]. The length of the model was 6 mm and nodes were positioned in 5 cylindrical shells inside the vessel wall.
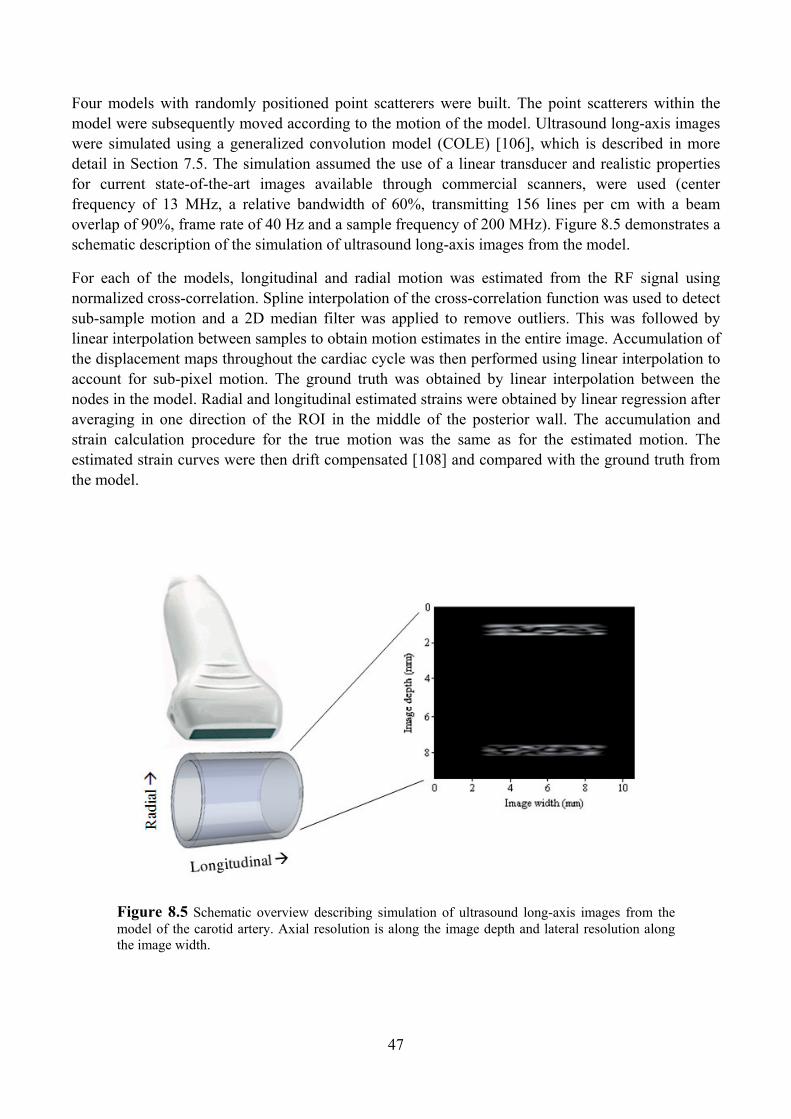
47
Four models with randomly positioned point scatterers were built. The point scatterers within the model were subsequently moved according to the motion of the model. Ultrasound long-axis images were simulated using a generalized convolution model (COLE) [106], which is described in more detail in Section 7.5. The simulation assumed the use of a linear transducer and realistic properties for current state-of-the-art images available through commercial scanners, were used (center frequency of 13 MHz, a relative bandwidth of 60%, transmitting 156 lines per cm with a beam overlap of 90%, frame rate of 40 Hz and a sample frequency of 200 MHz). Figure 8.5 demonstrates a schematic description of the simulation of ultrasound long-axis images from the model.
For each of the models, longitudinal and radial motion was estimated from the RF signal using normalized cross-correlation. Spline interpolation of the cross-correlation function was used to detect sub-sample motion and a 2D median filter was applied to remove outliers. This was followed by linear interpolation between samples to obtain motion estimates in the entire image. Accumulation of the displacement maps throughout the cardiac cycle was then performed using linear interpolation to account for sub-pixel motion. The ground truth was obtained by linear interpolation between the nodes in the model. Radial and longitudinal estimated strains were obtained by linear regression after averaging in one direction of the ROI in the middle of the posterior wall. The accumulation and strain calculation procedure for the true motion was the same as for the estimated motion. The estimated strain curves were then drift compensated [108] and compared with the ground truth from the model.
Figure 8.5 Schematic overview describing simulation of ultrasound long-axis images from the model of the carotid artery. Axial resolution is along the image depth and lateral resolution along the image width.
48
The comparison between the estimated and true strain curves showed good accuracy for both radial and longitudinal strain estimates and the maximal systolic radial strain was estimated to be -12.77 ± 0.4% (ground truth -13.89%) while longitudinal strain was 5.21 ± 0.67% (ground truth 5.3%). The root mean square (RMS) error between the true and estimated strains throughout the cardiac cycle, calculated according to (8-1), where is true strain, estimated strain and number of frames in one cardiac cycle, was 0.6 ± 0.2% and 0.8 ± 0.3% for the radial and longitudinal strain curves, respectively.
(8-1) ∑
8.3 Division of work between authors
L. Å. Brodin and R. Winter introduced the idea and initiated Study I. B. Lind, C. Westholm and P. Jacobsen obtained ultrasound images and tissue Doppler data. R. Winter performed the visual assessment of regional wall motion. The software was developed and applied to the data from the study patients by A. Bjällmark and M. Larsson. C. Westholm and P. Jacobsen contributed with clinical content to the manuscript, which was written by A. Bjällmark, M. Larsson and R. Winter. All authors reviewed the manuscript.
M. Larsson, A. Bjällmark, J. Johnson, S. Lundbäck and L. Å. Brodin contributed to both conception development and analysis and interpretation of data in Study II. M. Larsson and A. Bjällmark contributed with the programming work. M. Larsson and A. Bjällmark wrote the manuscript which was critically reviewed by J. Johnson and S. Lundbäck. R. Winter was the supervisor of echo examinations and also wrote parts of the manuscript. All authors read and approved the final manuscript.
The concept of the method in Study III was developed by U. Gustafsson, P. Lindqvist and A. Waldenström. The algorithm was implemented by M. Larsson and A. Bjällmark. U. Gustafsson acquired the ultrasound images, performed the STI analysis and the manual visual estimation. U. Gustafsson, M. Larsson and A. Waldenström wrote the manuscript and A. Bjällmark contributed to some parts in the manuscript. Finally, all authors reviewed the manuscript.
Study IV was planned and designed by M. Larsson, A. Bjällmark, M. Peolsson and L-Å Brodin. Image acquisition was performed by M. Larsson, A. Bjällmark, B. Lind and R. Balzano. A. Bjällmark and M. Larsson performed the software development and the analysis of the patient data. The manuscript was written by A. Bjällmark and M. Larsson and R. Winter added clinical discussion to the manuscript. All authors reviewed the final manuscript.
All authors contributed to the conception of Study V. The vessel model development, the simulations of ultrasound images and the strain calculations were performed by M. Larsson in close collaboration with F. Kremer. P. Claus and J. D’hooge provided technical and conceptual support during the work. M. Larsson wrote the manuscript, critically reviewed by J. D’hooge. Finally, all authors reviewed and commented on the manuscript.
49
9 DISCUSSION
Accurate methods for the assessment of cardiovascular function are crucial to reduce mortality and morbidity connected to cardiovascular diseases. The optimal procedure would be to detect early indicators of disease, enabling both the prediction and prevention of cardiovascular disease. Ultrasound is the cornerstone for the assessment of cardiovascular function in the clinical setting and also for research purposes to increase the understanding of the cardiovascular system and to improve the ability to detect cardiovascular diseases, with the advantages of being a noninvasive, safe, widely available and a relatively inexpensive imaging modality. Nevertheless, the subjective and qualitative nature of the interpretation of ultrasound images remains its major disadvantage. Visual interpretation, often performed in, for example, stress echocardiography (i.e. echocardiography at different workloads and heart rates) to detect CAD by regional wall motion analysis, is associated with a high user dependency and requires an experienced physician. Picano et al. showed that the diagnostic accuracy of wall motion analysis of stress echocardiography images depends on the specific experience of the physician interpreting the test. A sufficient learning curve of 100 stress echocardiography studies supervised by an experienced stress echo reader is adequate to reach a sufficient high diagnostic accuracy [109]. Additionally, studies have shown that visual recognition is limited [110, 111] and that interpretation through visual assessment is related to significant inter- and intra - observer variability [112]. Moreover, human ability for visual recognition is determined by the physical limitations imposed by the ocular system, e.g. the eye cannot perceive a frame rate higher than 50 Hz.
To overcome the qualitative nature of assessment and the user dependency problem, new techniques for easy and fast standardized quantification and visualization of important markers of diseases are needed. Robust techniques with these qualities have the potential to be clinically valuable tools in order to reduce objectivity and also to possibly improve both sensitivity and specificity in detecting cardiovascular diseases. TDI and STI have, among other methods, been proposed to provide an objective measure of cardiovascular function [36, 113, 114]. However, the literature essentially lacks quantitative comparisons between visual assessments and these techniques and it is still doubted if they really lead to faster diagnosing and improved diagnostic accuracy [115]. Obviously, these methods still have limitations and need to be optimized and further developed. In particular, the complexity of the analysis using these methods must be reduced to make them more practical for clinical use. In order to provide an overview of the complex function of the cardiovascular system,
50
important data must be extracted and visualized in an easier way. This could possibly decrease the time-consuming steps bedside and reduce the dependency on experience. Accordingly, methods allowing for a simplified and more accurate analysis based on these methods are needed. This is closely connected to the general aim of this thesis work, which was to develop applications for quantification and visualization of cardiovascular function using ultrasound. The five papers included in this thesis describe development and testing of such methods and will, in this discussion, first be address one by one, followed by a general discussion about technical limitations, before the future potential of the methods is addressed.
9.1 Velocity Tracking
The Velocity Tracking (VeT) method developed in Study I allowed for a quick and easily comprehensible visual analysis and a 3D understanding of LV longitudinal velocities in a single image through stepwise color-coded bull’s-eye plots. Decreased systolic and diastolic longitudinal velocities have, in previous studies, been shown to be an expression of regionally reduced systolic and diastolic function in various cardiac diseases [44, 45, 116]. The measurement of velocities using offline techniques can, however, be tedious and the presentation of data is not always easily understandable. The clinical examples and the feasibility study showed that VeT potentially makes TDI data more easily understandable and that VeT can be helpful for the visualization of characteristic pathological patterns such as regional hypokinesia, due to myocardial ischemia or myocardial infarction, aortic stenosis, isolated LV diastolic dysfunction and intraventricular dyssynchrony. However, the dynamic bull’s-eye plot might be complicated to overview and a program where the plot can be evaluated frame by frame is required. On the other hand, the dynamic bull’s-eye plot contains temporal information in the same context as the static bull’s-eye plot and is not dependent on the automated detection of peak velocities.
The clinical study indicated a high feasibility of the method, however, care must be taken in the interpretation of the results because the number of patients was small. The sum of PSV and E’ is a possibly more sensitive marker of regional differences, because PSV and E’ were shown to have a considerable covariation in a previous study [117]. Diastolic dysfunction has also been proven as a sensitive marker of myocardial ischemia. Consequently, a variable consisting of the sum of PSV and E’ could be expected to display ongoing myocardial ischemia in the bull’s-eye plot. This is supported in our example of a patient having an anterior myocardial infarction, where the difference between ischemic and nonischemic myocardium is attenuated in the bull’s-eye plot using the sum of PSV and E’, compared to PSV alone. This was also suggested by an additional study in which VeT was compared to expert wall motion scoring and bedside echo in twenty patients with NSTEMI and 10 controls [118]. The sensitivity to detect ischemia for the sum of PSV and E’ obtained with the VeT software was 85% and the specificity 60%, whereas the corresponding values for expert wall motion scoring were 75% and 40%, respectively. For regional analysis, VeT and wall motion scoring showed comparable results with a correct regional outcome in approximately 50% of the patients, both superior to bedside echo. The “gold standard” in this study was an expert consensus based on ECG findings, angiography and the clinical picture.
Bull’s-eye presentation of velocity data was first proposed by Hunziker et al., for use in stress echocardiogram reading, but that method used continuous color-coding of myocardial velocities and
51
did not interpolate between different projections [119]. The advantages with discrete color bands, which were used in the present bull’s-eye presentation, are the additional visual qualitative overview and regional comparison of Lagranian strain rate [120]. A decrease in regional strain rate will create a pattern of increasing distance of the color bands. Thus, regional decrease in strain rate can easily be identified from broader color bands.
9.2 State diagrams of the heart
The feasibility of the state diagram method, visualizing cardiac mechanics through cardiac phases, was tested in Study II by performing a clinical study, which included a comparison of the state diagram method with established echocardiography methods and by clinical examples demonstrating its potential use in the clinical setting. However, cardiac time intervals have been described as a measure of cardiac performance before, where prolongation, shortening and delay of the different time intervals have been evaluated as markers of cardiac dysfunction [49, 50]. The novelty with the state diagram method was to provide a tool for visualization of cardiac mechanics in an easily understandable way, through color-coding of cardiac phases from different segments in the myocardium. With this approach it was possible to overview and evaluate the relationships between the phases from one entire cardiac cycle.
The cardiac phases in the state diagram were defined according to motion shifts of the AV-plane, since this motion stands for the main part of the pumping function of the heart and thereby largely represents cardiac mechanics. This motion was captured by measuring myocardial velocities in close connection to the AV-plane. Motion shifts of the AV-plane, associated with opening and closing of the valves are critical events that affect the performance of the heart, since it is crucial for the heart to preserve flow and muscle dynamics throughout the cardiac cycle when the AV-plane has to be accelerated, retarded and change direction. These events have, in this study, been included in the phases Pre-Ejection and Post-Ejection, names which refer to their close link to the beginning and end of Ventricular Ejection. Pre-Ejection and Post-Ejection differ from the traditionally defined isovolumic phases by including volume redistributions between the atria, the ventricles and their outlets. Events connected to Pre-Ejection and Post-Ejection can be considered to result from pre- and postsystolic reshaping of the muscles in the ventricles. The starting and end points of Pre-Ejection and Post-Ejection were thus defined as generation or relaxation of muscle forces in connection to opening and closure of the valves in the heart. The pre- and postsystolic phases are important considerations when evaluating cardiac function and the prolongation of these time intervals is associated with cardiac dysfunction [50], which was confirmed in this study by a significant prolongation of these phases in NSTEMI subjects compared to the control subjects (p < 0.05).
The state diagrams in the four typical examples visualized the cardiac function in the different subjects, e.g. by prolonged Pre-Ejection and Post-Ejection in the diseased subjects. Furthermore, the clinical examples of the ischemic and the dyssynchronic subjects indicated that the state diagram could visualize regional heart muscle disturbances due to myocardial infarction, ongoing myocardial ischemia and electromechanical disturbances of the myocardium in patients with heart failure. Ventricular dyssynchrony disturbs the synchronous pumping and relaxation function of the heart leading to a reduced diastolic filling time and a post-systolic regional contraction [55], both of which are easily detected in the state diagram. Coronary blood flow is impeded during systole which makes
52
the duration of diastole an important determinant of myocardial perfusion. Adjustment of the diastolic time fraction has been proposed as a protective intervention to preserve coronary blood flow [56]. In LV dyssynchrony, the regions with a dyssynchronic contracting myocardium pattern can be identified with the state diagram method and the information obtained could potentially improve the selection of patients referred to cardiac resynchronization therapy. The state diagram acquired in the subject with dyssynchrony clearly visualized how regional functions create impacts on all the phases in the global state diagram. A prolonged Post-Ejection, usually referred to as diastolic dysfunction in individuals with dyssynchrony disorders can, by visualization with the state diagram, be demonstrated to originate from dyssynchrony occurring before this phase.
The state diagram method performed better than the other established echocardiographic variables (E/E' ratio, LVEF and WMSI) when investigating differences between the NSTEMI group and the control group. The significant differences between the groups that were found when using the state diagram indicated the state diagram method as a potentially more sensitive tool to detect NSTEMI compared to other established echocardiographic variables [39, 41]. Moreover, it should be underlined that the state diagram method allowed differences in the groups to be identified, even though the control group also demonstrated some clinical features.
There are a number of limitations associated with the state diagram displaying the cardiac phases in a circle. The first version of the state diagram, used in the present study, did not visualize differences in heart rate, which can make the comparison of data difficult since different heart rates influence the relation of the cardiac phases. However, the cyclic display is attractive because it illustrates the idea of the heart as a never-ending pump going on and on. The compensation for heart rate remains an issue for future versions of the method.
9.3 Rotation pattern of the left ventricle
The novel method developed in Study III introduced a new concept to evaluate LV function, by estimating planes of rotation at different levels of the LV and by describing the motion pattern of the rotation axes. This study demonstrated that the LV does not rotate around its longitudinal axis, but around another axis, the direction of which changes in a complex manner during the cardiac cycle. By displaying data on deflection and direction of the rotation axis at different levels, a unique overview of the rotation pattern of the LV was achieved.
The differences in direction and deflection of the axes during pre-ejection and ejection might indicate different rotational functions of the subendocardial and the subepicardial layers, presuming each myocardial layer is the main contributor in the respective phases. The rotation axes were directed towards the anterolateral area during pre-ejection, which could be an effect of the early activation of subendocardial fibers. During the ejection phase, when the subepicardial fibers are supposedly responsible for most of the twisting motion, the direction of the axes changed towards the outflow area.
The orientation of the rotation axis remains stationary as long as there is a similar change of rotation in all segments of the LV. However, if the rotation in one or a few segments alters in respect to other segments, the orientation of the axis in space will differ. Therefore, this method seemed suitable for
53
differentiating stable from unstable rotation patterns, where a stable rotation pattern describes uniform changes in rotation amplitudes. Moreover, absence of a transition plane indicates that all levels of the LV are rotating in the same direction, meaning that there is no effective twist. Absence and the position of the transition plane might both be markers of dysfunction. Clear differences in rotation pattern between the healthy group and the patient with ischemia and anteroseptal post infarction were seen. However, to validate the clinical use of this novel method, further studies are needed in pertinent cardiac diseases.
Creating a dynamic 3D model from fixed 2D measurements has obvious limitations in through-plane motion and angular dependency of the recordings. The current method makes use of a simplified model of the LV, where the shape of the ventricle was assumed to be symmetrical around a straight long-axis in the centre of the LV and the radial motions were based on measurements from three short-axis levels. Furthermore, the geometry change of the LV over time was assumed to be linear and the constant volumes during the isovolumic periods were not taken into account. No adjustment for the longitudinal motion was considered as the best solution, as the recordings were at fixed positions relative to the apex. The analysis was based on an assumption of the rotation axis being the same as the longitudinal axis, due to the short-axis recordings being presumably perpendicular to the longitudinal axis of the LV, meaning rotation was measured around the longitudinal axis but rotation planes were calculated around different axes, based on assumptions of interpolation.
The quality and reproducibility measurements indicate acceptable stability in the method and with improvement of the speckle tracking software, the reproducibility would likely be even better. The method could be further improved by more accurate geometry measurements over time. This could be achieved by 3D speckle tracking echocardiography, allowing for estimation of rotation in any direction, also making user dependency less pronounced.
9.4 Wave Intensity Wall Analysis
The results from Study IV indicated that STI derived deformation variables measured in the wall of CCA can possibly be used as input for the calculation of WI. The results of the correlation analysis between the input variables to WI analysis by Wave Intensity Wall Analysis (WIWA) and by Aloka demonstrated good agreement in the radial direction between radial strain and pressure, but weaker agreement in the longitudinal direction between longitudinal strain and blood velocity. The disagreement in the longitudinal direction can have several possible explanations and it is not certain that the dissimilarity is disadvantageous to the performance of WIWA. The methods measure different arterial parameters, in the blood pool and in the arterial wall, respectively. Since arterial stiffness is related to the vascular wall, a natural advantage would be to perform the measurements in the arterial wall instead of in the blood pool. Further investigations of how to interpret the information in the input variables to WIWA should be performed. Still, the advantage with deformation variables measured in the arterial wall is their direct relation to the tissue properties of the wall.
54
The measured time interval W1–W2 demonstrated reasonably good agreement between the two tested systems, whereas the agreement between the measured variable R–W1 was relatively poor and no reasonable correlation was found between the methods. However, this poor agreement can partly be explained by the low frame rate used by the WIWA system (42 frames/s). The results showed an achieved accuracy of approximately 50 ms, which corresponded to a difference between three sampled frames (approximately 48 ms). A frame rate of 42 frames/s is considered low because there is a substantial risk of losing information with an interframe interval of approximately 24 ms. To avoid this problem, the frame rate of the WIWA method was increased in a recent unpublished study.
The amplitude of the acquired WI graph is not comparable to any other WI measurement system without an adjusting constant. Furthermore, the same pressure change might not induce the same strain rate change in stiff as in compliant arteries. This means that the amplitude values measured with the WIWA system contain useful information about the elasticity of the arterial wall, even though they are not directly comparable to the amplitudes measured by the Aloka system. This is even more critical if the sample volume is small and selected in a very stiff region. The abovementioned issues correspond to the results of the study where the relation between the amplitude values, W1 and W2, of the two systems showed high SD, a result which can also partly be explained by the low frame rate of the WIWA system. However, for measurements of timing, the WIWA method seemed to be useful, and potentially, with increased knowledge about the interaction of hemodynamic variables and strain variables in the arterial wall, it might be possible to interpret and clinically use all the information from the WIWA system.
The WIWA system has several potential advantages over previous methods to calculate WI. The WIWA system allows for fast performance of WI measurement, which is primarily achieved by reducing the amount of time-consuming steps bedside, by only requiring a sequence of high quality 2D gray-scale images of the artery. Further analysis is then performed offline. In addition, the technique is not limited to measurements in larger arteries with a large flow component but also enables measurements to be made in small, peripheral vessels. The mechanical behavior of the arterial wall may be dependent on the density of surrounding tissues. For instance, a vessel near boney tissue has a presumably smaller diameter change per pressure unit. Since measurements can be made at only one site in the artery, WIWA becomes less dependent on these factors. It also opens up possibilities to investigate how the arterial wall characteristics change relative the distance to a plaque.
According to the results in Study IV, it seemed feasible to use the mechanical properties of the arterial wall, i.e. strain rate measurements as input variables to WI analysis, even though the results did not show a perfect agreement with the already established WI method. Study IV made use of a commercially available software for STI analysis, 2D-strain (EchoPAC). However, this software was developed for cardiac applications and has foremost been applied and validated as such. Study V was thus a continuation of Study IV, in order to test if STI is accurately applicable to vessels. Development and optimization of STI for vascular applications have the potential to increase the accuracy of the WIWA method and to provide new measures of vascular function, arterial stiffness and risk stratification of plaque rupture.
55
9.5 Strain assessment in the carotid artery
In Study V, the feasibility of simultaneous assessment of radial and longitudinal strain in an in-silico model of the CCA was tested using commercially available hardware. The results showed good accuracy for radial strain estimates in the vessel wall, which confirmed results of previous studies [72, 88, 92, 121]. Also, the estimated longitudinal strain showed good agreement with the true strain of the model. Due to lower spatial resolution in the lateral direction of the image, longitudinal strain estimates were expected to be less accurate than the radial ones. However, in order to compensate for this, a larger motion gradient estimation length in the lateral direction was used. As such, we could obtain similar accuracy in estimating peak axial and lateral strain values at the cost of reduced resolution of the lateral strain estimates. Nevertheless, the lateral strain profiles remained noisier, as seen from the higher RMS error over the heart cycle.
Most elastography studies in vessels have focused on radial strain and only a few have addressed strain in the longitudinal axis of the vessel wall. Some limited attempts to measure and test the feasibility of assessing longitudinal strain and shear strain of the vessel wall in phantoms and in vivo have been reported in the literature [92, 94, 122]. As the longitudinal deformation is a natural part of the vessel wall motion pattern, it has the potential to increase the understanding of vascular mechanics and to improve the ability to detect disturbances in vessel wall function. However, more research is required to further validate the assessment of longitudinal strain in vessels and to determine its clinical value and importance. A possible application could be to study strain along the longitudinal axis of a plaque to provide information on the plaque’s composition to be able to detect vulnerable plaques and predict the risk of a carotid plaque rupture. One study suggests that heterogeneity of arterial mechanics should also be analyzed along the longitudinal axis, because it may generate stress concentrations at the junction of distensible and stiff areas [95]. Still, this has to be evaluated in further studies.
The performed feasibility study was limited to in-silico measurements, which should be considered when interpreting the results. The step to in vivo measurements is challenging, but it would be of great interest to test the feasibility of this algorithm in vivo. The motion pattern of the model used in this study was based on data obtained in vivo, except for the longitudinal strain. The latter was obtained by applying the principle of conservation of volume, which seems a realistic assumption for a vessel wall. Moreover, similar longitudinal strain values as the one found in our model have recently been reported in an experimental study [123]. Consequently, it may be of benefit to exploit this incompressibility further by coupling the axial and lateral strain estimates as proposed by Skovoroda et al. [124]. This remains a topic of further research. The current model was based on data measured in a young healthy individual. As such, the more difficult setting was tested as IMT normally increases with age and vascular disease. Assessing strain in larger regions should make the estimation more robust.
56
9.6 General limitations
Achieving accurate results from the methods developed within this thesis work was partly dependent on the quality and resolution of the acquired ultrasound images. As such, the experience of the sonographer, and for example, transducer placement are user dependent factors that can have an influence on the image quality [125].
A sufficient high frame rate of the acquired ultrasound images is important, in particular when measuring motions of high frequencies. According to the Nyquist sample theorem, the maximum detected frequency of the sampled signal is half of the frame rate. Thus, decreased frame rate has the same effect as low pass filtering the velocity. When using frame rates that are too low, there is a substantial risk of losing information and underestimating amplitude values in motion and deformation curves. Generally, methods relying on quantification of cardiovascular function through single amplitude values, as some of the methods in this thesis do, are most likely more sensitive to low frame rate, noise and filtering effects than methods based on timing information as, for example, the state diagram method in Study II. The curves obtained with TDI and STI algorithms are also influenced by filtering effects. A filtering function that smoothes the curve first of all affects rapid myocardial movements, i.e. the velocities measured during IVCT and IVRT. The impact of a temporal filter increases with an increased filter width, which can lead to an underestimation of amplitude values [126]. The frame rate and filter widths used in the present cardiac studies were selected to catch motions of high frequencies and to preserve IVCT, IVRT and the general shape of the curves. The frame rate in Studies IV and V was lower and should be increased in further studies.
The majority of the methods in this thesis are based on measurements of variables in different views of the heart, and thereby provide an analysis in different cardiac cycles, when using a 2D transducer. Thus, errors could have occurred since the variables were not measured in the same heart beat and since no correction for respiratory influence was performed. However, in most cases the beat-to-beat differences are small and most likely negligible. In the vast majority of cases it is very unlikely that this will have any significant effect. The study subjects were at rest and had a stable heart rate during the examinations. However, the choice of using a 2D transducer or a triplane transducer is a trade-off between temporal resolution and the importance of doing the analysis in the same cardiac cycle. Future ultrasound examinations will most likely be performed with 3D transducers, since the capacity of the 3D transducers to perform high frame rate images is increasing.
The accuracy and reproducibility of the methods in this thesis can be compared with the accuracy and reproducibility established for TDI and STI, since the developed methods are based on them. TDI and STI have been validated and a reasonably good reproducibility has been found [37, 67, 127, 128]. Still, the accuracy and reproducibility of the methods have to be further addressed in future studies. By using the Doppler velocities, the problem of angle dependency occurs [129]. The velocities are only a projection of the true velocity vector onto the direction of the beams from the ultrasound transducer. Doppler-based methods are also associated with problems connected to external motion, and the translational motion of the imaging object, and can lead to artifacts. One advantage of STI in comparison with TDI is the tracking of unique speckle patterns in the tissue, which enables strain calculation in 2D without any angle dependency. The major problem with STI is to get accurate estimations in the lateral direction, due to the intrinsically low lateral resolution of
57
ultrasound images. However, different methods have been shown to improve the lateral resolution by producing lateral RF signals [130].
Moreover, TDI and STI are methods that potentially can detect early signs of disease in the cardiovascular system with higher sensitivity than other established measures, as for example EF. A high sensitivity is an advantage but also has the potential downside that some variables are age dependent and decline due to normal ageing, some variables have gender specific differences and some variables should probably need to be corrected for body size, obesity, level of physical fitness etc. Thus an increased sensitivity of a diagnostic tool can result in problems with establishing whether the measured changes are due to pathology or to normal changes dependent on ageing, differences between sexes, or other known or unknown factors. To establish reference values from these methods is therefore difficult and large scale studies are needed for this purpose and furthermore to find a cost effective use of such methods in clinical routine practice.
TDI and STI require manual placement of ROIs in the offline analysis. This step can be time-consuming and also gives rise to differences between measurements due to user dependency. The ROI size is also a variable that can affect the results, and due to limitations in the software used in Study IV, the selected ROI size included regions from the adventitia. However, results from another study indicated that the intima-media complex and the adventitia have the same longitudinal movement patterns, although the movement of the intima-media complex has a higher amplitude than the movement of the adventitia [131]. To minimize the processing time and user dependency, an algorithm for the automatic placement of ROIs is a desirable further development. Studies I and II comprised the semi-automated detection of specific values in TDI curves. This step might have induced errors, because the shape of the velocity curve can change greatly in different diseased cases. If the user, after visual assessment of the quality and reproducibility of the selected points in the velocity curve, disagreed with the automated detected values, a manual reselection could be done. This was not validated other than by visual assessment of the user.
Finally, the number of study subjects included in the studies in this thesis was small, which has to be considered when interpreting the results. The clinical importance of the developed methods has to be further validated and tested in larger study populations before a possible clinical use can be determined.
9.7 Future potential of the developed methods
The developed methods, all of which are based on quantification using TDI or STI, have the potential to shorten the learning curve towards accurately interpreting results from an ultrasound examination. The methods do not require visual interpretation from the user other than an understanding of color-coded data and quantified measures. Further automation by, for example, eliminating user dependent steps such as ROI placement, and implementing the methods in commercially available ultrasound systems would further reduce the user dependency, decrease the complexity and time of the analysis, and thus render them more suitable for clinical use. The data acquisition where upon the developed methods are based, will in the future most likely be more accurate and less time-consuming with the increasing use of 3D ultrasound. This will lead to improved analysis, since most of the methods present an overview of the cardiac function from

58
different projections of the heart. The studies in this thesis indicated that the developed methods have clinical potential and are sensitive in the detection of different cardiovascular diseases. Thus, they also might be suitable for risk stratification and detection of early disease. In particular, methods investigating the ventricular-arterial coupling and the combination of both cardiac and vascular measures are promising for the detection of early signs of disease. However the abovementioned issues have to be further evaluated in future studies.
59
10 CONCLUSIONS
The ultrasound-based methods developed within this thesis have presented new approaches to quantify and visualize cardiovascular function. The studies have shown promising results indicating that the methods have potential for the early detection of different cardiovascular diseases and are feasible for use in the clinical setting. However, further development of the methods and both quantitative comparison of user dependency, accuracy and ease of use with other established methods evaluating cardiovascular function, as well as additional testing of the clinical potential in larger study populations, are needed. The specific conclusions are listed below for each of the studies:
• Study I demonstrated VeT as a promising method for a fast, simple, and intuitive visual analysis of the regional longitudinal contraction pattern of the LV with the potential to identify characteristic pathological patterns such as regionally impaired function caused by myocardial infarction, LV dyssynchrony and diastolic dysfunction with decreased longitudinal velocity in spite of normal LVEF.
• The results from Study II indicated that the state diagram was feasible in the clinical setting and has the potential to be an efficient tool for the intuitive visualization of cardiac diseases. Additionally, the state diagram method performed better than established echocardiography methods when detecting differences between a group of NSTEMI patients and a group of healthy subjects.
• Study III introduced a new concept to evaluate LV function, through the development of a method to calculate rotation axes of the LV. This method provides a unique overview of the rotation pattern of the LV throughout the cardiac cycle. The rotation axes at different levels of the LV displayed a physiological pattern, and furthermore, the angle and level of the transition plane, where basal and apical rotations meet, could be described over time.

60
• The results from Study IV indicated that the STI-based WIWA concept, measuring WI directly from deformation variables in the arterial wall, is a promising new method that potentially provides advantages over earlier WI methods.
• The results from Study V showed that it was feasible to simultaneously measure radial and longitudinal strain in the model of CCA by making use of currently available hardware and computer simulations.
61
11 FUTURE WORK
Future work related to the developed methods is needed to develop and validate them further in larger study populations and to find the clinical use and potential for the methods. Furthermore, quantitative comparison of user dependency, accuracy and ease of use with other established methods to evaluate cardiovascular function are needed. Further automation of the methods is also required to decrease the complexity and time of the analysis and thus make them more suitable for clinical use. This could be performed by, e.g. eliminating user dependent steps and by implementing the methods in commercially available ultrasound systems.
The state diagram as a diagnostic tool could presumably be improved in future versions by extending it to contain information about, e.g. stroke-length, auto-regulating functions of the interventricular septum, as well as flows and pressures presented for each of the cardiac phases.
To enhance the rotation axis method in further studies, LV models with improved correspondence to real geometry of the human LV could be included. 3D STI would allow for the estimation of rotation in any direction and more accurate geometry estimations and thereby possibly increase the accuracy and make the user dependency of the method less pronounced. Another possible further development of the method would be to describe the torsion axis of the LV, defined as the rotation axis through the entire LV, i.e. a curved rotation axis influenced by the rotation axis at every level of the LV. The torsion axis could be used as a summarized measure of the global rotation pattern of the LV and could be displayed throughout the cardiac cycle.
Although the validation study of WIWA showed reasonably good results, additional studies are needed to test the reproducibility and to validate the new WI approach to invasively measured WI values. Future studies to investigate and determine differences and possible advantages to measure WI in the artery wall instead of in the lumen are also needed. Moreover, the clinical use of the method has to be investigated by testing WIWA in different clinical materials, in different arteries and along the axis of plaques. However, this kind of analysis is highly dependent on accurate assessment of deformation in the artery wall. Optimization and validation of STI algorithms in vessels are the main research focus to obtain a reliable WIWA method.

62
The developed CCA model could be regarded as a tool for further development of STI algorithms applied on the vessel wall and different approaches of STI could be validated and optimized on the model. Future versions of the model could be made more general by including e.g. different vessel geometries, bifurcations, diseased patterns and shear strain between the different layers in the vessel wall. Future work also includes the application of the same methodology in a gel phantom of the CCA. Additional research is also needed to validate the method against invasive measurements e.g. with sonomicrometry.
However, further research is required to determine the clinical value and importance of measuring longitudinal strain in vessels. A possible application could be to study strain along the longitudinal axis of a plaque to provide information on the plaque’s composition to be able to detect vulnerable plaques and predict the risk of carotid plaque rupture. Still, this has to be evaluated in further studies. Finally, it should be mentioned that the exact same methodology could be used to estimate the circumferential strain in the vessel wall by acquiring short-axis images. This was however not tested in the present study. Combined long and short-axis images should thus enable the assessment of the full 3D strain tensor of the vessel wall.
63
12 OTHER SCIENTIFIC CONTRIBUTIONS
Peer reviewed papers Velocity tracking, a new and user independent method for detecting regional function of the left ventricle. C. Westholm, A. Bjällmark, M. Larsson, P. Jacobsen, L. Å. Brodin, R. Winter. Clinical Physiology and Functional Imaging, 2009, vol. 29, pp. 24-31, 2009.
Differences in myocardial velocities during supine and upright exercise stress echocardiography in healthy adults. A. Bjällmark, M. Larsson, K. Shahgaldi, B. Lind, R. Winter, L. Å. Brodin. Clinical Physiology and Functional Imaging, vol. 29, pp. 216-23, 2009.
Fixation identification in centroid versus start-point modes using eye-tracking data. T. Falkmer, J. Dahlman, T. Dukic, A. Bjällmark, M. Larsson. Perceptional Motor Skills, vol. 106, pp. 710-724, 2008.
Conference abstracts Speckle tracking under conditions of small kernel to speckle size ratio, F. Kremer, M. Larsson, H. Fai Choi, P. Claus and J. D’hooge. Eight International Conference on the Ultrasonic Measurement and Imaging of Tissue Elasticity, Vlissingen, 2009.
The prevalence of right ventricular dysfunction and the acute effect of HD on right ventricular function in CKD. S. Yumi Hayashi, M. Mazza do Nascimento, B. Lind, M. Riella, M. Larsson, A. Bjällmark, A. Seeberger, J. Nowak, B. Lindholm, L. Å. Brodin. International Society of blood purification, Stockholm, 2009.
The prevalence of intraventricular dyssynchrony, detected by tissue synchronization imaging, in hemodialysis, peritoneal dialysis and chronic kidney disease stages 3 and 4. S. Yumi Hayashi, M. Mazza do Nascimento, B. Lind, M. Riella, M. Larsson, A. Bjällmark, A. Seeberger, J. Nowak, B. Lindholm, L. Å. Brodin. American Society of Nephrology - Renal week, San Diego, 2009.
Improvement of left ventricular synchronicity, assessed by tissue synchronization imaging, after a single hemodialysis session in chronic hemodialysis patients. S. Yumi Hayashi, M. Mazza do
64
Nascimento, B. Lind, M. Riella, M. Larsson, A. Bjällmark, A. Seeberger, J. Nowak, B. Lindholm, L. Å. Brodin. American Society of Nephrology - Renal week, San Diego, 2009.
Velocity tracking – a new user independent method for bedside detection of myocardial ischemia. C. Westholm, M. Larsson, A. Bjällmark, R. Winter, P. Jacobsen, L. Å. Brodin. EuroEcho, Lisbon, 2007.
Wave Intensity Wall Analysis - A novel noninvasive method for early detection of cardiovascular disease. M. Larsson, A. Bjällmark, B. Lind, R. Balzano, M. Peolsson, R. Winter, L. Å. Brodin. EuroEcho, Lisbon, 2007.
A new graphical user interface module generating state diagrams of the heart. A. Bjällmark, M. Larsson, S. Lundbäck, J. Johnsson, R. Winter, L. Å. Brodin. EuroEcho, Prague, 2006.
Bull’s eye presentation of speckle tracking data; a simple and user independent method for detection of regional myocardial ischemia. P. Jacobsen, R. Winter, A. Bjällmark, M. Larsson, M. Nygren, C. Westholm, L. Å. Brodin. EuroEcho, Prague, 2006.
Velocity Tracking - a novel method for quantitative analysis of longitudinal myocardial function. M. Larsson, A. Bjällmark, R. Winter, C. Westholm, P. Jacobsen, B. Lind, L. Å. Brodin. World Congress of Biomechanics, Munich, 2006.
Recognition of Faces and Expressions for People with Aperger Syndrome: The Nature of the Problem, T. Falkmer, A. Bjällmark, M. Larsson, M. Falkmer. Autism safari, 2nd World Autism Congress And Exhibition, Cape Town, 2006.
Patent Global and local detection of blood vessel elasticity, L. Å Brodin, H. Elmqvist, A. Bjällmark, M. Larsson, (WO/2008/002257).
65
13 REFERENCES
[1] A. Porta, M. D. Rienzo, N. Wessel and J. Kurths, "Addressing the complexity of cardiovascular regulation A", Philosophical Transactions of the Royal Society, vol. 367, pp. 1215–1218, 2009.
[2] G. J. Tortora and S. R. Grabowski, "The cardiovascular system: The heart", in Principles of Anatomy and Physiology, pp. 659-695, 2003.
[3] "The World Health Report - changing history," World Health Organization, 2004. [4] "The World Health Report - shaping the future," World Health Organization, 2003. [5] D. Abegunde, C. Mathers, T. Adam, M. Ortegon and K. Strong, "The burden and costs of chronic
diseases in low-income and middle-income countries", Lancet, vol. 370, pp. 1929-1938, 2007. [6] I. Edler and C. H. Hertz, "The use of ultrasonic reflectoscope for the continuous recording of
movements of the heart wall", Kungliga Fysiografiska sällskapet i Lund Förhandlingar, vol. BD 24, pp. 1-19, 1954.
[7] B. D. Rose and D. Rush, "Cardiac Anatomy", in UpToDate, D. E. Basow: Waltham, MA, 2009. [8] L. Opie, "The cardiac cycle", in Heart Disease: A Textbook of Cardiovascular Medicine, E.
Braunwald, 6th pp. 462-475, 2001. [9] O. Gauer, "Volume Changes of the Left Ventricle During Blood PooIing and Exercise in the Intact
Animal; Their Effects on Left Ventricular Performance", Physiological Reviews, vol. 35, pp. 143-155, 1955.
[10] W. Hamilton and J. Rompf, "Movements of the base of the ventricle and relative constancy of the cardiac volume", American Journal of Physiology, vol. 102, pp. 559-565, 1932.
[11] W. Harvey, "An Anatomical Disputation Concerning the Movement of the Heart and Blood in Living Creatures". Oxford: Blackwell Scientific Publication, 1976.
[12] S. Lundbäck, "Cardiac Pumping and Function of the ventricular Septum", Acta Physiologica Scandinavica Supplementum, vol. 550, pp. 1-101, 1986.
[13] B. Wandt, "Long-Axis Contraction of the Ventricles: A Modern Approach, but Described Already by Leonardo da Vinci", Journal of the American Society of Echocardiography, vol. 13, pp. 699-706, 2000.
[14] S. M. Shaw, D. J. Fox and S. G. Williams, "The development of left ventricular torsion and its clinical relevance", International Journal of Cardiology, vol. 130, pp. 319–325, 2008.
[15] S. de Jager, "Über die Saugkraft des Herzens", Pflügers Archiv European Journal of Physiology, vol. 30, pp. 491-510, 1883.
[16] E. P. Widmaier, H. Raff and K. T. Strang, "Mechanical events of the cardiac cycle", in Vander, Sherman & Luciano's Human Physiology: The mechanisms of body function, 9th. New York: Mc Graw Hill Higher Education, pp. 390-394, 2004.
[17] M. Alam, C. Höglund, C. Thorstrand and C. Hellekant, "Haemodynamic significance of the atrioventricular plane displacement in patients with coronary artery disease", European Heart Journal, vol. 13, pp. 194-200, 1992.
66
[18] J. S. Simonson and N. B. Schiller, "Descent of the base of the left ventricle: an echocardiographic index of left ventricular function", Journal of the American Society of Echocardiography, vol. 2, pp. 25-35, 1990.
[19] M. Carlsson, M. Ugander, H. Mosén, T. Buhre and H. Arheden, "Atrioventricular plane displacement is the major contributor to left ventricular pumping in healthy adults, athletes and patients with dilated cardiomyopathy", American Journal of Physiology and Heart Circulation Physiology, vol. 292, pp. H1452-1459, 2007.
[20] M. Carlsson, M. Ugander, E. Heiberg and H. Arheden, "The quantitative relationship between longitudinal and radial function in left, right, and total heart pumping in humans", American Journal of Physiology and Heart Circulation Physiology, vol. 293, pp. H636-644, 2007.
[21] J. M. Rothfeld, M. M. LeWinter and M. D. Tischler, "Left ventricular systolic torsion and early diastolic filling by echocardiography in normal humans", The American Journal of Cardiology, vol. 81, pp. 1465-1469, 1998.
[22] G. Holzapfel, T. C. Gasser and R. W. Ogden, "A New Constitutive Framework for Arterial Wall Mechanics and a Comparative Study of Material Models", Journal of Elasticity, vol. 61, pp. 1–48, 2000.
[23] E. Witzleb, "Functions of the Vascular System ", in Human Physiology, R. F. Schmidt and G. Thews, Second, Completely Revised Edition, pp. 481-541, 1989.
[24] K. Thygesen, J. S. Alpert and H. D. White, "Universal definition of myocardial infarction", European Heart Journal, vol. 28, pp. 2525–2538, 2007.
[25] A. C. Guyton and J. E. Hall, "Cardiac Failure", in Textbook of Medical Physiology. Philadelphia, pp. 258-265, 2006.
[26] C. M. Yu, J. J. Bax, M. Monaghan and P. Nihoyannopoulos, "Echocardiographic evaluation of cardiac dyssynchrony for predicting a favourable response to cardiac resynchronisation therapy", Heart, vol. 90, pp. vi17–vi22, 2004.
[27] H. B. Meire and P. Farrant, Basic Ultrasound. Chichester, England, 1995. [28] F. W. Kremkau, Diagnostic Ultrasound - Principles and Instruments, Seventh Edition ed. St. Louis,
Missouri 2006. [29] N. M. Gibson, N. J. Dudley and K. Griffith, "A computerised quality control testing system for B-
mode ultrasound", Ultrasound in Medicine & Biology, vol. 27, pp. 1697-1711, 2001. [30] J. D'hooge and B. H. Bijnens, "The principles of Ultrasound based motion and deformation
estimation", in Doppler myocardial Imaging - A textbook, G. R. Sutherland, L. Hatle, P. Claus, J. D'hooge and B. H. Bijnens, pp. 23-48, 2006.
[31] L. Å. Brodin, "Tissue Doppler, a fundamental tool for parametric imaging", Clinical Physiology and Functional Imaging, vol. 24, pp. 147-155, 2004.
[32] K. Isaaz, A. Thompson, G. Ethevenot, J. L. Cloez, B. Brembilla and C. Pernot, "Doppler echocardiographic measurement of low velocity motion of the left ventricular posterior wall", Journal of the American Society of Echocardiography, vol. 64, pp. 66-75, 1989.
[33] W. N. McDicken, G. R. Sutherland, C. M. Morana and L. N. Gordon, "Colour doppler velocity imaging of the myocardium ", Ultrasound in Medicine & Biology, vol. 18, pp. 651-654, 1992.
[34] G. R. Sutherland, M. J. Stewart, K. W. Groundstroem, C. M. Moran, A. Fleming, F. J. Guell-Peris, R. A. Riemersma, L. N. Fenn, K. A. Fox and W. N. McDicken, "Color Doppler myocardial imaging: a new technique for the assessment of myocardial function", Journal of the American Society of Echocardiography, vol. 7, pp. 441-458, 1994.
[35] L. N. Bohs and G. E. Trahey, "A Novel Method for Angle Independent Ultrasonic Imaging of Blood Flow and Tissue Motion", IEEE Transactions on biomedical engineering, vol. 38, pp. 280-286, 1991.
[36] T. Helle-Valle, "New noninvasive method for assessment of left ventricular rotation: speckle tracking echocardiography", Circulation, vol. 112, pp. 3149-3156, 2005.
[37] Z. B. Popovic, C. Benejam, J. Bian, N. Mal, J. Drinko, K. Lee, F. Forudi, R. Reeg, N. l. Greenberg, J. D. Thomas and M. S. Penn, "Speckle-tracking echocardiography correctly identifies segmental left ventricular dysfunction induced by scarring in a rat model of myocardial infarction", American Journal of Physiology, Heart and Circulation Physiology, vol. 292, pp. 2809-2816, 2007.
[38] R. M. Lang, M. Bierig, R. B. Devereux, F. A. Flachskampf, E. Foster, P. A. Pellikka, M. H. Picard, M. J. Roman, J. Seward, J. S. Shanewise, S. D. Solomon, K. T. Spencer, M. S. Sutton and W. J.
67
Stewart, "Recommendations for chamber quantification: a report from the American Society of Echocardiography's Guidelines and Standards Committee and the Chamber Quantification Writing Group, developed in conjunction with the European Association of Echocardiography, a branch of the European Society of Cardiology", Journal of the American Society of Echocardiography, vol. 18, pp. 1440-1463, 2005.
[39] J. P. Curtis, S. I. Sokol, Y. Wang, S. S. Rathore, D. T. Ko, F. Jadbabaie, E. L. Portnay, S. J. Marshalko, M. J. Radford and H. M. Krumholz, "The association of left ventricular ejection fraction, mortality, and cause of death in stable outpatients with heart failure", Journal of the American College of Cardiology, vol. 42, pp. 736-742, 2003.
[40] E. D. Folland, A. F. Parisi, P. F. Moynihan, D. R. Jones, C. L. Feldman and D. E. Tow, "Assessment of Left Ventricular Ejection Fraction and Volumes by Real-time, Two-dimensional Echocardiography. A Comparison of Cineangiographic and Radionuclide Techniques", Circulation, vol. 60, pp. 760-766, 1979.
[41] J. L. Weiss, B. H. Bulkley, G. M. Hutchins and S. J. Mason, "Two-dimensional Echocardiographic Recognition of Myocardial Injury in Man: Comparison with Postmortem Studies", Circulation vol. 63, pp. 401-408, 1981.
[42] R. Erbel, D. R. Wallbridge, J. Zamorano, J. Drozdz and H. J. Nesser, "Tissue Doppler echocardiography", Heart, vol. 76, pp. 193-196, 1996.
[43] R. Greenbaum, S. Ho, D. Gibson, A. Becker and R. Anderson, "Left ventricular fibre architecture in man", British Heart Journal, vol. 45, pp. 248-263, 1981.
[44] P. Cain, T. Baglin, C. Case, D. Spicer, L. Short and T. H. Marwick, "Application of Tissue Doppler to Interpretation of Dobutamine Echocardiography and Comparison With Quantitative Coronary Angiography", The American Journal of Cardiology, vol. 87, pp. 525-531, 2001.
[45] C. F. Madler, N. Payne, U. Wilkenshoff, A. Cohen, G. A. Derumeaux, L. A. Piérard, J. Engvall, L. Å. Brodin, G. R. Sutherland and A. G. Fraser, "Non-invasive diagnosis of coronary artery disease by quantitative stress echocardiography: optimal diagnostic models using off-line tissue Doppler in the MYDISE study", European Heart Journal vol. 24, pp. 1584–1594, 2003.
[46] G. Derumeaux, M. Ovieze, J. Loufoua, G. Pontier, X. Andrè-Fouet and A. Cribier, "Assessment of Nonuniformity of Transmural Myocardial Velocities by Color-Coded Tissue Doppler Imaging, Caracterization of Normal, Ischemic, and Stunned Myocardium", Circulation, vol. 101, pp. 1390-1395, 2000.
[47] T. Kuznetsova, L. Herbots, T. Richart, J. D'hooge, L. Thijs, R. H. Fagard, M. C. Herregods and J. A. Staessen, "Left ventricular strain and strain rate in a general population", European Heart Journal, vol. 29, pp. 2014-2023, 2008.
[48] J. D'hooge, B. Bijnens, J. Thoen, F. Van de Werf, G. R. Sutherland and P. Suetens, "Echocardiographic strain and strain-rate imaging: a new tool to study regional myocardial function", IEEE Transactions on Medical Imaging, vol. 21, pp. 1022-1030, 2002.
[49] P. Sogaard, H. Egeblad, A. K. Pedersen, W. Y. Kim, B. Kristensen, P. S. Hansen and P. T. Mortensen, "Sequential Versus Simultaneous Biventricular Resynchronization for Severe Heart Failure. Evaluation by Tissue Doppler Imaging ", Circulation, vol. 106, pp. 2078-2084, 2002.
[50] A. M. Weissler, W. S. Harris and C. D. Schoenfeld, "Systolic Time Intervals in Heart Failure in Man", Circulation, vol. 37, pp. 149-159, 1968.
[51] G. R. Sutherland, L. Hatle, P. Claus, L. Herbots and J. Separovic, "4 Normal Data", in Doppler Myocardial Imaging - A textbook, G. R. Sutherland, L. Hatle, P. Claus, J. D'hooge and B. H. Bijnens, 1:th, pp. 49-98, 2006.
[52] C. Tei, "New non-invasive index for combined systolic and diastolic ventricular function", Journal of Cardiology, vol. 26, pp. 396–404, 1995.
[53] C. Bruch, A. Schmermund, D. Marin, M. Katz, T. Bartel, J. Schaar and R. Erbel, "Tei-index in patients with mild to moderate congestive heart failure", European Heart Journal, vol. 21, pp. 1888-1895, 2000.
[54] C. Tei, K. S. Dujardin, D. O. Hodge, R. A. Kyle, A. J. Tajik and J. B. Seward, "Doppler index combining systolic and diastolic myocardial performance: Clinical value in cardiac amyloidisis", Journal of the American College of Cardiology, vol. 28, pp. 658-664, 1996.
68
[55] P. Søgaard, H. Egeblad, W. Y. Kim, H. K. Jensen, A. K. Pedersen, B. Ø. Kristensen and P. T. Mortensen, "Tissue Doppler imaging predicts improved systolic performance and reversed left ventricular remodeling during long-term cardiac resynchronization therapy", Journal of the American College of Cardiology, vol. 30, pp. 723-730, 2002.
[56] D. Merkus, F. Kajiya, H. Vink, I. Vergroesen, J. Dankelman, M. Goto and J. A. Spaan, "Prolonged diastolic time fraction protects myocardial perfusion when coronary blood flow is reduced", Circulation, vol. 100, pp. 75-81, 1999.
[57] P. Schuster, S. Faerestrand and O. Ohm, "Color Doppler tissue imaging can be used to quantify regional asynchronus left ventricular contraction and relaxation caused by bundle branch block in heart failure patients", European Journal of Echocardiography, vol. 2 Suppl A:90, 2001.
[58] C. M. Yu, Q. Zhang, J. W. Fung, H. C. Chan, Y. S. Chan, G. W. Yip, S. L. Kong, H. Lin, Y. Zhang and J. E. Sanderson, "A novel tool to assess systolic asynchrony and identify responders of cardiac resynchronization therapy by tissue synchronization imaging", Journal of the American College of Cardiology, vol. 45, pp. 677-684, 2005.
[59] N. R. Van de Veire, G. B. Bleeker, J. D. Sutter, C. Ypenburg, E. R. Holman, E. E. van der Wall, M. J. Schalij and J. J. Bax, "Tissue synchronisation imaging accurately measures left ventricular dyssynchrony and predicts response to cardiac resynchronisation therapy", Heart, vol. 93, pp. 1034-1039, 2007.
[60] R. A. Nishimura, M. D. Abel, L. K. Hatle and A. J. Tajik, "Assessment of diastolic function of the heart: background and current applications of Doppler echocardiography. Part II. Clinical studies", Mayo Clinic Proceedings vol. 62, pp. 181-204, 1989.
[61] S. F. Nagueh, C. P. Appleton, T. C. Gillebert, P. N. Marino, J. K. Oh, O. A. Smiseth, A. D. Waggoner, F. A. Flachskampf, P. A. Pellikka and A. Evangelisa, "Recommendations for the Evaluation of Left Ventricular Diastolic Function by Echocardiography", European Journal of Echocardiography, vol. 10, pp. 165-193, 2009.
[62] V. Ferferieva, P. Claus, K. Vermeulen, C. Missant, M. Szulik, F. Rademakers and J. D’hooge, "Echocardiographic assessment of left ventricular untwist rate: comparison of tissue Doppler and speckle tracking methodologies", European Journal of Echocardiography, vol. 10, pp. 683–690, 2009.
[63] J. Garot, O. Pascal, B. Diébold, G. Derumeaux, B. L. Gerber, J. L. Dubois-Randé, J. A. Lima and P. Guéret, "Alterations of systolic left ventricular twist after acute myocardial infarction", American Journal of Physiology and Heart Circulation Physiology, vol. 282, pp. H357-362, 2002.
[64] M. L. Knudtson, P. D. Galbraith, K. L. Hildebrand, J. V. Tyberg and R. Beyar, "Dynamics of left ventricular apex rotation during angioplasty: a sensitive index of ischemic dysfunction", Circulation, vol. 96, pp. 801-808, 1997.
[65] R. Winter, R. Jussila, J. Nowak and L. Å. Brodin, "Speckle Tracking Echocardiography is a Sensitive Tool for the Detection of Myocardial Ischemia: A Pilot Study from the Catheterization Laboratory During Percutaneous Coronary Intervention", Journal of the American Society of Echocardiography, vol. 20, pp. 974-981, 2007.
[66] E. Nagel, M. Stuber, M. Lakatos, M. B. Scheidegger, P. Boesiger and O. M. Hess, "Cardiac rotation and relaxation after anterolateral myocardial infarction", Coronary artery disease, vol. 11, pp. 261-7, 2000.
[67] U. Gustafsson, P. Lindqvist, S. Mörner and A. Waldenström, "Assessment of regional rotation patterns improves the understanding of the systolic and diastolic left ventricular function: an echocardiographic speckle-tracking study in healthy individuals", European Journal of Echocardiography, vol. 10, pp. 56-61, 2009.
[68] M. O'Rourke and J. Hashimoto, "Arterial stiffness: a modifiable cardiovascular risk factor?" Journal of Cardiopulmonary Rehabilitation and Prevention, vol. 28, pp. 225-237, 2008.
[69] P. L. Allan, P. I. Mowbray, A. J. Lee and G. R. Fowkes, "Relationship Between Carotid Intima-Media Thickness and Symptomatic and Asymptomatic Peripheral Arterial Disease", Stroke, vol. 28, pp. 348-353, 1997.
[70] D. O'Leary, J. Polak, R. Kronmal, T. Manolio, G. Burke and S. J. Wolfson, "Carotid-artery intima and media thickness as a risk factor for myocardial infarction and stroke in older adults. Cardiovascular
69
Health Study Collaborative Research Group", The New England Journal of Medicine, vol. 340, pp. 14-22, 1999.
[71] I. S. Mackenzie, I. B. Wilkinson and J. R. Cockcroft, "Assessment of arterial stiffness in clinical practice", QJM: monthly journal of the Association of Physicians, vol. 95, pp. 67–74, 2002.
[72] C. Schmitt, G. Soulez, R. Maurice, M. Giroux and G. Cloutier, "Noninvasive Vascular Elastography: Toward A Complementary Characterization Tool of Atherosclerosis in Carotid Arteries", Ultrasound in Medicine & Biology, vol. 33, pp. 1841-1858, 2007.
[73] E. B. Mathiesen and S. H. Johnsen, "Ultrasonographic measurements of subclinical carotid atherosclerosis in prediction of ischemic stroke", Acta Neurologica Scandinavica, vol. Suppl. 189, pp. 68-72, 2009.
[74] R. T. Hurst, D. W. Ng, C. Kendall and B. Khandheria, "Clinical Use of Carotid Intima-Media Thickness: Review of the Literature", Journal of the American Society of Echocardiography, vol. 20, pp. 907-914, 2007.
[75] G. Belcaro, A. N. Nicolaides, G. Laurora, M. R. Cesarone, M. D. Sanctis, L. Incandela and A. Barsotti, "Ultrasound Morphology Classification of the Arterial Wall and Cardiovascular Events in a 6-Year Follow-up Study", Arteriosclerosis, Thrombosis and Vascular Biology, vol. 16, pp. 851-856, 1996.
[76] M. Bots, A. Hoes, P. J. Koudstaal, A. Hofman and D. Grobbee, "Common carotid intima-media thickness and risk of stroke and myocardial infarction: the Rotterdam Study", Circulation, vol. 96, pp. 1432-1437, 1997.
[77] S. Ebrahim, O. Papacosta, P. Whincup, G. Wannamethee, M. Walker, A. Nicolaides, S. Dhanjil, M. Griffin, G. Belcaro, A. Rumley and G. Lowe, "Carotid Plaque, Intima Media Thickness, Cardiovascular Risk Factors, and Prevalent Cardiovascular Disease in Men and Women: The British Regional Heart Study." Stroke, vol. 30, pp. 841-850, 1999.
[78] C. Li, G. Engström, G. Berglund, L. Janzon and B. Hedblad, "Incidence of ischemic stroke in relation to asymptomatic carotid artery atherosclerosis in subjects with normal blood pressure. A prospective cohort study", Cerebrovascular Disease, vol. 26, pp. 297-303, 2008.
[79] M. W. Lorenz, H. S. Markus, M. L. Bots, M. Rosvall and M. Sitzer, "Prediction of Clinical Cardiovascular Events With Carotid Intima-Media Thickness: A Systematic Review and Meta-Analysis", Circulation, vol. 115, pp. 459-467, 2007.
[80] J. Spence, M. Eliasziw, M. DiCicco, D. Hackam, R. Galil and T. Lohmann, "Carotid plaque area: a tool for targeting and evaluating vascular Preventive Therapy", Stroke, vol. 33, pp. 2916-2922, 2002.
[81] M. M. Tanaka H, Kawano Y, Ohishi M, Shoji T, Sugawara J, Tomiyama H, Yamashina A, Yasuda H, Sawayama T, Ozawa T., "Comparison between carotid-femoral and brachial-ankle pulse wave velocity as measures of arterial stiffness", Journal of Hypertension, vol. 27, pp. 2022-2027, 2009.
[82] N. Inoue, R. Maeda, H. Kawakami, T. Shokawa, H. Yamamoto, C. Ito and H. Sasaki, "Aortic Pulse Wave Velocity Predicts Cardiovascular Mortality in Middle-Aged and Elderly Japanese Men", Circulation Journal: Official Journal of the Japanese Circulation Society, vol. 73, pp. 549 – 553, 2009.
[83] J. Nürnberger, A. Keflioglu-Scheiber, A. M. Opazo Saez, R. R. Wenzel, T. Philipp and R. F. Schäfers, "Augmentation index is associated with cardiovascular risk", Journal of Hypertension, vol. 20, pp. 24007-2414, 2002.
[84] N. K. Eryol, R. Topsakal, Y. Ciçek, A. Abaci, A. Oguzhan, E. Basar and A. Ergin, "Color Doppler tissue imaging in assessing the elastic properties of the aorta and in predicting coronary artery disease", Japanese Heart Journal, vol. 43, pp. 219-230, 2002.
[85] M. Cinthio, Å. R. Ahlgren, J. Bergkvist, T. Jansson, H. W. Persson and K. Lindström, "Longitudinal movements and resulting shear strain of the arterial wall", American Journal of Physiology and Heart Circulation Physiology, vol. 291, pp. 394-402, 2006.
[86] M. Cinthio, Å. R. Ahlgren, T. Jansson, A. Eriksson, H. W. Persson and K. Lindström, "Evaluation of an ultrasonic echo-tracking method for measurements of arterial wall movements in two dimensions", IEEE Transactions on Ultrasonics, Ferroelectrics and Frequency Control, vol. 52, pp. 1300-1311 2005.
[87] D. J. Patel, A. J. Mallos and D. L. Fry, "Aortic mechanics in the living dog", Journal of Applied Physiology, vol. 16, pp. 293-299, 1961.
70
[88] H. H. Hansen, R. G. Lopata and C. L. de Korte, "Noninvasive carotid strain imaging using angular compounding at large beam steered angles: validation in vessel phantoms", IEEE Transactions on Medical Imaging, vol. 28, pp. 872-880, 2009.
[89] H. H. Hansen, R. G. Lopata, S. Holewijn, M. Truijers and C. L. de Korte, "Non-invasive Vascular Ultrasound Strain Imaging: Different Arteries, Different Approaches", presented at IFMBE, Antwerp, 2008.
[90] S. I. Rabben, S. Bjaerum, V. Soerhus and H. Torp, "Ultrasound-Based Vessel Wall tracking: An auto-correlation Technique with RF Center Frequency Estimation", Ultrasound in Medicine and Biology, vol. 28, pp. 507-517, 2002.
[91] P. Segers, S. I. Rabben, J. de Backer, J. de Sutter, T. C. Gillebert, L. van Bortel and P. Verdonck, "Functional analysis of the common carotid artery: relative distension differences over the vessel wall measured in vivo", Journal of Hypertension, vol. 22, pp. 973-981, 2004.
[92] H. Ribbers, R. G. Lopata, S. Holewijn, G. Pasterkamp, J. D. Blankensteijn and C.L de Korte, "Noninvasive Two-dimensional Strain Imaging of arteries: Validation in phantoms and preliminary experience in carotid arteries in vivo", Ultrasound in Medicine and Biology, vol. 33, pp. 530 - 540, 2007.
[93] S. Golemati, A. Sassano, M. J. Lever, A. A. Bharath, S. Dhanjil and A. N. Nicolaides, "Carotid artery wall motion estimated from B-mode ultrasound using region tracking and block matching", Ultrasound in Medicine and Biology, vol. 29, pp. 387-399, 2003.
[94] T. Idzenga, H. H. Hansen, R. G. Lopata and C. L. de Korte, "Non-invasive Assessment of Shear Strain in the Carotid Arterial Wall Based on Ultrasound Radiofrequency Data", presented at IEEE International Ultrasonics Symposium Rome, Italy, 2009.
[95] A. Paini, P. Boutouyrie, D. Calvet, M. Zidi, E. Agabiti-Rosei and S. Laurent, "Multiaxial mechanical characteristics of carotid plaque: analysis by multiarray echotracking system", Stroke, vol. 38, pp. 117-23, 2007.
[96] W. C. Little and M. Pu, "Left ventricular-arterial coupling", Journal of the American Society of Echocardiography, vol. 22, pp. 1246-1248, 2009.
[97] K. Parker and C. J. Jones, "Forward and Backward Running Waves in the Arteries: Analysis Using the Method of Characteristics", Journal of Biomechanical Engineering, vol. 112, pp. 322-326, 1990.
[98] A. Harada, T. Okada, M. Sugawara and K. Niki, "Development of a Non-invasive Real-time Measurement System of Wave Intensity", pp. 1517-1520, 2000.
[99] A. W. Khir and K. Parker, "Wave intensity in the ascending aorta: effects of arterial occlusion", Journal of Biomechanics, vol. 38, pp. 647-655, 2005.
[100] K. Parker, "An introduction to wave intensity analysis", Medical and Biological Engineering and Computing, vol. 47, pp. 175-188, 2009.
[101] K. Niki, M. Sugawara, D. Chang, A. Harada, T. Okada and R. Tanaka, "Effects of sublingual nitroglycerin on working conditions of the heart and arterial system: analysis using wave intensity", The Japan Society of Ultrasonics in Medicine, vol. 32, pp. 145-152, 2005.
[102] M. Sugawara, K. Niki, N. Ohte, T. Okada and A. Harada, "Clinical usefulness of wave intensity analysis", Medical & Biological Engineering & Computing, vol. 47, pp. 197-206, 2009.
[103] N. Ohte, H. Narita, M. Sugawara, K. Niki, T. Okada, A. Harada, J. Hayano and G. Kimura, "Clinical usefulness of carotid arterial wave intensity in assessing left ventricular systolic and early diastolic performance", Heart and Vessels, vol. 18, pp. 107-111, 2003.
[104] M. Nakayama, H. Itoh, K. Oikawa, A. Tajima, A. Koike, T. Aizawa, L. Fu and F. Miyake, "Preload-adjusted 2 wave-intensity peaks reflect simultaneous assessment of left ventricular contractility and relaxation", Circulation Journal, vol. 69, pp. 683-687, 2005.
[105] J. C. Bamber and R. J. Dickinsont, "Ultrasonic B-scanning: a computer simulation", Physics in Medicine and Biology, vol. 25, pp. 463-479, 1980.
[106] H. Gao, H. F. Choi, P. Claus, S. Boonen, S. Jaecques, G. Harry van Lenthe, G. Van der Perre, W. Lauriks and J. D’hooge, "A Fast Convolution-Based Methodology to Simulate 2-D/3-D Cardiac Ultrasound Images", IEEE Transactions on Ultrasonics, Ferroelectrics, and Frequency Control, vol. 56, pp. 404-409, 2009.
[107] J. Bland and D. Altman, "Statistical methods for assessing agreement between two methods of clinical measurement", Lancet, vol. 1, pp. 307-310, 1986.
71
[108] F. Kremer, C. H. Fai, P. Claus, J. D'hooge, S. Langeland and E. D'Agostino, "Comparison of geometric regularization methods for 2D myocardial strain estimation in the mouse", presented at Ultrasonics Symposium IEEE, Beijing, China, 2008.
[109] E. Picano, F. Lattanzi, A. Orlandini, C. Marini and A. L'Abbate, "Stress echocardiography and the human factor: the importance of being expert", Journal of the American College of Cardiology, vol. 17, pp. 666-669, 1991.
[110] J. P. Kvitting, L. Wigström, J. M. Strotmann and G. R. Sutherland, "How accurate is visual assessment of synchronicity in myocardial motion? An In vitro study with computer-simulated regional delay in myocardial motion: clinical implications for rest and stress echocardiography studies", Journal of the American Society of Echocardiography, vol. 12, pp. 698-705, 1999.
[111] M. B. Jones and R. S. Kennedy, "Temporal factors in visual perception: a differential approach", Perceptual and Motor Skills, vol. 81, pp. 859-867, 1995.
[112] S. M. Ali, H. Egeblad, K. Saunamäki, S. Carstensen, F. Steensgård-Hansen and S. Haunsø, "Reproducibility of digital exercise echocardiography", European Heart Journal, vol. 16, pp. 1510-1519, 1995.
[113] H. Haraldsson, L. Wigström, M. Lundberg, A. F. Bolger, J. Engvall, T. Ebbers and J. P. Kvitting, "Improved estimation and visualization of two-dimensional myocardial strain rate using MR velocity mapping", Journal of magnetic resonance imaging, vol. 28, pp. 604-611, 2008.
[114] A. Pasquet, G. Armstrong, L. Beachler, M. S. Lauer and T. H. Marwick, "Use of Segmental Tissue Doppler Velocity to Quantitate Exercise Echocardiography", Journal of the American Society of Echocardiography, vol. 12, pp. 901-912, 1999.
[115] R. Sicari, "Relevance of tissue Doppler in the quantification of stress echocardiography for the detection of myocardial ischemia in clinical practice", Cardiovascular Ultrasound, vol. 3, 2005.
[116] M. Alam, J. Wardell, E. Andersson, B. A. Samad and R. Nordlander, "Effects of first myocardial infarction on left ventricular systolic and diastolic function with the use of mitral annular velocity determined by pulsed wave doppler tissue imaging." Journal of the American Society of Echocardiography, vol. 13, pp. 343-352, 2000.
[117] C. M. Yu, H. Lin, H. Yang, S. L. Kong, Q. Zhang and S. W. L. Lee, "Progression of Systolic Abnormalities in Patients With “Isolated” Diastolic Heart Failure and Diastolic Dysfunction", Circulation, vol. 105, pp. 1195-1201, 2002.
[118] C. Westholm, A. Bjällmark, M. Larsson, P. Jacobsen, L. Å. Brodin and R. Winter, "Velocity tracking, a new and user independent method for detecting regional function of the left ventricle", Clinical Physiology and Functional Imaging, vol. 29, pp. 24-31, 2008.
[119] P. R. Hunziker, M. H. Picard, N. Jander, M. Scherrer-Crosbie, M. Pfisterer and P. T. Buser, "Regional wall motion assessment in stress echocardiography by tissue Doppler bull's-eyes", Journal of the American Society of Echocardiography, vol. 12, pp. 196-202, 1999.
[120] J. D'hooge, A. Heimdal, F. Jamal, T. Kukulski, B. Bijnens, F. Rademakers, L. Hatle, P. Suetens and G. R. Sutherland, "Regional Strain and Strain Rate Measurements by Cardiac Ultrasound: Principles, Implementation and Limitations", European Journal of Echocardiography, vol. 1, pp. 154-170, 2000.
[121] R. L. Maurice, J. Ohayon, Y. Frétigny, M. Bertrand, G. Soulez and G. Cloutier, "Noninvasive Vascular Elastography: Theoretical Framework", IEEE Transactions on Medical Imaging, vol. 23, 2004.
[122] A. Paini, P. Boutouyrie, D. Calvet, M. Zidi, E. Agabiti-Rosei and S. Laurent, "Multiaxial mechanical characteristics of carotid plaque: analysis by multiarray echotracking system", Stroke, vol. 38, pp. 117-123, 2007.
[123] P. Tozzi, D. Hayoz, C. Oedman, I. Mallabiabarrena and L. L. Von Segesser, "Systolic axial artery length reduction: an overlooked phenomenon in vivo", American Journal of Physiology and Heart Circulation Physiology, vol. 280, pp. 2300-2305, 2001.
[124] A. Skovoroda, M. Lubinski, S. Emelianov and M. O'Donnell, "Nonlinear estimation of the lateral displacement using tissue incompressibility", IEEE Transactions on Ultrasonics, Ferroelectrics, and Frequency Control vol. 45, pp. 491-503, 1998.
[125] C. Storaa, N. Palmberg, L. Å. Brodin and H. Elmqvist, "Modeling the Error in Ultrasound Tissue Doppler Measurements due to Incorrect Transducer Placement", Engineering in Medicine and
72
Biology Society, 2003. Proceedings of the 25th Annual International Conference of the IEEE, vol. 1, pp. 111- 114 2003.
[126] S. Gunnes, C. Storaa, B. Lind, J. Nowak and L. Å. Brodin, "Analysis of the Effect of Temporal Filtering in Myocardial Tissue Velocity Imaging", Journal of the American Society of Echocardiography, vol. 17, pp. 1138-1145, 2004.
[127] S. Saha, J. Nowak, C. Storaa, C. Mädler, A. Fraser, S. Roumina, B. Lind and L. Å. Brodin, "Functional diagnosis of coronary stenosis using tissue tracking provides best sensitivity and specificity for left circumflex disease: experience from the MYDISE (myocardial Doppler in stress echocardiography) study", European Journal of Echocardiography, vol. 6, pp. 54-63, 2005.
[128] Y. Wu, T. Irvine, Y. Mori, X. Li and D. Sahn, "In vitro validation of tissue Doppler left ventricular regional wall velocities by using a novel balloon phantom." Journal of Tongji Medical University, vol. 21, pp. 337-340, 2001.
[129] C. Storaa, P. Åberg, B. Lind and L. Å. Brodin, "Effect of angular error on tissue Doppler velocities and strain", Echocardiography, vol. 20, pp. 581-587, 2003.
[130] H. Liebgott, A. Basarab, P. Gueth, C. Cachard and P. Delachartre, "Lateral RF Image Synthesis Using a Synthetic Aperture Imaging Technique", IEEE Transactions on Ultrasonics , Ferroelectrics , and Frequency Control, vol. 55, pp. 2097-2103, 2008.
[131] M. Persson, Å. R. Ahlgren, T. Jansson, A. Eriksson, H. W. Persson and K. Lindström, "A new non-invasive ultrasonic method for simultaneous measurements of longitudinal and radial arterial wall movements: first in vivo trial", Clinical Physiology and Functional Imaging, vol. 23, pp. 247–251, 2003.