mathematical modeling of electrode processes – potential...
TRANSCRIPT

3
Mathematical Modeling of Electrode Processes – Potential Dependent Transfer Coefficient in
Electrochemical Kinetics
Przemysław T. Sanecki and Piotr M. Skitał Rzeszów University of Technology
Poland
This chapter is dedicated to professor Zbigniew Galus, who consistently applied mathematical approach to electrochemical kinetics and to memory of professor Bogdan Jakuszewski who was succeeded in both theoretical and experimental electrochemistry.
1. Introduction
The connection between experimental results and mathematical modeling of electrode
processes may become an inspiration for new results and deeper understanding of the
nature of electrochemical processes and its kinetic description. Sometimes experiment is
preceded by a theory, sometimes it is the other way round. To avoid over discovering of
phenomena, uncertainties and even mistakes, a responsible validation of model results is
required. The analysis of complex, multi-electron electrode processes with chemical step(s)
provides the respective examples.
2. Elementary and apparent kinetic parameters in modeling of electrode processes
In chemical kinetics, elementary (one step) and complex (multi-step) processes are described. Exactly the same situation is observed in electrochemical kinetics where electron transfer steps and chemical steps are often coupled in various sequences. Therefore, electrochemical kinetics uses two kinds of kinetic parameters: elementary describing each single step of kinetic sequence and general (apparent, observed) relating to or describing the complex mechanism as a whole.
Consequently, there is a need of showing similarities, dissimilarities and relations between the two approaches to avoid possible confusion. The following significant problems are to be discussed here:
The distinction among apparent and elementary kinetic parameters (Sanecki & Skitał, 2002a; Skitał & Sanecki, 2009).
The accuracy of electrochemical kinetic parameters determination by the estimation method (Sanecki et al., 2003, 2006b).
www.intechopen.com

Recent Trend in Electrochemical Science and Technology 54
The analysis of complex current responses (Sanecki & Lechowicz, 1997; Sanecki & Kaczmarski, 1999; Sanecki & Skitał, 2002a; Sanecki et al., 2003; 2006a, 2006b, 2010; Skitał et al., 2010).
The relationship between apparent and elementary kinetic parameters (Sanecki & Skitał, 2002a; Skitał & Sanecki, 2009) and its consequences.
Most of electrochemical processes are complex and electrodics deal with multicharge transfer reactions as well as with multicomponent systems not considered here (Bard & Faulkner, 2001; Sanecki & Skitał, 2002b). The extraction of elementary kinetic parameters from experimental responses of multicharge reactions always requires an appropriate kinetic model, even if its application is not clearly given. Even a single formula used for calculation of kinetic parameters is a model. Therefore, a need of appraisal of assumptions basing every kind of model is evident. If the formulae available in electrochemistry textbooks and monographs are not adequate for considered mechanism, a respective rigorous mathematical model of kinetic case is required. If the applied model is appropriate to considered experimental data, the physical sense of obtained kinetic parameters is clear and the ones are reliable for further discussion. We will show further that the simple model is not appropriate for processes with chemical step unless the chemical step is extremely fast or slow and a simplification is justified.
The difference between elementary and apparent kinetic parameters denotes their physical
sense: (1)– elementary ones describe single step i (e.g. ki i i), general ones (apparent, observed)
(e.g. kapp i app) describe a sequence of steps (mechanism) as a whole i.e. electrochemical and chemical steps together, as well as the way they were obtained: (2)– elementary ones are obtained by estimation with the use of complex current response, apparent usually with the use of simplified model (formula) in relation to the same response. The use of elementary parameters method is a consequence of the fact that mechanism is described as a sequence of elementary steps. General and apparent kinetic parameters are useful when application of an analytical or estimation method to complex systems is not possible. An example of apparent kinetic parameters approach is the conception of general transfer coefficient e.g. applied to interpretation of Tafel plots of complex multi-electron processes (Bockris & Reddy, 1970). Similar discussion of apparent and elementary kinetic parameters can be found in monograph by Brenet and Traore (Brenet & Traore, 1971).
Acquisition of rigorous mathematical model of considered process is fundamental for any discussion of quantitative type. The actual numerical possibilities and availability of respective software are quite enough to solve practically each of mechanisms met in practice. The respective numerical procedure of nonlinear curve fitting, called multi-parameter estimation (MPE) is in general followed with validation of obtained kinetic parameters. The criterion of optimization is a minimization the difference between experimental and theoretical response by least squares method. In electrodics MPE operates on a set of CV responses for various scan rates (and eventually on responses for various concentrations). It is a fundamental rule in electrochemistry simulations. The respective fits should be optimized for different scan rates even if there is a possibility to determine it on single curve only. The considered set of CV curves for different scan rates should be covered by the only one set of kinetic parameters (Speiser, 1996a, 1996b). The power of CV is determined by the possibility to study the electrochemical system by using different time scales by changing potential scan rate (Speiser, 1985).
www.intechopen.com
Mathematical Modeling of Electrode Processes – Potential Dependent Transfer Coefficient in Electrochemical Kinetics 55
The form of i=f(E) and c=f(E) responses corresponding to a sum of steps as well as for
individual intermediate species can be predicted for almost each of mechanisms, which is
the important advantage of modeling. Another one is a possibility of simple moving from
elementary to general kinetic parameters. For now, however, it has not been possible to
complete it inversely. The limitation of the number of estimated parameters, even if series of
kinetic runs are used, is a disadvantage of MPE method. The credibility of MPE method
decreases with the number of them and confidence intervals become wider simultaneously.
It is however a general problem which denotes all complex systems and is a result of their
complexity and not of a calculation method. MPE is a global method i.e. it operates on whole
original, non processed responses (please note a comment given with equations (5)–(8)).
The electrochemical responses are in most cases complex and reflect the influence of various factors (e.g. chemical, electron transfer, adsorption steps) on its shape. Therefore, a model should include all of them. Respective electrochemical current response or concentration response is a function of many variables and it is easy to show the influence of a single kinetic parameter on its shape. In other words, an electrochemical response is directly a superposition of one-electron current responses and indirectly of chemical kinetic parameters. This chapter contains a number of respective examples, which visualize the part of complex relationships between relevant kinetic parameters and the resulting electrochemical response, namely Fig. 2–8, 9, 11–14, 15D.
3. The accuracy of electrochemical kinetic parameters determination by estimation method
For consecutive reaction steps there is a problem with the ability of a calculation procedure to extract kinetic parameters of the second kinetic step when the overall not naturally resolved current response is rate limited by the first step. In the early fifties of the last century Schwemer and Frost (Frost & Schwemer, 1952; Schwemer & Frost, 1951) and Frost and Pearson (Frost & Pearson, 1961) first solved the problem of two consecutive second order reactions in chemical kinetics. The attention was focused on the accuracy of k1 and k2 determination (e.g. error values k1 ±2–4%, k2 ±5–10% were reported (Kuritsyn et al., 1974). Analogous problems exist in electrochemical kinetics. In the first approach, in voltammetry for ECE process, the errors of kinetic parameters for the first and second one-electron steps are determined during estimation routine procedure applied to experimental response. The statistical treatment is incorporated into an algorithm. There are two other ways: (a) applying an estimation procedure to theoretical (simulated) CV curves to obtain the kinetic parameters with the best possible accuracy for the system; (b) applying an estimation procedure to the same simulated CV curves altered by the addition of noise, a non perfect zero base line, and a slight ohmic drop in order to imitate experimental errors of real voltammetric curves. The ways (a) and (b) serve only for the purpose of modeling studies. In practice, the kinetic parameters are determined entirely with the use of experimental voltammograms. The method of validation based on theoretical (synthetic) responses is seldom applied but is worth recommendation. In particular, the fact that accuracy of the evaluated parameters depends on the k2/k1 ratio will be shown. This means that not only the system with the rate limited by the first electron transfer is considered, i.e. the case when k2>k1, but also that the whole spectrum of k2/k1 ratios is taken into account for the ECE reaction scheme.
www.intechopen.com
Recent Trend in Electrochemical Science and Technology 56
Three approaches are possible for calculating confidence intervals of the estimated parameters.
Firstly, a numerical method used for the estimation and fitting procedure is applied to a single
experimental curve and the statistical treatment is incorporated into an algorithm (not
accessible for user). This is a non-linear regression problem solved by the least squares method
(Bieniasz & Speiser, 1998a, 1998b; Lavagnini et al., 1989; Scharbert & Speiser, 1989; Seber &
Wild, 1989; Speiser, 1985). For example, refs. (Bieniasz & Speiser, 1998b; Lavagnini et al., 1989)
discuss in details the error space of kinetic parameters obtained during a single estimation
procedure. In the second approach, the errors are determined on the basis of repeated
experiments as reported by Jäger and Rudolph (Jäger & Rudolph, 1997). The population of
kinetic parameters obtained by estimation provide the mean value, median, standard
deviation, confidence intervals, etc. In the third approach, the estimations are repeated for
theoretical responses with different starting points; it turns out that for some kinetic
parameters, the calculated values (e.g. k1) are identical or almost identical (with errors that
have no physically important meaning), for others (e.g. k2) they are not identical and for some
cases they differ even by an order of magnitude. The confidence intervals for the populations
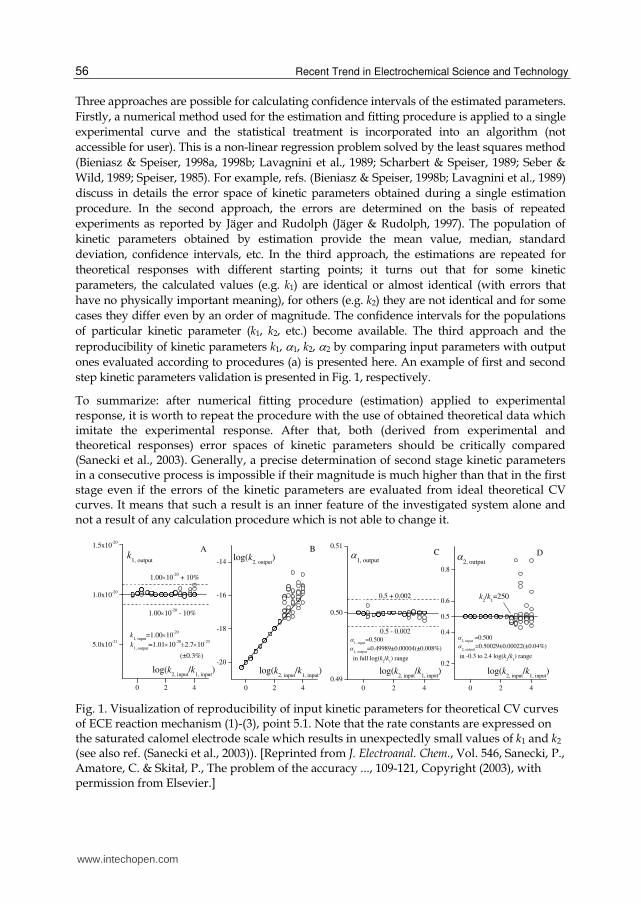
of particular kinetic parameter (k1, k2, etc.) become available. The third approach and the
reproducibility of kinetic parameters k1, 1, k2, 2 by comparing input parameters with output
ones evaluated according to procedures (a) is presented here. An example of first and second
step kinetic parameters validation is presented in Fig. 1, respectively.
To summarize: after numerical fitting procedure (estimation) applied to experimental response, it is worth to repeat the procedure with the use of obtained theoretical data which imitate the experimental response. After that, both (derived from experimental and theoretical responses) error spaces of kinetic parameters should be critically compared (Sanecki et al., 2003). Generally, a precise determination of second stage kinetic parameters in a consecutive process is impossible if their magnitude is much higher than that in the first stage even if the errors of the kinetic parameters are evaluated from ideal theoretical CV curves. It means that such a result is an inner feature of the investigated system alone and not a result of any calculation procedure which is not able to change it.
Fig. 1. Visualization of reproducibility of input kinetic parameters for theoretical CV curves of ECE reaction mechanism (1)-(3), point 5.1. Note that the rate constants are expressed on the saturated calomel electrode scale which results in unexpectedly small values of k1 and k2 (see also ref. (Sanecki et al., 2003)). [Reprinted from J. Electroanal. Chem., Vol. 546, Sanecki, P., Amatore, C. & Skitał, P., The problem of the accuracy ..., 109-121, Copyright (2003), with permission from Elsevier.]
0 2 4
5.0x10⁻²¹
1.0x10⁻²⁰
1.5x10⁻²⁰
A
1.0010-20
- 10%
k1, output
=1.0110-202.710
-23
(±0.3%)
k1, input
=1.0010-20
k1, output
1.0010-20
+ 10%
log(k2, input
/k1, input
)
0 2 4
-20
-18
-16
-14
B
log(k2, input
/k1, input
)
log(k2, output
)
0 2 4
0.49
0.50
0.51
C
0.5 - 0.002
0.5 + 0.002
1, input
=0.500
1, output
=0.49989±0.00004(±0.008%)
in full log(k2/k
1) range
log(k2, input
/k1, input
)
1, output
0 2 4
0.2
0.4
0.5
0.6
0.8
D
k2/k
1=250
2, input
=0.500
2, output
2, output
=0.50029±0.00022(±0.04%)
in -0.3 to 2.4 log(k2/k
1) range
log(k2, input
/k1, input
)
www.intechopen.com

Mathematical Modeling of Electrode Processes – Potential Dependent Transfer Coefficient in Electrochemical Kinetics 57
4. The list of applied kinetic models and description of numerical procedures
The problems formulated in this chapter were solved using ESTYM_PDE program. The ESTYM_PDE program has been designed to solve and estimate parameters of partial differential equations (PDE) describing one-dimensional mass and heat transfer coupled with chemical reaction. One of the program options enables solution of electrochemical reaction models. The numerical algorithm is based on an implementation of the method of orthogonal collocation on finite elements (OCFE) (Berninger et al., 1991; Gardini et al., 1985; Kaczmarski, 1996; Kaczmarski et al., 1997; Ma & Guiochon, 1991; Villadsen & Michelsen, 1978; Yu & Wang, 1989). After discretization of the space derivatives due to the method of OCFE, the obtained set of ordinary differential equations is solved with the backward differentiation formulae, implemented in the VODE procedure (Brown et al., n.d.). To estimate model parameters one of the best and fastest algorithms based on the least square fitting as proposed by Marquardt (Marquardt, 1963) in the version modified by Fletcher (Fletcher, n.d.) was used. The calculations of confidence level of estimated parameters were performed according to the method described in (Seber & Wild, 1989).
In the recovery process or estimation of model parameters, the set of differential equation must be solved many times as required by the least-squares algorithm. A single solution of the actual electrochemical reaction model takes 1-15 s (calculation of a single CV curve). The full estimation procedure, however, takes 0.5-2 hours. The time of estimation depends on the choice of initial values of estimated parameters and on the accuracy imposed for ODE solver. The highest applied accuracy of calculations was 1×10-15. The accuracy is related to that of solving ordinary differential equations with VODE procedure and to absolute accuracy of the estimation of parameters. The last one was adjusted to be six orders of magnitude lower than expected value of an estimated parameter. The relative accuracy used in VODE was 1×10-13 and absolute accuracy was 1×10-15. The Levenberg-Marquard procedure was applied as described in report (Fletcher, n.d.; Marquardt, 1963) without any changes. The same was for VODE procedure. All calculations were performed using the extended precision.
The algorithm applied for solving PDE’s in ESTYM_PDE was also used in other programs for modelling adsorption chromatography processes (Kaczmarski et al., 1997, 2001; Kim et al., 2005, 2006a, 2006b). Other algorithms to estimate parameters of PDE are being used as well. Among them are ELSIM and DigiSim® programs in which a Simplex method and Levenberg-Marquard algorithm are applied, respectively. Simulation packages are described in papers (Bott et al., 1996; Bott , 2000; Feldberg, 1969) (DigiSim®) and (Bieniasz, 1997; Bieniasz & Britz, 2004) (ELSIM). The applied theory of electrochemical simulations is described in refs. (Bard & Faulkner, 2001; Bieniasz & Britz, 2004; Bieniasz & Rabitz, 2006; Britz, 2005; Feldberg, 1969; Gosser, 1993; Speiser, 1996a). The ESTYM_PDE program, similarly to other analogous programs available, provides the possibility of calculating concentration versus both space parameter and time for various geometries of the electrode.
To test a simulation software, Speiser (Speiser, 1996a) proposed to use ECE/DISP1 sequence (Amatore & Saveant, 1977). In paper (Sanecki et al., 2003), there is a comparison of available Simulators gathered by Speiser on the ground of the test (Table 1 and 2 and p.11 in (Speiser, 1996a)). We extended both of Speiser’s tables by means of including our data for the example with the use of ESTYM_PDE. It is clear that all programs give practically the same results. The correctness of our calculations was also confirmed by the comparison of ESTYM_PDE with DigiSim® program. The results of calculations obtained for representative examples were exactly the same (Sanecki & Skitał, 2008).
www.intechopen.com
Recent Trend in Electrochemical Science and Technology 58
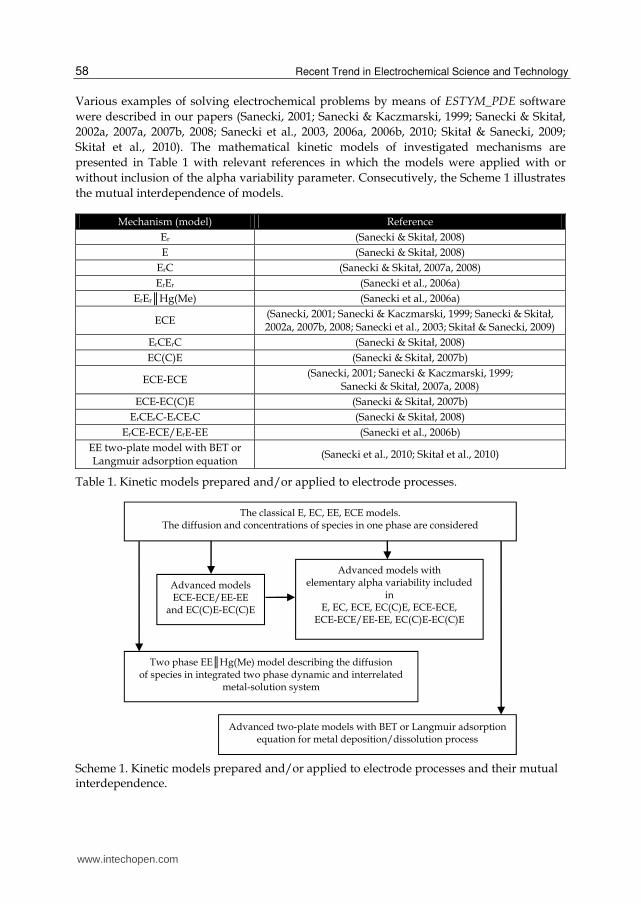
Various examples of solving electrochemical problems by means of ESTYM_PDE software
were described in our papers (Sanecki, 2001; Sanecki & Kaczmarski, 1999; Sanecki & Skitał, 2002a, 2007a, 2007b, 2008; Sanecki et al., 2003, 2006a, 2006b, 2010; Skitał & Sanecki, 2009;
Skitał et al., 2010). The mathematical kinetic models of investigated mechanisms are
presented in Table 1 with relevant references in which the models were applied with or
without inclusion of the alpha variability parameter. Consecutively, the Scheme 1 illustrates
the mutual interdependence of models.
Mechanism (model) Reference
Er (Sanecki & Skitał, 2008)
E (Sanecki & Skitał, 2008)
ErC (Sanecki & Skitał, 2007a, 2008)
ErEr (Sanecki et al., 2006a)
ErEr║Hg(Me) (Sanecki et al., 2006a)
ECE (Sanecki, 2001; Sanecki & Kaczmarski, 1999; Sanecki & Skitał, 2002a, 2007b, 2008; Sanecki et al., 2003; Skitał & Sanecki, 2009)
ErCErC (Sanecki & Skitał, 2008)
EC(C)E (Sanecki & Skitał, 2007b)
ECE-ECE (Sanecki, 2001; Sanecki & Kaczmarski, 1999;
Sanecki & Skitał, 2007a, 2008)
ECE-EC(C)E (Sanecki & Skitał, 2007b)
ErCErC-ErCErC (Sanecki & Skitał, 2008)
ErCE-ECE/ErE-EE (Sanecki et al., 2006b)
EE two-plate model with BET or Langmuir adsorption equation
(Sanecki et al., 2010; Skitał et al., 2010)
Table 1. Kinetic models prepared and/or applied to electrode processes.
Scheme 1. Kinetic models prepared and/or applied to electrode processes and their mutual interdependence.
The classical E, EC, EE, ECE models. The diffusion and concentrations of species in one phase are considered
Advanced models ECE-ECE/EE-EE
and EC(C)E-EC(C)E
Two phase EE║Hg(Me) model describing the diffusion of species in integrated two phase dynamic and interrelated
metal-solution system
Advanced models with elementary alpha variability included
in E, EC, ECE, EC(C)E, ECE-ECE,
ECE-ECE/EE-EE, EC(C)E-EC(C)E
Advanced two-plate models with BET or Langmuir adsorption equation for metal deposition/dissolution process
www.intechopen.com
Mathematical Modeling of Electrode Processes – Potential Dependent Transfer Coefficient in Electrochemical Kinetics 59
The MPE method is now widely applied in the determination of kinetic parameters of different dynamic processes e.g. for chromatography data with the use of respective mathematical model (Kaczmarski, 2007; Kim et al., 2005, 2006a).
5. The ECE process in cyclic voltammetry. The relationships between elementary and apparent kinetic parameters
Even textbook reaction mechanisms are not immune to changes. Bernd Speiser
5.1 Stepwise - concerted mechanism competition and complex app plots
The reduction process going through two one-electron steps with chemical reaction between them is typical for a large number of processes in both organic and inorganic electrochemistry and is still of current interest e.g. (Andrieux et al., 1992; 1993, 1994, 1997; Antonello & Maran, 1997, 1998, 1999; Antonello et al., 2001, 2002a, 2002b; Costentin et al., 2009; Daasbjerg, 1999; Jaworski & Leszczyński, 1999; Najjar et al., 2007; Pause et al., 1999, 2001; Savéant, 1987, 1992, 1993; Severin et al., 1993; Speiser, 1996a; Workentin et al., 1995).
1 1,
k α
RX e RX (1)
f kRX R X (2)
2 2
,
k α
R e R (3)
concertedk
RX e R X (4)
The first set (1)-(3) constitutes an ECE (stepwise, sequential) mechanism. The equation (4)
describes the concerted mechanism that may or may not be followed by a second electron
transfer (3).
Berzins and Delahay (Berzins & Delahay, 1953) were probably the first ones who
successfully applied the modeling method to unravel contentious kinetic problem.
Nicholson and Shain (Nicholson & Shain, 1964, 1965a) were the first ones to describe the full
mathematical model of ECE process followed with its experimental verification (Nicholson
& Shain, 1965b). The determination of elementary kinetic parameters from complex CV
current responses and the analysis of the competition between stepwise and concerted
mechanism presented in this chapter were realized by applying the ECE process
mathematical model, identical with the one described by Nicholson and Shain.
During investigation on elementary transfer coefficient (ETC) variability (sub chapters 6 and
7), we came across a series of results in which variability and its nonlinear complex plots together with stepwise-concerted mechanism transition were reported e.g. papers quoted
here in place before eq. (1)-(4). We recognized the respective parameter as the apparent since its value was generally calculated with the use of formulae (5) or (6) (Matsuda & Ayabe, 1955) as well as by the convolution method (7)-(8) (Bard & Faulkner, 2001; Galus,
www.intechopen.com

Recent Trend in Electrochemical Science and Technology 60
1994; Speiser, 1996a). Both of the models were derived for processes without chemical step and therefore applying the dependences (5) and (6) for ECE process has no appropriate physical basis. Consequently, kinetic parameters, plots and conclusions, obtained for the applied model cannot have clear physical sense (unless the chemical step is extremely slow or extremely fast and the process becomes E or EE, respectively).
p/2 p p/21.857Δ
( )R TE E EF (5)
(two selected characteristic points of CV curve are taken into consideration)
p 1.15( log ) ( )
E R Tv F
(6)
(several selected characteristic points of CV curve are taken into consideration)
1 2 1 2
0
1 t i uI t du
t u (7)
lim1 2app 0ln ln ln
I I tk E D
i t
(8)
where Ilim is the limiting current of convoluted (semiintegrated) curve; the CV curve as a
whole is taken into consideration).
The stepwise-concerted competition problem was solved (Sanecki & Skitał, 2002a; Skitał &
Sanecki, 2009) by respective simulations presented shortly here. To compare the stepwise
and concerted mechanisms on the basis of both elementary and apparent kinetic parameters
approach, a procedure reverse to that known from the literature was applied. The well-
known procedure involves recording of CV experimental curves from which app values are
calculated using peak width formula (5) or (6) or (7,8) method. The resulting app=f(E,v)
dependences are used to conclude about possible mechanism transition.
In our approach, CV theoretical responses for the whole spectrum of well defined
mechanisms from purely stepwise (low kf value) to purely concerted (high kf value), are
generated. Then, just like for experimental curves, app values and app=f(E,v) patterns are
determined as specific for the implemented mechanism. The procedure and its results are
shown in Fig. 2 and Fig. 3, respectively.
Fig. 3A illustrates that the range of sharp peaks cannot be interpreted as a mechanism
transition symptom since it remains in pure stepwise area. The order of magnitude of kf
necessary to reach concerted area, determined from Ipv–0.5 =f(v) dependence (Fig. 3 B,C), (see
also (Sanecki & Skitał, 2002a)), is >109 s–1. The results confirm that app values obtained from
peak width (5) or dEp/dv dependence (6) for ECE process do not judge stepwise/concerted
alternative hypothesis. Simultaneously, it turned out that non linear app patterns of type as
presented in Fig. 3A are characteristic for ECE processes within very pure stepwise
mechanism.
www.intechopen.com

Mathematical Modeling of Electrode Processes – Potential Dependent Transfer Coefficient in Electrochemical Kinetics 61
Fig. 2. (A) The theoretical CV responses obtained for the sequence of elementary steps given by eqs. (1) ÷ (3). (a): two-electron peak; (b): one-electron peak of step (1); (c): the same as (b) for step (3). (B) A series of two-electron peaks at various scan rates: 0.01, 0.1, 1, 2, 5, 10, 18, 25, 30, 40, 50, 60, 70, 80, 90, 100, 300, 500 V/s, increasing from the bottom to the top. [Reprinted from Comput. Chem., Vol. 26, Sanecki, P. & Skitał P., The cyclic voltammetry simulation of ..., 297-311, Copyright (2002), with permission from Elsevier.]
Fig. 3. The simulations of the sequence of (1) ÷ (3) steps. (A) The dependence of app on kf at
different scan rates. Input parameters: 1=2=0.5. The output parameters were calculated from eq. (5). (B), (C). The relationship ip v – 0.5 vs v as a diagnostic criterion. [Reprinted from Comput. Chem., Vol. 26, Sanecki, P. & Skitał P., The cyclic voltammetry simulation of ..., 297-311, Copyright (2002), with permission from Elsevier.]
5.2 The analysis of complex current responses and app plots obtained as a result of convolution method
The result of application of convolution method to CV current responses is expected to be a
linear type lnk=f(E) dependence. An value can be determined from its slope (Bard & Faulkner, 2001). For ECE process, however, the line obtained from parent two-electron ECE peak is curved (the degree of its curvature depends on k2/k1 ratio and kf value) and straight line approximation leads only to general, apparent parameters of no clear physical sense (Skitał & Sanecki, 2009). Moreover, the pseudo-linear plots clearly demonstrate involvement of two different steps of two-electron process (Fig. 4). Since linear regression is not sufficient here, the results of the convolution of two-electron ECE curves under discussion call for detailed mathematical procedure to evaluate kinetic parameters of individual steps. The simulation data (Fig. 4A) indicate that convolution method can be applied only to some
-1.6 -1.8 -2.0 -2.2 -2.4
0
100
200
300
(b)
one electron peak,
source for 1,app
calculation
(c)
one electron peak,
source for 2,app
calculation
(a)
two electron peak,
an equivalent
of experimental
curve source
for app
calculation
A
c
b
a
E / V
I / A
-1.6 -1.8 -2.0 -2.2 -2.4
0.0
0.5
1.0
18
16
17
151413
1211
10
78
9
654
321
E / V
BI / mA
10-7
10-5
10-3
10-1
101
103
105
107
109
1011
0.45
0.50
0.55
app
A
concerted stepwise
500V/s
100V/s10V/s1V/s0.1V/s
kf / s
-1
k2/k
1=1
0 100 200 300 400 500
20
40
60
80
100
120
k2/k
1=10
Ipv
- 0.5
v / Vs-1
B
stepwise
kf =1200 s
-1
2nd one electron peak
summary two electron peak
1st one electron peak
0 100 200 300 400 500
20
40
60
80
100
120
k2/k
1=10
v / Vs-1
1st one electron peak
summary two electron peak
concerted
kf =10
98 s
-1Ipv
- 0.5C
2nd one electron peak
www.intechopen.com

Recent Trend in Electrochemical Science and Technology 62
boundary cases of ECE mechanisms as E or EE type with kf from 109 value to kf=1098 as infinity, similarly as in Fig. 3 data.
Fig. 4. (A) The influence of kf on the shape of CV responses and lnkapp=f(E) dependences for simulated ECE mechanism. The interdependence between input CV curves and convolution results is shown. The length of non-linear curve fragment increases when kf increases (from the bottom to the top). The rate constants kapp were calculated by convolution method (eq. (7) and (8)). (B) The influence of k2/k1 ratio on the shape of lnkapp=f(E) dependence obtained from convoluted CV responses for simulated ECE mechanism. Parameters of CV curves are as
follows: k1=0.03 cm s-1, 1=2=0.5, v= 1 Vs-1. The k2/k1 and kf values are presented on the plot. Note the increase of complexity of structure from the left to the right. For values of parameters and details see original paper (Skitał & Sanecki, 2009). [Reprinted from Polish J. Chem., Vol. 83, Skitał P. & Sanecki P., The ECE Process in Cyclic Voltammetry. ..., 1127–1138, Copyright (2009), with permission from Polish Chemical Society.]
Fig. 5. The result of modeling of ECE process in cyclic voltammetry. An example of 3D plot:
general parameter app, determined by convolution method, as a function of log(k2/k1) and kf on 3D and 2D plots. Scan rate 10 V/s, k1=0.03 cm s-1; the values of kinetic parameters are in original paper (Skitał & Sanecki, 2009). For kf value less than 0.1 s–1 (not included), where process can be simplified to E one, the respective 3D plot is flat. The 2D plot can be obtained by cutting the 3D one with a respective plane. [Reprinted from Polish J. Chem., Vol. 83, Skitał P. & Sanecki P., The ECE Process in Cyclic Voltammetry. ..., 1127–1138, Copyright (2009), with permission from Polish Chemical Society.]
-0.6 -0.8 -1.0 -1.2 -1.4 -1.6 -1.8 -2.0 -2.2
-15
-10
-5
0
5
10
0
20
40
60
80
100
k2/k
1 = 10
kf = 5
kf = 50
kf = 180000
kf = 10
98
kf = 5000
lnkapp
E (V)
CV response
plots determined
from convoluted
CV responses
i (A)
A
-0.8 -1.1 -1.4
-14
-12
-10
-8
-6
-4
-2
k2/k
1=0.333
kf=5000
lnkapp
-0.8 -1.1 -1.4
k2/k
1=10
kf=5000
-0.8 -1.1 -1.4
B
E (V)
k2/k
1=1000
kf=5000
0.1
10
50
200
5005000
30000
-0.5700.426
11.42622.426
33.42644.426
v = 10 V s-1
log(k2 /k
1 ) k f (s
-1 )
0.4550
0.4725
0.4900
0.5075
0.5250
0.5425
0.5600
app
3D
5 4 3 2 1 0 -1 -2
0.46
0.48
0.50
0.52
0.54
v = 10 V s-1
kf = 0.1
kf = 10
kf = 50
kf = 200
kf = 500
kf = 5000
kf = 30 000
log(k2/k
1)
app
2D
www.intechopen.com
Mathematical Modeling of Electrode Processes – Potential Dependent Transfer Coefficient in Electrochemical Kinetics 63
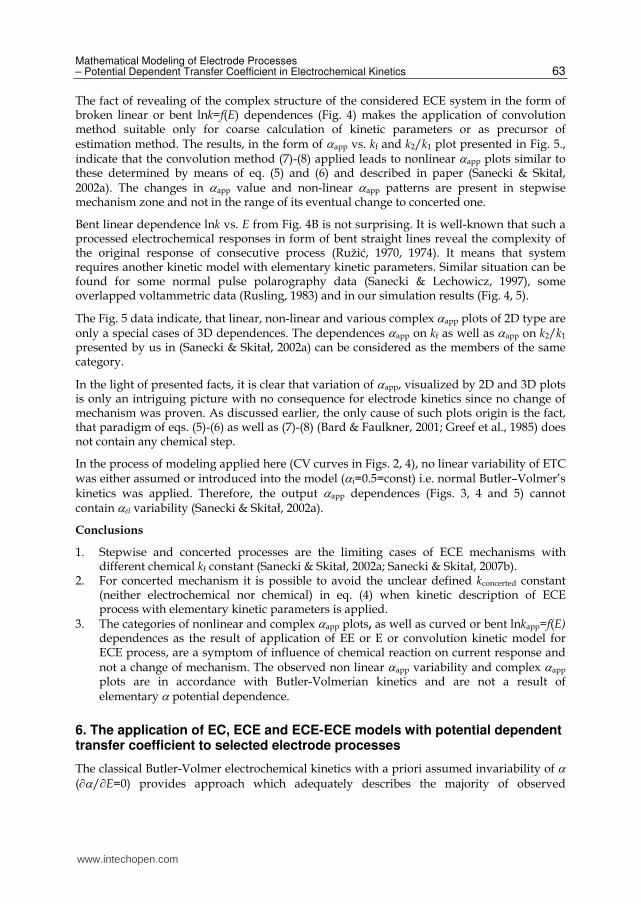
The fact of revealing of the complex structure of the considered ECE system in the form of broken linear or bent lnk=f(E) dependences (Fig. 4) makes the application of convolution method suitable only for coarse calculation of kinetic parameters or as precursor of estimation method. The results, in the form of app vs. kf and k2/k1 plot presented in Fig. 5., indicate that the convolution method (7)-(8) applied leads to nonlinear app plots similar to these determined by means of eq. (5) and (6) and described in paper (Sanecki & Skitał, 2002a). The changes in app value and non-linear app patterns are present in stepwise mechanism zone and not in the range of its eventual change to concerted one.
Bent linear dependence lnk vs. E from Fig. 4B is not surprising. It is well-known that such a processed electrochemical responses in form of bent straight lines reveal the complexity of the original response of consecutive process (Ružić, 1970, 1974). It means that system requires another kinetic model with elementary kinetic parameters. Similar situation can be found for some normal pulse polarography data (Sanecki & Lechowicz, 1997), some overlapped voltammetric data (Rusling, 1983) and in our simulation results (Fig. 4, 5).
The Fig. 5 data indicate, that linear, non-linear and various complex app plots of 2D type are only a special cases of 3D dependences. The dependences app on kf as well as app on k2/k1 presented by us in (Sanecki & Skitał, 2002a) can be considered as the members of the same category.
In the light of presented facts, it is clear that variation of app, visualized by 2D and 3D plots is only an intriguing picture with no consequence for electrode kinetics since no change of mechanism was proven. As discussed earlier, the only cause of such plots origin is the fact, that paradigm of eqs. (5)-(6) as well as (7)-(8) (Bard & Faulkner, 2001; Greef et al., 1985) does not contain any chemical step.
In the process of modeling applied here (CV curves in Figs. 2, 4), no linear variability of ETC was either assumed or introduced into the model (i=0.5=const) i.e. normal Butler–Volmer’s kinetics was applied. Therefore, the output app dependences (Figs. 3, 4 and 5) cannot contain el variability (Sanecki & Skitał, 2002a).
Conclusions
1. Stepwise and concerted processes are the limiting cases of ECE mechanisms with different chemical kf constant (Sanecki & Skitał, 2002a; Sanecki & Skitał, 2007b).
2. For concerted mechanism it is possible to avoid the unclear defined kconcerted constant (neither electrochemical nor chemical) in eq. (4) when kinetic description of ECE process with elementary kinetic parameters is applied.
3. The categories of nonlinear and complex app plots, as well as curved or bent lnkapp=f(E) dependences as the result of application of EE or E or convolution kinetic model for ECE process, are a symptom of influence of chemical reaction on current response and not a change of mechanism. The observed non linear app variability and complex app plots are in accordance with Butler-Volmerian kinetics and are not a result of elementary potential dependence.
6. The application of EC, ECE and ECE-ECE models with potential dependent transfer coefficient to selected electrode processes
The classical Butler-Volmer electrochemical kinetics with a priori assumed invariability of (/E=0) provides approach which adequately describes the majority of observed
www.intechopen.com

Recent Trend in Electrochemical Science and Technology 64
electrode processes. The problem of variability appears in some special cases of kinetic analysis e.g. during investigation of multi-stage electron transfer separated by a large potential interval, for series of substituted compounds with the same reactive group as well as for experimental long distance current-potential dependences of quasi-reversible processes (Corrigan & Evans, 1980; Matsuda & Tamamushi, 1979; Sanecki, 2001; Sanecki & Kaczmarski, 1999; Sanecki & Skitał, 2007b). The first case of the type was described by Pierce and Geiger as alpha kinetic discrimination (Pierce & Geiger, 1992). Currently, extended and still growing application of variety of solid electrodes (McDermott et al., 1992), including chemically modified and semiconductor electrodes, makes the problem of diversification and variability of transfer coefficient much more important than ever before.
The significance of the discussed problem is confirmed by simple calculations, based on relevant literature data (Angell & Dickinson, 1972; Garreau et al., 1979; Savéant & Tessier, 1982; Savéant & Tessier et al., 1977), which leads to the conclusion that ETC variability effect is usually 5-10 times stronger than the double layer correction effect (see also Sanecki & Skitał, 2007a).
Transfer coefficient is one of the fundamental concepts in electrode kinetics. The extensive theoretical support, including all modern theories of charge transfer, predicts the potential variability of ETC (Dogonadze, 1971; Hush, 1958; Levich, 1966; Marcus, 1956; Marcus, 1960; Marcus, 1977). The variation of ETC for reduction and oxidation processes of individual compounds and ions has been systematically investigated by Savéant’s group, Corrigan and Evans and others (Angell & Dickinson, 1972; Bindra et al., 1975; Corrigan & Evans, 1980; Dogonadze, 1971; Frumkin, 1932; Garreau et al., 1979; Hush, 1958; Levich, 1966; Marcus, 1956; Marcus, 1960; Marcus, 1977; Matsuda & Tamamushi, 1979; McDermott et al., 1992; Nagy et al., 1988; Parsons & Passeron, 1966; Rifi & Covitz, 1974; Samec & Weber, 1973; Sanecki, 1986; Savéant & Tessier, 1975; Savéant & Tessier, 1982; Tyma & Weaver, 1980). The studies have been focused on the experimental detection of the ETC variability. The research goal has been achieved with minimal further continuation. In refs. (Angell & Dickinson, 1972; Bindra et al., 1975; Corrigan & Evans, 1980; Garreau et al., 1979; Matsuda & Tamamushi, 1979; McDermott et al., 1992; Nagy et al., 1988; Parsons & Passeron, 1966; Samec & Weber, 1973; Savéant & Tessier, 1975; Savéant & Tessier, 1982; Tyma & Weaver,
1980) one can easily find or calculate the /E 0 values for the one electron processes and for resolved two electron reduction (Sanecki, 2001; Sanecki & Kaczmarski, 1999). The
investigation of a problem of the potential dependent has been continued by several authors (Chidsey, 1991; Finklea, 2001a, 2001b; Finklea & Haddox, 2001; Finklea et al., 2001; Haddox & Finklea, 2003; Miller, 1995; Smalley et al., 1995). What is more, well known
analogy of and to B and B of the BrØnsted parameters (Albery, 1975; Frumkin, 1932; Rifi & Covitz, 1974), the ETC has also been interpreted as a Hammett-type reaction constant (Sanecki, 1986). This interpretation, due to similarity of the homogenous and heterogeneous kinetics, allows the more flexible approach to the ETC value and is easy to understand by non electrochemists (Rifi & Covitz, 1974).
At present, the majority of electrochemists do not apply the ETC variability or consider it meaningless. Therefore, there is a need to indicate the special cases in which the effect may be of importance (Sanecki & Skitał, 2007a, 2007b). Our choice of respective experimental cases was focused on the following four examples (points 6.1-6.4). In turn, point 6.5 is
devoted to comparison of IRu drop and ∂/∂E parameter influence on CV responses.
www.intechopen.com

Mathematical Modeling of Electrode Processes – Potential Dependent Transfer Coefficient in Electrochemical Kinetics 65
6.1 Repetition of the important literature example of the observed elementary variability case
Corrigan and Evans (Corrigan & Evans, 1980) showed that inclusion of variability in form
of /E parameter into kinetic model of one-electron quasireversible reduction process of 2-nitro-2-methylpropane Eq. (9):
11
2 2 2
,-BuNO -BuNO -Bu NOch
k kt t t
e (9)
leads to better fit between experimental and theoretical responses.
We obtained the result similar to that but for more extended scan rate range on GC and Hg
electrodes in DMF solution, where the effect turned out to be more distinct. Our results are
presented in Table 2 and in Fig. 6 (/E =0 and /E 0 for comparison) where the value
/E = 0.42 V–1 was obtained as kinetic parameter by estimation for both electrodes.
The data shown in Table 2 indicate that our results, including the obtained /E values,
are in full agreement with the results obtained by Corrigan and Evans. In the light of
presented facts the need of introducing variability into kinetic model of the considered
system is clear (Fig. 6). The better fit obtained for model with /E included is confirmed
by statistical data (Sanecki & Skitał, 2007a).
(Corrigan & Evans, 1980) (Sanecki & Skitał, 2007a)
Hg Pt GCE Hg
/E, V–1 0.37± 0.03 0.40 0.42±0.02 0.42±0.03
scan rate range 10-100 Vs–1 0.1-100 Vs–1
medium AN, TBAP AN, TEAP DMF, 0.3 M TBAP
kinetic model E EC
Table 2. CV reduction of 2-methyl-2-nitropropane. The comparison of our variability results with analogical data published by Corrigan and Evans. [The Table reproduced by permission of The Electrochemical Society.]
6.2 Comparison of two ECE-ECE reduction steps with large potential difference (reduction of 1,3-benzenedisulfonyl difluoride)
A comparison of two identical reduction processes located at different potentials may be
considered as a classical model for determination of variability. The approach was first
presented by Pearce and Geiger (Pierce & Geiger,1992). In turn, the variability was
determined by the comparison of two –SO2F group reduction on Hg electrode (Sanecki &
Kaczmarski, 1999) (Δ method – the two different values of were optimized by
estimation). At present, the same system was investigated using the GCE electrode.
The results (Fig. 7) indicate that for electroreduction of 1,3-benzenedisulfonyl difluoride (1,3-
BDF), the ECE kinetic model without variability is not possible. There is a significant
difference between the ’s for both reduction stages i.e. between 1 and 3 as well as between 2 and 4 (note also the difference in a shape of the peaks). Fig. 7, the left column plots indicate
that a model without Δ variability provides crossing experimental and theoretical plots. Both
www.intechopen.com
Recent Trend in Electrochemical Science and Technology 66
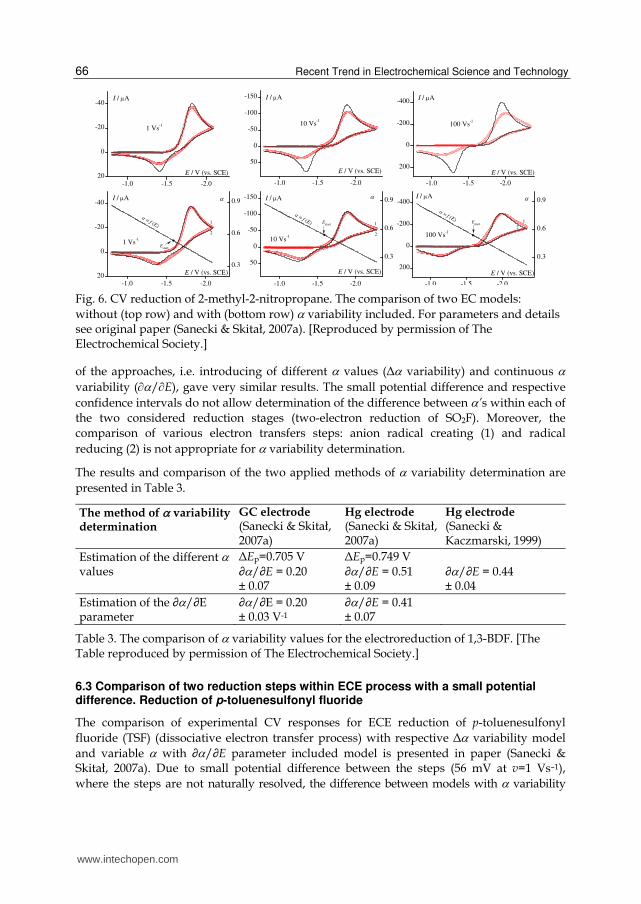
Fig. 6. CV reduction of 2-methyl-2-nitropropane. The comparison of two EC models:
without (top row) and with (bottom row) variability included. For parameters and details see original paper (Sanecki & Skitał, 2007a). [Reproduced by permission of The Electrochemical Society.]
of the approaches, i.e. introducing of different values (Δ variability) and continuous
variability (/E), gave very similar results. The small potential difference and respective
confidence intervals do not allow determination of the difference between ’s within each of
the two considered reduction stages (two-electron reduction of SO2F). Moreover, the
comparison of various electron transfers steps: anion radical creating (1) and radical
reducing (2) is not appropriate for variability determination.
The results and comparison of the two applied methods of variability determination are
presented in Table 3.
The method of variability determination
GC electrode(Sanecki & Skitał, 2007a)
Hg electrode(Sanecki & Skitał, 2007a)
Hg electrode (Sanecki & Kaczmarski, 1999)
Estimation of the different values
ΔEp=0.705 V∂/∂E = 0.20 ± 0.07
ΔEp=0.749 V ∂/∂E = 0.51 ± 0.09
∂/∂E = 0.44 ± 0.04
Estimation of the ∂/∂E parameter
∂/∂E = 0.20 ± 0.03 V-1
∂/∂E = 0.41 ± 0.07
Table 3. The comparison of variability values for the electroreduction of 1,3-BDF. [The Table reproduced by permission of The Electrochemical Society.]
6.3 Comparison of two reduction steps within ECE process with a small potential difference. Reduction of p-toluenesulfonyl fluoride
The comparison of experimental CV responses for ECE reduction of p-toluenesulfonyl
fluoride (TSF) (dissociative electron transfer process) with respective Δ variability model
and variable with ∂/∂E parameter included model is presented in paper (Sanecki & Skitał, 2007a). Due to small potential difference between the steps (56 mV at v=1 Vs–1),
where the steps are not naturally resolved, the difference between models with variability
-1.0 -1.5 -2.020
0
-20
-40
-1.0 -1.5 -2.0
50
0
-50
-100
-150
-1.0 -1.5 -2.0
200
0
-200
-400
0.3
0.6
0.9
0.3
0.6
0.9
0.3
0.6
0.9
-1.0 -1.5 -2.020
0
-20
-40
-1.0 -1.5 -2.0
50
0
-50
-100
-150
-1.0 -1.5 -2.0
200
0
-200
-400
1 Vs-1
E / V (vs. SCE)
I / A
2
1
10 Vs-1
E / V (vs. SCE)
I / A
2
1
100 Vs-1
E / V (vs. SCE)
I / A
2
1
= f (E)
Estart
= f (E)
Estart
Estart
= f (E)
1 Vs-1
E / V (vs. SCE)
I / A
10 Vs-1
E / V (vs. SCE)
I / A
100 Vs-1
E / V (vs. SCE)
I / A
www.intechopen.com

Mathematical Modeling of Electrode Processes – Potential Dependent Transfer Coefficient in Electrochemical Kinetics 67
included and not included is insignificant here. Moreover, the two ways of variability introduction lead to almost the same dependences which suggests that the models are equivalent (Sanecki & Skitał, 2007a).
6.4 Comparison of the p-toluenesulfonyl fluoride and benzenesulfonyl fluoride reductions. The substituent effect
When the two consecutive steps of two-electron process are not naturally split and k2<k1 or k2≈k1, it is possible to determine the elementary transfer coefficients with satisfactory accuracy. For such cases the difference of peak potentials is seen on calculated elementary steps parameters (Sanecki & Skitał, 2007a). When k2>k1, the respective confidence intervals for second electrochemical step are wider than those for the first one in case of 1,3-BDF electroreduction (Fig. 7).
Fig. 7. Comparison of experimental (red points) and theoretically obtained curves (black lines) of the CV electroreduction of 1,3-BDF in 0.3 M TBAP/DMF on GCE. Estimated
parameters for ECE-ECE model are: (A) & (B)– with variability not included (/E=0 and 1=2=3=4): k1=0.017±0.001 cms–1, k2=0.064±0.01 cms–1, k3=0.041±0.003 cms–1,
k4=0.0065±0.0005 cms–1, 1=2=3=4=0.51±0.01, kf1=1100±200 s–1, kf2=8000±900 s–1; (C) &
(D)– with included variability (1=2, 3=4; ∆/∆E≠0) in (Sanecki & Skitał, 2007a); (E) &
(F)– with included variability (/E≠0) in (Sanecki & Skitał, 2007a). The estimated linear =f(E) variability along the CV response is shown on the plot. The scale for is the right vertical axis. [Reproduced by permission of The Electrochemical Society.]
The effect of substituent on elementary was considered in our previous papers (Sanecki, 2001; Sanecki & Kaczmarski, 1999). Now we compare the reduction of two compounds with
ΔEp≈0.1V to show the limit of possibility of variability detection when two similar (with identical reducible group) compounds are compared (Fig. 8).
The two substituted compounds values of ∂/∂E obtained by comparison of respective
kinetic parameters are quite reasonable but due to the small difference in value must be charged with significant error. It suggests that for two substituted compounds, when
difference in peak potential is under 0.1 V, the difference in values is unrecognizable and
-1.0 -1.5 -2.0
0
-10
-20
-30
-1.0 -1.5 -2.0 -2.5
0
-100
-200
-300
0.0
0.3
0.6
0.0
0.3
0.6
-1.0 -1.5 -2.0
0
-10
-20
-30
-1.0 -1.5 -2.0 -2.5
0
-100
-200
-300
-1.0 -1.5 -2.0
0
-10
-20
-30
-1.0 -1.5 -2.0 -2.5
0
-100
-200
-300
(E)0.5 Vs-1
E / V (vs. SCE)
I / A
I
I4
I3
I2
I1
Estart
(F)100 Vs-1
E / V (vs. SCE)
I / A
I
I4
I3
I2
I1
= f (E)
= f (E)
E
start
(C)0.5 Vs
-1
E / V (vs. SCE)
I / A
I
I4
I3I
2I1
(D)100 Vs
-1
E / V (vs. SCE)
I / A
I
I4
I3
I2
I1
0.5 Vs-1
E / V (vs. SCE)
I / A
I
I4
I3
I2I
1
(A)
(B)100 Vs
-1
E / V (vs. SCE)
I / A
I
I4
I3
I2
I1
www.intechopen.com

Recent Trend in Electrochemical Science and Technology 68
variability is not a problem to consider. The similar picture as presented in Fig. 8 and the respective calculation results for two substituted compounds as well as for the series of
iodobenzenes examples of variability can be found in paper (Sanecki, 2001).
Fig. 8. The comparison of CV reduction of benzenesulfonyl fluoride (BSF) (red line) and TSF
(blue line) in 0.3M TBAP/DMF on: (A) GC and (B) Hg electrodes. The curves on plots (A)
and (B) were shifted to compare the slopes: plot (A) on GCE by ΔE= –0.122 V, plot (B) on Hg
by ΔE= –0.098 V. Note the small difference of slopes which corresponds to a difference of .
The same effect is seen on estimated values: 1=0.67±0.02 for BSF and 1=0.62±0.02 for TSF
both on GCE. On Hg electrode for BSF 1=0.67±0.02, for TSF 1=0.62±0.02. It results in
∂1/∂E = 0.41±V–1 for GCE and ∂1/∂E=0.61 V-1 for Hg electrode. For other parameters see
original paper (Sanecki & Skitał, 2007a). [Reproduced by permission of The Electrochemical
Society.]
6.5 Comparison of IRu drop and ∂/∂E parameter influence on CV responses
The influence of IRu effect and non-constant transfer coefficient effect on current response
shape can be similar and there is a real risk of making a mistake of detecting a non existing
∂/∂E effect. Therefore, the comparison of both effects by simulations is presented in Fig. 9.
Fig. 9. Theoretical CV current responses for EC kinetic model. The influence of
uncompensated resistance Ru and included variability for 1Vs-1 and 100Vs-1. The scan rate
value is the one difference between left and right plot. Curves (1),(2),(3),(4): variable model
with /E=0 and Ru=0Ω, 100Ω, -100Ω, 200Ω, respectively; curve (5): variable model with
/E=0.4 and Ru=0Ω. For other parameters see the paper (Sanecki & Skitał, 2007a).
[Reproduced by permission of The Electrochemical Society.]
-1.4 -1.6 -1.8 -2.0
0
-10
-20
-30
-40
-1.4 -1.6 -1.8 -2.0
0
-5
-10
-15
-20
TSF
E / V (vs. SCE)
I / A
0.5 Vs-1
ABSF
TSF
BSF
E / V (vs. SCE)
I / A
0.5 Vs-1
B
-1.0 -1.5 -2.020
0
-20
-40
-60
-1.0 -1.5 -2.0
200
0
-200
-400
-600
3
5
2
1 Vs-1
E / V (vs. SCE)
I / A 1
5
4
100 Vs-1
E / V (vs. SCE)
I / A
5
3
5
21
4
www.intechopen.com
Mathematical Modeling of Electrode Processes – Potential Dependent Transfer Coefficient in Electrochemical Kinetics 69
The IRu compensation problems have been resolved by the method of estimation with the use of theoretical peaks (Sanecki et al., 2003). The series of data in 0.1–100 V/s scan rate range for EC, ECE, and ECE–ECE mechanisms, which correspond to the investigated compounds, were compared.
At first, series of theoretical EC responses were generated, for input set of kinetic parameters. The obtained responses were treated as pseudo-experimental ones and the output kinetic parameters were evaluated from them by a standard estimation procedure. The obtained results indicate that generally, for all kinetic models, IRu attenuates the
determination of exact values not only /E, but all input values of kinetic parameters. For
EC model, the influence of IRu effect is expressed on k1 to a higher degree, and less on /E
and start.
The IRu effect depends on a scan rate value. It is practically invisible at low v up to 1–2 Vs-1 (Fig. 9). The effect increases gradually with v and at 25, 50 and 100 V/s is clearly visible, for
instance in the range 5–100 Vs–1 Ru=100 Ω produces non existing ∂/∂E = 0.01–0.04 V–1.
Hence, the low scan rate data are safe for /E determination, even in case of lack of IRu
compensation (not recommended). The /E≠0 effect, however, is generally observed as a visible gap in fits for all scan rate peaks (examples: Fig. 9). The influence on the peak shape is different for both effects. The IRu effect decreases the slope without change of the peak
height and passes Ep towards negative potentials. The /E effect decreases both the slope and the peak height with small influence on Ep.
An overcorrection done on IRu affected responses is not able to provide a variable effect,
since after IRu correction CV peaks are steeper which is exactly opposite to observed ∂/∂E effect on CV response (Fig. 9). On the contrary, the real risk is the CV response charged with
uncompensated IRu, which can be erroneously considered as comprising an ∂/∂E effect.
Other important results obtained from extensive simulations are as follows. For IRu>0 (the
case of undercompensation), the obtained ∂/∂E (and itself ) increases with v. For IRu<0
(the case of overcompensation), the obtained ∂/∂E (and itself ) decreases with v and its
negative values can be obtained. For IRu=0 (the proper compensation), the obtained ∂/∂E are constant with v.
The recognized rules can be treated as diagnostic criteria. For the other ECE and ECE–ECE models under consideration, the above rules and conclusions hold, although they are less
distinct for potential dependent parameter due to small sensitivity of their kinetic systems.
7. Alkyl iodides electroreduction and variability
The process of the electroreduction of organic iodides is an example of two-electron reductive cleavage reaction and a subject of extensive investigation in the organic electrochemistry (Andrieux et al., 1979; Caldwell & Hacobian, 1968a, 1968b; Colichman & Kung Liu, 1954; Hush, 1957; Hussey & Diefenderfer, 1967; Jaworski et al., 1992; Mairanovskii, 1969; Mairanovskii & Rubinskaya, 1972; Mairanovskii et al., 1975; Pause et al., 2000; Peters, 1991; Sanecki, 2001; Sawyer et al., 1995; Sease et al., 1968; Stackelberg, 1949;). The established mechanism is relevant for the cleavage of carbon–halogen bond and has been successfully applied also for the other categories of compounds (e.g. (Andrieux et al., 1996, 1997; Jakobsen et al., 1999)).
www.intechopen.com
Recent Trend in Electrochemical Science and Technology 70
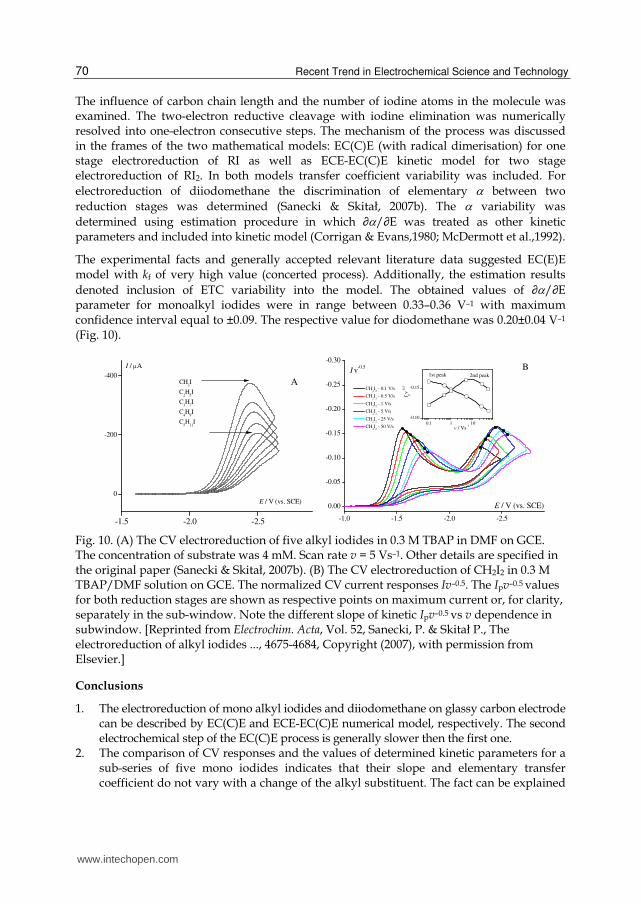
The influence of carbon chain length and the number of iodine atoms in the molecule was examined. The two-electron reductive cleavage with iodine elimination was numerically resolved into one-electron consecutive steps. The mechanism of the process was discussed in the frames of the two mathematical models: EC(C)E (with radical dimerisation) for one stage electroreduction of RI as well as ECE-EC(C)E kinetic model for two stage electroreduction of RI2. In both models transfer coefficient variability was included. For
electroreduction of diiodomethane the discrimination of elementary between two
reduction stages was determined (Sanecki & Skitał, 2007b). The variability was
determined using estimation procedure in which ∂/∂E was treated as other kinetic parameters and included into kinetic model (Corrigan & Evans,1980; McDermott et al.,1992).
The experimental facts and generally accepted relevant literature data suggested EC(E)E model with kf of very high value (concerted process). Additionally, the estimation results
denoted inclusion of ETC variability into the model. The obtained values of ∂/∂E parameter for monoalkyl iodides were in range between 0.33–0.36 V–1 with maximum confidence interval equal to ±0.09. The respective value for diodomethane was 0.20±0.04 V–1 (Fig. 10).
Fig. 10. (A) The CV electroreduction of five alkyl iodides in 0.3 M TBAP in DMF on GCE. The concentration of substrate was 4 mM. Scan rate v = 5 Vs–1. Other details are specified in the original paper (Sanecki & Skitał, 2007b). (B) The CV electroreduction of CH2I2 in 0.3 M TBAP/DMF solution on GCE. The normalized CV current responses Iv–0.5. The Ipv–0.5 values for both reduction stages are shown as respective points on maximum current or, for clarity, separately in the sub-window. Note the different slope of kinetic Ipv–0.5 vs v dependence in subwindow. [Reprinted from Electrochim. Acta, Vol. 52, Sanecki, P. & Skitał P., The electroreduction of alkyl iodides ..., 4675-4684, Copyright (2007), with permission from Elsevier.]
Conclusions
1. The electroreduction of mono alkyl iodides and diiodomethane on glassy carbon electrode can be described by EC(C)E and ECE-EC(C)E numerical model, respectively. The second electrochemical step of the EC(C)E process is generally slower then the first one.
2. The comparison of CV responses and the values of determined kinetic parameters for a sub-series of five mono iodides indicates that their slope and elementary transfer coefficient do not vary with a change of the alkyl substituent. The fact can be explained
-1.5 -2.0 -2.5
0
-200
-400
I / A
E / V (vs. SCE)
CH3I
C2H
5I
C3H
7I
C4H
9I
C5H
11I
A
-1.0 -1.5 -2.0 -2.5
0.00
-0.05
-0.10
-0.15
-0.20
-0.25
-0.30
0.1 1 10
-0.10
-0.15
CH2I
2 - 0.1 V/s
CH2I
2 - 0.5 V/s
CH2I
2 - 1 V/s
CH2I
2 - 5 V/s
CH2I
2 - 25 V/s
CH2I
2 - 50 V/s
E / V (vs. SCE)
I v
-0.5
v / Vs
-1
I pv
-0.5
1st peak 2nd peak
B
www.intechopen.com
Mathematical Modeling of Electrode Processes – Potential Dependent Transfer Coefficient in Electrochemical Kinetics 71
by a small difference of reduction potentials caused by weak substituent effect of alkyl groups.
3. The determined ∂/∂E value for diiodomethane is equal to 0.20 V–1 and is about two
times lower than that obtained in literature for aromatic compound electroreduction on
Hg (Sanecki & Kaczmarski, 1999). For the other elementary processes the values in the
range 0.174-0.4 V–1 were obtained (Savéant & Tessier, 1982). On the other hand, the
respective values obtained for monoalkyl iodides are higher (Sanecki & Skitał, 2007b).
4. The respective comparison of elementary kinetic parameters for two-stage diiodomethane
electroreduction on GCE indicates the presence of alpha kinetic discrimination with
/E=0.15 V-1 according to Pearce and Geiger nomenclature (Pierce & Geiger, 1992).
8. Theoretical discovery of isoalpha points
8.1 Parameter /E or non-continuous change of (∆) as a source of revealing particular points on CV curve
The variability was firstly used as a tool to reveal the particular properties of the investigated system in (Sanecki & Skitał, 2008). It was shown that respective simulations lead to discovery of the new meaningful phenomenon called isoalpha effect (Fig. 11,12). The
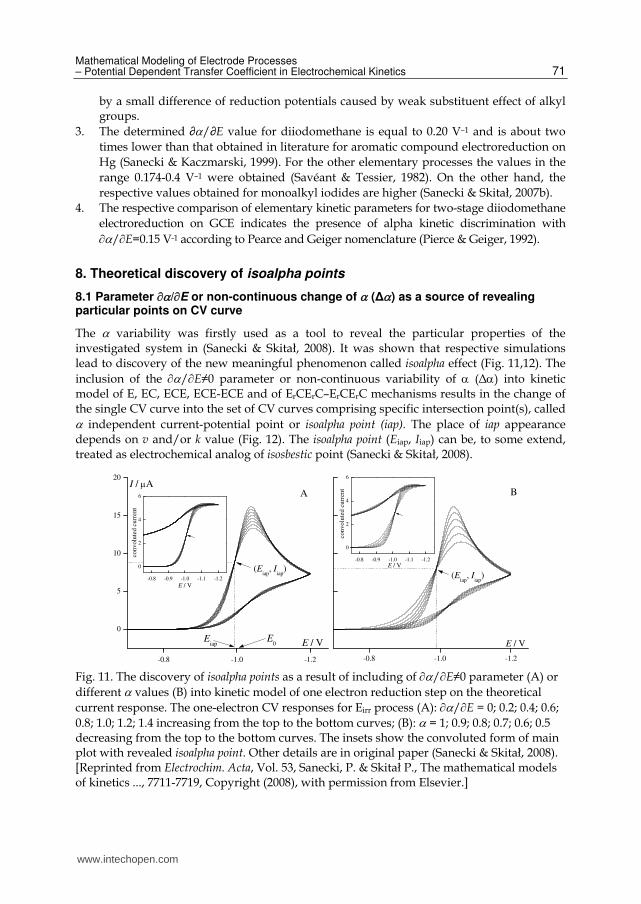
inclusion of the /E≠0 parameter or non-continuous variability of (Δ) into kinetic model of E, EC, ECE, ECE-ECE and of ErCErC–ErCErC mechanisms results in the change of the single CV curve into the set of CV curves comprising specific intersection point(s), called independent current-potential point or isoalpha point (iap). The place of iap appearance depends on v and/or k value (Fig. 12). The isoalpha point (Eiap, Iiap) can be, to some extend, treated as electrochemical analog of isosbestic point (Sanecki & Skitał, 2008).
Fig. 11. The discovery of isoalpha points as a result of including of /E≠0 parameter (A) or
different values (B) into kinetic model of one electron reduction step on the theoretical
current response. The one-electron CV responses for Eirr process (A): /E = 0; 0.2; 0.4; 0.6;
0.8; 1.0; 1.2; 1.4 increasing from the top to the bottom curves; (B): = 1; 0.9; 0.8; 0.7; 0.6; 0.5 decreasing from the top to the bottom curves. The insets show the convoluted form of main plot with revealed isoalpha point. Other details are in original paper (Sanecki & Skitał, 2008). [Reprinted from Electrochim. Acta, Vol. 53, Sanecki, P. & Skitał P., The mathematical models of kinetics ..., 7711-7719, Copyright (2008), with permission from Elsevier.]
-0.8 -1.0 -1.2
0
5
10
15
20
-0.8 -0.9 -1.0 -1.1 -1.2
0
2
4
6
-0.8 -1.0 -1.2
-0.8 -0.9 -1.0 -1.1 -1.2
0
2
4
6
I / A
(Eiap
, Iiap
)
Eiap E / VE
0
A
con
vo
lute
d c
urr
ent
E / V
(Eiap
, Iiap
)
E / V
B
con
vo
lute
d c
urr
ent
E / V
www.intechopen.com

Recent Trend in Electrochemical Science and Technology 72
Parameter /E into respective kinetic equation was previously applied by Corrigan and Evans (Corrigan & Evans, 1980) as well as McDermott and coauthors (McDermott et al.,
1992). The application of the non-continuous ETC variability parameter (Δ), in which each
curve is generated for different value was applied (Sanecki & Kaczmarski, 1999; Sanecki & Skitał, 2007a, 2007b; Sanecki et al., 2006b).
Theoretical curves visualized in Fig. 11A were obtained by the algorithm which includes
/E in the range 0 - 1.4 V-1. Despite the fact, that experimental values of /E do not
exceed 0.5 V-1, the application of wider range of /E results in more extended set of
curves. For the same reason =1 as a starting value was chosen (Fig. 11B). When the
variability starts at =0.5, the intersection point (iap) remains the same but the plot is less convincing.
Fig. 12. The effect of including of /E≠0 parameter (plots (A), (B), (C)) or different values (plots (D), (E), (F)) into theoretical one-electron kinetic model Eirr as well as the
influence of k value on isoalpha point current response. Plots (A), (B), (C) with /E = 0;
0.2; 0.4; 0.6; 0.8; 1.0; 1.2; 1.4. (A) k =0.05, (B) k =0.005, (C) k =0.00001. Plots (D), (E), (F) with =
1; 0.9; 0.8; 0.7; 0.6; 0.5; /E = 0, (D) k =0.05, (E) k =0.005, (F) k =0.00001. The calculations were done with the use of both ESTYM_PDE (black lines, Eirr) and DigiSim® (red lines, ErC with kf=1×10¹⁰ s–1). Notice, that the both programs provide identical current responses (plots (D), (E), (F)). The insets ((C) and (F)) show the enlarged form of background fragment. Other details are in original paper (Sanecki & Skitał, 2008). [Reprinted from Electrochim. Acta, Vol. 53, Sanecki, P. & Skitał P., The mathematical models of kinetics ..., 7711-7719, Copyright (2008), with permission from Elsevier.]
www.intechopen.com

Mathematical Modeling of Electrode Processes – Potential Dependent Transfer Coefficient in Electrochemical Kinetics 73
As a result of including of the ETC variation either through /E parameter or by different
values of , a single curve becomes the set of curves which intersect in one characteristic
point in which cathodic current is independent of (Fig. 11 A and B, respectively). The
result is similar to isosbestic point (Berlett et al., 2000; IUAPAC, 1997; Nakajima et al., 2004).
The system resembling iap and isosbestic point, called isopotential point has been described in
electrochemistry (Edens et al., 1991; Eichhorn & Speiser, 1994; Fitch & Edens, 1989). Its
appearance is associated with the linked multi-sweep experiments when two
distinguishable electroactive species interconvert.
The model for totally irreversible process applied with the use of ESTYM_PDE was
described in paper by Nicholson and Shain (Nicholson & Shain, 1964) and is given in Bard
and Faulkner’s monograph (Bard & Faulkner, 2001). It is not included in DigiSim® software.
In DigiSim®, however, the Eirr mechanism response was easily generated as ErC with very
high kf value e.g. kf = 1×10¹⁰ s–1 (Fig. 12 D,E,F).
A question arises why other authors dealing with the effect of potential-dependent in
voltammetry (Arun & Sangaranarayanan, 2004; Bieniasz & Speiser, 1998a; Bond & Mahon,
1997; Delahay, 1953; Nahir et al., 1994; Tender et al., 1994; Weber & Creager, 1994) did not
observe so far such a phenomenon as iap, even if Marcus’ λ parameter was discussed instead
of . Most probably there are three reasons. Firstly, the range of the phenomenon is not very
wide e.g. it appears for 0.05 > k > 1×10⁻⁴, at v =1Vs–1 (for k=0.05, Fig. 12 A,D the iap is
diffused). At lower k values iap occurs but is invisible unless a magnification method is
applied (Fig. 12 C,F). Secondly, is the phenomenon to be observed requires at least three (or
more) superimposed curves and that was not fulfilled by the other authors. Even if one
maintains all parameters constant except for , no iap is observed and CV peak moves
towards more negative potentials becoming flatter as decreases. Examples of the lacking
or not visible iap can be found in paper by Delahay (Fig. 2 in (Delahay, 1953)).
The third reason in form of examples was shown in Fig. 12 C,F. The data indicate that it is
not possible to find iap without magnification of the plot and therefore some authors could
not notice such a hidden effect. The observed iap phenomenon is not contradictory to the
well established theory and provides its completion.
The similar, although less distinct isoalpha points are obtained for ErC process when
/E≠0 parameter or different values mode is introduced into the model (Fig. 12).The influence of scan rate and E0 value on position iap is discussed in (Sanecki & Skitał, 2008). It is seen that iap moves down when scan rate increases and its value becomes closer to E0 value.
8.2 ECE and ECEC mechanisms with included variability
The kinetics should concern the steps and elementary parameters, which have clear physical
meaning as it was performed earlier for Eirr process (Fig. 11,12). On the other hand, data
applied for ECE process, allowed to generate dependences corresponding to those from Fig.
2 and may be important for ECE process kinetics. Examples of isoalpha points for both
general (two-electron) peaks and elementary (one-electron) sub-peaks are presented in Fig.
13A,B.
www.intechopen.com
Recent Trend in Electrochemical Science and Technology 74
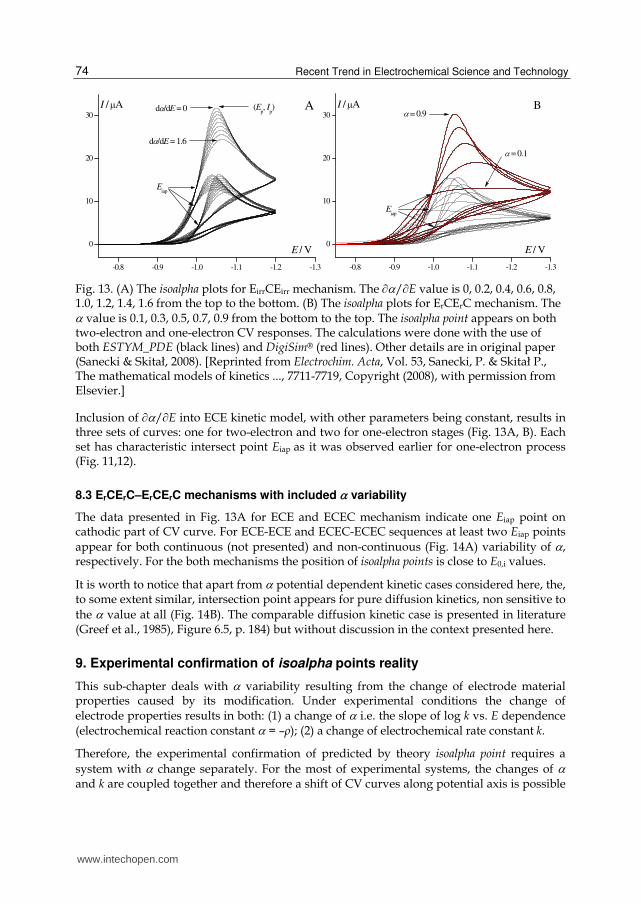
Fig. 13. (A) The isoalpha plots for EirrCEirr mechanism. The /E value is 0, 0.2, 0.4, 0.6, 0.8, 1.0, 1.2, 1.4, 1.6 from the top to the bottom. (B) The isoalpha plots for ErCErC mechanism. The value is 0.1, 0.3, 0.5, 0.7, 0.9 from the bottom to the top. The isoalpha point appears on both two-electron and one-electron CV responses. The calculations were done with the use of both ESTYM_PDE (black lines) and DigiSim® (red lines). Other details are in original paper (Sanecki & Skitał, 2008). [Reprinted from Electrochim. Acta, Vol. 53, Sanecki, P. & Skitał P., The mathematical models of kinetics ..., 7711-7719, Copyright (2008), with permission from Elsevier.]
Inclusion of /E into ECE kinetic model, with other parameters being constant, results in three sets of curves: one for two-electron and two for one-electron stages (Fig. 13A, B). Each set has characteristic intersect point Eiap as it was observed earlier for one-electron process (Fig. 11,12).
8.3 ErCErC–ErCErC mechanisms with included variability
The data presented in Fig. 13A for ECE and ECEC mechanism indicate one Eiap point on cathodic part of CV curve. For ECE-ECE and ECEC-ECEC sequences at least two Eiap points
appear for both continuous (not presented) and non-continuous (Fig. 14A) variability of , respectively. For the both mechanisms the position of isoalpha points is close to E0,i values.
It is worth to notice that apart from potential dependent kinetic cases considered here, the, to some extent similar, intersection point appears for pure diffusion kinetics, non sensitive to
the value at all (Fig. 14B). The comparable diffusion kinetic case is presented in literature (Greef et al., 1985), Figure 6.5, p. 184) but without discussion in the context presented here.
9. Experimental confirmation of isoalpha points reality
This sub-chapter deals with variability resulting from the change of electrode material properties caused by its modification. Under experimental conditions the change of electrode properties results in both: (1) a change of i.e. the slope of log k vs. E dependence (electrochemical reaction constant = –ρ); (2) a change of electrochemical rate constant k.
Therefore, the experimental confirmation of predicted by theory isoalpha point requires a
system with change separately. For the most of experimental systems, the changes of and k are coupled together and therefore a shift of CV curves along potential axis is possible
-0.8 -0.9 -1.0 -1.1 -1.2 -1.3
0
10
20
30
I / A
d/dE = 1.6
d/dE = 0 (Ep, I
p)
Eiap
E / V
A
-0.8 -0.9 -1.0 -1.1 -1.2 -1.3
0
10
20
30
= 0.1
= 0.9I / A
Eiap
E / V
B
www.intechopen.com
Mathematical Modeling of Electrode Processes – Potential Dependent Transfer Coefficient in Electrochemical Kinetics 75
and isoalpha point appearance may be disfigured. Despite of the above, experimental confirmation of existence of isoalpha point is possible by the use of the set of electrodes with slightly different electronic properties.
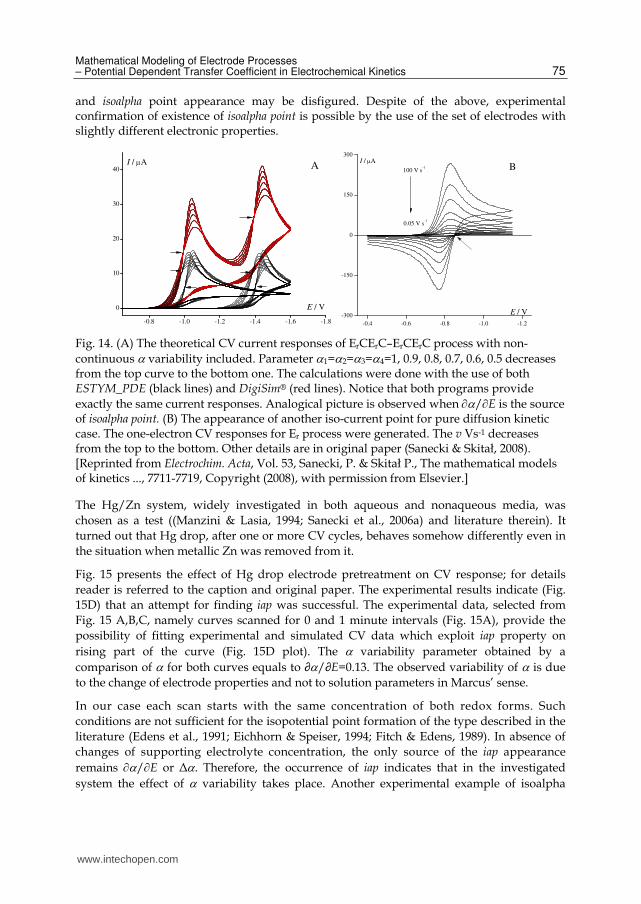
Fig. 14. (A) The theoretical CV current responses of ErCErC–ErCErC process with non-
continuous variability included. Parameter 1=2=3=4=1, 0.9, 0.8, 0.7, 0.6, 0.5 decreases from the top curve to the bottom one. The calculations were done with the use of both ESTYM_PDE (black lines) and DigiSim® (red lines). Notice that both programs provide
exactly the same current responses. Analogical picture is observed when /E is the source of isoalpha point. (B) The appearance of another iso-current point for pure diffusion kinetic case. The one-electron CV responses for Er process were generated. The v Vs-1 decreases from the top to the bottom. Other details are in original paper (Sanecki & Skitał, 2008). [Reprinted from Electrochim. Acta, Vol. 53, Sanecki, P. & Skitał P., The mathematical models of kinetics ..., 7711-7719, Copyright (2008), with permission from Elsevier.]
The Hg/Zn system, widely investigated in both aqueous and nonaqueous media, was
chosen as a test ((Manzini & Lasia, 1994; Sanecki et al., 2006a) and literature therein). It
turned out that Hg drop, after one or more CV cycles, behaves somehow differently even in
the situation when metallic Zn was removed from it.
Fig. 15 presents the effect of Hg drop electrode pretreatment on CV response; for details
reader is referred to the caption and original paper. The experimental results indicate (Fig.
15D) that an attempt for finding iap was successful. The experimental data, selected from
Fig. 15 A,B,C, namely curves scanned for 0 and 1 minute intervals (Fig. 15A), provide the
possibility of fitting experimental and simulated CV data which exploit iap property on
rising part of the curve (Fig. 15D plot). The variability parameter obtained by a
comparison of for both curves equals to ∂/∂E=0.13. The observed variability of is due
to the change of electrode properties and not to solution parameters in Marcus’ sense.
In our case each scan starts with the same concentration of both redox forms. Such
conditions are not sufficient for the isopotential point formation of the type described in the
literature (Edens et al., 1991; Eichhorn & Speiser, 1994; Fitch & Edens, 1989). In absence of
changes of supporting electrolyte concentration, the only source of the iap appearance
remains /E or Δ. Therefore, the occurrence of iap indicates that in the investigated
system the effect of variability takes place. Another experimental example of isoalpha
-0.8 -1.0 -1.2 -1.4 -1.6 -1.8
0
10
20
30
40I / A
E / V
A
-0.4 -0.6 -0.8 -1.0 -1.2
-300
-150
0
150
300
0.05 V s-1
I / A
E / V
100 V s-1 B
www.intechopen.com
Recent Trend in Electrochemical Science and Technology 76
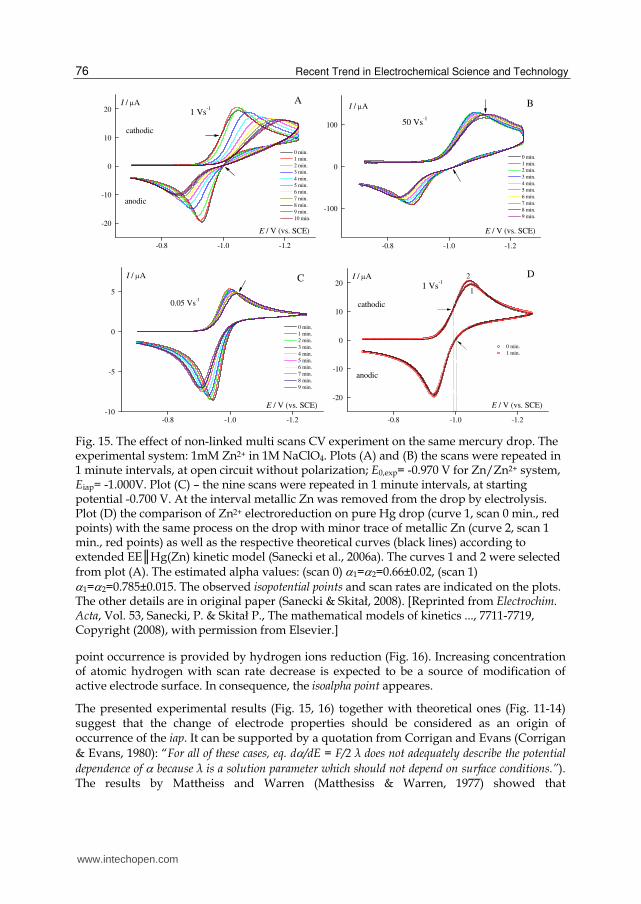
Fig. 15. The effect of non-linked multi scans CV experiment on the same mercury drop. The experimental system: 1mM Zn2+ in 1M NaClO4. Plots (A) and (B) the scans were repeated in 1 minute intervals, at open circuit without polarization; E0,exp= -0.970 V for Zn/Zn2+ system, Eiap= -1.000V. Plot (C) – the nine scans were repeated in 1 minute intervals, at starting potential -0.700 V. At the interval metallic Zn was removed from the drop by electrolysis. Plot (D) the comparison of Zn2+ electroreduction on pure Hg drop (curve 1, scan 0 min., red points) with the same process on the drop with minor trace of metallic Zn (curve 2, scan 1 min., red points) as well as the respective theoretical curves (black lines) according to extended EE║Hg(Zn) kinetic model (Sanecki et al., 2006a). The curves 1 and 2 were selected from plot (A). The estimated alpha values: (scan 0) 1=2=0.66±0.02, (scan 1) 1=2=0.785±0.015. The observed isopotential points and scan rates are indicated on the plots. The other details are in original paper (Sanecki & Skitał, 2008). [Reprinted from Electrochim. Acta, Vol. 53, Sanecki, P. & Skitał P., The mathematical models of kinetics ..., 7711-7719, Copyright (2008), with permission from Elsevier.]
point occurrence is provided by hydrogen ions reduction (Fig. 16). Increasing concentration of atomic hydrogen with scan rate decrease is expected to be a source of modification of active electrode surface. In consequence, the isoalpha point appeares.
The presented experimental results (Fig. 15, 16) together with theoretical ones (Fig. 11-14) suggest that the change of electrode properties should be considered as an origin of occurrence of the iap. It can be supported by a quotation from Corrigan and Evans (Corrigan
& Evans, 1980): “For all of these cases, eq. d/dE = F/2 λ does not adequately describe the potential
dependence of because λ is a solution parameter which should not depend on surface conditions.”). The results by Mattheiss and Warren (Matthesiss & Warren, 1977) showed that
-0.8 -1.0 -1.2
-20
-10
0
10
20
0 min.
1 min.
2 min.
3 min.
4 min.
5 min.
6 min.
7 min.
8 min.
9 min.
10 min.
E / V (vs. SCE)
I / A
1 Vs-1
cathodic
anodic
A
-0.8 -1.0 -1.2
-100
0
100
0 min.
1 min.
2 min.
3 min.
4 min.
5 min.
6 min.
7 min.
8 min.
9 min.
E / V (vs. SCE)
I / A
50 Vs-1
B
-0.8 -1.0 -1.2-10
-5
0
5
0 min.
1 min.
2 min.
3 min.
4 min.
5 min.
6 min.
7 min.
8 min.
9 min.
E / V (vs. SCE)
I / A
0.05 Vs-1
C
-0.8 -1.0 -1.2
-20
-10
0
10
20
0 min.
1 min.
E / V (vs. SCE)
I / A
1 Vs-1
cathodic
anodic
D
1
2
www.intechopen.com

Mathematical Modeling of Electrode Processes – Potential Dependent Transfer Coefficient in Electrochemical Kinetics 77
anymicroscopic inhomogeneity may significantly affect the Fermi level of electrons and, therefore, the kinetics of electrode process. The similar effect of the change of electrode properties caused by the electrodeposition process is well recognized for solid electrodes (Greef et al., 1985; Sanecki et al., 2006a; Sawyer et al., 1995).
Fig. 16. The normalized complete CV responses Iv–0.5 vs. potential E for hydrogen ions –reduction in 0.1M HCl solution. Electrode system: GCE/100 monomolecular Pd layers. The isopotential crossing point is indicated with the arrow (experimental data from ref. (Skitał et al., 2010)). Note the almost vertical position of rising part of CV curves which suggests high
increasing of values. Modification of active electrode surface can be explained by an increasing concentration of atomic hydrogen with scan rate decrease. [Reprinted from Electrochim. Acta, Vol. 55, Skitał P. & Sanecki P., The mathematical model of the stripping voltammetry ..., 5604–5609, Copyright (2010), with permission from Elsevier.]
Extended and still growing theory and application of solid electrodes (Horrocks et al., 1994;
Kuznetsov & Ulstrup, 1999; Levich, 1966; Wantz et al., 2005) prove that presented results can
be useful as an element of theory and practice concerning advanced solid electrodes and
thin films dominating in both theoretical and applied electrochemistry (Swain, 2004).
We expect that another experimental isoalpha points, analogous to described above, will be
found by other investigators.
10. Conclusions
1. Acquisition of rigorous mathematical model of considered mechanism comprising elementary kinetic parameters of electrochemical and chemical steps is fundamental for any discussion of quantitative type. MPE method with a proper mathematical model of the considered mechanism, applied to a series of electrochemical responses, is the simple, clear and rigorous way to determine the values of kinetic parameters with their confidence intervals. Additional error space for all estimated kinetic parameters, characteristic for considered mechanism like a fingerprint, can be easily determined basing on obtained theoretical responses. Every mechanism together with its mathematical model can generate electrochemical theoretical responses and its own error space, independently of error space obtained from experimental responses.
0.00 -0.25 -0.50
2
0
-2
-4 0.001 V/s
0.002 V/s
0.005 V/s
0.01 V/s
0.02 V/s
0.05 V/s
0.1 V/s
0.2 V/s
0.5 V/s
E / V (vs. SCE)
I/v0.5
www.intechopen.com

Recent Trend in Electrochemical Science and Technology 78
2. The common problems with extracting of kinetic parameters basing on selected characteristic points of complex electrochemical responses like half peak method or processed responses (e.g. convolution method) can be avoided by estimation of kinetic parameters on the whole original responses. The actual numerical possibilities and availability of respective software makes it possible to solve practically each of met in practice mechanisms by every researcher. The presented and quoted successful analysis of complex, multi-electron electrode processes with chemical step(s) provides the respective examples.
3. MPE method makes it possible to judge controversial or confused cases of mechanisms. A good example is here a stepwise/concerted mechanism. A uniform approach to understanding of the stepwise/concerted systems was confirmed by respective modeling for ECE mechanism where fluent passage from stepwise to concerted mechanism has been obtained. The only difference between them is the value of kf.
4. The mathematical modeling of electrode processes linked with experimental results may become an inspiration for new results and deeper understanding of the nature of electrochemical processes and its description. A good example is here an including of alpha variability into kinetic models and discovery of isoalpha points.
5. The occurrence of isoalpha point indicates that, under constant composition of the
solution, in investigated system α/dE or Δα type variability takes place. The origin of experimentally found isoalpha point can be explained by the change of electrode surface conditions.
11. Acknowledgment
The authors are grateful to professor Christian Amatore for valuable explanations,
discussions and cooperation.
12. Definitions, abbreviations and symbols
A mechanism can be defined as an system of chemical and electrochemical elementary steps
with a set of respective elementary kinetic parameters.
A model is a mathematical description of the considered mechanism or system. Both the
mechanism (system) and the model provide an electrochemical response, experimental and
theoretical, respectively.
The mathematical model as well as respective electrochemical current or concentration
response is a function of multiple variables. Among them there are system variables as
electrochemical and chemical rate constants, equilibrium constants, transfer coefficients,
standard potentials, etc. as well as variables of experimental type as scan rate, starting
potential, concentration, temperature.
AN – acetonitryle 1,3-BDF – 1,3-benzenedisulfonyl difluoride BSF – benzenesulfonyl fluoride CV – cyclic voltammetry DMF – dimethylformamide E0,i –standard potential of step i (V)
www.intechopen.com

Mathematical Modeling of Electrode Processes – Potential Dependent Transfer Coefficient in Electrochemical Kinetics 79
Eiap – potential in the isoalpha point (V) Ep – peak potential (V)
Estart – the value of potential where variability starts
ETC (or ) – elementary transfer coefficient GCE – glassy carbon electrode Iiap – current in the isoalpha point (A) iap – isoalpha point k – electrochemical rate constant for one electron process (cm s–1) ki (i=1,2,3,...) – electrochemical rate constant for a step of multi electron process (cm s–1) kf – chemical first order rate constant (s–1) kf1, kf2 – chemical first order rate constant of multi stage process (s–1) MPE – multi-parameter estimation PDE – partial differential equation(s) ESTYM_PDE - program for solving the models expressed by PDE and estimating their parameters r; irr (in subscript) – reversible; irreversible Ru – uncompensated resistance between the working and reference electrode TBAP – tetrabutylammonium perchlorate TEAP – tetraethylammonium perchlorate TSF – p-toluenesulfonyl fluoride v – scan rate – transfer coefficient of cathodic process (in electrode kinetics we use elementary kinetic parameters relating to, or describing the single step of kinetic sequence (k1,
k2, , 1, 2) as well as apparent (general) kinetic parameters i.e. relating to or
describing the complex kinetic course or mechanism as a whole (e.g. kapp, app)) – transfer coefficient of anodic process start – the value of to start with variability B , B – Brnsted acid-base catalysis coefficients λ – solvent reorganisation factor in Marcus’ theory
13. References
Albery, W. J. (1975). Electrode Kinetics, Clarendon Press, ISBN 0-19-855433-8, Oxford, pp. 100-
101.
Amatore, C. & Saveant, J. M. (1977). ECE and disproportionation: Part V. Stationary state
general solution application to linear sweep voltammetry. J. Electroanal. Chem., Vol.
85, pp. 27-46, ISSN: 0022-0728.
Andrieux, C. P., Blocman, C., Dumas-Bouchiat, J.-M. & Savéant J. M. (1979). Heterogeneous
and homogeneous electron transfers to aromatic halides. An electrochemical redox
catalysis study in the halobenzene and halopyridine series. J. Am. Chem. Soc., Vol.
101, pp. 3431-3441, ISSN: 0002-7863.
Andrieux, C. P., Le Gorande, A. & Savéant, J. M., (1992). Electron transfer and bond
breaking. Examples of passage from a sequential to a concerted mechanism in the
electrochemical reductive cleavage of arylmethyl halides. J. Am. Chem. Soc., Vol.
114, pp. 6892-6904, ISSN: 0002-7863.
www.intechopen.com

Recent Trend in Electrochemical Science and Technology 80
Andrieux, C. P., Differding, E., Robert, M. & Savéant, J.M. (1993). Controlling factors of
stepwise versus concerted reductive cleavages. Illustrative examples in the
electrochemical reductive breaking of nitrogen-halogen bonds in aromatic N-
halosultams. J. Am. Chem. Soc., Vol. 115, pp. 6592-6599, ISSN: 0002-7863.
Andrieux, C. P., Robert, M., Saeva, D. & Savéant, J. M., (1994). Passage from Concerted to
Stepwise Dissociative Electron Transfer as a Function of the Molecular Structure
and of the Energy of the Incoming Electron. Electrochemical Reduction of
Aryldialkyl Sulfonium Cations. J. Am. Chem. Soc., Vol. 116, pp. 7864-7871, ISSN:
0002-7863.
Andrieux, C. P., Savéant, J.-M., Tallec, A., Tardivel, R. & Tardy, C. (1996). Solvent
Reorganization as a Governing Factor in the Kinetics of Intramolecular Dissociative
Electron Transfers. Cleavage of Anion Radicals of -Substituted Acetophenones. J.
Am. Chem. Soc., Vol. 118, pp. 9788-9789, ISSN: 0002-7863.
Andrieux, C. P., Savéant, J.-M., Tallec, A., Tardivel, R. & Tardy, C. (1997). Concerted and
Stepwise Dissociative Electron Transfers. Oxidability of the Leaving Group and
Strength of the Breaking Bond as Mechanism and Reactivity Governing Factors
Illustrated by the Electrochemical Reduction of -Substituted Acetophenones. J.
Am. Chem. Soc., Vol. 119, pp. 2420-2429, ISSN: 0002-7863.
Angell, D. H. & Dickinson, T. (1972). The kinetics of the ferrous/ferric and
ferro/ferricyanide reactions at platinum and gold electrodes: Part I. Kinetics at
bare-metal surfaces. J. Electroanal. Chem., Vol. 35. pp. 55-72, ISSN: 0022-0728.
Antonello, S. & Maran, F. (1997). Evidence for the Transition between Concerted and
Stepwise Heterogeneous Electron Transfer−Bond Fragmentation Mechanisms. J.
Am. Chem. Soc., Vol. 119, pp. 12595-12600, ISSN: 0002-7863.
Antonello, S. & Maran, F. (1998). Dependence of Intramolecular Dissociative Electron
Transfer Rates on Driving Force in Donor−Spacer−Acceptor Systems. J. Am. Chem.
Soc., Vol. 120, pp. 5713-5722, ISSN: 0002-7863.
Antonello, S. & Maran, F. (1999). The Role and Relevance of the Transfer Coefficient in the
Study of Dissociative Electron Transfers: Concepts and Examples from the
Electroreduction of Perbenzoates. J. Am. Chem. Soc., Vol. 121, pp. 9668-9676, ISSN:
0002-7863.
Antonello, S., Formaggio, F., Moretto, A., Toniolo, C. & Maran, F. (2001). Intramolecular,
Intermolecular, and Heterogeneous Nonadiabatic Dissociative Electron Transfer to
Peresters. J. Am. Chem. Soc., Vol. 123, pp. 9577-9584, ISSN: 0002-7863.
Antonello, S., Benassi, R., Gavioli, G., Taddei, F. & Maran, F. (2002a). Theoretical and
Electrochemical Analysis of Dissociative Electron Transfers Proceeding through
Formation of Loose Radical Anion Species: Reduction of Symmetrical and
Unsymmetrical Disulfides. J. Am. Chem. Soc., Vol. 124, pp. 7529-7538, ISSN: 0002-
7863.
Antonello, S., Crisma, M., Formaggio, F., Moretto, A., Taddei, F., Toniolo, C. & Maran, F.
(2002b). Insights into the Free-Energy Dependence of Intramolecular Dissociative
Electron Transfers. J. Am. Chem. Soc., Vol. 124, pp. 11503-11513, ISSN: 0002-7863.
www.intechopen.com

Mathematical Modeling of Electrode Processes – Potential Dependent Transfer Coefficient in Electrochemical Kinetics 81
Arun, P. M. & Sangaranarayanan, M. V. (2004). Current function for irreversible electron
transfer processes in linear sweep voltammetry for the reactions obeying Marcus
kinetics. Chem. Phys. Lett., Vol. 387, pp. 317-321, ISSN: 0009-2614.
Bard, A. J. & Faulkner, L. R. (2001). Electrochemical Methods, Fundamentals and Applications,
Wiley, ISBN: 0-471-04372-9, New York.
Berlett, B. S., Levine, R. L. & Stadtman, E. R. (2000). Use of Isosbestic Point Wavelength
Shifts to Estimate the Fraction of a Precursor That Is Converted to a Given Product.
Anal. Biochem., Vol. 287, pp. 329-333, ISSN: 0003-2697.
Berninger, A. J., Whitley, R. D., Zhang, X. & Wang, N. H. L. (1991). A versatile model for
simulation of reaction and nonequilibrium dynamics in multicomponent fixed-bed
adsorption processes. Comput. Chem. Eng., Vol. 15, pp. 749-768, ISSN: 0098-1354.
Berzins, T. & Delahay, P. (1953). Theory of Irreversible Polarographic Waves—Case of Two
Consecutive Electrochemical Reactions. J. Am. Chem. Soc., Vol. 75, pp. 5716-5720,
ISSN: 0002-7863.
Bieniasz, L. K. (1997). ELSIM—a problem-solving environment for electrochemical kinetic
simulations. Version 3.0-solution of governing equations associated with interfacial
species, independent of spatial coordinates or in one-dimensional space geometry.
Comput. Chem., Vol. 21, p. 1-12, ISSN: 0097-8485.
Bieniasz, L. K. & Speiser, B. (1998a). Use of sensitivity analysis methods in the modelling of
electrochemical transients Part 1. Gaining more insight into the behaviour of kinetic
models. J. Electroanal. Chem., Vol. 441, pp. 271-285, ISSN: 0022-0728.
Bieniasz, L. K. & Speiser, B. (1998b). Use of sensitivity analysis methods in the modelling of
electrochemical transients: Part 3. Statistical error/uncertainty propagation in
simulation and in nonlinear least-squares parameter estimation. J. Electroanal.
Chem., Vol. 458, pp. 209-229, ISSN: 0022-0728.
Bieniasz, L. K. & Britz, D. (2004). Recent Developments in Digital Simulation of
Electroanalytical Experiments. Polish J. Chem., Vol. 78, pp. 1195-1219, ISSN 0137-
5083.
Bieniasz, L. K. & Rabitz, H. (2006). Extraction of Parameters and Their Error Distributions
from Cyclic Voltammograms Using Bootstrap Resampling Enhanced by Solution
Maps: Computational Study. Anal. Chem., Vol. 78, pp. 8430-8437, ISSN 0003-2700.
Bindra, P., Brown, A. P., Fleischmann, M. & Pletcher, D. (1975). The determination of the
kinetics of very fast electrode reactions by means of a quasi-steady state method:
The mercurous ion/mercury system Part II: Experimental results. J. Electroanal.
Chem., Vol. 58, pp. 39-50, ISSN: 0022-0728.
Bockris J. O’M. & Reddy A. K. N. (1970). Modern electrochemistry: An introduction to an
interdisciplinary area, Vol. 2, Macdonald, British SBN: 356 03262 0, London.
Bond, A. M. & Mahon, P. J. (1997). Linear and non-linear analysis using the Oldham–Zoski
steady-state equation for determining heterogeneous electrode kinetics at
microdisk electrodes and digital simulation of the microdisk geometry with the fast
quasi-explicit finite difference method. J. Electroanal. Chem., Vol. 439, pp. 37-53,
ISSN: 0022-0728.
Bott, A. W., Feldberg, S. W. & Rudolph, M. (1996). Fitting Experimental Cyclic Voltammetry
Data with Theoretical Simulations Using DigiSim® 2.1. Curr. Seps., Vol. 15, pp. 67-
71, ISSN: 0891-0006.
www.intechopen.com
Recent Trend in Electrochemical Science and Technology 82
Bott, A. W. (2000). Simulation of Cyclic Voltammetry Using Finite Difference Methods. Curr.
Seps., Vol. 19, pp. 45-48, ISSN: 0891-0006.
Brenet J. P., Traore K., (1971). Transfer Coeficients in Electrochemical Kinetics, Akademic Press,
ISBN: 0121309606, London and New York.
Britz, D. (2005). Digital Simulation in Electrochemistry, Springer, ISBN: 3-540-23979-0, Berlin.
Brown, P. N., Hindmarsh, A. C. & Byrne, G. D. (n.d.). Variable Coefficient Ordinary Differential
Equation Solver, procedure available on http://www.netlib.org.
Caldwell, R. A. & Hacobian, S. (1968a). Polarographic and nuclear quadrupole resonance
studies of some organic iodo compounds. I. Correlation of nuclear quadrupole
resonance frequency and polarographic half-step potentia. Austr. J. Chem., Vol. 21,
pp. 1-8, ISSN: 0004-9425.
Caldwell, R. A. & Hacobian, S. (1968b). Polarographic and nuclear quadrupole resonance
studies of some organic iodo compounds. II. The dependence of the half-step
potential on the ionic character of the carbon-iodine bond. Austr. J. Chem., Vol. 21,
pp. 1403-1413, ISSN: 0004-9425.
Chidsey, C. E. D. (1991). Free Energy and Temperature Dependence of Electron Transfer at
the Metal-Electrolyte Interface. Science, Vol. 251, pp. 919-922, ISSN: 0036-8075.
Colichman, E. L. & Kung Liu, S. (1954). Effect of Structure on the Polarographic Reduction of
Iodo Compounds. J. Am. Chem. Soc., Vol. 76, pp. 913-915, ISSN: 0002-7863.
Corrigan, D. A. & Evans, D. H. (1980). Cyclic voltammetric study of tert-nitrobutane
reduction in acetonitrile at mercury and platinum electrodes: Observation of a
potential dependent electrochemical transfer coefficient and the influence of the
electrolyte cation on the rate constant. J. Electroanal. Chem., Vol. 106, pp. 287-304,
ISSN: 0022-0728.
Costentin, C., Donati, L. & Robert, M. (2009). Passage from stepwise to concerted
dissociative electron transfer through modulation of electronic states coupling.
Chemistry, Vol. 15, pp. 785-792, ISSN: 1521-3765.
Daasbjerg, K., Jensen, H., Benassi, R., Taddei, F., Antonello, S., Gennaro, A.& Maran, F.
(1999). Evidence for Large Inner Reorganization Energies in the Reduction of Diaryl
Disulfides: Toward a Mechanistic Link between Concerted and Stepwise
Dissociative Electron Transfers? J. Am. Chem. Soc., Vol. 121, pp. 1750-1751, ISSN:
0002-7863.
Delahay, P. (1953). Theory of Irreversible Waves in Oscillographic Polarography. J. Am.
Chem. Soc., Vol. 75, pp. 1190-1196, ISSN: 0002-7863.
Dogonadze, R. R. (1971). Theory of molecular electrode kinetic, In: Reactions of Molecules at
Electrodes, Hush, N. S. (Ed.), pp. 135-227, Wiley-Interscience, ISBN: 0-471-42490-0,
New York.
Edens, G. J., Fitch, A. & Lavy-Feder, A. (1991). Use of isopotential points to elucidate ion
exchange reaction mechanisms: Cr(bpy)33+ at montmorillonite clay-modified
electrodes. J. Electroanal. Chem., Vol. 307, pp. 139-154, ISSN: 0022-0728.
Eichhorn, E. & Speiser, B. (1994). Electrochemistry of oxygenation catalysts: Part 4. Solvent-
composition-dependent isopotential points in cyclic voltammograms of
Co(SALEN). J. Electroanal. Chem., Vol. 365, pp. 207-212, ISSN: 0022-0728.
www.intechopen.com

Mathematical Modeling of Electrode Processes – Potential Dependent Transfer Coefficient in Electrochemical Kinetics 83
Feldberg, S. W. (1969). Digital simulation: A general method for solving
electrochemicaldiffusion-kinetic problems. In: Electroanalytical Chemistry, Bard,
A.J., (Ed.), Vol. 3, p. 199-296, Marcel Dekker, ISBN: 0824710371, New York.
Finklea, H. O. (2001a). Theory of Coupled Electron-Proton Transfer with Potential-
Dependent Transfer Coefficients for Redox Couples Attached to Electrodes. J. Phys.
Chem. B, Vol. 105, pp. 8685-8693, ISSN: 1520-6106.
Finklea, H. O. (2001b). Consequences of a potential-dependent transfer coefficient in ac
voltammetry and in coupled electron–proton transfer for attached redox couples. J.
Electroanal. Chem., Vol. 495, pp. 79-86, ISSN: 0022-0728.
Finklea, H. O. & Haddox, R. M. (2001). Coupled electron/proton transfer of galvinol
attached to SAMs on gold electrodes. Phys. Chem. Chem. Phys., Vol. 3, pp. 3431-3436,
ISSN: 14639076.
Finklea, H. O., Yoon, K., Chamberlain, E., Allen, J. & Haddox, R. (2001). Effect of the Metal
on Electron Transfer across Self-Assembled Monolayers. J. Phys. Chem. B, Vol. 105,
pp. 3088-3092, ISSN: 1520-6106.
Fitch, A. & Edens, G. J. (1989). Isopotential points as a function of an allowed cross reaction.
J. Electroanal. Chem., Vol. 267, pp. 1-13, ISSN: 0022-0728.
Fletcher, R. (n.d.). A modified Marquardt sub-routine for nonlinear least squares, AERE-
R6799-Harwell.
Frost, A. A. & Schwemer, W. C. (1952). The Kinetics of Competitive Consecutive Second-
order Reactions: The Saponification of Ethyl Adipate and of Ethyl Succinate. J. Am.
Chem. Soc., Vol. 74, pp. 1268-1273, ISSN: 0002-7863.
Frost, A. A. & Pearson, R. G. (1961). Kinetics and Mechanism, J. Wiley & Sons, ISBN:
047128355X, New York.
Frumkin, A. N. (1932). Bemerkung zur Theorie der Wasserstoffüberspannung. Z. Phys.
Chem., Vol. A160, pp. 116-118, ISSN: 0942-9352.
Galus Z. (1994). Fundamentals of Electrochemical Analysis, Ellis Horwood, ISBN: 83-01-11255-7,
New York.
Gardini, L., Servida, A., Morbidelli, M. & Carra, S. (1985). Use of orthogonal collocation on
finite elements with moving boundaries for fixed bed catalytic reactor simulation.
Comput. Chem. Eng., Vol. 9, pp. 1-17, ISSN: 0098-1354.
Garreau, D., Savéant, J. M. & Tessier, D. (1979). Potential dependence of the electrochemical
transfer coefficient. An impedance study of the reduction of aromatic compounds.
J. Phys. Chem., Vol. 83, pp. 3003-3007, ISSN 0022-3654.
Gosser, D. K. J. (1993). Cyclic Voltammetry: Simulation and Analysis of Reaction Mechanisms,
VCH Publishers, Inc., ISBN: 1-56081-026-2, New York.
Greef, R., Peat, R., Peter, L. M., Pletcher, D. & Robinson, J. (1985). Instrumental Methods in Electrochemistry, Ellis Horwood Limited, ISBN: 0-85312-875-8, Chichester.
Haddox, R. M. & Finklea, H. O. (2003). Proton coupled electron transfer of galvinol in self-assembled monolayers. J. Electroanal. Chem., Vol. 550/551, pp. 351-358, ISSN: 0022-0728.
Horrocks, B. R., Mirkin, M. V. & Bard, A. J. (1994). Scanning Electrochemical Microscopy. 25. Application to Investigation of the Kinetics of Heterogeneous Electron Transfer at Semiconductor (WSe2 and Si) Electrodes. J. Phys. Chem., Vol. 98, pp. 9106-9114, ISSN: 0022-3654.
www.intechopen.com
Recent Trend in Electrochemical Science and Technology 84
Hush, N. S. (1957). Elektrodenreaktionen der Methylhalogenide. Z. Elektrochem., Vol. 61, pp. 734-738, ISSN: 2590-1977.
Hush, N. S. (1958). Adiabatic Rate Processes at Electrodes. I. Energy-Charge Relationships. J. Chem. Phys., Vol. 28, pp. 962-973, ISSN: 0021-9606.
Hussey, W. W. & Diefenderfer, A. J. (1967). Ortho-substituent effects in polarography. J. Am. Chem. Soc., Vol. 89, pp. 5359-5362, ISSN: 0002-7863.
IUAPAC (1997). Compendium of Chemical Technology. Jakobsen, S., Jensen, H., Pedersen, S. U. & Daasbjerg, K. (1999). Stepwise versus Concerted
Electron Transfer-Bond Fragmentation in the Reduction of Phenyl Triphenylmethyl Sulfides. J. Phys. Chem. A, Vol. 103, pp. 4141-4143, ISSN: 1089-5639.
Jaworski, J. S., Kacperczyk, A. & Kalinowski, M. K. (1992). Hammett reaction constants for irreversible electroreduction of iodobenzenes in non-aqueous solvents. J. Phys. Org. Chem., Vol. 5, pp. 119-122, ISSN: 1099-1395.
Jaworski, J. S. & Leszczyński, P. (1999). Solvent effect on kinetics of the chloride ion cleavage
from anion radicals of 4-chlorobenzophenone. J. Electroanal. Chem., Vol. 464, pp.
259-262, ISSN: 0022-0728.
Jäger, E.-G. & Rudolph, M. (1997). Cyclic voltammetric and impedance spectrometric
investigations on addition/elimination reactions of Lewis bases accompanying the
electrode reactions of a nickel chelate complex with a structural resemblance to the
coenzyme F430. J. Electroanal. Chem., Vol. 434, pp. 1-18, ISSN: 0022-0728.
Kaczmarski, K. (1996). Use of orthogonal collocation on finite elements with moving
boundaries in the simulation of non-linear multicomponent chromatography.
Influence of fluid velocity variation on retention time in LC and HPLC. Comput.
Chem. Eng., Vol. 20, pp. 49-64, ISSN: 0098-1354.
Kaczmarski, K., Mazzotti, M., Storti, G. & Morbidelli, M. (1997). Modeling fixed-bed
adsorption columns through orthogonal collocations on moving finite elements.
Comput. Chem. Eng., Vol. 21, pp. 641-660, ISSN: 0098-1354.
Kaczmarski, K., Antos, D., Sajonz, H., Sajonz, P. & Guiochon, G. (2001). Comparative
modeling of breakthrough curves of bovine serum albumin in anion-exchange
chromatography. J. Chromatogr A, Vol. 925, pp. 1-17, ISSN: 0021-9673.
Kaczmarski, K. (2007). Estimation of adsorption isotherm parameters with inverse method –
possible problems. J. Chromatogr. A, Vol. 1176, pp. 57-68, ISSN: 0021-9673.
Kim, H., Kaczmarski, K. & Guichon, G. (2005). Mass transfer kinetics on the heterogeneous
binding sites of molecularly imprinted polymers. Chem. Eng. Sci., Vol. 60, pp. 5425-
5444, ISSN: 0009-2509.
Kim, H., Kaczmarski, K. & Guichon, G. (2006a). Optical and photoluminescent properties of
sol-gel Al-doped ZnO thin films. Chem. Eng. Sci., Vol. 61, pp. 1118-1121, ISSN: 0009-
2509.
Kim, H., Kaczmarski, K. & Guichon, G. (2006b). Isotherm parameters and intraparticle mass
transfer kinetics on molecularly imprinted polymers in acetonitrile/buffer mobile
phases. Chem. Eng. Sci., Vol. 61, pp. 5249-5267, ISSN: 0009-2509.
Kuritsyn, L. V., Sokolov, L. B., Savinov, V. M. & Ivanov, A. V. (1974). Otnositelnaya
reaktsionnosposobnost aminogrupp i aromaticheskikh diaminov v reaktsii s
khlorangidridnoi gruppoi. Vysokomolekularnye Soedineniya, Vol. 16B, pp. 532-535,
UDK: 541.64:547.553.1/2.
www.intechopen.com

Mathematical Modeling of Electrode Processes – Potential Dependent Transfer Coefficient in Electrochemical Kinetics 85
Kuznetsov, A. M. & Ulstrup, J. (1999). Electron Transfer in Chemistry and Biology, J. Wiley &
Sons, ISBN: 0-471-96749-1, Chichester.
Lavagnini, I., Pastore, P. & Magno, F. (1989). Comparison of the simplex, marquardt, and
extended and iterated extended kalman filter procedures in the estimation of
parameters from voltammetric curves. Anal. Chim. Acta, Vol. 223, pp. 193-204, ISSN:
0003-2670.
Levich, V. G. (1966). Present state of the Theory of Oxidation-Reduction in Solution (Bulk
and Electrode Reactions). In: Advances in Electrochemistry and Electrochemical
Engineering, Delahay, P. & Tobias, C. (Eds.), Vol. 4, pp. 249-371, Interscience, ISBN:
047020575X, New York.
Ma, Z. & Guiochon, G. (1991). Application of orthogonal collocation on finite elements in the
simulation of non-linear chromatography. Comput. Chem. Eng., Vol. 15, pp. 415-426,
ISSN: 0098-1354.
Mairanovskii, S. G. (1969). O vliyanii strojenya organicheskogo depolarizatora na vielichinu
spiecificheskogo effekta pri izmyenyenii pripoly kationa inliffyeryentnogo
elyektrolita. Elektrokhimiya, Vol. 5, pp. 757-759, ISSN: 0424-8570.
Mairanovskii, S. G. & Rubinskaya, T. Ya. (1972). O spyetsifichyeskom vlivaniikatonov
tyetraalkilammoniva pri elyektrovosstanovlyenii organivhyeskikh
galoidproizvodnykh. Elektrokhimiya, Vol. 8, pp. 424-427, ISSN: 0424-8570.
Mairanovskii, S. G., Stradyn, J. P. & Bezuglyi, V. D. (1975). Polarografiya v organicheskoj
khimii, Izdatyelstvo Khimiya , UDK: 543:253:547, Leningrad.
Manzini, M. & Lasia, A. (1994). Kinetics of electroreduction of Zn2+ at mercury in
nonaqueous solutions. Can. J. Chem., Vol. 72, pp. 1691-1698, ISSN: 0008-4042.
Marcus, R. A. (1956). On the Theory of Oxidation-Reduction Reactions Involving Electron
Transfer. I. J. Chem. Phys., Vol. 24, pp. 966-979, ISSN: 0021-9606.
Marcus, R. A. (1960). Exchange reactions and electron transfer reactions including isotopic
exchange. Theory of oxidation-reduction reactions involving electron transfer. Part
4.—A statistical-mechanical basis for treating contributions from solvent, ligands,
and inert salt. Disc. Faraday Soc., Vol. 29, pp. 21-31, ISSN: 0014-7664.
Marcus, R. A. (1977). Theory and Applications of Electron Transfers at Electrodes and in
Solution, In: Special Topics in Electrochemistry, Rock, P. A. (Ed.), pp. 161-179,
Elsevier, ISBN: 0444416277, Amsterdam.
Marquardt, D. W. (1963). An Algorithm for Least-Squares Estimation of Nonlinear
Parameters. SIAM J. Appl. Math., Vol. 11, pp. 431-441, ISSN: 0036-1399.
Matsuda, H. & Ayabe, Y. Zur Theorie der Randles-Sevčikschen Kathodenstrahl-
Polarographie. (1955). Z. Elektrochem., Vol. 59, pp. 494-503, ISSN: 2590-1977.
Matsuda, K. & Tamamushi, R. (1979). Potential-dependent transfer coefficients of the
Zn(II)/Zn(Hg) electrode reaction in aqueous solutions. J. Electroanal. Chem., Vol.
100, pp. 831-839, ISSN: 0022-0728.
Matthesiss, L. F. & Warren, W. W. (1977). Band model for the electronic structure of
expanded liquid mercury. Phys. Rev. B, Vol. 16, pp. 624-638, ISSN: 1098-0121.
McDermott, M. T., Kneten, K. & McCreery, R. L. (1992). Anthraquinonedisulfonate
adsorption, electron-transfer kinetics, and capacitance on ordered graphite
electrodes: the important role of surface defects. J. Phys. Chem., Vol. 96, pp. 3124-
3130, ISSN 0022-3654.
www.intechopen.com

Recent Trend in Electrochemical Science and Technology 86
Miller, C. J. (1995). Heterogeneous Electron Transfer Kinetics at Metallic Electrodes. In:
Physical electrochemistry : principles, methods, and applications, Rubinstein, I. (Ed.), pp.
27-80, Marcel Dekker, ISBN: 0824794524, New York.
Nagy, Z., Leaf, G. K., Minkoff, M. & Land, R. H. (1988). Extension of dc transient techniques
to reactions with a potential dependent charge transfer coefficient. Electrochim. Acta,
Vol. 33. pp. 1589-1593, ISSN: 0013-4686.
Nahir, T. M., Clark, R. A. & Bowden, E. F. (1994). Linear-Sweep Voltammetry of Irreversible
Electron Transfer in Surface-Confined Species Using the Marcus Theory. Anal.
Chem., Vol. 66, pp. 2595-2598, ISSN: 0003-2700.
Nakajima, R., Tsuruta, M., Higuchi, M. & Yamamoto, K. (2004). Fine Control of the Release
and Encapsulation of Fe Ions in Dendrimers through Ferritin-like Redox Switching.
J. Am. Chem. Soc., Vol. 126, pp. 1630-1631, ISSN: 0002-7863.
Nicholson, R. S. & Shain, I. (1964). Theory of Stationary Electrode Polarography. Single Scan
and Cyclic Methods Applied to Reversible, Irreversible, and Kinetic Systems. Anal.
Chem., Vol. 36, pp. 706-723, ISSN: 0003-2700.
Nicholson, R. S. & Shain, I. (1965a). Theory of Stationary Electrode Polarography for a
Chemical Reaction Coupled Between Two Charge Transfers. Anal. Chem., Vol. 37,
pp. 178-190, ISSN: 0003-2700.
Nicholson, R. S. & Shain, I. (1965b). Experimental Verification of an ECE Mechanism for the
Reduction of p-Nitrosophenol, Using Stationary Electrode Polarography. Anal.
Chem., Vol. 37, pp. 190-195, ISSN: 0003-2700.
Najjar, F., André-Barrès, C., Baltas, M., Lacaze-Dufaure, C., Magri, D.C., Workentin, M.S., Tzédakis, T (2007). Electrochemical reduction of G3-factor endoperoxide and its methyl ether: evidence for a competition between concerted and stepwise dissociative electron transfer. Chemistry, Vol. 13, 1174-1179, ISSN: 1521-3765.
Parsons, R. & Passeron, E. (1966). The potential-dependence of the transfer coefficient in the cr(II)/cr(III) reaction. J. Electroanal. Chem., Vol. 12, pp. 524-529, ISSN: 0022-0728.
Pause, L., Robert, M. & Savéant, J. M. (1999). Can Single-Electron Transfer Break an Aromatic Carbon−Heteroatom Bond in One Step? A Novel Example of Transition between Stepwise and Concerted Mechanisms in the Reduction of Aromatic Iodides. J. Am. Chem. Soc., Vol. 121, pp. 7158-7159, ISSN: 0002-7863.
Pause, L., Robert, M. & Savéant, J. M. (2001). Stepwise and Concerted Pathways in Photoinduced and Thermal Electron-Transfer/Bond-Breaking Reactions. Experimental Illustration of Similarities and Contrasts. J. Am. Chem. Soc., Vol. 123, pp. 4886-4895, ISSN: 0002-7863.
Peters, D. G. (1991). Halogenated Organic Compounds. In: Organic Electrochemistry: An introduction and guide, Lund, H. & Baizer, M. M. (Ed.), chapter 8, pp. 362-395, Marcel Dekker, Inc., ISBN: 0-8247-8154-6, New York.
Pierce, D. T. & Geiger, W. E. (1992). Electrochemical kinetic discrimination of the single-electron-transfer events of a two-electron-transfer reaction: cyclic voltammetry of the reduction of the bis(hexamethylbenzene)ruthenium dication. J. Am. Chem. Soc., Vol. 114, pp. 6063-6073, ISSN: 0002-7863.
Rifi, M. R. & Covitz, F. H. (1974). Introduction to Organic Electrochemistry, Marcel Dekker, Inc.,
ISBN: 0824760638, New York.
www.intechopen.com
Mathematical Modeling of Electrode Processes – Potential Dependent Transfer Coefficient in Electrochemical Kinetics 87
Rusling, J. F. (1983). Determination of rate constrants of pseudo-first-order electrocatalytic
reactions from overlapped voltammetric data. Anal. Chem., Vol. 55, pp. 776-781,
ISSN: 0003-2700.
Ružić, I. (1970). Logarithmic analysis of two overlapping d.c. polarographic waves II.
Multistep electrode raction. J. Electroanal. Chem., Vol. 25, pp. 144-147, ISSN: 0022-
0728.
Ružić, I., (1974). On the theory of stepwise electrode processes. J. Electroanal. Chem., Vol. 52,
pp. 331-354, ISSN: 0022-0728.
Samec, Z. & Weber, J. (1973). The influence of chemisorbed sulphur on the kinetic
parameters of the reduction of Fe3+ ions on a platinum electrode on the basis of the
marcus theory of electron transfer. J. Electroanal. Chem., Vol. 44, pp. 229-238, ISSN:
0022-0728.
Sanecki, P. (1986). An interpretation of the electrochemical transfer coefficient as a reduction
constant. Electrochim. Acta, Vol. 31, pp. 1187-1191, ISSN: 0013-4686.
Sanecki, P. & Lechowicz, J. (1997). The Problem of Complex Curves in Normal Pulse
Polarography, Electroanalysis, Vol. 9, pp. 1409-1415, ISSN: 1521-4109.
Sanecki, P. & Kaczmarski, K. (1999). The Voltammetric Reduction of Some Benzene-sulfonyl
Fluorides, Simulation of its ECE Mechanism and Determination of the Potential
Variation of Charge Transfer Coefficient by Using the Compounds with Two
Reducible Groups. J. Electroanal. Chem., Vol. 471, pp. 14-25, ISSN: 0022-0728.
Erratum published in (2001). J. Electroanal. Chem., Vol. 497, pp. 178-179.
Sanecki, P. (2001). A numerical modelling of voltammetric reduction of substituted
iodobenzenes reaction series. A relationship between reductions in the consecutive-
mode multistep system and a multicomponent system. Determination of the
potential variation of the elementary charge transfer coefficient, Comput. Chem.,
Vol. 25, pp. 521-539, ISSN: 0097-8485.
Sanecki, P. & Skitał P. (2002a) The cyclic voltammetry simulation of a competition between
stepwise and concerted dissociative electron transfer. The modeling of alpha
apparent variability. The relationship between apparent and elementary kinetic
parameters, Comput. Chem., Vol. 26, pp. 297-311, ISSN: 0097-8485.
Sanecki, P. & Skitał P. (2002b). A comparison of the multistep consecutive reduction mode
with the multicomponent system reduction mode in cyclic voltammetry. Comput.
Chem., Vol. 26, pp. 333-340, ISSN: 0097-8485.
Sanecki, P., Amatore, C. & Skitał, P. (2003). The problem of the accuracy of electrochemical
kinetic parameters determination for the ECE reaction mechanism. J. Electroanal.
Chem., Vol. 546, pp. 109-121, ISSN: 0022-0728.
Sanecki, P., Skitał, P. & Kaczmarski, K. (2006a). An integrated two phases approach to Zn2+
ions electroreduction on Hg. Electroanalysis, Vol. 18, pp. 595-604, ISSN: 1521-4109.
Sanecki, P., Skitał, P. & Kaczmarski, K. (2006b). Numerical modeling of ECE-ECE and
parallel EE-EE mechanisms in cyclic voltammetry. Reduction of 1,4-
benzenedisulfonyl difluoride and 1,4-naphthalenedisulfonyl difluoride.
Electroanalysis, Vol. 18, pp. 981-991, ISSN: 1521-4109.
Sanecki, P. & Skitał, P. (2007a). The Application of EC, ECE and ECE-ECE Models with
Potential Dependent Transfer Coefficient to Selected Electrode Processes. J.
Electrochem. Soc., Vol. 154, pp. F152-F158, ISSN 0013-4651.
www.intechopen.com
Recent Trend in Electrochemical Science and Technology 88
Sanecki, P. & Skitał, P. (2007b). The electroreduction of alkyl iodides and polyiodides The
kinetic model of EC(C)E and ECE-EC(C)E mechanisms with included transfer
coefficient variability. Electrochim. Acta, Vol. 52, pp. 4675-4684, ISSN: 0013-4686.
Sanecki, P. & Skitał, P. (2008). The mathematical models of kinetics of the E, EC, ECE, ECEC,
ECE–ECE and ECEC–ECEC processes with potential-dependent transfer coefficient
as a rationale of isoalpha points. Electrochim. Acta, Vol. 53, pp. 7711-7719, ISSN:
0013-4686.
Sanecki, P., Skitał, P. & Kaczmarski, K. (2010). The mathematical models of the stripping
voltammetry metal deposition/dissolution process. Electrochim. Acta, Vol. 55, pp.
1598-1604, ISSN: 0013-4686.
Sawyer, D. T., Sobkowiak, A. & Roberts, J. L. (1995). Electrochemistry for Chemists, J. Wiley,
Inc., ISBN:0-471-59468-7 , New York.
Savéant, J. M. & Tessier, D. (1975). Convolution potential sweep voltammetry V.
Determination of charge transfer kinetics deviating from the Butler-Volmer
behaviour. J. Electroanal. Chem., Vol. 65, pp. 57-66, ISSN: 0022-0728.
Savéant, J. M. & Tessier, D. (1977). Potential dependence of the electrochemical transfer
coefficient. Reduction of some nitro compounds in aprotic media. J. Phys. Chem.,
Vol. 81. pp. 2192-2197, ISSN: 0022-3654.
Savéant, J. M. & Tessier, D. (1982). Variation of the electrochemical transfer coefficient with
potential. Faraday Discuss. Chem. Soc., Vol. 74, pp. 57-72, ISSN: 0301-7249.
Savéant, J. M. (1987). A simple model for the kinetics of dissociative electron transfer in
polar solvents. Application to the homogeneous and heterogeneous reduction of
alkyl halides. J. Am. Chem. Soc., Vol. 109, pp. 6788-6795, ISSN: 0002-7863.
Savéant, J. M. (1992). Dissociative electron transfer. New tests of the theory in the
electrochemical and homogeneous reduction of alkyl halides. J. Am. Chem. Soc., Vol.
114, pp. 10595-10602, ISSN: 0002-7863.
Savéant, J. M. (1993). Electron transfer, bond breaking, and bond formation. Acc. Chem. Res.,
Vol. 26, pp. 455-461, ISSN: 0001-4842.
Schwemer, W. C. & Frost, A. A. (1951). A Numerical Method for the Kinetic Analysis of Two
Consecutive Second Order Reactions. J. Am. Chem. Soc., Vol. 73, pp. 4541-4542,
ISSN: 0002-7863.
Scharbert, B. & Speiser, B. (1989). Chemical information from electroanalytical data. Part 1—
Determination of system parameters for quasi-reversible electron transfer reactions
from cyclic voltammetric test data and data for the reduction of cerium (IV)
bis(octaethylporphyrinate). J. Chemometr., Vol. 3, pp. 61-80, ISSN: 0886-9383.
Sease, J. W., Burton, F. G. & Nickol, S. L. (1968). Mechanism of electrolytic reduction of
carbon-halogen bond. II. A rho sigma study. J. Am. Chem. Soc., Vol. 90, pp. 2595-
2598, ISSN: 0002-7863.
Seber, G. A. F. & Wild, C. J. (1989). Nonlinear Regression, John Wiley & Sons, Inc, ISBN:
0471617601, New York.
Severin, M. G., Arévalo, M. C., Maran, F. & Vianello, E. (1993). Electron-transfer bond-
breaking processes: an example of nonlinear activation-driving force relationship in
the reductive cleavage of the carbon-sulfur bond. J. Phys. Chem., Vol. 97, pp. 150-
157, ISSN 0022-3654.
www.intechopen.com

Mathematical Modeling of Electrode Processes – Potential Dependent Transfer Coefficient in Electrochemical Kinetics 89
Skitał, P. M. & Sanecki, P. T. (2009). The ECE Process in Cyclic Voltammetry. The
Relationships Between Elementary and Apparent Kinetic Parameters Obtained by
Convolution Method. Polish Journal of Chemistry, Vol. 83, pp. 1127–1138, ISSN: 0137-
5083.
Skitał, P., Sanecki, P. & Kaczmarski, K. (2010). The mathematical model of the stripping
voltammetry hydrogen evolution/dissolution process on Pd layer. Electrochim.
Acta, Vol. 55, pp. 5604–5609, ISSN: 0013-4686.
Smalley, J. F., Feldberg, S. W., Chidsey, C. E. D., Linford, M. R., Newton, M. D. & Liu, Y.-P.
(1995). The Kinetics of Electron Transfer Through Ferrocene-Terminated
Alkanethiol Monolayers on Gold. J. Phys. Chem., Vol. 99, pp. 13141-13149, ISSN:
0022-3654.
Speiser, B. (1985). Multiparameter estimation: extraction of information from cyclic
voltammograms. Anal. Chem., Vol. 57, pp. 1390-1397, ISSN: 0003-2700.
Speiser, B. (1996a). Numerical simulation of electroanalytical experiments: recent advance in
methodology, In: Electroanalytical Chemistry, A Series of Advances, Bard, A. J. &
Rubinstein, I. (Eds.), Vol. 19, pp. 1-106, Marcel Dekker, ISBN: 082479379X, New
York.
Speiser, B. (1996b). Electron Transfer and Chemical Reactions—Stepwise or Concerted? On
the Competition between Nucleophilic Substitution and Electron Transfer. Angew.
Chem. Int. Ed. Engl., Vol. 35, pp. 2471-2474, 1521-3773.
Stackelberg, M. & Stracke, W. (1949). The polarographic behavior of unsaturated and
halogenated hydrocarbons. Z. Elektrochem., Vol. 53, pp. 118-125, ISSN: 2590-1977.
Swain, G. M. (2004). Electrically Conducting Diamond Thin Films: Advanced Electrode
Materials for Electrochemical Technologies. In: Electroanalytical Chemistry, A Series
of Advances, Bard, A. J. & Rubinstein, I. (Eds.), Vol. 22, pp. 182-278, Marcell Dekker,
Inc., ISBN: 0824747194 , New York.
Tender, L., Carter, M. T. & Murray, R. W. (1994). Cyclic Voltammetric Analysis of Ferrocene
Alkanethiol Monolayer Electrode Kinetics Based on Marcus Theory. Anal. Chem.,
Vol. 66, pp. 3173-3181, ISSN: 0003-2700.
Tyma, P. D. & Weaver, M. J. (1980). Further observations on the dependence of the
electrochemical transfer coefficient upon the electrode potential. J. Electroanal.
Chem., Vol. 111, pp. 195-210, ISSN: 0022-0728.
Wantz, F., Banks, C. E. & Compton, R. G. (2005). Edge Plane Pyrolytic Graphite Electrodes
for Stripping Voltammetry: a Comparison with Other Carbon Based Electrodes.
Electroanalysis, Vol. 17, pp. 655-661, ISSN: 1521-4109.
Weber, K. & Creager, S. E. (1994). Voltammetry of Redox-Active Groups Irreversibly
Adsorbed onto Electrodes. Treatment Using the Marcus Relation between Rate and
Overpotential. Anal. Chem., Vol. 66, pp. 3164-3172, ISSN: 0003-2700.
Workentin, M., Maran, F. & Wayner, D. D. M., (1995). Reduction of Di-tert-Butyl Peroxide:
Evidence for Nonadiabatic Dissociative Electron Transfer J. Am. Chem. Soc., Vol.
117, pp. 2120-2121, ISSN: 0002-7863.
Villadsen, J. & Michelsen, M. L. (1978). Solutions of Differential Equation Models by Polynomial
Approximation, Prentice-Hall, ISBN: 0138222053, New York.
www.intechopen.com

Recent Trend in Electrochemical Science and Technology 90
Yu, Q. & Wang, N. H. L. (1989). Computer simulations of the dynamics of multicomponent
ion exchange and adsorption in fixed beds—gradient-directed moving finite
element method. Comput. Chem. Eng., Vol. 13, pp. 915-926, ISSN: 0098-1354.
www.intechopen.com

Recent Trend in Electrochemical Science and TechnologyEdited by Dr. Ujjal Kumar Sur
ISBN 978-953-307-830-4Hard cover, 306 pagesPublisher InTechPublished online 27, January, 2012Published in print edition January, 2012
InTech EuropeUniversity Campus STeP Ri Slavka Krautzeka 83/A 51000 Rijeka, Croatia Phone: +385 (51) 770 447 Fax: +385 (51) 686 166www.intechopen.com
InTech ChinaUnit 405, Office Block, Hotel Equatorial Shanghai No.65, Yan An Road (West), Shanghai, 200040, China
Phone: +86-21-62489820 Fax: +86-21-62489821
This book titled "Recent Trend in Electrochemical Science and Technology" contains a selection of chaptersfocused on advanced methods used in the research area of electrochemical science and technologies;descriptions of electrochemical systems; processing of novel materials and mechanisms relevant for theiroperation. This book provides an overview on some of the recent development in electrochemical science andtechnology. Particular emphasis is given both to the theoretical and the experimental aspect of modernelectrochemistry. Since it was impossible to cover the rich diversity of electrochemical techniques andapplications in a single issue, the focus is on the recent trends and achievements related to electrochemicalscience and technology.
How to referenceIn order to correctly reference this scholarly work, feel free to copy and paste the following:
Przemysław T. Sanecki and Piotr M. Skitał (2012). Mathematical Modeling of Electrode Processes – PotentialDependent Transfer Coefficient in Electrochemical Kinetics, Recent Trend in Electrochemical Science andTechnology, Dr. Ujjal Kumar Sur (Ed.), ISBN: 978-953-307-830-4, InTech, Available from:http://www.intechopen.com/books/recent-trend-in-electrochemical-science-and-technology/mathematical-modeling-of-electrode-processes-potential-dependent-transfer-coefficient-in-electrochem