maternal consumption of dairy products during pregnancy and lactation, and the development of...
TRANSCRIPT
Maternal consumption of dairy products during pregnancyand lactation, and the development of cow’s milkantibodies in the offspring
MAIJALIISA ERKKOLA1,2, CARINA KRONBERG-KIPPILA2, ERKKI SAVILAHTI3,
MICHAEL G. KENWARD4, MARJA SALONEN3, JORMA ILONEN5, MIKAEL KNIP3,6,
HANS K. AKERBLOM3 & SUVI M. VIRTANEN1,2,6
1Tampere School of Public Health, University of Tampere, Tampere, Finland, 2Department of Epidemiology and Health
Promotion, Nutrition Unit, National Public Health Institute, Helsinki, Finland, 3Hospital for Children and Adolescents,
University of Helsinki, Helsinki, Finland, 4London School of Hygiene and Tropical Medicine, London, United Kingdom,5Institute of Microbiology and Pathology, University of Turku, Turku, Finland, and 6Department of Paediatrics and Research
Unit, Tampere University Hospital, Tampere, Finland
AbstractObjective: To assess whether the maternal consumption of milk and milk products affects development of cow’s milk (CM)antibodies in infants. Design: A randomized pilot trial using food frequency questionnaires (mothers) and food records(infants). Setting: Families with a newborn infant with increased HLA-DQB1-conferred risk of type 1 diabetes and at least onefirst-degree relative affected by type 1 diabetes from 16 hospitals in Finland between April 1995 and November 1997. Subjectsand intervention: Infants randomized to receive a hydrolysed formula when breast milk was not available during their first 6–8 mo (n=112). Of these, 13 dropped out by the age of 3 mo and two were excluded due to incomplete CM antibody data.Results: Maternal milk protein intake from cheese during pregnancy was inversely related to IgA-class antibody titres to beta-lactoglobulin (BLG) and casein (CAS) at 3 mo, and to IgA antibody titres to BLG at 6 mo. Maternal consumption of raw milkproducts during lactation was positively related to the development of IgA antibody titres to CAS at 6 mo, and inverselycorrelated to IgG antibody titres to bovine serum albumin (BSA) and IgA antibody titres to CAS at 2 y. Maternal cheeseconsumption was inversely related to the IgG antibody titres to CM formula and CAS and to the IgA antibody titres to CAS inearly infancy.
Conclusions: Few associations were established between maternal CM protein intake and CM protein antibody levels in theinfants. The milk and milk products taken by the mother differed in their impact on the emerging CM antibody response inthe offspring.
Key Words: Antigen, cow’s milk, immunoglobulin, infancy, pregnancy
Introduction
Cow’s milk (CM) represents the first foreign protein
source to which the overwhelming majority of infants
are exposed. CM is the sensitizing food that most
commonly induces both gastrointestinal and skin
manifestations [1]. CM protein has been proposed as a
potential initiating factor in the autoimmune process
leading to the destruction of pancreatic b cells and
further development of type 1 diabetes [reviewed in 2].
High levels of antibodies to CM proteins have been
associated with increased risk of type 1 diabetes
independently of early formula feeding [3,4].
During pregnancy the fetus is exposed to the
maternal diet via the placental transfer of nutrients.
There is also transfer of anti-idiotypic antibodies from
the mother to the fetus [5]. The placenta seems to
protect the fetus against the effect of maternal food
antigens, and specific sensitization has been demon-
strated only rarely in newborn infants [6,7]. IgG-
class CM antibodies are present in the umbilical
serum as IgG is actively transported from the maternal
Correspondence: Suvi M. Virtanen, National Public Health Institute, Department of Epidemiology and Health Promotion, Nutrition Unit, Mannerheimintie
166, FI-00300 Helsinki, Finland. Tel: +358 9 4744 8729/+358 50 327 9696 (mobile). Fax: +358 9 4744 8591. E-mail: [email protected]
(Received 20 June 2004; revised 17 December 2004; accepted 4 January 2005)
Acta Pædiatrica, 2005; 94: 696–704
ISSN 0803-5253 print/ISSN 1651-2227 online # 2005 Taylor & Francis Group Ltd
DOI: 10.1080/08035250510029523
circulation to the fetus, whereas IgA-class CM anti-
bodies are absent at birth [8]. The IgG-class CM
antibodies detected in the newborn infant are accord-
ingly probably transplacentally transferred, and a
conspicuous correlation has been observed between
the CM antibody titres in the maternal circulation and
those found in cord blood [6,9]. The initial exposure
to CM proteins always provokes an immune response
in the infant as a normal phenomenon. The earlier CM
formula is introduced, the stronger the subsequent
IgG response [10]. IgA CM antibodies increase more
slowly, and parallel in exclusively breastfed and CM
formula-fed infants. The IgG response starts to level off
during the first year of life, while the IgA response
decreases more slowly, and the latter may persist
throughout childhood.
Secretory IgA is the predominant immunoglobulin
(90%) in breast milk [11], while beta-lactoglobulin and
casein are major protein fractions [12]. The occurrence
of maternal dietary antigens in breast milk is well
documented [13]. Modifying maternal diet may
control the amount of food antigens in breast milk.
However, the findings on the relationship between the
concentrations of CM antigens in human milk and
maternal milk consumption conflict [e.g. 10 vs 14].
Similarly, inconsistent findings have been recorded on
the possible effect of the maternal intake of CM during
lactation on the humoral immune response to CM
antigens in the child [15,16]. There have been no
reports on maternal consumption of various different
milk products and their putative impact on the devel-
opment of specific CM protein antibodies in infancy.
The aim of the present study was to assess whether
maternal consumption of different milk products
during pregnancy and lactation affects the develop-
ment of CM antibodies in infants, and whether such
associations are independent of the child’s own expo-
sure to CM products, if they exist.
Subjects and methods
Study design
Families with a newborn infant and at least one
member (mother, father or sibling) affected by type 1
diabetes were invited to the TRIGR (the Trial to
Reduce IDDM in the Genetically at Risk) pilot trial
between April 1995 and November 1997 [17]. Of the
521 children recruited, 234 had HLA DQB1 geno-
type conferring increased risk for type 1 diabetes
[DQB1*02/*0302, *0302/x (xl*02, *0301 or *0602,
*0603) or 02/y (yl0302, *0301, or *0602/*0603)],
and these infants continued in the intervention study.
Immediately after birth, the infants were randomized
to receive, after exclusive breastfeeding in a doubled-
blinded manner, either the hydrolysed infant formula
(Nutramigen1, Mead Johnson, Evansville, IN, USA;
extensively hydrolysed casein-based formula) or a
whey-adapted cow’s milk (CM)-based formula (Mead
Johnson) as the first milk product introduced into the
infant’s diet. The control formula was mixed with 20%
Nutramigen1 to make the two study formulas similar
in taste and smell. The dietary intervention lasted at
least until the infant reached the age of 6 mo. If the
child had not received the study formula for at least
2 mo by the age of 6 mo, the intervention continued at
most up to the age of 8 mo. The families received both
oral and written advice on the use of study formula and
on the avoidance of cow’s milk and beef in the infant’s
diet during the intervention period. The formula codes
were opened when the youngest child randomized had
passed the intervention period. The ethical committees
of all the participating hospitals had approved the study
protocol.
Subjects
The study population of the TRIGR pilot study was
described in detail earlier [17]. Briefly, the families of
521 newborn infants received the invitation letter and
parents signed the informed consent to take part in the
study. Twenty-five of the 521 infants were excluded
because they met the exclusion criteria. In addition,
five families decided before randomization not to
participate in the study, 12 families could not join due
to a missing HLA sample or a missing study code, and
three families dropped out without providing a reason.
Accordingly, altogether 476 newborn infants received
the study code at birth and of them 471 were screened
for their HLA DQB1 alleles. Of those screened, 230
had HLA DQB1 genotype conferring increased risk
for type 1 diabetes, and the parents of these infants
were asked to continue in the intervention study with
their child.
The present study included only infants randomized
to receive hydrolysed infant formula (n=112). Of
these, 13 (12%) dropped out by the age of 3 mo. The
reasons for discontinuing the study were mostly family
related such as moving to a distant location. The other
reasons included difficulties in using the study formula,
diagnosis or suspicion of cow’s milk allergy, parents’
unwillingness to have their child pricked for blood
sampling, or their unwillingness to learn about the
genetic risk. Two families could not be contacted after
the birth of the infants, and one family had been invited
to the study by mistake. In the final sample there were
99 infants in the casein hydrolysate group at the age of
3 mo. Two infants were excluded from the analyses
because of incomplete CM antibody data. The final
number of 97 infants included in the present analysis
comprised those subjects for whom we had nutritional
data and the results from CM antibody analyses on at
least one occasion. The neonatal variables used in the
Maternal diet and CM antibodies in infants 697
present study were birth weight and duration of
gestation (Table I).
Dietary assessment
The diet of the offspring was assessed by means of a 2-d
food record at the age of 6 mo and by a 3-d food record
at the ages of 1 and 2 y. The families recorded devi-
ations from the advised diet and age at introduction
of new foods. Maternal diet was studied using a
pre-tested and validated food frequency questionnaire
[18]. The questionnaire focused on the diet of the
mother during the eighth month of pregnancy. If the
mother was breastfeeding when the child was 3 mo old,
her diet during the preceding month was studied using
the same food frequency questionnaire. Maternal diet
was not modified. The data from both diet records and
food frequency questionnaires were analysed using a
software program developed at the National Public
Health Institute [19].
The dietary variables used in the present study were
the duration of exclusive (no other foods than breast
milk) and total breastfeeding, age at introduction of
milk products (CM formulas, CM and other CM
products), CM protein intake of the child at the ages of
12 and 24 mo, and CM protein intake of the mother
during pregnancy and lactation. When measuring
CM protein intake of the mothers, we grouped
milk products according to the type of processing. In
the present study, two groups used were “raw milk
products” including regular milk, cream and ice
cream, and “cheese” including all hard cheeses. The
descriptive statistics of the dietary variables are shown
in Table I.
Laboratory analysis
Blood samples were obtained from the infants at
birth and at the ages of 3, 6, 9, 12, 18 and 24 mo. The
maternal blood samples were taken on average 2 d
after the delivery. Antibodies of IgA and IgG isotypes
to whole CM formula, beta-lactoglobulin (BLG),
bovine serum albumin (BSA) and alpha-casein (CAS)
were measured using modifications of the original
enzyme-linked immunosorbent assay (ELISA) tech-
niques as previously described [3,4,20]. Microtitre
plates (MaxiSorp1, Nunc A/S, Roskilde, Denmark)
were coated with one of the following antigens:
adapted liquid CM formula (Tutteli1, Valio Ltd,
Helsinki, Finland); BLG (L-0130, Sigma Pharma-
ceuticals, St Louis, MO, USA); BSA (2 mg/ml, grade
V, Sigma); and CAS (C 6780, Sigma). Wells were
blocked either with 0.5% sheep serum (for anti-CM
and BLG assays) or with 1% gelatin in PBS pH 7.4 (for
BSA and CAS assays). Serum samples were diluted
in the blocking buffers. Triplicate dilutions were used
for dilutions of standard serum; duplicate for the
assayed sera. Alkaline phosphatase-conjugated affinity-
purified rabbit F(ab’)2 anti-human IgG, IgA or IgM
antisera (Dako A/S, Glostrup, Denmark), and
p-nitrophenyl-phosphate substrate, 1 mg/ml in TRIS
buffer (Sigma Fast p-nitrophenyl Phosphate Tablet
sets N-2770, Sigma) were added. The reaction was
followed and stopped when the absorbance of the
highest standard was above 2 with 100 ml 1 M NaOH.
The endpoint measure of OD405 nm was obtained in
a semi-automatic multiwell photometer (Titertek
Multiscan1, Elflab Inc., Helsinki, Finland). The mean
value of two absorbencies for wells coated with block-
ing solution was subtracted from the mean value for the
two absorbencies in antigen-coated wells. Results were
subjected to point-to-point analysis in a computerized
photometer using twofold serial dilutions of a high titre
standard serum as reference. Sample dilutions must
Table I. Maternal and infant characteristics and dietary variables
among the 97 families who started the intervention arm of the second
TRIGR pilota.
Characteristica
Boys 56 (58%)
Birthweight, g 3681+576
Maternal age, y 30+5
Gestational age, wk 39+1.5
Duration of exclusive breastfeeding, mo 3 (0–6)
Duration of total breastfeeding, mo 8.3 (0.2–24)b
Age at introduction of study formula, mo 3 (0–8)c
Age at introduction of milk products, mo 8 (5.3–24)b
Infants with reported dietary non-compliance
during the intervention
21 (22%)
Child’s energy-adjustedd milk protein intake
at the age of 1 y, g/d
15.8+9.7e
Child’s energy-adjustedd milk protein intake
at the age of 2 y, g/d
20.0+7.1e
Pregnancy
Maternal energy-adjustedd protein intake from:
raw milk products, g/d 22.6+14.1f
cheese, g/d 17.3+10.1f
sour milk products, g/d 7.8+7.2f
Lactation
Maternal energy-adjustedd protein intake from:
raw milk products, g/d 21.8+13.9f
cheese, g/d 18.5+12.4f
sour milk products, g/d 6.6+6.1f
a Unless otherwise stated, values are the numbers of children, with
proportion given in parentheses. Plus–minus values are means+SD
and values with the range in parentheses are medians.b n=87.c n=81.d Adjustment for total energy intake was made using Willett’s [21]
residual method. Residuals are computed from regression models,
with total energy as the independent variable and food consumption
or nutrient intake as the dependent variable.e Child’s diet was assessed with a 3-d food record; n=93 at the age of
1 y and 77 at the age of 2 y. Milk protein intake from breast milk is
not included in the calculations.f Maternal diet was assessed with a food frequency questionnaire
during the eighth month of pregnancy and the third month of
lactation; n=94 in both.
698 M. Erkkola et al.
fall within the linear part of the standard curve, and
antibody levels were expressed as percentages of the
standard. Antibody titres of IgA isotype in umbilical
cord blood were not included in the statistical analyses
as IgA is not transported through the placenta to the
fetus during pregnancy, and the titres detected in a few
infants were considered to be due to laboratory
mistakes or contamination of the umbilical cord blood
sample with maternal blood.
Statistical analyses
Means and standard deviations for food consumption
and nutrient intake were calculated from the food
records and the questionnaires. In addition, protein
intake from different milk products during pregnancy
and lactation was calculated. To achieve a more
normal distribution, dietary variables and antibody
titres were log transformed. Adjustment for total
energy intake was performed using the residual method
of Willett [21]. Residuals were computed from
regression models, with total energy as the indepen-
dent variable and milk protein intake as the dependent
variable. Spearman correlation coefficients and
Wilcoxon signed ranks test were used to study asso-
ciations between maternal diet and maternal antibody
titres, and between antibody titres in children and
mothers. Partial correlation coefficients were calcu-
lated between energy-adjusted dietary variables and
CM antibody titres. In logistic regression analysis, the
antibody levels were used as dichotomized variables
(highest tertile versus others). The division into tertiles
was done based on the antibody levels in the children in
the casein hydrolysate group (n=97). In the 6 mo
analysis, the four children consuming CM products
according to food records were excluded. Wald statis-
tics were examined for each variable included in the
model [22]. Odds ratios (OR) and 95% confidence
intervals (95% CI) were used to estimate the associa-
tions of the dietary variables with the CM antibody
titres. Dietary intakes during pregnancy and during
lactation were highly correlated and were therefore not
used as explanatory variables in the same model.
Results
Milk protein intake
Energy-adjusted values for the maternal milk protein
intake are shown in Table I. The average intake of
total energy was 11.2 MJ (SD 3.1) during pregnancy
and 10.5 MJ (SD 2.6) during lactation. The average
intakes of various milk products were slightly higher
during pregnancy than lactation. Raw milk products
represented the dominant source of milk proteins in the
maternal diet. Milk protein intake was quite similar
during pregnancy and lactation. Spearman correlation
coefficients for energy-adjusted protein intake during
pregnancy and lactation were 0.56 ( p50.001) for all
milk products, 0.70 ( p50.001) for raw milk products
and 0.66 ( p50.001) for cheese. Milk protein intake
from raw milk products correlated inversely with milk
protein intake from cheese (r=70.25, p=0.017 and
r=–0.23, p=0.027 during pregnancy and lactation,
respectively).
As expected, the intake of milk protein increased
with age in the children (Table I). Of 97 families, 21
(22%) reported dietary non-compliance during the
intervention period. Antibody levels did not differ
among children for whom dietary deviations had been
made and the remaining children.
Antibodies to total CM, BLG, BSA and CAS
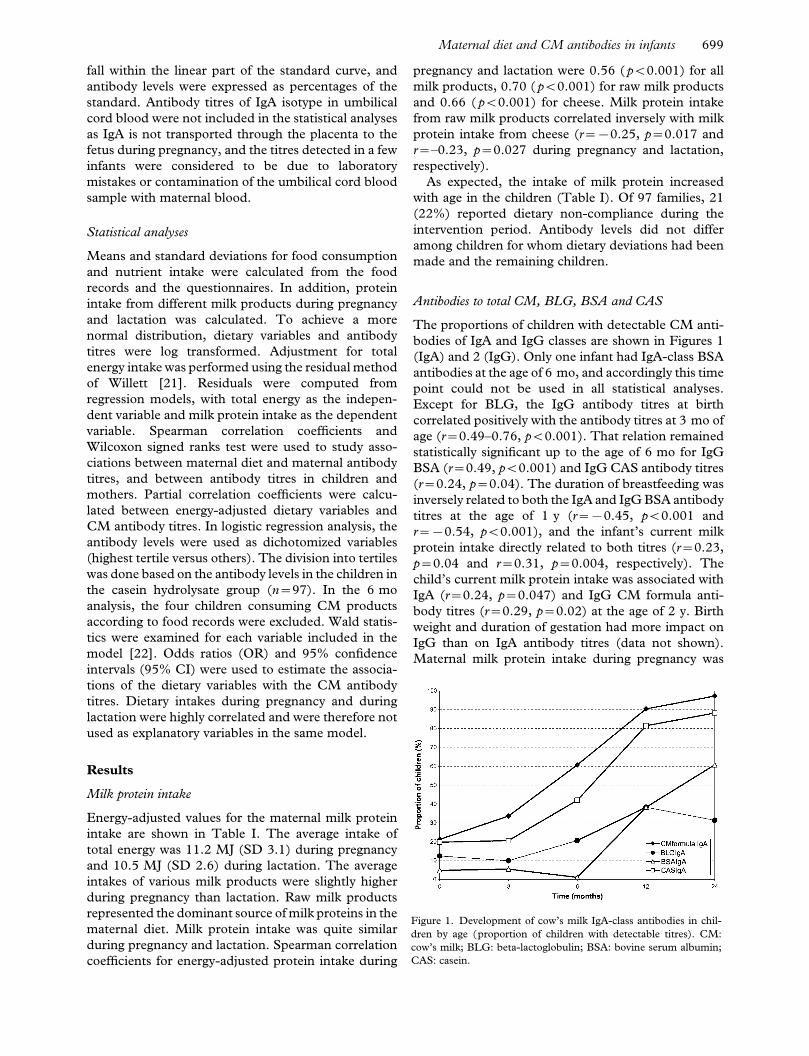
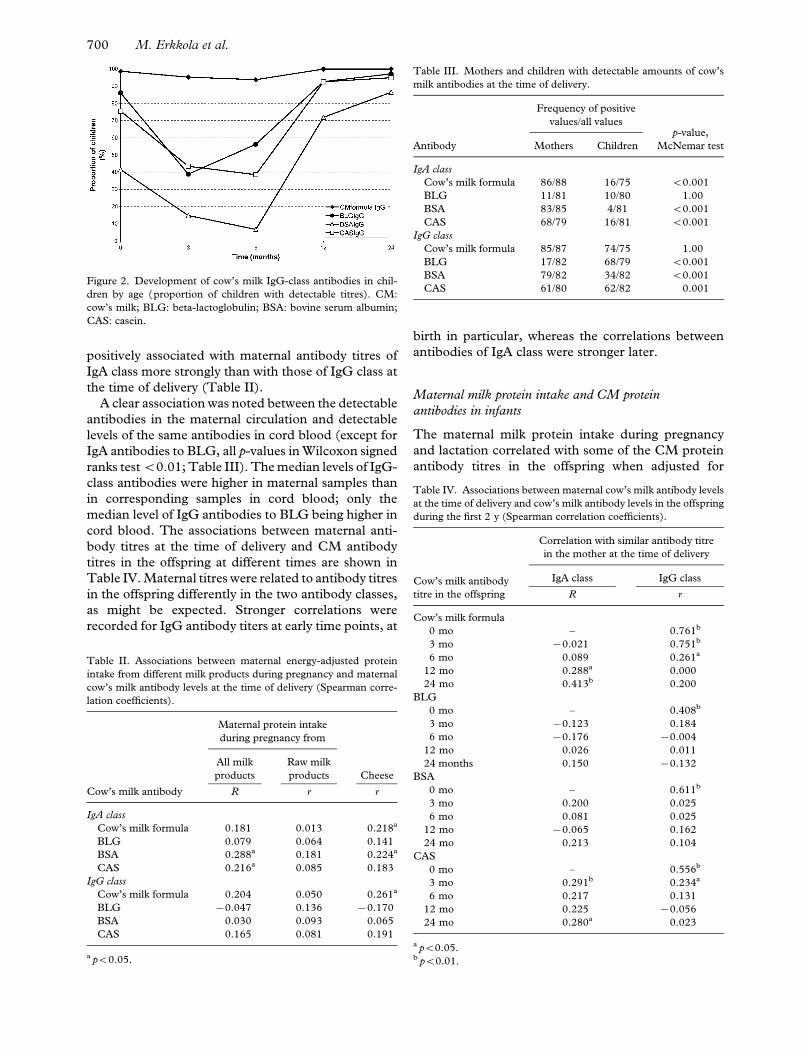
The proportions of children with detectable CM anti-
bodies of IgA and IgG classes are shown in Figures 1
(IgA) and 2 (IgG). Only one infant had IgA-class BSA
antibodies at the age of 6 mo, and accordingly this time
point could not be used in all statistical analyses.
Except for BLG, the IgG antibody titres at birth
correlated positively with the antibody titres at 3 mo of
age (r=0.49–0.76, p50.001). That relation remained
statistically significant up to the age of 6 mo for IgG
BSA (r=0.49, p50.001) and IgG CAS antibody titres
(r=0.24, p=0.04). The duration of breastfeeding was
inversely related to both the IgA and IgG BSA antibody
titres at the age of 1 y (r=70.45, p50.001 and
r=70.54, p50.001), and the infant’s current milk
protein intake directly related to both titres (r=0.23,
p=0.04 and r=0.31, p=0.004, respectively). The
child’s current milk protein intake was associated with
IgA (r=0.24, p=0.047) and IgG CM formula anti-
body titres (r=0.29, p=0.02) at the age of 2 y. Birth
weight and duration of gestation had more impact on
IgG than on IgA antibody titres (data not shown).
Maternal milk protein intake during pregnancy was
Figure 1. Development of cow’s milk IgA-class antibodies in chil-
dren by age (proportion of children with detectable titres). CM:
cow’s milk; BLG: beta-lactoglobulin; BSA: bovine serum albumin;
CAS: casein.
Maternal diet and CM antibodies in infants 699
positively associated with maternal antibody titres of
IgA class more strongly than with those of IgG class at
the time of delivery (Table II).
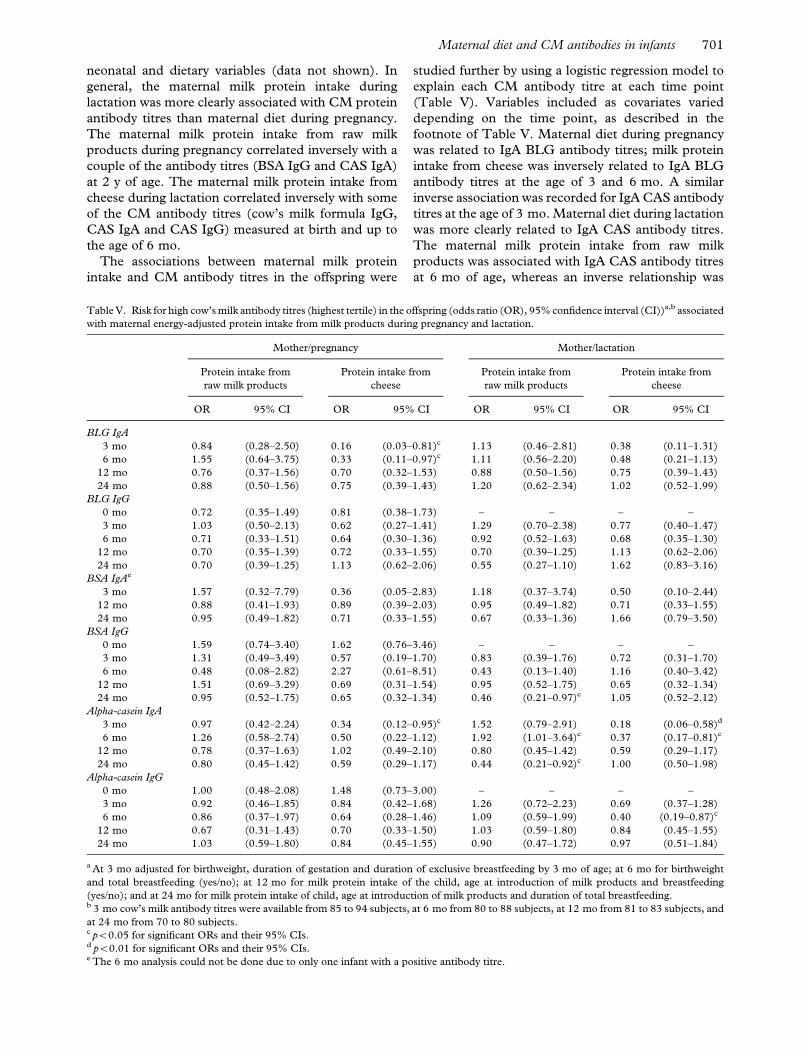
A clear association was noted between the detectable
antibodies in the maternal circulation and detectable
levels of the same antibodies in cord blood (except for
IgA antibodies to BLG, all p-values in Wilcoxon signed
ranks test50.01; Table III). The median levels of IgG-
class antibodies were higher in maternal samples than
in corresponding samples in cord blood; only the
median level of IgG antibodies to BLG being higher in
cord blood. The associations between maternal anti-
body titres at the time of delivery and CM antibody
titres in the offspring at different times are shown in
Table IV. Maternal titres were related to antibody titres
in the offspring differently in the two antibody classes,
as might be expected. Stronger correlations were
recorded for IgG antibody titers at early time points, at
birth in particular, whereas the correlations between
antibodies of IgA class were stronger later.
Maternal milk protein intake and CM protein
antibodies in infants
The maternal milk protein intake during pregnancy
and lactation correlated with some of the CM protein
antibody titres in the offspring when adjusted for
Figure 2. Development of cow’s milk IgG-class antibodies in chil-
dren by age (proportion of children with detectable titres). CM:
cow’s milk; BLG: beta-lactoglobulin; BSA: bovine serum albumin;
CAS: casein.
Table II. Associations between maternal energy-adjusted protein
intake from different milk products during pregnancy and maternal
cow’s milk antibody levels at the time of delivery (Spearman corre-
lation coefficients).
Cow’s milk antibody
Maternal protein intake
during pregnancy from
All milk
products
Raw milk
products Cheese
R r r
IgA class
Cow’s milk formula 0.181 0.013 0.218a
BLG 0.079 0.064 0.141
BSA 0.288a 0.181 0.224a
CAS 0.216a 0.085 0.183
IgG class
Cow’s milk formula 0.204 0.050 0.261a
BLG 70.047 0.136 70.170
BSA 0.030 0.093 0.065
CAS 0.165 0.081 0.191
a p50.05.
Table III. Mothers and children with detectable amounts of cow’s
milk antibodies at the time of delivery.
Antibody
Frequency of positive
values/all valuesp-value,
McNemar testMothers Children
IgA class
Cow’s milk formula 86/88 16/75 50.001
BLG 11/81 10/80 1.00
BSA 83/85 4/81 50.001
CAS 68/79 16/81 50.001
IgG class
Cow’s milk formula 85/87 74/75 1.00
BLG 17/82 68/79 50.001
BSA 79/82 34/82 50.001
CAS 61/80 62/82 0.001
Table IV. Associations between maternal cow’s milk antibody levels
at the time of delivery and cow’s milk antibody levels in the offspring
during the first 2 y (Spearman correlation coefficients).
Cow’s milk antibody
titre in the offspring
Correlation with similar antibody titre
in the mother at the time of delivery
IgA class IgG class
R r
Cow’s milk formula
0 mo – 0.761b
3 mo 70.021 0.751b
6 mo 0.089 0.261a
12 mo 0.288a 0.000
24 mo 0.413b 0.200
BLG
0 mo – 0.408b
3 mo 70.123 0.184
6 mo 70.176 70.004
12 mo 0.026 0.011
24 months 0.150 70.132
BSA
0 mo – 0.611b
3 mo 0.200 0.025
6 mo 0.081 0.025
12 mo 70.065 0.162
24 mo 0.213 0.104
CAS
0 mo – 0.556b
3 mo 0.291b 0.234a
6 mo 0.217 0.131
12 mo 0.225 70.056
24 mo 0.280a 0.023
a p50.05.b p50.01.
700 M. Erkkola et al.
neonatal and dietary variables (data not shown). In
general, the maternal milk protein intake during
lactation was more clearly associated with CM protein
antibody titres than maternal diet during pregnancy.
The maternal milk protein intake from raw milk
products during pregnancy correlated inversely with a
couple of the antibody titres (BSA IgG and CAS IgA)
at 2 y of age. The maternal milk protein intake from
cheese during lactation correlated inversely with some
of the CM antibody titres (cow’s milk formula IgG,
CAS IgA and CAS IgG) measured at birth and up to
the age of 6 mo.
The associations between maternal milk protein
intake and CM antibody titres in the offspring were
studied further by using a logistic regression model to
explain each CM antibody titre at each time point
(Table V). Variables included as covariates varied
depending on the time point, as described in the
footnote of Table V. Maternal diet during pregnancy
was related to IgA BLG antibody titres; milk protein
intake from cheese was inversely related to IgA BLG
antibody titres at the age of 3 and 6 mo. A similar
inverse association was recorded for IgA CAS antibody
titres at the age of 3 mo. Maternal diet during lactation
was more clearly related to IgA CAS antibody titres.
The maternal milk protein intake from raw milk
products was associated with IgA CAS antibody titres
at 6 mo of age, whereas an inverse relationship was
Table V. Risk for high cow’s milk antibody titres (highest tertile) in the offspring (odds ratio (OR), 95% confidence interval (CI))a,b associated
with maternal energy-adjusted protein intake from milk products during pregnancy and lactation.
Mother/pregnancy Mother/lactation
Protein intake from
raw milk products
Protein intake from
cheese
Protein intake from
raw milk products
Protein intake from
cheese
OR 95% CI OR 95% CI OR 95% CI OR 95% CI
BLG IgA
3 mo 0.84 (0.28–2.50) 0.16 (0.03–0.81)c 1.13 (0.46–2.81) 0.38 (0.11–1.31)
6 mo 1.55 (0.64–3.75) 0.33 (0.11–0.97)c 1.11 (0.56–2.20) 0.48 (0.21–1.13)
12 mo 0.76 (0.37–1.56) 0.70 (0.32–1.53) 0.88 (0.50–1.56) 0.75 (0.39–1.43)
24 mo 0.88 (0.50–1.56) 0.75 (0.39–1.43) 1.20 (0.62–2.34) 1.02 (0.52–1.99)
BLG IgG
0 mo 0.72 (0.35–1.49) 0.81 (0.38–1.73) – – – –
3 mo 1.03 (0.50–2.13) 0.62 (0.27–1.41) 1.29 (0.70–2.38) 0.77 (0.40–1.47)
6 mo 0.71 (0.33–1.51) 0.64 (0.30–1.36) 0.92 (0.52–1.63) 0.68 (0.35–1.30)
12 mo 0.70 (0.35–1.39) 0.72 (0.33–1.55) 0.70 (0.39–1.25) 1.13 (0.62–2.06)
24 mo 0.70 (0.39–1.25) 1.13 (0.62–2.06) 0.55 (0.27–1.10) 1.62 (0.83–3.16)
BSA IgAe
3 mo 1.57 (0.32–7.79) 0.36 (0.05–2.83) 1.18 (0.37–3.74) 0.50 (0.10–2.44)
12 mo 0.88 (0.41–1.93) 0.89 (0.39–2.03) 0.95 (0.49–1.82) 0.71 (0.33–1.55)
24 mo 0.95 (0.49–1.82) 0.71 (0.33–1.55) 0.67 (0.33–1.36) 1.66 (0.79–3.50)
BSA IgG
0 mo 1.59 (0.74–3.40) 1.62 (0.76–3.46) – – – –
3 mo 1.31 (0.49–3.49) 0.57 (0.19–1.70) 0.83 (0.39–1.76) 0.72 (0.31–1.70)
6 mo 0.48 (0.08–2.82) 2.27 (0.61–8.51) 0.43 (0.13–1.40) 1.16 (0.40–3.42)
12 mo 1.51 (0.69–3.29) 0.69 (0.31–1.54) 0.95 (0.52–1.75) 0.65 (0.32–1.34)
24 mo 0.95 (0.52–1.75) 0.65 (0.32–1.34) 0.46 (0.21–0.97)c 1.05 (0.52–2.12)
Alpha-casein IgA
3 mo 0.97 (0.42–2.24) 0.34 (0.12–0.95)c 1.52 (0.79–2.91) 0.18 (0.06–0.58)d
6 mo 1.26 (0.58–2.74) 0.50 (0.22–1.12) 1.92 (1.01–3.64)c 0.37 (0.17–0.81)c
12 mo 0.78 (0.37–1.63) 1.02 (0.49–2.10) 0.80 (0.45–1.42) 0.59 (0.29–1.17)
24 mo 0.80 (0.45–1.42) 0.59 (0.29–1.17) 0.44 (0.21–0.92)c 1.00 (0.50–1.98)
Alpha-casein IgG
0 mo 1.00 (0.48–2.08) 1.48 (0.73–3.00) – – – –
3 mo 0.92 (0.46–1.85) 0.84 (0.42–1.68) 1.26 (0.72–2.23) 0.69 (0.37–1.28)
6 mo 0.86 (0.37–1.97) 0.64 (0.28–1.46) 1.09 (0.59–1.99) 0.40 (0.19–0.87)c
12 mo 0.67 (0.31–1.43) 0.70 (0.33–1.50) 1.03 (0.59–1.80) 0.84 (0.45–1.55)
24 mo 1.03 (0.59–1.80) 0.84 (0.45–1.55) 0.90 (0.47–1.72) 0.97 (0.51–1.84)
a At 3 mo adjusted for birthweight, duration of gestation and duration of exclusive breastfeeding by 3 mo of age; at 6 mo for birthweight
and total breastfeeding (yes/no); at 12 mo for milk protein intake of the child, age at introduction of milk products and breastfeeding
(yes/no); and at 24 mo for milk protein intake of child, age at introduction of milk products and duration of total breastfeeding.b 3 mo cow’s milk antibody titres were available from 85 to 94 subjects, at 6 mo from 80 to 88 subjects, at 12 mo from 81 to 83 subjects, and
at 24 mo from 70 to 80 subjects.c p50.05 for significant ORs and their 95% CIs.d p50.01 for significant ORs and their 95% CIs.e The 6 mo analysis could not be done due to only one infant with a positive antibody titre.
Maternal diet and CM antibodies in infants 701
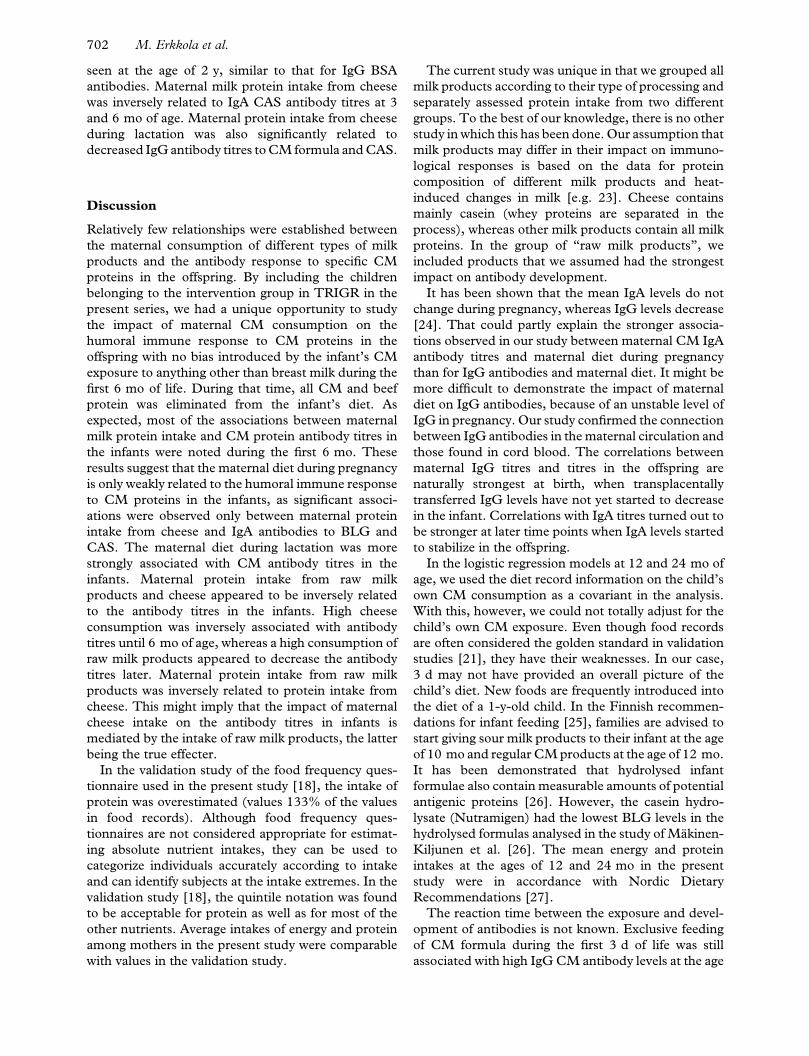
seen at the age of 2 y, similar to that for IgG BSA
antibodies. Maternal milk protein intake from cheese
was inversely related to IgA CAS antibody titres at 3
and 6 mo of age. Maternal protein intake from cheese
during lactation was also significantly related to
decreased IgG antibody titres to CM formula and CAS.
Discussion
Relatively few relationships were established between
the maternal consumption of different types of milk
products and the antibody response to specific CM
proteins in the offspring. By including the children
belonging to the intervention group in TRIGR in the
present series, we had a unique opportunity to study
the impact of maternal CM consumption on the
humoral immune response to CM proteins in the
offspring with no bias introduced by the infant’s CM
exposure to anything other than breast milk during the
first 6 mo of life. During that time, all CM and beef
protein was eliminated from the infant’s diet. As
expected, most of the associations between maternal
milk protein intake and CM protein antibody titres in
the infants were noted during the first 6 mo. These
results suggest that the maternal diet during pregnancy
is only weakly related to the humoral immune response
to CM proteins in the infants, as significant associ-
ations were observed only between maternal protein
intake from cheese and IgA antibodies to BLG and
CAS. The maternal diet during lactation was more
strongly associated with CM antibody titres in the
infants. Maternal protein intake from raw milk
products and cheese appeared to be inversely related
to the antibody titres in the infants. High cheese
consumption was inversely associated with antibody
titres until 6 mo of age, whereas a high consumption of
raw milk products appeared to decrease the antibody
titres later. Maternal protein intake from raw milk
products was inversely related to protein intake from
cheese. This might imply that the impact of maternal
cheese intake on the antibody titres in infants is
mediated by the intake of raw milk products, the latter
being the true effecter.
In the validation study of the food frequency ques-
tionnaire used in the present study [18], the intake of
protein was overestimated (values 133% of the values
in food records). Although food frequency ques-
tionnaires are not considered appropriate for estimat-
ing absolute nutrient intakes, they can be used to
categorize individuals accurately according to intake
and can identify subjects at the intake extremes. In the
validation study [18], the quintile notation was found
to be acceptable for protein as well as for most of the
other nutrients. Average intakes of energy and protein
among mothers in the present study were comparable
with values in the validation study.
The current study was unique in that we grouped all
milk products according to their type of processing and
separately assessed protein intake from two different
groups. To the best of our knowledge, there is no other
study in which this has been done. Our assumption that
milk products may differ in their impact on immuno-
logical responses is based on the data for protein
composition of different milk products and heat-
induced changes in milk [e.g. 23]. Cheese contains
mainly casein (whey proteins are separated in the
process), whereas other milk products contain all milk
proteins. In the group of “raw milk products”, we
included products that we assumed had the strongest
impact on antibody development.
It has been shown that the mean IgA levels do not
change during pregnancy, whereas IgG levels decrease
[24]. That could partly explain the stronger associa-
tions observed in our study between maternal CM IgA
antibody titres and maternal diet during pregnancy
than for IgG antibodies and maternal diet. It might be
more difficult to demonstrate the impact of maternal
diet on IgG antibodies, because of an unstable level of
IgG in pregnancy. Our study confirmed the connection
between IgG antibodies in the maternal circulation and
those found in cord blood. The correlations between
maternal IgG titres and titres in the offspring are
naturally strongest at birth, when transplacentally
transferred IgG levels have not yet started to decrease
in the infant. Correlations with IgA titres turned out to
be stronger at later time points when IgA levels started
to stabilize in the offspring.
In the logistic regression models at 12 and 24 mo of
age, we used the diet record information on the child’s
own CM consumption as a covariant in the analysis.
With this, however, we could not totally adjust for the
child’s own CM exposure. Even though food records
are often considered the golden standard in validation
studies [21], they have their weaknesses. In our case,
3 d may not have provided an overall picture of the
child’s diet. New foods are frequently introduced into
the diet of a 1-y-old child. In the Finnish recommen-
dations for infant feeding [25], families are advised to
start giving sour milk products to their infant at the age
of 10 mo and regular CM products at the age of 12 mo.
It has been demonstrated that hydrolysed infant
formulae also contain measurable amounts of potential
antigenic proteins [26]. However, the casein hydro-
lysate (Nutramigen) had the lowest BLG levels in the
hydrolysed formulas analysed in the study of Makinen-
Kiljunen et al. [26]. The mean energy and protein
intakes at the ages of 12 and 24 mo in the present
study were in accordance with Nordic Dietary
Recommendations [27].
The reaction time between the exposure and devel-
opment of antibodies is not known. Exclusive feeding
of CM formula during the first 3 d of life was still
associated with high IgG CM antibody levels at the age
702 M. Erkkola et al.
of 2 y in the study of Juvonen et al. [28]. Individual
mammary permeability influences the amount of
antigen secreted into breast milk and, in addition, the
gastrointestinal permeability differs between individual
babies. Overall, the development of CM antibodies in
infants seems to be related more closely to the type of
feeding than to age. In our study the exposure to milk
and meat products was minimal in all infants during
the first 6 mo. Subsequently, there was more inter-
individual variation in the food intake, and it is well
established that the diet represents a full variety of
different exposures, which may have a confounding
effect on the relations between a specific nutrient and
the development of an immune response.
The present findings are not directly comparable
with earlier studies because of the particular study
design, and the conclusions may not be directly
generalized because of the participating families being
selected by genetic risk for type 1 diabetes. Antibodies
to CM proteins have been measured in children in a
number of settings. Most of the studies have focused
on IgE-mediated hypersensitivity in high-risk children,
and only a few have addressed other issues such as CM
intolerance or the aetiology of diabetes. In their review,
Akerblom et al. [29] summarized various studies on the
humoral immune response to CM proteins in patients
with type 1 diabetes. Increased levels to at least one of
the IgA- and IgG-class antibodies to CM, BLG and
BSA were recorded in subjects with type 1 diabetes
compared to control subjects in the 11 studies re-
viewed. The authors suggested that temporary but
strict avoidance of CM proteins in early infancy might
prevent the development of type 1 diabetes in geneti-
cally susceptible subjects. The possible pathogenic role
of IgA- and IgG-class CM antibodies has remained
open.
To conclude, this study introduced a new viewpoint
into research on CM antibodies in infants and young
children. Milk products seem to differ in their effects
on CM antibody responses. Maternal protein intake
from raw milk products and cheese tended to inhibit
the humoral immune responses to CM proteins in the
offspring. The inverse association between maternal
intake of cheese during pregnancy and the humoral
immune response to CM proteins in early infancy raises
the issue of whether such maternal exposure could
induce tolerance to CM proteins in the offspring. Simi-
larly, the inverse relationship between maternal intake
of raw milk products and cheese during lactation and
the antibody response to CM proteins in infants indi-
cates the possibility of tolerance induction in the off-
spring by CM proteins transferred through breast milk.
References
[1] Businco L, Bruno G, Giampietro PG. Prevention and manage-
ment of food allergy. Acta Paediatr 1999;Suppl 430:104–9.
[2] Virtanen SM, Knip M. Nutritional risk predictors of b cell
autoimmunity and type 1 diabetes at a young age. Am J Clin
Nutr 2003;78:1053–67.
[3] Savilahti E, Saukkonen T, Virtala E, Tuomilehto J, Akerblom
HK, the Childhood Diabetes in Finland Study Group.
Increased levels of cow’s milk and betalactoglobulin antibodies
in young children with newly diagnosed insulin-
dependent diabetes mellitus. Diabetes Care 1993;16:984–9.
[4] Saukkonen T, Savilahti E, Vaarala O, Virtala E, Tuomilehto J,
Akerblom H, the Childhood Diabetes in Finland Study Group.
Children with newly diagnosed insulin-dependent diabetes
mellitus have increased levels of antibodies to bovine serum al-
bumin but not to ovalalbumin. Diabetes Care 1994;17:970–6.
[5] Hughes DA. The influence of the diet on the maturation of the
immune system. Allergy 1998;Suppl 46:26–8.
[6] Lovegrove JA, Hampton SM, Morgan JB. The immunological
and long-term atopic outcome of infants born to women
following a milk-free diet during late pregnancy and lactation: a
pilot study. Br J Nutr 1994;71:223–38.
[7] Zeiger RS. Dietary aspects of food allergy prevention in infants
and children. J Pediatr Gastroenterol Nutr 2000;Suppl 30:
77–86.
[8] Tainio V-M, Savilahti E, Arjomaa P, Salmenpera L, Perheen-
tupa J, Siimes MA. Plasma antibodies to cow’s milk are
increased by early weaning and consumption of unmodified
milk, but production of plasma IgA and IgM cow’s milk anti-
bodies is stimulated even during exclusive breast-feeding. Acta
Paediatr Scand 1988;77:807–11.
[9] Kaila M, Arvilommi H, Soppi E. A prospective study of
humoral immune responses to cow milk antigens in the first
year of life. Pediatr Allergy Immunol 1994;5:164–9.
[10] Kuitunen M, Savilahti E, Sarnesto A. Human a-lactalbumin
and bovine b-lactoglobulin absorption in infants. Allergy
1994;49:354–60.
[11] Telemo E, Hanson LA. Antibodies in milk. J Mammary Gland
Biol Neoplasia 1996;1:243–9.
[12] Savilahti E, Kuitunen M. Allergenicity of cow milk proteins.
J Pediatr 1992;Suppl 121:12–20.
[13] Kilshaw PJ, Cant AJ. The passage of maternal proteins into
breast milk. Int Arch Appl Immunol 1984;75:8–15.
[14] Fukushima Y, Kawata Y, Onda T, Kitagawa M. Consumption
of cow milk and egg by lactating women and the presence of
beta-lactoglobulin and ovalbumin in breast milk. Am J Clin
Nutr 1997;65:30–5.
[15] Falth-Magnusson K, Kjellman NI, Magnusson KE. Antibodies
IgG, IgA, and IgM to food antigens during the first 18 months
of life in relation to feeding and development of atopic disease.
Allergy Clin Immunol 1988;81:743–9.
[16] Hattevig G, Kjellman B, Sigurs N, Grodzinsky E, Hed J,
Bjorksten B. The effect of maternal avoidance of eggs, cow’s
milk, and fish during lactation on the development of IgE, IgG,
and IgA antibodies in infants. J Allergy Clin Immunol
1990;85:108–15.
[17] Akerblom HK, Virtanen SM, Ilonen J, Savilahti E, Vaarala O,
Reunanen A, et al. Diabetologia 2005 (in press).
[18] Erkkola M, Karppinen M, Javanainen J, Rasanen L, Knip M,
Virtanen SM. Validity and reproducibility of a food frequency
questionnaire for pregnant Finnish women. Am J Epidemiol
2001;154:466–76.
[19] Ovaskainen M-L, Valsta LM, Lauronen J. The compilation of
food analysis values as a database for dietary studies – the
Finnish experience. Food Chem 1996;57:133–6.
[20] Vaarala O, Saukkonen T, Savilahti E, Klemola T, Akerblom
HK. Development of immune response to cow’s milk proteins
in infants receiving cow’s milk or hydrolyzed formula. J Allergy
Clin Immunol 1995;96:917–23.
[21] Willett W. Nutritional epidemiology. 2nd ed. New York:
Oxford University Press; 1998.
Maternal diet and CM antibodies in infants 703
[22] Hosmer DW, Lemeshow S. Applied logistic regression, Second
edition. A Wiley-Interscience publication. New York: John
Wiley & Sons Inc, 2000.
[23] Jost R, Fritsche R, Pahud JJ. Reduction of milk protein
allergenicity through processing. Bibl Nutr Dieta 1991;48:
127–37.
[24] Ailus KT. A follow-up study of immunoglobulin levels and
autobodies in an unselected pregnant population. Am J Reprod
Immunol 1994;31:189–96.
[25] Hasunen K, Kalavainen M, Keinonen H, Lagstrom H, Lyyti-
kainen A, Nurttila A, et al. Lapsi, perhe ja ruoka. Imevais- ja
leikki-ikaisten lasten, odottavien ja imettavien aitien ravitse-
mussuositus. Sosiaali- ja terveysministerion julkaisuja 2004:11.
Helsinki: Edita Prima Oy; 2004 (in Finnish).
[26] Makinen-Kiljunen S, Sorva R. Bovine b-lactoglobulin levels in
hydrolysed protein formulas for infant feeding. Clin Exp
Allergy 1993;23:287–91.
[27] Nordisk ministerrad. Nordiska naringsrekommendationer
1996, Nord 1996:28. Kopenhamn: AKA-print; 1996.
[28] Juvonen P, Mansson M, Kjellman NI, Bjorksten B,
Jakobsson I. Development of immunoglobulin G and im-
munoglobulin E antibodies to cow’s milk proteins and oval-
bumin after a temporary neonatal exposure to hydrolyzed
and whole cow’s milk proteins. Pediatr Allergy Immunol
1999;10:191–8.
[29] Akerblom HK, Savilahti E, Vaarala O. Cow’s milk protein
and insulin-dependent diabetes mellitus. Scand J Nutr 1996;
40:98–103.
704 M. Erkkola et al.