masterton district council agenda audit and risk … · 16 november 2018 masterton district council...
TRANSCRIPT
16 November 2018
MASTERTON DISTRICT COUNCIL
AGENDA
AUDIT AND RISK COMMITTEE
WEDNESDAY 21 NOVEMBER 2018 AT 3.00PM
MEMBERSHIP OF THE COMMITTEE
Philip Jones (Chairperson)
Her Worship the Mayor Cr D Davidson Cr J Dalziell
Cr B Goodwin Cr G McClymont Cr C Peterson
Quorum: Four
No ce is given that the mee ng of the Masterton District Council Audit and Risk Commi ee will be held on Wednesday 21 November 2018 at Sports House, 101 Chapel St, Masterton commencing at 3.00pm.
RECOMMENDATIONS IN REPORTS ARE NOT TO BE CONSTRUED AS COUNCIL
POLICY UNTIL ADOPTED

1 AGENDA ITEMS
1. APOLOGIES 2. CONFLICTS OF INTEREST (Members to declare conflicts, if any) 3. LATE ITEMS 4. MINUTES OF PREVIOUS MEETING TO BE RECEIVED (174/18) Pages 401-406 FOR INFORMATION 5. INSURANCE BRIEFING (240/18) Pages 411-414 6. FIRST QUARTER REPORTS (242/18) Pages 415-437
a) Destination Wairarapa – quarterly report and financial statements Pages 418-431d) Aratoi Regional Trust - quarterly report and financial statements Pages 432-437 7. 2018/19 THREE MONTHS TO DATE FINANCIAL REPORT (247/18) Pages 438-461 8. NON-FINANCIAL PERFORMANCE 2018/2019 FIRST QUARTER REPORT (244/18)
Pages 462-470 9. LGFA, BORROWING AND INVESTMENTS UPDATE (241/18) Pages 471-472 10. PROGRESS REPORT: MONITORING OF POLICIES (243/18) Pages 473-474 MATTERS TO BE TAKEN WITH THE PUBLIC EXCLUDED Moved by Seconded by Under section 48 (1) of the Local Government Official Information and Meetings Act 1987 the following matters will be taken with the public excluded :-
Receive the Minutes of the previous meeting held with the public excluded 29 August 2018.
General Business
11. Audit Report to the Council on the year ended 30 June 2018
12. SMT Risk Discussion.
The general subject of the matters to be considered while the public is excluded, the reason for passing this resolution in relation to the matter, and the specific grounds under section 48(1) of the Local Government Official Information and Meetings Act 1987 for the passing of this resolution is as follows:-

2
General subject of each matter to be considered
Reason for passing this resolution in relation to each matter
Ground(s) under section 48(1) for the passing of this resolution
Minutes of Previous Meeting held 29 August 2018
See page 404-406 s48(1)(d) That the exclusion of the public from the whole or the relevant part of the proceedings of the meeting is necessary to enable the local authority to deliberate in private on its decision or recommendation in any proceeding to which this paragraph applies
Audit Report to the Council on the year ended 30 June 2018
7(2)(f)(ii) The withholding of the information is necessary to maintain the effective conduct of public affairs through the protection of such members, officers, employees, and persons from improper pressure or harassment
s48(1)(d) That the exclusion of the public from the whole or the relevant part of the proceedings of the meeting is necessary to enable the local authority to deliberate in private on its decision or recommendation in any proceeding to which this paragraph applies
SMT Risk Discussion 7(2)(c)(i) The withholding of the information is necessary to protect information which is subject to an obligation of confidence or which any person has been or could be compelled to provide under the authority of any enactment, where the making available of the information would be likely to prejudice the supply of similar information or information from the same source and it is in the public interest that such information should continue to be supplied. 7(2)(c)(ii) The withholding of the information is necessary to protect information which is subject to an obligation of confidence or which any person has been or could be compelled to provide under the authority of any enactment, where the making available of the information would be likely to damage the public interest.
s48(1)(d) That the exclusion of the public from the whole or the relevant part of the proceedings of the meeting is necessary to enable the local authority to deliberate in private on its decision or recommendation in any proceeding to which this paragraph applies

240/18
To: Audit & Risk Committee
From: David Paris, Manager Finance
Endorsed by: Kathryn Ross, Chief Executive
Date: 21 November 2018
Subject: Insurance Briefing
FOR INFORMATION
Recommendation:
That the Audit & Risk Committee receives the Report 240/18 and verbal briefing from a representative from Jardine Lloyd Thompson (JLT).
Purpose
To provide the Audit and Risk Committee with an extension of the information provided at the May meeting with respect to the insurance cover the Council has in place for the 2018/19 year. A representative of the Council’s insurance broker, Jardine Lloyd Thompson (JLT) (Darren Williamson) will provide a briefing, including a description of the collaborative nature of the insurance cover across the three Wairarapa Councils.
Executive Summary
The Council carries insurance cover to mitigate a number of risks to the assets and activities of the Council. This report has been prepared in order to provide further background information on risks and insurance cover.
Risk Overview
Insurance is one of many tools an organisation has available to manage risks – in particular, the financial risks associated with the occurrence of an adverse event through the transfer of that risk to a third party. Insurance alone cannot be relied upon to manage risks. A number of other methods are required to be used:
Avoidance
Reduction in risk (eg with design or processes)
Mitigation
Recovery processes. It is the Council’s responsibility to identify risks in our business and decide which ones to insure against and at what value. Being uninsured or underinsured is risky, as it exposes us to potential losses if something goes wrong in our business. Equally, having the wrong kind of insurance can be a waste of money. We regularly review and update our insurance, especially when our business or circumstances change.
411

Background
While insurance is often seen as financial cover for damage to physical assets, it is also available to cover potential financial losses from adverse events affecting our business operations. Insurance cover may include:
o property damage
o equipment breakdown
o liability claims
o professional indemnity
o theft
o natural disasters. It is noted that insurance only deals with financial losses and needs to be considered in the wider context of risk management.
Insurance Principles
Recommended principles are:
Council will transfer financial risk where appropriate.
Council will have a conservative approach to insurance.
Council will self‐insure (in part) where appropriate contingency funding is in place (e.g. flood damage for road and bridge assets).
Council will ensure sufficient financial reserves (capacity funds) are in place to cover periods before insurance payments are received.
The broad intention is to deliver an informed balance of insured risk vs non‐financial risk across Council’s operations, activities and services.
Current Insurance
Council operates a business with a $44m turnover. It has fixed assets worth more than $757m. The operations include activities that carry many risks and potential financial liabilities. The insurance world’s view of New Zealand’s risk profile changes regularly. The graph on the following page illustrates the changing cost of securing insurance cover. The impact of the 2011 Christchurch earthquake on insurance premiums is clear. The reducing premiums are described as a ‘softening’ of the market. A turn‐around has occurred with the Kaikoura earthquake in November 2016 having an impact on the earthquake portion of the material damage premiums. A 25% increase in the earthquake portion of premiums was seen in 2016/17. In addition, the changes to the Fire Service saw their levies increase in 2017/18. The current year has seen continuing hardening of the insurance market due to on‐going claims and losses due to storm events. The material damage premiums increased 7.5% over the prior year. The cost of disaster recovery cover on underground assets remained less affected by the global market as the Council has stayed with the LAPP scheme. The prospect of having to move to a market‐based scheme from July 2019 has been signalled as the LAPP scheme looks to transfer its members across to an insurance‐based model.
412
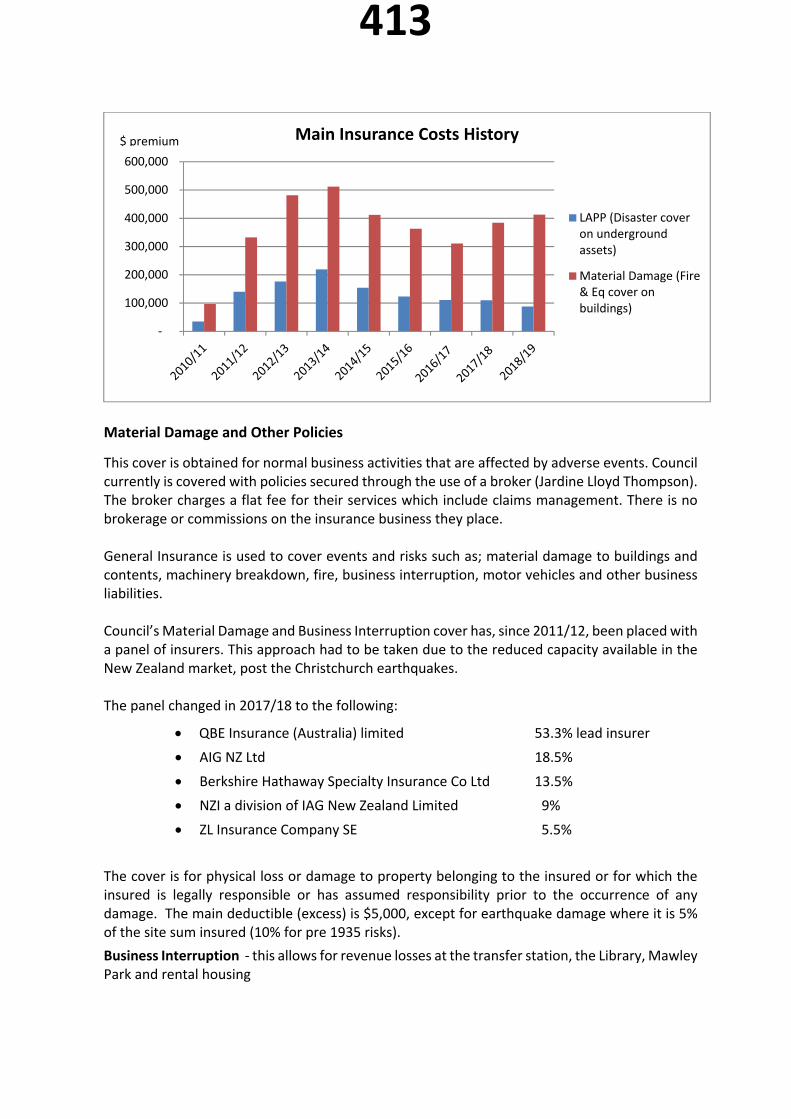
Material Damage and Other Policies
This cover is obtained for normal business activities that are affected by adverse events. Council currently is covered with policies secured through the use of a broker (Jardine Lloyd Thompson). The broker charges a flat fee for their services which include claims management. There is no brokerage or commissions on the insurance business they place. General Insurance is used to cover events and risks such as; material damage to buildings and contents, machinery breakdown, fire, business interruption, motor vehicles and other business liabilities. Council’s Material Damage and Business Interruption cover has, since 2011/12, been placed with a panel of insurers. This approach had to be taken due to the reduced capacity available in the New Zealand market, post the Christchurch earthquakes. The panel changed in 2017/18 to the following:
QBE Insurance (Australia) limited 53.3% lead insurer
AIG NZ Ltd 18.5%
Berkshire Hathaway Specialty Insurance Co Ltd 13.5%
NZI a division of IAG New Zealand Limited 9%
ZL Insurance Company SE 5.5%
The cover is for physical loss or damage to property belonging to the insured or for which the insured is legally responsible or has assumed responsibility prior to the occurrence of any damage. The main deductible (excess) is $5,000, except for earthquake damage where it is 5% of the site sum insured (10% for pre 1935 risks).
Business Interruption ‐ this allows for revenue losses at the transfer station, the Library, Mawley Park and rental housing
‐
100,000
200,000
300,000
400,000
500,000
600,000
Main Insurance Costs History
LAPP (Disaster coveron undergroundassets)
Material Damage (Fire& Eq cover onbuildings)
$ premium
413

Machinery Breakdown (QBE) covers identified pumps over 5kw (that are excluded under the material damage policy) with a $2,500 deductible.
Motor Vehicle (Vero) – cover is based on the market value at the time of loss. Deductible is 1% of vehicle value with a minimum of $500
Personal Accident (Chubb Insurance NZ Ltd) The Mayor, Councillors and all staff are covered for death by accident, worldwide, 24 hours, sum insured $50,000, subject to exclusions
Fidelity Guarantee (Vero) – indemnifies for losses as a result of fraudulent or dishonest acts committed by employees. Deductible $5,000
Airport Owners & Operators Liability (AIG APAC Holdings Pte Ltd (AIG Singapore)
Standing Timber (Primacy) – covers the small blocks of forestry the Council owns.
Employers Liability and Statutory Liability (Vero) – for damages and defence costs.
Public Liability/Professional Indemnity
The Council changed its liability insurer from 1 July 2017 to JLT’s Local Government Liability Programme. Local Government has some unique risks associated with the regulatory functions and the previous insurer, Riskpool was established in the 1990s to fill a gap in the market for local authorities. They stood behind Councils through many legal challenges and obtained good clarity around liability issues such as leaky homes. Riskpool (and Civic Assurance) withdrew from the market last year but will take 3 to 5 years to wind up as old claims are settled. Riskpool has signalled that a further call on member Councils will be made for the Fund years 7 and 10 (2004 and 2007). The call totals $6m and is to cover the deficit the mutual fund is carrying. Their deficit relates to leaky homes claims that were not able to be covered by re‐insurance. Masterton DC’s share of the call is just under $30,000 and was not budgeted in the 2018/19 year. A further call on Riskpool members has been signalled in 2022 or 2023.
414
242/18
To: Audit and Risk Committee
From: Andrea Jackson, Manager Community Facilities and Activities
Endorsed by: Kathryn Ross, Chief Executive
Date: 21 November 2018
Subject: First Quarter Reports
FOR INFORMATION
Recommendation:
That Council receives:
(a) the quarterly report and financial statement as at 30 September 2018 from Destination Wairarapa;
(b) the quarterly report and financial statement as at 30 September 2018 from Aratoi Regional Trust.
Purpose The purpose of this report is to provide the committee with the quarterly report and financial statement from Destination Wairarapa and Aratoi Regional Trust.
Executive Summary Destination Wairarapa provides a community public service and supports council’s community outcome “A Thriving and Resilient Economy”.
Aratoi Regional Trust provides community infrastructure and a community service, to support council’s community outcome “Pride in our Identity and Heritage”.
Both providers have achieved their required deliverables for the period reported on, as set out below.
Destination Wairarapa (DW)
Destination Wairarapa deliverables are:
(i) To increase the number of visitors to the Wairarapa, the length of time they stay in the region and the amount they spend. Specifically, DW are tasked with delivering 3% growth in tourism GDP per annum for each territory (Masterton, Carterton and South Wairarapa), with statistics sourced from Infometrics. This information to be reported as Wairarapa‐wide and by each territory. Achieved : DW General Manager’s Report, 30 September 2018 * (Pages 1‐5)
[Attachment 1]
(ii) That the percentage growth to tourism is comparable to Wellington and Taupo Achieved : DW General Manager’s Report, 30 September 2018 * (Pages 1‐3)
[Attachment 1]
* NOTE: the provided report refers to 12 months ending August 2018 for the CommercialAccommodation Monitor information.
415
(iii) To provide a balanced budget Achieved : DW Profit & Loss Report, 30 September 2018 (Pages 1‐4)
[Attachment 3]; DW General Manager’s Financial Report, 30 September 2018 (Page 1) [Attachment 2]
(iv) To provide an online Wairarapa events calendar Achieved : DW General Manager’s Report, 30 September 2018 (Page 7)
[Attachment 1]
(v) To report quarterly to the council, including attending a council meeting Achieved : DW General Manager’s Report, 30 September 2018 (Pages 1‐4)
[Attachment 1]; DW General Manager’s Financial Report, 30 September 2018 (Page 1) [Attachment 2]
Council meeting attended 28 February 2018
(vi) To have a joint partnership with Tourism New Zealand’s Business Events Team for at least one funded pitch per annum Achieved : DW General Manager’s Report, 30 September 2018 (Page 5)
[Attachment 1]
(vii) To provide a clear marketing strategy including at least six workshops and/or networking events per annum Achieved : DW General Manager’s Report, 30 September 2018 (Pages 6‐9)
[Attachment 1]
Aratoi Regional Trust (ART)
The Aratoi Regional Trust reports on:
(a) Exhibitions ‐ no significant deviation from the exhibitions delivered as planned
Achieved: ART Report, Q1 2018‐19 (Page 5) [Attachment 4]
(a) Programmes – arrange public programmes, events and activities to enhance visitor experience
Achieved: ART Report, Q1 2018‐19 (Pages 5‐6) [Attachment 4]
(b) Permanent Collection ‐ care, research and develop museum and historical collections and provide reports on cultural and/or significant objects
Achieved: ART Report, Q1 2018‐19 (Page 4) [Attachment 4]
(c) Relationships – liaise with local organisations from the arts, history and culture sectors and maintain on‐going relationships with other funders
Achieved: ART Report, Q1 2018‐19 (Pages 5‐6) [Attachment 4]
(e) Visitors ‐ measure visitor numbers and establish a baseline. 80% visitor satisfaction achieved
Achieved: ART Report, Q1 2018‐19 (Page 6) [Attachment 4]
416

(f) Balanced budget and at least 20% from external sources
Achieved: ART Report, Q1 2018‐19 (Pages 1‐3) [Attachment 4]
(g) Volunteer Labour – achieve over 2,000 hours of volunteer labour
Achieved: ART Report, Q1 2018‐19 (Page 6) [Attachment 4]
417

Destination Wairarapa
30 September 2018
General Manager’s Report
More Visitors, Staying Longer & Spending More
Overview
Visitor Arrivals International visitor guest nights continued to decline against same volumes last year and the share of Wairarapa’s total guest nights is sitting at about 17%.
Backing up from May when Wairarapa had the highest Guest Night growth (20.3%) of any region in the country, in June we had the highest domestic guest night growth (42.6%) and the second highest overall guest night growth 13.4%. Now in August the Wairarapa has again had the highest percentage guest night growth in the country with 29.6%. The closest region in terms of this measure was Manawatu with 14.8%.
In August we not only had guest night growth but guest arrivals were up 13.7%, length of stay up a phenomenal 0.23 nights and the resulting 5.6 point growth in occupancy levels is exceptional.
Despite a rough June and July, the Wairarapa commercial accommodation monitor figures for the YE August 2018 are better than any other region in the feeder set including National.
Commercial Accommodation MonitorStatistics New Zealand August 2018
Wairarapa
Greater
Wellington
Hawkes
Bay Taupo National
Guest Arrivals
2018 7,682 89,318 29,342 41,946 1,250,843
2017 6,755 85,889 30,520 39,749 1,201,490
Variance 13.7% 4.0% -3.9% 5.5% 4.1%
Guest Nights
2018 14,698 192,763 69,694 71,731 2,524,000
2017 11,337 184,693 62,793 67,563 2,440,597
Variance 29.6% 4.4% 11.0% 6.2% 3.4%
Occupancy
2018 22.7% 59.7% 34.5% 30.3% 36.5%
2017 17.1% 56.5% 32.5% 29.4% 35.7%
Variance 5.6 2.8 2.0 0.9 0.5
Length of Stay
2018 1.91 2.16 2.38 1.71 2.02
2017 1.68 2.15 2.06 1.70 2.03
Note: Greater Wellington excludes Wellington City
1
Attachment 1418
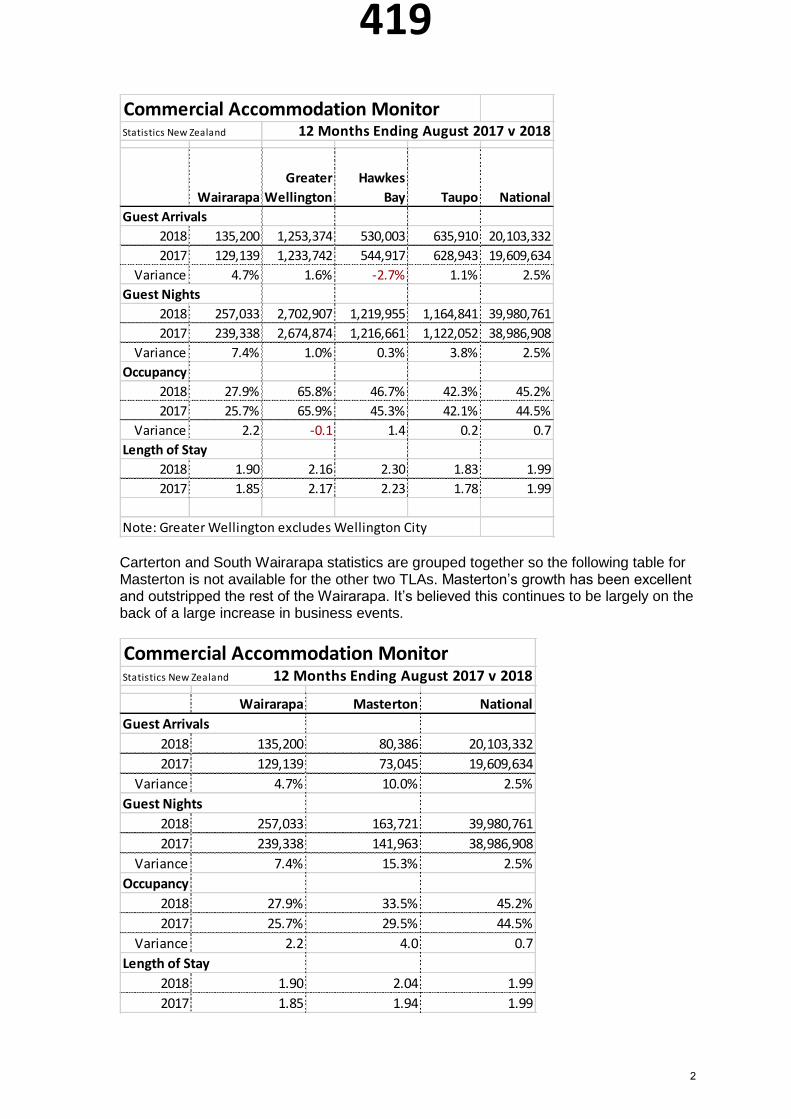
Carterton and South Wairarapa statistics are grouped together so the following table for Masterton is not available for the other two TLAs. Masterton’s growth has been excellent and outstripped the rest of the Wairarapa. It’s believed this continues to be largely on the back of a large increase in business events.
Commercial Accommodation MonitorStatistics New Zealand 12 Months Ending August 2017 v 2018
Wairarapa
Greater
Wellington
Hawkes
Bay Taupo National
Guest Arrivals
2018 135,200 1,253,374 530,003 635,910 20,103,332
2017 129,139 1,233,742 544,917 628,943 19,609,634
Variance 4.7% 1.6% -2.7% 1.1% 2.5%
Guest Nights
2018 257,033 2,702,907 1,219,955 1,164,841 39,980,761
2017 239,338 2,674,874 1,216,661 1,122,052 38,986,908
Variance 7.4% 1.0% 0.3% 3.8% 2.5%
Occupancy
2018 27.9% 65.8% 46.7% 42.3% 45.2%
2017 25.7% 65.9% 45.3% 42.1% 44.5%
Variance 2.2 -0.1 1.4 0.2 0.7
Length of Stay
2018 1.90 2.16 2.30 1.83 1.99
2017 1.85 2.17 2.23 1.78 1.99
Note: Greater Wellington excludes Wellington City
Commercial Accommodation MonitorStatistics New Zealand 12 Months Ending August 2017 v 2018
Wairarapa Masterton National
Guest Arrivals
2018 135,200 80,386 20,103,332
2017 129,139 73,045 19,609,634
Variance 4.7% 10.0% 2.5%
Guest Nights
2018 257,033 163,721 39,980,761
2017 239,338 141,963 38,986,908
Variance 7.4% 15.3% 2.5%
Occupancy
2018 27.9% 33.5% 45.2%
2017 25.7% 29.5% 44.5%
Variance 2.2 4.0 0.7
Length of Stay
2018 1.90 2.04 1.99
2017 1.85 1.94 1.99
2
419

Visitor Spend This series of graphs is an aggregated view of spend. Spend is once again up with most of the growth coming from Manawatu and Wellington although pleasingly the Wellington share of all spend has not changed. The YE July spend of $186.7 million is a new benchmark. Despite the drop in International guest nights, Australian spend is up slightly on last month and the real hit has been in USA and UK spend although both held their share of spend.
A reminder that the 2025 goal is for Wairarapa tourism to be generating $212million dollars a year to the local economy. YE July 2018 and the industry is generating $186.7 million which is average annual growth of $13.17 million from the $134 million benchmark in 2014. This is considerably better than the $3.6 million required per year between now and 2025. At this rate we’ll have achieved the goal by 2022.
For the YE July 2018 we can see the breakdown of visitor spend by TLA. Masterton and Carterton spend grew in July from June, while South Wairarapa held at the same level.
Wellington, $71.94, 47%
Manawatu, $20.39, 13%
Austra lia, $11.25, 7%
Auckland, $11.87, 8%
Hawkes Bay, $9.16, 6%
Canterbury, $5.82, 4%
Waikato, $6.13, 4%
Bay of Plenty, $5.04, 3%
USA, $5.25, 4% UK, $6.26, 4%
Revenue by Major MarketYE July 2018 (millions)
3
420
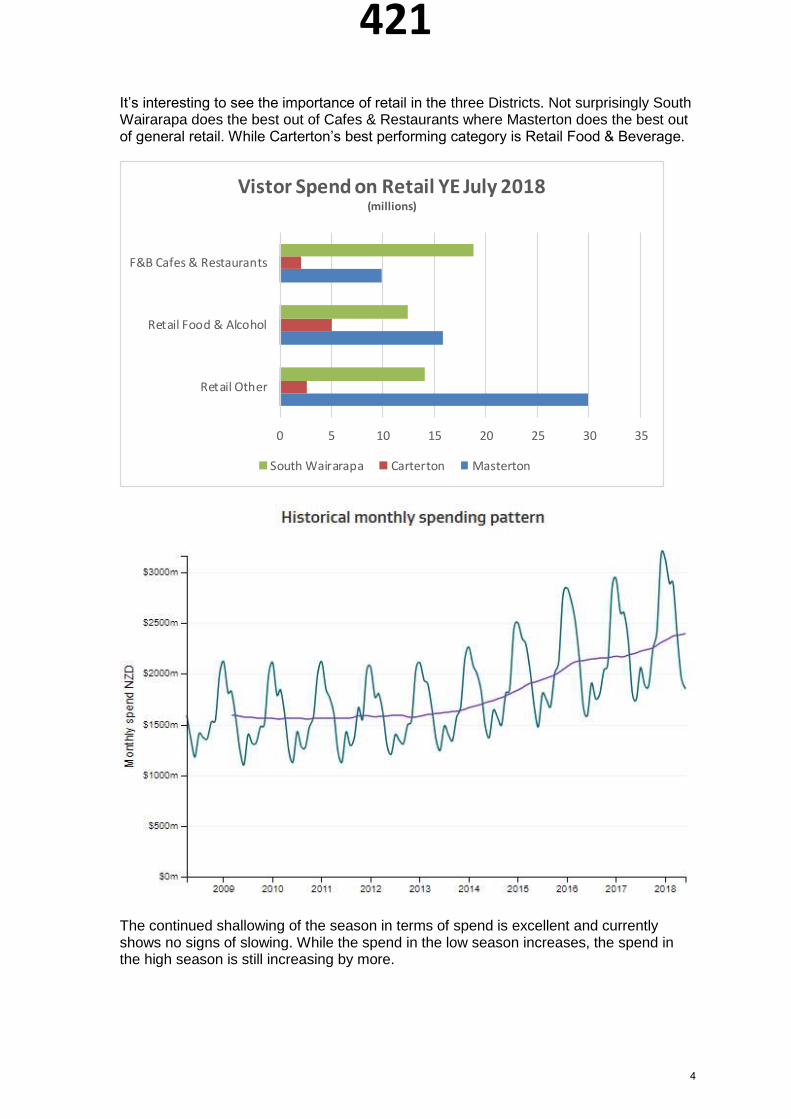
It’s interesting to see the importance of retail in the three Districts. Not surprisingly South Wairarapa does the best out of Cafes & Restaurants where Masterton does the best out of general retail. While Carterton’s best performing category is Retail Food & Beverage.
The continued shallowing of the season in terms of spend is excellent and currently shows no signs of slowing. While the spend in the low season increases, the spend in the high season is still increasing by more.
0 5 10 15 20 25 30 35
Retail Other
Retail Food & Alcohol
F&B Cafes & Restaurants
Vistor Spend on Retail YE July 2018(millions)
South Wairarapa Carterton Masterton
4
421

Winning Business Events
Destination Wairarapa has recognised the growth in Business Events and the lack of a
Convention Bureau in the region. To fill this gap, we’ve partnered with a PCO out of
Wellington. Between July and December, this PCO has booked five business events into
the region.
At the Strategic Planning meeting, Masterton and South Wairarapa all reported excellent
growth in conference business compared to previous years. While Carterton, without a
sales person, has recorded a decline.
i-SITE Visitor Centres
Highlights:
Door counts at the i-SITE Visitor Centres for the YE September 2018 (34,347)
are down 5,739 (14.3%) on the previous year.
o Masterton volumes of 8,445 are down 1,728 (16.9%)
o Martinborough volumes of 25,902 are down 4,011 (13.4%)
Despite the drop in visitors through the door we did see an increase in revenue through
the centres.
5
422

Product Development
Gladstone community consulted with us on a Maori heritage walk to the coast
Working with Star Field in Martinborough to engage tourism sector on the
experience
Working with Martinborough Manor to pick up on a gap in the market
Operator Development
Members’ session x 2
Partnered with Employsure for an HR workshop for members
Google My Business & Facebook training
Neighbourly training
Strategic Planning session
Barbara Hyde, Marketing Manager Domestic Marketing Projects Activity included email database / social media campaigns and web content supporting:
Visa Wellington on a Plate
Secondary activity promotion
Martinborough Music Festival
Jazz in Martinborough
Daffodil Festival
Wai Art
Eclipse
Pukaha Garden Tour
Wings Over Wairarapa
$0
$10,000
$20,000
$30,000
$40,000
$50,000
$60,000
$70,000
Jan Feb Mar Apr May Jun Jul Aug Sep Oct Nov Dec
i-SITE REVENUE
Total 2017 Total 2018
6
423

Tania White joined the team in a part time Marketing Coordinator role. We exhibited (with Schoc and Food Forest Organics) at the Wellington Women’s Lifestyle Expo which is a key way we grow our email database.
2019 Visitor guide/wine map production began. This is a major project and this year was project managed by Tania. Waihine Gorge is the cover this year and will be distributed from the top of the North Island to the bottom of the South.
Provided input into the new Classic NZ Wine Trail (SH2) brochure.
Worked with AA 101 on their summer content.
We began managing the marketing activity for Country Village Heaven group.
We’ve had a major focus on promoting the Remutaka Cycle Trail. Work included:
Complete overhaul of our web content for the trail with new pages added.
A prize promotion via email and extensive Facebook and Instagram activity
including funded activity
Development of and funding of sponsored content on STUFF based on an
article written by cyclist journalist Sarah Bennett who we hosted in the region.
Online In this period we presented a well-attended session about changes to using Facebook and the importance of Google My Business pages. We are working hard to keep our learnings and capability current in this space. This session was top notch and really demonstrated how we can add value to members.
We’ve taken a firm lead on getting onto Neighbourly. With over 780,000 NZers signed up it’s a channel we must be adroit at using. We’ve bought a premium page in the region which Pixie is using to promote the two i-SITE Visitor Centres and a page actually in Wellington which we will be used strategically around events.
We hosted a very well attended session with our Platinum partners and major events around how to use Neighbourly and will continue to share our learnings around this platform.
Developed guidance to major hotel on responding to negative Trip Advisor reviews; a guide we can use more widely.
Trade
Organized appointments for various members for a visit by USA Ambassador
Scott Brown
Singaporean tour group of 70 to Carterton, Martinborough and Greytown
During this period we hosted a number of trade visitors:
Business and conference famil – we brought in targeted PCOs we had met at
Convene and Meetings
NZ Journeys incentive famil
5 driver guides from independent chauffeur companies from Wellington came on
a famil.
7
424

Media Hosted visits and highlights were: Woman’s Day Sarah Kate-Lynch, the travel editor for Woman’s Day. The angle of her story was: A Girls Weekend in Martinborough. Highlights included cycling the vines, Wine Tips and trips at Stonecutter; staying at the Old Manse, Martinborough Hotel, Poppies, MartyGirl, shopping in Greytown. Outstanding outcome and a great relationship established
AA Directions/Traveller Hosted Elisabeth Esther with the view to write a feature article on the Remutaka Cycle Trail. She developed Room check: Karaka Cottage at Wairongomai Station plus AA story to come
Kia Ora Magazine Three day hosting of Cameron Officer from Kia Ora AIR NZ magazine with the brief to write about the Wairarapa’s five towns under a Play, Eat, Stay format. Cameron visited Featherston, Carterton, Martinborough, Masterton and Greytown and did a variety of activities and enjoyed lunch/dinner recommendations provided by Destination Wairarapa.
Major story for the region PLUS a magazine cover from which we’ve had a tremendous amount of feedback.
8
425

Sarah Bennett & Lee Slater Freelance writers and cycling specialists. They did a variety of cycling whilst here including: The Remutaka Cycle Trail, cycling the vines, Rivenrock MTB Park. Extraordinary story achieved: https://www.stuff.co.nz/travel/kiwi-traveller/106430924/over-the-hill-riding-the-remutaka
Worth noting the quality of those we’re attracting here and the outcomes – this is as a result of months of persistent pitching and chasing by Katie.
9
426

1
Destination Wairarapa
30 September 2018
General Manager’s Financial Report
Unaudited Financials 30 September 2018
Revenue, YE 30 September 2018 and revenue is performing slightly better than forecast. Although the $4,548 correction from CDC for a short payment last year is more than the $2,689 better than budget result.
Expenses are under control and with RCT – Project revenue and expenses now being separated out from the core operations, we’re getting a better picture of the actual position.
Corporate Expenses finished $14,400 under budget:o Roughly $8,000 needs to come from this after the audit expense is
realisedo Timing of Board fees will also correct by $4,700
i-SITE Expenses finished $2,200 under budget
Marketing Expenses are $14,000 under spento Classic NZ Wine Trail spend will correct with timing $2,500o Domestic Winter Campaign will correct at the end of the year $2,000o Remutaka Cycle Trail will correct with the production of a new user guide
$4,200
Attachment 2427

Profit & Loss
Profit & Loss September 2018 | Destination Wairarapa Inc. | 10 October 2018 Page 1 of 4
Destination Wairarapa Inc. For the month ended 30 September 2018
Actual Budget Var NZD Var % YTD Actual YTD Budget Var NZD Var %
Income Retail Sales 423 350 73 20.9% 984 900 84 9.3%
Accommodation Commission 751 600 151 25.1% 1,372 1,250 122 9.8%
Bookit 198 300 (102) -33.9% 529 900 (371) -41.3%
Grants - CDC 4,550 4,550 (1) 0.0% 18,198 13,650 4,548 33.3%
Grants - MDC - - - 0.0% 70,450 70,449 1 0.0%
Grants - SWDC - - - 0.0% 32,858 32,858 (1) 0.0%
Interest Received 26 125 (99) -79.4% 479 375 104 27.8%
Membership 958 2,600 (1,642) -63.2% 1,877 7,800 (5,923) -75.9%
Other Revenue 8,303 2,200 6,103 277.4% 17,123 12,400 4,723 38.1%
Ticket Commission 62 190 (128) -67.3% 349 570 (221) -38.8%
Tourism Products 10 250 (240) -96.2% 192 600 (408) -68.0%
Travel Sales 172 350 (178) -50.8% 880 800 80 10.0%
Wairarapa Visitor Guide 2,354 13,000 (10,646) -81.9% 29,950 30,000 (50) -0.2%
Total Income 17,807 24,515 (6,708) -27.4% 175,241 172,552 2,689 1.6%
Gross Profit 17,807 24,515 (6,708) -27.0% 175,241 172,552 2,689 2.0%
Less Operating Expenses
Corporate Support Expenses ACC Levies - - - 0.0% 1,154 1,400 (246) -17.6%
Attachment 3428
Profit & Loss
Profit & Loss September 2018 | Destination Wairarapa Inc. | 10 October 2018 Page 2 of 4
Actual Budget Var NZD Var % YTD Actual YTD Budget Var NZD Var %Accounting Fees 1,200 1,200 - 0.0% 3,600 3,600 - 0.0%
Audit Fees - - - 0.0% 91 - 91 0.0%
Bank Fees - ANZ 49 63 (14) -22.2% 176 189 (13) -7.0%
Board Fees 1,147 5,902 (4,755) -80.6% 1,147 5,902 (4,755) -80.6%
Board Members Expenses - - - 0.0% 9 50 (41) -82.6%
Depreciation - 958 (958) -100.0% - 2,874 (2,874) -100.0%
Electricity Corporate 125 92 33 36.0% 427 276 151 54.8%
Equipment Rental 91 91 - -0.2% 272 273 (1) -0.2%
Fringe Benefit Tax - - - 0.0% 1,385 1,450 (65) -4.5%
Information Technology 567 592 (25) -4.3% 2,339 1,776 563 31.7%
Insurance 454 454 - -0.1% 1,361 1,362 (1) -0.1%
Interest Expense 165 165 - -0.2% 494 495 (1) -0.2%
Kitchen Supplies Corporate 15 42 (27) -64.0% 134 126 8 6.7%
KiwiSaver Employer Contributions - 1,292 (1,292) -100.0% - 3,876 (3,876) -100.0%
Membership Expenses - 150 (150) -100.0% 284 300 (16) -5.5%
Merchant & BNZ Bank Fees 118 250 (132) -52.9% 325 750 (425) -56.7%
Office Supplies & Photocopying Corporate 516 55 461 839.1% 1,800 165 1,635 990.8%
Personnel incl. Training Corporate 794 250 544 217.4% 1,682 750 932 124.3%
Rent & Rates Corporate 1,156 1,250 (94) -7.5% 4,008 3,750 258 6.9%
Salaries 26,540 23,404 3,136 13.4% 69,396 70,212 (816) -1.2%
Subscriptions & Membership 197 50 147 293.9% 4,603 8,690 (4,087) -47.0%
Telecom incl Mobiles Corporate 887 842 45 5.3% 2,503 2,526 (23) -0.9%
Vehicle Leases 466 466 - 0.1% 1,399 1,398 1 0.1%
Vehicle Operating Costs 973 1,250 (277) -22.1% 2,929 3,750 (821) -21.9%
Total Corporate Support Expenses 35,459 38,818 (3,359) -8.7% 101,519 115,940 (14,421) -12.4%
429
Profit & Loss
Profit & Loss September 2018 | Destination Wairarapa Inc. | 10 October 2018 Page 3 of 4
Actual Budget Var NZD Var % YTD Actual YTD Budget Var NZD Var %
Total I-Site Expenses Electricity i-SITEs 307 375 (68) -18.1% 956 1,125 (169) -15.0%
Kitchen Supplies i-SITEs 43 41 2 5.4% 148 123 25 20.6%
Less Cost of Sales 152 100 52 52.3% 1,145 400 745 186.2%
Office Supplies i-SITEs 29 49 (20) -41.5% 66 147 (81) -55.1%
Personnel incl Training & Conferences i-SITEs 480 158 322 203.8% 1,807 474 1,333 281.2%
Photocopier i-SITEs 44 33 11 33.3% 44 99 (55) -55.6%
Rent & Rates i-SITEs 667 1,750 (1,083) -61.9% 3,343 5,250 (1,908) -36.3%
Repairs & Maintenance i-SITEs - - - 0.0% - 100 (100) -100.0%
Telecom i-SITEs 413 375 38 10.2% 1,185 1,125 60 5.4%
Travel & Transport - - - 0.0% 24 - 24 0.0%
Wages 12,489 12,800 (311) -2.4% 36,325 38,400 (2,075) -5.4%
Total Total I-Site Expenses 14,625 15,681 (1,056) -6.7% 45,042 47,243 (2,201) -4.7%
Total Marketing Expenses Advertising 395 - 395 0.0% 395 - 395 0.0%
Business Events Marketing - 1,000 (1,000) -100.0% 203 2,000 (1,797) -89.8%
CNZWT Marketing - - - 0.0% - 2,500 (2,500) -100.0%
Distribution 759 925 (166) -17.9% 2,801 2,775 26 0.9%
Domestic Marketing 565 583 (18) -3.1% 1,239 1,749 (510) -29.1%
Domestic Marketing Email Distribution - 500 (500) -100.0% 545 1,500 (955) -63.7%
Domestic Marketing Facebook - 240 (240) -100.0% 187 720 (533) -74.0%
Domestic Marketing Spring Campaign 211 - 211 0.0% 211 - 211 0.0%
Domestic Marketing Winter Campaign - - - 0.0% - 2,000 (2,000) -100.0%
Domstic Marketing Consumer Expos - - - 0.0% 37 400 (363) -90.8%
430

Profit & Loss
Profit & Loss September 2018 | Destination Wairarapa Inc. | 10 October 2018 Page 4 of 4
Actual Budget Var NZD Var % YTD Actual YTD Budget Var NZD Var %Imagery 280 - 280 0.0% 1,130 - 1,130 0.0%
International Marketing Alliance - 400 (400) -100.0% - 400 (400) -100.0%
Media Hosting 611 500 111 22.3% 864 1,500 (636) -42.4%
Relationship Marketing 173 67 106 157.6% 646 201 445 221.5%
Rimutaka Cycle Trail 415 - 415 0.0% 751 5,000 (4,249) -85.0%
Trade Events & Training 144 583 (439) -75.3% 659 1,749 (1,090) -62.3%
Trade Famils - 250 (250) -100.0% 404 750 (346) -46.2%
Visitor Guide - 1,200 (1,200) -100.0% - 1,200 (1,200) -100.0%
Website 357 583 (226) -38.7% 2,119 1,749 370 21.2%
Total Total Marketing Expenses 3,911 6,831 (2,920) -42.8% 12,192 26,193 (14,001) -53.5%
Total Operating Expenses 53,994 61,330 (7,336) -12.0% 158,753 189,376 (30,623) -16.2%
Operating Profit (36,187) (36,815) 628 2.0% 16,488 (16,824) 33,312 198.0%
Non-operating Expenses Entertainment - Non deductible 339 333 6 1.8% 1,216 999 217 21.7%
Total Non-operating Expenses 339 333 6 1.8% 1,216 999 217 21.7%
Net Profit (36,526) (37,148) 622 2.0% 15,273 (17,823) 33,096 186.0%
431

To: Audit & Risk Committee
From: David Paris, Manager Finance
Endorsed by:
Kath Ross, Chief Executive
Date: 21 November 2018
Subject: 2018/19 Three Months to Date Financial Report
FOR INFORMATION
Recommendation:
That the Audit & Risk Committee receives the 3 months to date f inancial report and
commentary, including Operating and Capital Expenditure Statements.
Purpose
The purpose of this report is to provide the Audit and Risk Committee with the financial report for the three months to 30 September 2018.
Executive Summary
The Rates Requirement Summary to 30 Sept 2018 shows the Council’s net spending of rates funding at $7.88m, 4.8% less than the year to date budget. Significant variances from the budgeted position are explained in the commentary below. Overall the Council’s net spending on rates‐funded activities is on‐track after 3 months of the financial year.
The Statement of Revenue & Expenditure shows a small YTD accounting surplus of $61,617. This is $722,400 better than the planned YTD deficit, due in large part to more Operating Revenue. Two components of revenue better than planned are:
‐ NZTA subsidies are more than expected due to a higher level of Roading expenditure in the first quarter than expected; and
‐ Financial Contributions from subdivision developments have continued their positive performance and are well ahead (142%) of the planned level YTD.
In the expenditure area, personnel costs are running 10.8% underspent as a number of vacant positions were not filled in the first quarter. Timing variances between budget and actual also account for some of the variance. Other operating expenditure savings amount to 1% of the YTD budget.
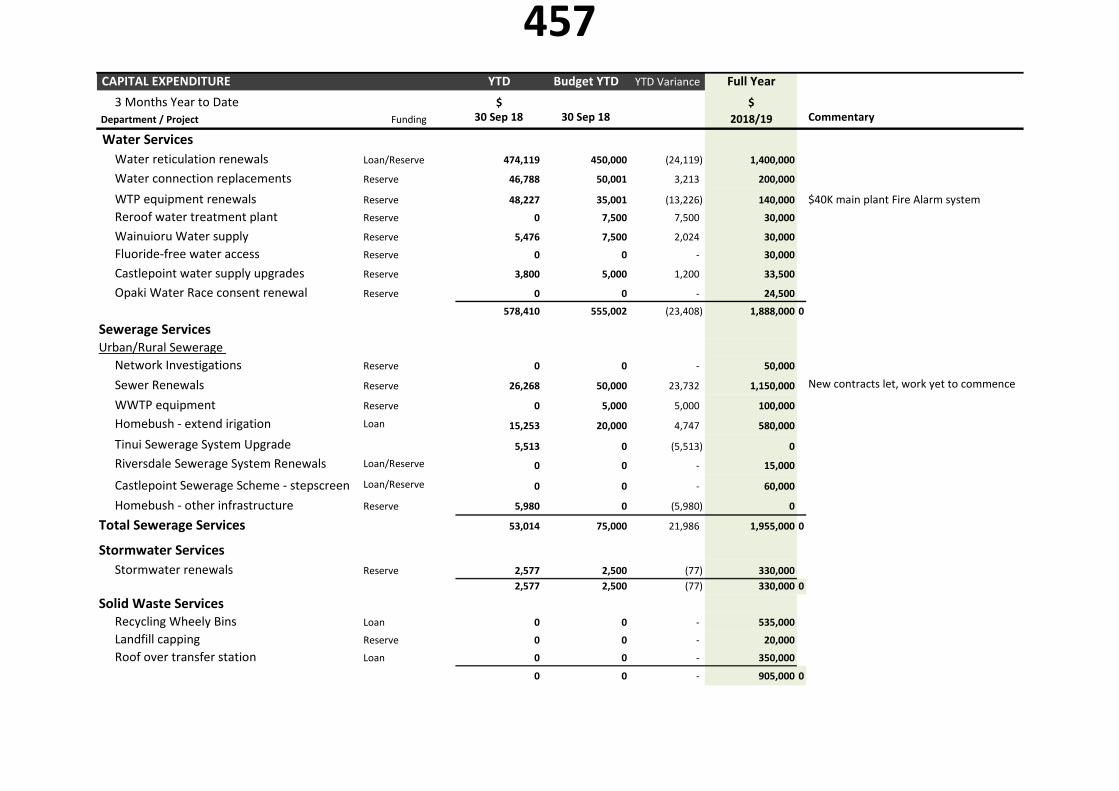
The Summary Statement of Capital Expenditure for the first quarter shows $2.7m spent, which is 15% of the full year capital budget (last year it was 10% at 3 months to date). The detailed schedule is included at the end of this report. Some commentary on variances is included in the capital statements, but further work is being done to forecast the extent to which each of the capital projects or financial provisions will be completed/spent by 30 June 2019. This work will come to the Council’s strategy day in late January.
Commentary on Operating/Funding Statements
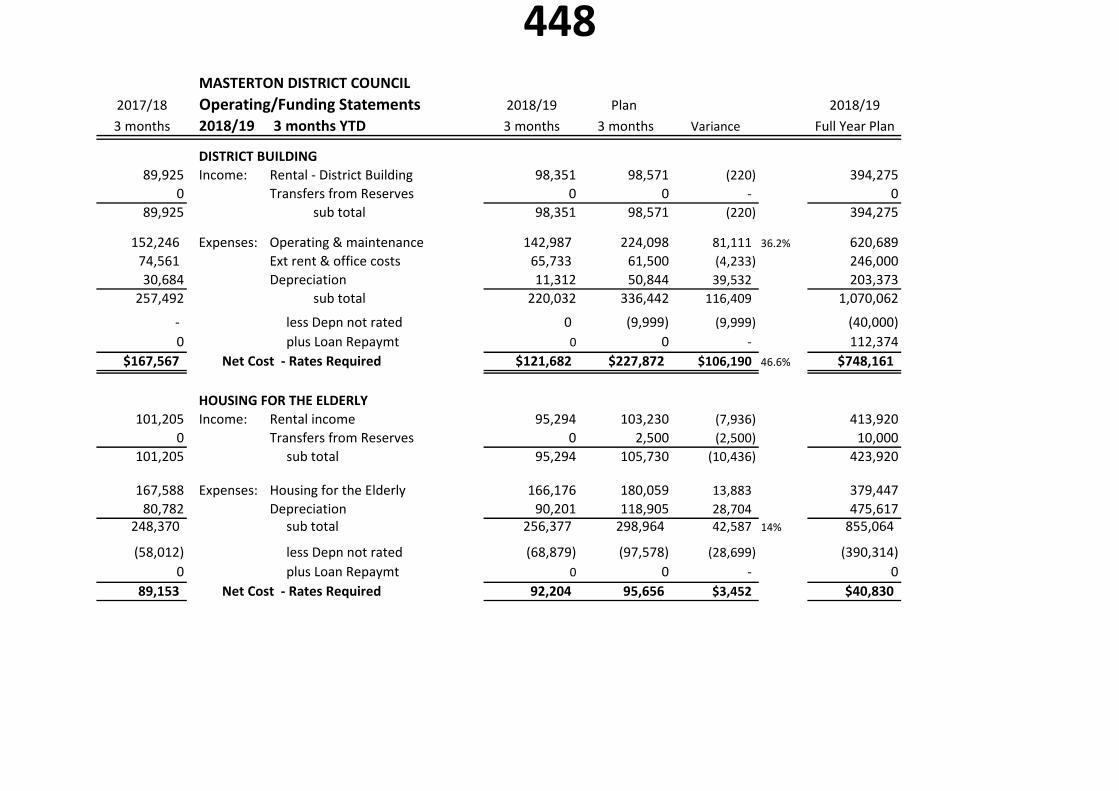
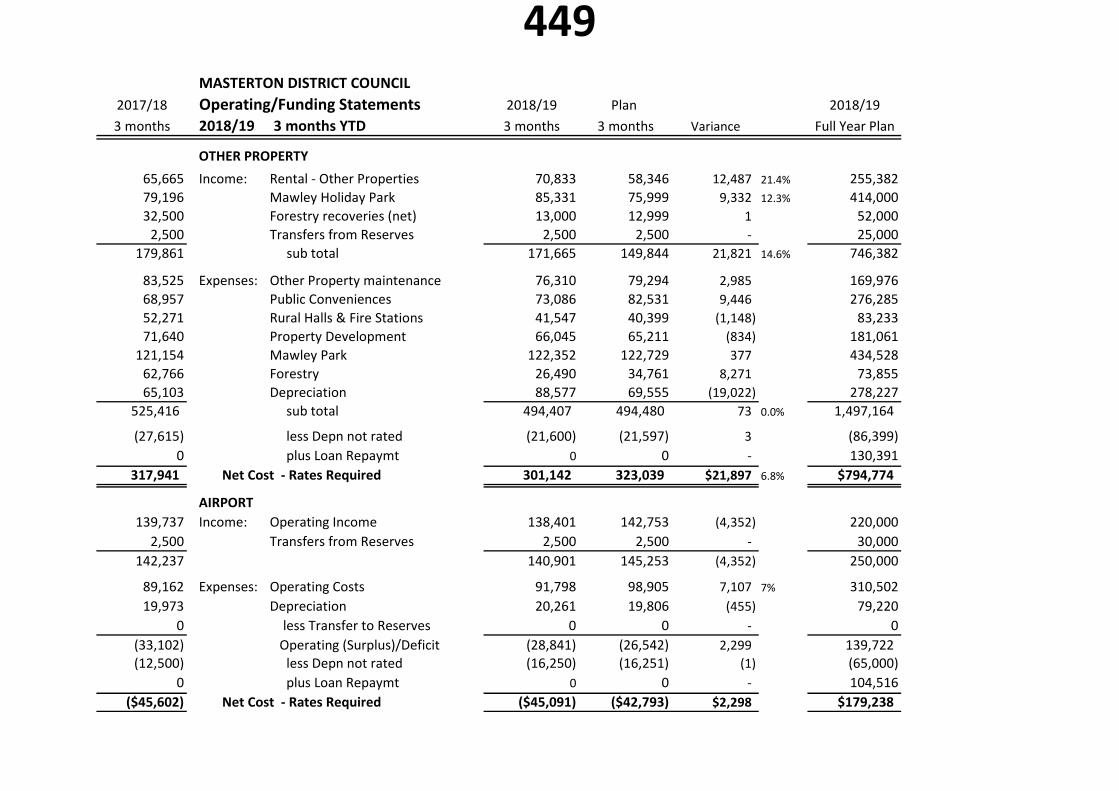
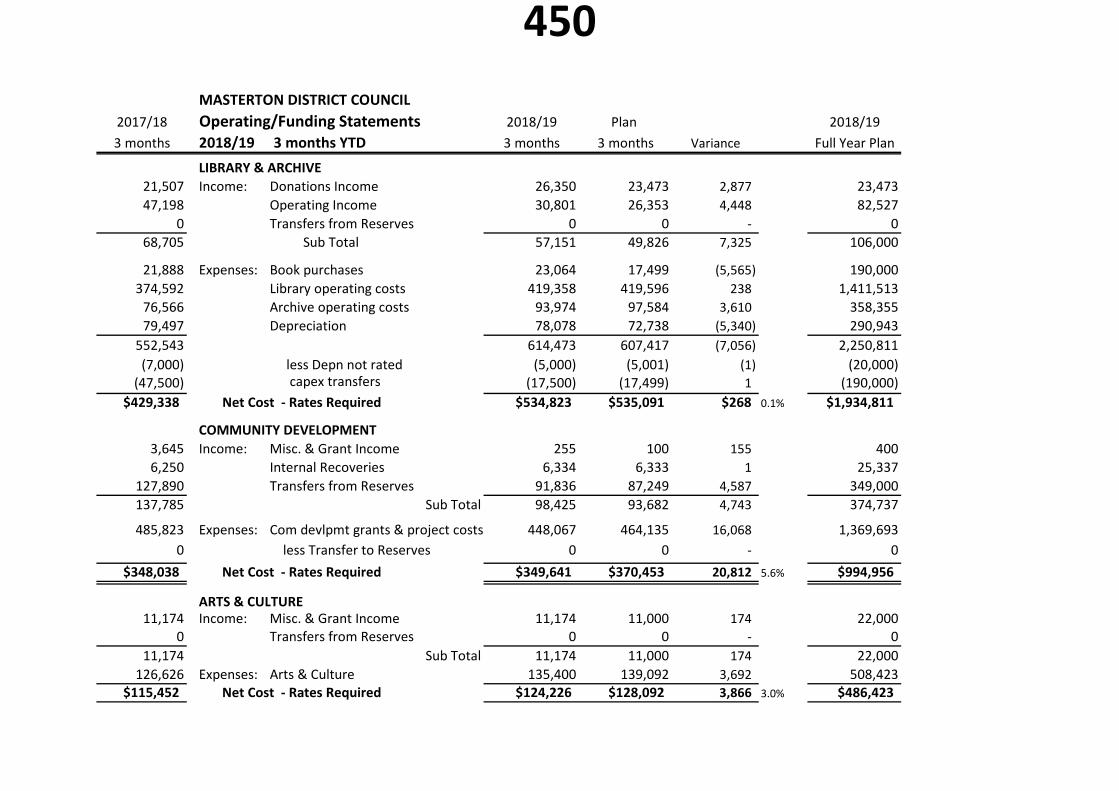
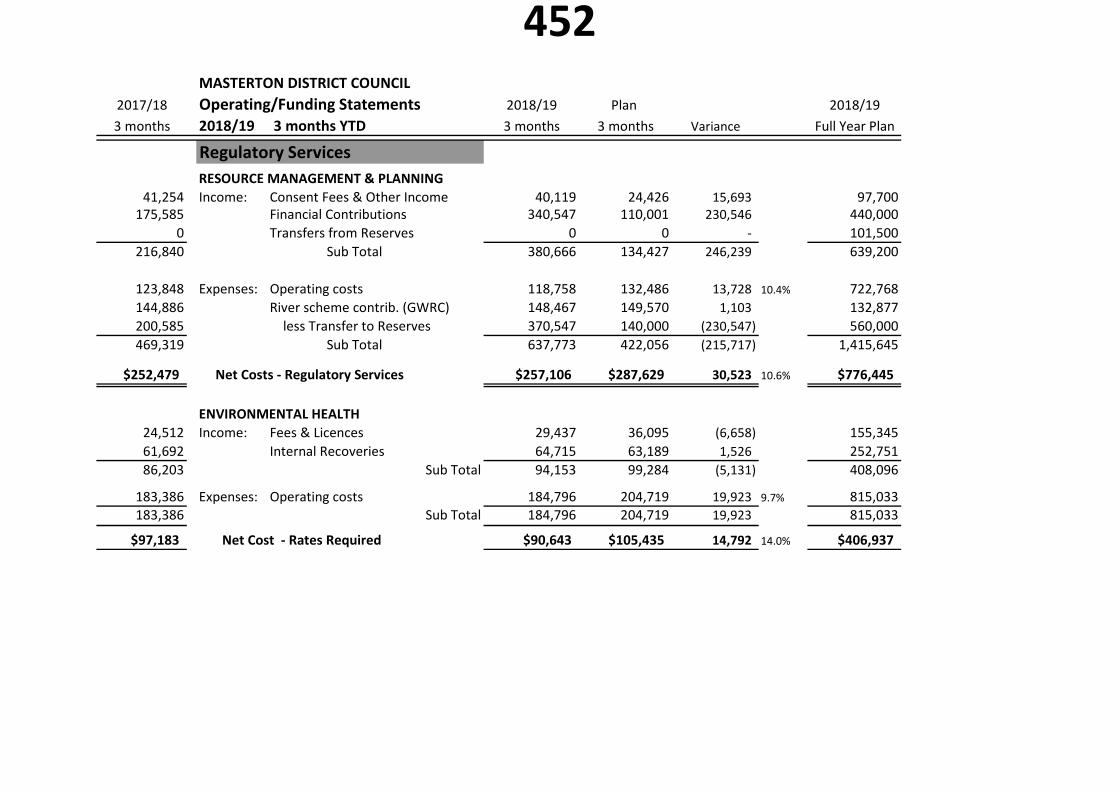
This commentary should be read in conjunction with the Operating/Funding Statements for the 3 months to 30 September 2018 for each of the Council’s operating areas, as listed on the following pages.
247/18
438

The variances shown may not translate to the full year result, but the Plan figures for three months to date have been adjusted to match expected timing of income and expenditure, where known.
In the Activity areas:
Roading has run above the planned rates required as a number of renewals contracts wereprogressed in the first three months of the year. These include footpaths, kerbing androadmarking. It is expected that these are timing variances that will even out over thebalance of the year.
District Building has realised savings vs Plan as the Plan allowed for Waiata House costs suchas rates, insurance, depreciation and loan interest. External rent on Public Trust was alloweduntil September.
Economic development spending reflects the costs of the My Masterton supplement andother promotional activity that took place in Aug/Sept and that were committed from theprior year to come from the well‐beings budget. Overall, the economic development area isexpected to be within budget by year end.
Resource Mgmt & Planning better than Plan reflects the higher level of resource consent feeincome from subdivision developments than planned.
Building Services revenue is 18.3% ahead of the plan, but costs of processing the highvolumes of consents are also up. Legal costs more than Plan have also offset the higher thanplan income.
Internal functions overall show $86,147 in net costs less than planned. Savings have beengenerated largely from several staffing roles that have yet to be filled.
Rates Receivable
The graph below provides a picture of the changes in the value of rates receivable by quarter.
-
100,000
200,000
300,000
400,000
500,000
600,000
700,000
800,000
900,000
1,000,000
Quarterly Rates Receivable Movements Current Year
Prior Years Arrears
Total Rates
439

At the end of September 2018, the rates arrears from the prior year were $290,580 which is 56.4% of the balance of all arrears at 30 June 2018. This compares to $302,519 and 58.7% at 30 Sept 2017.
Current year rates unpaid at 30 September 2018 were $511,710 compared to $415,189 at 30 Sept 2017. Debt collection activity in the last quarter includes writing to mortgagees of properties with arrears, requiring them to clear the rates outstanding.
Statement of Revenue & Expenditure
3 Months Year to Date ‐ Draft to 30 Sept 2018 3 months 3 months
Revenue2017/18
Actual
2017/18
Plan Variance
Full Year
2017/18
Rates Revenue* 6,977,352 6,975,602 1,750 0.0% 29,459,396
Interest Received (external) 167,653 174,000 (6,347) ‐3.6% 697,800
NZTA Roading Subsidies 1,583,395 1,478,394 105,001 7.1% 4,983,638
Financial Contributions 458,213 189,249 268,964 142.1% 682,000
Fees, Charges & Other Revenue 2,297,427 2,210,011 87,416 4.0% 7,834,319
Total Operating Revenue 11,484,040 11,027,256 456,784 4.1% 43,657,153
Expenses
Personnel Costs 2,146,612 2,406,240 259,628 10.8% 9,008,253
Other Operating Expenditure 5,639,361 5,698,610 59,249 1.0% 19,939,606
Interest Expense 656,400 649,542 (6,858) ‐1.1% 2,598,123
Depreciation & amortisation 2,980,050 2,933,652 (46,398) 11,734,546
Total Operating Expenses 11,422,423 11,688,044 265,621 2.3% 43,280,528
Operating Surplus/(Deficit) $61,617 ($660,788) $722,406 $376,625
*Rates on Council Properties excluded 580,418 559,000 (21,418) 559,000
440
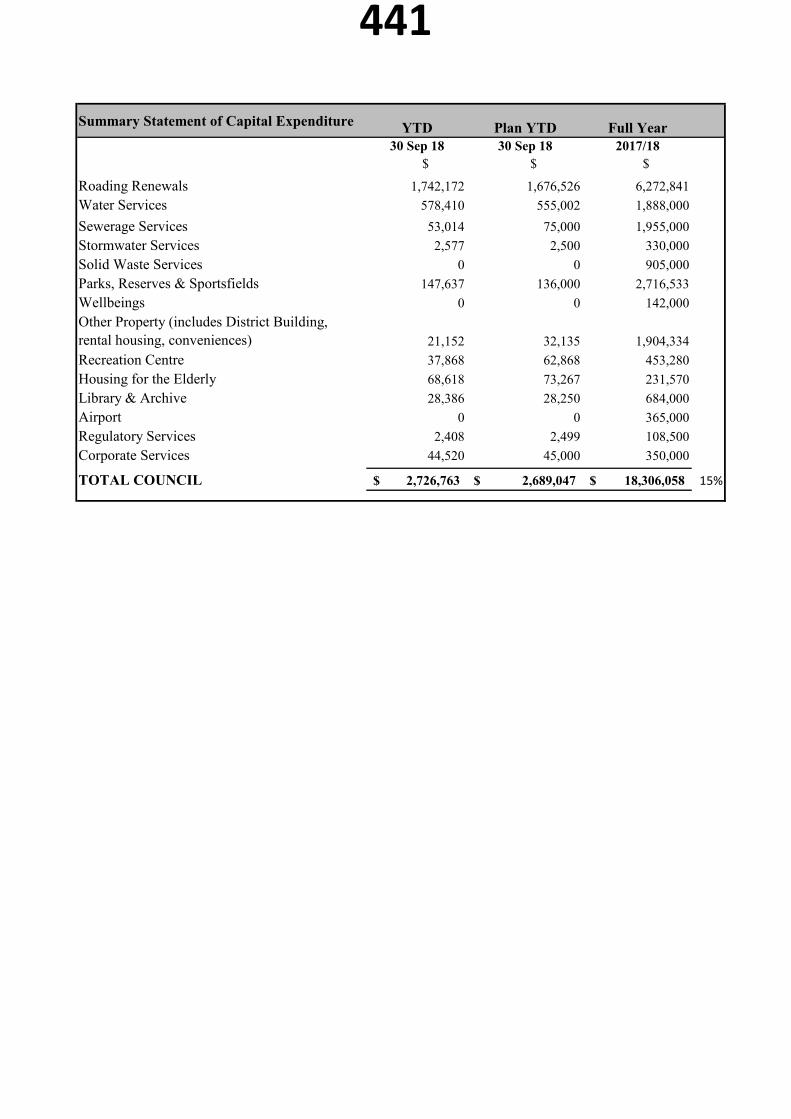
Summary Statement of Capital Expenditure YTD Plan YTD Full Year30 Sep 18 30 Sep 18 2017/18
$ $ $
Roading Renewals 1,742,172 1,676,526 6,272,841
Water Services 578,410 555,002 1,888,000
Sewerage Services 53,014 75,000 1,955,000
Stormwater Services 2,577 2,500 330,000
Solid Waste Services 0 0 905,000
Parks, Reserves & Sportsfields 147,637 136,000 2,716,533
Wellbeings 0 0 142,000
Other Property (includes District Building, rental housing, conveniences) 21,152 32,135 1,904,334
Recreation Centre 37,868 62,868 453,280
Housing for the Elderly 68,618 73,267 231,570
Library & Archive 28,386 28,250 684,000
Airport 0 0 365,000
Regulatory Services 2,408 2,499 108,500
Corporate Services 44,520 45,000 350,000
TOTAL COUNCIL 2,726,763$ 2,689,047$ 18,306,058$ 15%
441

2018/19 3 Months to 30 September 2018
2017/18 Rates Requirement Summary 2018/19 2018/19 Variance 2018/19
3 Months 3 Months YTD Plan Full Year Plan
$ RATES REQUIRED BY ACTIVITY $ $ $ % $
Transport1,480,113 Roading 1,670,284 1,650,965 (19,319) 5,982,777
Water Services
827,854 Urban Water supply 867,856 878,641 10,785 3,124,067
61,205 Rural Water supplies & races 73,466 70,978 (2,488) 94,844
Sewerage Services
1,368,531 Urban Sewerage system 1,318,142 1,356,207 38,065 6,794,503
60,036 Rural Sewerage systems 42,012 36,173 (5,839) 310,574
Stormwater Services
112,812 Stormwater 118,646 145,918 27,272 495,041
Solid Waste Services
140,772 Solid Waste Services 140,662 173,882 33,220 636,804
161,692 Waste Minimisation Services 75,141 79,849 4,709 348,707
Community Facilities/Activities
601,970 Parks, Reserves & Sportsfields 680,071 703,050 22,979 2,458,917
266,966 Trust House Recreation Centre 299,855 298,125 (1,730) 935,884
13,042 Cemeteries 17,938 25,062 7,124 89,233
429,338 Library & Archive 534,823 535,085 262 1,934,811
167,567 District Building 121,682 227,874 106,192 748,161
89,153 Housing for Elderly 92,204 95,659 3,455 40,830
241,109 Other Property 252,931 257,105 4,175 695,359
(45,602) Hood Airport (45,091) (42,793) 2,298 179,238
76,832 Mawley Holiday Park 48,212 65,936 17,724 99,416
Community Wellbeing
348,038 Community Development 349,641 370,457 20,816 994,956
115,452 Arts & Culture 124,226 128,092 3,866 486,423
259,994 Economic Devlpmt & Promo 268,373 252,710 (15,663) 993,757
‐ Environmental Initiatives 41,526 54,486 12,960 164,268
Planning & Regulatory Services
252,479 Resource Mgmt & Planning 257,106 287,625 30,519 776,445
34,226 Building Development 101,008 94,970 (6,038) 334,701
97,183 Environmental Services 90,643 105,436 14,793 406,937
(6,417) Parking Control (16,077) (12,537) 3,540 (50,142)
(392) Animal Services 18,370 18,173 (197) 73,202
44,120 Emergency Management 51,977 53,785 1,808 215,120
Governance
172,452 Representation 165,082 163,348 (1,734) 653,569
87,622 Internal Functions (net) 124,428 210,575 86,147 1
$ 7,458,147 Total Rates Requirement $ 7,885,137 $ 8,284,836 $ 399,699 4.8% $ 30,018,406
RATES INCOME7,098,609 Masterton District Council rates* 7,509,953 7,484,602 25,351 29,938,406
80,827 Penalty Income 89,952 80,000 9,952 200,000
(40,858) Rates Remissions (42,135) (30,000) (12,135) (120,000)
Discounts Given ‐ ‐
$ 7,138,578 Net Rates Income $ 7,557,770 $ 7,534,602 $ 23,168 0.3% $ 30,018,406
($319,569) Surplus/(Deficit) of Rates Income ($327,367) ($750,233) $ 422,868 5.1% $ 0
55,836 * Rural sewerage capital contrib. 33,989 20,633 13,356 82,532
included in Rates Income
*Rates on Council Properties included 580,418 559,000 21,418 559,000
442

MASTERTON DISTRICT COUNCIL
2017/18 Operating/Funding Statements 2018/19 Plan 2018/19
3 months 2018/19 3 months YTD 3 months 3 months Variance % Full Year Plan
RoadingROADS, STREETS, FOOTPATHS & PARKING AREAS
917,300 Income: NZTA subsidies 1,583,395 1,478,394 105,001 4,983,638
135,654 Petrol Tax & Other Income 174,495 98,499 75,996 441,170
18,750 Transfers from Reserves 236,572 171,951 64,621 687,807
1,071,705 Sub Total 1,994,462 1,748,844 245,618 14.0% 6,112,615
1,159,013 Expenses: Subsidised Maintenance 1,163,774 1,027,248 (136,525) ‐13.3% 4,331,385
597,975 Subsidised Renewals 1,674,239 1,646,528 (27,711) 4,562,034
0 Flood Damage 27,846 27,939 93 500,000
1,345 Construction (streetlights) 36,971 0 (36,971) 0
89,337 Non‐Subsidised ‐ Rural 62,028 88,359 26,331 216,187
359,983 Non‐Subsidised ‐ Urban Maintenanc 396,129 383,642 (12,487) 1,004,259
35,640 Non‐Subsidised ‐ Urban Renewals 0 0 ‐ 540,807
1,218,617 Depreciation 1,274,095 1,274,094 (1) 5,096,378
73,749 less Transfer to Reserves 117,666 40,000 (77,666) 160,000
3,535,657 Sub Total 4,752,748 4,487,810 (264,938) ‐5.9% 16,411,050
(983,840) less Depn not rated (1,088,002) (1,088,001) 1 (4,352,006)
0 plus Loan Repaymt 0 0 ‐ 36,348
plus Capex funded from rates 0
$1,480,113 Net Cost ‐ Rates Required $1,670,284 $1,650,965 (19,319) ‐1.2% $5,982,777
443
MASTERTON DISTRICT COUNCIL
2017/18 Operating/Funding Statements 2018/19 Plan 2018/19
3 months 2018/19 3 months YTD 3 months 3 months Variance Full Year Plan
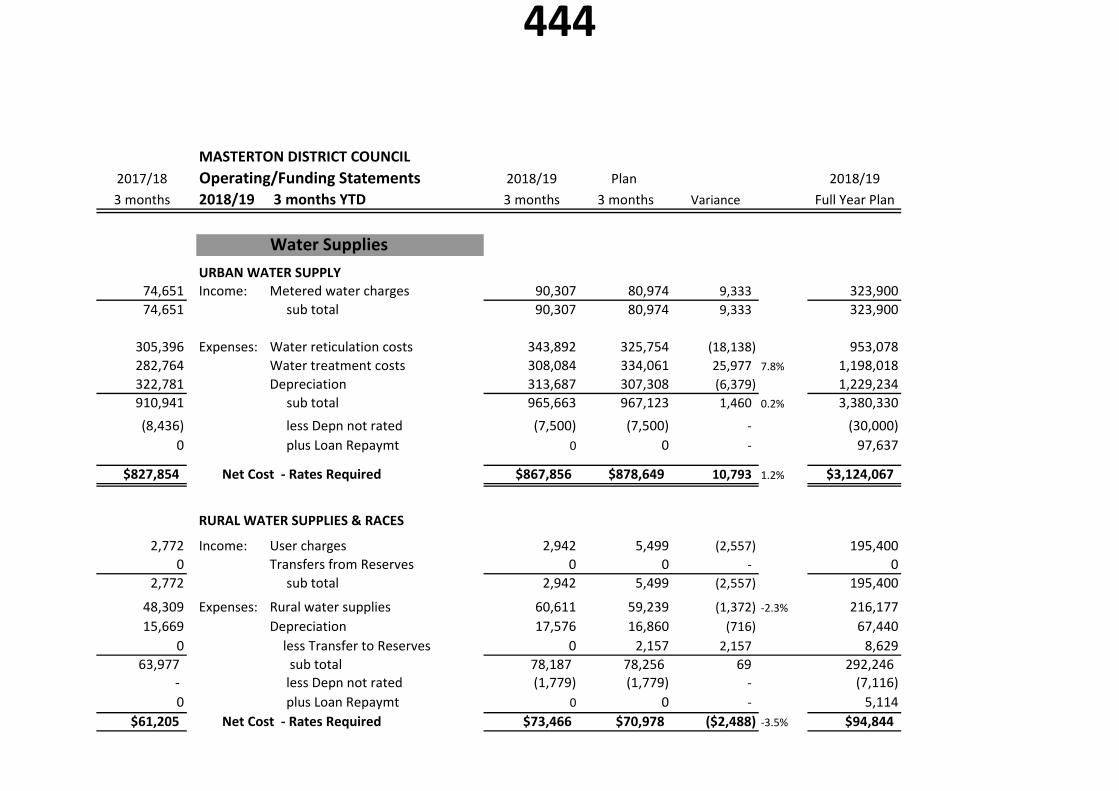
Water Supplies
URBAN WATER SUPPLY74,651 Income: Metered water charges 90,307 80,974 9,333 323,900
74,651 sub total 90,307 80,974 9,333 323,900
305,396 Expenses: Water reticulation costs 343,892 325,754 (18,138) 953,078
282,764 Water treatment costs 308,084 334,061 25,977 7.8% 1,198,018
322,781 Depreciation 313,687 307,308 (6,379) 1,229,234
910,941 sub total 965,663 967,123 1,460 0.2% 3,380,330
(8,436) less Depn not rated (7,500) (7,500) ‐ (30,000)
0 plus Loan Repaymt 0 0 ‐ 97,637
$827,854 Net Cost ‐ Rates Required $867,856 $878,649 10,793 1.2% $3,124,067
RURAL WATER SUPPLIES & RACES
2,772 Income: User charges 2,942 5,499 (2,557) 195,400
0 Transfers from Reserves 0 0 ‐ 0
2,772 sub total 2,942 5,499 (2,557) 195,400
48,309 Expenses: Rural water supplies 60,611 59,239 (1,372) ‐2.3% 216,177
15,669 Depreciation 17,576 16,860 (716) 67,440
0 less Transfer to Reserves 0 2,157 2,157 8,629
63,977 sub total 78,187 78,256 69 292,246 ‐ less Depn not rated (1,779) (1,779) ‐ (7,116)
0 plus Loan Repaymt 0 0 ‐ 5,114
$61,205 Net Cost ‐ Rates Required $73,466 $70,978 ($2,488) ‐3.5% $94,844
444
2017/18 Operating/Funding Statements 2018/19 Plan 2018/19
3 months 2018/19 3 months YTD 3 months 3 months Variance Full Year Plan
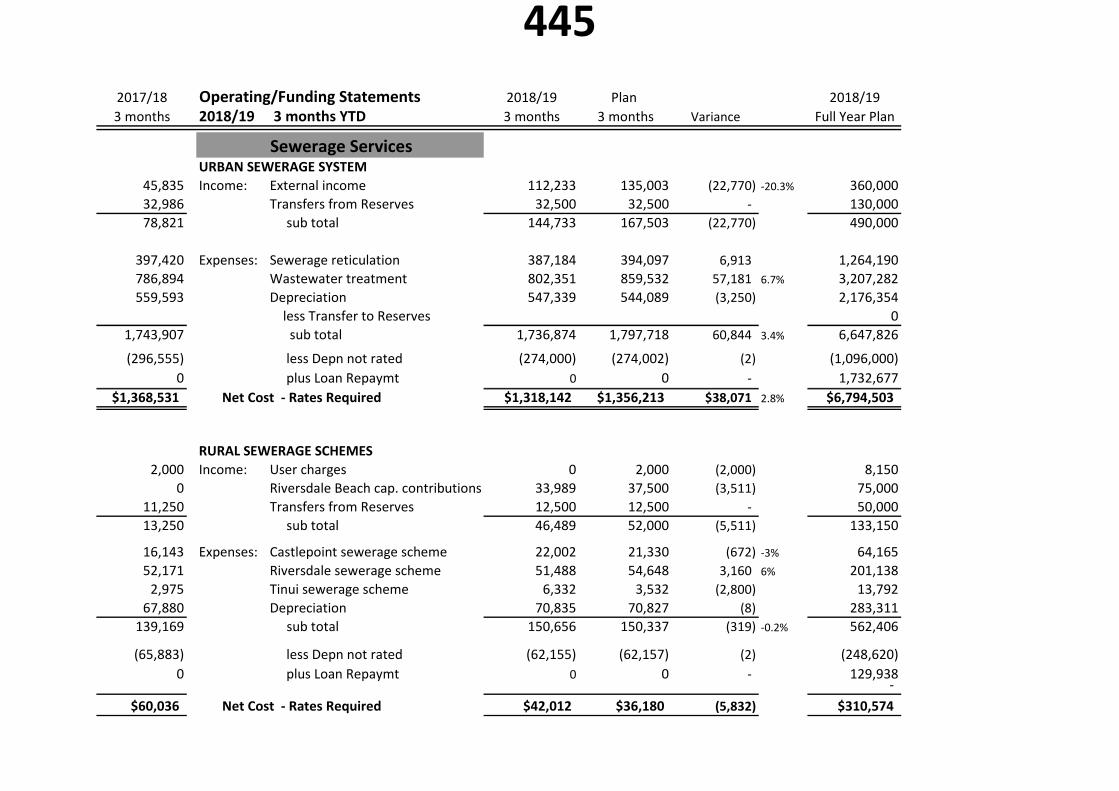
Sewerage ServicesURBAN SEWERAGE SYSTEM
45,835 Income: External income 112,233 135,003 (22,770) ‐20.3% 360,000
32,986 Transfers from Reserves 32,500 32,500 ‐ 130,000
78,821 sub total 144,733 167,503 (22,770) 490,000
397,420 Expenses: Sewerage reticulation 387,184 394,097 6,913 1,264,190
786,894 Wastewater treatment 802,351 859,532 57,181 6.7% 3,207,282
559,593 Depreciation 547,339 544,089 (3,250) 2,176,354
less Transfer to Reserves 0
1,743,907 sub total 1,736,874 1,797,718 60,844 3.4% 6,647,826
(296,555) less Depn not rated (274,000) (274,002) (2) (1,096,000)
0 plus Loan Repaymt 0 0 ‐ 1,732,677
$1,368,531 Net Cost ‐ Rates Required $1,318,142 $1,356,213 $38,071 2.8% $6,794,503
RURAL SEWERAGE SCHEMES
2,000 Income: User charges 0 2,000 (2,000) 8,150
0 Riversdale Beach cap. contributions 33,989 37,500 (3,511) 75,000
11,250 Transfers from Reserves 12,500 12,500 ‐ 50,000
13,250 sub total 46,489 52,000 (5,511) 133,150
16,143 Expenses: Castlepoint sewerage scheme 22,002 21,330 (672) ‐3% 64,165
52,171 Riversdale sewerage scheme 51,488 54,648 3,160 6% 201,138
2,975 Tinui sewerage scheme 6,332 3,532 (2,800) 13,792
67,880 Depreciation 70,835 70,827 (8) 283,311
139,169 sub total 150,656 150,337 (319) ‐0.2% 562,406
(65,883) less Depn not rated (62,155) (62,157) (2) (248,620)
0 plus Loan Repaymt 0 0 ‐ 129,938‐
$60,036 Net Cost ‐ Rates Required $42,012 $36,180 (5,832) $310,574
445

MASTERTON DISTRICT COUNCIL2017/18 Operating/Funding Statements 2018/19 Plan 2018/19
3 months 2018/19 3 months YTD 3 months 3 months Variance Full Year Plan
StormwaterSTORMWATER
0 Income: Miscellaneous income 0 0 ‐ 0
33,750 Transfers from Reserves 33,750 33,750 ‐ 205,000
33,750 sub total 33,750 33,750 ‐ 205,000
111,341 Expenses: Stormwater maintenance 86,537 113,808 27,271 407,404
72,965 Depreciation 73,109 73,110 1 292,436
184,306 sub total 159,646 186,918 27,272 699,840
(37,744) less Depn not rated (7,250) (7,251) (1) (29,000)
0 plus Loan Repaymt 0 0 ‐ 29,201
$112,812 Net Cost ‐ Rates Required $118,646 $145,917 27,271 18.7% $495,041
Solid WasteSOLID WASTE MANAGEMENT
81,903 Income: Refuse bag recoveries 87,382 93,204 (5,822) ‐6.2% 372,810
600,592 Transfer station gate fees 689,288 640,988 48,300 7.5% 2,660,925
23,750 Waste levy recovery 23,201 23,750 (549) 70,000
0 Transfers from Reserves 0 5,001 (5,001) 20,000
706,245 sub total 799,871 762,943 36,928 4.8% 3,123,735
94,086 Expenses: Refuse Collection 102,554 106,578 4,024 3.8% 426,310
618,643 Waste transfer & disposal 555,928 552,856 (3,072) ‐0.6% 2,204,551
259,388 Recycling & Composting 307,472 312,727 5,255 1.7% 1,197,753
56,320 Rural Landfills 69,720 64,509 (5,211) 248,925
1,028,438 sub total 1,035,673 1,036,670 997 0.1% 4,077,539
0 less Transfer to Reserves 0 0 ‐ 0
(19,729) less Depn not rated (20,000) (20,001) (1) (80,000)
0 plus Loan Repaymt 0 0 ‐ 111,707
$302,464 Net Cost ‐ Rates Required $215,803 $253,726 37,923 14.9% $985,511
446
MASTERTON DISTRICT COUNCIL
2017/18 Operating/Funding Statements 2018/19 Plan 2018/19
3 months 2018/19 3 months YTD 3 months 3 months Variance Full Year Plan
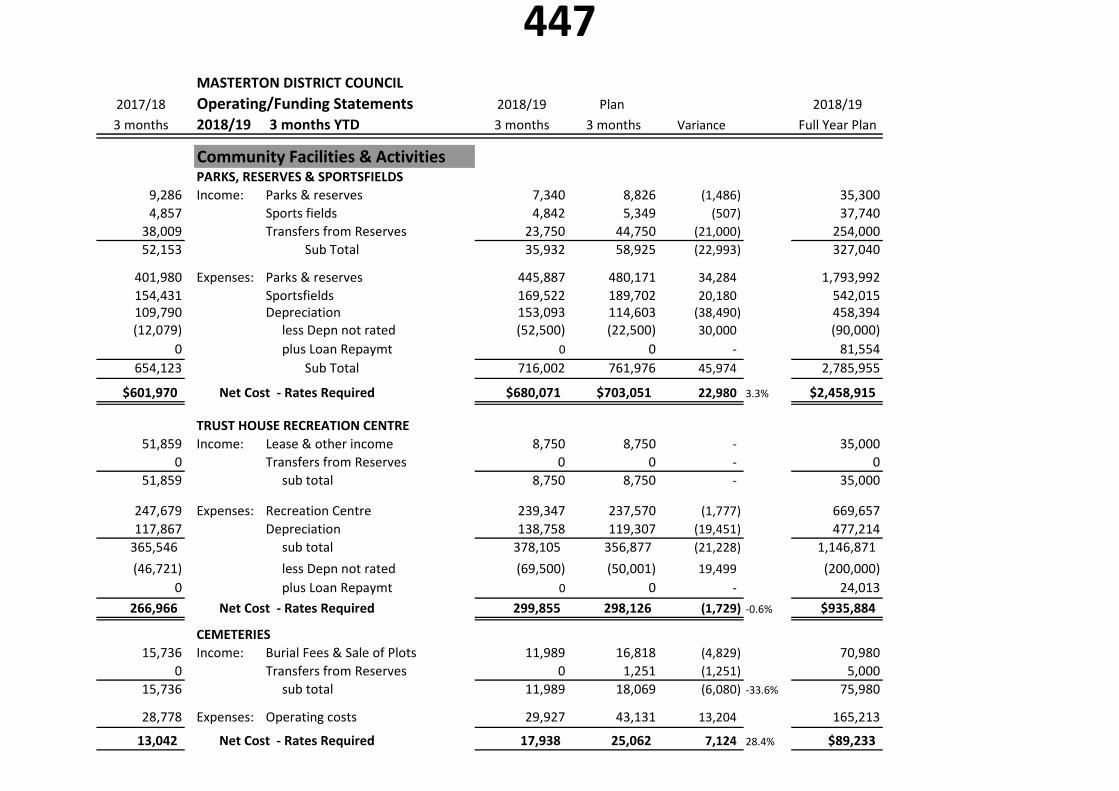
Community Facilities & Activities PARKS, RESERVES & SPORTSFIELDS
9,286 Income: Parks & reserves 7,340 8,826 (1,486) 35,300
4,857 Sports fields 4,842 5,349 (507) 37,740
38,009 Transfers from Reserves 23,750 44,750 (21,000) 254,000
52,153 Sub Total 35,932 58,925 (22,993) 327,040
401,980 Expenses: Parks & reserves 445,887 480,171 34,284 1,793,992
154,431 Sportsfields 169,522 189,702 20,180 542,015109,790 Depreciation 153,093 114,603 (38,490) 458,394(12,079) less Depn not rated (52,500) (22,500) 30,000 (90,000)
0 plus Loan Repaymt 0 0 ‐ 81,554
654,123 Sub Total 716,002 761,976 45,974 2,785,955
$601,970 Net Cost ‐ Rates Required $680,071 $703,051 22,980 3.3% $2,458,915
TRUST HOUSE RECREATION CENTRE
51,859 Income: Lease & other income 8,750 8,750 ‐ 35,000
0 Transfers from Reserves 0 0 ‐ 0
51,859 sub total 8,750 8,750 ‐ 35,000
247,679 Expenses: Recreation Centre 239,347 237,570 (1,777) 669,657
117,867 Depreciation 138,758 119,307 (19,451) 477,214
365,546 sub total 378,105 356,877 (21,228) 1,146,871
(46,721) less Depn not rated (69,500) (50,001) 19,499 (200,000)
0 plus Loan Repaymt 0 0 ‐ 24,013
266,966 Net Cost ‐ Rates Required 299,855 298,126 (1,729) ‐0.6% $935,884
CEMETERIES
15,736 Income: Burial Fees & Sale of Plots 11,989 16,818 (4,829) 70,980
0 Transfers from Reserves 0 1,251 (1,251) 5,000
15,736 sub total 11,989 18,069 (6,080) ‐33.6% 75,980
28,778 Expenses: Operating costs 29,927 43,131 13,204 165,213
13,042 Net Cost ‐ Rates Required 17,938 25,062 7,124 28.4% $89,233
447
MASTERTON DISTRICT COUNCIL
2017/18 Operating/Funding Statements 2018/19 Plan 2018/19
3 months 2018/19 3 months YTD 3 months 3 months Variance Full Year Plan
DISTRICT BUILDING
89,925 Income: Rental ‐ District Building 98,351 98,571 (220) 394,275
0 Transfers from Reserves 0 0 ‐ 0
89,925 sub total 98,351 98,571 (220) 394,275
152,246 Expenses: Operating & maintenance 142,987 224,098 81,111 36.2% 620,689
74,561 Ext rent & office costs 65,733 61,500 (4,233) 246,000
30,684 Depreciation 11,312 50,844 39,532 203,373
257,492 sub total 220,032 336,442 116,409 1,070,062
‐ less Depn not rated 0 (9,999) (9,999) (40,000)
0 plus Loan Repaymt 0 0 ‐ 112,374
$167,567 Net Cost ‐ Rates Required $121,682 $227,872 $106,190 46.6% $748,161
HOUSING FOR THE ELDERLY
101,205 Income: Rental income 95,294 103,230 (7,936) 413,920
0 Transfers from Reserves 0 2,500 (2,500) 10,000
101,205 sub total 95,294 105,730 (10,436) 423,920
167,588 Expenses: Housing for the Elderly 166,176 180,059 13,883 379,447
80,782 Depreciation 90,201 118,905 28,704 475,617248,370 sub total 256,377 298,964 42,587 14% 855,064
(58,012) less Depn not rated (68,879) (97,578) (28,699) (390,314)
0 plus Loan Repaymt 0 0 ‐ 0
89,153 Net Cost ‐ Rates Required 92,204 95,656 $3,452 $40,830
448
MASTERTON DISTRICT COUNCIL
2017/18 Operating/Funding Statements 2018/19 Plan 2018/19
3 months 2018/19 3 months YTD 3 months 3 months Variance Full Year Plan
OTHER PROPERTY
65,665 Income: Rental ‐ Other Properties 70,833 58,346 12,487 21.4% 255,382
79,196 Mawley Holiday Park 85,331 75,999 9,332 12.3% 414,000
32,500 Forestry recoveries (net) 13,000 12,999 1 52,000
2,500 Transfers from Reserves 2,500 2,500 ‐ 25,000
179,861 sub total 171,665 149,844 21,821 14.6% 746,382
83,525 Expenses: Other Property maintenance 76,310 79,294 2,985 169,976
68,957 Public Conveniences 73,086 82,531 9,446 276,285
52,271 Rural Halls & Fire Stations 41,547 40,399 (1,148) 83,233
71,640 Property Development 66,045 65,211 (834) 181,061
121,154 Mawley Park 122,352 122,729 377 434,528
62,766 Forestry 26,490 34,761 8,271 73,855
65,103 Depreciation 88,577 69,555 (19,022) 278,227
525,416 sub total 494,407 494,480 73 0.0% 1,497,164
(27,615) less Depn not rated (21,600) (21,597) 3 (86,399)
0 plus Loan Repaymt 0 0 ‐ 130,391
317,941 Net Cost ‐ Rates Required 301,142 323,039 $21,897 6.8% $794,774
AIRPORT
139,737 Income: Operating Income 138,401 142,753 (4,352) 220,000
2,500 Transfers from Reserves 2,500 2,500 ‐ 30,000
142,237 140,901 145,253 (4,352) 250,000
89,162 Expenses: Operating Costs 91,798 98,905 7,107 7% 310,502
19,973 Depreciation 20,261 19,806 (455) 79,220
0 less Transfer to Reserves 0 0 ‐ 0
(33,102) Operating (Surplus)/Deficit (28,841) (26,542) 2,299 139,722 (12,500) less Depn not rated (16,250) (16,251) (1) (65,000)
0 plus Loan Repaymt 0 0 ‐ 104,516
($45,602) Net Cost ‐ Rates Required ($45,091) ($42,793) $2,298 $179,238
449
MASTERTON DISTRICT COUNCIL
2017/18 Operating/Funding Statements 2018/19 Plan 2018/19
3 months 2018/19 3 months YTD 3 months 3 months Variance Full Year Plan
LIBRARY & ARCHIVE
21,507 Income: Donations Income 26,350 23,473 2,877 23,473
47,198 Operating Income 30,801 26,353 4,448 82,527
0 Transfers from Reserves 0 0 ‐ 0
68,705 Sub Total 57,151 49,826 7,325 106,000
21,888 Expenses: Book purchases 23,064 17,499 (5,565) 190,000
374,592 Library operating costs 419,358 419,596 238 1,411,513
76,566 Archive operating costs 93,974 97,584 3,610 358,355
79,497 Depreciation 78,078 72,738 (5,340) 290,943
552,543 614,473 607,417 (7,056) 2,250,811
(7,000) less Depn not rated (5,000) (5,001) (1) (20,000) (47,500) capex transfers (17,500) (17,499) 1 (190,000)
$429,338 Net Cost ‐ Rates Required $534,823 $535,091 $268 0.1% $1,934,811
COMMUNITY DEVELOPMENT
3,645 Income: Misc. & Grant Income 255 100 155 400
6,250 Internal Recoveries 6,334 6,333 1 25,337
127,890 Transfers from Reserves 91,836 87,249 4,587 349,000
137,785 Sub Total 98,425 93,682 4,743 374,737
485,823 Expenses: Com devlpmt grants & project costs 448,067 464,135 16,068 1,369,693
0 less Transfer to Reserves 0 0 ‐ 0
$348,038 Net Cost ‐ Rates Required $349,641 $370,453 20,812 5.6% $994,956
ARTS & CULTURE11,174 Income: Misc. & Grant Income 11,174 11,000 174 22,000
0 Transfers from Reserves 0 0 ‐ 0
11,174 Sub Total 11,174 11,000 174 22,000
126,626 Expenses: Arts & Culture 135,400 139,092 3,692 508,423$115,452 Net Cost ‐ Rates Required $124,226 $128,092 3,866 3.0% $486,423
450

MASTERTON DISTRICT COUNCIL2017/18 Operating/Funding Statements 2018/19 Plan 2018/19
3 months 2018/19 3 months YTD 3 months 3 months Variance Full Year Plan
ECONOMIC DEVELOPMENT & PROMOTION
12 Income: Misc. & Grant Income 689 250 439 6,000
16,250 Transfers from Reserves 12,500 12,500 ‐ 50,000
16,262 Sub Total 13,189 12,750 439 56,000
157,547 Expenses: Econ. devlpmt projects 199,302 180,778 (18,524) 540,852
69,683 Destination Wairarapa 70,450 71,250 800 285,000
46,700 Events grants 8,800 11,250 2,450 135,000
5,671 CBD Amenities costs 6,527 5,699 (828) 88,905
0 Regional Amenities grant 0 0 ‐ 0
279,601 285,078 268,977 (16,101) ‐6.0% 1,049,757
(3,345) less Depn not rated (3,516) (3,516) 0 (14,065)
0 plus Loan Repaymt 0 0 ‐ 14,065
‐ less Transfer to Reserves ‐ ‐ ‐ ‐
276,256 Sub Total 281,562 265,461 (16,101) 1,049,757
$259,994 Net Cost ‐ Rates Required $268,373 $252,711 (15,662) ‐6.2% $993,757
ENVIRONMENTAL INITIATIVES
0 Income: Internal Recoveries 12,500 12,501 (1) 50,000
0 Transfers from Reserves 22,500 22,500 ‐ 90,000
0 Sub Total 35,000 35,001 (1) 140,000
0 Environmental grants & project costs 76,526 89,487 12,961 304,268
$0 Net Cost ‐ Rates Required $41,526 $54,486 12,960 23.8% $164,268
451
MASTERTON DISTRICT COUNCIL
2017/18 Operating/Funding Statements 2018/19 Plan 2018/19
3 months 2018/19 3 months YTD 3 months 3 months Variance Full Year Plan
Regulatory Services
RESOURCE MANAGEMENT & PLANNING
41,254 Income: Consent Fees & Other Income 40,119 24,426 15,693 97,700175,585 Financial Contributions 340,547 110,001 230,546 440,000
0 Transfers from Reserves 0 0 ‐ 101,500
216,840 Sub Total 380,666 134,427 246,239 639,200
123,848 Expenses: Operating costs 118,758 132,486 13,728 10.4% 722,768
144,886 River scheme contrib. (GWRC) 148,467 149,570 1,103 132,877
200,585 less Transfer to Reserves 370,547 140,000 (230,547) 560,000
469,319 Sub Total 637,773 422,056 (215,717) 1,415,645
$252,479 Net Costs ‐ Regulatory Services $257,106 $287,629 30,523 10.6% $776,445
ENVIRONMENTAL HEALTH
24,512 Income: Fees & Licences 29,437 36,095 (6,658) 155,345
61,692 Internal Recoveries 64,715 63,189 1,526 252,751
86,203 Sub Total 94,153 99,284 (5,131) 408,096
183,386 Expenses: Operating costs 184,796 204,719 19,923 9.7% 815,033183,386 Sub Total 184,796 204,719 19,923 815,033
$97,183 Net Cost ‐ Rates Required $90,643 $105,435 14,792 14.0% $406,937
452

MASTERTON DISTRICT COUNCIL2017/18 Operating/Funding Statements 2018/19 Plan 2018/19
3 months 2018/19 3 months YTD 3 months 3 months Variance Full Year Plan
BUILDING CONTROL
313,019 Income: Consent fees & charges 293,384 248,023 45,361 18.3% 989,076
0 Transfers from Reserves 5,000 5,001 (1) 20,000
313,019 Sub Total 298,384 253,024 45,360 1,009,076‐
347,245 Expenses: Operating costs 399,392 348,004 (51,388) ‐14.8% 1,343,777
0 less Transfer to Reserves 0 0 ‐ 0347,245 Sub Total 399,392 348,004 (51,388) 1,343,777
$34,226 Net Cost ‐ Rates Required $101,008 $94,980 (6,028) $334,701
PARKING CONTROL
52,783 Income: Meters & Fines 61,604 57,627 3,977 6.9% 230,500
46,365 Expenses: Operating Costs 45,527 45,090 (437) ‐1.0% 180,358
0 Tsf to reserves 0 0 ‐ 0
46,365 Sub Total 45,527 45,090 (437) 180,358
(6,417) Operating (Surplus)/Deficit (16,077) (12,537) (3,540) (50,142) 0 Loan Repaymt (net) 0 0 ‐ 0
($6,417) Net Cost ‐ Rates Required ( ) = surplus ($16,077) ($12,537) 3,540 ($50,142)
DOG CONTROL
339,424 Income: Dog registrations & Pound fees 346,556 339,890 6,666 2.0% 351,850
3,910 Grant Income 0 0 ‐ 0
0 Transfers from Reserves 1,816 0 1,816 0
343,334 Sub Total 348,372 339,890 8,482 351,850
‐
104,622 Expenses: Operating costs 106,088 113,682 7,594 6.7% 415,052
(308) less Depn not rated ‐ ‐ ‐ ‐ 238,628 less Transfer to Reserves 260,654 244,383 (16,271) 10,000
($392) Net Cost ‐ Rates Required $18,370 $18,175 ($195) $73,202
453

MASTERTON DISTRICT COUNCIL2017/18 Operating/Funding Statements 2018/19 Plan 2018/19
3 months 2018/19 3 months YTD 3 months 3 months Variance Full Year Plan
EMERGENCY MANAGEMENT5,115 Income: Recoveries CDC & SWDC 1,552 8,625 (7,073) 34,500
0 Transfers from Reserves 0 0 ‐ 30,000
5,115 Sub Total 1,552 8,625 (7,073) 64,500‐
49,235 Expenses: Operating costs 53,529 61,160 7,631 274,620
0 less Transfer to Reserves 0 1,250 1,250 5,00049,235 Sub Total 53,529 62,410 8,881 279,620
$44,120 Net Cost ‐ Rates Required $51,977 $53,785 $1,808 3.4% $215,120
GovernanceREPRESENTATION
105,704 Income: Internal Allocation 108,928 108,927 1 435,711
0 Recoveries ‐ election & governance 0 0 ‐ 0
0 Transfers from Reserves 0 0 ‐ 0
105,704 Sub Total 108,928 108,927 1 435,711
97,005 Expenses: Councillors costs 107,471 107,110 (361) 391,09213,342 Election costs 322 0 (322) 25,000
3,836 Consultation & publications 128 1,250 1,122 47,000
163,972 Other support costs 166,089 163,918 (2,171) 626,188
0 less Transfer to Reserves 0 0 ‐ 0
278,156 Sub Total 274,010 272,278 (1,732) 1,089,280
$172,452 Net Cost ‐ Representation $165,082 $163,351 (1,731) ‐1.1% $653,569
Internal FunctionsENGINEERING CONSULTANCY
136,373 Income: Internal recoveries 166,095 166,095 (0) 664,379
11,499 External recoveries 6,539 13,500 (6,961) 54,000
0 Transfers from Reserves 0 0 ‐ 0
147,871 Sub Total 172,633 179,595 (6,962) 718,379
170,292 Expenses: Operating costs 189,980 193,311 3,331 713,3790 less Transfer to Reserves 0 1,251 1,251 5,000
$22,421 Net Cost ‐ Rates Required $17,346 $14,967 (2,379) $0
454

MASTERTON DISTRICT COUNCIL
2017/18 Operating/Funding Statements 2018/19 Plan 2018/19
3 months 2018/19 3 months YTD 3 months 3 months Variance Full Year Plan
ASSET & PROJECT MANAGEMENT
304,428 Income: Internal recoveries 322,949 322,947 2 1,291,797
32,704 Corporate Services Apportionment 33,505 33,504 134,019
3,759 External recoveries 6,970 5,001 1,969 20,000
340,890 Sub Total 363,424 361,452 1,972 1,445,816
375,982 Expenses: Consultancy 382,482 410,356 27,874 1,445,815
$35,092 Net Cost ‐ Rates Required $19,058 $48,904 29,846 $1
CORPORATE SERVICES
84,532 Income: Misc Income 103,627 91,754 11,873 608,463
243,020 Interest Income 226,064 275,370 (49,306) (17.9%) 880,000
1,222 Transfers from Reserves 0 9,999 (9,999) 40,000
328,774 329,691 377,123 (47,432) 1,528,463
224,505 Expenses: Administration 220,205 231,913 11,708 5.0% 818,696
344,716 Finance 392,104 389,315 (2,789) (0.7%) 1,311,478
146,744 Information Services 158,082 169,728 11,646 6.9% 569,962
109,082 Strategic Planning 144,769 152,829 8,060 5.3% 562,341
109,651 CE's Office 85,843 124,391 38,548 31.0% 477,222
95,555 Communications & Promotion 90,601 112,833 22,232 19.7% 439,617
108,795 Human Resources 96,090 103,479 7,389 7.1% 391,783
43,386 Council Vehicle Fleet Costs 51,227 42,164 (9,063) (21.5%) 168,655
150,111 Transfers to Reserves (interest) 129,116 147,500 18,384 590,000
(973,662) Corporate Services Apportionment (950,323) (950,325) (2) (3,801,291)
358,882 417,715 523,827 106,112 1,528,463
$30,109 Net Cost ‐ Rates Required $88,024 $146,704 $58,680 $0
455

CAPITAL EXPENDTIURE STATEMENTS
CAPITAL EXPENDITURE YTD Budget YTD YTD Variance Full Year
3 Months Year to Date $ $ Department / Project Funding 30 Sep 18 30 Sep 18 2018/19 Commentary
RoadingSubsidised Roading
Roading renewals ‐ rural Rates & subsidy 939,621 815,979 (123,643) 2,459,100
Roading renewals ‐ urban Rates & subsidy 183,074 279,447 96,374 764,744
Bridge renewals Rates & subsidy 0 0 ‐ 53,790
Rural/Urban minor improvements Rates & subsidy 247,096 251,100 4,005 814,400
Cycleways Rates & subsidy 0 0 ‐ 70,000
LED streetlighting upgrade Depn & subsidy 36,971 0 (36,971) 0 Balance of last year's contract
Footpath surface renewals Reserve & Subsidy 304,448 300,000 (4,448) 400,000 Now subsidised, contract let last year
Non‐ Subsidised Roading
Neighbourhood Planning ‐ provision Rates 0 0 ‐ 100,000
Urban footpath renewals Reserves 0 0 ‐ 250,000 Carried forward funding
Solway crescent upgrade Subdiv Contrib 0 0 ‐ 580,000
Carpark Lighting ‐ safety initiative Dev Contribtn 0 0 ‐ 80,000
CBD Recycling Bins Reserves 0 0 ‐ 10,000
Car park seal renewals Reserves 0 0 ‐ 190,807
Queen Street ‐ CBD Rejuvenation Dev Contribtn 30,962 30,000 (962) 500,000 Design work is underway
1,742,172 1,676,526 (65,645) 6,272,841
456
CAPITAL EXPENDITURE YTD Budget YTD YTD Variance Full Year
3 Months Year to Date $ $
Department / Project Funding 30 Sep 18 30 Sep 18 2018/19 Commentary
Water Services
Water reticulation renewals Loan/Reserve 474,119 450,000 (24,119) 1,400,000
Water connection replacements Reserve 46,788 50,001 3,213 200,000
WTP equipment renewals Reserve 48,227 35,001 (13,226) 140,000 $40K main plant Fire Alarm system
Reroof water treatment plant Reserve 0 7,500 7,500 30,000
Wainuioru Water supply Reserve 5,476 7,500 2,024 30,000
Fluoride‐free water access Reserve 0 0 ‐ 30,000
Castlepoint water supply upgrades Reserve 3,800 5,000 1,200 33,500
Opaki Water Race consent renewal Reserve 0 0 ‐ 24,500
578,410 555,002 (23,408) 1,888,000 0
Sewerage ServicesUrban/Rural Sewerage
Network Investigations Reserve 0 0 ‐ 50,000
Sewer Renewals Reserve 26,268 50,000 23,732 1,150,000 New contracts let, work yet to commence
WWTP equipment Reserve 0 5,000 5,000 100,000
Homebush ‐ extend irigation Loan 15,253 20,000 4,747 580,000
Tinui Sewerage System Upgrade 5,513 0 (5,513) 0
Riversdale Sewerage System Renewals Loan/Reserve 0 0 ‐ 15,000
Castlepoint Sewerage Scheme ‐ stepscreen Loan/Reserve 0 0 ‐ 60,000
Homebush ‐ other infrastructure Reserve 5,980 0 (5,980) 0
Total Sewerage Services 53,014 75,000 21,986 1,955,000 0
Stormwater Services
Stormwater renewals Reserve 2,577 2,500 (77) 330,000
2,577 2,500 (77) 330,000 0
Solid Waste ServicesRecycling Wheely Bins Loan 0 0 ‐ 535,000
Landfill capping Reserve 0 0 ‐ 20,000
Roof over transfer station Loan 0 0 ‐ 350,000
0 0 ‐ 905,000 0
457

CAPITAL EXPENDITURE YTD Budget YTD YTD Variance Full Year
3 Months Year to Date $ $
Department / Project Funding 30 Sep 18 30 Sep 18 2018/19 Commentary
Water Services
Water reticulation renewals Loan/Reserve 474,119 450,000 (24,119) 1,400,000
Water connection replacements Reserve 46,788 50,001 3,213 200,000
WTP equipment renewals Reserve 48,227 35,001 (13,226) 140,000 $40K main plant Fire Alarm system
Reroof water treatment plant Reserve 0 7,500 7,500 30,000
Wainuioru Water supply Reserve 5,476 7,500 2,024 30,000
Fluoride‐free water access Reserve 0 0 ‐ 30,000
Castlepoint water supply upgrades Reserve 3,800 5,000 1,200 33,500
Opaki Water Race consent renewal Reserve 0 0 ‐ 24,500
578,410 555,002 (23,408) 1,888,000
Sewerage ServicesUrban/Rural Sewerage
Network Investigations Reserve 0 0 ‐ 50,000
Sewer Renewals Reserve 26,268 50,000 23,732 1,150,000 New contracts let, work yet to commence
WWTP equipment Reserve 0 5,000 5,000 100,000
Homebush ‐ extend irigation Loan 15,253 20,000 4,747 580,000
Tinui Sewerage System Upgrade 5,513 0 (5,513) 0
Riversdale Sewerage System Renewals Loan/Reserve 0 0 ‐ 15,000
Castlepoint Sewerage Scheme ‐ stepscreen Loan/Reserve 0 0 ‐ 60,000
Homebush ‐ other infrastructure Reserve 5,980 0 (5,980) 0
Total Sewerage Services 53,014 75,000 21,986 1,955,000
Stormwater Services
Stormwater renewals Reserve 2,577 2,500 (77) 330,000
2,577 2,500 (77) 330,000
Solid Waste ServicesRecycling Wheely Bins Loan 0 0 ‐ 535,000
Landfill capping Reserve 0 0 ‐ 20,000
Roof over transfer station Loan 0 0 ‐ 350,000
0 0 ‐ 905,000
458

CAPITAL EXPENDITURE YTD Budget YTD YTD Variance Full Year
3 Months Year to Date $ $
Department / Project Funding 30 Sep 18 30 Sep 18 2018/19 Commentary
Community Facilities/ActivitiesParks, Reserves & Sports fields
Q E Park ‐ renewal projectReserve
Contrib/Loans 500 0 (500) 750,000 Contract due to start in Jan 2019
Kidz Own Junior playground area Reserve 0 0 ‐ 48,620
Upgrade structures/fac incl playgrounds Reserve 0 0 ‐ 126,563
Henley Lake ‐ toilets renewal Reserve 0 0 ‐ 206,000
Developing rural district networking trails Loan 0 0 ‐ 80,000
Parks & Open spaces ‐ signage Reserve 0 0 ‐ 20,000
Henley Lake ‐ intake Loan 0 0 ‐ 450,000 Consent remains pending
Chinese Pagoda General Capital 7,711 0 (7,711) 0 Residual costs of roof in 2018/19
Street trees additions & replacements Reserves 303 1,000 697 16,750
Recreational trails ‐ upgrade & extension Reserve Contrib 0 0 ‐ 22,000
QE Park ‐ Irrigation System Reserve 0 0 ‐ 15,000
Memorial Park upgrades Reserve 84,688 75,000 (9,688) 130,000 Balance of grandstand strengthening cost
Sports facilities building Reserve 0 0 ‐ 220,000
Cricket Facility ‐ Grandstand upgrade Reserve 7,843 10,000 2,157 400,000 budget
Sport ‐ Netball facility upgrade Reserve 0 0 ‐ 50,000 Provision
Sports facilities upgrading ‐ provision Reserve 0 0 ‐ 120,400
Colin Pugh Sports Bowl Reserve 46,592 50,000 3,408 61,200
147,637 136,000 (11,637) 2,716,533 0
Conveniences
Public conveniences ‐ incl Bannister St Reserve 0 0 ‐ 50,800
$15.8K Bannister St and $35K other toilet
uprades
Riversdale Toilets Reserve 0 0 ‐ 16,000
Castlepoint Toilet UpgradeReserve/External
Funds 492 1,000 508 240,000
492 1,000 508 306,800 0
459

CAPITAL EXPENDITURE YTD Budget YTD YTD Variance Full Year
3 Months Year to Date $ $
Department / Project Funding 30 Sep 18 30 Sep 18 2018/19 Commentary
Recreation Centre
Outdoor pools upgrade Reserve 0 0 ‐ 250,000
Other plant & equipment Reserve 0 0 ‐ 15,000
THRC ‐ Interior First Floor Reserve 0 25,000 25,000 69,290
THRC ‐ Outdoor Exterior Reserve 0 0 ‐ 102,990
THRC ‐ Services Reserve 37,868 37,868 ‐ 16,000
37,868 62,868 25,000 453,280 0
Cemeteries
Cemetery facilities Reserve 0 0 ‐ 20,000
0 0 ‐ 20,000 0
District Building
Renew building equipment & systems Reserve 0 0 ‐ 10,000
Waiata House ‐ upgrade Fixtures & Fittings Reserve 0 0 ‐ 300,000 purchase
New Events Centre Reserve 153 0 (153) 1,000,000 Design provision in year 1
Replace emergency generator Reserve 0 0 ‐ 50,000
153 0 (153) 1,360,000 0
Housing for the Elderly
Renewals ‐ carpet & vinyl, HWC & stoves Reserve 4,826 12,549 7,723 50,200
Insulation upgrades Reserve 1,119 0 (1,119) 0
Window upgrades Reserve 22,419 20,500 (1,919) 20,500
Replace/renew roofs Panama Reserve 19,723 17,499 (2,224) 70,000
Repainting exteriors & reseal carparks Reserve 20,532 22,719 2,187 90,870
68,618 73,267 4,649 231,570 0
Other Properties
Rental Property upgrades Reserve 17,951 25,635 7,684 102,534
Rural halls upgrades Reserve 375 500 125 15,000
Asbestos Removal ‐ all property Reserve 0 0 ‐ 50,000 Provision
Mawley Park ‐ upgrades Reserve 2,182 5,000 2,818 50,000
20,507 31,135 10,628 217,534 0
Library & Archive
Library book purchases Reserve 17,500 17,499 (1) 190,000
Library computer & equipment upgrades Reserve 1,493 2,000 508 73,000
Library ‐ air conditioning Reserve 0 0 ‐ 25,000
Library building & furniture upgrades Reserve 0 2,751 2,751 11,000
Library Learning Centre Loan/External 6,015 6,000 (15) 260,000 Deposit paid in October
Library Building upgrade Reserve 3,379 0 (3,379) 0
Archive renewals & space Reserve 0 0 ‐ 125,000 $30K shelving & $95K space
28,386 28,250 (136) 684,000 0
460

CAPITAL EXPENDITURE YTD Budget YTD YTD Variance Full Year
3 Months Year to Date $ $
Department / Project Funding 30 Sep 18 30 Sep 18 2018/19 Commentary
Airport
Airport runway light replacement Reserve 0 0 ‐ 150,000
Airport internal roading Reserve 0 0 ‐ 70,000
Airport regulatory (fencing misc.) Reserve 0 0 ‐ 30,000
Hanger area expansion Loan 0 0 ‐ 100,000
Airport relocate grass runway Loan 0 0 ‐ 15,000
0 0 ‐ 365,000
TOTAL Community Facilities/Activities 303,663 332,520 28,858 6,354,717
WellbeingsEconomic Development & Promotion
Christmas decorations Reserves 0 0 ‐ 20,000
Security camera renewals & upgrades Reserves 0 0 ‐ 20,000
Solway Showgrounds dump station Reserves 0 0 ‐ 70,000
Street History Signage Reserves 0 0 ‐ 32,000
0 0 ‐ 142,000
Regulatory ServicesAnimal Control ‐ equipment Reserve 0 0 ‐ 21,500
Animal Control ‐ Animal Pound upgrade Reserve 2,408 2,499 91 10,000
Building control equipment Reserve 0 0 ‐ 4,000
Hand held parking devices Reserve 0 0 ‐ 20,000
Animal & Bylaws Signage Reserve 0 0 ‐ 10,000
Emergency welfare centres
Water/Sewerage Facilities
Reserve
0 0 ‐ 35,000
Environmental Health equipment Reserve 0 0 ‐ 8,000
2,408 2,499 91 108,500
Corporate ServicesComputer and office equipment upgrades Reserve 3,098 5,000 1,902 150,000
Council Meeting info systems Reserve 2,322 2,500 178 40,000
Asset Management System Reserve 0 0 ‐ 10,000
Council vehicle fleet replacements Reserve 39,100 37,500 (1,600) 150,000
44,520 45,000 480 350,000
Total $2,726,763 $2,689,047 ($37,715) $18,306,058
461

244/18
To: Audit and Risk Committee
From: Tania Madden, Manager Strategic Planning
Endorsed by: Kathryn Ross, Chief Executive
Date: 21 November 2018
Subject Non‐Financial Performance 2018‐19 First Quarter Report
INFORMATION
Recommendation:
That the Audit and Risk Committee:
a) receives the Quarter 1 non‐financial performance report for the 2018‐19 financial year; and
b) agrees to the reporting frequency for each of the performance measures, as provided in Attachment 1 to Report 244/18.
Purpose
The purpose of this report is to advise the Audit and Risk Committee of performance against non‐financial measures reported in the first quarter of the 2018/19 financial year. The figures in this report are for the period from 1 July to 30 September 2018.
Executive Summary
As part of the development of the 2018‐28 Long‐Term Plan (LTP) Council reviewed its non‐financial performance framework and adopted a total of 70 performance measures.
The proposed reporting frequency for each of the performance measures is included with this report as Attachment 1. Please note, this is the minimum frequency for which measures will be reported. If relevant data that reflects progress does become available before a measure is due to be reported (i.e. for those that are six monthly or annual), this will be included in the next quarterly report.
This is the first non‐financial performance report for the 2018‐28 Long‐Term Plan (LTP). Results against performance measures are reported for four activity areas in this first quarter report. The activity areas are:
Water Supply;
Wastewater;
Stormwater; and
Solid Waste.
Of the 15 performance measures reported this quarter, 13 (87%) were achieved as at 30 September 2018. The two measures relating to solid waste were not achieved.
Further information is provided below.
462

The graph below shows the percentage of measures against each activity area that:
have been achieved as at 30 September 2018;
have not been achieved as at 30 September 2018; or
are not measured at three months.
463

2018‐19 Quarter 1 Non‐Financial Performance Measure Results
Measure 2018‐19 Annual Target Q1 Result Status at 30/9/2018
Commentary
Water Supply
Number of complaints received about drinking water clarity, taste, odour, pressure or flow, continuity of supply, or MDC's response to any of these issues
Less than or equal to 6 complaints/1000 connections
1 complaint/ 1,000
connections
Achieved Total complaints: 9
Response time to call outs to a fault or unplanned interruption to MDC's networked reticulation system:
a) attendance at urgent call outs (from notification to arrival on site)
60 minutes or less 25 min Achieved
b) resolution of urgent call outs (from notification to confirmation of resolution)
480 minutes or less 213 min Achieved
c) attendance at non‐urgent call outs (from notification to arrival on site)
7 days or less 14 min Achieved
d) resolution of non‐urgent call outs (from notification to confirmation of resolution)
3 months or less 60 min Achieved
Wastewater
Number of complaints received about sewerage odour, system faults, system blockages, MDC's response to issues with its sewerage system
Less than or equal to 8 complaints/1000 connections
1.33 complaints/ 1,000
connections
Achieved Total complaints: 12
Median response time to sewerage overflows resulting from a blockage or other fault to MDC's sewerage system:
a) attendance (from time of notification to the time service personnel arrive onsite)
6 hours or less 31 min Achieved
b) resolution (from time of notification to the time service personnel confirm resolution)
12 hours or less 111 min Achieved
Number of dry weather sewerage overflows from MDC's sewerage system
Less than or equal to 2/1000 connections
None Achieved
464

If relevant data becomes available before the scheduled time of reporting, this will be included in the quarterly report.
Measure 2018‐19 Annual Target Q1 Result Status at 30/9/2018
Commentary
Stormwater
Number of flooding events that occur in the district
10 events or less None Achieved
For each flooding event, the number of habitable floors affected
Less than or equal to 1/1000 connections
None Achieved
Number of complaints received about the performance of MDC's stormwater system
Less than or equal to 2/1000
0.2 complaints/ 1,000
connections
Achieved Total complaints: 2
Median response time to attend a flooding event (from time of notification to the time service personnel arrive onsite)
60 minutes or less 49 minutes Achieved
Solid Waste
Number of call backs due to non‐collection of official rubbish bag in each weekly collection
Improvement on previous year
7 call‐backs Not Achieved
Total call backs: 7. In 2017‐18 there was a total of 5 call backs during Q1 and Q2 combined. This measure will continue to be monitored to determine any patterns.
Tonnage of waste transferred to landfill per head of population
Reduction on previous year
No change compared to the same period in 2017‐18 (0.13 tonne/head of population)
Not Achieved
Tonnes to landfill (excluding CDC and SWDC waste that transits via Nursery Road) was 3,445.6 tonnes (0.13 tonne/head). This is based on the 2018 population estimate of 25,700.
For the same period last year 3,172.74 tonnes (0.13 tonne/head) was transferred.
In terms of total tonnage, there has been an 8.6% increase in the amount transferred to landfill between this quarter and the same period last year. This increase is attributable to high levels of economic activity.
Waste minimisation efforts will continue in order to reduce the amount of waste transferred per person.
465

If relevant data becomes available before the scheduled time of reporting, this will be included in the quarterly report.
Attachment 1: Reporting Frequency of Non‐Financial Performance Measures Please note: If relevant data does become available before a measure is due to be reported, this will be included in the next quarterly report.
Measure 2018‐19 Annual Target Reporting Frequency
Community Wellbeing
Number of air quality exceedances Reduction in the number of exceedances, compared to the previous year Annual
CO2 emissions per head of population Annual reduction in CO2 emissions per head of population Annual
Percentage of staff that have completed He Korowai Wairua (MDC's introductory Māori language and tikanga Māori programme
Annual increase in the proportion of staff who have completed the programme
Annual
Masterton Gross Domestic Product (GDP) percentage change relative to Wellington region GDP
Equal to or greater than Wellington region average Six‐monthly
Roads and Footpaths
Number of fatalities and serious injury crashes on the local road network Reduction in fatalities and serious injury crashes compared to previous year
Annual
Average quality of ride on a sealed local road network, measured by smooth travel exposure
Maintain or improve on 90% Annual
Percentage of sealed local road network that is resurfaced Maintain within 5‐7% Annual
Percentage of footpaths where the condition falls within the level of service defined in MDC's Asset Management Plan
97% of footpaths are rated excellent, good or fair Annual
Percentage of urgent customer service requests responded to within 2 days
95% Six‐monthly
Percentage of non‐urgent customer service requests responded to within the timeframes specified in MDC's Asset Management Plan and placed on appropriate maintenance programme
80% Six‐monthly
Number of cyclists using our urban roading network Increase on previous year
Annual
Water Supply
466

If relevant data becomes available before the scheduled time of reporting, this will be included in the quarterly report.
Measure 2018‐19 Annual Target Reporting Frequency
Number of complaints received about drinking water clarity, taste, odour, pressure or flow, continuity of supply, or MDC's response to any of these issues
Less than or equal to 6 complaints/1000 connections Quarterly
Response time to call outs to a fault or unplanned interruption to MDC's networked reticulation system:
a) attendance at urgent call outs (from notification to arrival on site) 60 minutes or less Quarterly
b) resolution of urgent call outs (from notification to confirmation of resolution)
480 minutes or less Quarterly
c) attendance at non‐urgent call outs (from notification to arrival on site) 7 days or less Quarterly
d) resolution of non‐urgent call outs (from notification to confirmation of resolution)
3 months or less Quarterly
Council's drinking water supply complies with:
a) part 4 of the Drinking Water Standards (bacteria compliance criteria) Fully compliant Annual
b) part 5 of the Drinking Water Standards (protozoal compliance criteria) Fully compliant Annual
Percentage of real water loss from MDC's reticulation system (calculated using minimum night flow)
Reduction on previous year Annual
Average consumption of drinking water per day per resident within the district
Reduction on previous year Annual
Alternative water supply is provided when shutdown exceeds 24 hours Less than or equal to 1/1,000 connections Annual
Percentage of water pipe renewals completed 90% of planned work Annual
Wastewater
Number of complaints received about sewerage odour, system faults, system blockages, MDC's response to issues with its sewerage system
Less than or equal to 8 complaints/1000 connections Quarterly
a) attendance (from time of notification to the time service personnel arrive onsite)
6 hours or less Quarterly
b) resolution (from time of notification to the time service personnel confirm resolution)
12 hours or less Quarterly
Number of dry weather sewerage overflows from MDC's sewerage system
Less than or equal to 2/1000 connections Quarterly
467
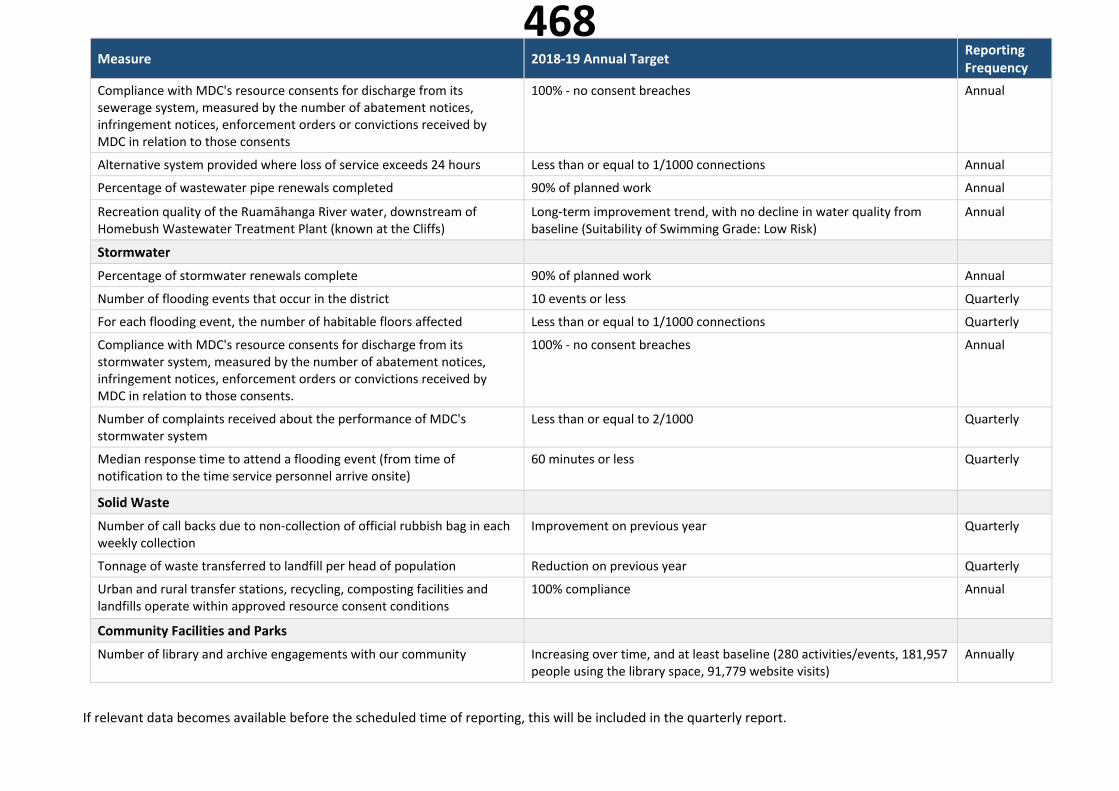
If relevant data becomes available before the scheduled time of reporting, this will be included in the quarterly report.
Measure 2018‐19 Annual Target Reporting Frequency
Compliance with MDC's resource consents for discharge from its sewerage system, measured by the number of abatement notices, infringement notices, enforcement orders or convictions received by MDC in relation to those consents
100% ‐ no consent breaches Annual
Alternative system provided where loss of service exceeds 24 hours Less than or equal to 1/1000 connections Annual
Percentage of wastewater pipe renewals completed 90% of planned work Annual
Recreation quality of the Ruamāhanga River water, downstream of Homebush Wastewater Treatment Plant (known at the Cliffs)
Long‐term improvement trend, with no decline in water quality from baseline (Suitability of Swimming Grade: Low Risk)
Annual
Stormwater
Percentage of stormwater renewals complete 90% of planned work Annual
Number of flooding events that occur in the district 10 events or less Quarterly
For each flooding event, the number of habitable floors affected Less than or equal to 1/1000 connections Quarterly
Compliance with MDC's resource consents for discharge from its stormwater system, measured by the number of abatement notices, infringement notices, enforcement orders or convictions received by MDC in relation to those consents.
100% ‐ no consent breaches Annual
Number of complaints received about the performance of MDC's stormwater system
Less than or equal to 2/1000 Quarterly
Median response time to attend a flooding event (from time of notification to the time service personnel arrive onsite)
60 minutes or less Quarterly
Solid Waste
Number of call backs due to non‐collection of official rubbish bag in each weekly collection
Improvement on previous year Quarterly
Tonnage of waste transferred to landfill per head of population Reduction on previous year Quarterly
Urban and rural transfer stations, recycling, composting facilities and landfills operate within approved resource consent conditions
100% compliance Annual
Community Facilities and Parks
Number of library and archive engagements with our community Increasing over time, and at least baseline (280 activities/events, 181,957 people using the library space, 91,779 website visits)
Annually
468

If relevant data becomes available before the scheduled time of reporting, this will be included in the quarterly report.
Measure 2018‐19 Annual Target Reporting Frequency
Number of literacy programmes offered (including library promotions and digital literacy)
Increasing over time, and at least baseline (224) Six‐monthly
Number of children participating in the Summer Reading Programme Increasing over time, and at least baseline (317) Annually
Number of people using free online services per head of population Free online sessions increasing over time, and at least baseline (3.8) Annually
Free Wai‐Fi sessions increasing over time, and at least baseline (1.2) Annually
Number of archive feature stories/publications (media and online) Average of 1 per month/12 per annum Six‐monthly
Cemetery records accessed online Maintain baseline (7,447) Six‐monthly
Number of structured activities/events in MDC's parks and sportsgrounds Increasing utilisation over time Annually in Year 1, then quarterly.
Number of people using the recreational trails that are part of our parks and reserves network
Increasing utilisation over time Annually in Year 1, then quarterly.
Number of structured activities/events that have been run in the War Memorial Stadium
Increasing utilisation over time Annually in Year 1, then quarterly.
Number of landings at Hood Aerodrome Increasing over time and at least baseline (7,821) Six‐monthly
Number of new hangars at Hood Aerodrome Increase in hangars over time Annually
Ratio of average MDC senior housing weekly rent compared to average private sector rent
Maintain senior housing rentals at no more than 60% of the market rental for a 1‐bed flat
Annually
Number of under‐12s enrolled in Learn to Swim programmes
Annual increase Annually in Year 1, then quarterly.
Regulatory
Number of dog attacks (on people and stock) in our district Reducing over time and no more than baseline (17 attacks on people, 48 attacks on stock)
Six‐monthly
Number of 'responsible owners' of dogs Increasing number of 'responsible owners' Six‐monthly
Number of pet/working dogs reunited with their owner or rehomed Increasing over time and at least baseline (207) Six‐monthly
469
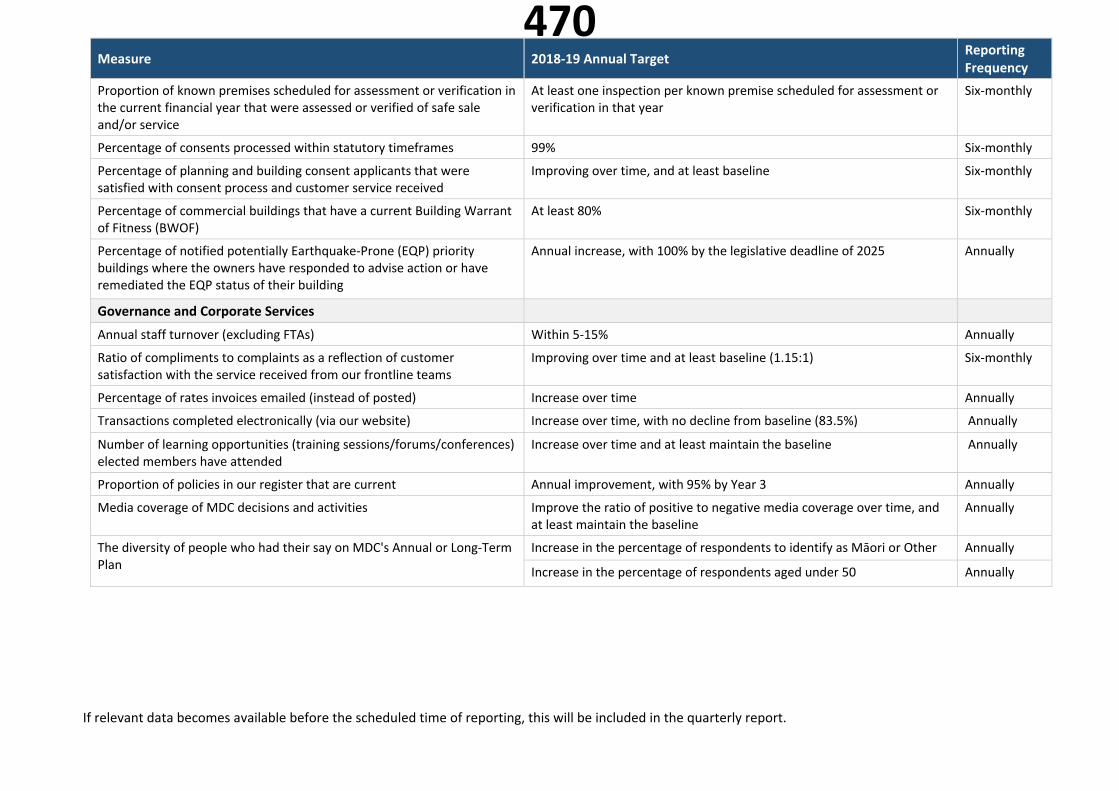
If relevant data becomes available before the scheduled time of reporting, this will be included in the quarterly report.
Measure 2018‐19 Annual Target Reporting Frequency
Proportion of known premises scheduled for assessment or verification in the current financial year that were assessed or verified of safe sale and/or service
At least one inspection per known premise scheduled for assessment or verification in that year
Six‐monthly
Percentage of consents processed within statutory timeframes 99% Six‐monthly
Percentage of planning and building consent applicants that were satisfied with consent process and customer service received
Improving over time, and at least baseline Six‐monthly
Percentage of commercial buildings that have a current Building Warrant of Fitness (BWOF)
At least 80% Six‐monthly
Percentage of notified potentially Earthquake‐Prone (EQP) priority buildings where the owners have responded to advise action or have remediated the EQP status of their building
Annual increase, with 100% by the legislative deadline of 2025 Annually
Governance and Corporate Services
Annual staff turnover (excluding FTAs) Within 5‐15% Annually
Ratio of compliments to complaints as a reflection of customer satisfaction with the service received from our frontline teams
Improving over time and at least baseline (1.15:1) Six‐monthly
Percentage of rates invoices emailed (instead of posted) Increase over time Annually
Transactions completed electronically (via our website) Increase over time, with no decline from baseline (83.5%) Annually
Number of learning opportunities (training sessions/forums/conferences) elected members have attended
Increase over time and at least maintain the baseline Annually
Proportion of policies in our register that are current Annual improvement, with 95% by Year 3 Annually
Media coverage of MDC decisions and activities Improve the ratio of positive to negative media coverage over time, and at least maintain the baseline
Annually
The diversity of people who had their say on MDC's Annual or Long‐Term Plan
Increase in the percentage of respondents to identify as Māori or Other Annually
Increase in the percentage of respondents aged under 50 Annually
470
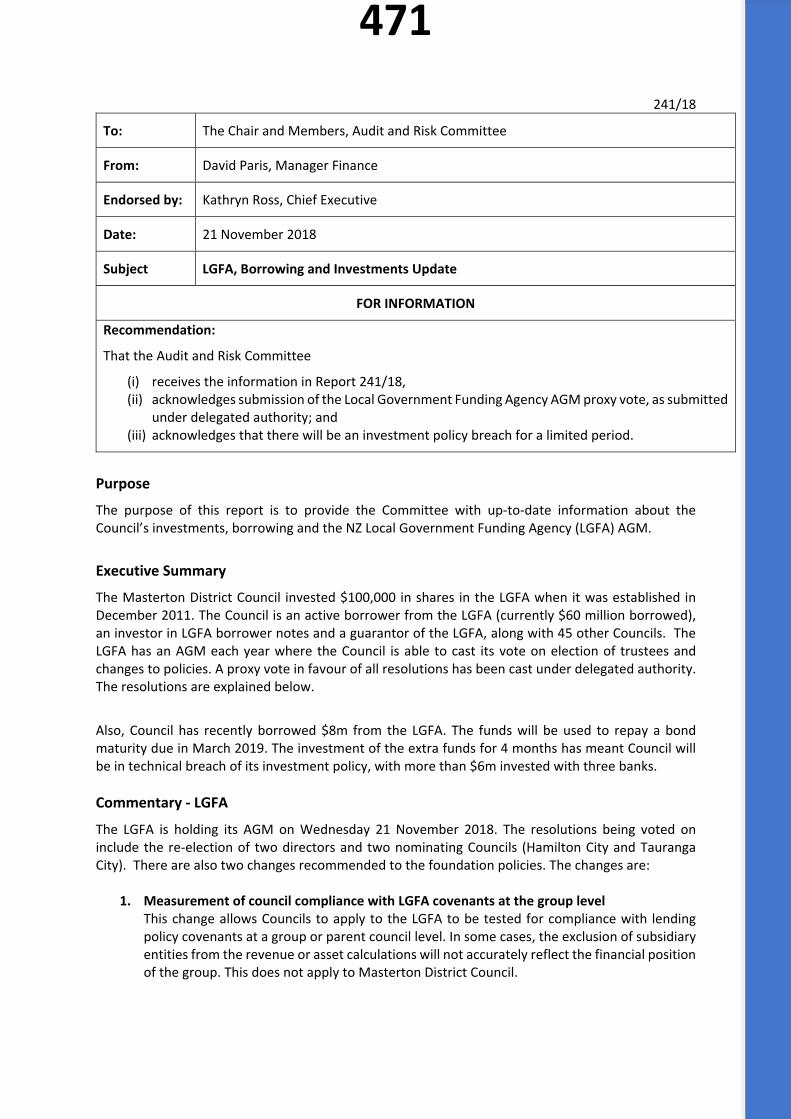
241/18
To: The Chair and Members, Audit and Risk Committee
From: David Paris, Manager Finance
Endorsed by: Kathryn Ross, Chief Executive
Date: 21 November 2018
Subject LGFA, Borrowing and Investments Update
FOR INFORMATION
Recommendation:
That the Audit and Risk Committee
(i) receives the information in Report 241/18, (ii) acknowledges submission of the Local Government Funding Agency AGM proxy vote, as submitted
under delegated authority; and (iii) acknowledges that there will be an investment policy breach for a limited period.
Purpose
The purpose of this report is to provide the Committee with up‐to‐date information about the Council’s investments, borrowing and the NZ Local Government Funding Agency (LGFA) AGM.
Executive Summary
The Masterton District Council invested $100,000 in shares in the LGFA when it was established in December 2011. The Council is an active borrower from the LGFA (currently $60 million borrowed), an investor in LGFA borrower notes and a guarantor of the LGFA, along with 45 other Councils. The LGFA has an AGM each year where the Council is able to cast its vote on election of trustees and changes to policies. A proxy vote in favour of all resolutions has been cast under delegated authority. The resolutions are explained below.
Also, Council has recently borrowed $8m from the LGFA. The funds will be used to repay a bond maturity due in March 2019. The investment of the extra funds for 4 months has meant Council will be in technical breach of its investment policy, with more than $6m invested with three banks.
Commentary ‐ LGFA
The LGFA is holding its AGM on Wednesday 21 November 2018. The resolutions being voted on include the re‐election of two directors and two nominating Councils (Hamilton City and Tauranga City). There are also two changes recommended to the foundation policies. The changes are:
1. Measurement of council compliance with LGFA covenants at the group level This change allows Councils to apply to the LGFA to be tested for compliance with lending policy covenants at a group or parent council level. In some cases, the exclusion of subsidiary entities from the revenue or asset calculations will not accurately reflect the financial position of the group. This does not apply to Masterton District Council.
471
2. Lending to Council Controlled Organisations (“CCOs”)
Currently LGFA only lends to the parent council and not to any other related entities. This is not ideal for a number of reasons. Several councils borrow and on‐lend to their CCOs. The changes proposed will provide councils with greater flexibility in structuring their borrowing and on‐lending. LGFA currently cannot lend to multiple‐owned CCOs. There are very few but may become more established in the future eg. jointly owned water companies. Dunedin City borrows via a CCTO subsidiary which cannot currently borrow from the LGFA. The change proposed will allow Dunedin City to use the LGFA when appropriate. There are a number of measures proposed to ensure the LGFA does not bear any additional risk through the change to lending to CCOs. The papers supporting the two changes above fully describe the changes, the reasons for them and the risks and safeguards that will be put in place.
Both the LGFA Board and Shareholders’ Council have recommended and endorsed the proposed changes to the Foundation Policies. The full set of documents is available on request. Due to the timing of the AGM (the same date as Audit and Risk Committee and November Council meeting) staff have, in consultation with the Mayor, submitted to the Local Government Funding Agency AGM a proxy vote in support of the changes proposed.
Commentary – Borrowing & Investment
The Council has a $10m bond from the LGFA due to be repaid on 15 March 2019. The strategy for funding that repayment is to borrow $8m and use $2m of rates funding for debt repayment (as allowed in the LTP). The timing of borrowing the $8m has been subject to choosing the most favourable market rates. Borrowing early and investing the funds for 4 months has been the approach taken. This avoids any exposure to fluctuating interest rates in March, enables current low interest rate margins to be locked in and provides the opportunity to gain approximately $14,000 on the margin between borrowing and investing. The $8m has been split into two bonds of $4m each, one to mature in March 2024 and one in March 2025. They are floating rate bonds priced off the 90 day swap rate plus a margin that was set as part of an LGFA bond tender on 7 November. The interest rates payable are 2.67% and 2.73% respectively. The investment of $8m for 4 months has been spread across three banks at interest rates of 3.23% and 3.22%. Adding these investments to other funds on deposit, through until March 2019 the Council will have more than $6m invested with three banks (ANZ, BNZ and Westpac). This is a technical breach of the Investment Policy. The Audit & Risk Committee is asked to acknowledge the breach as being an acceptable risk for a limited period.
472
243/18
To: Audit and Risk Committee
From: Tania Madden, Manager Strategic Planning
Endorsed by: Kath Ross, Chief Executive
Date: 21 November 2018
Subject Progress Report: Monitoring of Policies
INFORMATION
Recommendation:
That the Audit and Risk Committee notes the content of Report 243/18.
Purpose
The purpose of this report is to provide an update on key Masterton District Council (MDC) policies monitored by the Audit and Risk Committee.
Background
The Audit and Risk (A&R) Committee agreed to monitor the following policies:
Asset Management Policy
Delegations Policy
Fraud, Dishonesty and Corruption Control Policy
Health and Safety Policy
Procurement Policy
Revenue and Financing Policy
Significance and Engagement Policy
Sensitive Expenditure Policy
Treasury Management Policy
Status of Monitored Policies
Of the nine policies monitored by the A&R Committee, seven are current and two are under review. The table on the following page provides a more detailed update on the status of each of these policies.
473

KEY: No review pending Due for review within 12 months Review overdue
Policy Status Policy Type Current Version Next Review/Comments
Dated Approved By
Asset Management Policy Current Internal 2017 SMT and endorsed by Council Next review due in 2020.
Delegations Policy Current Internal 2016 SMT and endorsed by Audit & Risk Committee
Next review due in 2019. However, as part of preliminary analysis on the governance structures for Council, and efficient decision making by staff, staff have commenced a high level review of what works well within the policy and where there are opportunities for improvement.
Fraud, Dishonesty and Corruption Control Policy
Current Internal 2018 SMT and endorsed by Audit & Risk Committee
Next review due in 2021.
Health and Safety Policy Under Review Internal 2015 SMT and endorsed by Audit & Risk Committee
Review Underway.
Procurement Policy Current Internal 2017 SMT and endorsed by Audit & Risk Committee
Next review due in 2020.
Revenue and Financing Policy Current Legislative 2018 Audit & Risk Committee Next review due in 2021.
Significance and Engagement Policy Current Legislative 2017 Audit & Risk Committee Next review due in 2020.
Sensitive Expenditure Policy Manual1 Current Internal 2018 Audit & Risk Committee Next review due in 2021.
Treasury Management Policy (includes the Liability Management Policy and Investment Policy)
Current Legislative 2017 Council Next review due in 2020.
Note the Manager Finance is considering additional content for the policy regarding ethical investment.
1 This policy was renamed following its most recent review
474