masterplan 2013
DESCRIPTION
new delhi master planTRANSCRIPT
Hkkjr ljdkj
Government of IndiaTky lalk/ku ea=ky;
Ministry of Water Resources
dsUnzh; Hkwfe ty cksMZ
Central Ground Water Board
ubZ fnYyh
New Delhi
2013
Hkkjr esa Hkwty ds Ñf=e iquHkZj.k lca/kh
ekLVj ;kstuk
Master Plan for Artificial Recharge to Ground Water in India
Hkkjr esa Hkwt
y ds Ñf=e iquHkZj.k
lca/kh
ekLV
j ;kstuk

Hkkjr ljdkj
Government of Indiaty lalk/ku ea=kky;
Ministry of Water Resources
dsUnzh; Hkwfe ty cksMZ
Central Ground Water Board
ubZ fnYyh
New Delhi
2013
Hkkjr esa Hkwty ds Ñf=e iquHkZj.k lca/kh
ekLVj ;kstuk
Master Plan for Artificial Recharge to Ground Water in India
I
MASTER PLAN FORARTIFICIAL RECHARGE TO GROUND WATER IN INDIA
CONTENTS
Chapters Description Page No. FOREWORD i PREFACE iii EXECUTIVE SUMMARY v MASTER PLAN AT A GLANCE ix1.0 INTRODUCTION 12.0 NATIONAL SCENARIO OF GROUND WATER 63.0 CONCEPT OF ARTIFICIAL RECHARGE TO GROUND WATER 134.0 NEED FOR ARTIFICIAL RECHARGE TO GROUND WATER 175.0 METHODOLOGY FOR PREPARATION OF MASTER PLAN 206.0 DESIGN OF ARTIFICIAL RECHARGE STRUCTURES 237.0 MONITORING MECHANISM 278.0 STATE WISE MASTER PLAN FOR ARTIFICIAL RECHARGE 308.1 Andhra Pradesh 308.2 Bihar 358.3 Chhattisgarh 398.4 Delhi (National Capital Territory) 468.5 Goa 498.6 Gujarat 528.7 Haryana 598.8 Himachal Pradesh 638.9 Jammu and Kashmir 678.10 Jharkhand 708.11 Karnataka 758.12 Kerala 848.13 Madhya Pradesh 908.14 Maharashtra 1008.15 North Eastern States 1108.16 Odisha 1148.17 Punjab 119
II
8.18 Rajasthan 1238.19 Sikkim 1308.20 Tamil Nadu 1338.21 Uttar Pradesh 1438.22 Uttarakhand 1548.23 West Bengal 1618.24 Andaman & Nicobar Islands 1688.25 Chandigarh 1718.26 Dadra & Nagar Haveli 1748.27 Daman & Diu 1768.28 Lakshadweep 1788.29 Puducherry 1809.0 OVERVIEW OF MASTER PLAN FOR ARTIFICIAL RECHARGE 181
TO GROUND WATER10.0 ROAD MAP OF IMPLEMENTATION 189Annexure- 1A Concept Paper on Comprehensive National Recharge Programme in the CountryAnnexure- 1B Guidelines for Revision of Master Plan of Artificial RechargeAnnexure- 1C Draft Guidelines for Converting Over-Exploited Blocks to Safe Category taking
into Consideration Aspects of Withdrawal, Recharge, Water Use Practices etc.LIST OF TABLES
Table No. Description1.1 Artificial Recharge Studies taken by CGWB during different Five Year Plans2.1 Distribution of Hydrogeological Units in India and their Ground Water Potential4.1 Traditional Artificial Recharge Practices in India8.1.1 Cost Estimate for different kinds of Artificial Recharge Structures in Andhra Pradesh8.1.2 District-wise Master Plan for Artificial Recharge in Andhra Pradesh8.2.1 Requirement of Surface Water Resources for Artificial Recharge to Ground Water in Bihar8.2 .2 District-wise feasibility of Artificial Recharge Structures in Bihar8.2.3 Unit Cost of Structures in Bihar8.2.4 District-wise details of Artificial Recharge Structures in Bihar8.3.1 District-wise details of Artificial Recharge Structures in Chhattisgarh8.4.1 District-wise details of Artificial Recharge Structures in Delhi8.5.1 District-wise details of Artificial Recharge Structures in Goa8.6.1 Computation of areas feasible for Artificial Recharge in Gujarat8.6.2 Computation of volume of unsaturated zone available for recharge in Gujarat
III
8.6.3 Computation of volume of water required for recharge in Gujarat8.6.4 District-wise Artificial Recharge Structures considered for Ground Water
Estimation- 2009 in Gujarat8.6.5 District-wise details of Artificial Recharge Structures in Gujarat8.7.1 District-wise details of Artificial Recharge Structures in Haryana8.8.1 Details of Artificial Recharge Structures proposed in Himachal Pradesh8.10.1 Requirement of Surface Water Resources for Artificial Recharge to
Ground Water in Jharkhand8.10.2 District-wise feasibility of Artificial Recharge Structures in Jharkhand8.10.3 District-wise numbers of completed Check Dam and Roof Top Rain
Water Harvesting Structures of State Govt. Departments, Jharkhand8.11.1 District-wise details of Artificial Recharge Structures in Karnataka8.11.2 Hydrologic Framework Statistics in Honnaghatta Sub-watershed, Karnataka8.11.3 Status of availability of Source Water for Augmentation of Aquifer System,
Honnaghatta Sub-watershed, Karnataka8.11.4 Details of exiting Surface Water Bodies in Honnaghatta Sub-watershed, Karnataka8.11.5 Conservation and Augmentation components of the proposed Action
Plan in Honnaghatta Sub-watershed, Karnataka8.12.1 Details of Unit Capacity and Unit Cost of each type of Artificial Recharge
Structure, Kerala8.12.2 Injection wells proposed in Kerala8.12.3 District-wise details of Artificial Recharge Structures in Kerala8.13.1 Basin-wise committed Surface Water in Madhya Pradesh (Large Dams)8.13.2 Cost estimates for proposed district-wise Ground Water Recharge Plan, Madhya
Pradesh8.14.1 District-wise Artificial Recharge to Ground Water by Suitable Artificial Recharge
Structures using Surface Water Resources, Maharashtra.8.15.1 State-wise Area, Population, Districts, Blocks and Villages in North Eastern States8.15.2 Artificial Recharge Structures and Cost estimates in North Eastern States8.15.3 Estimate for development of Springs in North Eastern States8.15.4 Cost estimate for various structures in North Eastern States8.16.1 Surface water availability and requirement in Odisha8.16.2 Artificial Recharge Structures and their weightage in Odisha8.16.3 Elevation breakup of the prioritized areas in Odisha8.16.4 Cost estimates of Artificial Recharge Structures in Odisha8.17.1 District-wise details of Artificial Recharge Structures in Punjab
IV
8.18.1 District-wise details of Artificial Recharge Structures in Rajasthan8.18.2 Basin-wise details of Artificial Recharge Structures in Rajasthan8.19.1 Rainwater Harvesting Structures and Cost estimates, Sikkim8.20.1 District-wise feasibility of Artificial Recharge Structures and estimated cost in Tamil Nadu8.20.2 Long term trend of Ground Water Levels around Neyveli Area, Tamil Nadu8.20.3 Details of Exploratory Wells constructed in Neyveli Area, Tamil Nadu8.20.4 Structures feasible and Cost estimates, Tamil Nadu8.21.1. Total requirement of actual surface water in Uttar Pradesh8.21.2 Basin-wise Non-Committed Surface Water availability For Recharge /
Conservation in Uttar Pradesh8.21.3 Summary of Recharge Plan for Uttar Pradesh8.21.4 Summary of Recharge Structures Proposed for constrution in Uttar Pradesh
by State Government8.21.5 District-wise Ground Water Recharge Plan for Uttar Pradesh8.22.1 District-wise estimates of Artificial Recharge Structures in Uttarakhand8.22.2 Summarized Cost Estimates for various types of Structures feasible in Uttarakhand8.23.1 Gross Storage Capacity and percentage of Resources allocated for
Artificial Recharge Structures, West Bengal8.23.2 District-wise number of Artificial Recharge Structure proposed, West Bengal8.23.3 Artificial Recharge Structures and Cost estimates, West Bengal8.24.1 Cost estimates and Number of Structures Proposed in Andaman & Nicobar8.25.1 Details of Artificial Recharge Structures in Chandigarh UT8.27.1 Estimates of Roof Top Rainwater Harvesting in UT of Daman & Diu8.28.1 Scope of Rainwater Harvesting in Lakshadweep Island8.29.1 Artificial Recharge Structures in UT of Puducherry9.1 Master Plan for Artificial Recharge in a Nutshell9.2 State-wise Rural and Urban Artificial Recharge Structures and Cost estimates9.3 State-wise summarized details of Artificial Recharge Structures

V
LIST OF FIGURESFig.1.1 Categorisation of Blocks/Mandals/Taluks as on March 2009Fig.2.1 Hydrogeology of IndiaFig.2.2 Per Capita Water Availability in IndiaFig.3.1 Depth to Water Level Map, Post-Monsoon, 2010Fig.8.1.1 Areas identified for Artificial Recharge in Andhra PradeshFig. 8.2.1 Areas identified for Artificial Recharge in BiharFig.8.3.1 Areas identified for Artificial Recharge, ChhattisgarhFig.8.4.1 Areas suitable for Artificial Recharge in DelhiFig. 8.5.1 Areas suitable for Artificial Recharge in GoaFig. 8.6.1 Areas identified for Artificial Recharge in GujaratFig. 8.7.1 Areas suitable for Artificial Recharge in HaryanaFig. 8.8.1 Areas suitable for Artificial Recharge in Himachal PradeshFig. 8.9.1 Areas identified for Artificial Recharge in Jammu & KashmirFig 8.10.1 Areas feasible for Artificial Recharge in JharkhandFig. 8.11.1 Areas suitable for Artificial Recharge in KarnatakaFig. 8.11.2 Hydrograph of Doddaballapur Observation WellFig. 8.12.1 Areas suitable for Artificial Recharge in KeralaFig.8.12.2 Specific areas suitable for Artificial Recharge in KeralaFig. 8.13.1 Areas suitable for Artificial Recharge in Madhya PradeshFig. 8.14.1 Hilly areas identified for Artificial Recharge in MaharashtraFig. 8.14.2 Coastal areas identified for Artificial Recharge in MaharashtraFig. 8.14.3 Inland salinity areas identified for Artificial Recharge in MaharashtraFig. 8.14.4 Over-exploited area identified for Artificial Recharge through recharge
canals in MaharashtraFig. 8.14.5 Areas identified for Artificial Recharge in MaharashtraFig. 8.15.1 Areas identified for Artificial Recharge in North Eastern StatesFig. 8.16.1 Areas identified for Artificial Recharge in OdishaFig. 8.17.1 Areas identified for Artificial Recharge in PunjabFig. 8.18.1 Areas identified for Artificial Recharge in RajasthanFig. 8.19.1 Areas feasible for Artificial Recharge in SikkimFig. 8.20.1 Areas identified for Artificial Recharge in Tamil NaduFig. 8.20.2 Special areas identified for Artificial Recharge in Tamil NaduFig. 8.21.1 Areas suitable for Artificial Recharge in Uttar Pradesh

VI
Fig. 8.22.1 Areas suitable for Artificial Recharge in UttarakhandFig. 8.23.1 Areas suitable for Artificial Recharge in West BengalFig. 8.24.1 Areas suitable for Artificial Recharge in Andaman districtFig. 8.24.2 Areas suitable for Artificial Recharge in Nicobar districtFig. 8.25.1 Areas suitable for Artificial Recharge in ChandigarhFig. 8.26.1 Areas identified for Artificial Recharge in UT of Dadra & Nagar HaveliFig. 9.0 Number and type of Artificial Recharge Structures proposed except Roof top Rainwater harvesting structuresFig. 9.1 Percentage distribution of total costs of Artificial Recharge Structures proposed
(Except Roof top Rain water harvesting structures)

i

iii
EXECUTIVE SUMMARY
India is a vast country with diverse geological, geomorphological and hydrometeorological conditions,which give rise to widely varying ground water situations. The hydrogeological units are broadly classifiedinto unconsolidated, consolidated and semi-consolidated formations. Indo-Gangetic plains and coastalareas are occupied by unconsolidated formations. Almost two third of the country, mainly Peninsular Indiais covered by consolidated formations. Semi-consolidated formations occupy parts of both Peninsular andextra Peninsular India. Proliferation of ground water development by stakeholders of various sectors hasresulted in water scarcity, quality deterioration and other related development problems in many areas ofthe country. As a result, substantial decline in ground water levels is being observed both in hard rockterrain as well as alluvial areas. Ground water quality in coastal area has also been affected due to excessiveground water development and resultant sea water ingress. Pollution of ground water due to unplanneddisposal of industrial effluent and sewage is also on the rise. The ground water development in such areasneeds to be watched and augmented through suitable recharge measures to provide sustainability andprotection to ground water reservoir.
Central Ground Water Board (CGWB) prepared a “National Perspective Plan for Recharge to GroundWater by utilizing Surplus Monsoon Run-off” in 1996. The availability of non-committed surplus monsoonrun-off in 20 River Basins of the country was analyzed vis-a-vis the sub-surface available space underdifferent hydrogeological situations for saturating the vadose zone to 3m below ground level. It was estimatedthat it is possible to store 21.4 M.ha.m of surplus monsoon runoff in ground water reservoir, out of which16.05 M.ha.m can be utilized. The plan presented a conceptual framework for utilization of surplus monsoonrun-off for artificial recharge of ground water.
CGWB had prepared a Master Plan for Artificial Recharge to Ground Water earlier in the year 2002. TheMaster Plan envisaged the number of artificial recharge and water conservation structures in the country as39 lakh at an estimated cost of Rs. 24,500 crores. Based on the above, various State Agencies andCGWB have taken up the construction of artificial recharge structures on a large scale under State/Centralsector schemes.
Problems that may arise in coastal and hard rock aquifers and over-development in isolated pockets in“Safe” blocks are also to be addressed in coming years. The ground water quality issues also need to befocused on new areas of integrated approach in rain water harvesting and recharge to ground water.Considering this, some changes in the methodology in artificial recharge are proposed.
Based on the experience gained under demonstrative artificial recharge program and artificial recharge toground water through dug well scheme, the need for identification of specific new areas in different Statesfor additional artificial recharge to ground water was felt. To implement schemes in an effective manner,state-wise presentation of the base data on existing recharge structures and proposals in the pipeline isrequired. Also, the feasibility of diverting flood water or surplus run off from rainfall from one region toanother region is examined. The new guidelines for taking up recharge schemes without affecting theexisting surface water storage structures are also envisaged.
The Chairman, CGWB, constituted a Committee to prepare new guidelines for revision of Master Plan forartificial recharge to ground water for the country and the Committee submitted the report in September2008. The committee recommended broad guidelines for selection of priority areas, schemes for different
v
agroclimatic areas and use of transported water for recharge, creation of data base on existing rechargestructures for planning any new schemes in a given time and other recommendations. The demand sidemanagement of ground water resources was given stress by the Committee.
Based on the recommendations of the Committee, the present revised Master Plan is prepared on thebasis of hydrogeological parameters and hydrological data base available for each State. The identificationof feasible areas for artificial recharge to ground water was made on the basis of depth and declining trendof ground water levels. The decadal average depth to water level for post monsoon period was taken toestimate the sub-surface storage space for recharge and volume of water needed to saturate the vadosezone to 3m below ground level. The quantification of surplus monsoon run-off was made for the identifiedareas/sub-basins. The computations for surface water available to harness in each identified areas weremade to plan the feasibility of different artificial recharge structures. Based on the hydrogeological situationof each of the states the feasible number of different artificial recharge structures and their cost estimateswere made.
A total area of about 9,41,541 sq.km. has been identified in various parts of country where artificialrecharge to ground water is feasible. This also includes hilly terrain of Jammu and Kashmir, HimachalPradesh, Uttarakhand, North Eastern States & Islands where the structures are proposed to improve thesustainability of springs and freshwater.
It is estimated that annually about 85,565 MCM of surplus run-off is to be harnessed to augment theground water. Most of the basins of the country, particularly in Peninsular India are having marginal/negligible surplus runoff, where considerable space in underground reservoirs is available. Hence, surplusrunoff is not available for recharge to ground water in various areas, which otherwise need artificial recharge.The surplus runoff available in North Eastern States, Himachal Pradesh and Islands is very high and due tolimited space available underground for recharge, the surplus run off calculation is not separately given.However, for the stabilization of springs and improving the ground water scenario in existing localizedground water extraction areas, few recharge structures are identified and will be executed by consideringthe local ground slope and vulnerability of landslides, etc. in these areas.
In rural areas, suitable structures like percolation tanks, check dams, nala bunds, gully plugs, gabionstructures etc. and sub-surface techniques of recharge shaft, well recharge etc. have been recommended.Provision to arrest ground water flow through ground water dams has also been made in some states.
The revised Master Plan envisages construction of about 1.11crore artificial recharge structures in urbanand rural areas at an estimated cost of about Rs. 79,178 crores. This comprises of around 88 lakh rechargestructures/ facilities utilizing rain water directly from roof top and around 23 lakh artificial recharge and rainwater harvesting structures for conserving surplus runoff and recharging ground water in aquifers. Thebreak-up includes around 2.90 lakh check dams, 1.55 lakh gabion structures, 6.26 lakh gully plugs, 4.09lakh nala bunds/cement plugs 84925 percolation tanks, 8281 sub-surface dykes, 5.91 lakh rechargeshafts,1.08 lakh contour bunds,16235 injection wells and 23172 other structures which includes pointrecharge structures recharge tubewells, stop dams, recharge trenches, anicuts, flooding structures, inducedrecharge structures, weir structures etc. In North Eastern States, Andaman & Nicobar and Sikkim emphasishas been given to spring development and 2,950 springs are proposed for augmentation and development.
vi

The areas having existing recharge structures are recommended to revisit for evaluating their performanceand supplementing advanced techniques such as recharge shafts, recharge bores and tube wells for improvingthe overall efficiency of recharge structures.
The need for conservation of ground water has been emphasized in urban areas. The roof top rainwaterharvesting is proposed both by augmenting the ground water storage as well as by storing it in speciallybuilt tanks. It is estimated that 88 lakh roof top rainwater harvesting structures are feasible in the country atan estimated cost of Rs. 16266 crores. The total cost of the revised Master Plan for Artificial Recharge toGround water is estimated around Rs.79178 crores. The cost estimates have been computed on the basisof costs of various structures in the year 2011. The actual implementation of the plan is suggested to betaken up in a phased manner over a time period of 10 years. Part of the estimated cost of the order of Rs15,000 crores may be utilized by Ministry of Water resources, Government of India to fund the rechargeprojects to states as central assistance and also for taking up action research program like construction ofinjection wells in identified deeper aquifers of the country.
The ongoing MGNREGA work will be also used to improve the existing rain water harvesting and rechargestructures, creating specific supply channels and desilting of trenches, ponds etc. The community participationat Panchayat level for such work through concerned central ministries is estimated at Rs 20,000 crores fora period of 10 years.
The stakeholder industries (existing/new) would be involved in implementing rain water harvesting andrecharge to ground water as part of Ministry of Environment & Forest directions with technical guidance ofCGWB and state agencies. The expected contribution from industrial sector is estimated at Rs. 20,000crores. The balance of about Rs. 24,178 crores would be spent by State/Central Government Departmentsunder various programmes by involving the line Departments in the State, particularly Integrated WatershedDevelopment Department, Forest Department, Public Works Department, Horticulture Department, Roadsand Buildings Department, Agriculture Department and Water Supply Departments.
vii
MASTER PLAN FOR ARTIFICIAL RECHARGETO GROUND WATER IN INDIA
AT A GLANCE
1. Area identified for Artificial Recharge 941541 sq. km.
2. Volume of water to be recharged 85565 MCM
3. Total number of structures proposed (in lakhs)
(i) In Rural areas 22.83
(ii) In Urban areas 87.99
Total 110.82
4. Estimated Cost (Rs. in crores)
(i) In Rural areas 61192
(ii) In Urban areas 17986
Total 79178
i x
1
MASTER PLAN FOR ARTIFICIAL RECHARGETO GROUND WATER IN INDIA
1.0 INTRODUCTION
1.1 BACKGROUND
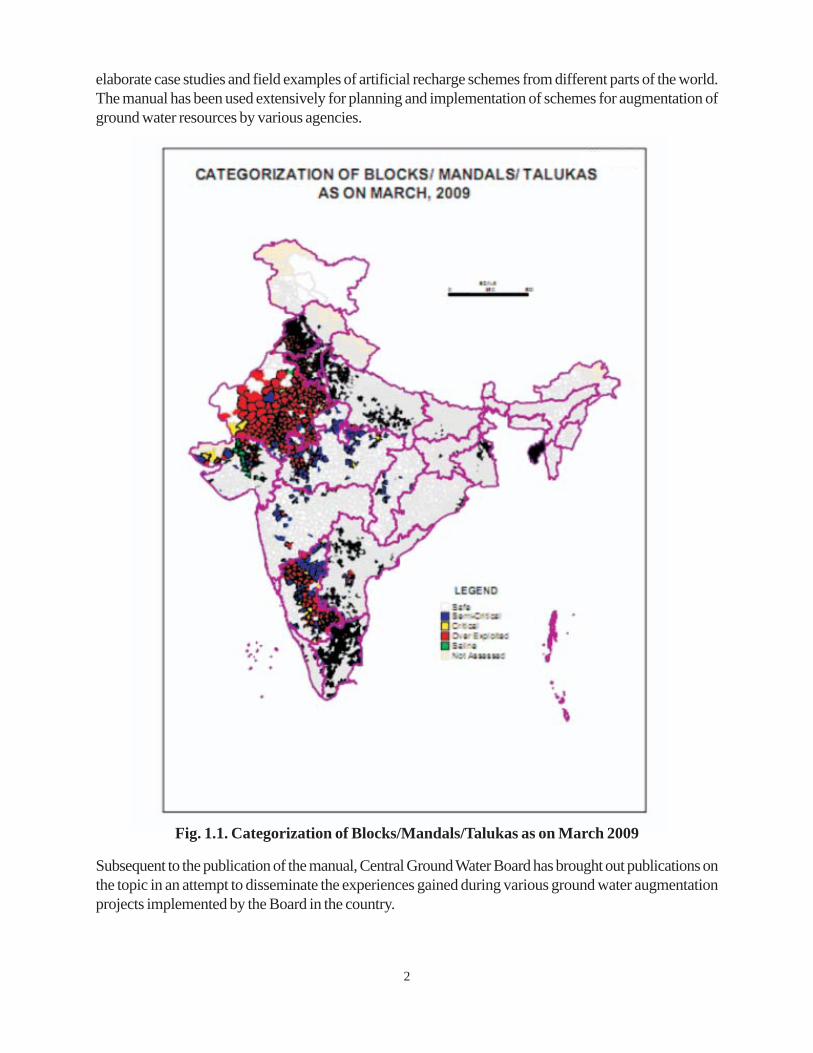
The rapid development of ground water resources for varied usage has contributed in expansion of irrigatedagriculture, overall economic development and in improving the quality of life in India. Ground water,which is the source for more than 85 percent of rural domestic water requirements, 50 percent of urbanwater requirements and more than 50 percent of irrigation requirements of the country, is depleting fast inmany areas due to its large-scale withdrawal for various sectors. The ground water development with timehas changed the hydrogeological regime and as a result natural recharge components have altered to agreat extent. Out of a total of 5723 assessment units (Blocks/Mandals/Talukas) in the country, 839 havebeen categorized as ‘Over-exploited’ as assessed on 31st March 2004, with ground water extraction inexcess of the net annual recharge. There were also 226 ‘Critical’ assessment units where the ground waterdraft is between 90 and 100 percent of the annual replenishment, apart from 30 blocks having only salineground water. As per latest ground water resource estimation as on 31st March, 2009, the stage of groundwater development of the country is worked out to be around 61%. Out of the 5842 assessment units, 802units have been categorized as ‘Over-exploited’, 169 as ‘Critical’and 523 units as ‘Semi-Critical’. Thereare 71 saline units and 4277 ‘Safe’ units. The annual replenishable ground water resource is 431 BCM andnet ground water availability is 396 BCM. Categorization of Blocks/Mandals/Talukas is shown in Fig.1.1.The total annual ground water draft is 243 BCM and balance ground water resources available for furtherdevelopment is 153 BCM.
The revised ground water estimation indicated the improvement in the water levels due to the large scaleartificial recharge activities and irrigation management practices as observed in Tamil Nadu and AndhraPradesh. Over-development of the ground water resources results in declining ground water levels, shortagein water supply, intrusion of saline water in coastal areas and increased pumping lifts necessitating deepeningof ground water structures. Geogenic contamination of ground water due to high concentrations of Arsenic,Fluoride and Iron in excess of limits prescribed for drinking purposes (BIS, 2004) has also been observedin many parts of the country. The development of ground water resource in such areas therefore needs tobe regulated and augmented through suitable measures to provide sustainability. The National Water Policy,2002 enunciates development and implementation of ground water recharge projects for augmenting theavailable supplies. It also envisages integrated and coordinated development of surface and ground water.Development of ground water needs to be kept under constant check near the coast to prevent ingress ofsea water into fresh water aquifers. As such the ground water reservoir in different areas needs suitablemanagement efforts for protection and augmentation.
To tackle the twin hazards of de-saturation of aquifer zones and consequent deterioration of ground waterquality, there is an urgent need to augment the ground water resources through suitable managementinterventions. Artificial recharge has now been accepted world-wide as a cost-effective method to augmentground water resources in areas where continued overexploitation without due regard to their rechargingoptions has resulted in various undesirable environmental consequences.
A ‘Manual on Artificial Recharge of Ground Water’ providing detailed guidelines on investigative techniquesfor selection of sites, planning and design of artificial recharge structures, monitoring and economic evaluationof artificial recharge schemes was brought out by Central Ground Water Board in 1994. It also included
2
elaborate case studies and field examples of artificial recharge schemes from different parts of the world.The manual has been used extensively for planning and implementation of schemes for augmentation ofground water resources by various agencies.
Fig. 1.1. Categorization of Blocks/Mandals/Talukas as on March 2009
Subsequent to the publication of the manual, Central Ground Water Board has brought out publications onthe topic in an attempt to disseminate the experiences gained during various ground water augmentationprojects implemented by the Board in the country.
3
These are:-
1) Manual on Artificial Recharge of Ground Water (1994)
2) National Perspective Plan for Recharge to Ground Water by Utilizing Surplus Monsoon Runoff(1996)
3) Guide on Artificial Recharge to Ground Water (1998)
4) Guide on Artificial Recharge to Ground Water (2000)
5) Master Plan for Artificial Recharge to Ground Water (2002)
6) Manual on Artificial Recharge of Ground Water (2009)
7) Select Case Studies on Rain Water Harvesting and Artificial Recharge (2011)
Apart from these, Central Ground Water Board has also published technical brochures on various aspectsof artificial recharge through its Regional Directorates, in its local vernacular languages, which served asguidelines to various governmental and non-governmental agencies and the general public. Some of theState Departments have also brought out manuals and guidelines on artificial recharge to ground water,which dealt with specific areas in most cases. There were also many projects implemented at state andnational level with people’s participatory approach in executing recharge projects. It is felt that there is aneed for convergence of data and information on ongoing recharge and rain water harvesting projects aswell as the optimization of the number of structures.
1.1.1 SALIENT FEATURES OF MASTER PLAN -2002
The preparation of master plan for artificial recharge to ground water in different states, prepared byCentral Ground Water Board in 2002, aims at providing area specific artificial recharge techniques toaugment the ground water reservoir based on the twin important requirements of source water availabilityand capability of ground water reservoir to accommodate it. The specific problems in different areas in thestates like excessive ground water development resulting in ground water decline, water scarcity due toinadequate recharge in arid areas, low ground water retention in hilly areas despite substantial rainfall,urban areas with limited ground water recharge avenues and related problems of urban pollution, etc.,have been considered while preparing the master plan. To fully utilize the available surplus monsoon runoffin rural areas, emphasis has been given for adoption of artificial recharge techniques based on surfacespreading like percolation tanks, nala bunds, etc. and sub surface techniques of recharge shaft, well recharge,etc. In urban areas, hilly areas and coastal regions priority has to be given to rain water conservationmeasures through roof top harvesting techniques etc.
The Master Plan while bringing out the areas suitable for artificial recharge to ground water reservoir,prioritizes the areas wherein schemes need to be implemented as a first priority to ameliorate the waterscarcity problems. The proposals and schemes recommended are not the ultimate ones but are the firststage of implementation. These need to be further extended in other areas depending on the availability ofinfrastructure, finances and future problems.
The master plan envisaged the number of artificial recharge and water conservation structures in thecountry as 39 lakh at an estimated cost of Rs. 24,500 crores.
4
Experiments on artificial recharge to aquifers started in India from1970 onwards by Central and StateGovernment Departments and individually by some NGOs in different parts of the country where earlysigns of overexploitation of ground water were noticed. The Central Ground Water Board under tookartificial recharge experiments through injection well around Kamliwala in Central Mehsana, Gujarat wheresufficient water was available from Saraswati River during monsoon period. A detailed injection rechargeexperiment was carried out at the Kamliwala site by injecting water from the source well in Saraswati Riverbed to the injection well by 5cm dia. siphon of galvanized pipe, at a rate of 225 m3/day for 250 days.There was a building of 5 meters piezometric head in the injection well and 0.6 to 1.0 m in wells in areas of150 m away. These experiments indicated feasibility of ground water recharge through injection wells inthe area. Subsequently several such studies were taken up in different states of the country. The details ofdemonstrative artificial recharge studies taken up by CGWB during different five year plans are furnishedin table 1.1.
Table 1.1 Artificial Recharge Studies taken by CGWB during different Five Year Plans
Plan Status Cost
(crores) VIII
(1992-97) Maharashtra, Karnataka, Andhra Pradesh, Delhi, Kerala, Madhya Pradesh, Tamil Nadu, West Bengal & Chandigarh (Total States/UT – 9)
3.23
IX (1997-2002)
Andhra Pradesh, Arunachal Pradesh, Assam, Andaman & Nicobar, Bihar, Chandigarh, Gujarat, Haryana, Himachal Pradesh, Jammu & Kashmir, Jharkand, Karnataka, Kerala, Lakshdweep, Madhya Pradesh, Maharashtra, Meghalaya, Mizoram, Nagaland, Delhi, Odisha, Punjab, Rajasthan, Tamil Nadu, Uttar Pradesh, Uttrakhand and West Bengal (Total States/UT – 27)
33.10
X (2002-2007)
Andhra Pradesh, Karnataka, Madhya Pradesh & Tamil Nadu (Total States – 4)
5.60
XI (2007-2012)
Andhra Pradesh, Arunachal Pradesh, Bihar, Chhattisgarh, Chandigarh, Delhi, Gujarat, Himachal Pradesh, Jammu & Kashmir, Jharkhand, Kerala, Karnataka, Maharashtra, Madhya Pradesh, Nagaland, Odisha, Punjab, Rajasthan, Tamil Nadu, Uttar Pradesh and West Bengal (Total States/UT – 21)
99.87
Over exploited, critical, coastal and urban aquifers as well as ground water quality issues were given focusin the above schemes and some suggestions were also received for revision of the Master Plan. A separatescheme on Dug well recharge was prepared for Tamil Nadu, Gujarat, Madhya Pradesh, Karnataka,Maharashtra, Rajasthan and Andhra Pradesh states at the estimated cost of Rs. 1871 crores covering4.455 Million irrigation dug wells covering 1155 blocks in seven participating states. The Scheme is beingimplemented through NABARD, CGWB and identified nodal agencies in the state. Under this scheme,farmers were given fund directly for the construction of recharge pits near the dug well at a average cost ofRs 4000/- which varies from Rs.3600/- (Maharashtra) to Rs.5700/- (Andhra Pradesh). As on March2012, 1,14,205 dug well recharge structures were completed under this scheme.
5
The earlier Master Plan prepared by the Government of India also needs updating of physical and financialtargets to account the executed work and to arrive at a base for further implementation with the involvementof state and other stake holders at grass root level.
1.2 PRESENT ENDEAVOUR
It is decided to revise and update the Master Plan of Artificial Recharge (2002) as on March 2011, byincorporating the actual progress made in the targets up to 2010-11 and also reassessing the new areas ofrecharge to make use of the experience already gained and the input received from the impact assessmentof select schemes executed by Central Ground Water Board through state agencies under central sectorand centrally sponsored schemes.
1.3 CONSTITUTION OF GROUP
Realizing the necessity to revise the earlier Master Plan for Artificial Recharge to Ground Water for differentStates and Union Territories of the country, CGWB has constituted a committee vide letter no.13-15/MSML/AR/District plan/09-465- dated 26th April 2011.
The composition of the committee is as follows:
1. Dr. N.Varadaraj, Regional Director, CGWB, SR, Hyderabad - Chairman
2. Sh. Manoj Srivastava, Regional Director, CGWB, WR, Jaipur - Member
3. Dr K.M. Najeeb, Regional Director, CGWB, SWR, Bangalore - Member
4 Sh. Sanjay Marwaha, Suptdg. Hydrogeologist, CGWB, NR, Lucknow - Member Coordinator
A Group was constituted earlier by the Chairman, CGWB to prepare new guidelines for revision ofMaster Plan for Artificial Recharge to Ground Water for the country with Sh. Sushil Gupta, then RegionalDirector, NWR, and Dr N.Varadaraj, then Regional director, SECR along with Sh. Sanjay Marwaha andDr S.Suresh, Scientists. The group submitted the report in September 2008 and recommended broadguidelines for selection of priority area, schemes for different agro-climatic areas and use of transportedwater for recharge, creation of data base on existing recharge structures for planning any new schemes ina given time and other recommendations. (Annexure I-A to I-C). The demand side water managementwas given stress by the committee. Based on the concept note prepared during the year 2008, by Sh.Sushil Gupta, Member (SML), Dr. N.Varadaraj, Regional Director under the guidance of Dr. S.C.Dhiman,Chairman, CGWB, the approach for revision of the Master Plan was finalized. Regional Directors ofCGWB have collected the required input from various states and facilitated the revision of the MasterPlan. The group members held meetings to discuss the various issues and prepared a model physical andfinancial outlay for eliciting desired information from different States. The Regional Directors of CGWBwere requested to send the details on the various ongoing schemes of artificial recharge as well as additionalrequirement in consultation with concerned state agencies. The data made available by the Regional officeswere utilized in preparing the revised Master Plan for Artificial Recharge.
6
2.0 NATIONAL SCENARIO OF GROUND WATER
2.1 HYDROGEOLOGICAL SET UP
India is a vast country with varied hydrogeological situations resulting from diversified geological,climatological and topographic set up. The rock formations, ranging in age from Archaean to Recent,control occurrence and movement of ground water. Physiography varies widely from rugged mountainousterrains of Himalayas, Eastern Ghats, Western Ghats and Deccan Plateau to the flat alluvial plains of theriver valleys and coastal tracts, and the Aeolian deserts in western part. Similarly rainfall pattern alsoshows region wise variations.
Various rock types occurring in the country have been categorized as follows to describe the ground watercharacteristics.
1. Porous rock formation
(a) Unconsolidated formations.
(b) Semi-consolidated formations
2. Hard rock/ consolidated formations
The proper understanding of the characteristics of rock types help in site selection and designing artificialrecharge structures. The area recording high yield is obviously having more storage potential and hencethere is scope for more recharge to ground water.
2.1.1 POROUS ROCK FORMATIONS
2.1.1.1 Unconsolidated Formations
The sediments comprising newer alluvium, older alluvium and coastal alluvium are by and large the importantrepositories of ground water. These are essentially comprised of clay, sand, gravel and boulders, ferruginousnodules, kankar (calcareous concretions), etc. The beds of sand and gravel and their admixtures formpotential aquifers. The aquifer materials vary in particle size, roundness and sorting. Consequently, theirwater yielding capabilities vary considerably. The coastal aquifers show wide variations in the waterquality both laterally and vertically.
The piedmont zone of the Himalayas extending from Jammu and Kashmir in the west to Tripura in the east,offers suitable locations for artificial recharge. The hydrogeological conditions and ground water regime inIndo-Ganga-Brahmaputra basin indicate existence of large quantities of fresh ground water down to 600.5m or more below land surface. Bestowed with high rainfall and good recharge conditions, the groundwater gets replenished every year in these zones. The alluvial aquifers to the explored depth of 600 m havetransmissivity values from 250 to 4000 m2/day and hydraulic conductivity from 10 to 800 m/day.
2.1.1.2 Semi-consolidated Formations
The semi-consolidated formations mainly comprise shales, sandstones and limestones. The sedimentarydeposits belonging to Gondwana and Tertiary formations are included under this category. The sandstonesform highly potential aquifers locally, particularly in Peninsular India. Elsewhere they have only moderatepotential and at places they yield meagre supplies. These sediments normally occur at narrow valleys or
7
structurally faulted basins. Though these formations have been identified to possess moderate potential,the physiography of the terrain, normally restricts development. Under favorable situations, these sedimentsgive rise to artesian conditions as in parts of Godavari Valley, Cambay basin and parts of West Coast,Puducherry and Neyveli in Tamil Nadu. Potential aquifers particularly those belonging to Gondwanas andTertiaries have transmissivity values from 100 to 2300 m2/day and the hydraulic conductivity from 0.5 to70 m/day. Generally the well yields in productive areas range from 10 to 50 lps. Lathi and Nagaursandstone in Rajasthan and Tipam sandstone in Tripura state also form productive aquifers.
2.1.2 HARD ROCK FORMATIONS
2.1.2.1 Consolidated Formations
The consolidated formations occupy almost two thirds of the country. From the hydrogeological point ofview, the consolidated rocks are broadly classified into the following three types:
a) Igneous and metamorphic rocks excluding volcanic and carbonate rocks
b) Volcanic rocks
c) Carbonate rocks
These formations control the ground water availability and scope for augmentation and artificial recharge.The nature, occurrence and movement of ground water in these formations are described as follows:
2.1.2.2 Igneous and Metamorphic Rocks
The most common rock types are granites, gneisses, charnockites, khondalites, quartzites, schist andassociated phyllite, slate, etc. These rocks possess negligible primary porosity but are rendered porousand permeable due to secondary porosity by fracturing and weathering.
Ground water yield and capability to accept recharge also depend on rock types. Granite and gneiss arebetter repositories than Charnockites. The ground water studies carried out in the crystalline hard rocksreveal the existence of lineaments along deeply weathered and fractured zones, locally forming potentialaquifers. These lineament zones are found to be highly productive for construction of bore wells. These inturn offer good scope for recharge through suitable techniques.
In areas underlain by hard crystalline and meta-sedimentaries viz; granite, gneiss, schist, phyllite, quartzite,charnockites, etc., occurrence of ground water in the fracture system has been identified down to a depthof 100 m and even up to 300 m locally. In most of the granite/ gneiss area, the weathered residuum servesas an effective ground water repository. It has been observed that the fracture systems are generallyhydraulically connected with the overlying weathered saturated residuum. The yield potential of the crystallineand meta-sedimentary aquifers show wide variations. Bore wells tapping the fracture systems generallyyield from less than 1.0 lps to 10 lps. The transmissivity values vary from 10 to 500 m2/day and thehydraulic conductivity values vary from 0.1 to 10 m/day.
2.1.2.3 Volcanic Rocks
The basaltic lava flows are mostly horizontal to gently dipping. Ground water occurrence in these hardrocks is controlled by the contrasting water bearing properties of different lava flows. The topography,nature and extent of weathering, jointing and fracture pattern, thickness and depth of occurrence of vesicular
8
basalts are the important factors which play a major role in the occurrence and movement of ground waterin these rocks. Basalts or Deccan Traps usually have medium to low permeability depending on thepresence of primary and secondary porosity. Pumping tests have shown that under favourable conditions,bore wells yield about 3 to 6 lps at moderate drawdown. Transmissivity and the hydraulic conductivityvalues of these aquifers are generally in the range of 25 to 100 m2/day 0.05 to 15 m/day respectively.
2.1.2.4 Carbonate Rocks
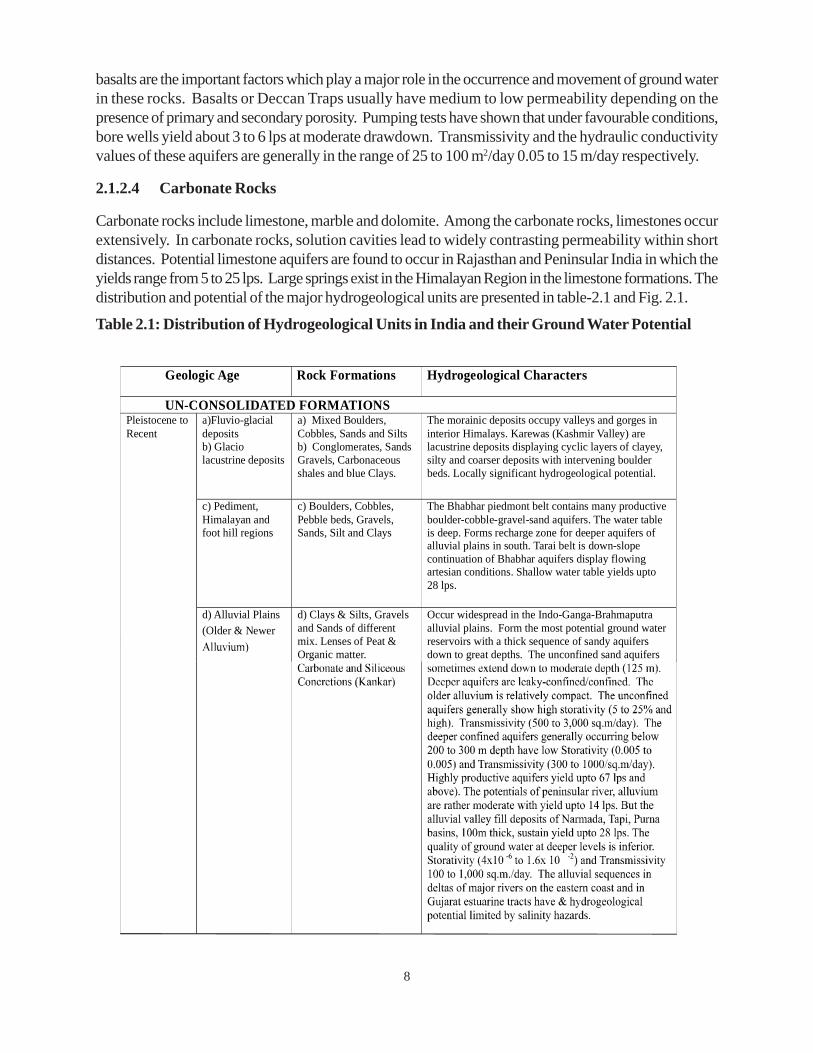
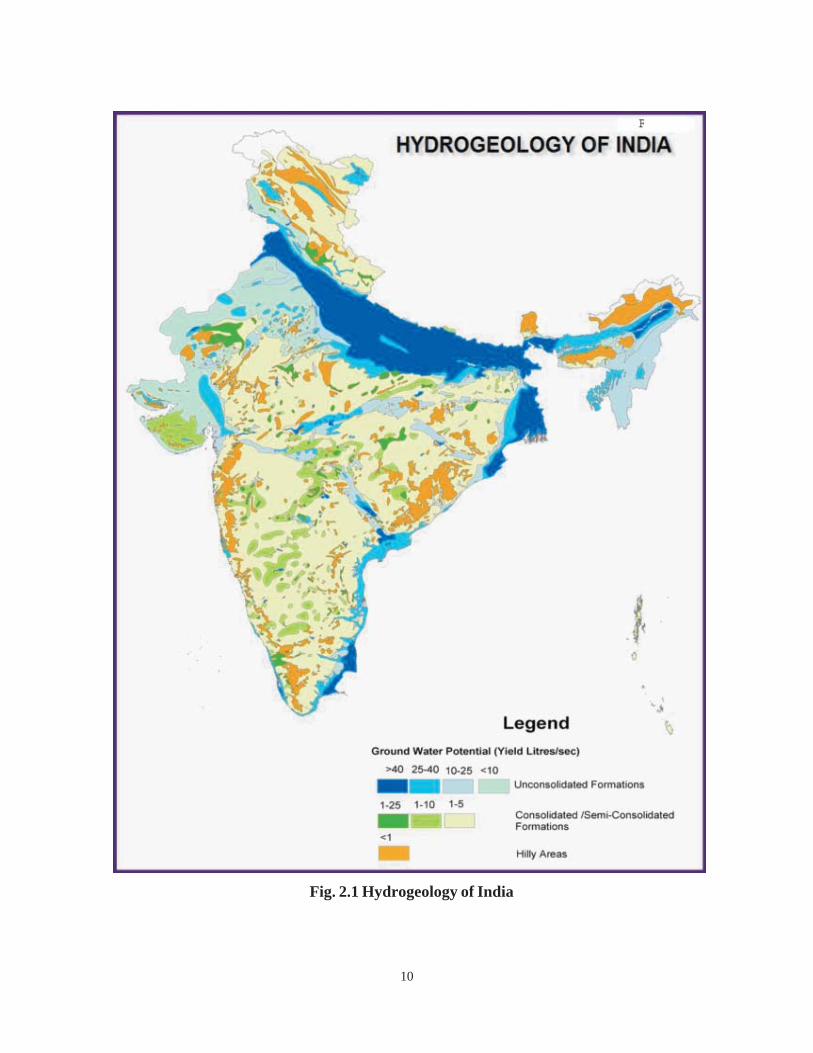
Carbonate rocks include limestone, marble and dolomite. Among the carbonate rocks, limestones occurextensively. In carbonate rocks, solution cavities lead to widely contrasting permeability within shortdistances. Potential limestone aquifers are found to occur in Rajasthan and Peninsular India in which theyields range from 5 to 25 lps. Large springs exist in the Himalayan Region in the limestone formations. Thedistribution and potential of the major hydrogeological units are presented in table-2.1 and Fig. 2.1.
Table 2.1: Distribution of Hydrogeological Units in India and their Ground Water Potential
Geologic Age Rock Formations Hydrogeological Characters
UN-CONSOLIDATED FORMATIONS a)Fluvio-glacial deposits b) Glacio lacustrine deposits
a) Mixed Boulders, Cobbles, Sands and Silts b) Conglomerates, Sands Gravels, Carbonaceous shales and blue Clays.
The morainic deposits occupy valleys and gorges in interior Himalays. Karewas (Kashmir Valley) are lacustrine deposits displaying cyclic layers of clayey, silty and coarser deposits with intervening boulder beds. Locally significant hydrogeological potential.
c) Pediment, Himalayan and foot hill regions
c) Boulders, Cobbles, Pebble beds, Gravels, Sands, Silt and Clays
The Bhabhar piedmont belt contains many productive boulder-cobble-gravel-sand aquifers. The water table is deep. Forms recharge zone for deeper aquifers of alluvial plains in south. Tarai belt is down-slope continuation of Bhabhar aquifers display flowing artesian conditions. Shallow water table yields upto 28 lps.
Pleistocene to Recent
d) Alluvial Plains (Older & Newer
d) Clays & Silts, Gravels and Sands of different mix. Lenses of Peat & Organic matter.
Occur widespread in the Indo-Ganga-Brahmaputra alluvial plains. Form the most potential ground water reservoirs with a thick sequence of sandy aquifers down to great depths. The unconfined sand aquifers
9
upto 5 lps, Storativity: 1 to 4%. Hydraulic conductivity 5 to 15 m/day. Unconfined shallow aquifers and leaky confined/confined deeper aquifers.
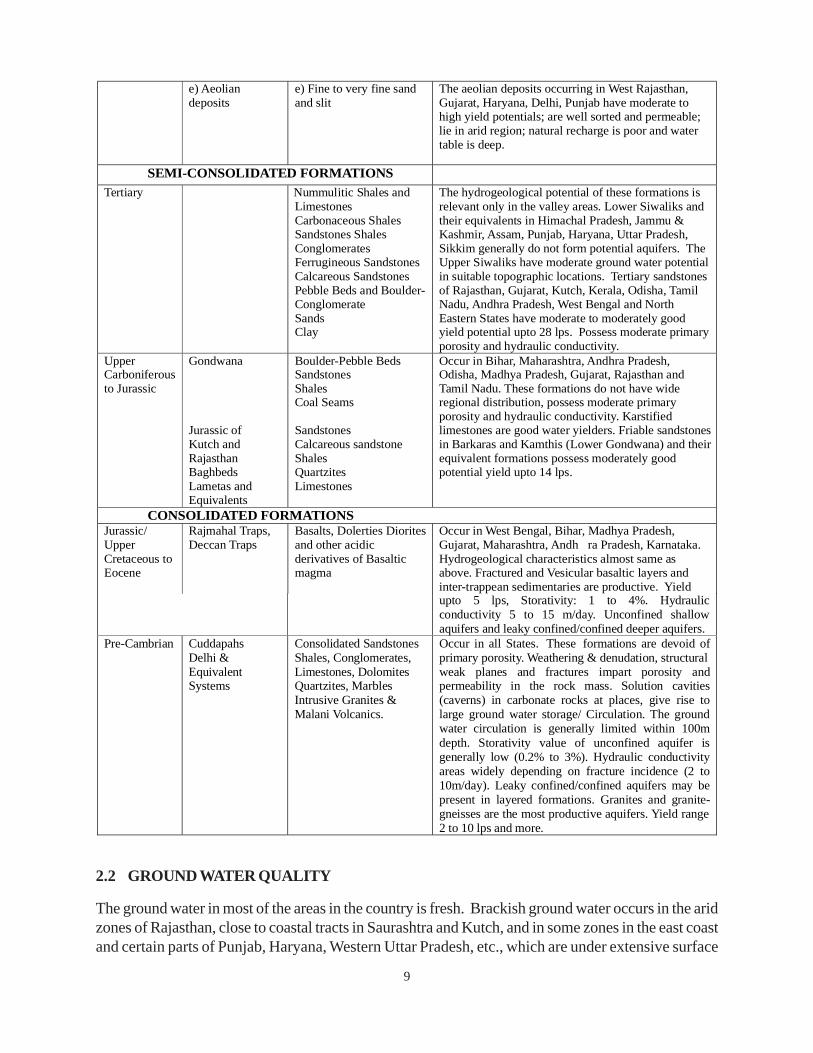
Pre-Cambrian Cuddapahs Delhi & Equivalent Systems
Consolidated Sandstones Shales, Conglomerates, Limestones, Dolomites Quartzites, Marbles Intrusive Granites & Malani Volcanics.
Occur in all States. These formations are devoid of primary porosity. Weathering & denudation, structural weak planes and fractures impart porosity and permeability in the rock mass. Solution cavities (caverns) in carbonate rocks at places, give rise to large ground water storage/ Circulation. The ground water circulation is generally limited within 100m depth. Storativity value of unconfined aquifer is generally low (0.2% to 3%). Hydraulic conductivity areas widely depending on fracture incidence (2 to 10m/day). Leaky confined/confined aquifers may be present in layered formations. Granites and granite-gneisses are the most productive aquifers. Yield range 2 to 10 lps and more.
2.2 GROUND WATER QUALITY
The ground water in most of the areas in the country is fresh. Brackish ground water occurs in the aridzones of Rajasthan, close to coastal tracts in Saurashtra and Kutch, and in some zones in the east coastand certain parts of Punjab, Haryana, Western Uttar Pradesh, etc., which are under extensive surface
e) Aeolian deposits
e) Fine to very fine sand and slit
The aeolian deposits occurring in West Rajasthan, Gujarat, Haryana, Delhi, Punjab have moderate to high yield potentials; are well sorted and permeable; lie in arid region; natural recharge is poor and water table is deep.
SEMI-CONSOLIDATED FORMATIONS Tertiary Nummulitic Shales and
Limestones Carbonaceous Shales Sandstones Shales Conglomerates Ferrugineous Sandstones Calcareous Sandstones Pebble Beds and Boulder- Conglomerate Sands Clay
The hydrogeological potential of these formations is relevant only in the valley areas. Lower Siwaliks and their equivalents in Himachal Pradesh, Jammu & Kashmir, Assam, Punjab, Haryana, Uttar Pradesh, Sikkim generally do not form potential aquifers. The Upper Siwaliks have moderate ground water potential in suitable topographic locations. Tertiary sandstones of Rajasthan, Gujarat, Kutch, Kerala, Odisha, Tamil Nadu, Andhra Pradesh, West Bengal and North Eastern States have moderate to moderately good yield potential upto 28 lps. Possess moderate primary porosity and hydraulic conductivity.
Upper Carboniferous to Jurassic
Gondwana Jurassic of Kutch and Rajasthan Baghbeds Lametas and Equivalents
Boulder-Pebble Beds Sandstones Shales Coal Seams Sandstones Calcareous sandstone Shales Quartzites Limestones
Occur in Bihar, Maharashtra, Andhra Pradesh, Odisha, Madhya Pradesh, Gujarat, Rajasthan and Tamil Nadu. These formations do not have wide regional distribution, possess moderate primary porosity and hydraulic conductivity. Karstified limestones are good water yielders. Friable sandstones in Barkaras and Kamthis (Lower Gondwana) and their equivalent formations possess moderately good potential yield upto 14 lps.
CONSOLIDATED FORMATIONS Jurassic/ Upper Cretaceous to Eocene
Rajmahal Traps, Deccan Traps
Basalts, Dolerties Diorites and other acidic derivatives of Basaltic magma
Occur in West Bengal, Bihar, Madhya Pradesh, Gujarat, Maharashtra, Andh ra Pradesh, Karnataka. Hydrogeological characteristics almost same as above. Fractured and Vesicular basaltic layers and inter-trappean sedimentaries are productive. Yield
10
Fig. 2.1 Hydrogeology of India
11
water irrigation. The fluoride levels in the ground water are considerably higher than the permissible limit invast areas of Andhra Pradesh, Haryana and Rajasthan and in some parts of Punjab, Uttar Pradesh, M.P.,Karnataka and Tamil Nadu. In the north-eastern regions, ground water with iron content above thedesirable limit occurs widely. Pollution due to human and animal wastes and fertilizer application hasresulted in high levels of nitrate and potassium in ground water in some parts of the country. Ground watercontamination in pockets of industrial zones is observed in localized areas. The over-exploitation of thecoastal aquifers in the Saurashtra and Kutch regions of Gujarat has resulted in salinisation of coastalaquifers due to sea water ingress. The excessive ground water withdrawal near the city of Chennai has ledto seawater intrusion into coastal aquifers. The artificial recharge techniques can be utilized in improving thequality of ground water and to maintain the delicate fresh water-salt water interface in coastal zone.
2.3 GROUND WATER RESOURCE POTENTIAL
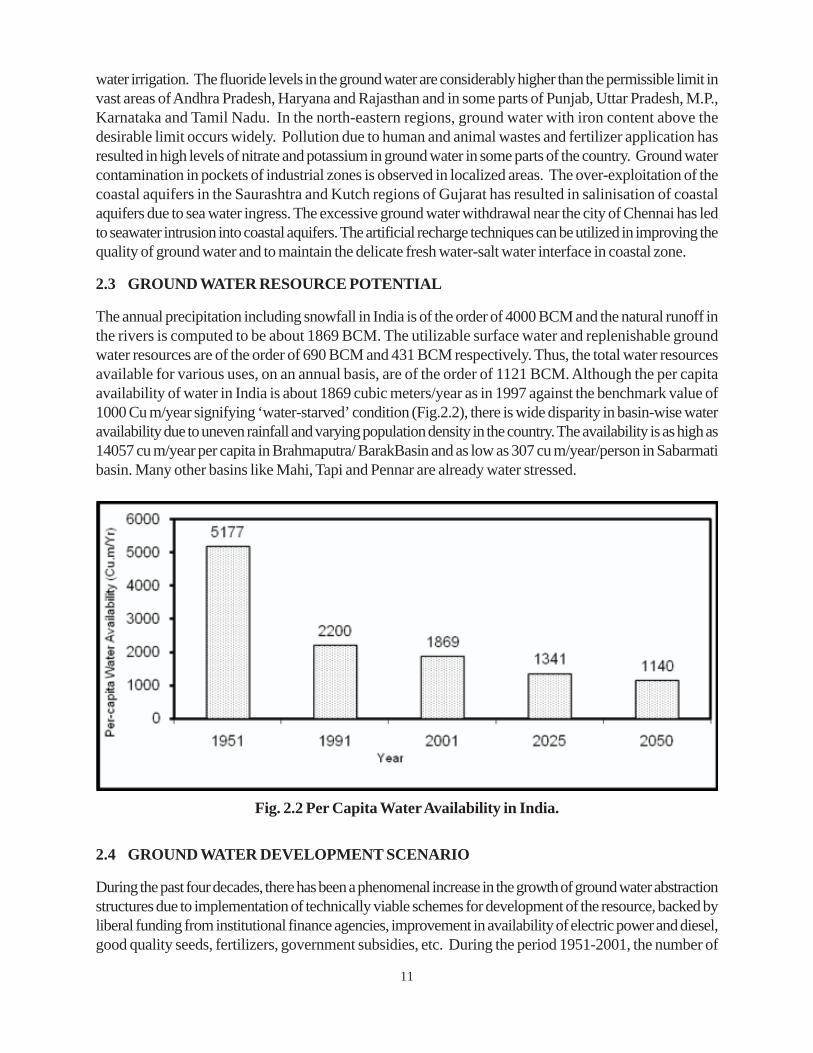
The annual precipitation including snowfall in India is of the order of 4000 BCM and the natural runoff inthe rivers is computed to be about 1869 BCM. The utilizable surface water and replenishable groundwater resources are of the order of 690 BCM and 431 BCM respectively. Thus, the total water resourcesavailable for various uses, on an annual basis, are of the order of 1121 BCM. Although the per capitaavailability of water in India is about 1869 cubic meters/year as in 1997 against the benchmark value of1000 Cu m/year signifying ‘water-starved’ condition (Fig.2.2), there is wide disparity in basin-wise wateravailability due to uneven rainfall and varying population density in the country. The availability is as high as14057 cu m/year per capita in Brahmaputra/ BarakBasin and as low as 307 cu m/year/person in Sabarmatibasin. Many other basins like Mahi, Tapi and Pennar are already water stressed.
Fig. 2.2 Per Capita Water Availability in India.
2.4 GROUND WATER DEVELOPMENT SCENARIO
During the past four decades, there has been a phenomenal increase in the growth of ground water abstractionstructures due to implementation of technically viable schemes for development of the resource, backed byliberal funding from institutional finance agencies, improvement in availability of electric power and diesel,good quality seeds, fertilizers, government subsidies, etc. During the period 1951-2001, the number of

12
dug wells increased from 3.86 million to 9.62 million that of shallow tube wells from 3000 to 8.35 millionand deep tube wells from negligible to 0.53 million. There has been a steady increase in the area irrigatedfrom ground water from 6.5 Mha in 1951 to 44.98 Mha in 2001. The ground water abstraction structuresare projected to be in the order of 27 million as on March, 2011.
Such a magnitude of ground water development with sub optimal planning has resulted in creating deleteriouseffects in terms of ground water depletion and quality deterioration. These multiple challenges emerging indifferent parts of country need a suitable ground water management approach. Augmentation and artificialrecharge to ground water reservoir offers a positive approach to overcome the problems of ground waterdepletion and affected quality. The revision of Master Plan for Artificial Recharge is an effort in thisdirection.
13
3.0 CONCEPT OF ARTIFICIAL RECHARGE TO GROUND WATER
The artificial recharge to ground water aims at augmentation of ground water reservoir by modifying thenatural movement of surface water utilizing suitable civil construction techniques. Artificial recharge techniquesnormally address to the following issues:
• To enhance the sustainability in areas where over-development has depleted the aquifer.
• Conservation and storage of excess surface water for future requirements, since these requirementsoften change within a season or a period
• To improve the quality of existing ground water through dilution.
3.1 GROUND WATER RESERVOIRS
The rivers and rivulets of the Indian sub continent are mainly monsoon fed with 80 to 90 percent runoffgenerated during the monsoon. The principle source for ground water recharge is also monsoon precipitation.The country receives more than 75% monsoon rainfall from June to September except in the eastern coast.Annually the rainy days vary from 12 to 100, and actual rainfall time varies from a few hours to over 300hours. Incidences of up to 60 percent annual rainfall within a few days duration in a year are common inmany parts of the country, causing excessive runoff, taking a heavy toll of life, agriculture and property.Harnessing of excess monsoon runoff in ground water storage/reservoir will not only increase the availabilityof water to meet the growing water demands, but also help in controlling damages from floods.
The sub surface reservoirs are technically feasible alternatives for storing surplus monsoon runoff and storesubstantial quantity of water. The sub surface geological formations may be considered as “warehouse”for storing water that come from sources located on the land surface. Besides suitable lithological condition,other considerations for creating sub surface storages are favorable geological structures and physiographicunits, whose dimensions and shape will allow retention of substantial volume of water in porous andpermeable formations.
The sub surface reservoirs located in suitable hydrogeological situations will be environment friendly andeconomically viable for artificial recharge. The sub surface storages have advantages of being free fromthe adverse effects like inundation of large surface area, loss of cultivable land, displacement of localpopulation, substantial evaporation losses and sensitivity to earthquakes. No gigantic structures are neededto store sub-surface water. The underground storage of water also has beneficial influence on the existingground water regime and abstraction structures. The deeper water levels in many parts of the countryeither of natural occurrence or due to excessive ground water development, may be substantially raised,resulting in reduction on lifting costs and energy saving. The quality of natural ground water would substantiallyimprove in brackish and saline areas. The conduit function of aquifers can further help in natural sub-surface transfer of water to various needy centres, thereby reducing the cost intensive surface waterconveyance system. The effluence resulting from such sub-surface storage of various surface intersectionpoints in the form of spring line, or stream emergence, would enhance the river flows and improve thedegraded eco-system of riverine tracts, particularly in the outfall areas. The structures required for arrestingsurface runoff and recharging to ground water reservoirs are of small dimensions and cost effective such ascheck dams, percolation tanks, surface spreading basins, pits, sub-surface dykes, etc. and these can beconstructed with local knowhow.
14
3.2 BASIC REQUIREMENTS
The basic requirements for recharging the ground water reservoir are:
• Availability of non-committed surplus monsoon run off in space and time.
• Identification of suitable sites for creating sub-surface reservoir in suitable hydrogeological environmentthrough cost effective artificial recharge techniques.
3.2.1 SOURCE WATER AVAILABILITY
The availability of source water, one of the prime requisites for ground water recharge, is basically assessedin terms of non-committed surplus monsoon run off, which as per present water resource developmentscenario is going unutilized. This component can be assessed by analyzing the monsoon rainfall pattern, itsfrequency, number of rainy days, and maximum rainfall in a day and its variation in space and time. Thevariations in rainfall pattern in space and time, and its relevance in relation to the scope for artificial rechargeto sub-surface reservoirs can be considered for assessing the surplus surface water availability.
3.2.2 HYDROGEOLOGICAL ASPECTS
Detailed knowledge of geological and hydrological features of the area is necessary for adequately selectingthe site and the type of recharge structure. In particular, the features, parameters and data to be consideredare geological boundaries, hydraulic boundaries, inflow and outflow of waters, storage capacity, porosity,hydraulic conductivity, transmissivity, natural discharge of springs, water resources available for recharge,natural recharge, water balance, lithology, depth of the aquifer, and tectonic boundaries. The aquifers bestsuited for artificial recharge are those aquifers which absorb large quantities of water and do not releasethem too quickly. Theoretically this will imply that the vertical hydraulic conductivity is high, while thehorizontal hydraulic conductivity is moderate. These two conditions are not often encountered in nature.
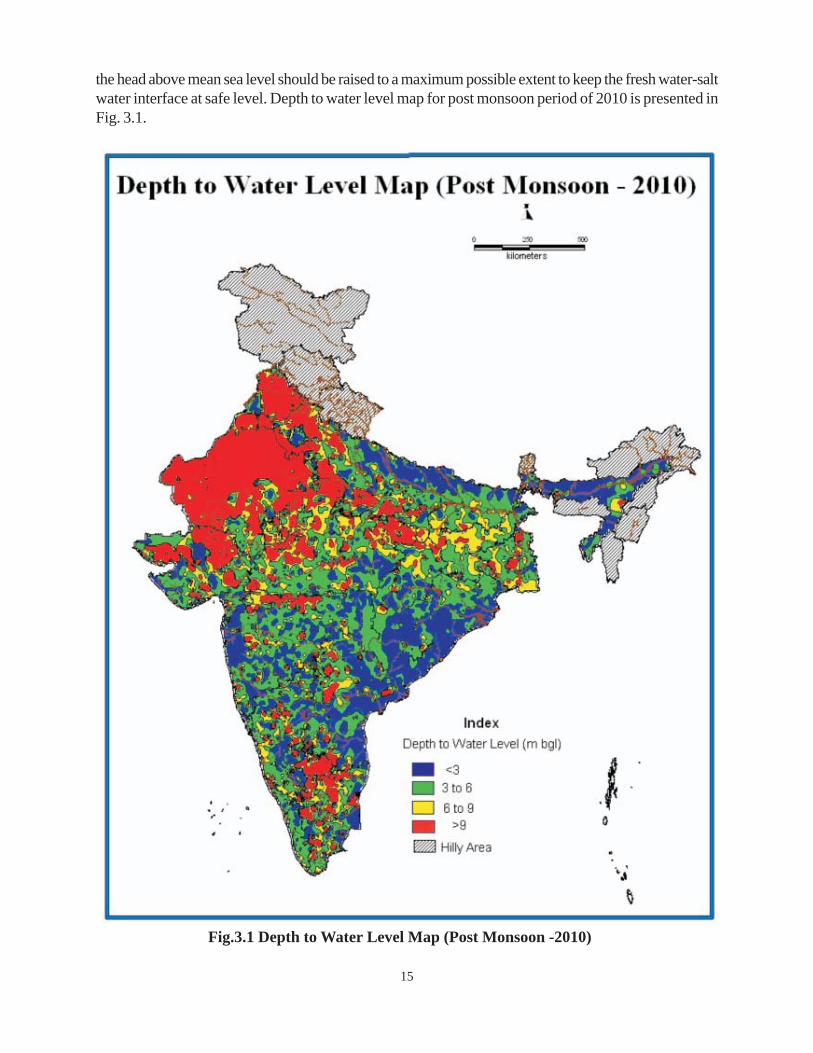
The evaluation of the storage potential of sub-surface reservoir is invariably based on the knowledge ofdimensional data of reservoir rock, which includes their thickness and lateral extent. The availability ofsub-surface storage space and its replenishment capacity further govern the extent of recharge. Thehydrogeological situation in each area needs to be appraised with a view to assess the recharge capabilitiesof the underlying hydrogeological formations. The unsaturated thickness of rock formations, occurringbeyond three meters below ground level should be considered to assess the requirement of water to buildup the sub-surface storage by saturating the entire thickness of the vadose zone to 3 meter below groundlevel. The upper 3 m of the unsaturated zone is not considered for recharging, since it may cause adverseenvironmental impact e.g. water logging, soil salinity, etc. The historical water level behaviour gives an ideaof the maximum saturation existed in a given area and the present endeavour should also aim for restorationof the maximum saturation for a given hydrogeological set up. There are few states like Rajasthan wherethe water level is very deep in the historical past also. Similarly, the states with undulating terrain will havesteep hydraulic gradient and the saturation up to 3 m below ground level is not logical. The post-monsoondepth to water level represents a situation of minimum thickness of vadose zone available for rechargewhich can be considered vis-à-vis surplus monsoon run off in the area. In view of the above, depth below3 m from ground level is taken for estimation of thickness of available unsaturated zone in post monsoonperiod for most of the states. For states like Bihar (7m), Rajasthan (8m), Gujarat (6m), Kerala (6m),Maharashtra (5m) and Sikkim (5m) deeper levels are considered for estimating the available averagevolume of unsaturated mass. However, shallow level is considered in coastal and island aquifers, where
15
the head above mean sea level should be raised to a maximum possible extent to keep the fresh water-saltwater interface at safe level. Depth to water level map for post monsoon period of 2010 is presented inFig. 3.1.
Fig.3.1 Depth to Water Level Map (Post Monsoon -2010)

16
The artificial recharge techniques inter-relate and integrate the source water to ground water reservoir.This results in rise in water level and increment in the total volume of the ground water reservoir.
3.3 NATIONAL PERSPECTIVE PLAN
Central Ground Water Board in year 1996 prepared National Perspective Plan for utilization of surplusmonsoon run off for augmentation of ground water resources. This Plan was a broad policy frame of theartificial recharge schemes for implementation in the country. The Plan envisaged in situ conservation ofsurplus monsoon run off through artificial ground water recharge techniques. However, presently thetransported water is proposed to be utilized for artificial recharge structures in the absence of insitu-surplusrunoff and availability of thick unsaturated zone.
3.3.1 Salient features of National Perspective Plan
The surplus monsoon run off available for sub surface ground water storage in twenty river basins of thecountry has been estimated as 87.19 million hectare meters.Saturating the vadose zone to 3 meters depthbelow ground level will create sub surface storage potential of 59.06 M.ha.m. Of this, the retrievablestorage potential works out to be 43.65 M.ha.m. The availability of monsoon run off is, however, notuniform in all the basins, resulting in surplus and deficit of monsoon run off vis-à-vis the water required torecharge the vadose zone. Hence, the above potential is further modified.
On the basis of availability of monsoon run off and storage potential of vadose zone, the feasible groundwater storage has been estimated as 21.42 M.ha.m, of which 16.05 M.ha.m can be utilized.
The sub surface storages created would be free from environmental hazards and interstate controversies,since the surface structures created for recharge would be of small dimensions and would be within thebasin/ watershed.
The creation of sub surface storage will help in:
(i) Equitable distribution of water resources, especially in the water scarcity hilly areas, since theaugmentation of ground water resources will commence from the first order streams.
(ii) Ensuring sustainability of existing ground water abstraction system for major parts of the year due toextended recharge period of 3 to 4 months, thereby mitigating drinking water scarcity in problematicvillages.
(iii) Mitigating hazards of flash floods, soil erosion, and silting of major reservoirs or river channels,thereby increasing the lift of the reservoirs, as also navigability of the river channels.
17
4.0 NEED FOR ARTIFICIAL RECHARGE TO GROUND WATER
Artificial Recharge is the process by which the ground water reservoir is augmented at a rate exceedingthat under natural conditions of replenishment. Any man made scheme or facility that adds water to anaquifer may be considered to be an artificial recharge system.
Natural replenishment of ground water reservoir is slow and unable to keep pace with the excessivecontinued exploitation of ground water resources in various parts of the country. This has resulted indeclining ground water levels and depleted ground water resources in some areas of the country. In orderto augment the natural supply of ground water, artificial recharge of ground water has become an importantand frontal management strategy in the country. The artificial recharge efforts are basically augmentation ofnatural movement of surface water into ground water reservoir through suitable civil structures. Theartificial recharge techniques interrelate and integrate the source water to ground water reservoir and aredependent on the hydrogeological situation of the area.
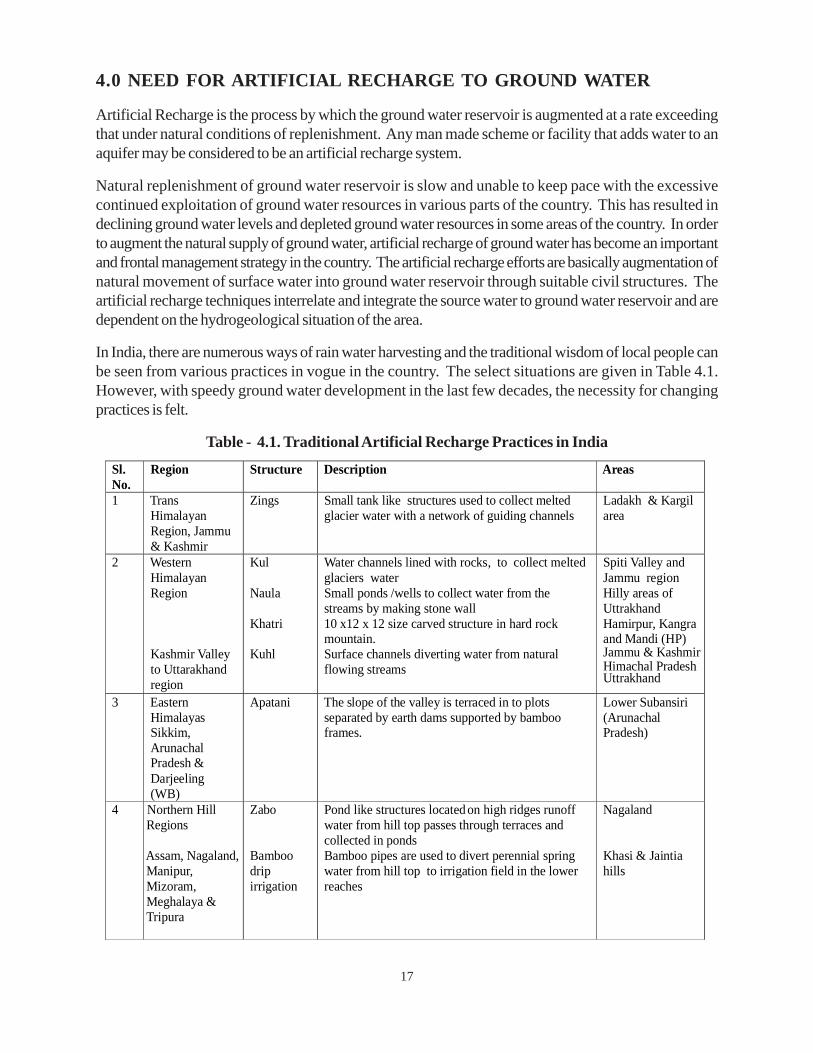
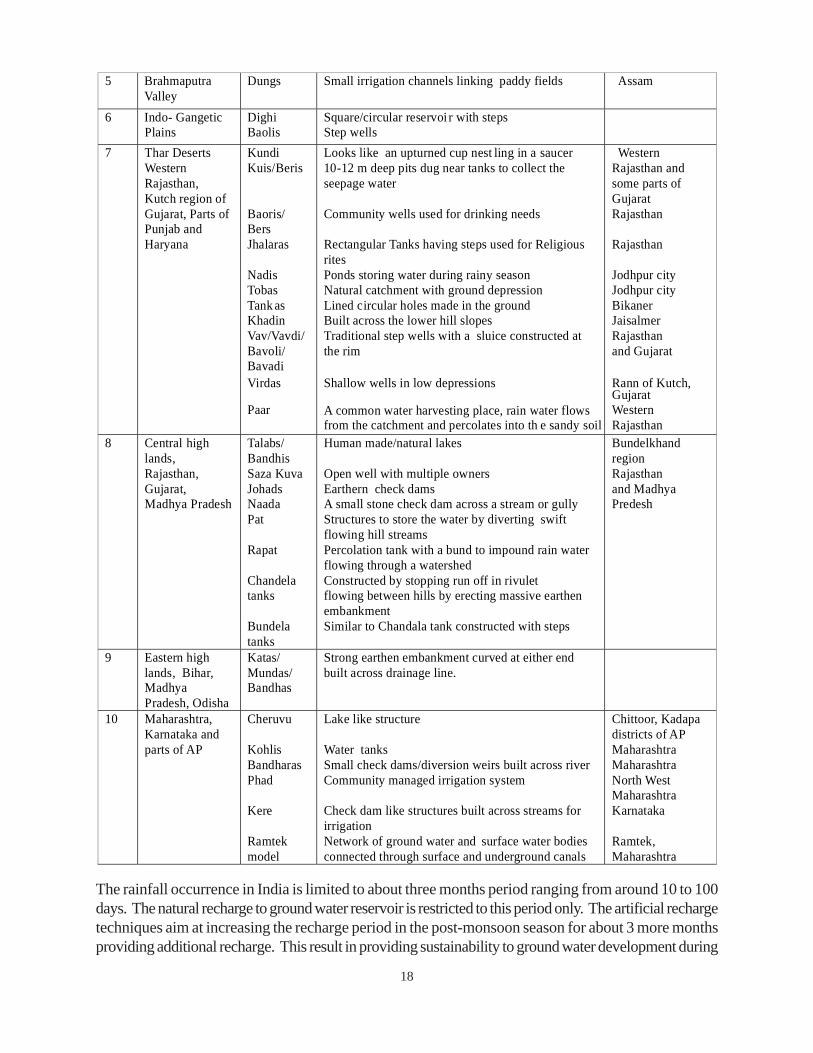
In India, there are numerous ways of rain water harvesting and the traditional wisdom of local people canbe seen from various practices in vogue in the country. The select situations are given in Table 4.1.However, with speedy ground water development in the last few decades, the necessity for changingpractices is felt.
Table - 4.1. Traditional Artificial Recharge Practices in India Sl. No.
Region Structure Description Areas
1 Trans Himalayan Region, Jammu & Kashmir
Zings Small tank like structures used to collect meltedglacier water with a network of guiding channels
Ladakh & Kargil area
2 Western Himalayan Region Kashmir Valley to Uttarakhand region
Kul
Naula Khatri
Kuhl
Water channels lined with rocks, to collect melted glaciers water Small ponds /wells to collect water from the streams by making stone wall 10 x12 x 12 size carved structure in hard rock mountain. Surface channels diverting water from natural flowing streams
Spiti Valley and Jammu region Hilly areas of UttrakhandHamirpur, Kangra and Mandi (HP)
Himachal Pradesh
3 Eastern Himalayas Sikkim, Arunachal Pradesh & Darjeeling (WB)
Apatani The slope of the valley is terraced in to plotsseparated by earth dams supported by bamboo frames.
Lower Subansiri (Arunachal Pradesh)
4 Northern Hill Regions Assam, Nagaland, Manipur, Mizoram, Meghalaya & Tripura
Zabo
Bamboo drip irrigation
Pond like structures located on high ridges runoff water from hill top passes through terraces and collected in ponds Bamboo pipes are used to divert perennial spring water from hill top to irrigation field in the lower reaches
Nagaland
Khasi & Jaintia hills
Jammu & Kashmir
Uttrakhand
18
The rainfall occurrence in India is limited to about three months period ranging from around 10 to 100days. The natural recharge to ground water reservoir is restricted to this period only. The artificial rechargetechniques aim at increasing the recharge period in the post-monsoon season for about 3 more monthsproviding additional recharge. This result in providing sustainability to ground water development during
5 Brahmaputra Valley
Dungs Small irrigation channels linking paddy fields Assam
6 Indo- Gangetic Plains
Dighi Baolis
Square/circular reservoi r with steps Step wells
7 Thar Deserts Western Rajasthan, Kutch region of Gujarat, Parts of Punjab and Haryana
Kundi Kuis/Beris Baoris/ Bers Jhalaras Nadis Tobas Tank as Khadin Vav/Vavdi/ Bavoli/ Bavadi Virdas
Paar
Looks like an upturned cup nest ling in a saucer 10-12 m deep pits dug near tanks to collect the seepage water Community wells used for drinking needs Rectangular Tanks having steps used for Religious rites Ponds storing water during rainy season Natural catchment with ground depression Lined circular holes made in the ground Built across the lower hill slopes Traditional step wells with a sluice constructed at the rim
Shallow wells in low depressions
A common water harvesting place, rain water flows from the catchment and percolates into th e sandy soil
Western Rajasthan and some parts of Gujarat Rajasthan
Rajasthan Jodhpur city Jodhpur city Bikaner Jaisalmer Rajasthan and Gujarat
Rann of Kutch, Gujarat
Western
Rajasthan
8 Central high lands, Rajasthan, Gujarat, Madhya Pradesh
Talabs/ Bandhis Saza Kuva Johads Naada Pat Rapat Chandela tanks Bundela tanks
Human made/natural lakes Open well with multiple owners Earthern check dams A small stone check dam across a stream or gully Structures to store the water by diverting swift flowing hill streams Percolation tank with a bund to impound rain water flowing through a watershed Constructed by stopping run off in rivulet flowing between hills by erecting massive earthen embankment Similar to Chandala tank constructed with steps
Bundelkhand region Rajasthan and Madhya Predesh
9 Eastern high lands, Bihar, Madhya Pradesh, Odisha
Katas/ Mundas/ Bandhas
Strong earthen embankment curved at either end built across drainage line.
10 Maharashtra, Karnataka and parts of AP
Cheruvu Kohlis Bandharas Phad Kere Ramtek model
Lake like structure Water tanks Small check dams/diversion weirs built across river Community managed irrigation system Check dam like structures built across streams for irrigation Network of ground water and surface water bodies connected through surface and underground canals
Chittoor, Kadapa districts of AP Maharashtra Maharashtra North West Maharashtra Karnataka Ramtek, Maharashtra
19
the lean season. In arid areas of the country rainfall varies between 150 and 600 mm/year with even lessthan 10 rainy days. Majority of the rain occurs in 3 to 5 major storms lasting only a few hours. The ratesof potential evapo-transpiration (PET) are exceptionally high in these areas which range from 300 to 1300mm. The average annual PET is much higher than the rainfall and at times as high as ten times the rainfall.The entire annual water resource planning has to be done by conserving the rainfall by either storing onsurface or in sub-surface reservoir. The climatic features are not favorable for creating surface storage.Artificial recharge techniques have to be adopted which help in diverting most of the surface storage toground water storage within shortest possible time.
In hilly areas, even though the rainfall is high, the scarcity of water is felt in the post-monsoon season. Dueto the steep gradients, major quantity of water flows in the low lying areas as surface run-off. Springswhich are the major source of water in hilly areas are also depleted during the post monsoon period. Thereis thus a need to provide sustainability to these springs. This can be done by increasing the recharge periodduring and after rainy season. Small surface storages above the spring level provide additional rechargeand help in sustaining yield of springs.
Roof top rain water harnessing can also be adopted to meet domestic water requirements. The roof toprain water can be stored in specifically constructed surface or sub-surface tanks. Dependence on groundwater has increased many folds and the natural recharge to ground water has decreased, due to urbanization,construction of buildings and paved area. The over-development of ground water is resulting in decline ofground water levels and to counter this artificial recharge has to be adopted. In urban areas water fallingon roof tops can be collected and diverted to the open wells/ tube wells/ bore wells by providing a filterbed.
There is thus a need to prepare a systematic plan for augmenting ground water resources under varioushydrogeological situations. The revised Master Plan prepared by CGWB provides an overview of thepossibilities for storing surplus monsoon run-off in sub-surface reservoirs in major basins of the country.This covered all the areas to saturate vadose zone up to 3 m depth bgl. based on available surplus monsoonrun-off and specific areas of coastal aquifers and island aquifers. However specific emphasis needs to begiven to the areas where ground water levels are declining and water scarcity is being felt. Keeping thisneed in view, an attempt has been made, to prepare a Master Plan for each state where artificial rechargecan be taken up in identified water scarcity areas. In this Plan emphasis has been given to the areas withdeclining and deep ground water levels. The Plan also includes roof top rain water harvesting in urban andrural areas for recharging the specific aquifer that ensures prevention of rain water wastage by letting intodrains along with sewage water.

20
5.0 METHODOLOGY FOR PREPARATION OF MASTER PLAN
The Master Plan for Artificial Recharge has been prepared considering the hydrogeological parametersand hydrological data base. The following aspects were considered for preparation of the plan:
(i) Identification and prioritization of need based areas for artificial recharge to ground water. Estimationof sub surface storage space based on the water table behaviour and quantity of water needed tosaturate the unsaturated zone (up to a depth of 3 to 8 m bgl depending on the prevailing hydraulicconditions and zone of fluctuation in the state, to fully utilize the unsaturated zone without allowingwater logging condition)
(ii) Quantification of local surplus annual run off availability as source water for artificial recharge in eachsub basin/watershed and possibility of transporting surplus run off from adjoining watersheds/sub-basins also to be considered.
(iii) Areas of poor chemical quality of ground water and scope of improvement by suitable rechargemeasures.
(iv) Working out design of suitable recharge structures, their numbers and type; storage capacity andefficiency considering the estimated storage space and available source water for recharge.
(v) Cost estimates of artificial recharge structures required to be constructed in identified areas.
5.1 DATA PREPARATION
Depth to water table map for post monsoon period based on decadal average of depth to ground waterlevels was prepared with contour intervals of 2 or 3 meters. The data of ground water levels was takenfrom National Hydrograph Network Stations of CGWB. Similarly a long term (decadal) post monsoonwater level trend map was prepared. This map brought out the ranges of water level rise and fall on longterm basis. These two maps were superimposed to bring out depth to water table variations along with thetrends of water levels over the last decade. The special problem areas like deeper pressure head in deeperaquifers under exploitation and coastal aquifers under stress were demarcated and special rechargeprogrammes aresuggested in the plan. The water logged areas close to water scarcity areas are alsoidentified for diverting the surface run off.
5.2 IDENTIFICATION OF FEASIBLE AREAS
The areas feasible for artificial recharge have been demarcated into different categories as follows in mostof the states:
• Areas showing post monsoon water levels deeper than 3 m bgl and declining trend of more than 10cm/year in plains.
• Post monsoon Water level above 4 to 8 m in undulating/ hilly terrain and poor rainfall with deep watertable zones.
• Areas with deeper pressure head in known principal aquifers.
• Areas having less fresh water lenses in coastal/island aquifers.
21
However, in few states, the categorization of area was done to suit the local situations. Depending upondata availability and specific ground conditions, the areas of above categories were demarcated and identifiedas feasible areas for planning and implementation of artificial recharge to ground water. Based on theseverity of decline of ground water levels and ground water scarcity situation, prioritization for implementationof plan was decided. The availability of funds needed for the implementation, surveys, investigations,preparation of design and cost estimates for the structures, capability of the implementing agencies, landacquisition in case of scheme involving submergence etc. are some of the important aspects which need tobe considered for implementation of the plan.
5.3 ESTIMATION OF AVAILABLE STORAGE SPACE
The thickness of available unsaturated zone (below 3 m bgl) described earlier is estimated by consideringthe different ranges of water level. The different ranges of DTW(depth to water level) are averaged toarrive at thickness of unsaturated zone. The total volume of unsaturated strata is calculated by consideringthe above categories and unsaturated thickness of different ranges. This volume was then multiplied byaverage specific yield on an area specific basis to arrive at volume of water required to saturate the aquiferto 3 m bgl.
5.4 SOURCE WATER REQUIREMENT
After assessing the volume of water required for saturating the vadose zone, the actual requirement ofsource water is to be estimated. Based on the experience gained in the pilot/demonstrative rechargeprojects implemented in different hydrogeological situations, an average recharge efficiency of 75% of theindividual structure is considered. The volume of source water required for artificial recharge was calculatedby multiplying a factor of 1.33 (i.e. reciprocal of 0.75). In few cases different values are taken dependingupon the regional scenario prevailing thereupon.
5.5 SOURCE WATER AVAILABILITY
The surface water resources available in various basins and sub basins utilized for preparation of plan werebased on information mostly provided by State Government. In few cases information from other GovernmentAgencies were considered. The data availability for source water availability for each sub basin includescommitted run off, provision for future planning and surplus water available. The availability of sourcewater per annum was worked out by adding the amount of surface water provided for future planning andsurplus available. This availability so worked out is for the entire sub basin and not exclusively for therequirement of the areas identified for artificial recharge. The source water availability for areas identifiedfor artificial recharge was apportioned from total water availability in the basin.
5.6 CAPACITY OF RECHARGE STRUCTURES
The capacity of recharge structures was worked out based on the findings of various artificial rechargestudies under taken in different states and the same was used for planning the recharge structures. Maximumstorage capacity (single filling) and gross capacity due to multiple fillings during rainy season were takeninto consideration for designing percolation tanks, cement plugs, check dams and other surface storagestructures. The number of rainy days and the possible number of fillings to the proposed recharge structure(2 to 3 fillings for check dams, 3 to 5 fillings for ponds etc) is also taken into consideration.
22
5.7 NUMBER OF RECHARGE STRUCTURES
The numbers of recharge structures required to store and recharge the ground water reservoir have beenworked out as follows: -
Total surplus Surface Water runoff ConsideredNo. of Structures = ——————————————————
Average Gross Capacity of Water SpreadingRecharge Structures (Considering Multiple Fillings)
The type and design of different types of structures like percolation tanks, check dams, recharge shafts etc.in a particular block/watershed would be guided by prevailing hydrogeological situation, existing densityand number of structures, land availability etc. The planning of type and design of proposed structuresshould accordingly be decided. The allocation of source water for recharge through specific type of artificialrecharge structures should be done considering these aspects. In case of deeper aquifers, injection wellsare recommended on the basis of thickness of aquifer and status of ground water withdrawal and thefeasibility of gravity injection at safe rate obtained from trial tests at Neyveli aquifer in Tamil Nadu. Fewstructures are based on conceptual projection, which can be fine-tuned by more site specific field studiesduring preparation of Detailed Project Reports (DPRs).
23
6.0 DESIGN OF ARTIFICIAL RECHARGE STRUCTURES
A wide spectrum of techniques are in vogue which are being implemented to recharge the ground waterreservoir. Similar to the variations in hydrogeological framework, the artificial recharge techniques feasibletoo, would vary accordingly. The artificial recharge structures, which are feasible in varied hydrogeologicalsituation, are described as follows:
6.1 PERCOLATION TANKS
Percolation tank is an artificially created surface water body, submerging in its reservoir highly permeableland areas, so that the surface run off is made to percolate and recharge the ground water storage. Thepercolation tank should have adequate catchment area. The hydrogeological condition of site for percolationtank is of utmost importance. The rocks coming under submergence area should have high permeability.The degree and extent of weathering of rocks should be uniform and not just localized. The purpose ofpercolation tank is to conserve the surface run off and diverts the maximum possible surface water to theground water storage. Thus the water accumulated in the tank after monsoon should percolate at theearliest, without much evaporation losses.
The size of a percolation tank should be governed by the percolation capacity of the strata in the tank bedrather than yield of the catchment. For, in case the percolation rate is not adequate, the impounded wateris locked up and wasted more through evaporation losses, thus depriving the downstream area of thevaluable resource.These are the most prevalent structures in India as a measure to recharge the groundwaterreservoir both in alluvial as well as hard rock formations. The efficacy and feasibility of these structures ismore in hard rock formation where the rocks are highly fractured and weathered. In the States ofMaharashtra, Andhra Pradesh, Madhya Pradesh, Karnataka and Gujarat, the percolation tanks havebeen constructed in plenty in basaltic lava flows and crystalline rocks. The percolation tanks are, however,also feasible in mountain fronts occupied by talus scree deposits. The percolation tanks can also beconstructed in the Bhabar zone. Percolation tanks with wells and shafts can also be constructed in areaswhere shallow or superficial formations are highly impermeable or clayey.
6.1.1 Site Characteristics and Design Guidelines
A detailed analysis of rainfall pattern, number of rainy days, dry spells and evaporation rate and detailedhydrogeological studies to demarcate suitable percolation tank sites, is necessary. In Peninsular India withsemi arid climate, the storage capacity of percolation tank is designed such that the water percolates toground water reservoir by January/February. The submergence area should be in uncultivable land as faras possible. Percolation tank be located on highly fractured and weathered rock for speedy recharge. Incase of alluvium, the bouldary formations are ideal for locating percolation tanks. The aquifer to be rechargedshould have sufficient thickness of permeable vadose zone to accommodate recharge. The benefited areashould have sufficient number of wells and cultivable land to develop the recharged water. Detailedhydrological studies for run off assessment be done and designed capacity should not normally be morethan 50 percent of total quantum of rain fall in catchment. Waste weir or spillway is suitably designed basedon single day maximum rain fall to allow flow of surplus water after the tank is filled to its maximumcapacity. Cut off trench be provided to minimize seepage losses both below and above nala bed. To avoiderosion of embankment due to ripple action stone pitching be provided upstream up to highest flood level(HFL).
24
6.2 CHECK DAM CEMENT PLUG/ NALA BUND
Check dams are constructed across small streams having gentle slope and are feasible both in hard rock aswell as alluvial formation. The site selected for check dam should have sufficient thickness of permeablebed or weathered formation to facilitate recharge of stored water within short span of time. The waterstored in these structures is mostly confined to stream course and the height is normally around 2 m. Theseare designed based on stream width and excess water is allowed to flow over the wall. In order to avoidscouring from excess run off, water cushions are provided at down streamside. To harness the maximumrun off in the stream, series of such check dams can be constructed to have recharge on a regional scale.The peak flow should not create bank erosion and damage to structures.
A series of small bunds or weirs are made across selected nala sections such that the flow of surface waterin the stream channel is impeded and water is retained on pervious soil/ rock surface for longer periodNala-Bunds are constructed across bigger nala or second order streams in areas having gentler slopes. Anala bund acts like a mini percolation tank with water storage confined to stream course.
6.2.1 Site Characteristics and Design Guidelines
For selecting a site for check dams/ nala bunds the following aspects may be observed :
• The total catchment of the nala should normally be between 40 to 100 hectares though the localsituations can be guiding factor for this.
• The rain fall in the catchment should be less than 1000 mm/annum.
• The width of nala bed should be at least 5 meters and not exceed 15 meters and the depth of bedshould not be less than 1 meter.
• The lands downstream of check dam/ nala bund should have land under well irrigation.
• The rock strata exposed in the ponded area should be adequately permeable to cause ground waterrecharge through ponded water.
• The structures should not block the flow of water during the rainfall totally and hence the sufficientcarrying capacity of nala/stream should be ensured.
6.3 GABION STRUCTURE
This is a kind of check dam being commonly constructed across small stream to conserve stream flowswith practically no submergence beyond stream course. The boulders locally available are stored in a steelwire. This is put up across the stream to make a small dam by anchoring it to the streamside. The height ofsuch structures is around 0.5 m and is normally used in the streams with width of about 10 to 15 m. Theexcess water overflows this structure leaving some storage water to serve as source of recharge. The siltcontent of stream water is deposited in the interstices of the boulders in due course to make it moreimpermeable. These structures are common in the states of Maharashtra, Madhya Pradesh, AndhraPradesh, etc.
6.4 MODIFICATION OF VILLAGE TANKS AS RECHARGE STRUCTURE
The existing village tanks which are normally silted and damaged can be modified to serve as rechargestructure in case these are suitably located to serve as percolation tanks. In general, no “Cut Off Trench”
25
(COT) and Waste Weir is provided for village tanks. Desilting, coupled with providing proper waste weirand COT on the upstream side, the village tanks can be converted into recharge structure. Several suchtanks are available which can be modified for enhancing ground water recharge. Studies, however, areneeded to ascertain whether the village tanks are suitably located to serve as recharge structures. Some ofthe tanks in Maharashtra and Karnataka have been converted into percolation tanks.
6.5 DUG WELL RECHARGE
In alluvial as well as hard rock areas, there are thousands of dug wells which have either gone dry or thewater levels have declined considerably. These dug wells can be used as structures to recharge groundwater. The storm water, tank water, canal water, etc. can be diverted into these structures to directlyrecharge the dried aquifer. By doing so the soil moisture losses during the normal process of recharge, arereduced. The recharge water is guided through a pipe to the bottom of well, below the water level to avoidscoring of bottom and entrapment of air bubbles in the aquifer. The quality of source water including the siltcontent should be such that the quality of ground water reservoir is not deteriorated. In rural areas the rainwater runoff can be channelized and recharged to dug wells through a filter.
6.6 RECHARGE SHAFTS
In areas where phreatic aquifer is overlain by poorly permeable strata, the recharge to ground waterstorage by water spreading method becomes ineffective or has very low efficiency. This situation alsooccur in ponds/depressions where due to siltation an impermeable layer or lens is formed which affectshydraulic connection of surface water and phreatic aquifers. Recharge shaft is an artificial recharge structurewhich penetrates the overlying impervious horizon and provides affective access of surface water forrecharging the phreatic aquifer. These structures are ideally suited for areas with deep water levels. Inareas where low permeable sandy horizon is within shallow depths, a trench can be excavated to 3 mdepth and back filled with boulder and gravel. The trench can be provided with injection well to effectivelyrecharge the deeper aquifers.
6.6.1 Site Characteristics and Design Guidelines
The following are the site characteristics and design guidelines:
• To be dug manually if the strata is of non-caving nature.
• If the strata are caving, proper permeable lining should be provided.
• The diameter of shaft should normally be more than 2 m to accommodate more water and to avoideddies in the well.
In the areas where source water is having silt, the shaft should be filled with boulder, gravel and sand frombottom to have inverted filter. The upper most sandy layer has to be removed and cleaned periodically.When water is put into the recharge shaft directly through pipes, air bubbles are also sucked into the shaftthrough the pipe which can choke the aquifer. The injection pipe should therefore, be lowered below thewater level, to avoid this.
6.7 INJECTION WELL
The aquifer to be replenished is generally one which is already over exploited by tube well pumpage andthe declining trend of water levels in the aquifer has set in. Because of the confining layers of low permeability
26
the aquifer cannot get natural replenishment from the surface and needs direct injection through rechargewells. Artificial Recharge of aquifers by injection well is also done in coastal regions to arrest the ingress ofsea water and to combat the problems of land subsidence in areas where confined aquifers are heavilypumped.
In alluvial areas, injection well recharging a single aquifer or multiple aquifers can be constructed in afashion similar to normal gravel packed pumping well. The only difference is that cement sealing of theupper section of the well is done in order to prevent the injection pressures from forcing leakage of waterthrough the annular space of borehole and well assembly. In hard rock areas casing and well screens maynot be required. An injection pipe with opening against the aquifer to be recharged may be sufficient.However, in case of number of permeable horizons separated by impervious rocks, a properly designedinjection well may be constructed with slotted pipe against the aquifer to be recharged. In practice theinjection rates are limited by the physical characteristics of the aquifer. In the vicinity of well, the speed ofground water flow may increase to the point that the aquifer is eroded, especially if it is made up ofunconsolidated or semi-consolidated rocks. In confined aquifer confining layers may fail if too greatpressure is created under them. If this occurs, the aquifer will become clogged in the vicinity of theborehole and/or may collapse.
6.8 GROUND WATER DAMS OR SUB SURFACE DYKES OR UNDERGROUNDBANDHARAS (UGB)
These are basically ground water conservation structures and are effective to provide sustainability toground water structures by arresting sub surface flow. A ground water dam is a sub surface barrier acrossstream which retards the natural ground water flow of the system and stores water below ground surfaceto meet the demands during the period of need. The main purpose of ground water dam is to arrest theflow of ground water out of the sub-basin and increase the storage within the aquifer. This helps in rising ofwater levels in upstream part of ground water dam rise, thus saturating the otherwise dry part of aquifer.
6.9 ROOF TOP RAIN WATER HARVESTING
In urban areas, the roof top rain water can be conserved and used for recharge of ground water. Thisapproach requires connecting the outlet pipes from roof top to divert the water to either existing wells/ tubewells/ bore well or specially designed wells. The urban housing complexes or institutional buildings havelarge roof area and can be utilized for harvesting roof top rain water and recharging.
27
7.0 MONITORING MECHANISM
The monitoring of water levels and water quality is of prime importance in any scheme of artificial rechargeto ground water. The monitoring data speaks for the efficacy of structures constructed for artificial rechargeand greatly helps in taking effective measures for ground water management on scientific lines. As such theplan for artificial recharge should have the monitoring mechanism inbuilt with the scheme.
7.1 WATER LEVEL MONITORING
The monitoring of surface water and ground water levels during feasibility studies greatly help in identifyingthe method of artificial recharge. Network of observation wells is used to study the ground water flowpattern and temporal changes in potentiometric head in the aquifer.
The observation well network during feasibility stage is generally of low density, spread over a large areawith the primary aim of defining the boundary zonation of the aquifer to be recharged and to know thehydraulic characteristics of the natural ground water system. After identification of the feasible groundwater structures, the observation well network is redefined in a smaller area with greater well density. Theobjective of monitoring system is to study the effect of artificial recharge on the natural ground watersystem. Depending on the method of artificial recharge and the hydrogeology of the area, the observationwell network has to be designed.
The monitoring system of observation well network should be designed specially to monitor impact ofindividual structures which can further be extended and dovetailed to monitor the impact of group of suchstructures in the artificial recharge scheme area. The network of observation wells should be
a) adjacent to the recharge facility
b) at a sufficient distance from the recharge facility to observe composite effects and
c) near the limit of hydrological boundaries.
If the recharged aquifer is overlain by confining/ semi-confining layer, piezometers should be installed tomonitor the water levels of overlying and underlying aquifers which helps in the study of leakages etc.Where the surface water bodies are hydraulically connected with the aquifers which are being recharged,it is advisable to monitor the water level profiles of both surface water and ground water.
The periodic monitoring of water levels can demarcate the zone of benefit. In this method a network ofobservation wells is established in the area likely to be benefitted to study the following:
• In the zone benefitted, the water levels be observed as to whether the well hydrographs have a flatapex during the time when there is water in the recharge structure (tank, pit, etc.)
• Wells situated outside the zone of influence normally show an angular apex for the period when therecharge is taking place, while those situated within the zone of influence have a flatter area.
• The recession limbs of hydrograph wells close to a recharge structure normally have a gentle gradientas compared to those located far off. Crops in the zone of influence will be healthy compared to thoseoutside such an area. Furthermore, in the zone of influence there is a tendency by the farmers to growcrops with high water requirements. Well yields in the zone of influence are generally being greater
28
than those outside it. The wells in benefitted zones may have more sustainability in lean period thanthose outside.
The above criteria can be used to define the zone of influence and thereby, a real and temporal demarcationof the effectiveness of recharges structures.
7.2 TRACER TECHNIQUE FOR DEMARCATING ZONE OF BENEFIT
Tracers are useful in demarcating the area benefitted by artificial recharge, Tritium; Rodhomine B, fluorescentdye and environmental isotopes, etc. are quite useful in assessing the extent of recharge and efficiency ofrecharge structures.
7.3 WATER QUALITY MONITORING
The monitoring of water quality during the implementation of artificial recharge schemes is essential tomaintain the quality standards for specified uses of the augmented resource. In case of injection wells, thecomposition of native water in the aquifer and the recharged water is important to know prevent cloggingof well and aquifer due to excessive precipitation of salts. The data on the chemical quality of native waterand the changes which may take place during the implementation of artificial recharge schemes should becollected by regular sampling from observation well network. Where treated wastewater is used forrecharge a careful monitoring is required to detect any possibility of contamination through a network ofmonitoring wells. Thus, the type of water quality monitoring programme depends on the specific problembeing studied i.e. changes in ground water quality; effect of soil salinisation and prevention of any contaminationetc. The samples to be collected will also depend on the purpose and are generally categorized into:
(1) Indicative: The indicative samples are collected at 1 to 4 months intervals and used to ascertain thepresence of injected effluent.
(2) Basic: Basic samples are taken at monthly intervals for wells already influenced by recharge to determinethe effect of recharge effluent on ground water quality and the purification provided by flow throughthe soil and aquifer system.
(3) Comprehensive: Comprehensive samples are taken at intervals of 6 months to 1 year for observationwells to determine water quality with respect to specific standards for intended water use.
7.4 IMPACT ASSESSMENT
The impact assessment of artificial recharge schemes can generally be enumerated as follows:
• Conservation and harvesting of surplus monsoon run off in ground water reservoir which otherwisewas going un-utilized outside the watershed/ basin and to sea. Rise in ground water levels due toadditional recharge to ground water. In case where continuous decline of ground water level wastaking place, a check to this and/or the intensity of decline subsequently reduces. The energyconsumption for lifting ground water from abstraction structures also reduces.
• The ground water structures in the benefitted zone of artificial recharge structures gain sustainabilityand the wells provide water in lean month. The domestic wells will become sustainable and many ofthe areas depending on water supply through tankers are benefitted.

29
• The cropping pattern in the benefitted zone may undergo marked change due to augmentation ofground water. Due to the increase in soil moisture, green vegetation cover may be increased and soare the number of ground water abstraction structures in the zone of influence.
• The quality of ground water may also improve due to dilution. Besides, the artificial recharge schemeswill generate indirect benefit in terms of decrease in soil erosion, improvement in fauna and flora,influx of migratory birds, etc. The social and economic status of farmers would be substantiallyimproved due to increase in crop production.

30
8.0 STATE WISE MASTER PLAN FOR ARTIFICIAL RECHARGE
8.1 ANDHRA PRADESH
Andhra Pradesh State with a geographical area of 2,75,068 sq km has three distinct regions viz; CoastalAndhra, Rayalaseema and Telangana and is administratively divided into 23 districts and 1125 Mandals.The state is characterized by diverse climatic, physiographic and hydrogeological conditions. It has semi-arid type of climate with normal rainfall of 940 mm. It receives rainfall during south- west monsoon (June-Oct) and north-east monsoon (Nov-Dec), out of which south-west monsoon contributes 67% of totalrainfall. The distribution of rainfall is highly variable from 561 mm to 1113 mm from south and southwestern parts of the state to north and north eastern parts of the state.
Agriculture is the lifeline of State’s economy. Increased water demand, vagaries of rainfall coupled withnear total utilization of surface water resources resulted in increase in dependency on ground water as themajor source for irrigation, domestic and industrial sectors. This led to declining water levels, reduction inwell yields, well commands and increase in pumping lifts in considerable part of the state particularly inRayalaseema and Telangana regions. As on March, 2009, the stage of ground water development in thestate is 46%. Out of 1108 Assessment units (basins) in the state, 84 units are over exploited, 26 arecritical, while 93 are semi-critical. In these basins, there is a need to take up steps for augmentation ofground water resource through appropriate techniques for sustainable development. The state is havingthree major river basins i.e. Krishna, Godavari and the Pennar. The total estimated surplus water availabilityat 75% dependency, in the state of Andhra Pradesh is about 6,141 MCM.
8.1.1 IDENTIFICATION OF AREA
Artificial recharge is feasible in areas having surplus monsoon run-off and in areas where the aquifer iscapable of storing water when the natural recharge process is augmented. Both declining trend and depthto water levels have been taken into consideration for taking up artificial recharge schemes. The areacharacterized by depth to water level of more than 3 m bgl during the post-monsoon period and area withdeclining decadal water level trend is considered as area requiring artificial recharge. The areas which arecategorized as Semi-critical, Critical or Over-exploited (2008-09) meet such criteria. Hence these areasare identified for artificial recharge. Apart from these, urban areas, coastal areas prone to salinity ingressand areas with deep water levels in deeper aquifers in sedimentary terrain also need special attention.Hence, all municipal areas in the state (except shallow water level areas) and identified specific areas aretaken into consideration while preparing the present plan.
8.1.2 SUBSURFACE STORAGE SPACE
The thickness of unsaturated zone for each category of depth to water level is arrived and 3 m is subtractedto get the unsaturated thickness available for recharge in the regional level. The state is covered by crystallineformations, having specific yield in the range of 1-3% are considered.
8.1.3 SOURCE WATER AVAILABILITY
Monsoon rainfall run off is the only source water for artificial recharge in the state. The runoff yield in eachunit is estimated from monsoon rainfall of respective unit (Mandal) using Strangers table for average catchmenttype. From the data used in ground water resource estimation and field experience, 25 % of runoff potentialis taken as existing storage and the remaining as surplus runoff. The utilizable surplus runoff is assumed as
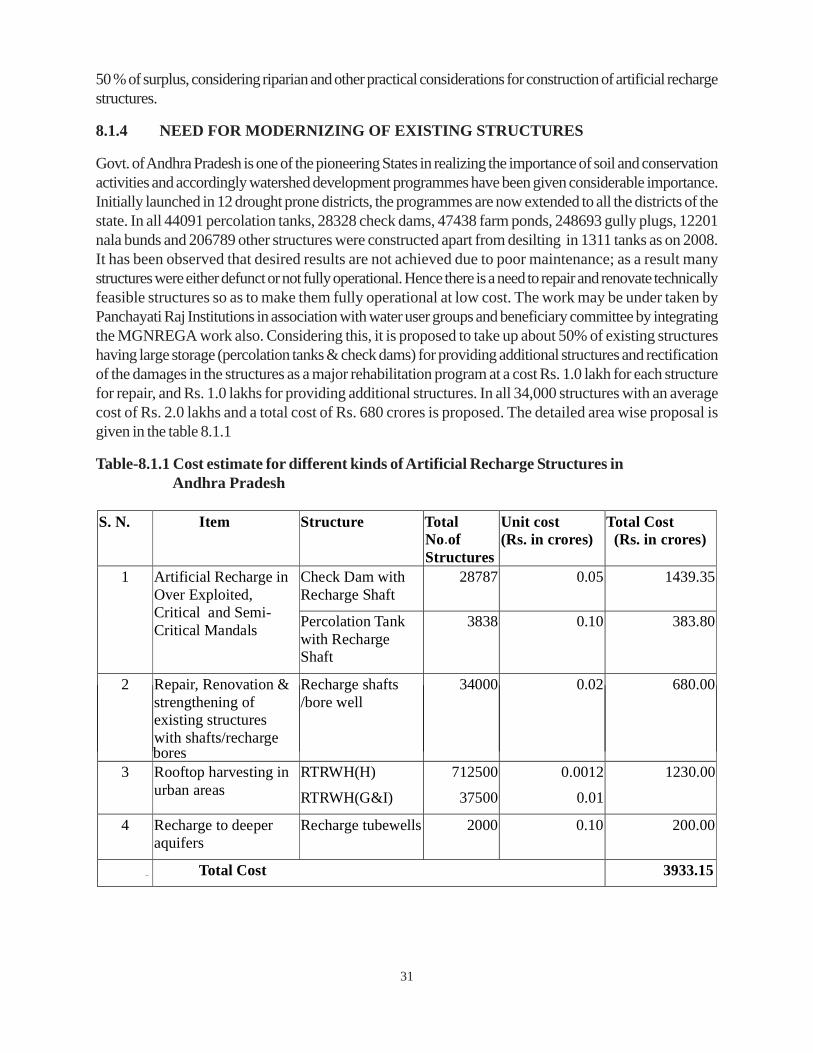
31
50 % of surplus, considering riparian and other practical considerations for construction of artificial rechargestructures.
8.1.4 NEED FOR MODERNIZING OF EXISTING STRUCTURES
Govt. of Andhra Pradesh is one of the pioneering States in realizing the importance of soil and conservationactivities and accordingly watershed development programmes have been given considerable importance.Initially launched in 12 drought prone districts, the programmes are now extended to all the districts of thestate. In all 44091 percolation tanks, 28328 check dams, 47438 farm ponds, 248693 gully plugs, 12201nala bunds and 206789 other structures were constructed apart from desilting in 1311 tanks as on 2008.It has been observed that desired results are not achieved due to poor maintenance; as a result manystructures were either defunct or not fully operational. Hence there is a need to repair and renovate technicallyfeasible structures so as to make them fully operational at low cost. The work may be under taken byPanchayati Raj Institutions in association with water user groups and beneficiary committee by integratingthe MGNREGA work also. Considering this, it is proposed to take up about 50% of existing structureshaving large storage (percolation tanks & check dams) for providing additional structures and rectificationof the damages in the structures as a major rehabilitation program at a cost Rs. 1.0 lakh for each structurefor repair, and Rs. 1.0 lakhs for providing additional structures. In all 34,000 structures with an averagecost of Rs. 2.0 lakhs and a total cost of Rs. 680 crores is proposed. The detailed area wise proposal isgiven in the table 8.1.1
Table-8.1.1 Cost estimate for different kinds of Artificial Recharge Structures in Andhra Pradesh
3 Rooftop harvesting in urban areas
RTRWH(H)
RTRWH(G&I)
712500
37500
0.0012
0.01
1230.00
4 Recharge to deeper aquifers
Recharge tubewells 2000 0.10 200.00
5 Total Cost 3933.15
bores
S. N. Item Structure Total
No of Structures
Unit cost (Rs. in crores)
Total Cost (Rs. in crores)
Check Dam with Recharge Shaft
28787 0.05 1439.351
Artificial Recharge in Over Exploited, Critical and Semi-Critical Mandals Percolation Tank
with Recharge Shaft
3838 0.10 383.80
2 Repair, Renovation & strengthening of existing structures with shafts/recharge
Recharge shafts /bore well
34000 0.02 680.00
.
32
8.1.5 PLANNING OF SUITABLE ARTIFICIAL RECHARGE STRUCTURES ANDTHEIR NUMBER
Considering past experience of the effective recharge rate from various structures, check dams and percolationtanks in combination with recharge shafts are proposed for faster inflow into the system. The availablesurplus run off has been accounted in equal proportions for new check dams and percolation tanks atappropriate locations. In all, 3838 percolation tanks along with recharge shafts and 28,787 check damsalong with recharge shafts or bore wells are proposed for artificial recharge, based on the storage capacityof the recharge structures. There are many existing recharge structures and village ponds and irrigationtanks with poor connectivity to the fractures available at 20 to 60 m depth. The massive sheet rocks areprevalent in major part of hard rocks and hence the structures created for recharge purpose are oftenfound to be less effective which can be improved by providing additional structures like recharge shafts orbore wells. Depending upon hydrogeological conditions, the exact locations of structures can be decidedafter field investigations. As many rain water harvesting and recharge structures were constructed in thepast, stress on restoration and renovation of existing structures was also need to be taken up.
8.1.6 OTHER SPECIFIC AREAS IDENTIFIED FOR ARTIFICIAL RECHARGE
Roof top rain water harvesting structures in all urban areas and major villages in rural areas are alsoproposed with recharge pits around existing bore wells. Areas of semi consolidated rocks in coastaldistricts have overexploited aquifers like Rajahmundry sandstone in West Godavari and East Godavaridistricts, where the pressure head is lowering at alarming rate and there is a need to recharge these aquiferswith local or transported surplus water from adjoining watersheds through existing net work of canals andsystem tanks. For the construction of recharge tube wells, deeper aquifers under high level of exploitationas well as areas vulnerable for sea water ingress are identified with provision of supply channel and localsurface storage for collecting the run off in monsoon/ canal water in non monsoon and allow a long termrecharge provision. In all, recharge well fields / tube wells of 100 to 200 m depth in cluster (unit cost ofRs. 10 lakhs) at 2000 locations are proposed to be taken in feasible artificial recharge areas by State levelagencies.
8.1.7 ROOF TOP RAINWATER HARVESTING
It has been assessed that roof top rainwater harvesting can be adopted in ~7.5 lakh houses, govt buildings,institutes etc. in urban and municipal area of the state suitable for artificial recharge in the first phase. It willharness 120.53 MCM rain water to augment groundwater resources considering normal rainfall for thestate and 80% efficiency of the system. The cost of roof top rain water harvesting of a buildings having roofand paved areas of ~ 200 sq.m has been assessed to be Rs. 12,000/- and for bigger building having morethan 1000 sq.m will be Rs. 1.0 lakh. The total cost for the roof top rain water harvesting for the state hasbeen estimated to be Rs. 1,230 crore in the first phase considering 5% of the total buildings having largerroofs.
8.1.8 COST ESTIMATES
The unit cost of each percolation tank with shaft is taken as Rs.10 lakhs, while the cost for check damalong with recharge shaft is considered as Rs. 5 lakhs. The district wise estimate for the above twostructures are given in table 8.1.2 and the area proposed under the same is given in Fig-8.1.1. Therecharge tube well with storage and filter unit is taken as Rs. 10 lakhs. The total outlay is estimated atabout Rs. 3,933.15 crores to take up the artificial recharge structures including Roof Top Rain WaterHarvesting.

33
Fig.8.1.1. Areas identified for Artificial Recharge in Andhra Pradesh
Fig 8.1.1 Areas identified for Artificial Recharge in Andhra Pradesh.
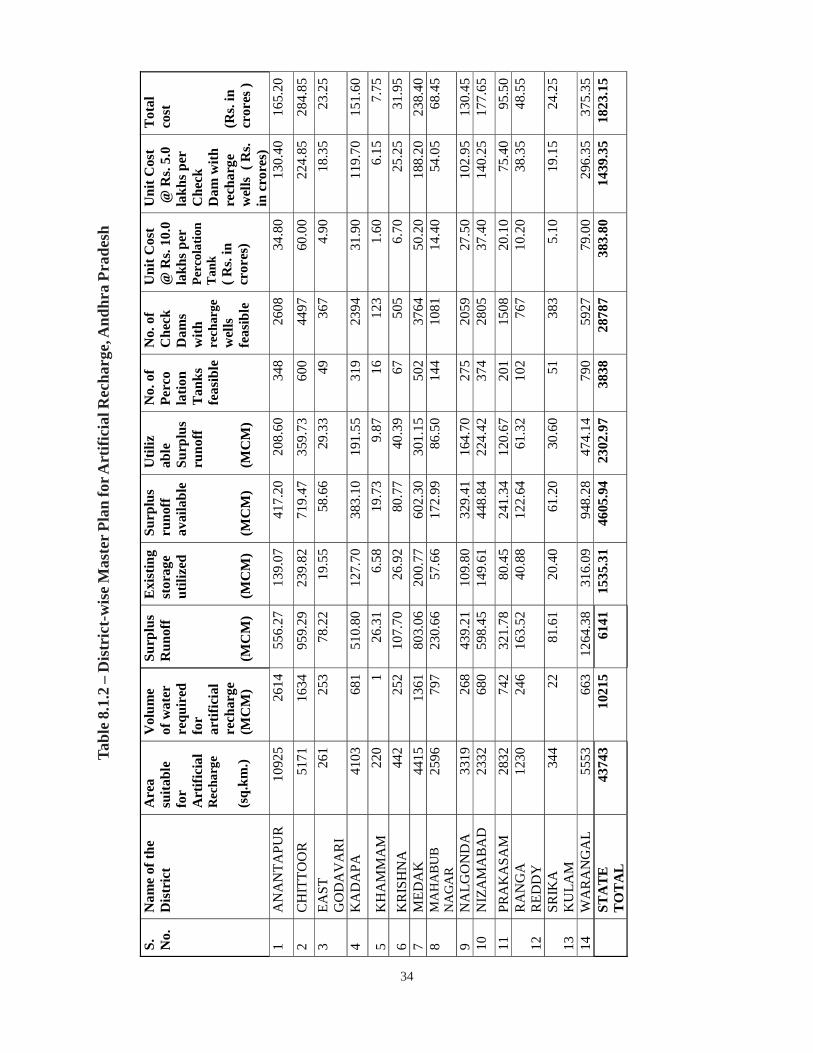
34
T
able
8.1
.2 –
Dis
tric
t-w
ise M
aste
r Pla
n fo
r Art
ifici
al R
echa
rge,
And
hra
Prad
esh
S.
No.
N
ame
of th
e D
istr
ict
Are
a su
itabl
e fo
r A
rtifi
cial
R
echa
rge
(s
q.km
.)
Vol
ume
of w
ater
re
quir
ed
for
artif
icia
l re
char
ge
(MC
M)
Surp
lus
Run
off
(MC
M)
Exi
stin
g st
orag
e ut
ilize
d
(MC
M)
Surp
lus
runo
ff
avai
labl
e
(MC
M)
Util
iz
able
Su
rplu
s ru
noff
(M
CM
)
No.
of
Perc
o la
tion
Tan
ks
feas
ible
No.
of
Che
ck
Dam
s w
ith
rech
arge
w
ells
fe
asib
le
Uni
t Cos
t
@ R
s. 10
.0
lakh
s per
Pe
rcol
atio
n T
ank
( Rs.
in
cror
es)
Uni
t Cos
t @
Rs.
5.0
lakh
s per
C
heck
D
am w
ith
rech
arge
w
ells
( R
s. in
cro
res)
Tot
al
cost
(R
s. in
cr
ores
)
1 A
NA
NTA
PUR
10
925
2614
55
6.27
13
9.07
41
7.20
208.
60
348
2608
34
.80
130.
40
165.
20
2 C
HIT
TOO
R
5171
16
34
959.
29
239.
82
719.
4735
9.73
60
0 44
97
60.0
0 22
4.85
28
4.85
3
EAST
G
OD
AV
AR
I 26
1 25
3 78
.22
19.5
5 58
.66
29.3
3 49
36
7 4.
90
18.3
5 23
.25
4 K
AD
APA
41
03
681
510.
80
127.
70
383.
1019
1.55
31
9 23
94
31.9
0 11
9.70
15
1.60
5 K
HA
MM
AM
22
0 1
26.3
1 6.
58
19.7
39.
87
16
123
1.60
6.
15
7.75
6 K
RIS
HN
A
442
252
107.
70
26.9
2 80
.77
40.3
9 67
50
5 6.
70
25.2
5 31
.95
7 M
EDA
K
4415
13
61
803.
06
200.
77
602.
3030
1.15
50
2 37
64
50.2
0 18
8.20
23
8.40
8
MA
HA
BU
B
NA
GA
R
2596
79
7 23
0.66
57
.66
172.
9986
.50
144
1081
14
.40
54.0
5 68
.45
9 N
ALG
ON
DA
33
19
268
439.
21
109.
80
329.
4116
4.70
27
5 20
59
27.5
0 10
2.95
13
0.45
10
N
IZA
MA
BAD
23
32
680
598.
45
149.
61
448.
8422
4.42
37
4 28
05
37.4
0 14
0.25
17
7.65
11
PR
AK
ASA
M
2832
74
2 32
1.78
80
.45
241.
3412
0.67
20
1 15
08
20.1
0 75
.40
95.5
0
12
RA
NG
A
RED
DY
12
30
246
163.
52
40.8
8 12
2.64
61.3
2 10
2 76
7 10
.20
38.3
5 48
.55
13
SRIK
A
KU
LAM
34
4 22
81
.61
20.4
0 61
.20
30.6
0 51
38
3 5.
10
19.1
5 24
.25
14
WA
RA
NG
AL
5553
66
3 12
64.3
8 31
6.09
94
8.28
474.
14
790
5927
79
.00
296.
35
375.
35
ST
AT
E
TO
TA
L
4374
3 10
215
6141
15
35.3
1 46
05.9
423
02.9
7 38
38
2878
7 38
3.80
14
39.3
5 18
23.1
5
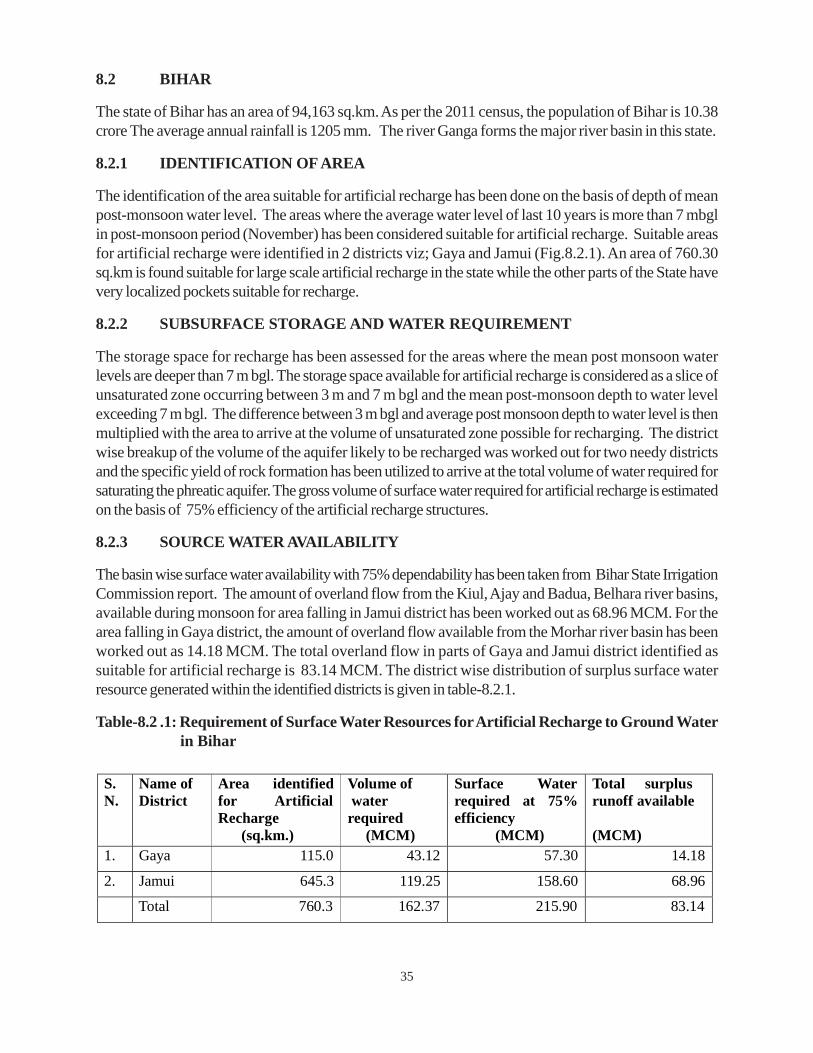
35
8.2 BIHAR
The state of Bihar has an area of 94,163 sq.km. As per the 2011 census, the population of Bihar is 10.38crore The average annual rainfall is 1205 mm. The river Ganga forms the major river basin in this state.
8.2.1 IDENTIFICATION OF AREA
The identification of the area suitable for artificial recharge has been done on the basis of depth of meanpost-monsoon water level. The areas where the average water level of last 10 years is more than 7 mbglin post-monsoon period (November) has been considered suitable for artificial recharge. Suitable areasfor artificial recharge were identified in 2 districts viz; Gaya and Jamui (Fig.8.2.1). An area of 760.30sq.km is found suitable for large scale artificial recharge in the state while the other parts of the State havevery localized pockets suitable for recharge.
8.2.2 SUBSURFACE STORAGE AND WATER REQUIREMENT
The storage space for recharge has been assessed for the areas where the mean post monsoon waterlevels are deeper than 7 m bgl. The storage space available for artificial recharge is considered as a slice ofunsaturated zone occurring between 3 m and 7 m bgl and the mean post-monsoon depth to water levelexceeding 7 m bgl. The difference between 3 m bgl and average post monsoon depth to water level is thenmultiplied with the area to arrive at the volume of unsaturated zone possible for recharging. The districtwise breakup of the volume of the aquifer likely to be recharged was worked out for two needy districtsand the specific yield of rock formation has been utilized to arrive at the total volume of water required forsaturating the phreatic aquifer. The gross volume of surface water required for artificial recharge is estimatedon the basis of 75% efficiency of the artificial recharge structures.
8.2.3 SOURCE WATER AVAILABILITY
The basin wise surface water availability with 75% dependability has been taken from Bihar State IrrigationCommission report. The amount of overland flow from the Kiul, Ajay and Badua, Belhara river basins,available during monsoon for area falling in Jamui district has been worked out as 68.96 MCM. For thearea falling in Gaya district, the amount of overland flow available from the Morhar river basin has beenworked out as 14.18 MCM. The total overland flow in parts of Gaya and Jamui district identified assuitable for artificial recharge is 83.14 MCM. The district wise distribution of surplus surface waterresource generated within the identified districts is given in table-8.2.1.
Table-8.2 .1: Requirement of Surface Water Resources for Artificial Recharge to Ground Water in Bihar
S. N.
Name of District
Area identified for Artificial Recharge
(sq.km.)
Volume of water required
(MCM)
Surface Water required at 75% efficiency
(MCM)
Total surplus runoff available (MCM)
1. Gaya 115.0 43.12 57.30 14.18
2. Jamui 645.3 119.25 158.60 68.96
Total 760.3 162.37 215.90 83.14
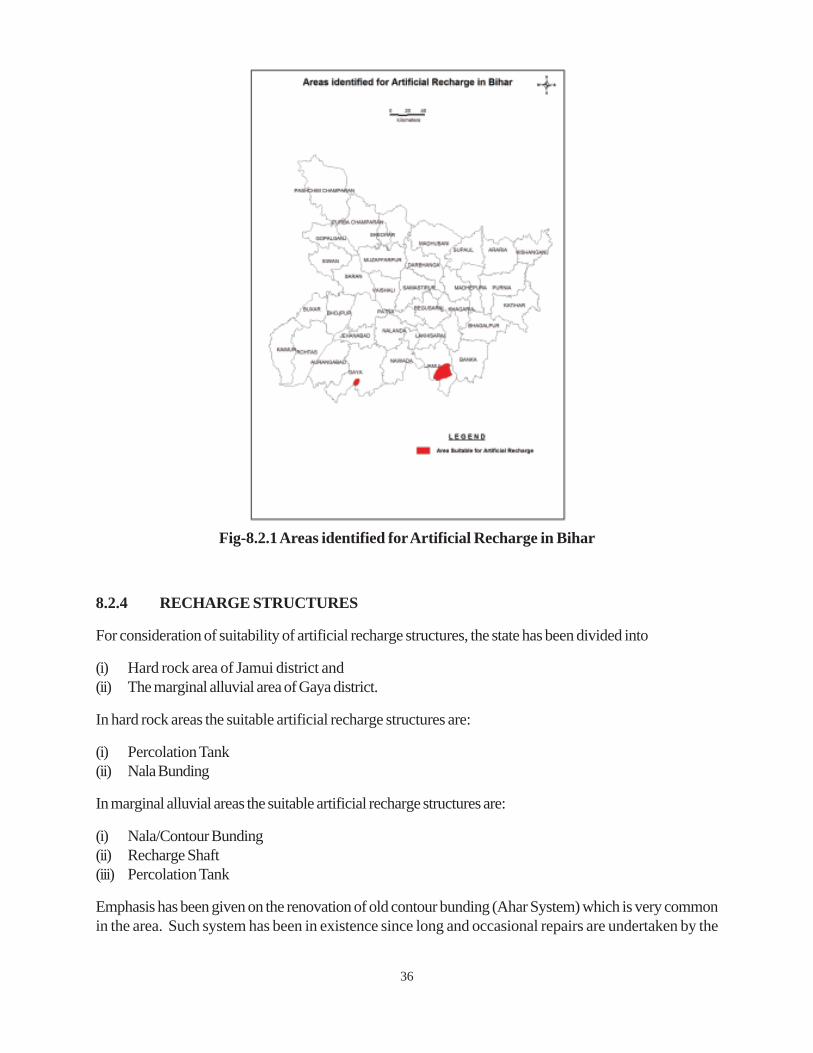
36
Fig-8.2.1 Areas identified for Artificial Recharge in Bihar
8.2.4 RECHARGE STRUCTURES
For consideration of suitability of artificial recharge structures, the state has been divided into
(i) Hard rock area of Jamui district and(ii) The marginal alluvial area of Gaya district.
In hard rock areas the suitable artificial recharge structures are:
(i) Percolation Tank(ii) Nala Bunding
In marginal alluvial areas the suitable artificial recharge structures are:
(i) Nala/Contour Bunding(ii) Recharge Shaft(iii) Percolation Tank
Emphasis has been given on the renovation of old contour bunding (Ahar System) which is very commonin the area. Such system has been in existence since long and occasional repairs are undertaken by the
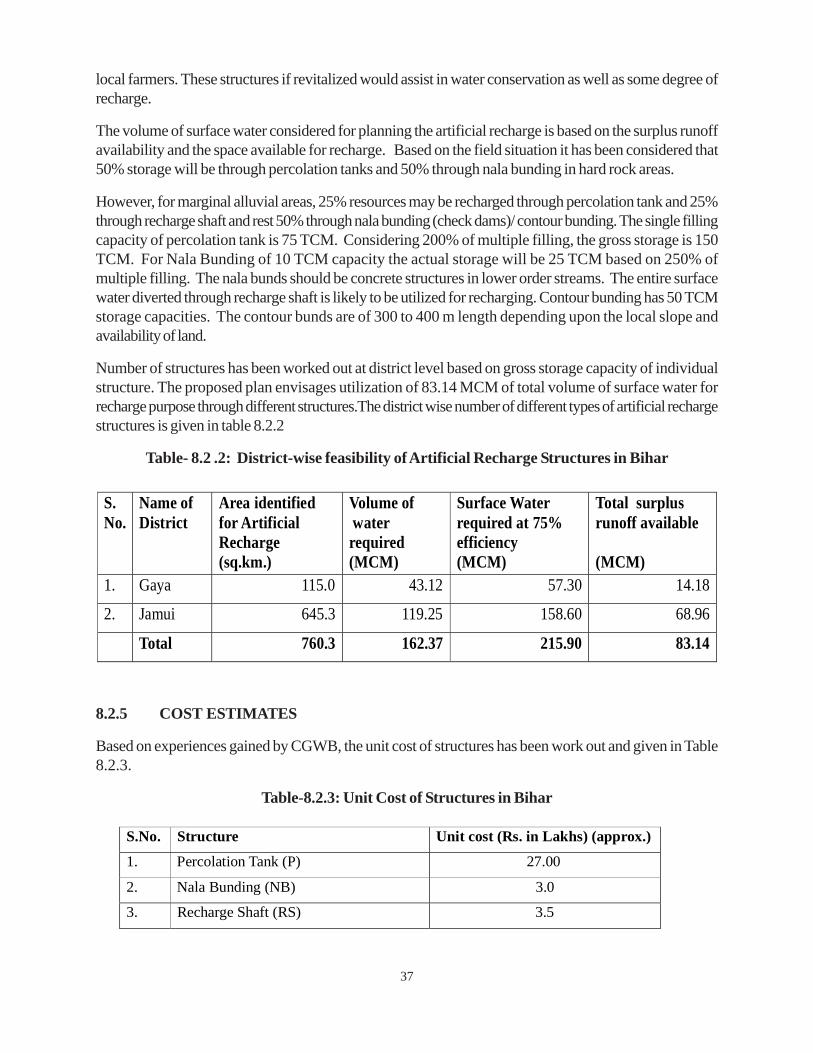
37
local farmers. These structures if revitalized would assist in water conservation as well as some degree ofrecharge.
The volume of surface water considered for planning the artificial recharge is based on the surplus runoffavailability and the space available for recharge. Based on the field situation it has been considered that50% storage will be through percolation tanks and 50% through nala bunding in hard rock areas.
However, for marginal alluvial areas, 25% resources may be recharged through percolation tank and 25%through recharge shaft and rest 50% through nala bunding (check dams)/ contour bunding. The single fillingcapacity of percolation tank is 75 TCM. Considering 200% of multiple filling, the gross storage is 150TCM. For Nala Bunding of 10 TCM capacity the actual storage will be 25 TCM based on 250% ofmultiple filling. The nala bunds should be concrete structures in lower order streams. The entire surfacewater diverted through recharge shaft is likely to be utilized for recharging. Contour bunding has 50 TCMstorage capacities. The contour bunds are of 300 to 400 m length depending upon the local slope andavailability of land.
Number of structures has been worked out at district level based on gross storage capacity of individualstructure. The proposed plan envisages utilization of 83.14 MCM of total volume of surface water forrecharge purpose through different structures.The district wise number of different types of artificial rechargestructures is given in table 8.2.2
Table- 8.2 .2: District-wise feasibility of Artificial Recharge Structures in Bihar
8.2.5 COST ESTIMATES
Based on experiences gained by CGWB, the unit cost of structures has been work out and given in Table8.2.3.
Table-8.2.3: Unit Cost of Structures in Bihar
S.No. Structure Unit cost (Rs. in Lakhs) (approx.)
1. Percolation Tank (P) 27.00
2. Nala Bunding (NB) 3.0
3. Recharge Shaft (RS) 3.5
S. No.
Name of District
Area identified for Artificial Recharge (sq.km.)
Volume of water required (MCM)
Surface Water required at 75% efficiency (MCM)
Total surplus runoff available (MCM)
1. Gaya 115.0 43.12 57.30 14.18
2. Jamui 645.3 119.25 158.60 68.96
Total 760.3 162.37 215.90 83.14
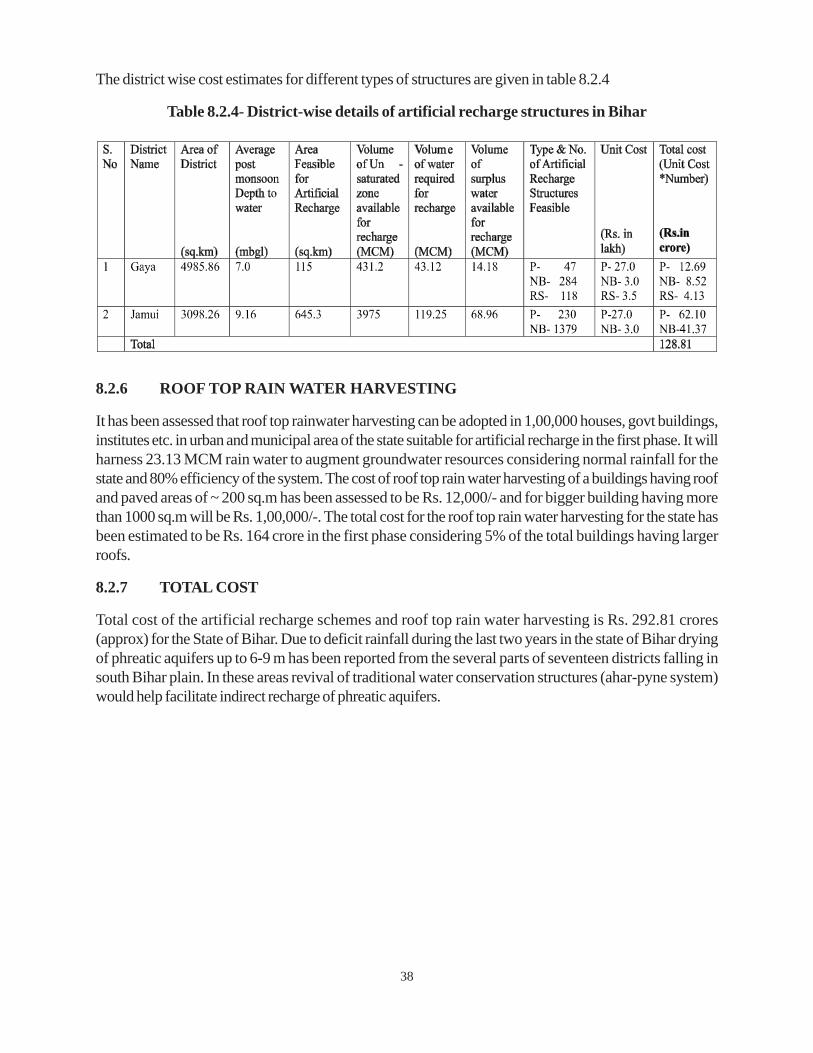
38
The district wise cost estimates for different types of structures are given in table 8.2.4
Table 8.2.4- District-wise details of artificial recharge structures in Bihar
8.2.6 ROOF TOP RAIN WATER HARVESTING
It has been assessed that roof top rainwater harvesting can be adopted in 1,00,000 houses, govt buildings,institutes etc. in urban and municipal area of the state suitable for artificial recharge in the first phase. It willharness 23.13 MCM rain water to augment groundwater resources considering normal rainfall for thestate and 80% efficiency of the system. The cost of roof top rain water harvesting of a buildings having roofand paved areas of ~ 200 sq.m has been assessed to be Rs. 12,000/- and for bigger building having morethan 1000 sq.m will be Rs. 1,00,000/-. The total cost for the roof top rain water harvesting for the state hasbeen estimated to be Rs. 164 crore in the first phase considering 5% of the total buildings having largerroofs.
8.2.7 TOTAL COST
Total cost of the artificial recharge schemes and roof top rain water harvesting is Rs. 292.81 crores(approx) for the State of Bihar. Due to deficit rainfall during the last two years in the state of Bihar dryingof phreatic aquifers up to 6-9 m has been reported from the several parts of seventeen districts falling insouth Bihar plain. In these areas revival of traditional water conservation structures (ahar-pyne system)would help facilitate indirect recharge of phreatic aquifers.
39
8.3 CHHATTISGARH
Chhattisgarh, the newly formed State of India after bifurcation of Madhya Pradesh on 1st November,2000, covers an area of 1,36,034 Sq. km. The population of the state is 25.54 million (Census 2011) withdensity of population being 189 per sq.km. The average annual rainfall of the state is 1356 mm. The statehas 3 administrative divisions, 18 districts and 146 development blocks. There are 19,744 populatedvillages and 8 major cities in the state. About 59,285.27 sq.km. area of the state is covered by forests.The agricultural land and irrigated land in the state is 5.8 million ha and 1.21 million ha respectively. Thestate comprises Mahanadi and Godavari basins with small parts of Ganga, Narmada and Swarnarekhabasins. These basins can be subdivided into 74 major watersheds 8 watersheds of Son and Narmada fallspartly in the adjoining Madhya Pradesh state.
8.3.1 IDENTIFICATION OF THE AREA
Based on data of National Hydrograph Stations established by CGWB, a trend analysis was carried outfor the decade between 2000 and 2009. A total area of 22,401.40 sq.km. shows declining trend inground water levels. 39 major watersheds have been identified in Chhattisgarh in which declining trend ofmore than 0.1 m/yr was recorded (Fig-8.3.1). These watersheds have been identified for construction ofsuitable artificial recharge structures for augmenting the available ground water resources.
8.3.2 SUB-SURFACE STORAGE SPACE AND WATER REQUIREMENT
To estimate the sub surface storage space available, a map was prepared on the basis of average postmonsoon depth to water level for period 2000-2009. The decadal post monsoon average depth to waterlevel is predominantly in the range of 3 to 6 m below ground level. Based on this map the volume ofunsaturated zone available for recharge (Vadose zone to 3 m below ground level) was calculated for eachof the 39 identified watersheds. A total 85343.578 MCM volume of unsaturated zone was estimated forthe Chhattisgarh state. The requirement of water to fully saturate the vadose zone up to 3 m below groundlevel was worked out for each watershed at 75% efficiency considered for recharge structures. The totalrequirement of water for creating the sub-surface storage works out to 2902.72 MCM for the entire state.
8.3.3 SOURCE WATER AVAILABILITY
The availability of surplus monsoon runoff was estimated for 39 identified watersheds mainly on the basisof NWDA data and State Irrigation Department. The total availability of source water for recharge worksout to 37,783.48 MCM, which far exceeds the total requirement to create the sub-surface storage.However, for each watershed the requirement vis-a-vis the availability was seen and the least of the twowas considered as available source water for harnessing in artificial recharge structures. The total quantumof source water which can be utilized for creation of sub-surface storage works out to 2902.72 MCM forall the 39 identified watersheds (table 8.3.1).
8.3.4 RECHARGE STRUCTURES AND COST ESTIMATES
The suitable artificial recharge structures in the state are gully plugs, gabion structures, contour bunds in theupper reaches of the watersheds, percolation tanks, nala bunds in the runoff zones and recharge shafts,gravity head wells in downstream areas. The main artificial recharge structures proposed are given belowalong with the estimated number of feasible structures and their cost.
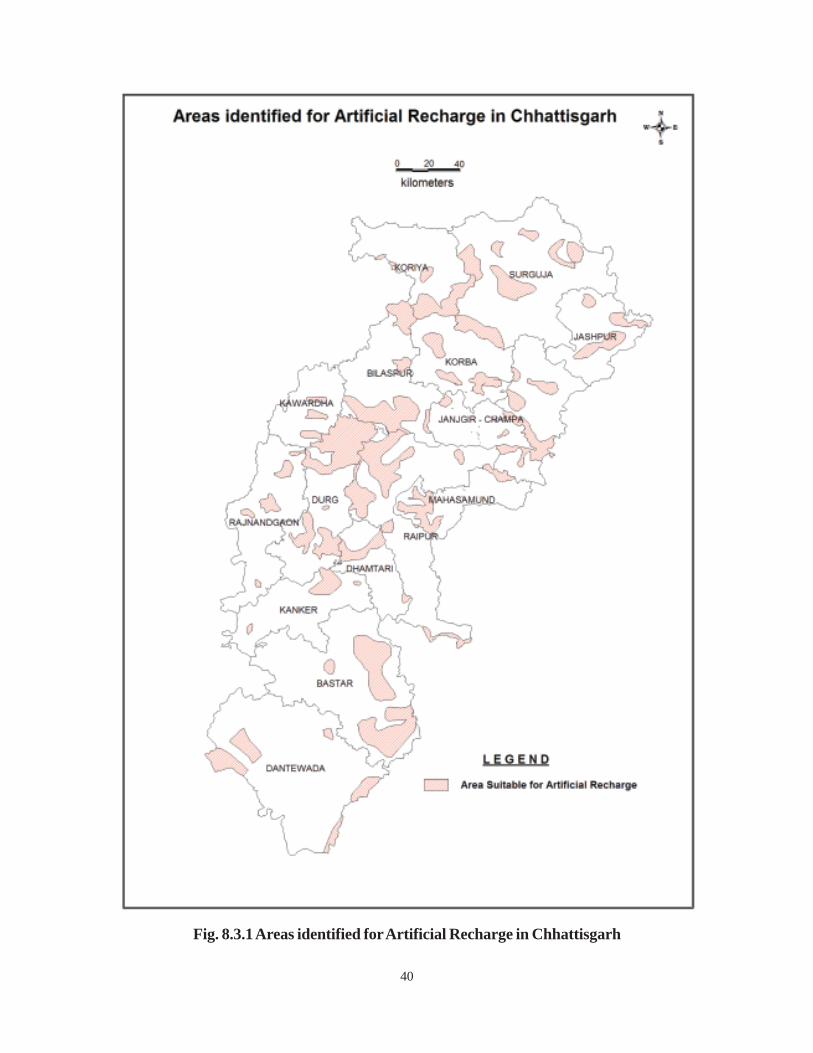
40
Fig. 8.3.1 Areas identified for Artificial Recharge in Chhattisgarh
41
a) Percolation Tanks
Percolation tank is the main artificial recharge structure proposed for effective utilization of the surplusmonsoon runoff. In hard rock areas only 50% of the total estimated surplus surface water resourceshave been considered for storage in the percolation tanks. As per the hydrogeological conditions inChhattisgarh an average percolation tank has filling capacity of 0.1525 MCM. It can actually store200% of its capacity due to multiple filling during the monsoon. Thus an average gross storagecapacity of 0.305 MCM has been considered. The average cost of such structure has been consideredas Rs. 20 lakh. The number of feasible percolation tank in each identified watershed has beencalculated and presented in table 8.3.1. The total percolation tanks feasible in Chhattisgarh are 4729costing Rs. 945.8 crore.
b) Nala Bunds
There is a large scope for constructing nala bunds/cement plugs in various second order streams ofthe state. About 25% of surplus monsoon runoff can be utilized by recharge through these structures.The average capacity of nala bunds/cement plugs has been considered as 0.45759 MCM. Theaverage cost of each structure has been taken as Rs.1 lakh. It is estimated that 15,862 nala bund/cement plugs can be constructed in the state at the cost of 158.6 crore (table 8.3.1).
c) Recharge Shafts & Gravity Head Recharge Wells
These structures are feasible in villages and urban pockets. About 10% of the surplus monsoon runoffcan be utilized through these structures. The average recharge capacity through recharge shafts,gravity head recharge through dug wells during an operational period of 60 days in monsoon and postmonsoon period is considered as 0.01525 MCM. The average cost of structure may be taken asRs.2.5 lakhs. The number of structures and their cost for each identified watershed is calculated andpresented in table 8.3.1. For the entire State the feasible structures are 28,549 costing Rs.713.725crore.
d) Gully Plugs, Contour Bunds, Gabion Structures
These are mainly soil conserving structures to increase the soil moisture with limited recharge toground water. It is estimated that 15% of total water available for recharge can be utilized throughthese structures, which have an average storage capacity of 0.007626MCM. The average cost ofeach structure is taken as Rs 10,000/-. The structures feasible in each identified watershed has beenestimated and presented in table 8.3.1. For the entire State the feasible structures will total up to38,062 costing Rs 38.062 crore.
8.3.5 ROOF TOP RAIN WATER HARVESTING:
It has been assessed that roof top rainwater harvesting can be adopted in ~2,00,000 houses, govt buildings,institutes etc. in urban and municipal area of the state suitable for artificial recharge in the first phase. It willharness 52.07 MCM rain water to augment groundwater resources considering normal rainfall for thestate and 80% efficiency of the system. The cost of roof top rain water harvesting of a building having roofand paved areas of ~ 200 sq.m has been assessed to be Rs. 11,000/- and for bigger building having morethan 1000 sq.m will be Rs. 1.0 lakh. The total cost for the roof top rain water harvesting for the state hasbeen estimated to be Rs. 309 crores in the first phase considering 5% of the total buildings having largerroofs.

42
8.3.6 COST ESTIMATES AND BENEFITS
The main artificial recharge structure in the 39 identified watershed are percolation tanks, nala bund/cement plugs, recharge shaft / gravity head recharge wells and water conservation structures like gullyplug, contour bund and gabion structures. The total cost of these artificial recharge structures works out toRs 1856.21crore. For urban areas, the roof top rainwater harvesting will have a total cost of Rs. 309.0crore. The total cost estimations of the proposed Master Plan are Rs. 2165.21crore (Say 2165 crores).
The benefits from the proposed plan would be in terms of creation of additional irrigation potential in ruralareas and supplementing drinking water needs in urban areas. An additional irrigation potential of 2,06,188.76ha would be created.
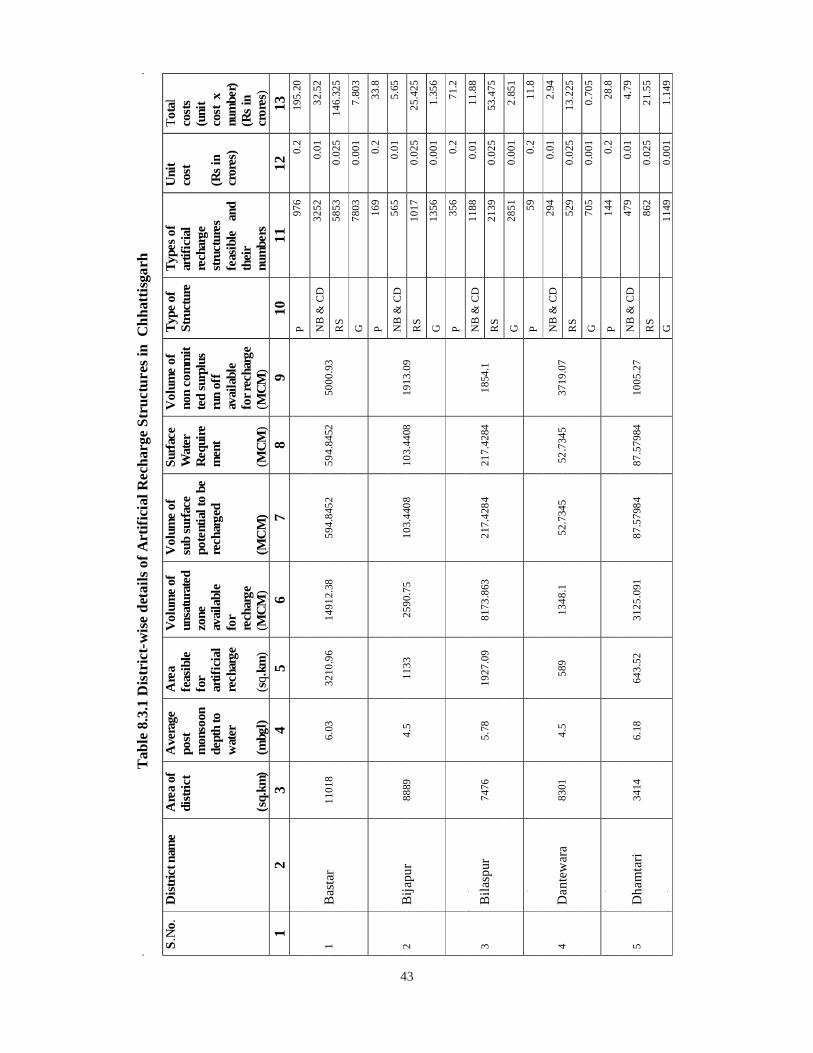
43
Tab
le8.
3.1
Dis
tric
t-w
ise
deta
ilsof
Art
ifici
alR
echa
rge
Stru
ctur
esin
Chh
attis
garh
S.N
o.D
istri
ctna
me
Are
aof
distr
ict
(sq.
km)
Ave
rage
post
mon
soon
dept
hto
wat
er
(mbg
l)
Are
afe
asib
lefo
rar
tific
ial
rech
arge
(sq.
km)
Vol
ume
ofun
satu
rate
dzo
neav
aila
ble
for
rech
arge
(MCM
)
Vol
ume
ofsu
bsu
rface
pote
ntia
lto
bere
char
ged
(MC
M)
Surfa
ceW
ater
Requ
irem
ent
(MCM
)
Vol
ume
ofno
nco
mm
itte
dsu
rplu
sru
nof
fav
aila
ble
forr
echa
rge
(MCM
)
Type
ofSt
ruct
ure
Type
sof
artif
icia
lre
char
gestr
uctu
res
feas
ible
and
thei
rnu
mbe
rs
Uni
tco
st
(Rsi
ncr
ores
)
Tota
lco
sts
(uni
tco
stx
num
ber)
(Rsi
ncr
ores
)1
23
45
67
89
1011
1213
P97
60.
219
5.20
NB
&C
D32
520.
0132
.52
RS
5853
0.02
514
6.32
51
Bas
tar
1101
86.
0332
10.9
614
912.
3859
4.84
5259
4.84
5250
00.9
3
G78
030.
001
7.80
3
P16
90.
233
.8
NB
&C
D56
50.
015.
65
RS
1017
0.02
525
.425
2B
ijapu
r88
894.
511
3325
90.7
510
3.44
0810
3.44
0819
13.0
9
G13
560.
001
1.35
6
P35
60.
271
.2
NB
&C
D11
880.
0111
.88
RS
2139
0.02
553
.475
3B
ilasp
ur74
765.
7819
27.0
981
73.8
6321
7.42
8421
7.42
8418
54.1
G28
510.
001
2.85
1
P59
0.2
11.8
NB
&C
D29
40.
012.
94
RS
529
0.02
513
.225
4D
ante
war
a83
014.
558
913
48.1
52.7
345
52.7
345
3719
.07
G70
50.
001
0.70
5
P14
40.
228
.8
NB
&C
D47
90.
014.
79
RS
862
0.02
521
.55
5D
ham
tari
3414
6.18
643.
5231
25.0
9187
.579
8487
.579
8410
05.2
7
G11
490.
001
1.14
9
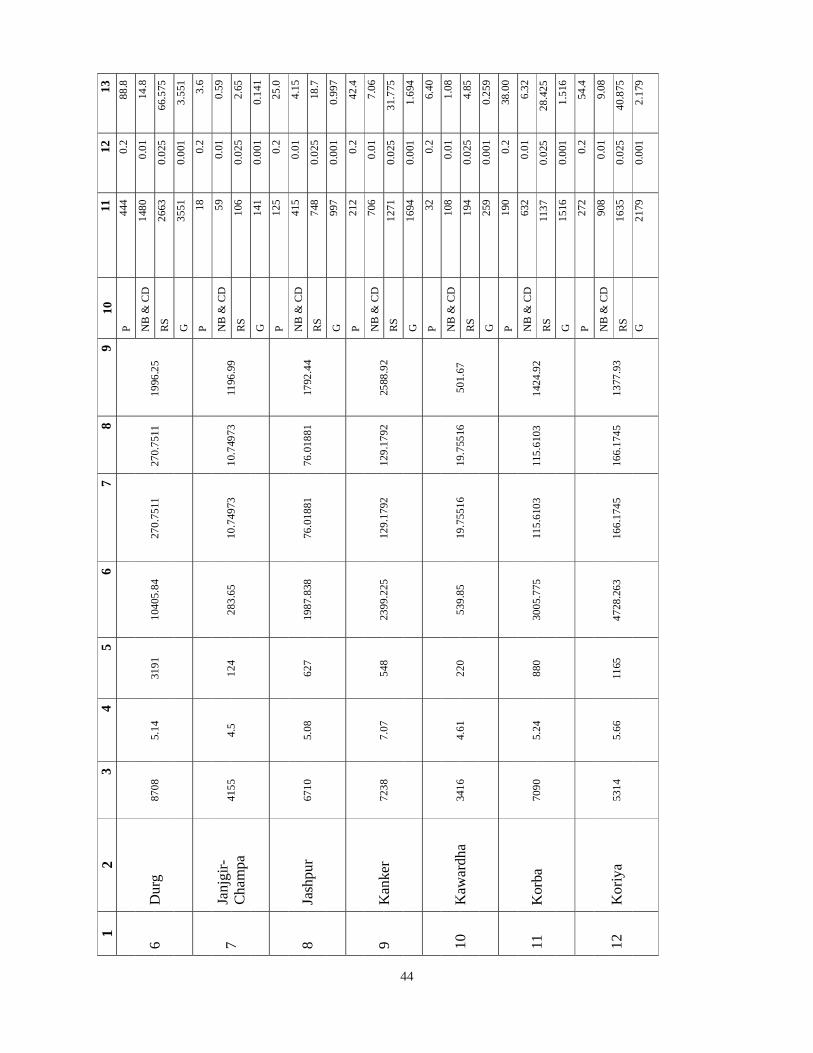
44
1 2
3 4
56
78
910
11
12
13
P 44
4 0.
2 88
.8
NB
& C
D
1480
0.
01
14.8
RS
2663
0.
025
66.5
75
6 D
urg
8708
5.
14
3191
10
405.
84
270.
7511
27
0.75
11
1996
.25
G
3551
0.
001
3.55
1
P 18
0.
2 3.
6
NB
& C
D
59
0.01
0.
59
RS
106
0.02
5 2.
65
7 Ja
njgi
r-C
ham
pa
4155
4.
5 12
4 28
3.65
10
.749
73
10.7
4973
11
96.9
9
G
141
0.00
1 0.
141
P 12
5 0.
2 25
.0
NB
& C
D
415
0.01
4.
15
RS
748
0.02
5 18
.7
8 Ja
shpu
r 67
10
5.08
62
7 19
87.8
38
76.0
1881
76
.018
81
1792
.44
G
997
0.00
1 0.
997
P 21
2 0.
2 42
.4
NB
& C
D
706
0.01
7.
06
RS
1271
0.
025
31.7
75
9 K
anke
r 72
38
7.07
54
8 23
99.2
25
129.
1792
12
9.17
92
2588
.92
G
1694
0.
001
1.69
4
P 32
0.
2 6.
40
NB
& C
D
108
0.01
1.
08
RS
194
0.02
5 4.
85
10
Kaw
ardh
a 34
16
4.61
22
0 53
9.85
19
.755
16
19.7
5516
50
1.67
G
259
0.00
1 0.
259
P 19
0 0.
2 38
.00
NB
& C
D
632
0.01
6.
32
RS
1137
0.
025
28.4
25
11
Kor
ba
7090
5.
24
880
3005
.775
11
5.61
03
115.
6103
14
24.9
2
G
1516
0.
001
1.51
6
P 27
2 0.
2 54
.4
NB
& C
D
908
0.01
9.
08
RS
1635
0.
025
40.8
75
12
Kor
iya
5314
5.
66
1165
47
28.2
63
166.
1745
16
6.17
45
1377
.93
G
21
79
0.00
1 2.
179
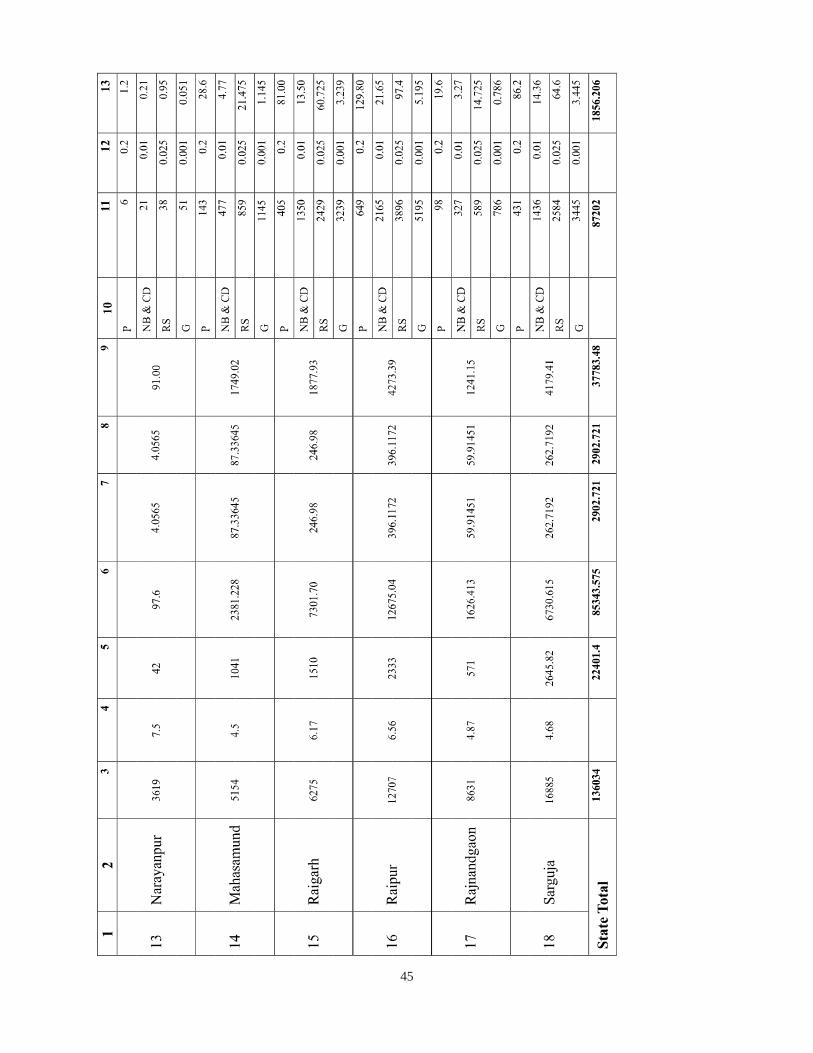
45

46
8.4 DELHI (NATIONAL CAPITAL TERRITORY)
National Capital Territory, Delhi occupies an area of 1483 sq. km. Out of this about 145 sq. km is theridge area comprising of weathered quartzite rock. The present population of Delhi is about 125 lakhs.Administratively, the state has 6 blocks namely Alipur block, City block, Mehrauli Block, Najafgarh block,Kanjhawala block & Shahdara block. In Alipur block, Kanjhawala block, Najafgarh block & part ofMehrauli block the area is cultivable. Due to increase in population, the water demand is increasing andground water is also used for irrigating the cultivable land. Due to over-exploitation of groundwater resourcesthe ground water levels have been declining especially in southern and south western parts of the State.
8.4.1 IDENTIFICATION OF AREA
Feasible areas for artificial recharge to ground water have been identified on the basis of depth to waterlevel (> 3 m.bgl) areas showing declining trend of water level and having surplus surface water availability.The area identified for artificial recharge to ground water is 699.86 sq. km in NCT Delhi (Fig-8.4.1).
8.4.2 SOURCE WATER AVAILABILITY
The average annual rainfall of the state is 611.8 mm, of which 533.1 mm occurs during monsoon period(June to September). Delhi mostly being urban area, 142 sq.km of roof area, 69 sq.km of paved area andbalance 485 sq.km is open area. Considering 80 % runoff coefficient for roof area, 60% for paved areaand 30 % for open, the runoff availability for Delhi state is assessed as 175 MCM. The surplus monsoonrunoff available from Yamuna is 282 MCM. Thus a total of 457 MCM surplus runoff is available forrecharge to ground water. As the areas proposed for recharge are at higher elevations, the surplus water ofYamuna River cannot be diverted under gravity to these areas. Hence only the available surface runofffrom the recharge areas i.e. 175 MCM out of which 52 MCM is estimated to be utilized by existingstructures and balance 123 MCM is available for recharge in feasible area. Out of this only 20% i.e. 24.39MCM may be utilized for recharge to ground water as most area is urban and entire rainwater cannot beharvested due to outflow into sewers and other losses.
8.4.3 RECHARGE STRUCTURES
In order to harness the net available runoff, two types of structures are considered i.e recharge shaft withinjection well in urban area and check dams in ridge area. The artificial recharge structures are given intable-8.4.1 along with cost estimates. Total number of feasible structures are 17,850 recharge shaft withinjection well and 8 number of check dams costing Rs. 892.90 crore.
8.4.4 ROOF TOP RAIN WATER HARVESTING
It has been assessed that roof top rainwater harvesting can be adopted in 1.25 lakh houses, govt buildings,institutes etc. in urban and municipal area of the state suitable for artificial recharge in the first phase. It willharness 14.69 MCM rain water to augment groundwater resources considering normal rainfall for thestate and 80% efficiency of the system. The cost of roof top rain water harvesting of a buildings having roofand paved areas of ~ 200 sq.m has been assessed to be Rs. 12,000/- and for bigger building having morethan 1000 sq.m will be Rs. 1 lakh. The total cost for the roof top rain water harvesting for the state hasbeen estimated to be Rs. 205 crore in the first phase considering 5% of the total buildings having largerroofs.
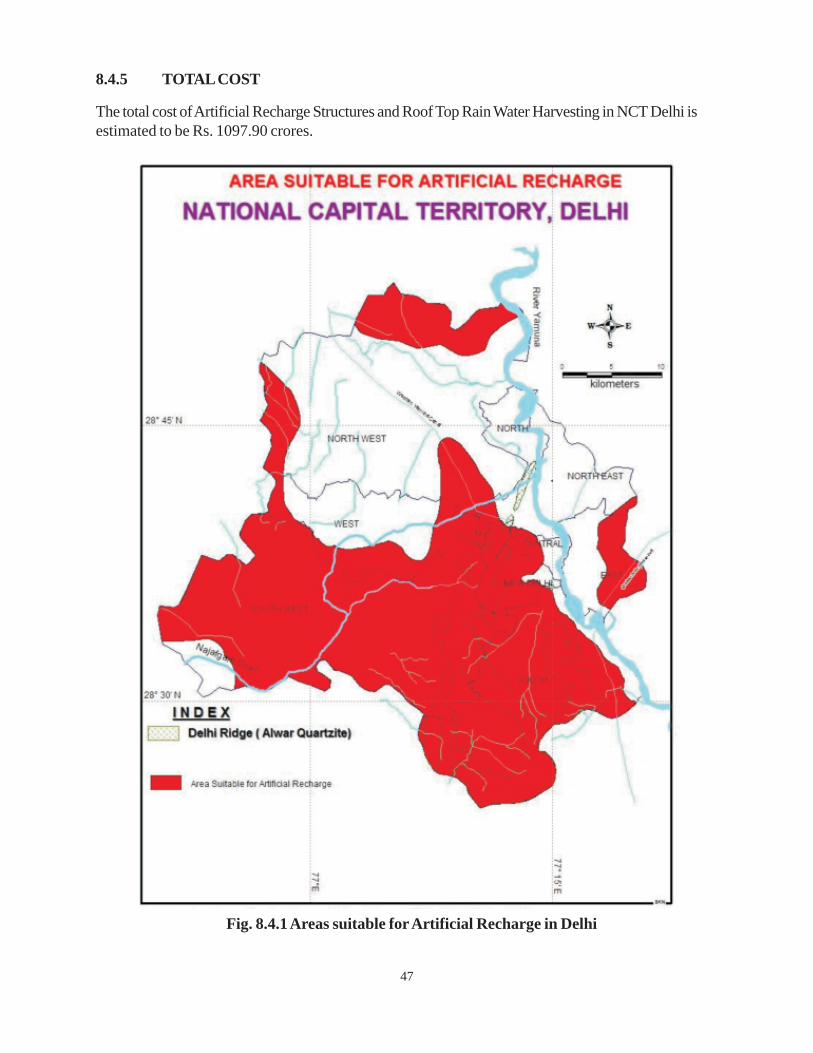
47
8.4.5 TOTAL COST
The total cost of Artificial Recharge Structures and Roof Top Rain Water Harvesting in NCT Delhi isestimated to be Rs. 1097.90 crores.
Fig. 8.4.1 Areas suitable for Artificial Recharge in Delhi
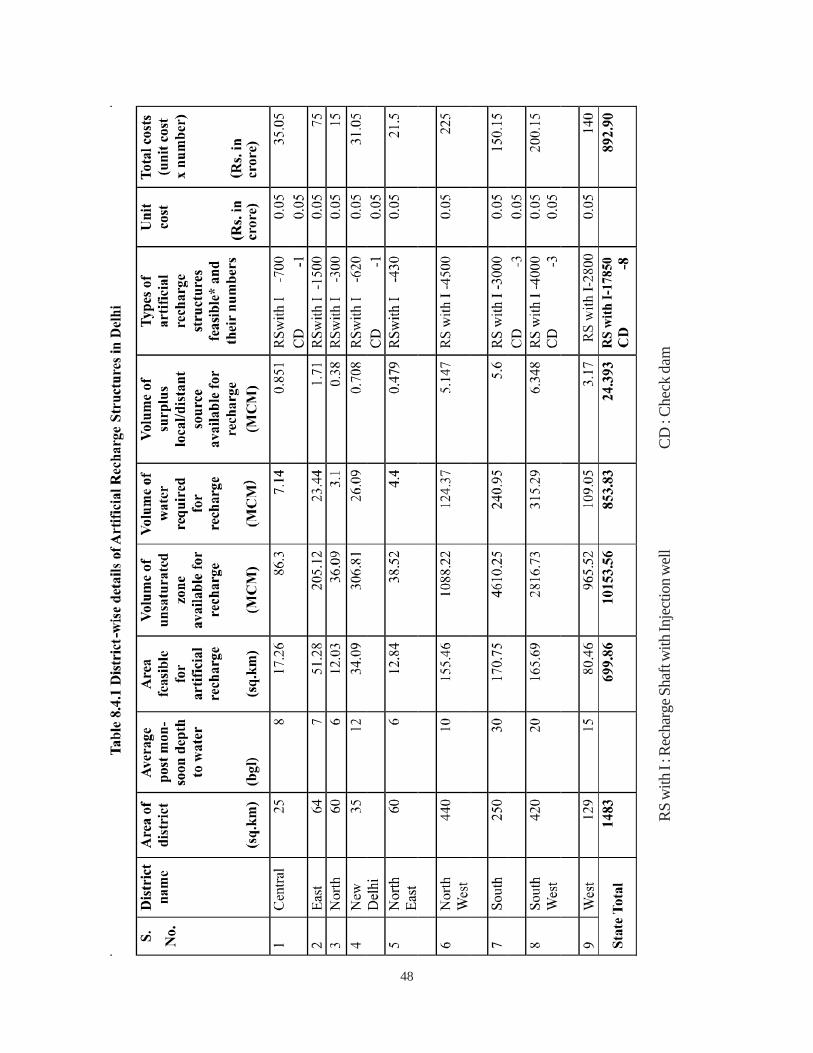
48
RS w
ith I :
Rec
harg
e Sha
ft w
ith In
ject
ion w
ell
CD
: Che
ck d
am
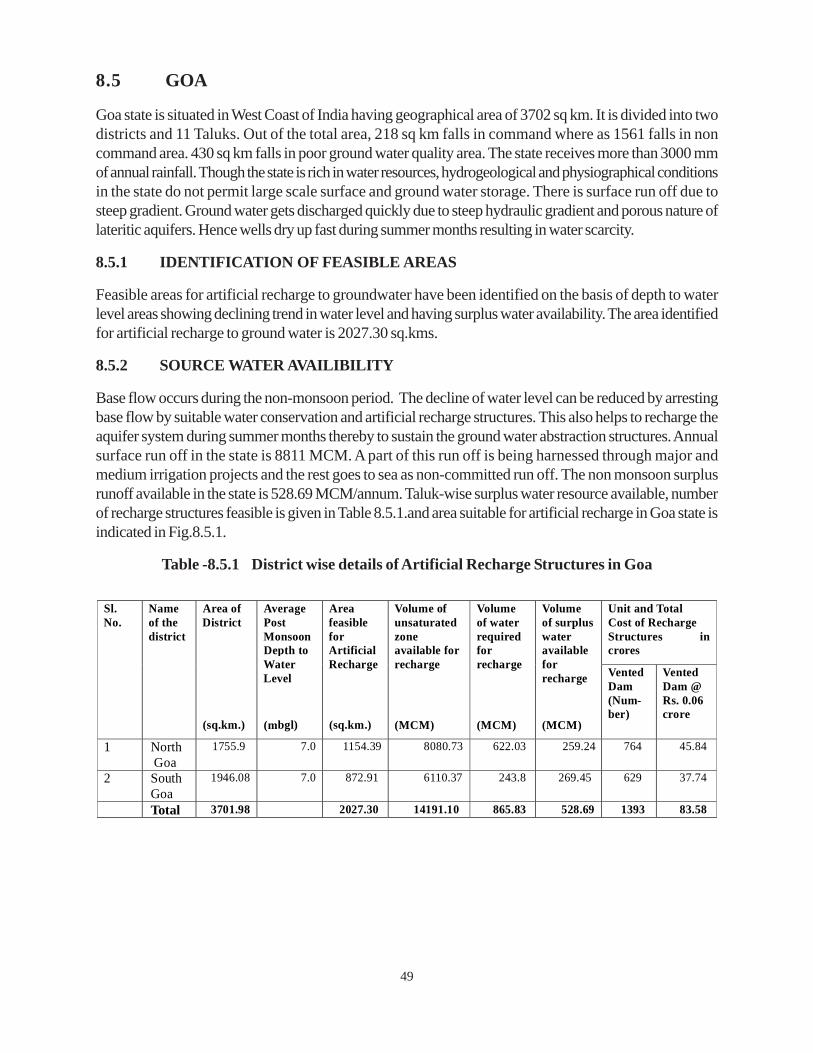
49
8.5 GOA
Goa state is situated in West Coast of India having geographical area of 3702 sq km. It is divided into twodistricts and 11 Taluks. Out of the total area, 218 sq km falls in command where as 1561 falls in noncommand area. 430 sq km falls in poor ground water quality area. The state receives more than 3000 mmof annual rainfall. Though the state is rich in water resources, hydrogeological and physiographical conditionsin the state do not permit large scale surface and ground water storage. There is surface run off due tosteep gradient. Ground water gets discharged quickly due to steep hydraulic gradient and porous nature oflateritic aquifers. Hence wells dry up fast during summer months resulting in water scarcity.
8.5.1 IDENTIFICATION OF FEASIBLE AREAS
Feasible areas for artificial recharge to groundwater have been identified on the basis of depth to waterlevel areas showing declining trend in water level and having surplus water availability. The area identifiedfor artificial recharge to ground water is 2027.30 sq.kms.
8.5.2 SOURCE WATER AVAILIBILITY
Base flow occurs during the non-monsoon period. The decline of water level can be reduced by arrestingbase flow by suitable water conservation and artificial recharge structures. This also helps to recharge theaquifer system during summer months thereby to sustain the ground water abstraction structures. Annualsurface run off in the state is 8811 MCM. A part of this run off is being harnessed through major andmedium irrigation projects and the rest goes to sea as non-committed run off. The non monsoon surplusrunoff available in the state is 528.69 MCM/annum. Taluk-wise surplus water resource available, numberof recharge structures feasible is given in Table 8.5.1.and area suitable for artificial recharge in Goa state isindicated in Fig.8.5.1.
Table -8.5.1 District wise details of Artificial Recharge Structures in Goa
Unit and Total Cost of Recharge Structures incrores
Sl. No.
Name of the district
Area of District
(sq.km.)
Average Post Monsoon Depth to Water Level
(mbgl)
Area feasible for Artificial Recharge
(sq.km.)
Volume of unsaturated zone available for recharge
(MCM)
Volume of water required for recharge
(MCM)
Volume of surplus water available for recharge
(MCM)
Vented Dam (Num-ber)
Vented Dam @ Rs. 0.06 crore
1 North Goa
1755.9 7.0 1154.39 8080.73 622.03 259.24 764 45.84
2 South Goa
1946.08 7.0 872.91 6110.37 243.8 269.45 629 37.74
Total 3701.98 2027.30 14191.10 865.83 528.69 1393 83.58

50
8.5.3 RECHARGE STRUCTURES AND COST ESTIMATES
Bhandaras and vented dams are suitable structures in the state. These structures will allow the run off togo away during heavy rainfall and arrest non monsoon run off. These structures can be taken up leavingthe coastal plains of the state where water table is shallow.
Cost estimates for bhandaras/vented dams are as follows:
Water available for conservation : 528.69 MCM
Water which can be conserved per structure : 0.38 MCM
No. of feasible structures : 1393
Unit cost per structure : Rs.6 lakhs
Total cost : Rs.83.58 crore
8.5.4 ROOF TOP RAIN WATER HARVESTING
It has been assessed that roof top rainwater harvesting can be adopted in 10,000 houses, govt buildings,institutes etc. in urban and municipal area of the state suitable for artificial recharge in the first phase. It willharness 5.76 MCM rain water to augment groundwater resources considering normal rainfall for the stateand 80% efficiency of the system. The cost of roof top rain water harvesting of a buildings having roof andpaved areas of ~ 200 sq.m has been assessed to be Rs. 12,000/- and for bigger building having more than1000 sq.m will be Rs. 1.0 lakh. The total cost for the roof top rain water harvesting for the state has beenestimated to be Rs. 16.40 crore in the first phase considering 5% of the total buildings having larger roofs.
8.5.5 TOTAL COST
A total of Rs. 99.98 crores is estimated for ground water conservation and rain water harvesting in thestate of Goa.

51
Fig. 8.5.1 Areas Suitable for Artificial Recharge in Goa
AREAS SUITABLE FOR ARTIFICIAL RECHARGE IN GOA
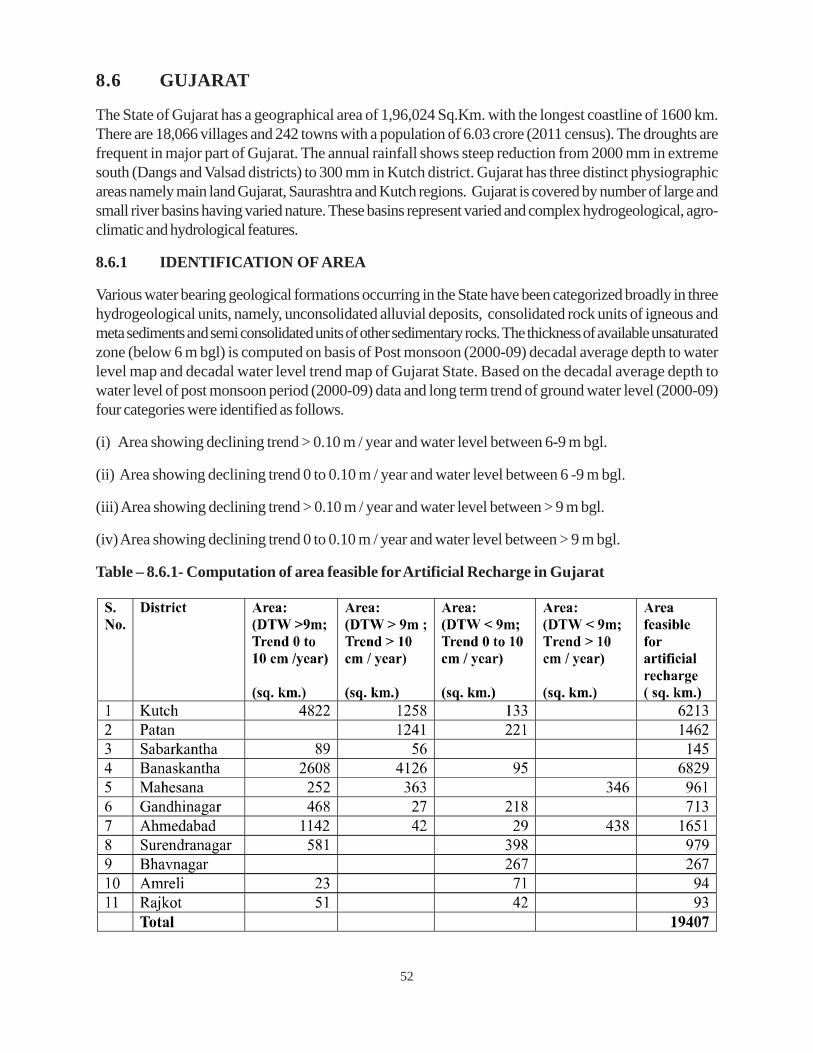
52
8.6 GUJARAT
The State of Gujarat has a geographical area of 1,96,024 Sq.Km. with the longest coastline of 1600 km.There are 18,066 villages and 242 towns with a population of 6.03 crore (2011 census). The droughts arefrequent in major part of Gujarat. The annual rainfall shows steep reduction from 2000 mm in extremesouth (Dangs and Valsad districts) to 300 mm in Kutch district. Gujarat has three distinct physiographicareas namely main land Gujarat, Saurashtra and Kutch regions. Gujarat is covered by number of large andsmall river basins having varied nature. These basins represent varied and complex hydrogeological, agro-climatic and hydrological features.
8.6.1 IDENTIFICATION OF AREA
Various water bearing geological formations occurring in the State have been categorized broadly in threehydrogeological units, namely, unconsolidated alluvial deposits, consolidated rock units of igneous andmeta sediments and semi consolidated units of other sedimentary rocks. The thickness of available unsaturatedzone (below 6 m bgl) is computed on basis of Post monsoon (2000-09) decadal average depth to waterlevel map and decadal water level trend map of Gujarat State. Based on the decadal average depth towater level of post monsoon period (2000-09) data and long term trend of ground water level (2000-09)four categories were identified as follows.
(i) Area showing declining trend > 0.10 m / year and water level between 6-9 m bgl.
(ii) Area showing declining trend 0 to 0.10 m / year and water level between 6 -9 m bgl.
(iii) Area showing declining trend > 0.10 m / year and water level between > 9 m bgl.
(iv) Area showing declining trend 0 to 0.10 m / year and water level between > 9 m bgl.
Table – 8.6.1- Computation of area feasible for Artificial Recharge in Gujarat
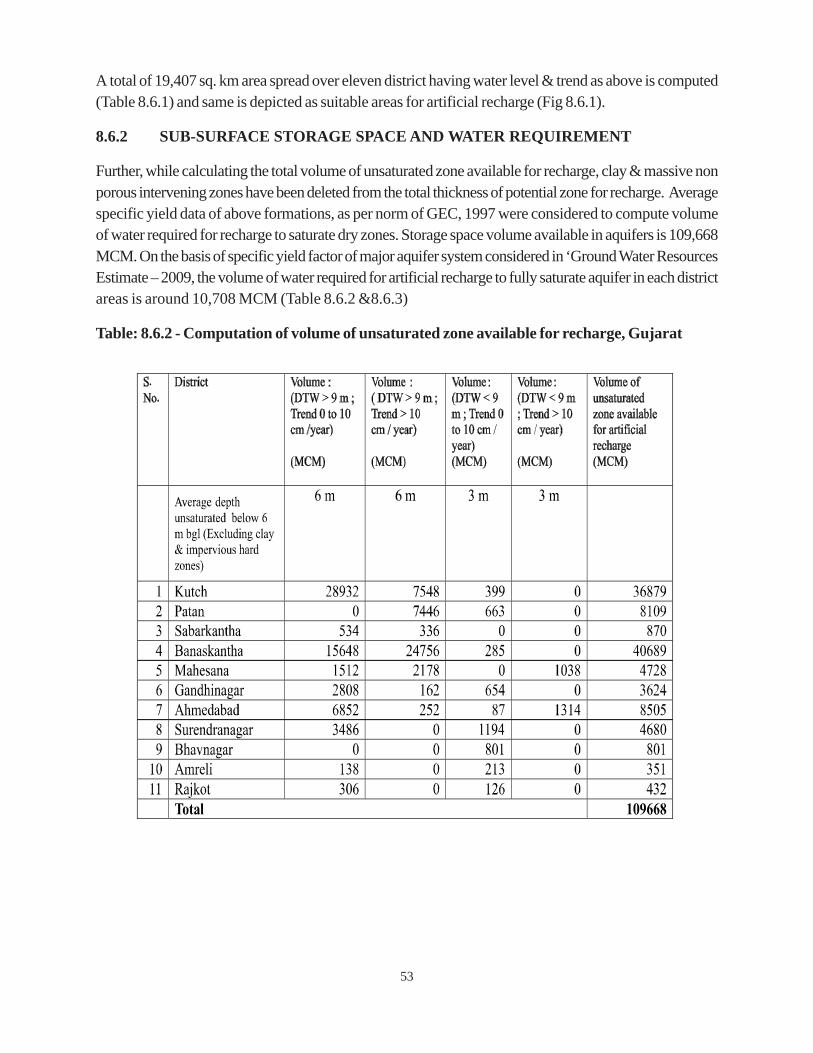
53
A total of 19,407 sq. km area spread over eleven district having water level & trend as above is computed(Table 8.6.1) and same is depicted as suitable areas for artificial recharge (Fig 8.6.1).
8.6.2 SUB-SURFACE STORAGE SPACE AND WATER REQUIREMENT
Further, while calculating the total volume of unsaturated zone available for recharge, clay & massive nonporous intervening zones have been deleted from the total thickness of potential zone for recharge. Averagespecific yield data of above formations, as per norm of GEC, 1997 were considered to compute volumeof water required for recharge to saturate dry zones. Storage space volume available in aquifers is 109,668MCM. On the basis of specific yield factor of major aquifer system considered in ‘Ground Water ResourcesEstimate – 2009, the volume of water required for artificial recharge to fully saturate aquifer in each districtareas is around 10,708 MCM (Table 8.6.2 &8.6.3)
Table: 8.6.2 - Computation of volume of unsaturated zone available for recharge, Gujarat
.
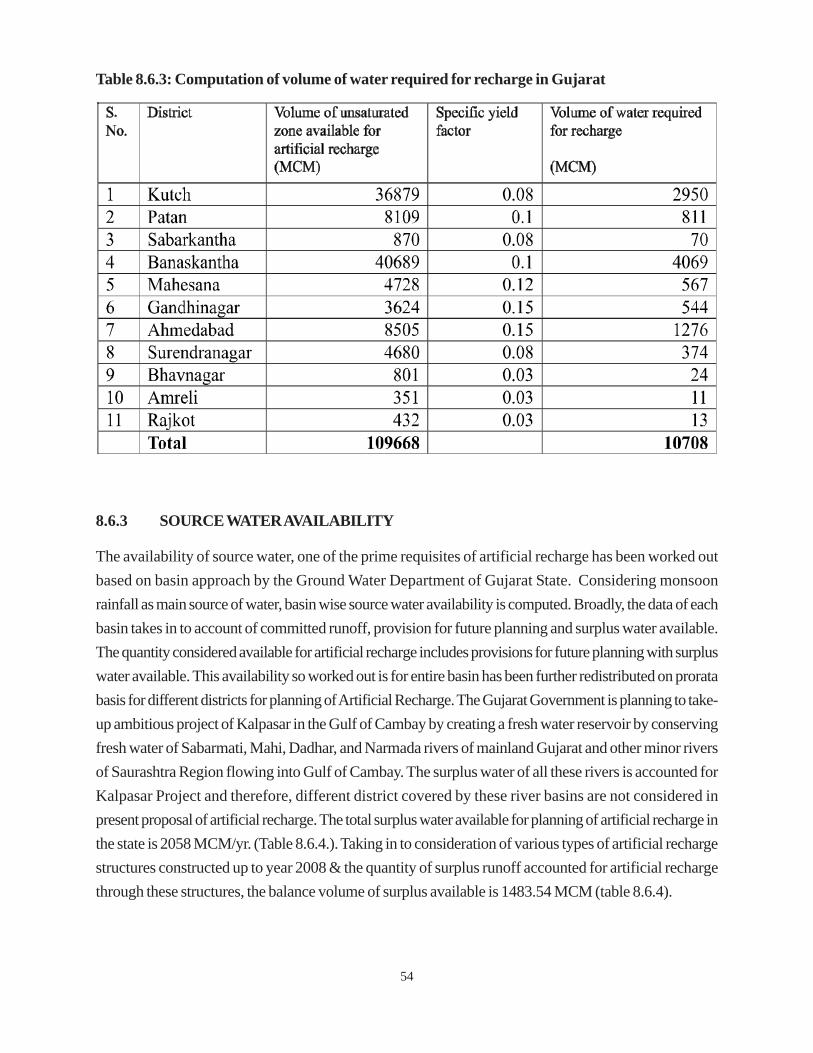
54
Table 8.6.3: Computation of volume of water required for recharge in Gujarat
8.6.3 SOURCE WATER AVAILABILITY
The availability of source water, one of the prime requisites of artificial recharge has been worked outbased on basin approach by the Ground Water Department of Gujarat State. Considering monsoonrainfall as main source of water, basin wise source water availability is computed. Broadly, the data of eachbasin takes in to account of committed runoff, provision for future planning and surplus water available.The quantity considered available for artificial recharge includes provisions for future planning with surpluswater available. This availability so worked out is for entire basin has been further redistributed on proratabasis for different districts for planning of Artificial Recharge. The Gujarat Government is planning to take-up ambitious project of Kalpasar in the Gulf of Cambay by creating a fresh water reservoir by conservingfresh water of Sabarmati, Mahi, Dadhar, and Narmada rivers of mainland Gujarat and other minor riversof Saurashtra Region flowing into Gulf of Cambay. The surplus water of all these rivers is accounted forKalpasar Project and therefore, different district covered by these river basins are not considered inpresent proposal of artificial recharge. The total surplus water available for planning of artificial recharge inthe state is 2058 MCM/yr. (Table 8.6.4.). Taking in to consideration of various types of artificial rechargestructures constructed up to year 2008 & the quantity of surplus runoff accounted for artificial rechargethrough these structures, the balance volume of surplus available is 1483.54 MCM (table 8.6.4).
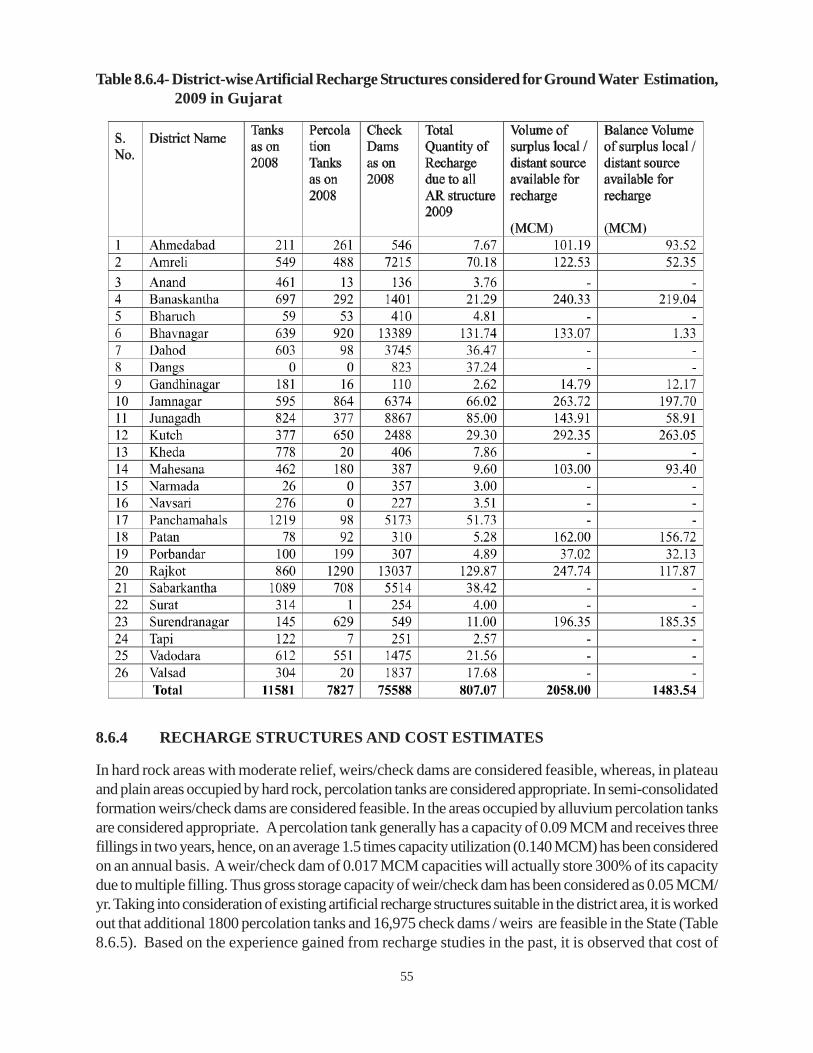
55
Table 8.6.4- District-wise Artificial Recharge Structures considered for Ground Water Estimation, 2009 in Gujarat
8.6.4 RECHARGE STRUCTURES AND COST ESTIMATES
In hard rock areas with moderate relief, weirs/check dams are considered feasible, whereas, in plateauand plain areas occupied by hard rock, percolation tanks are considered appropriate. In semi-consolidatedformation weirs/check dams are considered feasible. In the areas occupied by alluvium percolation tanksare considered appropriate. A percolation tank generally has a capacity of 0.09 MCM and receives threefillings in two years, hence, on an average 1.5 times capacity utilization (0.140 MCM) has been consideredon an annual basis. A weir/check dam of 0.017 MCM capacities will actually store 300% of its capacitydue to multiple filling. Thus gross storage capacity of weir/check dam has been considered as 0.05 MCM/yr. Taking into consideration of existing artificial recharge structures suitable in the district area, it is workedout that additional 1800 percolation tanks and 16,975 check dams / weirs are feasible in the State (Table8.6.5). Based on the experience gained from recharge studies in the past, it is observed that cost of
56
structure depends upon local situation. For the present planning average cost of structure has been adoptedfrom the guidelines laid down by Govt. of Gujarat. A percolation tank may cost around Rs.5 Lakh. Similarlya weir/check dam may cost around Rs. 4 lakh. Thus the total cost of project is estimated to be Rs.769crores for constructing various structures as indicated in table 8.6.5.
8.6.5 ROOF TOP RAIN WATER HARVESTING
It has been assessed that roof top rainwater harvesting can be adopted in 5 lakh houses, govt buildings,institutes etc. in urban and municipal area of the state suitable for artificial recharge in the first phase. It willharness 110.4 MCM rain water to augment groundwater resources considering normal rainfall for the stateand 80% efficiency of the system. The cost of roof top rain water harvesting of a buildings having roof andpaved areas of ~ 200 sq.m has been assessed to be Rs. 10,000/- and for bigger building having more than1000 sq.m will be Rs. 1.0 lakh. The total cost for the roof top rain water harvesting for the state has beenestimated to be Rs. 725 crore in the first phase considering 5% of the total buildings having larger roofs.
8.6.6 TOTAL COST
The total cost of artificial recharge structures and roof top rain water harvesting is estimated as Rs. 1494crores for the state of Gujarat.

57
Tabl
e – 8
.6.5
Dis
tric
t wis
e det
ails
of A
rtifi
cial
Rec
harg
e Str
uctu
res i
n G
ujar
at
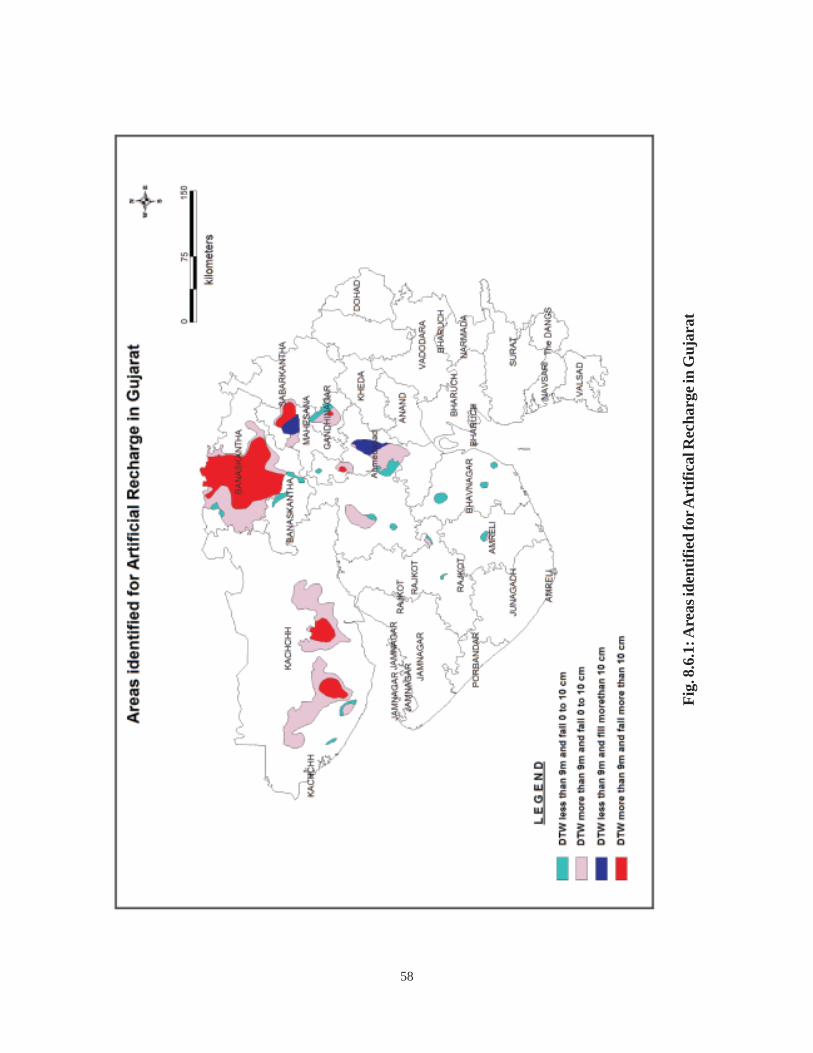
58
Fig.
8.6
.1: A
reas
iden
tifie
d fo
r Art
ifica
l Rec
harg
e in
Guj
arat
59
8.7 HARYANA
Haryana state is located in the north western part of India. It has an areal extent of 44,212 sq.km. andforms 1.35 % of the geographical area of the country. Around 97% of the state area is plain and known asIndo-Gangetic plain. The state forms the part of Ganga & Indus basin. The normal annual rainfall variesfrom more than 1000 mm in the north east to less than 300 mm in the south west. In the south western partsof the state, drought is a common feature.
In the north eastern and eastern parts of the state, fairly thick and regionally extensive confined/unconfinedaquifers exist down to a depth of more than 300 m with yield prospects of about 150 m3/hour. Thealluvium down to 450 m below land surface has been explored in this part. In the south-western and thecentral parts of the state, moderately thick and regionally extensive confined/unconfined aquifers exist.The ground water here is generally saline at all levels except local patches. The yield prospects in this areaare less than 50 m3/hour. In the remaining areas moderately thick and regionally extensive aquifers existand their yield prospects are 50-150 m3/hour mainly due to limitation of depth as underlying ground wateris saline. In the hard rock areas the ground water potentials are limited and there the yield prospects are 5to 20 m3/hour within weathered residum and fractured zones.
Ground water resources of state have been estimated as on 31.03.2009. The Net annual ground wateravailability of state has been assessed to be 9.80 BCM. Net annual draft of the state has been estimated tobe 12.43 BCM. The average stage of ground water development in the state is 127%. Out of 117 blocksassessed, 68 fall under ‘Over exploited’ category, 21 in ‘Critical’, 9 as ‘Semi Critical’ and 18 as ‘Safe’category. The reason for this stage of ground water development are excessive withdrawal of groundwater mainly to meet growing demands of agriculture in addition to industrial and domestic needs. Thusstress is more and more on ground water. These over-exploited aquifers require augmentation for sustainingthe ground water abstraction structures.
8.7.1 IDENTIFICATION OF AREA
Based on the post monsoon depth to water level and long term ground water level trends, it has beenestimated that ~37,029 sq. kms area is feasible for artificial recharge. (Fig 8.7.1).
8.7.2 SUB-SURFACE STORAGE SPACE AND WATER REQUIREMENT
The total volume of unsaturated strata is calculated by considering unsaturated thickness of aquifers onblock-wise basis. This volume of unsaturated aquifer is multiplied by average specific yield i.e. 12% toarrive at the quantity of water required which is to be recharged by artificial methods to saturate the aquiferup to 3 mbgl. Sub surface storage potential of the State is estimated as 54,175 MCM. District-wisebreak up is given in the table 8.7.1
8.7.3 SOURCE WATER AVAILABILITY
The quantity of non-committed surplus surface water in the Haryana state has been estimated to be only679.26 MCM against the requirement of 54,175 MCM.
60
8.7.4 RECHARGE STRUCTURES AND COST ESTIMATES
The main recharge structures suitable in the state are recharge shaft, horizontal trench with or withoutinjection wells and check dams. The average cost of a recharge shaft to recharge 0.015 MCM waterannually will be around Rs. 2.50 lakh and of check dam to recharge 0.04 MCM annually will be aroundRs. 50 lakhs in Aravali hills and Rs. 30 lakhs in Siwaliks. The total cost of 44,727 recharge structuresrequired to recharge will be around Rs. 1255.30 crores. The district wise number of structures feasibleand cost estimates is given in table 8.7.1.
8.7.5 AREA BENEFITED
It is estimated that influence of recharge schemes as proposed will be observed in about 16,000 sq km andit will not only check decline in ground water level but rise of water level up to 0.5 m per year is expected.In Haryana state almost entire cultivable area in northern and eastern parts is under irrigation by surface orground water. The area falling in southern and south western parts have less irrigation facility. The additionalrecharge to ground water will bring about 1, 37,000 ha of additional area under assured irrigation.
8.7.6 ROOF TOP RAIN WATER HARVESTING
It has been assessed that roof top rainwater harvesting can be adopted in 15 lakh houses, govt buildings,institutes etc. in urban and municipal area of the state suitable for artificial recharge in the first phase. It willharness 187 MCM rain water to augment groundwater resources considering normal rainfall for the stateand 80% efficiency of the system. The cost of roof top rain water harvesting of a buildings having roof andpaved areas of ~ 200 sq.m in a cluster of 4-6 houses has been assessed to be Rs. 30,000/- and for biggerbuilding having more than 1000 sq.m will be Rs. 1.0 lakh. The total cost for the roof top rain waterharvesting for the state has been estimated to be Rs. 1650 crore in the first phase considering 3 lakhstructures for houses on cluster basis and 75,000 structures for government/institutional buildings.
8.7.7 ARTIFICIAL RECHARGE FROM SEWAGE WATER
Besides rainfall, ample scope exists to recharge treated sewage water, which is disposed away from thetown without any purposeful gain. At present, in majority of the towns sewage water is subjected toprimary treatment only. In certain towns, the sewage water is subjected to secondary treatment. Thissecondary treated water can also be used as source for artificial recharge after assessing the suitability ofchemical quality. The towns where treated sewage water is available are Panipat, Karnal, Faridabad,Yamunanagar, Gurgaon, Sonepat etc. The total capacity of the plants installed for treatment in these townsis 0.325 MCM per day. Therefore, total treated water availability per year is 118.6 MCM. To rechargethis water around 1000 recharge structures will be required. The total cost of these structures will be Rs2500 lacs @ Rs 2.50 lakh per structure. Besides this, there are about 48 urban agglomerations which arelocated in the area suitable for artificial recharge. The total population of these towns is around 13 lakhs.The sewage generated from these towns is around 45.5 MCM annually. The sewage in these towns issubjected to primary treatment only, which is not suitable for artificial recharge. If sewage in these towns isgiven secondary/tertiary treatment, it may be utilized for artificial recharge in proximity of the towns.
8.7.8 TOTAL COST
The cost of taking up artificial recharge in rural and urban areas will be Rs.2930.30 crores.
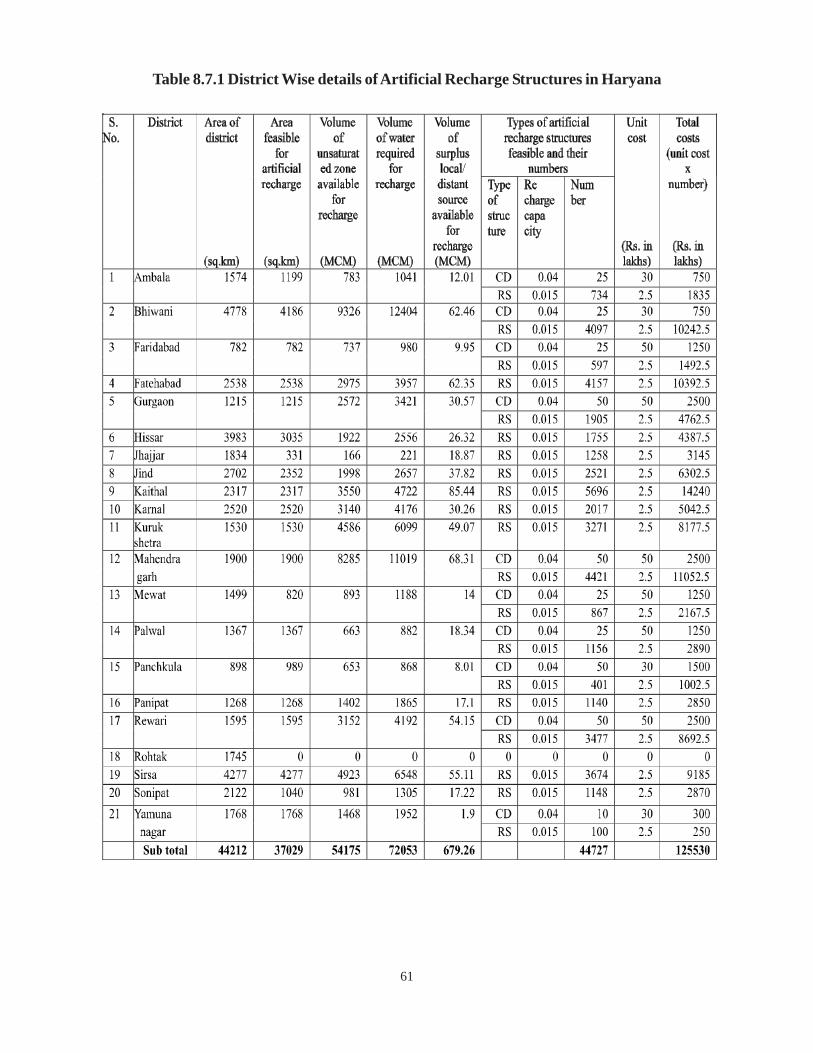
61
Table 8.7.1 District Wise details of Artificial Recharge Structures in Haryana
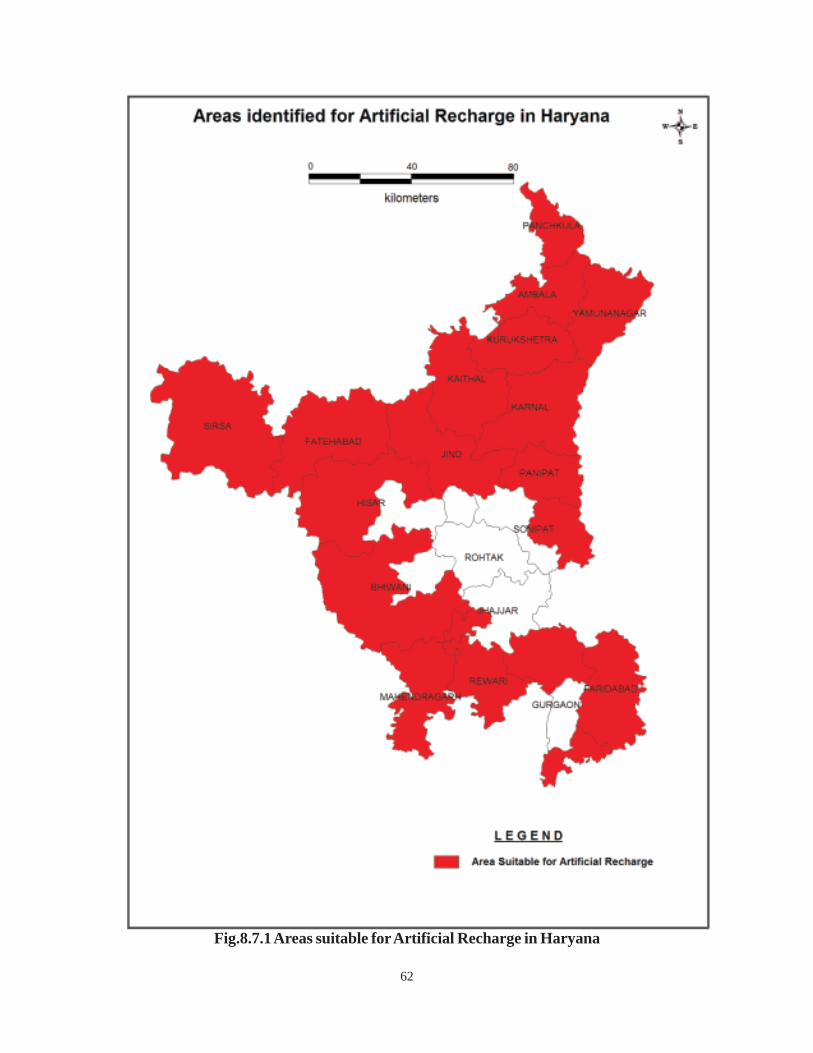
62
Fig.8.7.1 Areas suitable for Artificial Recharge in Haryana
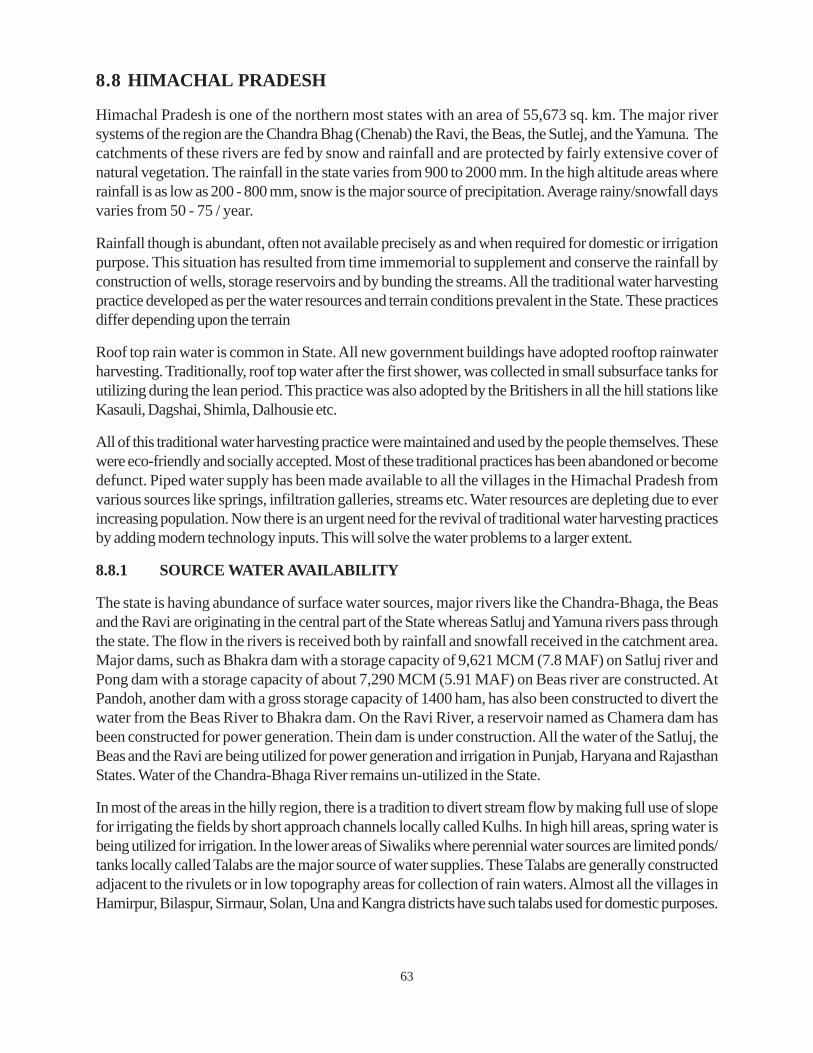
63
8.8 HIMACHAL PRADESH
Himachal Pradesh is one of the northern most states with an area of 55,673 sq. km. The major riversystems of the region are the Chandra Bhag (Chenab) the Ravi, the Beas, the Sutlej, and the Yamuna. Thecatchments of these rivers are fed by snow and rainfall and are protected by fairly extensive cover ofnatural vegetation. The rainfall in the state varies from 900 to 2000 mm. In the high altitude areas whererainfall is as low as 200 - 800 mm, snow is the major source of precipitation. Average rainy/snowfall daysvaries from 50 - 75 / year.
Rainfall though is abundant, often not available precisely as and when required for domestic or irrigationpurpose. This situation has resulted from time immemorial to supplement and conserve the rainfall byconstruction of wells, storage reservoirs and by bunding the streams. All the traditional water harvestingpractice developed as per the water resources and terrain conditions prevalent in the State. These practicesdiffer depending upon the terrain
Roof top rain water is common in State. All new government buildings have adopted rooftop rainwaterharvesting. Traditionally, roof top water after the first shower, was collected in small subsurface tanks forutilizing during the lean period. This practice was also adopted by the Britishers in all the hill stations likeKasauli, Dagshai, Shimla, Dalhousie etc.
All of this traditional water harvesting practice were maintained and used by the people themselves. Thesewere eco-friendly and socially accepted. Most of these traditional practices has been abandoned or becomedefunct. Piped water supply has been made available to all the villages in the Himachal Pradesh fromvarious sources like springs, infiltration galleries, streams etc. Water resources are depleting due to everincreasing population. Now there is an urgent need for the revival of traditional water harvesting practicesby adding modern technology inputs. This will solve the water problems to a larger extent.
8.8.1 SOURCE WATER AVAILABILITY
The state is having abundance of surface water sources, major rivers like the Chandra-Bhaga, the Beasand the Ravi are originating in the central part of the State whereas Satluj and Yamuna rivers pass throughthe state. The flow in the rivers is received both by rainfall and snowfall received in the catchment area.Major dams, such as Bhakra dam with a storage capacity of 9,621 MCM (7.8 MAF) on Satluj river andPong dam with a storage capacity of about 7,290 MCM (5.91 MAF) on Beas river are constructed. AtPandoh, another dam with a gross storage capacity of 1400 ham, has also been constructed to divert thewater from the Beas River to Bhakra dam. On the Ravi River, a reservoir named as Chamera dam hasbeen constructed for power generation. Thein dam is under construction. All the water of the Satluj, theBeas and the Ravi are being utilized for power generation and irrigation in Punjab, Haryana and RajasthanStates. Water of the Chandra-Bhaga River remains un-utilized in the State.
In most of the areas in the hilly region, there is a tradition to divert stream flow by making full use of slopefor irrigating the fields by short approach channels locally called Kulhs. In high hill areas, spring water isbeing utilized for irrigation. In the lower areas of Siwaliks where perennial water sources are limited ponds/tanks locally called Talabs are the major source of water supplies. These Talabs are generally constructedadjacent to the rivulets or in low topography areas for collection of rain waters. Almost all the villages inHamirpur, Bilaspur, Sirmaur, Solan, Una and Kangra districts have such talabs used for domestic purposes.

64
8.8.2. DESIGN OF ARTIFICIAL RECHARGE STRUCUTRES
Wide spectrums of techniques are in vogue to recharge ground water reservoir. Similar to the variations inHydrogeological frame work, the artificial recharge techniques too would vary accordingly. The artificialrecharge structures which are feasible in varied Hydrogeological situation are gabion structures, checkdams, cement plug/nala bund, sub-surface dykes, recharge shaft and injection wells. The area suitable forartificial recharge is shown in fig 8.8.1
8.8.3 ROOF TOP RAIN WATER HARVESTING
It has been assessed that roof top rainwater harvesting can be adopted in 50,000 houses, govt buildings,institutes etc. in urban and municipal area of the state suitable for artificial recharge in the first phase. It willharness 13.0 MCM rain water to augment groundwater resources considering normal rainfall for the stateand 80% efficiency of the system. The cost of roof top rain water harvesting of a buildings having roof andpaved areas of ~ 200 sq.m has been assessed to be Rs. 12,000/- and for bigger building having more than1000 sq.m will be Rs. 1.0 lakh. The total cost for the roof top rain water harvesting for the state has beenestimated to be Rs. 82.0 crore in the first phase considering 5% of the total buildings having larger roofs.
8.8.4 TOTAL COST
The total cost of artificial recharge structures roof top rainwater harvesting structures and revival of tanksand ponds would be around Rs.655.47 crore as per table 8.8.1.
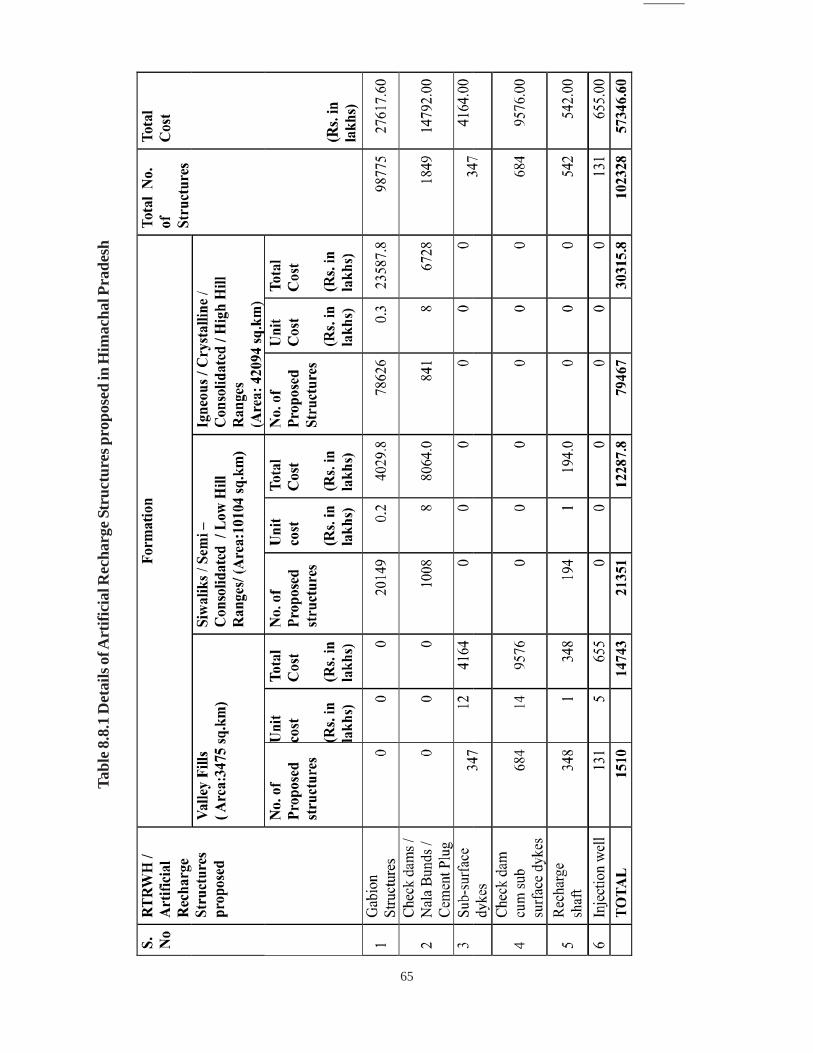
65
Tabl
e 8.8
.1 D
etai
ls o
f Art
ifici
al R
echa
rge S
truc
ture
s pro
pose
d in
Him
acha
l Pra
desh
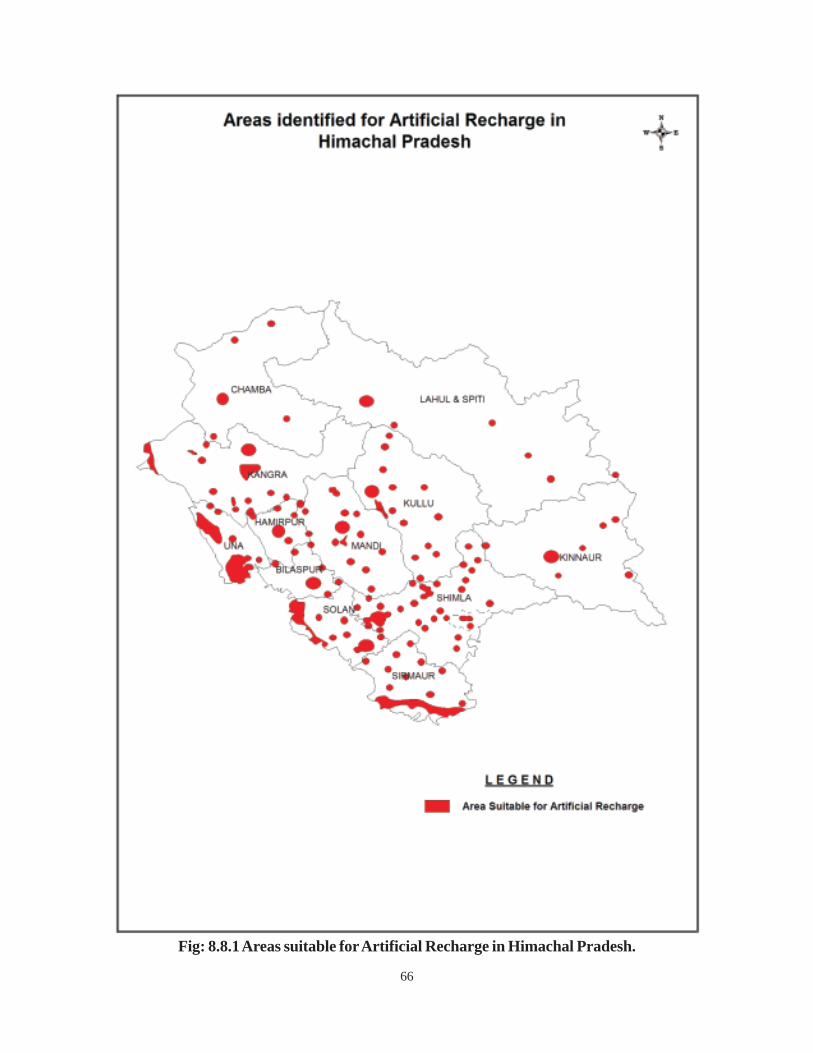
66
Fig: 8.8.1 Areas suitable for Artificial Recharge in Himachal Pradesh.
67
8.9 JAMMU & KASHMIR
Jammu & Kashmir has a total geographical area of 2, 22,236 sq.km which includes an area of 78,932sq.km under illegal occupation of Pakistan and 37,555 km2 area under illegal occupation of China. TheJammu and Kashmir State is divided into two administrative divisions viz. Kashmir Division comprisingKashmir and Ladakh regions, and Jammu division comprising Jammu region. The average annualprecipitation is 660 mm. The state is drained by the rivers of Indus River System whereas a small area inthe extreme north-east is drained by the rivulets of QaraQash River Basin. Kandi region of the state has anaverage annual rainfall of about 1100 mm. It faces acute water scarcity, especially during summer due tovery high run-off resulting from high topographic gradient. The fragile eco-system of the Kandi region isprone to erosion and as result high rate of siltation takes place in the ponds which necessitates periodic de-silting. The problem of water scarcity is more acute in higher reaches of the Kandi area as the villages arelocated on high slopes of Siwalik hills and the rivers and streams flow through deep cut valleys.
8.9.1 SOURCE WATER AVAILABILITY
The mean annual surplus run-off in Chenab sub-basin is 27,220 MCM while in Tawi sub-basin it is 1953MCM. Thus, the total surplus run-off available is 29,173 MCM. Volume of water required for recharge isestimated considering specific yield as 3%.
8.9.2 RECHARGE STRUCTURES AND COST ESTIMATES
The depth to water level during pre-monsoon season in Kandi region is generally very deep (15 to 74 mbelow ground level). Rainwater harvesting and groundwater conservation structures are required to providesustainability to existing sources such as springs, ponds wells etc. The area identified for artificial rechargeto groundwater in Jammu & Kashmir are given in fig 8.9.1. Considering the topography, precipitation andlocal aspects following structures are proposed:
8.9.2.1 Nala bund/Check dams
Nala bund/check dams are the most suitable structure in Kandi area to store and recharge the groundwater. The average length of such structure will be about 15m with average height of 1.5m above the nalabed. The underlying formations are highly permeable down to water level. The average cost of suchstructure will be around Rs. 10 lakhs. Each nala bund/check dam will impound 0.0135 MCM of surfaceflow in single filling. Considering the average of three fillings per year, the structure is expected to harvestabout 1.0 MCM annually. Taking into account the topography of the catchment it is proposed to construct1000 such structures to conserve 1000 MCM of surface flow. The total cost of these structures at the rateof Rs. 10.0 lakh per structure works out to be Rs. 100 crores.
8.9.2.2 Revival of Ponds
There are 336 big ponds in Kandi region, covering on an average of 1, 50,000 m2 area, which need to berevived for increasing their efficiency as rainwater harvesting structure. These major ponds in Kandi regionshould be desilted and deepened for storing the rainwater. The ponds can also be connected with nearbyrivulets by constructing small check dams and diversion channels. The deepening of ponds may be done tothe extent that the average depth of water in it is about 2 m. Considering an average depth of deepening as2 m the volume of water that can be harnessed by one pond of the dimension of 300 x 500 m, the storagewould be 0.30 MCM in one filling and approximately 1 MCM due to multiple filling. Thus, additionalstorage of 336 MCM water can be created in 336 Kandi ponds for recharge. Considering the cost as Rs.
68
10 lakh per pond the total cost of deepening 336 ponds and connecting them with the nearby rivuletsworks out to be Rs. 33.60 crores. There are ponds in other regions of the state which can also be used forrecharge purpose. It is expected to recharge around 352 MCM through additional 352 ponds. Theapproximate cost would be Rs.35.20 crores. Thus total amount would be Rs. 68.80 crore.
8.9.2.3 ROOF TOP RAIN WATER HARVESTING
It has been assessed that roof top rainwater harvesting can be adopted in 1.0 lakh houses, govt buildings,institutes etc. in urban and municipal area of the state suitable for artificial recharge in the first phase. It willharness 12.0 MCM rain water to augment groundwater resources considering normal rainfall for the stateand 80% efficiency of the system. The cost of roof top rain water harvesting of a buildings having roof andpaved areas of ~ 200 sq.m has been assessed to be Rs. 10,000/- and for bigger building having more than1000 sq.m will be Rs. 1.0 lakh. The total cost for the roof top rain water harvesting for the state has beenestimated to be Rs. 145.0 crore in the first phase considering 5% of the total buildings having larger roofs.
8.9.3 TOTAL COST
The total cost of artificial recharge to the groundwater in the State of Jammu & Kashmir would be aroundRs. 331.80 crores, with break up as follows:
(i) Nala bund/Check dams …… Rs. 100.00 crores
(ii) Construction/ Revival of Kandi Ponds …… Rs. 68.80 crores
(iii) Rooftop Harvesting in Houses …. .. Rs. 95.00 crores
(iv) Rooftop Harvesting in
Govt./Institutional buildings …… Rs. 50.00 crores
TOTAL COST …… Rs. 313.80 crores.

69
Fig 8.9.1 Areas identified for Artificial Recharge to Ground Water in Jammu & Kashmir
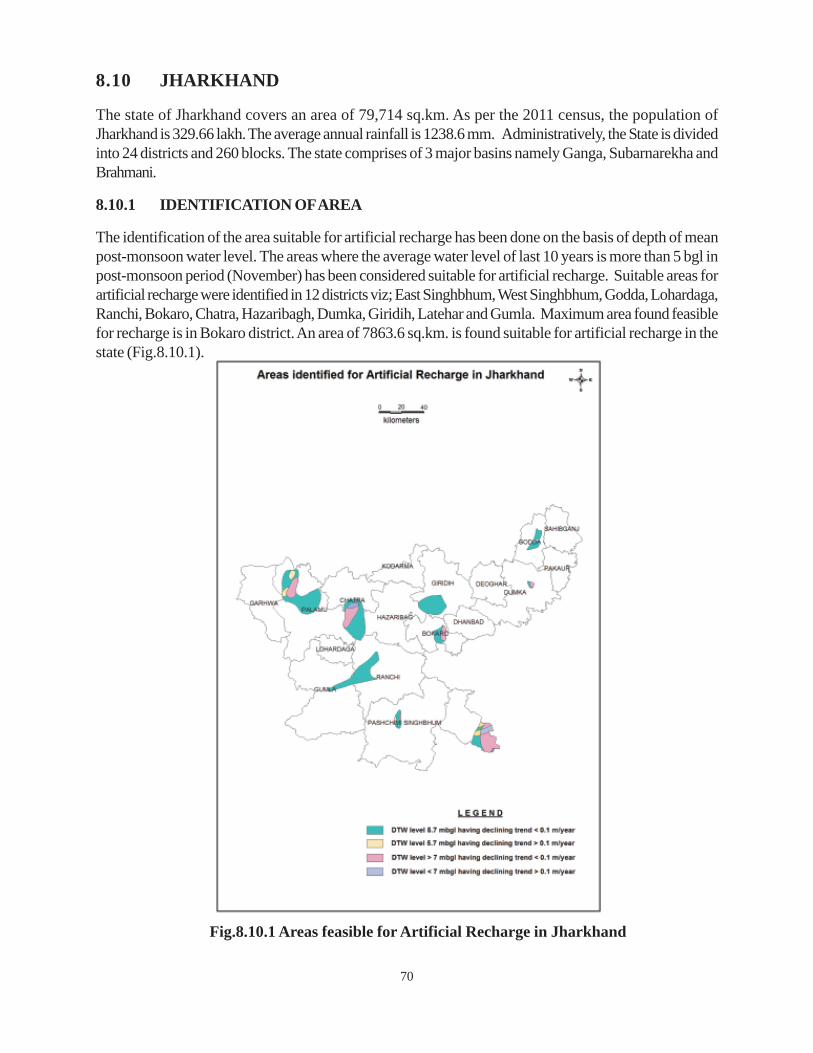
70
8.10 JHARKHAND
The state of Jharkhand covers an area of 79,714 sq.km. As per the 2011 census, the population ofJharkhand is 329.66 lakh. The average annual rainfall is 1238.6 mm. Administratively, the State is dividedinto 24 districts and 260 blocks. The state comprises of 3 major basins namely Ganga, Subarnarekha andBrahmani.
8.10.1 IDENTIFICATION OF AREA
The identification of the area suitable for artificial recharge has been done on the basis of depth of meanpost-monsoon water level. The areas where the average water level of last 10 years is more than 5 bgl inpost-monsoon period (November) has been considered suitable for artificial recharge. Suitable areas forartificial recharge were identified in 12 districts viz; East Singhbhum, West Singhbhum, Godda, Lohardaga,Ranchi, Bokaro, Chatra, Hazaribagh, Dumka, Giridih, Latehar and Gumla. Maximum area found feasiblefor recharge is in Bokaro district. An area of 7863.6 sq.km. is found suitable for artificial recharge in thestate (Fig.8.10.1).
Fig.8.10.1 Areas feasible for Artificial Recharge in Jharkhand
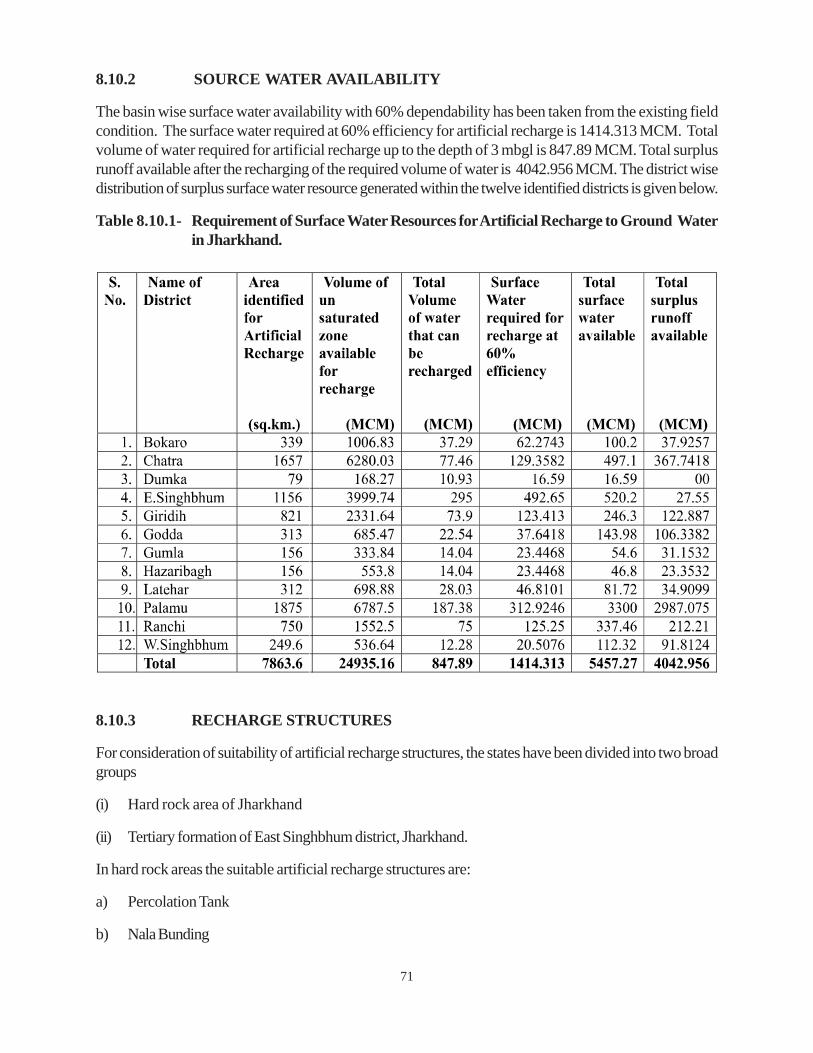
71
8.10.2 SOURCE WATER AVAILABILITY
The basin wise surface water availability with 60% dependability has been taken from the existing fieldcondition. The surface water required at 60% efficiency for artificial recharge is 1414.313 MCM. Totalvolume of water required for artificial recharge up to the depth of 3 mbgl is 847.89 MCM. Total surplusrunoff available after the recharging of the required volume of water is 4042.956 MCM. The district wisedistribution of surplus surface water resource generated within the twelve identified districts is given below.
Table 8.10.1- Requirement of Surface Water Resources for Artificial Recharge to Ground Waterin Jharkhand.
8.10.3 RECHARGE STRUCTURES
For consideration of suitability of artificial recharge structures, the states have been divided into two broadgroups
(i) Hard rock area of Jharkhand
(ii) Tertiary formation of East Singhbhum district, Jharkhand.
In hard rock areas the suitable artificial recharge structures are:
a) Percolation Tank
b) Nala Bunding
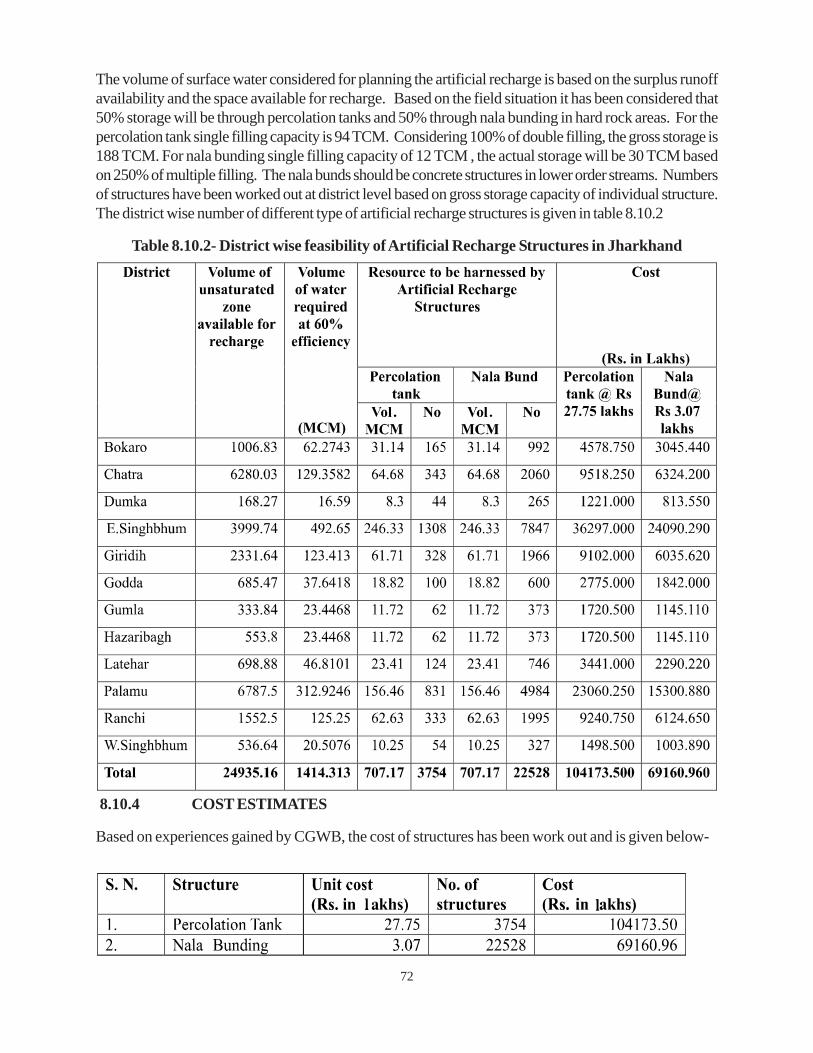
72
The volume of surface water considered for planning the artificial recharge is based on the surplus runoffavailability and the space available for recharge. Based on the field situation it has been considered that50% storage will be through percolation tanks and 50% through nala bunding in hard rock areas. For thepercolation tank single filling capacity is 94 TCM. Considering 100% of double filling, the gross storage is188 TCM. For nala bunding single filling capacity of 12 TCM , the actual storage will be 30 TCM basedon 250% of multiple filling. The nala bunds should be concrete structures in lower order streams. Numbersof structures have been worked out at district level based on gross storage capacity of individual structure.The district wise number of different type of artificial recharge structures is given in table 8.10.2
Table 8.10.2- District wise feasibility of Artificial Recharge Structures in Jharkhand
8.10.4 COST ESTIMATES
Based on experiences gained by CGWB, the cost of structures has been work out and is given below-
73
The district wise cost estimates for different types of structures are given in table 8.10.2. In 12 districts, thetotal cost of the percolation tanks is 1041.74 crores and nala bunds is 691.61 crores. Thus, the total costrequired for artificial recharge structures (3754 percolation tanks + 22,528 Nala bund) is 1733.34 crores.
8.10.5 ROOFTOP RAINWATER HARVESTING IN URBAN AREAS
It has been assessed that roof top rain water harvesting can be adopted in 2 Lakh houses, govt. buildings,institutes etc. in urban and municipal areas of the state suitable for artificial recharge in the first phase. It willharness 47.56 MCM rain water to augment ground water resources considering normal rainfall for thestate and 80% efficiency of the system. The cost of roof top rain water harvesting of a building having roofand paved area of ~ 200 sq.m. has been assessed to be Rs. 10,000/- and for bigger buildings having morethan 1000 sq.m. will be Rs. 1.0 lakhs. The total cost for the roof top rain water harvesting for the state hasbeen estimated to be Rs.290.0 Crores in the first phase considering 5% of the total buildings having largerroofs.
8.10.6 TOTAL COST
Total cost of the artificial recharge schemes and roof top rain water harvesting is Rs. 2023.34 crores forthe state of Jharkhand.
8.10.7 PRESENT STATUS OF ARTIFICIAL RECHARGE STRUCTURES
Out of total number of proposed nala bund (22528) only 4974 nala bund / check dam have been completedand out of 2,00,000 buildings which has to be rain water harvested through roof top only 1203 numbershave been constructed, through different Govt. Departments (as per the data available). With regard topercolation tank no data was available (Table-8.10.3).

74
Table 8.10.3 - District wise numbers of completed Check Dam and Roof Top Rain Water Harvesting structures of State Govt. Departments, Jharkhand
75
8.11 KARNATAKA
Karnataka state is located in south western part of India with a population as per the census (2011) is61,130,704 and population density of 319 per sq km. It covers an area of 1,91,791 sq. km. and dividedinto 30 districts and 176 Taluks for administrative convenience.
The state is covered with black, red, lateritic, gravelly, alluvial and mixed soils. Infiltration rates of thesesoils vary from 0.5 to 114 cm/hour. Bulk of the annual rainfall is received during the south-west and north-east monsoons. Humid to semi arid climatic conditions prevail in the state. Normal annual rainfall variesfrom 573 to 4119mm.
Physiographically, Karnataka is divided into four regions
(i) The Coastal belt
(ii) The Malnad region
(iii) The Northern Maidan region
(iv) The Southern Maidan region
The Western Ghats which runs North-South forms the principal water divide in the state, giving rise toWest and East flowing rivers of Karnataka. The Sharavati, the Kalinadi, the Netravati, the Varahi, theBedti and Aghanashini are some of the important rivers which originate from the Western Ghats and flowwesterly and join the Arabian Sea. The Krishna River system covers an area 1,13,271 sq. km and drains59.06 percent of Karnataka State followed by the Cauvery river system which drains 34273 sq. kmcovering 17.87 percent. The west flowing rivers drain 26,214 sq. km area of the state covering 13.68percent. Other river systems cover appreciably small areas.
Geologically, the important formations occurring in the state are gneisses, granites, schists, basalts andsedimentaries. Quality of ground water in general is good and potable in the state. However fluorideconcentration of more than 1.5 ppm is found in areas falling in Bellary, Raichur, Kolar, Chitradurga, Dharwarand Tumkur district which are underlain by closepet granites and other younger granites and pegmatitesetc. High nitrate concentrations are mostly seen in the districts of Raichur, Bijapur, Gulbarga, Hassan,Mandya, Bangalore and Tumkur having intensive surface irrigation agriculture practices using chemical andorganic manures or having poor solid waste disposal.
8.11.1 IDENTIFICATION OF AREA
The area characterized by depth to water level of more than 3 m bgl during the post-monsoon period andarea with declining decadal water level trend is considered as area requiring artificial recharge. The areacharacterized by both declining trend and depth to water levels has been taken into consideration fortaking up artificial recharge schemes. The rain-fed catchment areas are most suitable to take up artificialrecharge through watershed treatment structures such as check dams.
As far as ground water quality is concerned, poor ground water quality areas need special attention. Thequality of ground water will improve due to dilution by way of adding fresh water through artificial recharge.Hence, such areas are also taken into consideration while preparing the present plan. The stage of groundwater development is an important bench mark in finalizing the area to take up artificial recharge scheme.
76
The area where the stage of development is more than 100 percent is considered as the priority areas.Areas suitable for artificial recharge are given in Fig. 8.11.1
8.11.2 SUBSURFACE STORAGE SPACE
The thickness of unsaturated zone for each category of depth to water level is arrived and 3 m is subtractedto get the unsaturated thickness available for recharge in the regional level. The state is covered by crystallineformations, an average specific yield of 1 % has been assumed. The density of various artificial rechargestructures and design are inferred by the integrated hydro geological set-up and the status of ground waterdevelopment as well as the feasibility of structures with source water.
8.11.3 SOURCE WATER AVAILABILITY
Monsoon rainfall run off is the only source water for artificial recharge in the state. Non-committed monsoonrunoff is taken based on “Theme paper on water Vision 2050 water resources day 99” of NWDA.
8.11.4 NUMBER OF RECHARGE STRUCTURES
The estimated cost of artificial recharge structures in Karnataka State works out to be 1998.65 crores andthe proposed structures and other details are given in Table 8.11.2. Out of this the state govt has alreadyspent about Rs 250 crores towards construction of such structures in various parts of the state.
8.11.5 ROOF TOP RAIN WATER HARVESTING
It has been assessed that roof top rain water harvesting can be adopted in 7 lakh houses, govt. buildings,institutes etc. in urban and municipal areas of the state suitable for artificial recharge in the first phase. It willharness 167.73 MCM rain water to augment ground water resources considering normal rainfall for thestate and 80% efficiency of the system. The cost of roof top rain water harvesting of a building having roofand paved area of ~ 200 sq.m. has been assessed to be Rs12,000/- and for bigger buildings having morethan 1000 sq.m. will be Rs. 1.0 lakhs. The total cost for the roof top rain water harvesting for the statehas been estimated to be Rs.1148.0 crores in the first phase considering 5% of the total buildings havinglarger roofs.
8.11.6 COST ESTIMATES
The total cost of the artificial recharge structures and roof top rain water harvesting structures is estimatedto be Rs.3146.65 crores for implementation.
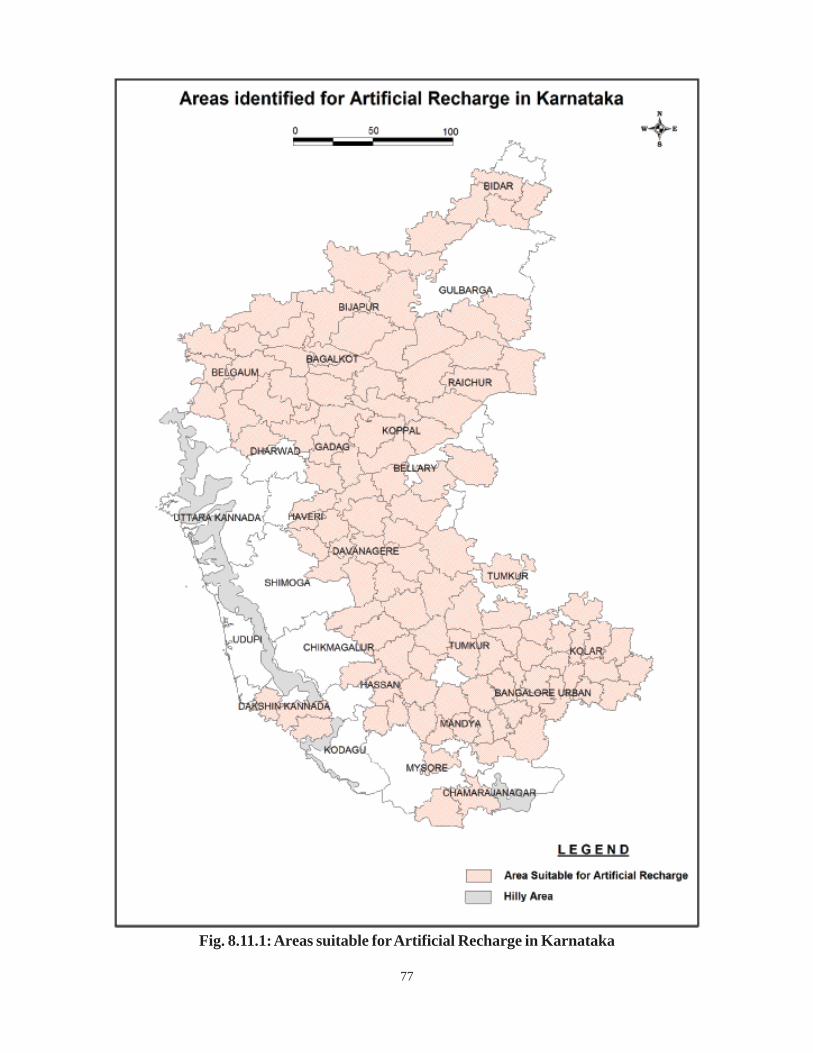
77
Fig. 8.11.1: Areas suitable for Artificial Recharge in Karnataka
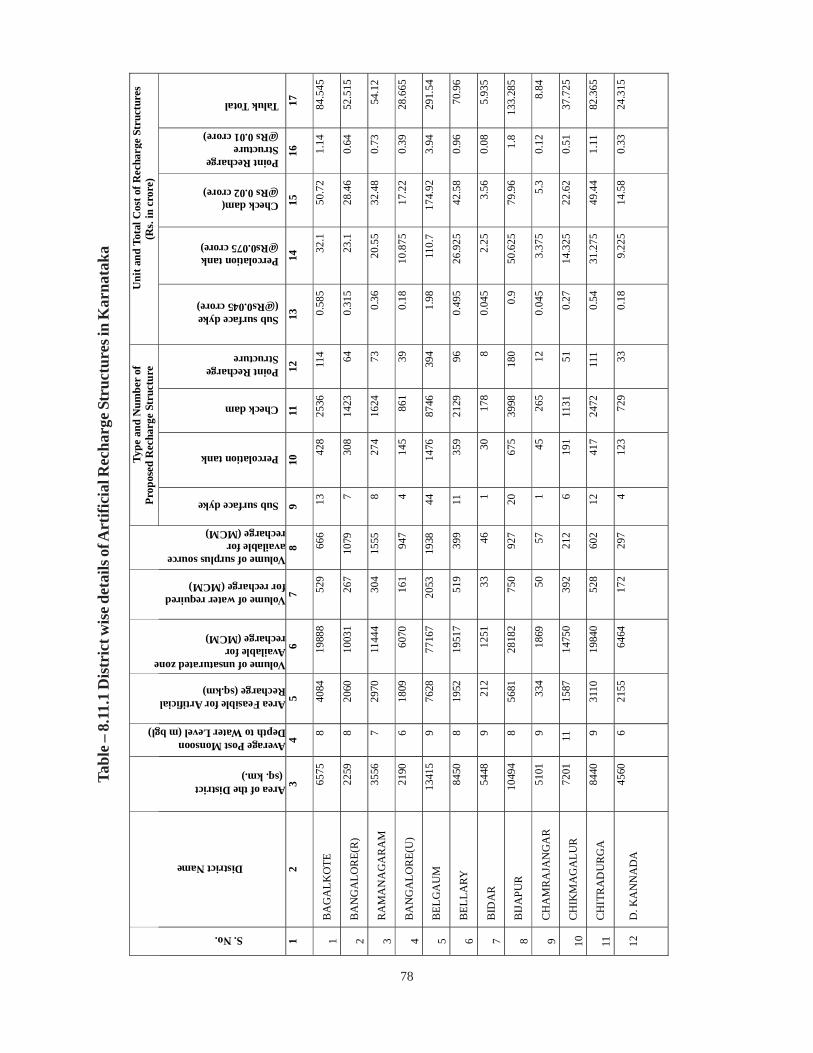
78
Tabl
e – 8
.11.
1 D
istr
ict w
ise d
etai
ls o
f Art
ifici
al R
echa
rge S
truc
ture
s in
Kar
nata
ka
Type
and
Num
ber
of
Prop
osed
Rec
harg
e St
ruct
ure
Uni
t and
Tot
al C
ost o
f Rec
harg
e St
ruct
ures
(R
s. in
cro
re)
S. No.
District Name
Area of the District (sq. km.)
Average Post Monsoon Depth to Water Level (m bgl)
Area Feasible for Artificial Recharge (sq.km)
Volume of unsaturated zone Available for recharge (MCM)
Volume of water required for recharge (MCM)
Volume of surplus source available for recharge (MCM)
Sub surface dyke
Percolation tank
Check dam
Point Recharge Structure
Sub surface dyke (@Rs0.045 crore)
Percolation tank @Rs0.075 crore)
Check dam( @Rs 0.02 crore) Point Recharge Structure @Rs 0.01 crore)
Taluk Total
1 2
3 4
5 6
7 8
9 10
11
12
13
14
15
16
17
1 B
AG
ALK
OTE
65
75
8 40
84
1988
8 52
9 66
6 13
42
8 25
36
114
0.58
5 32
.1
50.7
2 1.
14
84.5
45
2 B
AN
GA
LOR
E(R
) 22
59
8 20
60
1003
1 26
7 10
79
7 30
8 14
23
64
0.31
5 23
.1
28.4
6 0.
64
52.5
15
3 R
AM
AN
AG
AR
AM
35
56
7 29
70
1144
4 30
4 15
55
8 27
4 16
24
73
0.36
20
.55
32.4
8 0.
73
54.1
2
4 B
AN
GA
LOR
E(U
) 21
90
6 18
09
6070
16
1 94
7 4
145
861
39
0.18
10
.875
17
.22
0.39
28
.665
5 B
ELG
AU
M
1341
5 9
7628
77
167
2053
19
38
44
1476
87
46
394
1.98
11
0.7
174.
92
3.94
29
1.54
6 B
ELLA
RY
8450
8
1952
19
517
519
399
11
359
2129
96
0.
495
26.9
25
42.5
8 0.
96
70.9
6
7 B
IDA
R
5448
9
212
1251
33
46
1
30
178
8 0.
045
2.25
3.
56
0.08
5.
935
8 B
IJA
PUR
10
494
8 56
81
2818
2 75
0 92
7 20
67
5 39
98
180
0.9
50.6
25
79.9
6 1.
8 13
3.28
5
9 C
HA
MR
AJA
NG
AR
51
01
9 33
4 18
69
50
57
1 45
26
5 12
0.
045
3.37
5 5.
3 0.
12
8.84
10
CH
IKM
AG
ALU
R
7201
11
15
87
1475
0 39
2 21
2 6
191
1131
51
0.
27
14.3
25
22.6
2 0.
51
37.7
25
11
CH
ITR
AD
UR
GA
84
40
9 31
10
1984
0 52
8 60
2 12
41
7 24
72
111
0.54
31
.275
49
.44
1.11
82
.365
12
D. K
AN
NA
DA
45
60
6 21
55
6464
17
2 29
7 4
123
729
33
0.18
9.
225
14.5
8 0.
33
24.3
15
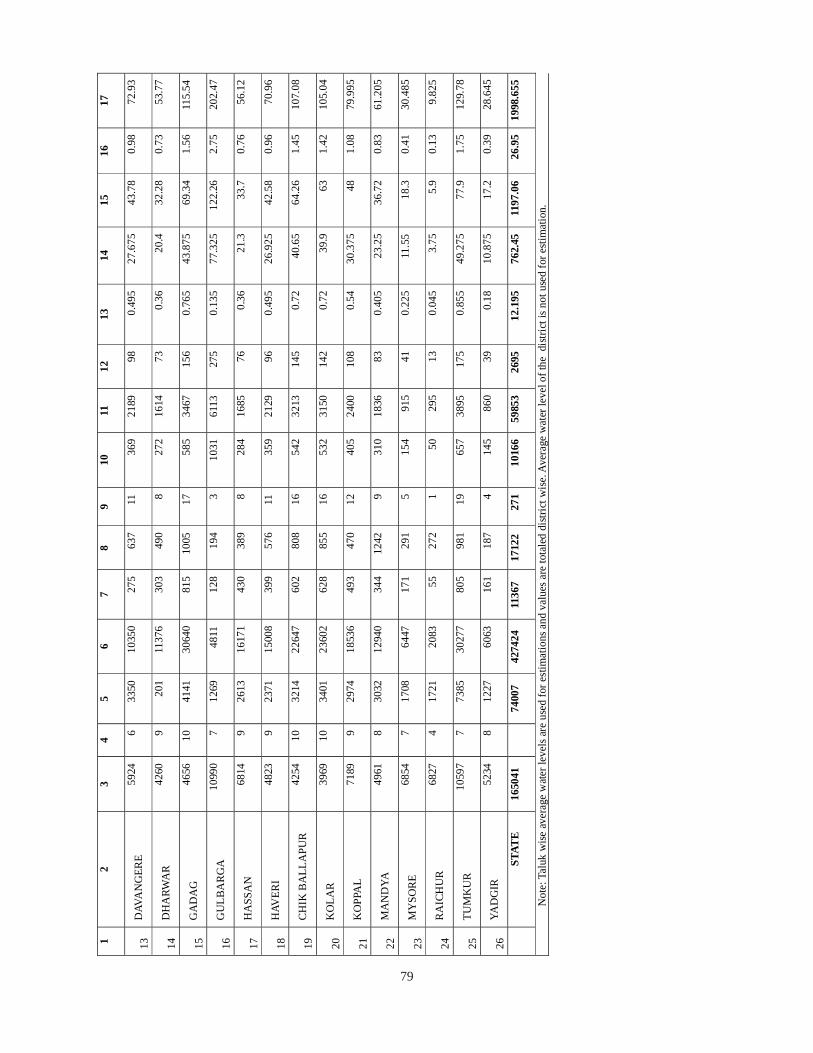
79
1 2
3 4
5 6
7 8
9 10
11
12
13
14
15
16
17
13
DAV
AN
GER
E 59
24
6 33
50
1035
0 27
5 63
7 11
36
9 21
89
98
0.49
5 27
.675
43
.78
0.98
72
.93
14
DH
ARW
AR
42
60
9 20
1 11
376
303
490
8 27
2 16
14
73
0.36
20
.4
32.2
8 0.
73
53.7
7
15
GA
DA
G
4656
10
41
41
3064
0 81
5 10
05
17
585
3467
15
6 0.
765
43.8
75
69.3
4 1.
56
115.
54
16
GU
LBA
RG
A
1099
0 7
1269
48
11
128
194
3 10
31
6113
27
5 0.
135
77.3
25
122.
26
2.75
20
2.47
17
HA
SSA
N
6814
9
2613
16
171
430
389
8 28
4 16
85
76
0.36
21
.3
33.7
0.
76
56.1
2
18
HAV
ERI
4823
9
2371
15
008
399
576
11
359
2129
96
0.
495
26.9
25
42.5
8 0.
96
70.9
6
19
CH
IK B
ALL
APU
R
4254
10
32
14
2264
7 60
2 80
8 16
54
2 32
13
145
0.72
40
.65
64.2
6 1.
45
107.
08
20
KO
LAR
39
69
10
3401
23
602
628
855
16
532
3150
14
2 0.
72
39.9
63
1.
42
105.
04
21
KO
PPA
L 71
89
9 29
74
1853
6 49
3 47
0 12
40
5 24
00
108
0.54
30
.375
48
1.
08
79.9
95
22
MA
ND
YA
4961
8
3032
12
940
344
1242
9
310
1836
83
0.
405
23.2
5 36
.72
0.83
61
.205
23
MY
SOR
E 68
54
7 17
08
6447
17
1 29
1 5
154
915
41
0.22
5 11
.55
18.3
0.
41
30.4
85
24
RA
ICH
UR
6827
4
1721
20
83
55
272
1 50
29
5 13
0.
045
3.75
5.
9 0.
13
9.82
5
25
TUM
KU
R
1059
7 7
7385
30
277
805
981
19
657
3895
17
5 0.
855
49.2
75
77.9
1.
75
129.
78
26
YAD
GIR
52
34
8 12
27
6063
16
1 18
7 4
145
860
39
0.18
10
.875
17
.2
0.39
28
.645
STAT
E
1650
41
7400
7 42
7424
11
367
1712
2 27
1 10
166
5985
3 26
95
12.1
95
762.
45
1197
.06
26.9
5 19
98.6
55
Not
e: T
aluk
wise
ave
rage
wat
er le
vels
are
use
d fo
r est
imat
ions
and
val
ues a
re to
tale
d di
stric
t wis
e. A
vera
ge w
ater
leve
l of t
he d
istri
ct is
not
use
d fo
r est
imat
ion.
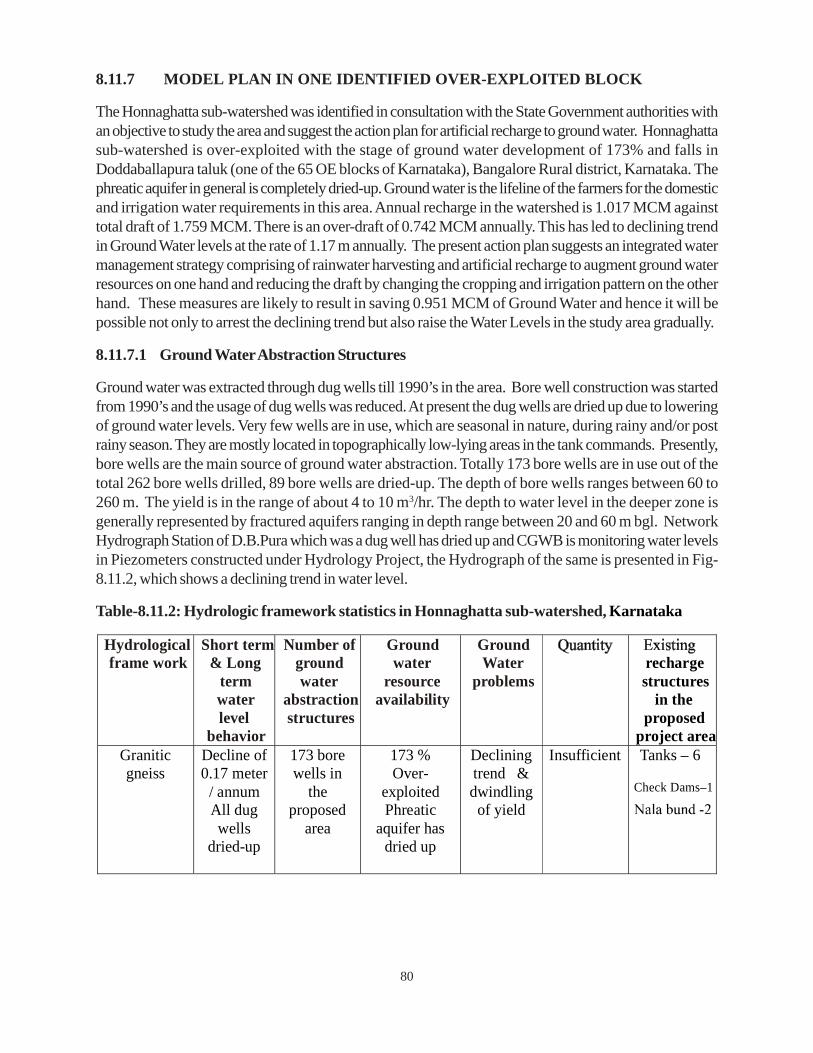
80
8.11.7 MODEL PLAN IN ONE IDENTIFIED OVER-EXPLOITED BLOCK
The Honnaghatta sub-watershed was identified in consultation with the State Government authorities withan objective to study the area and suggest the action plan for artificial recharge to ground water. Honnaghattasub-watershed is over-exploited with the stage of ground water development of 173% and falls inDoddaballapura taluk (one of the 65 OE blocks of Karnataka), Bangalore Rural district, Karnataka. Thephreatic aquifer in general is completely dried-up. Ground water is the lifeline of the farmers for the domesticand irrigation water requirements in this area. Annual recharge in the watershed is 1.017 MCM againsttotal draft of 1.759 MCM. There is an over-draft of 0.742 MCM annually. This has led to declining trendin Ground Water levels at the rate of 1.17 m annually. The present action plan suggests an integrated watermanagement strategy comprising of rainwater harvesting and artificial recharge to augment ground waterresources on one hand and reducing the draft by changing the cropping and irrigation pattern on the otherhand. These measures are likely to result in saving 0.951 MCM of Ground Water and hence it will bepossible not only to arrest the declining trend but also raise the Water Levels in the study area gradually.
8.11.7.1 Ground Water Abstraction Structures
Ground water was extracted through dug wells till 1990’s in the area. Bore well construction was startedfrom 1990’s and the usage of dug wells was reduced. At present the dug wells are dried up due to loweringof ground water levels. Very few wells are in use, which are seasonal in nature, during rainy and/or postrainy season. They are mostly located in topographically low-lying areas in the tank commands. Presently,bore wells are the main source of ground water abstraction. Totally 173 bore wells are in use out of thetotal 262 bore wells drilled, 89 bore wells are dried-up. The depth of bore wells ranges between 60 to260 m. The yield is in the range of about 4 to 10 m3/hr. The depth to water level in the deeper zone isgenerally represented by fractured aquifers ranging in depth range between 20 and 60 m bgl. NetworkHydrograph Station of D.B.Pura which was a dug well has dried up and CGWB is monitoring water levelsin Piezometers constructed under Hydrology Project, the Hydrograph of the same is presented in Fig-8.11.2, which shows a declining trend in water level.
Table-8.11.2: Hydrologic framework statistics in Honnaghatta sub-watershed, Karnataka
Hydrological frame work
Short term & Long
term water level
behavior
Number of ground water
abstraction structures
Ground water
resource availability
Ground Water
problems recharge structures
in the proposed
project areaGranitic gneiss
Decline of 0.17 meter
/ annum All dug wells
dried-up
173 bore wells in
the proposed
area
173 % Over-
exploited Phreatic
aquifer has dried up
Declining trend & dwindling
of yield
Insufficient Tanks – 6
Check Dams–1
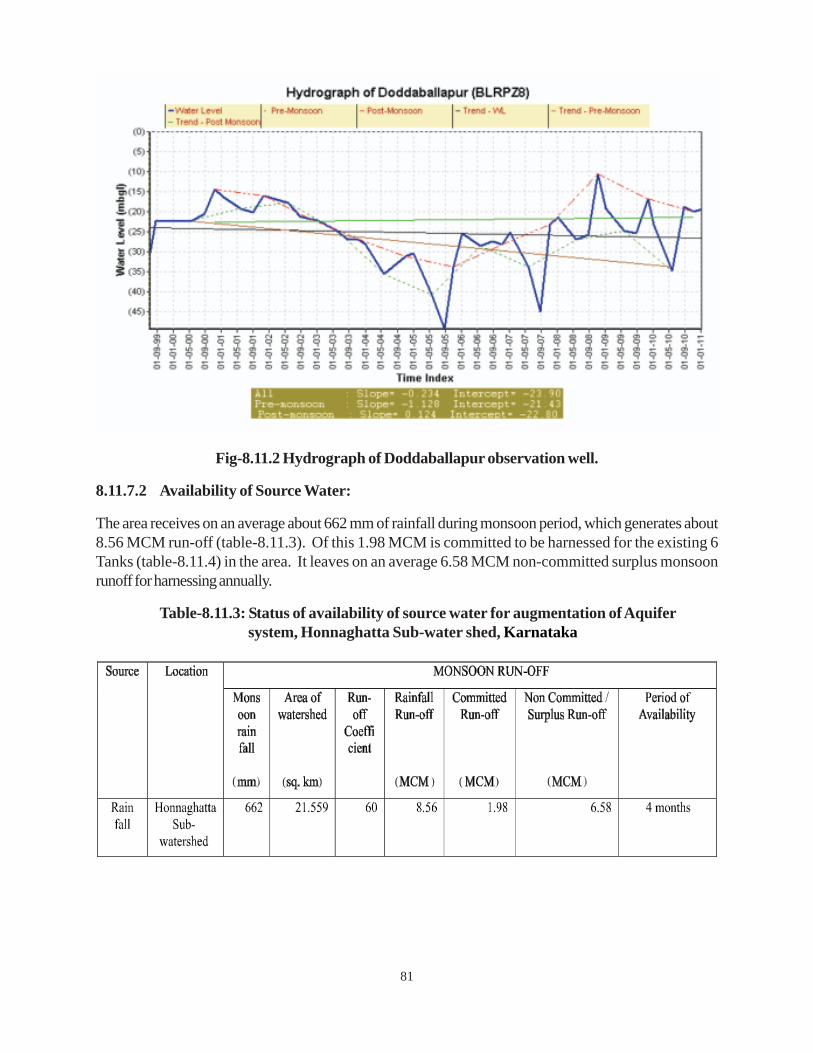
81
Fig-8.11.2 Hydrograph of Doddaballapur observation well.
8.11.7.2 Availability of Source Water:
The area receives on an average about 662 mm of rainfall during monsoon period, which generates about8.56 MCM run-off (table-8.11.3). Of this 1.98 MCM is committed to be harnessed for the existing 6Tanks (table-8.11.4) in the area. It leaves on an average 6.58 MCM non-committed surplus monsoonrunoff for harnessing annually.
Table-8.11.3: Status of availability of source water for augmentation of Aquifer system, Honnaghatta Sub-water shed, Karnataka
( ( ( ( (
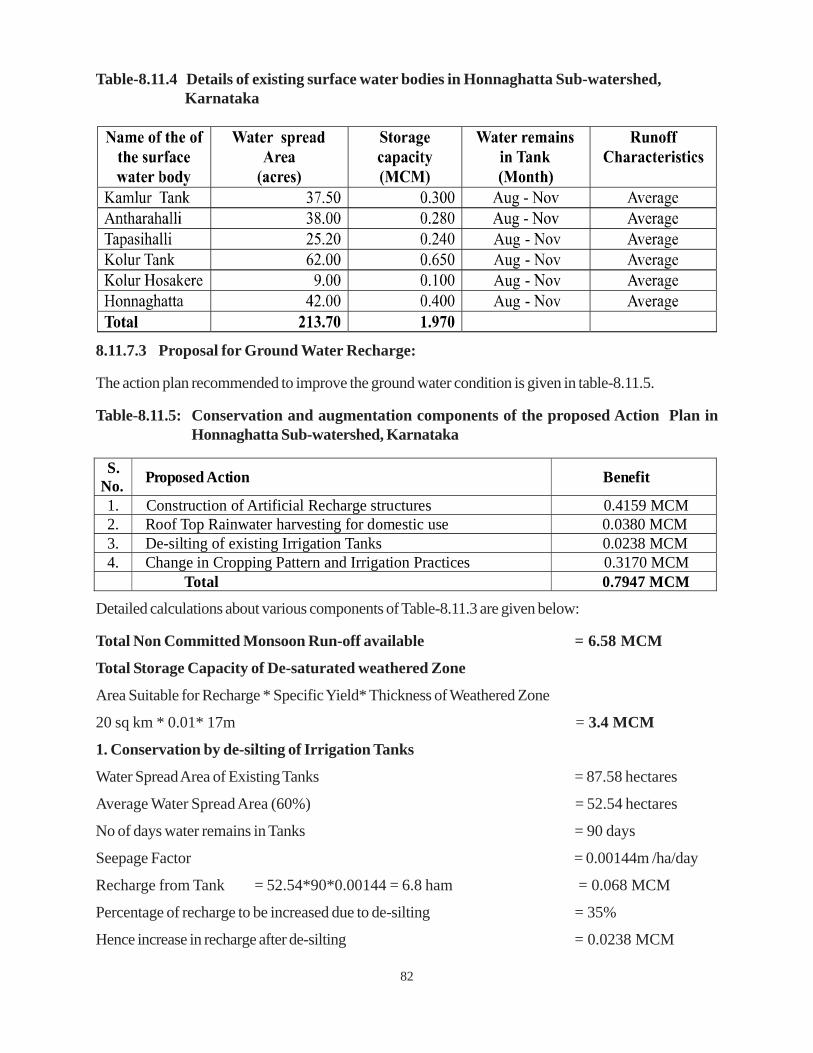
82
Table-8.11.4 Details of existing surface water bodies in Honnaghatta Sub-watershed, Karnataka
8.11.7.3 Proposal for Ground Water Recharge:
The action plan recommended to improve the ground water condition is given in table-8.11.5.
Table-8.11.5: Conservation and augmentation components of the proposed Action Plan inHonnaghatta Sub-watershed, Karnataka
Detailed calculations about various components of Table-8.11.3 are given below:
Total Non Committed Monsoon Run-off available = 6.58 MCM
Total Storage Capacity of De-saturated weathered Zone
Area Suitable for Recharge * Specific Yield* Thickness of Weathered Zone
20 sq km * 0.01* 17m = 3.4 MCM
1. Conservation by de-silting of Irrigation Tanks
Water Spread Area of Existing Tanks = 87.58 hectares
Average Water Spread Area (60%) = 52.54 hectares
No of days water remains in Tanks = 90 days
Seepage Factor = 0.00144m /ha/day
Recharge from Tank = 52.54*90*0.00144 = 6.8 ham = 0.068 MCM
Percentage of recharge to be increased due to de-silting = 35%
Hence increase in recharge after de-silting = 0.0238 MCM
S.
No. Proposed Action Benefit
1. Construction of Artificial Recharge structures 0.4159 MCM2. Roof Top Rainwater harvesting for domestic use 0.0380 MCM3. De-silting of existing Irrigation Tanks 0.0238 MCM4. Change in Cropping Pattern and Irrigation Practices 0.3170 MCM
Total 0.7947 MCM
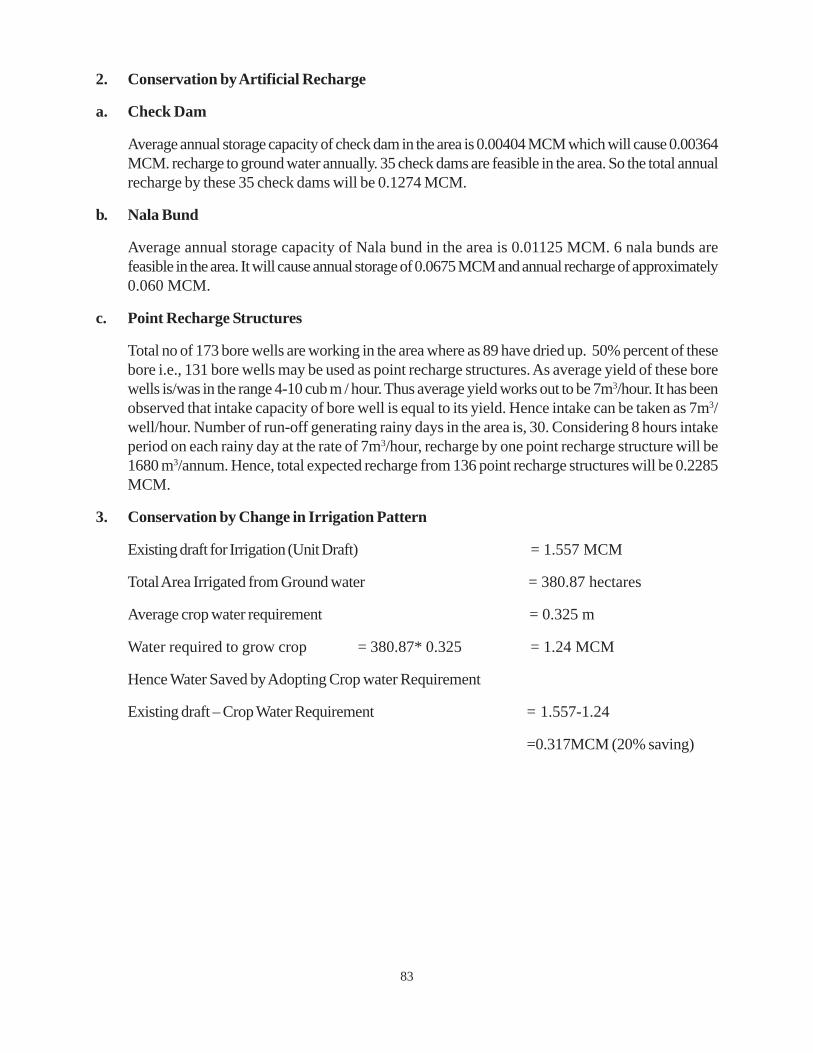
83
2. Conservation by Artificial Recharge
a. Check Dam
Average annual storage capacity of check dam in the area is 0.00404 MCM which will cause 0.00364MCM. recharge to ground water annually. 35 check dams are feasible in the area. So the total annualrecharge by these 35 check dams will be 0.1274 MCM.
b. Nala Bund
Average annual storage capacity of Nala bund in the area is 0.01125 MCM. 6 nala bunds arefeasible in the area. It will cause annual storage of 0.0675 MCM and annual recharge of approximately0.060 MCM.
c. Point Recharge Structures
Total no of 173 bore wells are working in the area where as 89 have dried up. 50% percent of thesebore i.e., 131 bore wells may be used as point recharge structures. As average yield of these borewells is/was in the range 4-10 cub m / hour. Thus average yield works out to be 7m3/hour. It has beenobserved that intake capacity of bore well is equal to its yield. Hence intake can be taken as 7m3/well/hour. Number of run-off generating rainy days in the area is, 30. Considering 8 hours intakeperiod on each rainy day at the rate of 7m3/hour, recharge by one point recharge structure will be1680 m3/annum. Hence, total expected recharge from 136 point recharge structures will be 0.2285MCM.
3. Conservation by Change in Irrigation Pattern
Existing draft for Irrigation (Unit Draft) = 1.557 MCM
Total Area Irrigated from Ground water = 380.87 hectares
Average crop water requirement = 0.325 m
Water required to grow crop = 380.87* 0.325 = 1.24 MCM
Hence Water Saved by Adopting Crop water Requirement
Existing draft – Crop Water Requirement = 1.557-1.24
=0.317MCM (20% saving)
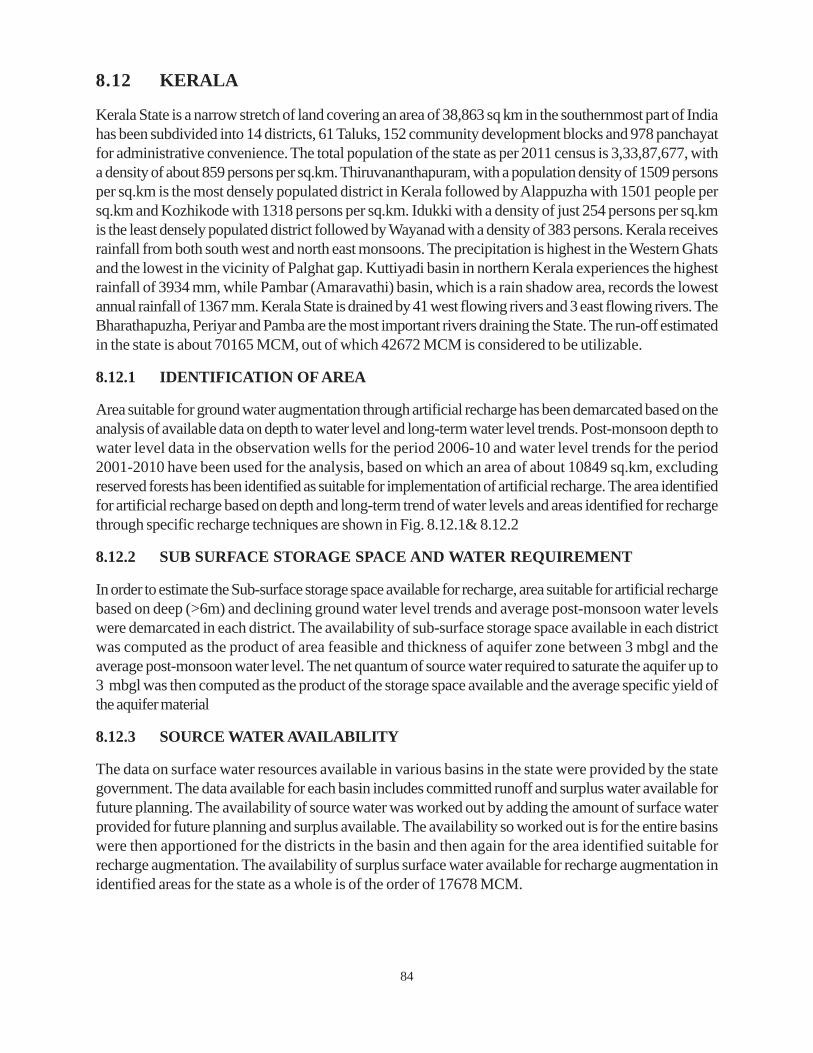
84
8.12 KERALA
Kerala State is a narrow stretch of land covering an area of 38,863 sq km in the southernmost part of Indiahas been subdivided into 14 districts, 61 Taluks, 152 community development blocks and 978 panchayatfor administrative convenience. The total population of the state as per 2011 census is 3,33,87,677, witha density of about 859 persons per sq.km. Thiruvananthapuram, with a population density of 1509 personsper sq.km is the most densely populated district in Kerala followed by Alappuzha with 1501 people persq.km and Kozhikode with 1318 persons per sq.km. Idukki with a density of just 254 persons per sq.kmis the least densely populated district followed by Wayanad with a density of 383 persons. Kerala receivesrainfall from both south west and north east monsoons. The precipitation is highest in the Western Ghatsand the lowest in the vicinity of Palghat gap. Kuttiyadi basin in northern Kerala experiences the highestrainfall of 3934 mm, while Pambar (Amaravathi) basin, which is a rain shadow area, records the lowestannual rainfall of 1367 mm. Kerala State is drained by 41 west flowing rivers and 3 east flowing rivers. TheBharathapuzha, Periyar and Pamba are the most important rivers draining the State. The run-off estimatedin the state is about 70165 MCM, out of which 42672 MCM is considered to be utilizable.
8.12.1 IDENTIFICATION OF AREA
Area suitable for ground water augmentation through artificial recharge has been demarcated based on theanalysis of available data on depth to water level and long-term water level trends. Post-monsoon depth towater level data in the observation wells for the period 2006-10 and water level trends for the period2001-2010 have been used for the analysis, based on which an area of about 10849 sq.km, excludingreserved forests has been identified as suitable for implementation of artificial recharge. The area identifiedfor artificial recharge based on depth and long-term trend of water levels and areas identified for rechargethrough specific recharge techniques are shown in Fig. 8.12.1& 8.12.2
8.12.2 SUB SURFACE STORAGE SPACE AND WATER REQUIREMENT
In order to estimate the Sub-surface storage space available for recharge, area suitable for artificial rechargebased on deep (>6m) and declining ground water level trends and average post-monsoon water levelswere demarcated in each district. The availability of sub-surface storage space available in each districtwas computed as the product of area feasible and thickness of aquifer zone between 3 mbgl and theaverage post-monsoon water level. The net quantum of source water required to saturate the aquifer up to3 mbgl was then computed as the product of the storage space available and the average specific yield ofthe aquifer material
8.12.3 SOURCE WATER AVAILABILITY
The data on surface water resources available in various basins in the state were provided by the stategovernment. The data available for each basin includes committed runoff and surplus water available forfuture planning. The availability of source water was worked out by adding the amount of surface waterprovided for future planning and surplus available. The availability so worked out is for the entire basinswere then apportioned for the districts in the basin and then again for the area identified suitable forrecharge augmentation. The availability of surplus surface water available for recharge augmentation inidentified areas for the state as a whole is of the order of 17678 MCM.
85
8.12.4 STRUCTURES AND COST ESTIMATES
Hydrogeologically, the areas have been grouped into hard rock and alluvial areas. Areas having waterlevels deeper than 6.0 mbgl have been considered for artificial recharge. Surface spreading techniquessuch as check dams, percolation ponds, gully plugs and nala bunds; ground water conservation structuressuch as sub-surface dykes and soil & water conservation techniques such as contour bunds have beenconsidered as appropriate structures for ground water augmentation in the State. Ground water conservationstructures like sub-surface dykes are also appropriate in parts of the districts depending on the topography.Soil & water conservation structures such as contour bunds are also feasible in the hilly areas of all thedistricts.
The volume of surface water required for recharge augmentation in identified areas of the state is 1520MCM. Based on the geomorphological and hydrogeological settings, the feasibility of artificial rechargethrough different structures has been assessed. The number of structures of each category required tofacilitate the recharge in each district has been computed accordingly. Based on local enquires, it has beengathered that about 34300 artificial recharge structures of different types have already been constructedby various agencies under various schemes. The net number of recharge structures in each district has beenarrived at by deducting the number of structures constructed from the number of structures feasible.
The details of unit capacity and unit cost of each type of artificial recharge structure proposed are furnishedbelow.
Fig. 8.12.2: Specific area suitable for Artificial Recharge in Kerala
Fig. 8.12.1: Area suitable for Artificial
Recharge in Kerala
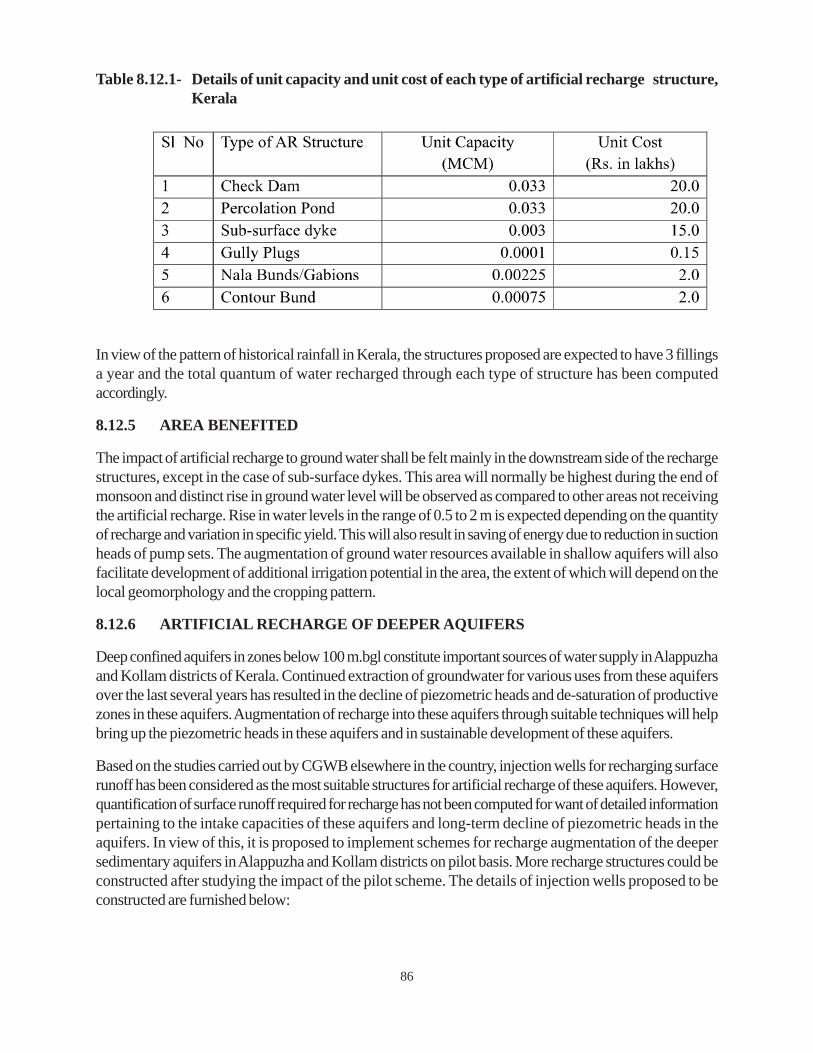
86
Table 8.12.1- Details of unit capacity and unit cost of each type of artificial recharge structure,Kerala
In view of the pattern of historical rainfall in Kerala, the structures proposed are expected to have 3 fillingsa year and the total quantum of water recharged through each type of structure has been computedaccordingly.
8.12.5 AREA BENEFITED
The impact of artificial recharge to ground water shall be felt mainly in the downstream side of the rechargestructures, except in the case of sub-surface dykes. This area will normally be highest during the end ofmonsoon and distinct rise in ground water level will be observed as compared to other areas not receivingthe artificial recharge. Rise in water levels in the range of 0.5 to 2 m is expected depending on the quantityof recharge and variation in specific yield. This will also result in saving of energy due to reduction in suctionheads of pump sets. The augmentation of ground water resources available in shallow aquifers will alsofacilitate development of additional irrigation potential in the area, the extent of which will depend on thelocal geomorphology and the cropping pattern.
8.12.6 ARTIFICIAL RECHARGE OF DEEPER AQUIFERS
Deep confined aquifers in zones below 100 m.bgl constitute important sources of water supply in Alappuzhaand Kollam districts of Kerala. Continued extraction of groundwater for various uses from these aquifersover the last several years has resulted in the decline of piezometric heads and de-saturation of productivezones in these aquifers. Augmentation of recharge into these aquifers through suitable techniques will helpbring up the piezometric heads in these aquifers and in sustainable development of these aquifers.
Based on the studies carried out by CGWB elsewhere in the country, injection wells for recharging surfacerunoff has been considered as the most suitable structures for artificial recharge of these aquifers. However,quantification of surface runoff required for recharge has not been computed for want of detailed informationpertaining to the intake capacities of these aquifers and long-term decline of piezometric heads in theaquifers. In view of this, it is proposed to implement schemes for recharge augmentation of the deepersedimentary aquifers in Alappuzha and Kollam districts on pilot basis. More recharge structures could beconstructed after studying the impact of the pilot scheme. The details of injection wells proposed to beconstructed are furnished below:
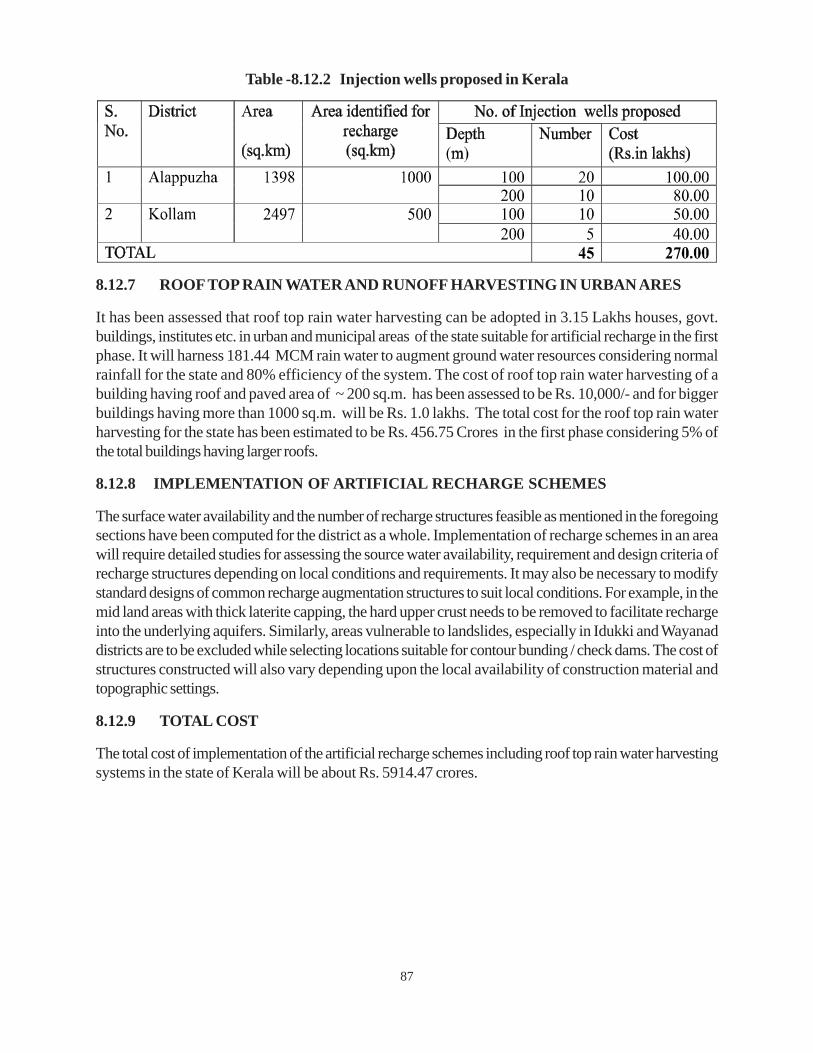
87
Table -8.12.2 Injection wells proposed in Kerala
8.12.7 ROOF TOP RAIN WATER AND RUNOFF HARVESTING IN URBAN ARES
It has been assessed that roof top rain water harvesting can be adopted in 3.15 Lakhs houses, govt.buildings, institutes etc. in urban and municipal areas of the state suitable for artificial recharge in the firstphase. It will harness 181.44 MCM rain water to augment ground water resources considering normalrainfall for the state and 80% efficiency of the system. The cost of roof top rain water harvesting of abuilding having roof and paved area of ~ 200 sq.m. has been assessed to be Rs. 10,000/- and for biggerbuildings having more than 1000 sq.m. will be Rs. 1.0 lakhs. The total cost for the roof top rain waterharvesting for the state has been estimated to be Rs. 456.75 Crores in the first phase considering 5% ofthe total buildings having larger roofs.
8.12.8 IMPLEMENTATION OF ARTIFICIAL RECHARGE SCHEMES
The surface water availability and the number of recharge structures feasible as mentioned in the foregoingsections have been computed for the district as a whole. Implementation of recharge schemes in an areawill require detailed studies for assessing the source water availability, requirement and design criteria ofrecharge structures depending on local conditions and requirements. It may also be necessary to modifystandard designs of common recharge augmentation structures to suit local conditions. For example, in themid land areas with thick laterite capping, the hard upper crust needs to be removed to facilitate rechargeinto the underlying aquifers. Similarly, areas vulnerable to landslides, especially in Idukki and Wayanaddistricts are to be excluded while selecting locations suitable for contour bunding / check dams. The cost ofstructures constructed will also vary depending upon the local availability of construction material andtopographic settings.
8.12.9 TOTAL COST
The total cost of implementation of the artificial recharge schemes including roof top rain water harvestingsystems in the state of Kerala will be about Rs. 5914.47 crores.
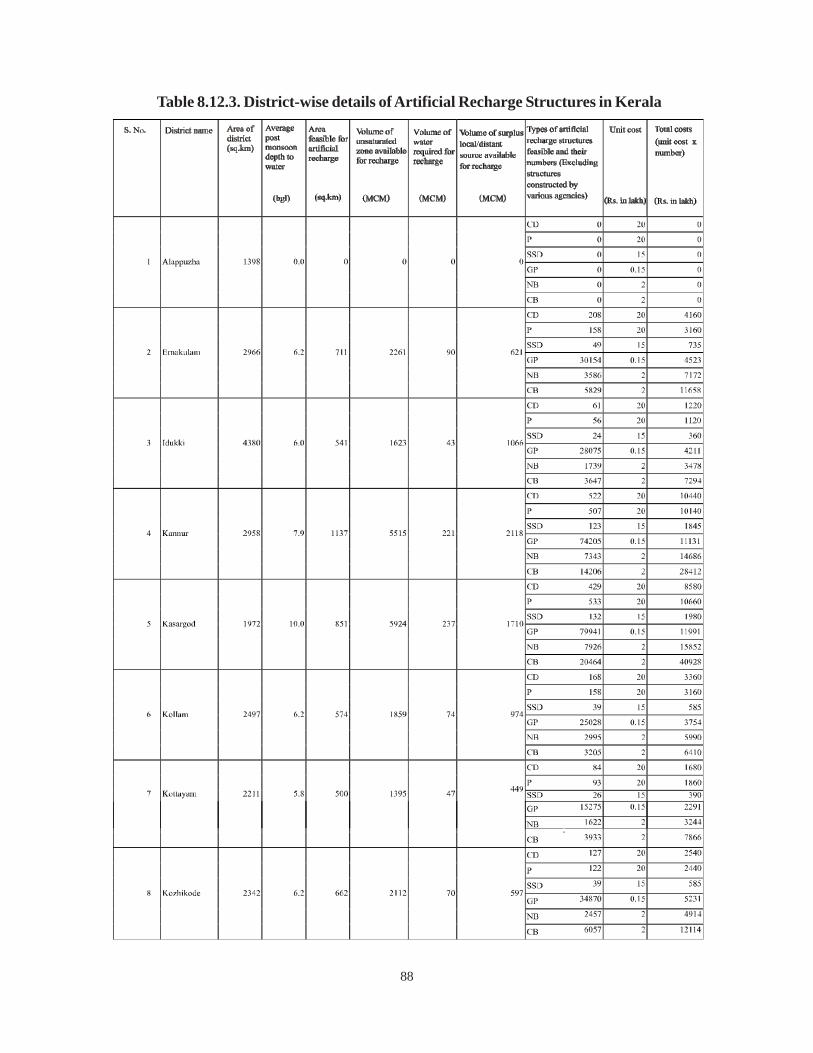
88
Table 8.12.3. District-wise details of Artificial Recharge Structures in Kerala
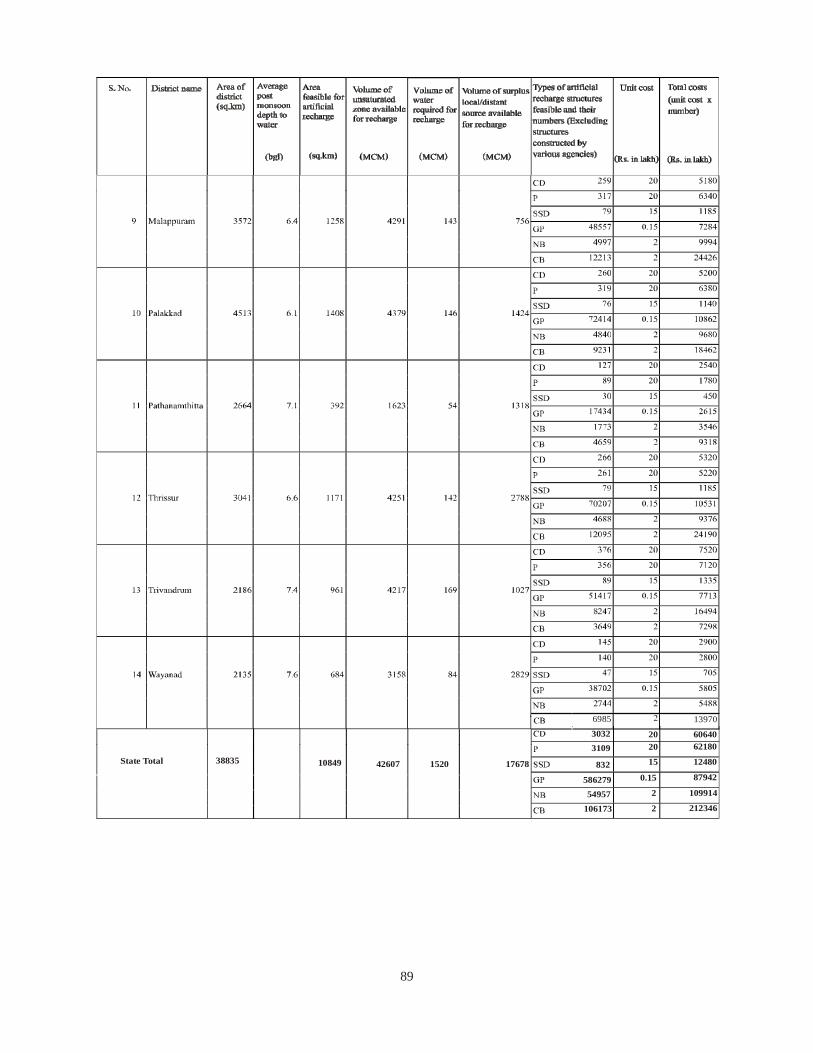
89
6985 13970
38835State Total 10849 42607 1520 17678 832
30323109
58627954957
106173
20 6064020 62180
15 12480
0.15 87942
2 109914
2 212346
90
8.13 MADHYA PRADESH
Madhya Pradesh is a land locked State located in the central part of India. It has a geographical area of3,08,144 Sq. km. There are 50 districts and 313 Community Development blocks in Madhya Pradesh.The population of state as per census 2011 is 7, 25, 97,565 with a population density of 236 persons persq.km area. Out of total population, 74.7% is rural. The important urban areas in the State are Bhopal,Indore, Jabalpur, Ujjain and Gwalior. Dhupgarh in Pachmarhi is the highest point in the state.
Madhya Pradesh is drained by five major river basins namely Ganga, Narmada, Godavari, Tapi and Mahi.These basins are divided into 11 sub basins and further sub divided into 155 major watersheds out ofwhich 6 watersheds in Son and Narmada sub-basin falls partly in adjoining Chhattisgarh State.
8.13.1 IDENTIFICATION OF FEASIBLE AREAS
Based on National Hydrograph Monitoring Wells data, two maps were prepared. A district wise basemap showing administrative boundary and post monsoon depth to water level (2010) zones varying from0-3, 3-6, 6-9 and more than 9 meters below ground level is prepared and given as Fig 4 and the otherdistrict wise base map showing administrative boundary and post monsoon depth to water level (2010)zones varying from 0-3, 3-6, 6-9 and more than 9 meters below ground level with post monsoon decliningtrend of >0.10 meters/year for 10 years from 2001 to 2010 were prepared to visualize and identify thefeasible areas. Areas showing depth to water level between 0 and 3 m bgl have not been considered forcomputing the potential zones available for recharge.
Based on the information mentioned above the area suitable for artificial recharge has been segregated intotwo categories as follows:
• Depth to water level < 3 m bgl and declining trend of 0.10 m /year.
• Depth to water level more than > 3 m bgl and declining trend of 0.10 m /year.
The areas of above two categories are demarcated on base map. The areas with water level more than 3mbgl and declining trend of more than 0.1 m/yr are identified for artificial recharge to ground water and areshown in fig. 8.13.1.
8.13.2 ESTIMATION OF AVAILABLE SUB SURFACE STORAGE POTENTIAL
The thickness of available unsaturated zone (below 3 m bgl) of above categories is estimated by consideringthe different ranges of water level. The total volume of unsaturated zone is calculated by considering theabove categories and unsaturated thickness of different range. This volume was then multiplied by averagespecific yield i.e. 1.5% for hard rock and 10% for alluvium on area specific basis to arrive at the netamount of water required which is to be recharged by artificial recharge to saturate the aquifer up to 3 mbgl.
8.13.3 SURFACE WATER REQUIREMENT
After assessing the volume of water required for saturating the unsaturated zone, the actual requirement ofsource water is to be estimated. Based on the experience gained in the field experiments, an averagerecharge efficiency of 75% of the individual structure is only possible. Therefore, to arrive at the totalvolume of actual source water required at the surface, the volume of water required for artificial rechargecalculated is multiplied by 1.33 (i.e. reciprocal of 0.75).
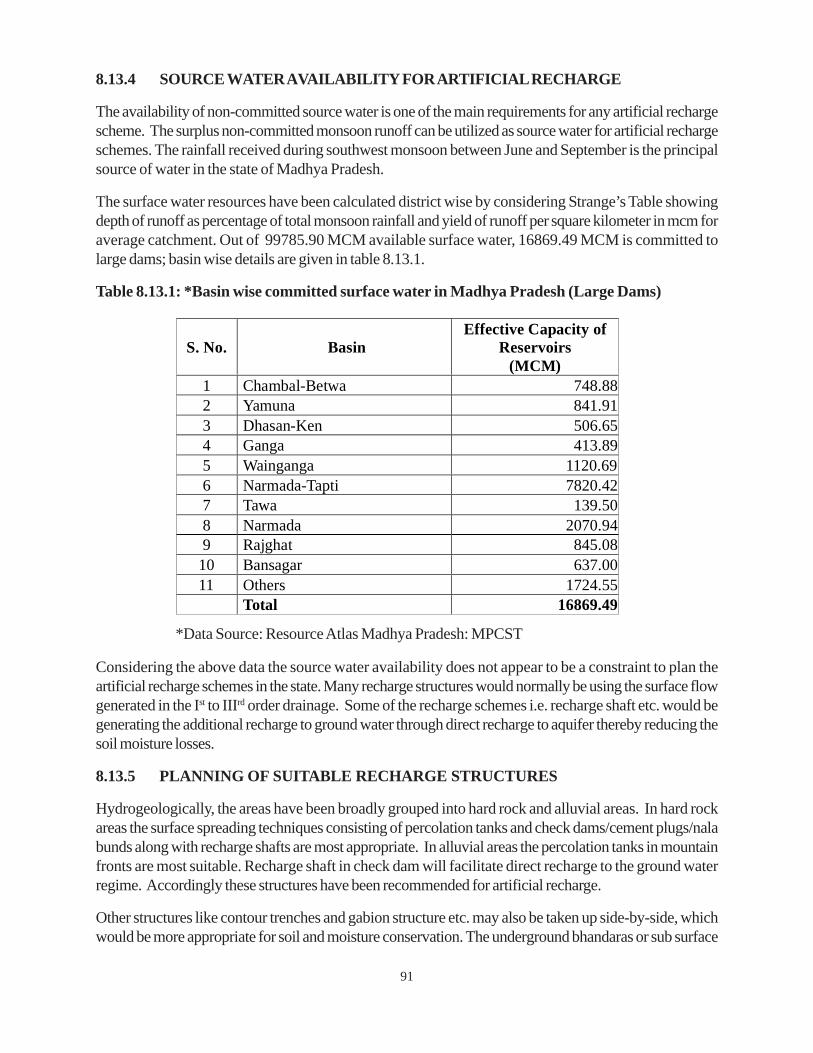
91
8.13.4 SOURCE WATER AVAILABILITY FOR ARTIFICIAL RECHARGE
The availability of non-committed source water is one of the main requirements for any artificial rechargescheme. The surplus non-committed monsoon runoff can be utilized as source water for artificial rechargeschemes. The rainfall received during southwest monsoon between June and September is the principalsource of water in the state of Madhya Pradesh.
The surface water resources have been calculated district wise by considering Strange’s Table showingdepth of runoff as percentage of total monsoon rainfall and yield of runoff per square kilometer in mcm foraverage catchment. Out of 99785.90 MCM available surface water, 16869.49 MCM is committed tolarge dams; basin wise details are given in table 8.13.1.
Table 8.13.1: *Basin wise committed surface water in Madhya Pradesh (Large Dams)
Considering the above data the source water availability does not appear to be a constraint to plan theartificial recharge schemes in the state. Many recharge structures would normally be using the surface flowgenerated in the Ist to IIIrd order drainage. Some of the recharge schemes i.e. recharge shaft etc. would begenerating the additional recharge to ground water through direct recharge to aquifer thereby reducing thesoil moisture losses.
8.13.5 PLANNING OF SUITABLE RECHARGE STRUCTURES
Hydrogeologically, the areas have been broadly grouped into hard rock and alluvial areas. In hard rockareas the surface spreading techniques consisting of percolation tanks and check dams/cement plugs/nalabunds along with recharge shafts are most appropriate. In alluvial areas the percolation tanks in mountainfronts are most suitable. Recharge shaft in check dam will facilitate direct recharge to the ground waterregime. Accordingly these structures have been recommended for artificial recharge.
Other structures like contour trenches and gabion structure etc. may also be taken up side-by-side, whichwould be more appropriate for soil and moisture conservation. The underground bhandaras or sub surface
*Data Source: Resource Atlas Madhya Pradesh: MPCST
S. No. Basin Effective Capacity of
Reservoirs (MCM)
1 Chambal-Betwa 748.88 2 Yamuna 841.91 3 Dhasan-Ken 506.65 4 Ganga 413.89 5 Wainganga 1120.69 6 Narmada-Tapti 7820.42 7 Tawa 139.50 8 Narmada 2070.94 9 Rajghat 845.08
10 Bansagar 637.00 11 Others 1724.55
Total 16869.49
92
dykes are ground water conservation structures and hence may be taken up at site specific location toconserve the ground water at technically suitable locations.
8.13.6 STORAGE CAPACITY OF RECHARGE STRUCTURES
The storage capacity of recharge structure was worked out based on the findings of various artificialrecharge studies under taken in Madhya Pradesh. Depending upon the rainfall pattern during the monsoonseason, 3 to 4 fillings of the structures are considered to arrive at the storage capacity of the structure.
1. A percolation tank of 0.1million cubic meter capacity (single filling) will actually store more than300% due to multiple fillings during monsoon. This will have gross storage capacity of 0.35 MCM.
2. A check dam with recharge shaft, of 0.01 MCM capacity (single filling) will actually store more than300% due to multiple filling in monsoon. This will provide gross storage of 0.030 MCM. Therecharge shaft will facilitate additional recharge to the ground water regime.
3. A cement plug will store more than 300% due to multiple filling in monsoon and it will provide grossstorage of 0.02 MCM.
4. A nala bund will store more than 300% due to multiple filling in monsoon. This will provide grossstorage of 0.01MCM in multiple fillings.
8.13.7 NUMBER OF RECHARGE STRUCTURES:
The number of recharge structures required to store and recharge the ground water reservoir has beenworked out as follows:
Total surface water consideredNo. of structures = ————————————————
Average gross capacity of P/CP/CD/NB(Considering multiple fillings)
The amount of surface water considered for planning the artificial recharge is 15280.15 MCM. Based onthe field situation it has been considered that 35% storage would be through percolation tank, 45% bycheck dams, 15% by nala bunds and remaining 5% by cement plug. Accordingly 35% of it i.e. 5348MCM will be stored in percolation tanks, 45% of it i.e., 6876.07 MCM to be stored in check dams, 15%of it i.e., 2292.02 mcm to be stored in nala bunds and remaining 5% i.e., 764.01 mcm to be stored inCement plugs. Therefore, 15284 percolation tanks, 125019 check dams, 38200 cement plugs and 229202nala bunds are proposed in the identified areas of Madhya Pradesh.
One recharge shaft in each check dam has been proposed for effective recharge through these structures.Therefore, 125019 recharge shafts are proposed. The percolation tanks should be constructed on secondand third order drainage, on favorable hydrogeological and physiographical locations. The nala bunds/cement plugs can be constructed on II nd or IIIrd order of drainage in hard rock areas.
8.13.8 COST ESTIMATES
Based on the experiences gained from central sector scheme, “Study of artificial recharge to GroundWater”, it is observed that the cost of recharge schemes depends upon the site-specific conditions. Theaverage cost of construction of a percolation tank is considered around Rs. 18 lakhs. The cost of masonry
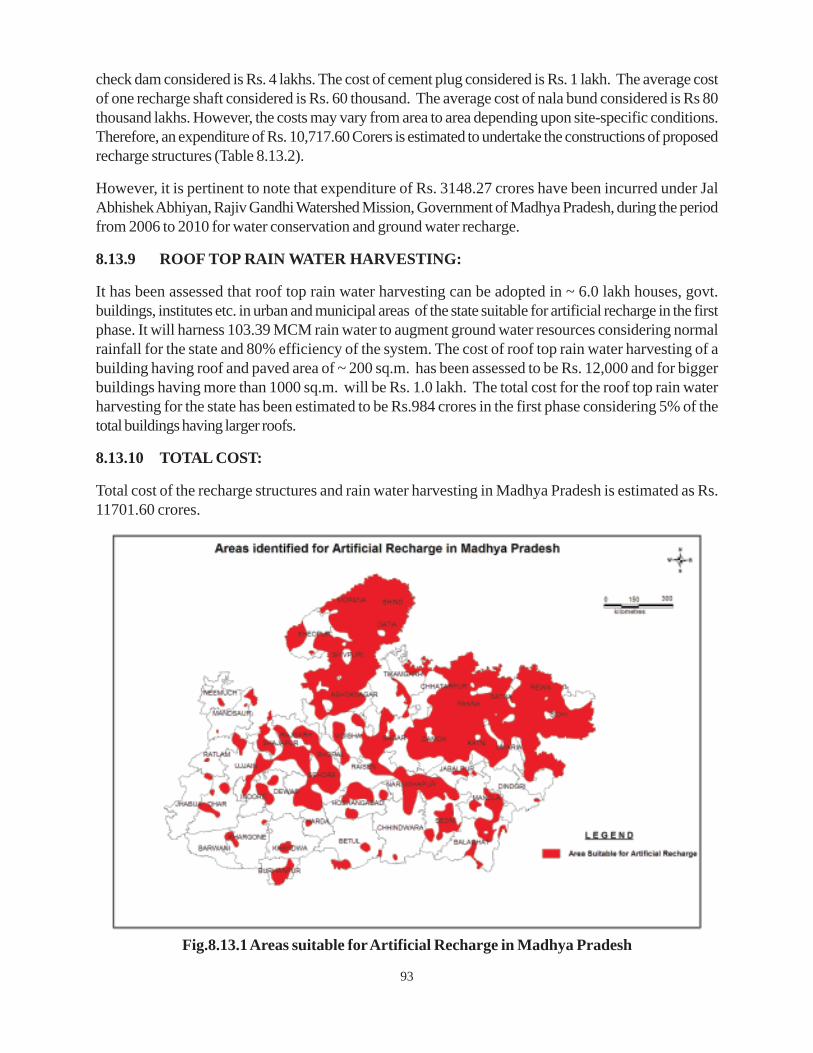
93
check dam considered is Rs. 4 lakhs. The cost of cement plug considered is Rs. 1 lakh. The average costof one recharge shaft considered is Rs. 60 thousand. The average cost of nala bund considered is Rs 80thousand lakhs. However, the costs may vary from area to area depending upon site-specific conditions.Therefore, an expenditure of Rs. 10,717.60 Corers is estimated to undertake the constructions of proposedrecharge structures (Table 8.13.2).
However, it is pertinent to note that expenditure of Rs. 3148.27 crores have been incurred under JalAbhishek Abhiyan, Rajiv Gandhi Watershed Mission, Government of Madhya Pradesh, during the periodfrom 2006 to 2010 for water conservation and ground water recharge.
8.13.9 ROOF TOP RAIN WATER HARVESTING:
It has been assessed that roof top rain water harvesting can be adopted in ~ 6.0 lakh houses, govt.buildings, institutes etc. in urban and municipal areas of the state suitable for artificial recharge in the firstphase. It will harness 103.39 MCM rain water to augment ground water resources considering normalrainfall for the state and 80% efficiency of the system. The cost of roof top rain water harvesting of abuilding having roof and paved area of ~ 200 sq.m. has been assessed to be Rs. 12,000 and for biggerbuildings having more than 1000 sq.m. will be Rs. 1.0 lakh. The total cost for the roof top rain waterharvesting for the state has been estimated to be Rs.984 crores in the first phase considering 5% of thetotal buildings having larger roofs.
8.13.10 TOTAL COST:
Total cost of the recharge structures and rain water harvesting in Madhya Pradesh is estimated as Rs.11701.60 crores.
Fig.8.13.1 Areas suitable for Artificial Recharge in Madhya Pradesh
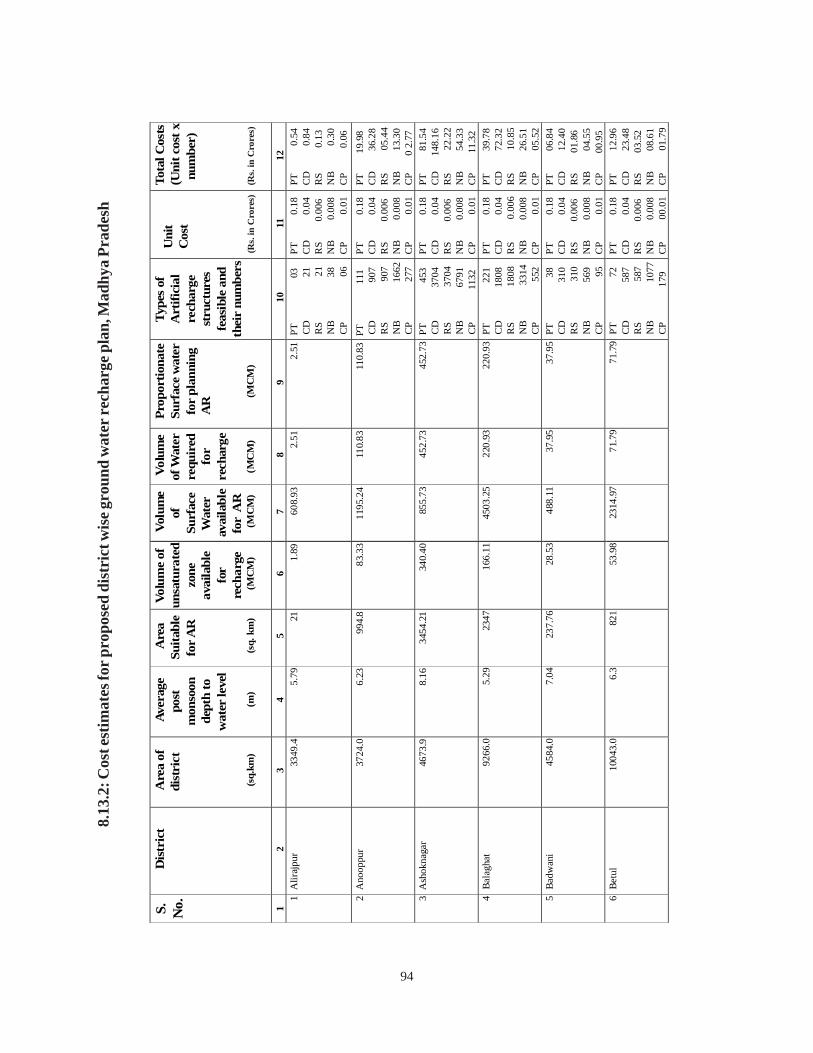
94
8.13
.2: C
ost e
stim
ates
for p
ropo
sed
dist
rict
wis
e gro
und
wat
er re
char
ge p
lan,
Mad
hya
Prad
esh
S. No.
Dis
tric
tA
rea
ofdi
stri
ct
(qs
.km
)
Aver
age
post
mon
soon
dept
hto
wat
erle
vel
(m)
Are
aSu
itabl
efo
rAR
(sq.
km)
Volu
me
ofun
satu
rate
dzo
neav
aila
ble
for
rech
arge
(MC
M)
Volu
me
ofSu
rfac
eW
ater
avai
labl
efo
rA
R(M
CM
)
Volu
me
ofW
ater
requ
ired
for
rech
arge
(MC
M)
Prop
ortio
nate
Surf
ace
wat
erfo
rpl
anni
ngA
R (MC
M)
Type
sof
Art
ifici
alre
char
gest
ruct
ures
feas
ible
and
thei
rnu
mbe
rs
Uni
tC
ost
Tota
lCos
ts(U
nitc
ostx
num
ber)
12
34
56
78
910
1112
1A
liraj
pur
3349
.45.
7921
1.89
608.
932.
512.
51PT
03C
D21
RS
21N
B38
CP
06
PT0.
18C
D0.
04R
S0.
006
NB
0.00
8C
P0.
01
PT0.
54C
D0.
84R
S0.
13N
B0.
30C
P0.
062
Ano
oppu
r37
24.0
6.23
994.
883
.33
1195
.24
110.
8311
0.83
PT11
1C
D90
7R
S90
7N
B16
62C
P27
7
PT0.
18C
D0.
04R
S0.
006
NB
0.00
8C
P0.
01
PT19
.98
CD
36.2
8R
S05
.44
NB
13.3
0C
P0
2.77
3A
shok
naga
r46
73.9
8.16
3454
.21
340.
4085
5.73
452.
7345
2.73
PT45
3C
D37
04R
S37
04N
B67
91C
P11
32
PT0.
18C
D0.
04R
S0.
006
NB
0.00
8C
P0.
01
PT81
.54
CD
148.
16R
S22
.22
NB
54.3
3C
P11
.32
4Ba
lagh
at92
66.0
5.29
2347
166.
1145
03.2
522
0.93
220.
93PT
221
CD
1808
RS
1808
NB
3314
CP
552
PT0.
18C
D0.
04R
S0.
006
NB
0.00
8C
P0.
01
PT39
.78
CD
72.3
2R
S10
.85
NB
26.5
1C
P05
.52
5Ba
dwan
i45
84.0
7.04
237.
7628
.53
488.
1137
.95
37.9
5PT
38C
D31
0R
S31
0N
B56
9C
P95
PT0.
18C
D0.
04R
S0.
006
NB
0.00
8C
P0.
01
PT06
.84
CD
12.4
0R
S01
.86
NB
04.5
5C
P00
.95
6Be
tul
1004
3.0
6.3
821
53.9
823
14.9
771
.79
71.7
9PT
72C
D58
7R
S58
7N
B10
77C
P17
9
PT0.
18C
D0.
04R
S0.
006
NB
0.00
8C
P00
.01
PT12
.96
CD
23.4
8R
S03
.52
NB
08.6
1C
P01
.79
(Rs.
in C
rore
s)(R
s. in
Cro
res)
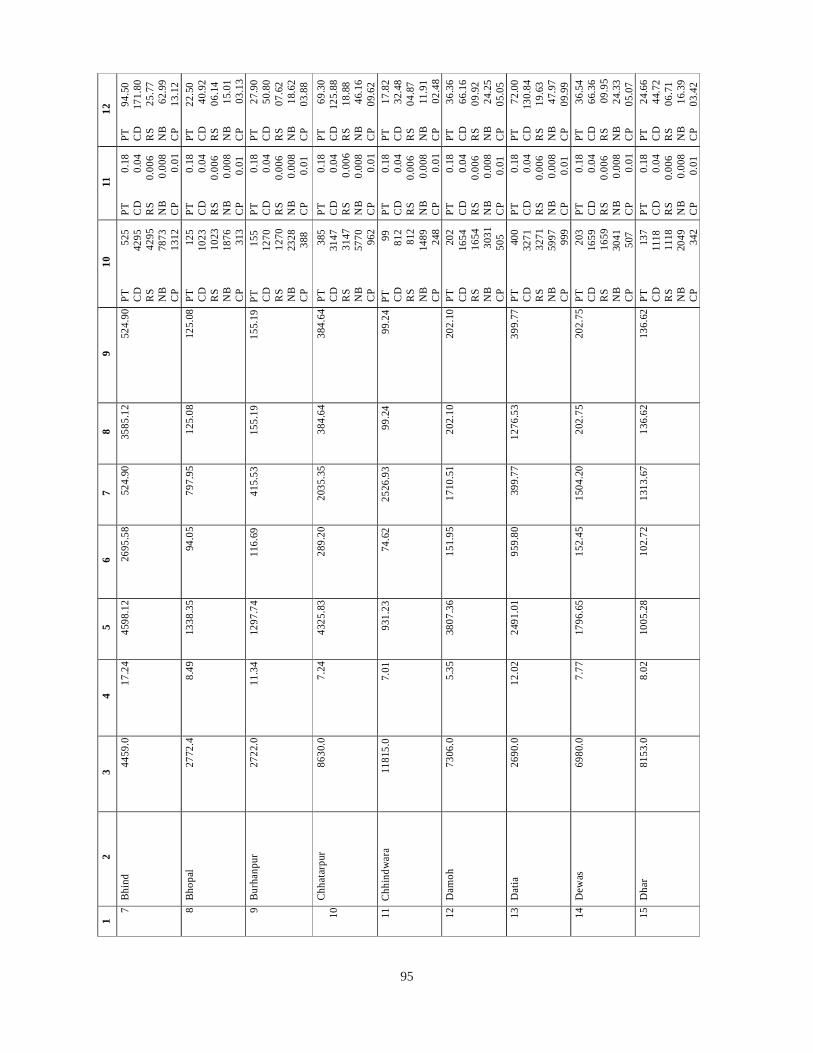
95
1 2
3 4
5 6
7 8
9 10
11
12
7 Bh
ind
4459
.0
17.2
445
98.1
226
95.5
852
4.90
3585
.12
524.
90PT
5
25
CD
429
5 R
S
4
295
NB
787
3 C
P
1
312
PT
0.1
8 C
D
0.0
4 R
S
0
.006
N
B
0
.008
C
P
0.0
1
PT
9
4.50
C
D
17
1.80
R
S
2
5.77
N
B
6
2.99
C
P
1
3.12
8
Bhop
al
2772
.4
8.49
1338
.35
94.0
579
7.95
125.
08
125.
08PT
1
25
CD
102
3 R
S
1
023
NB
187
6 C
P
313
PT
0.1
8 C
D
0.0
4 R
S
0
.006
N
B
0
.008
C
P
0.01
PT
2
2.50
C
D
4
0.92
R
S
0
6.14
N
B
1
5.01
C
P
0
3.13
9 Bu
rhan
pur
2722
.0
11.3
412
97.7
411
6.69
415.
5315
5.19
15
5.19
PT
155
C
D
1
270
RS
127
0 N
B
2
328
CP
388
PT
0.1
8 C
D
0.0
4 R
S
0
.006
N
B
0
.008
C
P
0.01
PT
27.9
0 C
D
5
0.80
R
S
0
7.62
N
B
1
8.62
C
P
0
3.88
10 Ch
hata
rpur
86
30.0
7.
2443
25.8
328
9.20
2035
.35
384.
64
384.
64PT
3
85
CD
314
7 R
S
3
147
NB
577
0 C
P
962
PT
0.1
8 C
D
0.0
4 R
S
0
.006
N
B
0
.008
C
P
0.0
1
PT
69.3
0 C
D
12
5.88
R
S
1
8.88
N
B
4
6.16
C
P
0
9.62
11
Chh
indw
ara
1181
5.0
7.01
931.
2374
.62
2526
.93
99.2
4 99
.24
PT
99
C
D
812
RS
81
2 N
B
1
489
CP
24
8
PT
0.1
8 C
D
0.0
4 R
S
0
.006
N
B
0
.008
C
P
0.0
1
PT
17.8
2 C
D
3
2.48
R
S
0
4.87
N
B
1
1.91
C
P
0
2.48
12 D
amoh
73
06.0
5.
3538
07.3
615
1.95
1710
.51
202.
10
202.
10PT
2
02
CD
165
4 R
S
1
654
NB
303
1 C
P
5
05
PT
0.1
8 C
D
0.0
4 R
S
0
.006
N
B
0
.008
C
P
0.01
PT
36.3
6 C
D
6
6.16
R
S
0
9.92
N
B
2
4.25
C
P
0
5.05
13
Dat
ia
2690
.0
12.0
224
91.0
195
9.80
399.
7712
76.5
3 39
9.77
PT
400
C
D
3
271
RS
327
1 N
B
5
997
CP
99
9
PT
0.1
8 C
D
0.0
4 R
S
0
.006
N
B
0
.008
C
P
0.01
PT
72.0
0 C
D
13
0.84
R
S
1
9.63
N
B
4
7.97
C
P
0
9.99
14
Dew
as
6980
.0
7.77
1796
.65
152.
4515
04.2
020
2.75
20
2.75
PT
203
C
D
1
659
RS
165
9 N
B
3
041
CP
507
PT
0.1
8 C
D
0.0
4 R
S
0
.006
N
B
0
.008
C
P
0.0
1
PT
36.5
4 C
D
6
6.36
R
S
0
9.95
N
B
2
4.33
C
P
0
5.07
15
Dha
r 81
53.0
8.
0210
05.2
810
2.72
1313
.67
136.
62
136.
62PT
1
37
CD
111
8 R
S
1
118
NB
204
9 C
P
342
PT
0.1
8 C
D
0.0
4 R
S
0
.006
N
B
0
.008
C
P
0.01
PT
24.6
6 C
D
4
4.72
R
S
0
6.71
N
B
1
6.39
C
P
0
3.42
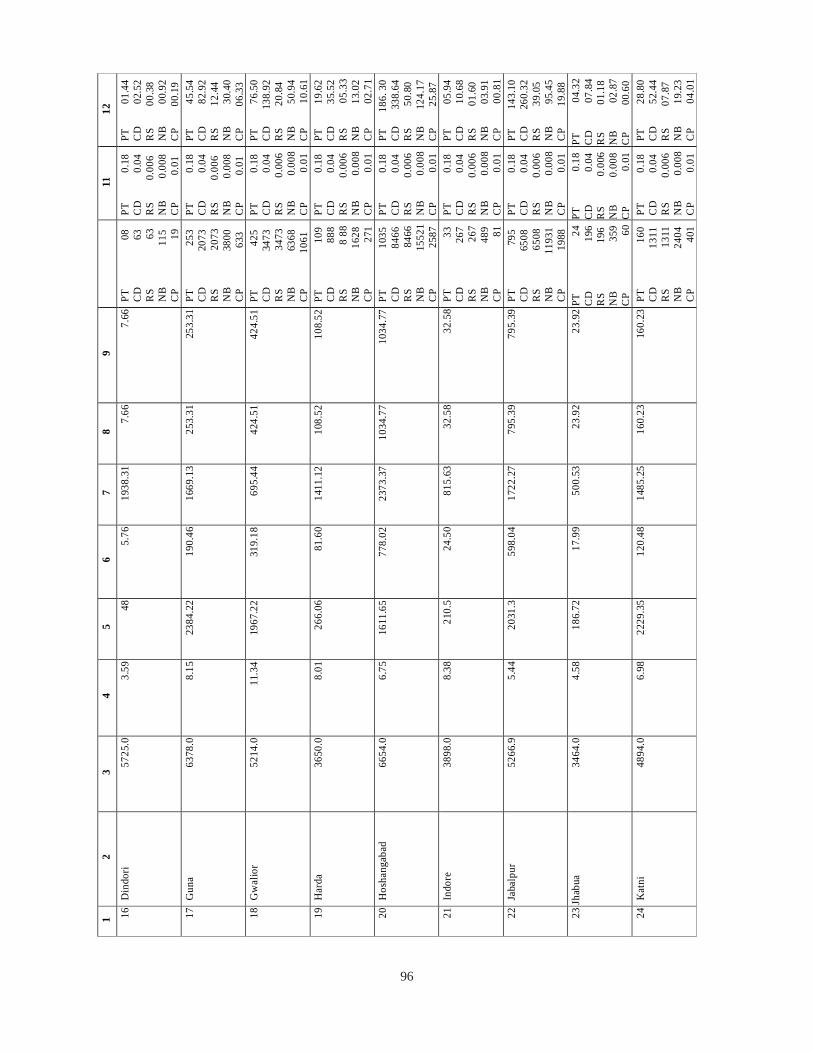
96
1 2
3 4
5 6
7 8
9 11
12
16 D
indo
ri 57
25.0
3.
5948
5.76
1938
.31
7.66
7.
66PT
08
CD
6
3 R
S
63
NB
11
5 C
P
19
PT
0.1
8 C
D
0.0
4 R
S
0
.006
N
B
0
.008
C
P
0.01
PT
01.4
4 C
D
0
2.52
R
S
0
0.38
N
B
0
0.92
C
P
0
0.19
17
Gun
a 63
78.0
8.
1523
84.2
219
0.46
1669
.13
253.
31
253.
31PT
2
53
CD
207
3 R
S
2
073
NB
380
0 C
P
6
33
PT
0.1
8 C
D
0.0
4 R
S
0
.006
N
B
0
.008
C
P
0.01
PT
45.5
4 C
D
8
2.92
R
S
1
2.44
N
B
3
0.40
C
P
0
6.33
18
Gw
alio
r 52
14.0
11
.34
1967
.22
319.
1869
5.44
424.
51
424.
51PT
4
25
CD
347
3 R
S
3
473
NB
636
8 C
P
10
61
PT
0.1
8 C
D
0.0
4 R
S
0
.006
N
B
0.00
8C
P
0.0
1
PT
76.5
0 C
D
13
8.92
R
S
2
0.84
N
B
5
0.94
C
P
1
0.61
19 H
arda
36
50.0
8.
0126
6.06
81.6
014
11.1
210
8.52
10
8.52
PT
109
C
D
888
R
S
8 88
N
B
1
628
CP
2
71
PT
0.1
8 C
D
0.0
4 R
S
0
.006
N
B
0.00
8C
P
0.0
1
PT
19.6
2 C
D
3
5.52
R
S
0
5.33
N
B
1
3.02
C
P
0
2.71
20 H
osha
ngab
ad
6654
.0
6.75
1611
.65
778.
0223
73.3
710
34.7
7 10
34.7
7PT
10
35
CD
846
6 R
S
8
466
NB
155
21C
P
2
587
PT
0.1
8 C
D
0.0
4 R
S
0
.006
N
B
0.00
8C
P
0.0
1
PT
18
6. 3
0 C
D
33
8.64
R
S
5
0.80
N
B
124
.17
CP
25.
87
21 I
ndor
e 38
98.0
8.
3821
0.5
24.5
081
5.63
32.5
8 32
.58
PT
3
3 C
D
267
R
S
267
N
B
489
C
P
81
PT
0.1
8 C
D
0.0
4 R
S
0
.006
N
B
0.00
8C
P
0.0
1
PT
05.9
4 C
D
1
0.68
R
S
0
1.60
N
B
0
3.91
C
P
0
0.81
22 J
abal
pur
5266
.9
5.44
2031
.359
8.04
1722
.27
795.
39
795.
39PT
7
95
CD
650
8 R
S
6
508
NB
1193
1 C
P
1
988
PT
0.1
8 C
D
0.0
4 R
S
0
.006
N
B
0.00
8C
P
0.0
1
PT
1
43.1
0 C
D
26
0.32
R
S
3
9.05
N
B
9
5.45
C
P
1
9.88
23
Jhab
ua
3464
.0
4.58
186.
7217
.99
500.
5323
.92
23.9
2PT
24
C
D
19
6 R
S
196
N
B
35
9 C
P
6
0
PT
0
.18
CD
0.04
R
S
0.0
06
NB
0.
008
CP
0.01
PT
04.
32C
D
07.
84R
S
01.1
8 N
B
02.
87
CP
00
.60
24 K
atni
48
94.0
6.
9822
29.3
512
0.48
1485
.25
160.
23
160.
23PT
1
60
CD
131
1 R
S
1
311
NB
240
4 C
P
401
PT
0.1
8 C
D
0.0
4 R
S
0
.006
N
B
0.00
8C
P
0.0
1
PT
28.8
0 C
D
5
2.44
R
S
0
7.87
N
B
1
9.23
C
P
0
4.01
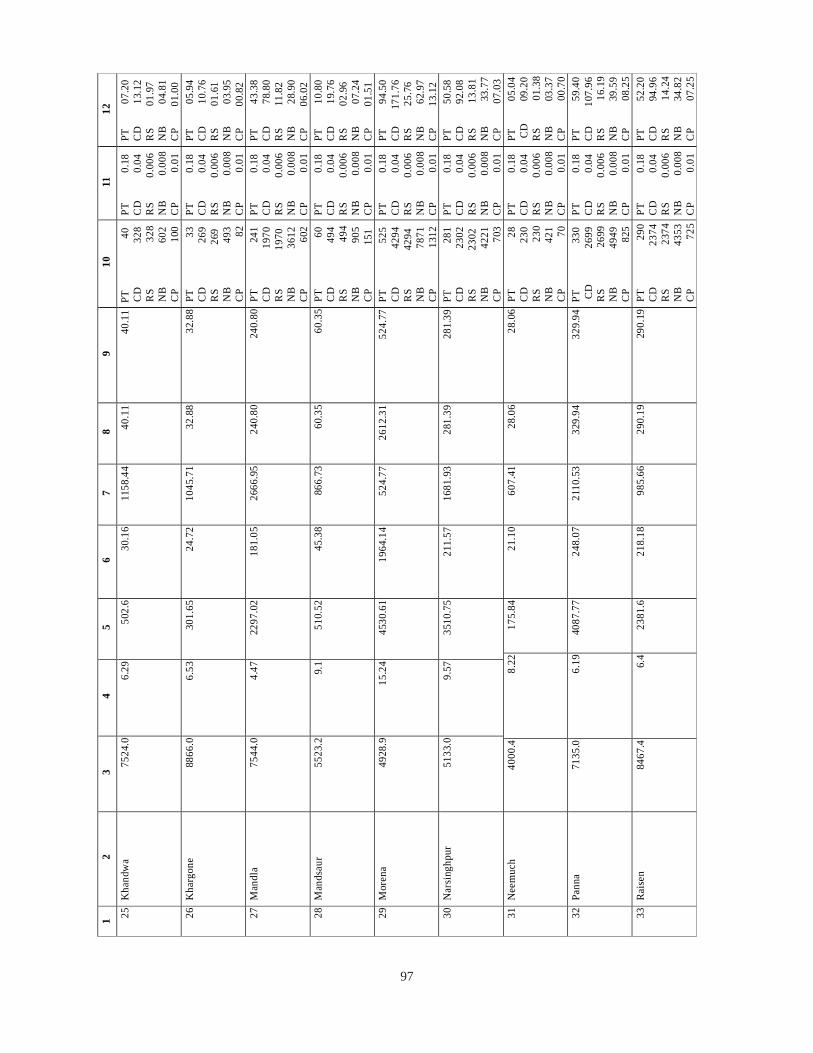
97
1 2
3 4
5 6
7 8
9 10
11
12
25 K
hand
wa
7524
.0
6.29
502.
630
.16
1158
.44
40.1
1 40
.11
PT
4
0 C
D
328
R
S
328
N
B
602
C
P
100
PT
0.1
8 C
D
0.0
4 R
S
0
.006
N
B
0.00
8C
P
0.0
1
PT
07.2
0 C
D
1
3.12
R
S
0
1.97
N
B
0
4.81
C
P
0
1.00
26
Kha
rgon
e 88
66.0
6.
5330
1.65
24.7
210
45.7
132
.88
32.8
8PT
33
CD
2
69
RS
26
9 N
B
493
C
P
82
PT
0.1
8 C
D
0.0
4 R
S
0
.006
N
B
0.00
8C
P
0.0
1
PT
05.9
4 C
D
1
0.76
R
S
0
1.61
N
B
0
3.95
C
P
0
0.82
27
Man
dla
7544
.0
4.47
2297
.02
181.
0526
66.9
524
0.80
24
0.80
PT
241
C
D
1
970
RS
197
0 N
B
3
612
CP
6
02
PT
0.1
8 C
D
0.0
4 R
S
0
.006
N
B
0.00
8C
P
0.0
1
PT
43.3
8 C
D
7
8.80
R
S
1
1.82
N
B
2
8.90
C
P
0
6.02
28
Man
dsau
r 55
23.2
9.
151
0.52
45.3
886
6.73
60.3
5 60
.35
PT
6
0 C
D
494
R
S
494
N
B
905
C
P
151
PT
0.1
8 C
D
0.0
4 R
S
0
.006
N
B
0.00
8C
P
0.0
1
PT
10.8
0 C
D
1
9.76
R
S
0
2.96
N
B
0
7.24
C
P
0
1.51
29
Mor
ena
4928
.9
15.2
445
30.6
119
64.1
452
4.77
2612
.31
524.
77PT
5
25
CD
429
4 R
S
4
294
NB
787
1 C
P
1
312
PT
0.1
8 C
D
0.0
4 R
S
0
.006
N
B
0.00
8C
P
0.0
1
PT
94.5
0 C
D
17
1.76
R
S
2
5.76
N
B
6
2.97
C
P
1
3.12
30
Nar
sing
hpur
51
33.0
9.
5735
10.7
521
1.57
1681
.93
281.
39
281.
39PT
2
81
CD
230
2 R
S
2
302
NB
422
1 C
P
703
PT
0.1
8 C
D
0.0
4 R
S
0
.006
N
B
0.00
8C
P
0.0
1
PT
50.5
8 C
D
9
2.08
R
S
1
3.81
N
B
33.7
7C
P
0
7.03
31 N
eem
uch
4000
.4
8.22
175.
8421
.10
607.
4128
.06
28.0
6PT
28
CD
2
30
RS
2
30
NB
4
21
CP
70
PT
0.1
8 C
D
0.0
4 R
S
0
.006
N
B
0.00
8C
P
0.0
1
PT
05.
04
CD
09.
20R
S
01.3
8N
B
03.3
7C
P
00.7
032
Pan
na
7135
.0
6.19
4087
.77
248.
0721
10.5
332
9.94
32
9.94
PT
330
C
D
2
699
RS
269
9 N
B
4
949
CP
8
25
PT
0.1
8 C
D
0.0
4 R
S
0
.006
N
B
0.00
8C
P
0.0
1
PT
59.
40
CD
107
.96
RS
16
.19
NB
39
.59
CP
08
.25
33 R
aise
n 84
67.4
6.
423
81.6
218.
1898
5.66
290.
19
290.
19PT
290
CD
23
74R
S
2374
NB
43
53C
P
725
PT
0.1
8 C
D
0.0
4 R
S
0
.006
N
B
0.00
8C
P
0.0
1
PT
52.
20C
D
94.9
6R
S
14.2
4N
B
34.8
2C
P
07.2
5
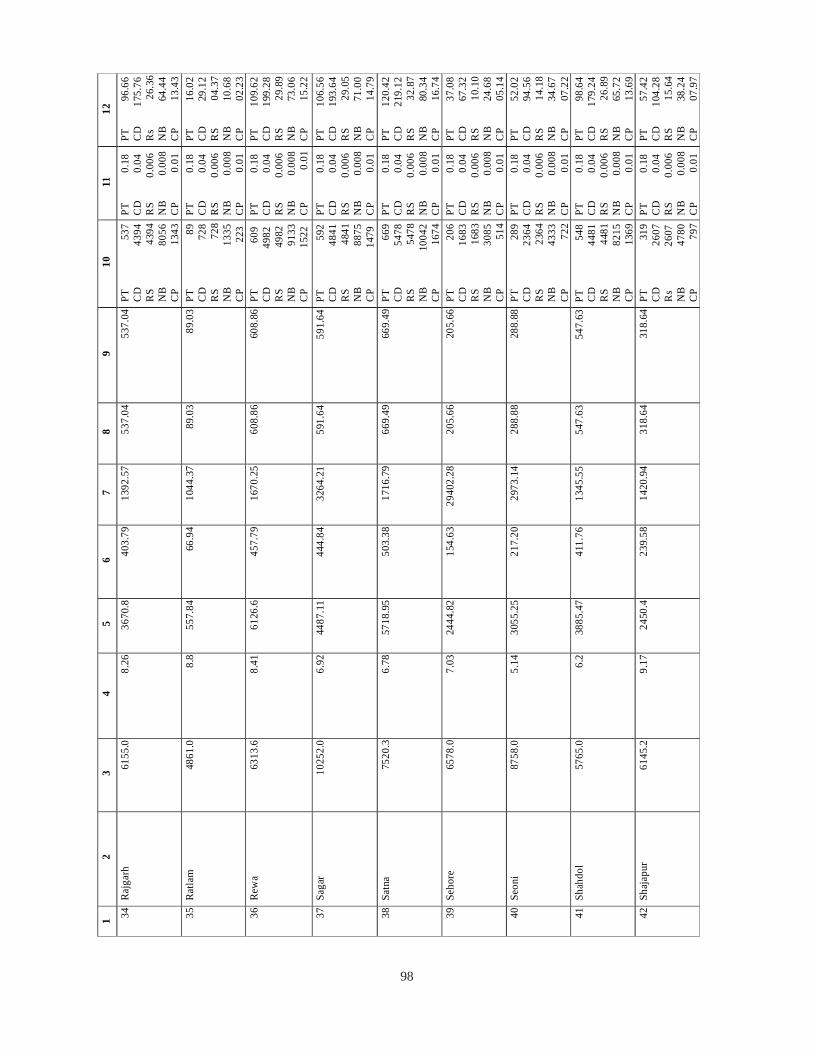
98
1 2
3 4
5 6
7 8
9 10
11
12
34 R
ajga
rh
6155
.0
8.26
3670
.840
3.79
1392
.57
537.
04
537.
04PT
537
CD
43
94R
S
4394
NB
80
56C
P
1343
PT
0.1
8 C
D
0.0
4 R
S
0
.006
N
B
0.00
8C
P
0.0
1
PT
96.
66C
D
1
75.7
6R
s
26.3
6N
B
64.4
4C
P
13.4
335
Rat
lam
48
61.0
8.
855
7.84
66.9
410
44.3
789
.03
89.0
3PT
89
CD
7
28R
S
728
NB
13
35C
P
223
PT
0.1
8 C
D
0.0
4 R
S
0
.006
N
B
0.00
8C
P
0.0
1
PT
16.
02C
D
29.1
2R
S
04.3
7N
B
10.6
8C
P
02.2
336
Rew
a 63
13.6
8.
4161
26.6
457.
7916
70.2
560
8.86
60
8.86
PT
609
C
D
4
982
RS
498
2 N
B
9133
CP
152
2
PT
0.1
8 C
D
0.0
4 R
S
0
.006
N
B
0.00
8C
P
0.0
1
PT
1
09.6
2C
D
1
99.2
8R
S
29.8
9N
B
73.0
6C
P
15.2
237
Sag
ar
1025
2.0
6.92
4487
.11
444.
8432
64.2
159
1.64
59
1.64
PT
59
2C
D
4841
RS
48
41N
B
8875
CP
147
9
PT
0.1
8 C
D
0.0
4 R
S
0
.006
N
B
0.00
8C
P
0.0
1
PT
1
06.5
6C
D
1
93.6
4R
S
29.0
5N
B
71.0
0C
P
14.7
938
Sat
na
7520
.3
6.78
5718
.95
503.
3817
16.7
966
9.49
66
9.49
PT
66
9C
D
5478
RS
54
78N
B
1
0042
CP
16
74
PT
0.1
8 C
D
0.0
4 R
S
0
.006
N
B
0.00
8C
P
0.0
1
PT
1
20.4
2C
D
2
19.1
2R
S
32.8
7N
B
80.3
4C
P
16.7
439
Seh
ore
6578
.0
7.03
2444
.82
154.
6329
402.
2820
5.66
20
5.66
PT
20
6C
D
1683
RS
16
83N
B
3085
CP
5
14
PT
0.1
8 C
D
0.0
4 R
S
0
.006
N
B
0.00
8C
P
0.0
1
PT
37.
08C
D
67.3
2R
S
10.1
0N
B
24.6
8C
P
05.1
440
Seo
ni
8758
.0
5.14
3055
.25
217.
2029
73.1
428
8.88
28
8.88
PT
28
9C
D
2364
RS
23
64N
B
4333
CP
7
22
PT
0.1
8 C
D
0.0
4 R
S
0
.006
N
B
0.00
8C
P
0.0
1
PT
52.
02C
D
94.5
6R
S
14.1
8N
B
34.6
7C
P
07.2
241
Sha
hdol
57
65.0
6.
238
85.4
741
1.76
1345
.55
547.
63
547.
63PT
548
CD
44
81R
S
4481
NB
82
15C
P
1369
PT
0.1
8 C
D
0.0
4 R
S
0
.006
N
B
0.00
8C
P
0.0
1
PT
98.
64C
D
1
79.2
4R
S
26.8
9N
B
65.7
2C
P
13.6
942
Sha
japu
r 61
45.2
9.
1724
50.4
239.
5814
20.9
431
8.64
31
8.64
PT
31
9C
D
2607
Rs
260
7N
B
4780
CP
7
97
PT
0.1
8 C
D
0.0
4 R
S
0
.006
N
B
0.00
8C
P
0.0
1
PT
57.
42C
D
1
04.2
8R
S
15.6
4N
B
38.2
4C
P
07.9
7
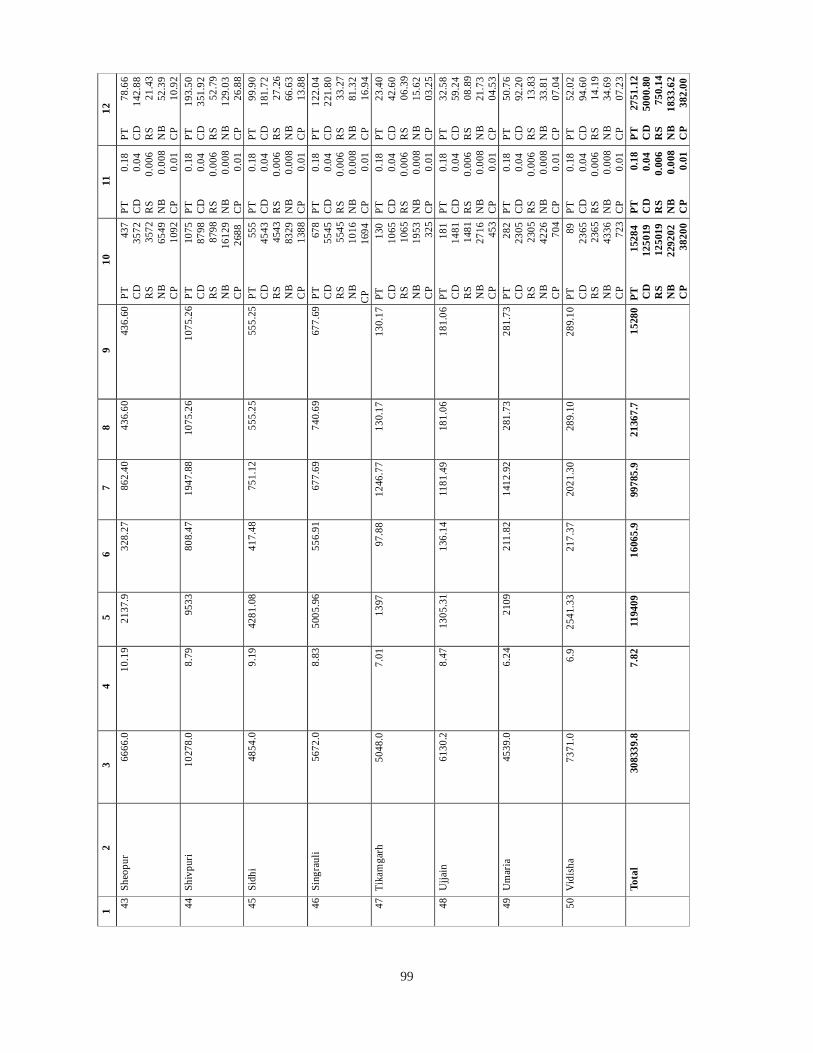
99
1 2
3 4
5 6
7 8
9 10
11
12
43 S
heop
ur
6666
.0
10.1
921
37.9
328.
2786
2.40
436.
60
436.
60PT
437
CD
35
72R
S
3572
NB
65
49C
P
1092
PT
0.1
8 C
D
0.0
4 R
S
0
.006
N
B
0.00
8C
P
0.0
1
PT
78.
66C
D
1
42.8
8R
S
21.4
3N
B
52.3
9C
P
10.9
244
Shi
vpur
i 10
278.
0 8.
7995
3380
8.47
1947
.88
1075
.26
1075
.26
PT
107
5C
D
8798
RS
87
98N
B
1
6129
CP
268
8
PT
0.1
8 C
D
0.0
4 R
S
0
.006
N
B
0.00
8C
P
0.0
1
PT
1
93.5
0C
D
3
51.9
2R
S
52.7
9N
B
12
9.03
CP
26
.88
45 S
idhi
48
54.0
9.
1942
81.0
841
7.48
751.
1255
5.25
55
5.25
PT
55
5C
D
4543
RS
45
43N
B
8329
CP
13
88
PT
0.1
8 C
D
0.0
4 R
S
0
.006
N
B
0.00
8C
P
0.0
1
PT
99.
90C
D
1
81.7
2R
S
27.2
6N
B
66.6
3C
P
13.8
846
Sin
grau
li 56
72.0
8.
8350
05.9
655
6.91
677.
6974
0.69
67
7.69
PT
67
8C
D
5545
RS
55
45N
B
1016
C
P
169
4
PT
0.1
8 C
D
0.0
4 R
S
0
.006
N
B
0.00
8C
P
0.0
1
PT
1
22.0
4C
D
2
21.8
0R
S
33.2
7N
B
81.3
2C
P
16.9
447
Tik
amga
rh
5048
.0
7.01
1397
97.8
812
46.7
713
0.17
13
0.17
PT
13
0C
D
1065
RS
10
65N
B
1953
CP
3
25
PT
0.1
8 C
D
0.0
4 R
S
0
.006
N
B
0.00
8C
P
0.0
1
PT
23.
40C
D
42.6
0R
S
06.3
9N
B
15.6
2C
P
03.2
548
Ujja
in
6130
.2
8.47
1305
.31
136.
1411
81.4
918
1.06
18
1.06
PT
18
1C
D
1481
RS
14
81N
B
2716
CP
4
53
PT
0.1
8 C
D
0.0
4 R
S
0
.006
N
B
0.00
8C
P
0.0
1
PT
32.
58C
D
59.2
4R
S
08.8
9N
B
21.7
3C
P
04.5
349
Um
aria
45
39.0
6.
2421
0921
1.82
1412
.92
281.
73
281.
73PT
282
CD
23
05R
S
2305
NB
42
26C
P
704
PT
0.1
8 C
D
0.0
4 R
S
0
.006
N
B
0.00
8C
P
0.0
1
PT
50.
76C
D
92.2
0R
S
13.8
3N
B
33.8
1C
P
07.0
450
Vid
isha
73
71.0
6.
925
41.3
321
7.37
2021
.30
289.
10
289.
10PT
89
CD
23
65R
S
2365
NB
43
36C
P
723
PT
0.1
8 C
D
0.0
4 R
S
0
.006
N
B
0.00
8C
P
0.0
1
PT
52.
02C
D
94.6
0R
S
14.1
9N
B
34.6
9C
P
07.2
3To
tal
3083
39.8
7.
8211
9409
1606
5.9
9978
5.9
2136
7.7
1528
0PT
152
84C
D
125
019
RS
1
2501
9N
B
229
202
CP
3820
0
PT
0.1
8C
D
0.0
4 R
S
0
.006
NB
0.
008
CP
0
.01
PT
27
51.1
2C
D
500
0.80
RS
750
.14
NB
1
833.
62C
P
38
2.00
100
8.14 MAHARASHTRA
Maharashtra State covers an area of 3,07,713 sq.km.and comprises of 35 districts and 357 taluks. Thereare 322394 inhabited villages. The population of state is 112.3 million as per 2011 census. The Stateexperiences south west monsoon with rainfall ranging from 6000 mm in Western Ghats to less than 500mm in Madhya Maharashtra. The eastern part of Maharashtra, known as Vidharba Region, receivesrainfall up to 1500 mm. Geographical area of Maharashtra falls in four major basins namely Godavari(49%), Krishna (22.6%), Tapi-Purna (16.7%) and west flowing small rivers known as Coastal river basin.
8.14.1 IDENTIFICATION OF AREA
Identification and prioritization of need based areas for artificial recharge to ground water is based on longterm (decadal) monsoon (August) depth to water level. The areas with depth to water level between 5 and7 m bgl and areas with water level more than 7 m bgl were identified as feasible areas for artificial recharge.Estimation of sub surface storage space available for artificial recharge below 5 m bgl was done by consideringthe different ranges of water level as above.
Quantification of surface water requirement and surplus annual run off availability as source water forartificial recharge in each district based on proportionate basin area was calculated. Basin wise availablesurface run off has been considered for working out the number of feasible structures for artificial rechargeto have maximum benefit 70% of the available surface water is allocated for construction of percolationtanks and remaining 30% for construction of check dams/cement nala bunds in hard rock areas andrecharge shafts in soft rock areas. The estimated storage space and available source water for rechargewere considered for working out type of suitable recharge structures, their numbers, storage capacity andefficiency.
The capacity of recharge structures is worked out based on the findings of various artificial rechargestudies undertaken in different districts and the same was used for planning the recharge structures. Thestorage capacity for different structures considering multiple fillings is worked out as 200 TCM (100 TCMfor single filling) for percolation tanks, 30 TCM (10 TCM for single filling) for check dams and 60 TCM (1TCM/day*60 days) for recharge shafts.
An area of 13,00,11 sq.km. had been identified for artificial recharge in 35 districts of Maharashtra State.The district wise area identified for artificial recharge measures is given in Table-8.14.1 and Fig.8.14.1 to8.14.5.
The plan for artificial recharge has been prepared considering the hydrogeological parameters andhydrological data base.
8.14.2 SUB-SURFACE STORAGE AND WATER REQUIREMENT
The thickness of available unsaturated zone (below 5 m bgl) is estimated by considering the differentranges of water level i.e., 5 to 7 m bgl and more than 7 m bgl. The different range of depth to water levelis averaged to arrive at thickness of unsaturated zone effectively. The total volume of unsaturated strata iscalculated as 2,60,022 MCM. This volume was then multiplied by average specific yield i.e. 2% (0.020)in hard rock areas and 7.0% (0.07) in soft rock areas to arrive at 6,355 MCM of water required forartificial recharge. However, based on the experiences gained in the field experiments, an average rechargeefficiency of 75% of the individual structure is only possible. Therefore, to arrive at the total volume ofactual source water required at the surface, the volume of water required for artificial recharge has been
101
multiplied by 1.33 (i.e. reciprocal of 0.75). About 8474 MCM is required as source water to bring waterlevel up to 5 mbgl.
8.14.3 SOURCE WATER AVAILABILITY
The surface water resources available in various basins & sub basins were based on information providedby the state government. The data available for each sub basin included committed runoff, reserved forfuture planning and surplus water available. Considering the water as single entity for surface and groundwater resource planning the availability of source water is worked out by adding the amount of surfacewater provided for future planning and surplus available. This availability so worked out is for the entire subbasin and not for the requirement of the areas identified for artificial recharge. Hence, to account for therequirement of identified area, district wise apportioning of surface water availability was done. Forplanning the artificial recharge structures in each district of Maharashtra, the amount of proportionatesurplus runoff/surface water availability in the targeted area and storage volume was matched to arrive atthe feasibility of the scheme.
A total of 12308 MCM run off/surface water is available in the State and can be utilized for artificialrecharge, however after proportioning it for the target area of 1,30,011 sq. km, the surface water availabilitycomes out to be 3,167 MCM. Invariably the proportionate surface water availability is less (3,167 MCM)and the storage volume or requirement of surface water for artificial recharge is more (8,473 MCM).However, in coastal districts of Maharashtra the availability of source water is more and the requirementfor artificial recharge is less due to shallow ground water level conditions. Thus the proportionate surfacewater availability for artificial recharge is 2846 MCM for the state.
8.14.4 RECHARGE STRUCTURES AND COST ESTIMATES
Hydrogeologically, the areas have been broadly grouped into hard rock and alluvial areas. In hard rockareas i.e. Godavari, Krishna, Coastal basins and part of Tapi-Purna, the surface spreading techniquesconsisting of percolation tanks and cement plugs/bunds are most appropriate. In alluvial areas i.e. part ofTapi and Purna basins, the percolation tanks in mountain fronts and recharge shaft in alluvial/bazada zoneare the most feasible structures. Accordingly these structures have been recommended for artificial recharge.
Other structures like contour trenches, gabion structure, nala bunds, village ponds etc. may also be takenup side by side which would be more appropriate for soil and moisture conservation. The undergroundbandharas or sub surface dykes are ground water conservation structures and hence can be taken up atsite specific location to conserve the ground water.
The amount of surface water considered for planning the artificial recharge is 2846 MCM. Based on thefield situation it has been considered that 70% storage would be through percolation tanks and remainingby check dams (hard rock areas) or recharge shafts (alluvial areas). Accordingly 1,992 MCM (70%) willbe stored in percolation tanks, 808 MCM will be stored in cement plugs/check dams and 46 MCMthrough recharge shafts. Therefore, 9961 percolation tanks, 26924 check dams/cement plugs and 772recharge shafts are proposed in the identified areas of Maharashtra.
The cost estimate for artificial recharge structures viz. percolation tank, cement plug and recharge shaft areworked out based on the experiences gained from artificial recharge studies under central sector scheme,it is observed that the cost of recharge schemes depends upon the specific situation. At present the averagecost of construction of a percolation tank (100 TCM single filling storage capacity) is around Rs. 60 lakhs.The cost of cement plugs or masonry check dam of 10 TCM single filling capacity is Rs. 6.0 lakh. These

102
costs were estimated as per the Irrigation Dept. Schedule of Rates (SOR). The average cost of onerecharge shaft is Rs. 2.5 lakhs. Therefore, an expenditure of Rs. 7611.34 crores is estimated to undertakethe construction of proposed recharge structures. The district wise plan of artificial recharge is given inTable 8.14.1.
8.14.5 AREA BENEFITED
The impact of artificial recharge to ground water shall be created mainly at the downstream side of rechargestructures. It is estimated that the maximum influence of recharge schemes proposed in Master Plan wouldbe distinctly observed in around 51,305 Sq.Km. area at the monsoon period. A rise of 1 to 3 m in waterlevel shall be observed depending upon the quantity of recharge and variation in specific yield provided thepresent rate of ground water development remains the same. This will also result in saving of energy as theaverage suction lift of pump sets would be reduced by 1 to 3 m.
Though the impact of artificial recharge will be witnessed in around 51305 sq km., the entire area will notbe brought under assured irrigation. Therefore the calculation of additional area to be brought underassured irrigation from the proposed recharge schemes has been done. Considering the prevailing croppingpattern the Delta factor of 0.5 m/year is adopted for further calculation.
It is estimated that a total of about 5691 sq. km. additional land can be brought under assured irrigationduring rabi & kharif seasons. The scheme wise additional irrigation from percolation tanks, cement plugsand recharge shafts would be 3983.70 sq. km. 1615.55 sq. km. and 91.75 sq. km. respectively. This willalso provide sustainability to the ground water round the year and remove the dependability on tankerwater supply in proposed areas.
8.14.6 ROOF TOP RAIN WATER AND RUNOFF HARVESTING IN URBAN AREAS
Considering the overall demographic, climatic, hydrogeological, physiographic and socio-economic set upand quality of the source water available in the urban areas, following recharge techniques are proposed:
• Roof Top Rainwater Harvesting (RTRWH),
• Runoff Harvesting
8.14.6.1 Roof Top Rainwater Harvesting
It has been assessed that roof top rain water harvesting can be adopted in ~ 16 lakh houses, govt. buildings,institutes etc. in urban and municipal areas of the state suitable for artificial recharge in the first phase. It willharness 257.43 MCM rain water to augment ground water resources considering normal rainfall for thestate and 80% efficiency of the system. The cost of roof top rain water harvesting of a building having roofand paved area of ~ 200 sq.m. has been assessed to be Rs. 12,000 and for bigger buildings having morethan 1000 sq.m. will be Rs. 1.0 lakh. The total cost for the roof top rain water harvesting for the state hasbeen estimated to be Rs.2624 crores in the first phase considering 5% of the total buildings having largerroofs.
8.14.6.2 Runoff Water Harvesting
The rainfall runoff flowing from the roads and open grounds is substantial during rains. This water oftencreates the water logging and the drainage system is put under stress in the urban agglomerates. A schemesuitable for artificial recharge in urban area is prepared by C.G.W.B and is successfully implemented and
103
operated at Nagpur Municipal Corporation. In this scheme about 15000 sq.m of residential catchmentwas intercepted and runoff generated was diverted into the specially constructed recharge well in thepublic garden. The runoff water was filtered silt free by providing a filter pit. Number of such locations canbe identified within city areas where such structure may be constructed to provide a sustainable groundwater based water supply in the city.
It is estimated that in 378 urban areas of Maharashtra around 5,670 structures (recharge shafts) would beneeded with an average of 15 schemes per town/city. The cost of each scheme will be around Rs. 2.5 lakh.Therefore an expenditure of Rs. 142 crores is estimated for taking up the scheme. It is estimated that morethan 15 lakh additional urban population would get adequate water supply round the year by implementingthe scheme in the urban areas.
8.14.7 RECHARGE IN HILLY AREAS
Maharashtra State covers an area of 3,07,713 sq.km., and about 15% of the state area is hilly. Thus,about 46,157 sq. km. can be categorized as hilly area. The Continuous Contour Trenches (CCT), looseboulder structures (gully plugs) are the most suitable structures for hilly area as these structures haveproved their effectiveness in the schemes implemented by state govt. on pilot basis. Such structures willfunction initially as soil conservation structure and subsequently improve the soil moisture retention andalso enhance the recharge to ground water, which in turn will support development of fauna and flora in thearea. These structures will also improve sustainability of springs thereby improving water supply scenarioin the small hamlets situated in hilly areas. The areas identified for recharge in hilly areas are shown inFig.8.14.1. The estimated cost for 1500 structures @ Rs 1.0 lakh is Rs.15 crores.
8.14.8 RECHARGE IN COASTAL AREAS
Maharashtra State has a coast line of about 700 kms. along the west coast adjoining Arabian Sea. In thecoastal areas, the salinity affected area is restricted to coastal alluvial aquifer comprising of silt, sand, graveland clay and occupy vary limited area in parts of Thane and Raigarh districts of the states, whereas in hardrock aquifers such problem is not observed along the coast line of the state. In the coastal areas nalabunds, cement plugs and earthen bandharas are the most suitable structures for artificial recharge. Theareas identified for recharge in coastal areas are shown in Fig-8.14.2.The estimated cost for 8000 sturctures@ Rs 2.5 lakh is Rs.200 crores.
8.14.9 RECHARGE IN AREAS HAVING INLAND SALINITY
The Purna alluvial basin possesses unique features of inland salinity, spared over an area of 7500 km2 inparts of Amravati, Akola and Buldhana districts of the state. About 2700 km2 area of the basin is badly isaffected by ground water salinity at both shallow and deeper depth. In the saline tract of the basin, fewriver terraces and buried channels (old river courses) are found, and one of it, is very well seen as oldShahnur River channel. These buried channels and river terraces are mainly consisting of sand, gravel &pebbles and holds fresh water in saline tract of basin. A series of nala bunds, cement plugs and earthenbandharas in these buried channels and dug well recharge in river terraces will help in building fresh waterrepositories in the area affected by inland salinity. Similarly the construction of nala bunds and percolationtanks in surrounding area of saline tract would also help in straightening the pipe water based water supplysituation in area. The areas identified for recharge in inland salinity affected areas are shown in fig.8.14.3.The estimated cost for 4000 structures @ Rs 2.5 lakh is Rs.100 crores.

104
8.14.10 RECHARGE IN OVER-EXPLOITED AREAS BY RECHARGE CANALS
In Jalgaon district, Yaval and Raver are the 2 over-exploited talukas. In these talukas the recharge throughcanals from surplus surface water source can be taken up. The most feasible recharge structures in thisarea are recharge shafts and injection wells. The areas identified for recharge in over-exploited areas areshown in fig.8.14.4.
8.14.11 TOTAL COST
The total cost of the recharge structures proposed in rural and urban areas of the Maharashtra in the Planis Rs. 10377.09 Crores. The additional expenditure for hilly areas, inland salinity and coastal areas isestimated to be Rs.315 crores. Thus the total expenditure comes to Rs.10692.09 crores.
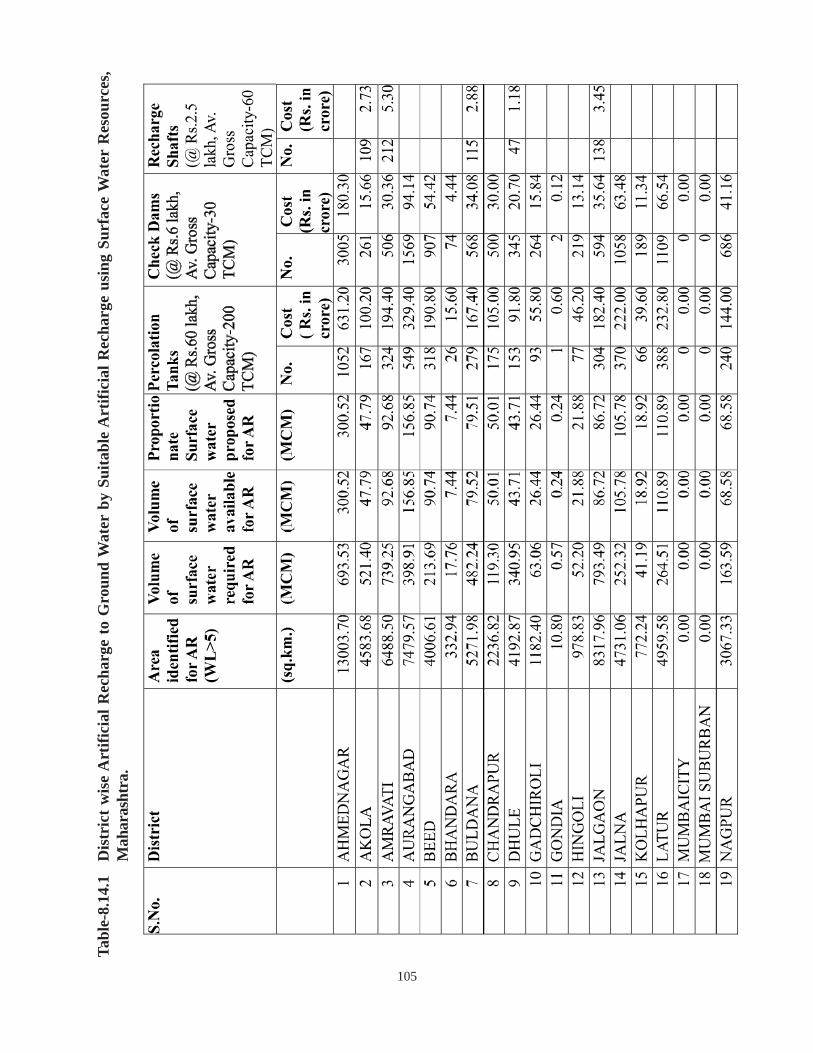
105
Tabl
e-8.
14.1
Dis
tric
t wis
e A
rtifi
cial
Rec
harg
e to
Gro
und
Wat
er b
y Su
itabl
e A
rtifi
cial
Rec
harg
e us
ing
Surf
ace
Wat
er R
esou
rces
,M
ahar
asht
ra.
-
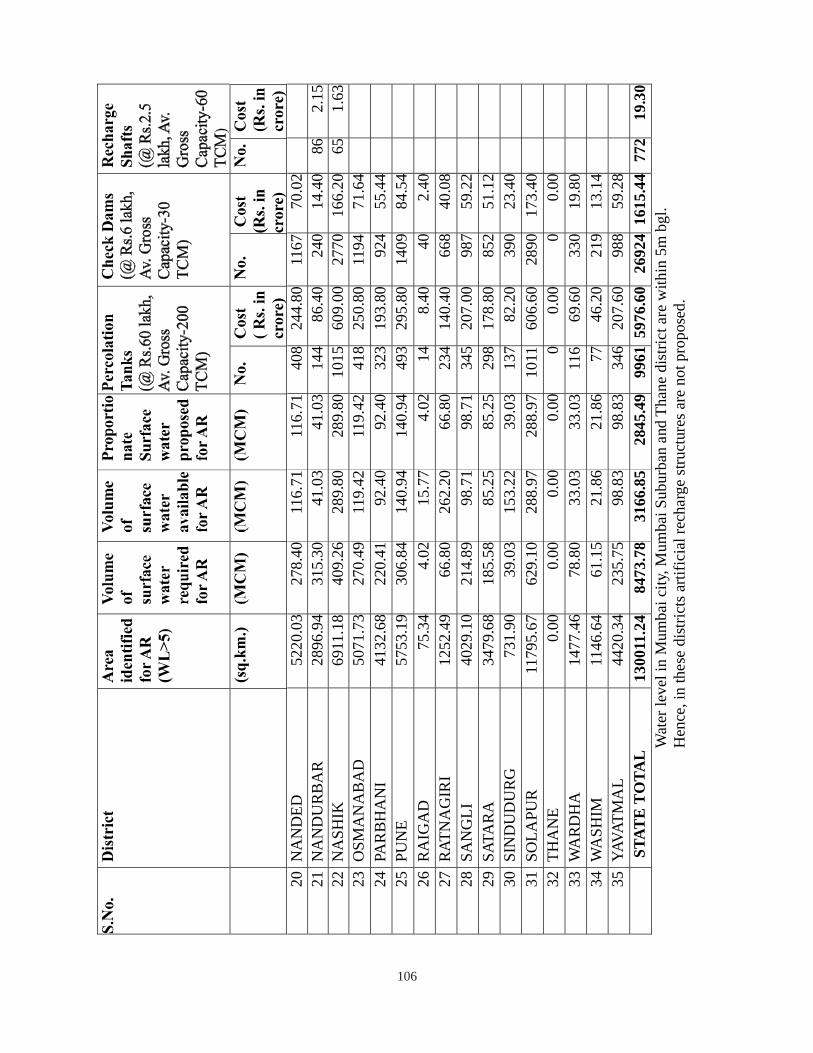
106
20 N
AN
DED
5
220.
03
278.
40
116.
71
116.
71
408
244.
80
1167
70
.02
21 N
AN
DU
RB
AR
28
96.9
4 31
5.30
41
.03
41.0
3 14
4 86
.40
240
14.4
0 86
2.
15
22 N
ASH
IK
6911
.18
409.
26
289.
80
289.
80
1015
60
9.00
27
70
166.
20
65
1.63
23
OSM
AN
AB
AD
50
71.7
3 27
0.49
11
9.42
11
9.42
41
8 25
0.80
11
94
71.6
4
24
PA
RB
HA
NI
4132
.68
220.
41
92.4
0 92
.40
323
193.
80
924
55.4
4
25
PU
NE
5753
.19
306.
84
140.
94
140.
94
493
295.
80
1409
84
.54
26 R
AIG
AD
75
.34
4.02
15
.77
4.02
14
8.
40
40
2.40
27
RAT
NA
GIR
I 12
52.4
9 66
.80
262.
20
66.8
0 23
4 14
0.40
66
8 40
.08
28 S
AN
GLI
40
29.1
0 21
4.89
98
.71
98.7
1 34
5 20
7.00
98
7 59
.22
29 S
ATA
RA
34
79.6
8 18
5.58
85
.25
85.2
5 29
8 17
8.80
85
2 51
.12
30 S
IND
UD
UR
G
731.
90
39.0
3 15
3.22
39
.03
137
82.2
0 39
0 23
.40
31 S
OLA
PUR
11
795.
67
629.
10
288.
97
288.
97
1011
60
6.60
28
90
173.
40
32 T
HA
NE
0.00
0.
00
0.00
0.
00
0 0.
00
0 0.
00
33 W
AR
DH
A
1477
.46
78.8
0 33
.03
33.0
3 11
6 69
.60
330
19.8
0
34
WA
SHIM
11
46.6
4 61
.15
21.8
6 21
.86
77
46.2
0 21
9 13
.14
35 Y
AVAT
MA
L
4420
.34
235.
75
98.8
3 98
.83
346
207.
60
988
59.2
8
STA
TE
TO
TAL
13
0011
.24
8473
.78
3166
.85
2845
.49
9961
597
6.60
26
924
1615
.44
772
19.3
0 W
ater
leve
l in
Mum
bai c
ity, M
umba
i Sub
urba
n an
d Th
ane
dist
rict a
re w
ithin
5m
bgl
. H
ence
, in
thes
e di
stric
ts a
rtific
ial r
echa
rge
stru
ctur
es a
re n
ot p
ropo
sed.
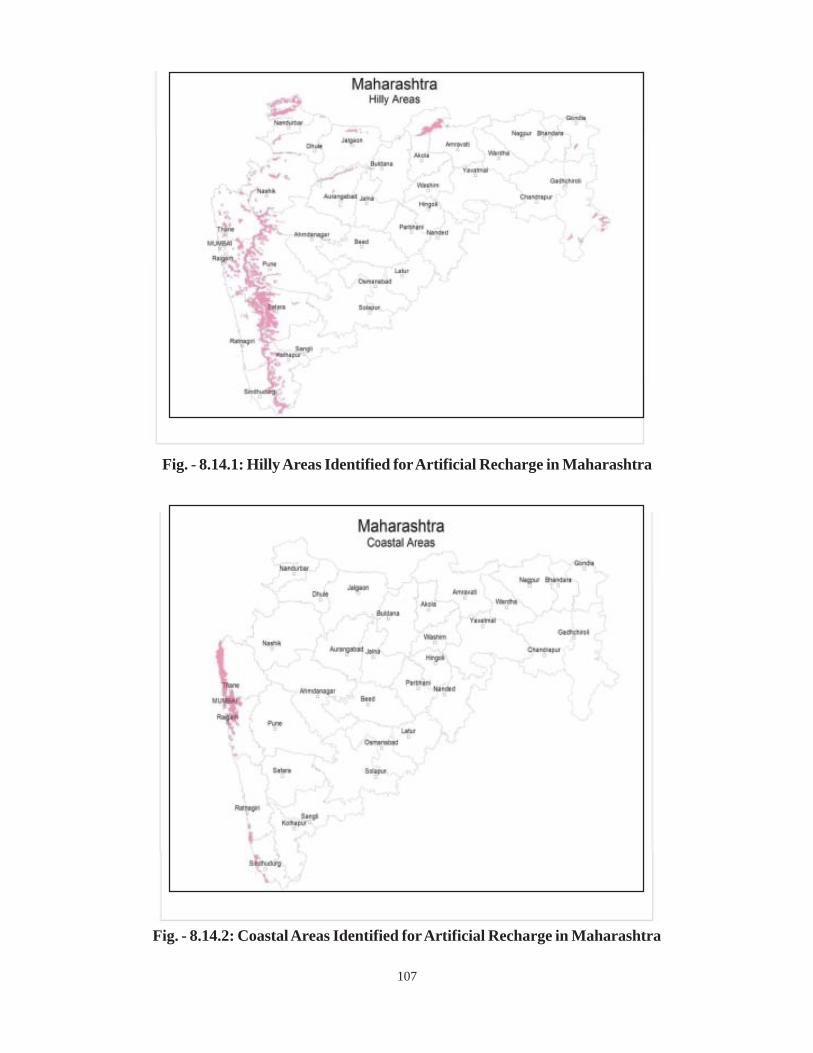
107
Fig. - 8.14.2: Coastal Areas Identified for Artificial Recharge in Maharashtra
Fig. - 8.14.1: Hilly Areas Identified for Artificial Recharge in Maharashtra
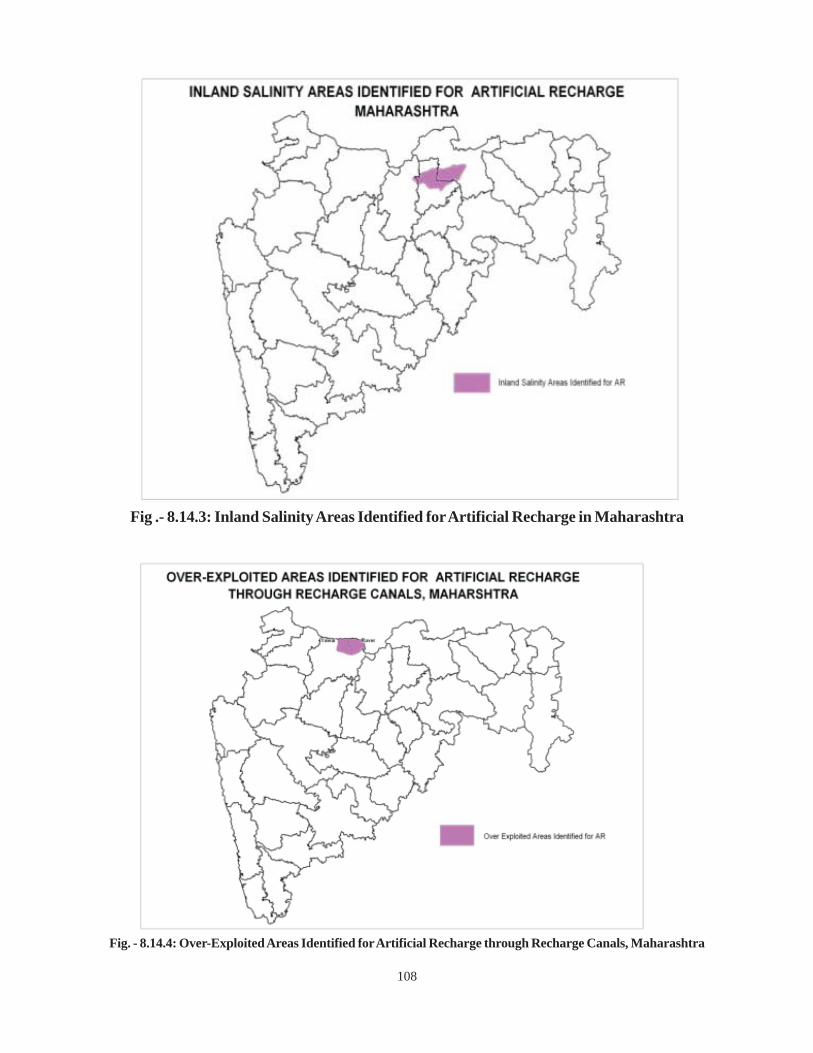
108
Fig .- 8.14.3: Inland Salinity Areas Identified for Artificial Recharge in Maharashtra
Fig. - 8.14.4: Over-Exploited Areas Identified for Artificial Recharge through Recharge Canals, Maharashtra
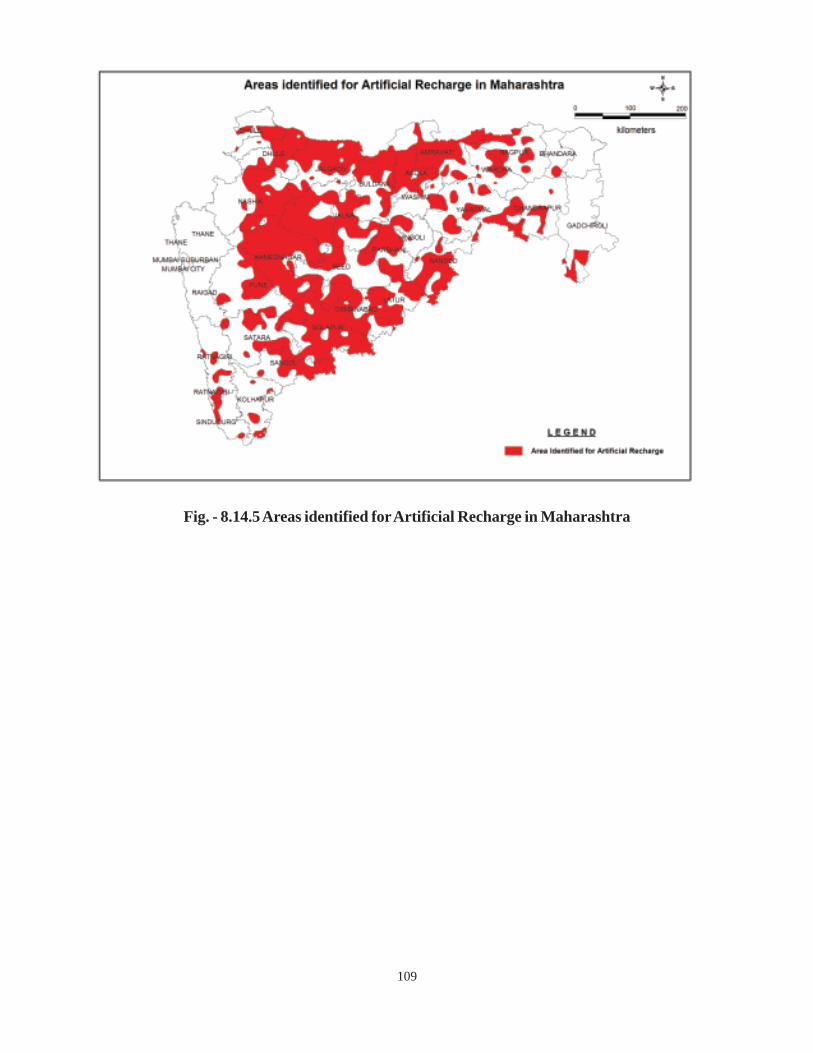
109
Fig. - 8.14.5 Areas identified for Artificial Recharge in Maharashtra
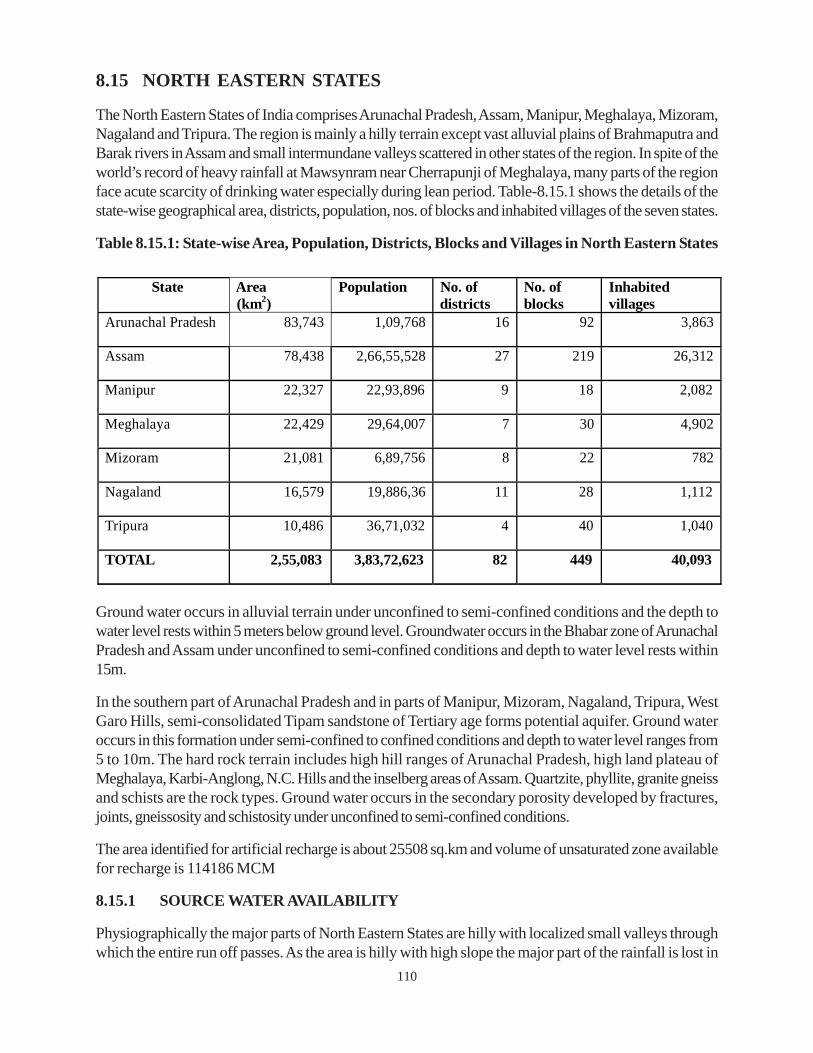
110
8.15 NORTH EASTERN STATES
The North Eastern States of India comprises Arunachal Pradesh, Assam, Manipur, Meghalaya, Mizoram,Nagaland and Tripura. The region is mainly a hilly terrain except vast alluvial plains of Brahmaputra andBarak rivers in Assam and small intermundane valleys scattered in other states of the region. In spite of theworld’s record of heavy rainfall at Mawsynram near Cherrapunji of Meghalaya, many parts of the regionface acute scarcity of drinking water especially during lean period. Table-8.15.1 shows the details of thestate-wise geographical area, districts, population, nos. of blocks and inhabited villages of the seven states.
Table 8.15.1: State-wise Area, Population, Districts, Blocks and Villages in North Eastern States
State Area (km2)
Population No. of districts
No. of blocks
Inhabited villages
Arunachal Pradesh 83,743 1,09,768 16 92 3,863
Assam 78,438 2,66,55,528 27 219 26,312
Manipur 22,327 22,93,896 9 18 2,082
Meghalaya 22,429 29,64,007 7 30 4,902
Mizoram 21,081 6,89,756 8 22 782
Nagaland 16,579 19,886,36 11 28 1,112
Tripura 10,486 36,71,032 4 40 1,040
TOTAL 2,55,083 3,83,72,623 82 449 40,093
Ground water occurs in alluvial terrain under unconfined to semi-confined conditions and the depth towater level rests within 5 meters below ground level. Groundwater occurs in the Bhabar zone of ArunachalPradesh and Assam under unconfined to semi-confined conditions and depth to water level rests within15m.
In the southern part of Arunachal Pradesh and in parts of Manipur, Mizoram, Nagaland, Tripura, WestGaro Hills, semi-consolidated Tipam sandstone of Tertiary age forms potential aquifer. Ground wateroccurs in this formation under semi-confined to confined conditions and depth to water level ranges from5 to 10m. The hard rock terrain includes high hill ranges of Arunachal Pradesh, high land plateau ofMeghalaya, Karbi-Anglong, N.C. Hills and the inselberg areas of Assam. Quartzite, phyllite, granite gneissand schists are the rock types. Ground water occurs in the secondary porosity developed by fractures,joints, gneissosity and schistosity under unconfined to semi-confined conditions.
The area identified for artificial recharge is about 25508 sq.km and volume of unsaturated zone availablefor recharge is 114186 MCM
8.15.1 SOURCE WATER AVAILABILITY
Physiographically the major parts of North Eastern States are hilly with localized small valleys throughwhich the entire run off passes. As the area is hilly with high slope the major part of the rainfall is lost in
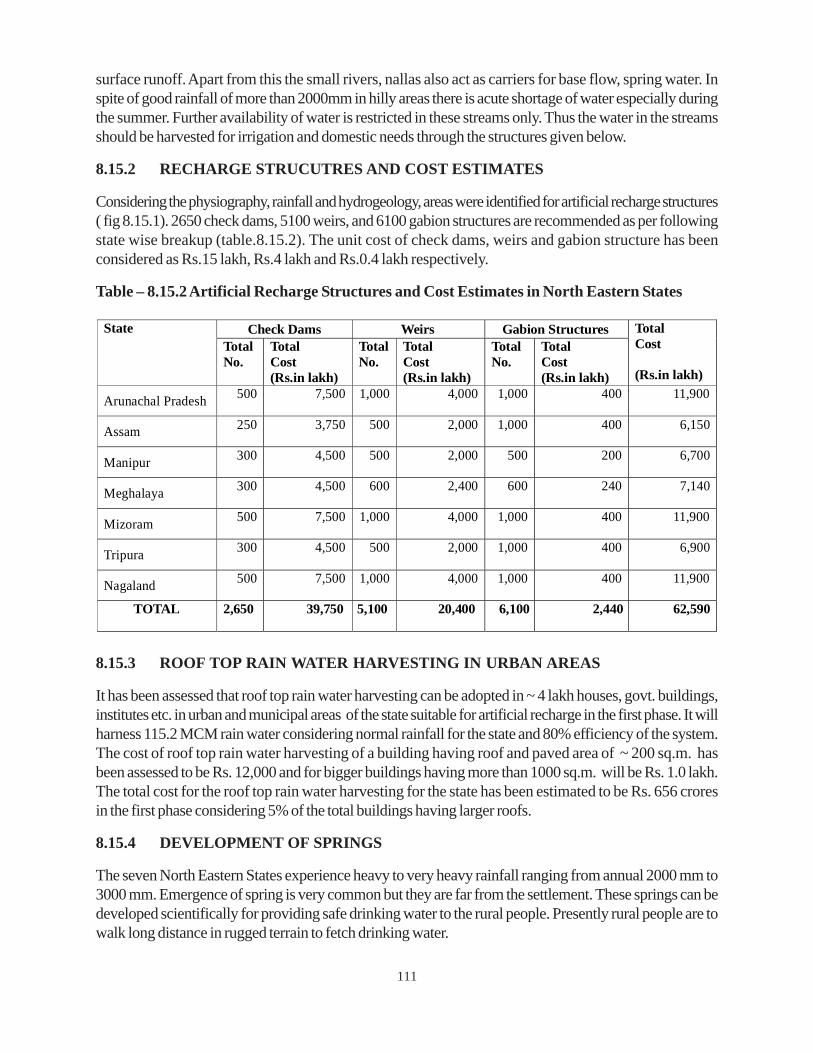
111
surface runoff. Apart from this the small rivers, nallas also act as carriers for base flow, spring water. Inspite of good rainfall of more than 2000mm in hilly areas there is acute shortage of water especially duringthe summer. Further availability of water is restricted in these streams only. Thus the water in the streamsshould be harvested for irrigation and domestic needs through the structures given below.
8.15.2 RECHARGE STRUCUTRES AND COST ESTIMATES
Considering the physiography, rainfall and hydrogeology, areas were identified for artificial recharge structures( fig 8.15.1). 2650 check dams, 5100 weirs, and 6100 gabion structures are recommended as per followingstate wise breakup (table.8.15.2). The unit cost of check dams, weirs and gabion structure has beenconsidered as Rs.15 lakh, Rs.4 lakh and Rs.0.4 lakh respectively.
Table – 8.15.2 Artificial Recharge Structures and Cost Estimates in North Eastern States
8.15.3 ROOF TOP RAIN WATER HARVESTING IN URBAN AREAS
It has been assessed that roof top rain water harvesting can be adopted in ~ 4 lakh houses, govt. buildings,institutes etc. in urban and municipal areas of the state suitable for artificial recharge in the first phase. It willharness 115.2 MCM rain water considering normal rainfall for the state and 80% efficiency of the system.The cost of roof top rain water harvesting of a building having roof and paved area of ~ 200 sq.m. hasbeen assessed to be Rs. 12,000 and for bigger buildings having more than 1000 sq.m. will be Rs. 1.0 lakh.The total cost for the roof top rain water harvesting for the state has been estimated to be Rs. 656 croresin the first phase considering 5% of the total buildings having larger roofs.
8.15.4 DEVELOPMENT OF SPRINGS
The seven North Eastern States experience heavy to very heavy rainfall ranging from annual 2000 mm to3000 mm. Emergence of spring is very common but they are far from the settlement. These springs can bedeveloped scientifically for providing safe drinking water to the rural people. Presently rural people are towalk long distance in rugged terrain to fetch drinking water.
Check Dams Weirs Gabion StructuresState
Total No.
Total Cost (Rs.in lakh)
TotalNo.
Total Cost (Rs.in lakh)
Total No.
Total Cost (Rs.in lakh)
Total Cost (Rs.in lakh)
Arunachal Pradesh 500 7,500 1,000 4,000 1,000 400 11,900
Assam 250 3,750 500 2,000 1,000 400 6,150
Manipur 300 4,500 500 2,000 500 200 6,700
Meghalaya 300 4,500 600 2,400 600 240 7,140
Mizoram 500 7,500 1,000 4,000 1,000 400 11,900
Tripura 300 4,500 500 2,000 1,000 400 6,900
Nagaland 500 7,500 1,000 4,000 1,000 400 11,900
TOTAL 2,650 39,750 5,100 20,400 6,100 2,440 62,590
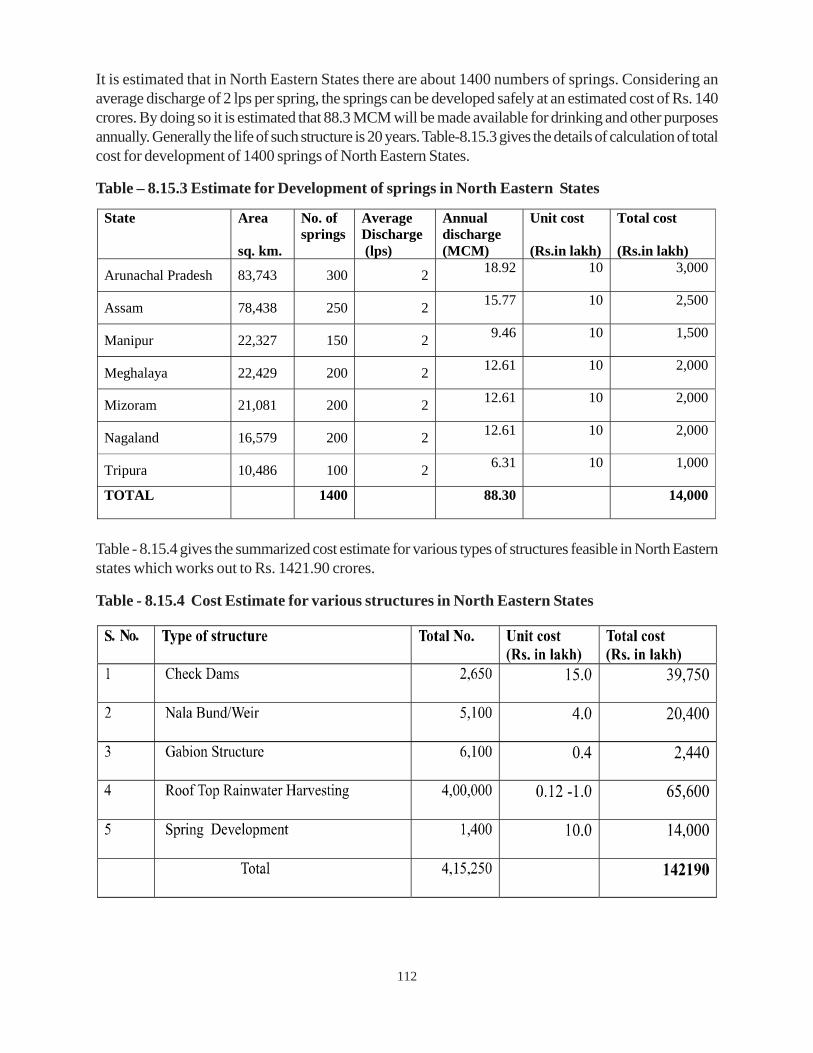
112
It is estimated that in North Eastern States there are about 1400 numbers of springs. Considering anaverage discharge of 2 lps per spring, the springs can be developed safely at an estimated cost of Rs. 140crores. By doing so it is estimated that 88.3 MCM will be made available for drinking and other purposesannually. Generally the life of such structure is 20 years. Table-8.15.3 gives the details of calculation of totalcost for development of 1400 springs of North Eastern States.
Table – 8.15.3 Estimate for Development of springs in North Eastern States
Table - 8.15.4 gives the summarized cost estimate for various types of structures feasible in North Easternstates which works out to Rs. 1421.90 crores.
Table - 8.15.4 Cost Estimate for various structures in North Eastern States
State Area
sq. km.
No. of springs
Average Discharge (lps)
Annual discharge (MCM)
Unit cost (Rs.in lakh)
Total cost (Rs.in lakh)
Arunachal Pradesh 83,743 300 2 18.92 10 3,000
Assam 78,438 250 2 15.77 10 2,500
Manipur 22,327 150 2 9.46 10 1,500
Meghalaya 22,429 200 2 12.61 10 2,000
Mizoram 21,081 200 2 12.61 10 2,000
Nagaland 16,579 200 2 12.61 10 2,000
Tripura 10,486 100 2 6.31 10 1,000
TOTAL 1400 88.30 14,000
. .
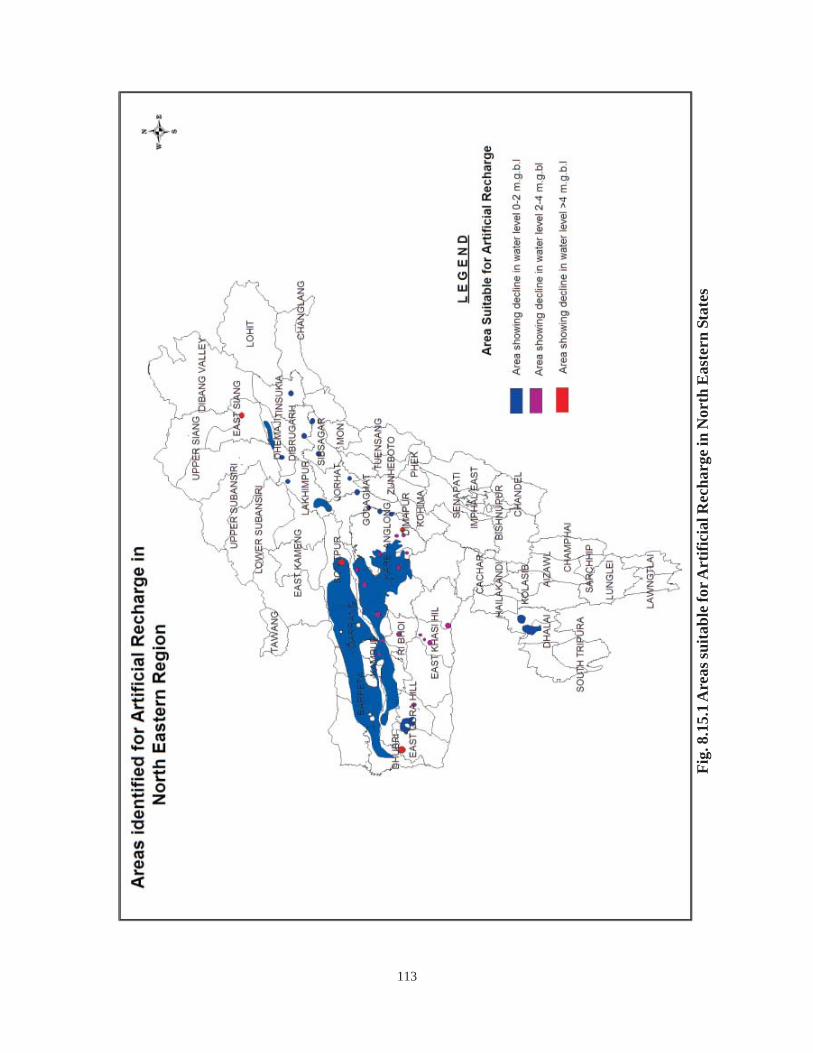
113
Fig
. 8.1
5.1 A
reas
suita
ble
for A
rtifi
cial
Rec
harg
e in
Nor
th E
aste
rn S
tate
s
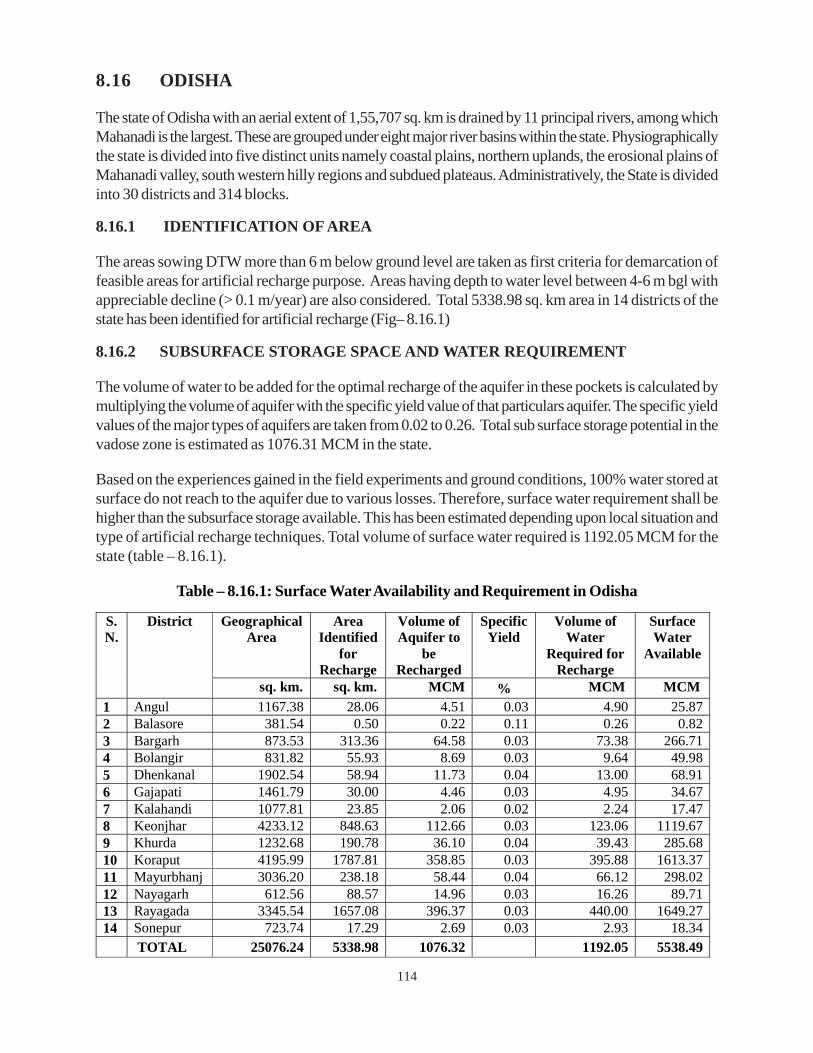
114
8.16 ODISHA
The state of Odisha with an aerial extent of 1,55,707 sq. km is drained by 11 principal rivers, among whichMahanadi is the largest. These are grouped under eight major river basins within the state. Physiographicallythe state is divided into five distinct units namely coastal plains, northern uplands, the erosional plains ofMahanadi valley, south western hilly regions and subdued plateaus. Administratively, the State is dividedinto 30 districts and 314 blocks.
8.16.1 IDENTIFICATION OF AREA
The areas sowing DTW more than 6 m below ground level are taken as first criteria for demarcation offeasible areas for artificial recharge purpose. Areas having depth to water level between 4-6 m bgl withappreciable decline (> 0.1 m/year) are also considered. Total 5338.98 sq. km area in 14 districts of thestate has been identified for artificial recharge (Fig– 8.16.1)
8.16.2 SUBSURFACE STORAGE SPACE AND WATER REQUIREMENT
The volume of water to be added for the optimal recharge of the aquifer in these pockets is calculated bymultiplying the volume of aquifer with the specific yield value of that particulars aquifer. The specific yieldvalues of the major types of aquifers are taken from 0.02 to 0.26. Total sub surface storage potential in thevadose zone is estimated as 1076.31 MCM in the state.
Based on the experiences gained in the field experiments and ground conditions, 100% water stored atsurface do not reach to the aquifer due to various losses. Therefore, surface water requirement shall behigher than the subsurface storage available. This has been estimated depending upon local situation andtype of artificial recharge techniques. Total volume of surface water required is 1192.05 MCM for thestate (table – 8.16.1).
Table – 8.16.1: Surface Water Availability and Requirement in Odisha
Geographical Area
Area Identified
for Recharge
Volume of Aquifer to
be Recharged
Specific Yield
Volume of Water
Required for Recharge
Surface Water
Available
S. N.
District
sq. km. sq. km. MCM % MCM MCM 1 Angul 1167.38 28.06 4.51 0.03 4.90 25.87 2 Balasore 381.54 0.50 0.22 0.11 0.26 0.82 3 Bargarh 873.53 313.36 64.58 0.03 73.38 266.71 4 Bolangir 831.82 55.93 8.69 0.03 9.64 49.98 5 Dhenkanal 1902.54 58.94 11.73 0.04 13.00 68.91 6 Gajapati 1461.79 30.00 4.46 0.03 4.95 34.67 7 Kalahandi 1077.81 23.85 2.06 0.02 2.24 17.47 8 Keonjhar 4233.12 848.63 112.66 0.03 123.06 1119.67 9 Khurda 1232.68 190.78 36.10 0.04 39.43 285.68 10 Koraput 4195.99 1787.81 358.85 0.03 395.88 1613.37 11 Mayurbhanj 3036.20 238.18 58.44 0.04 66.12 298.02 12 Nayagarh 612.56 88.57 14.96 0.03 16.26 89.71 13 Rayagada 3345.54 1657.08 396.37 0.03 440.00 1649.27 14 Sonepur 723.74 17.29 2.69 0.03 2.93 18.34
TOTAL 25076.24 5338.98 1076.32 1192.05 5538.49
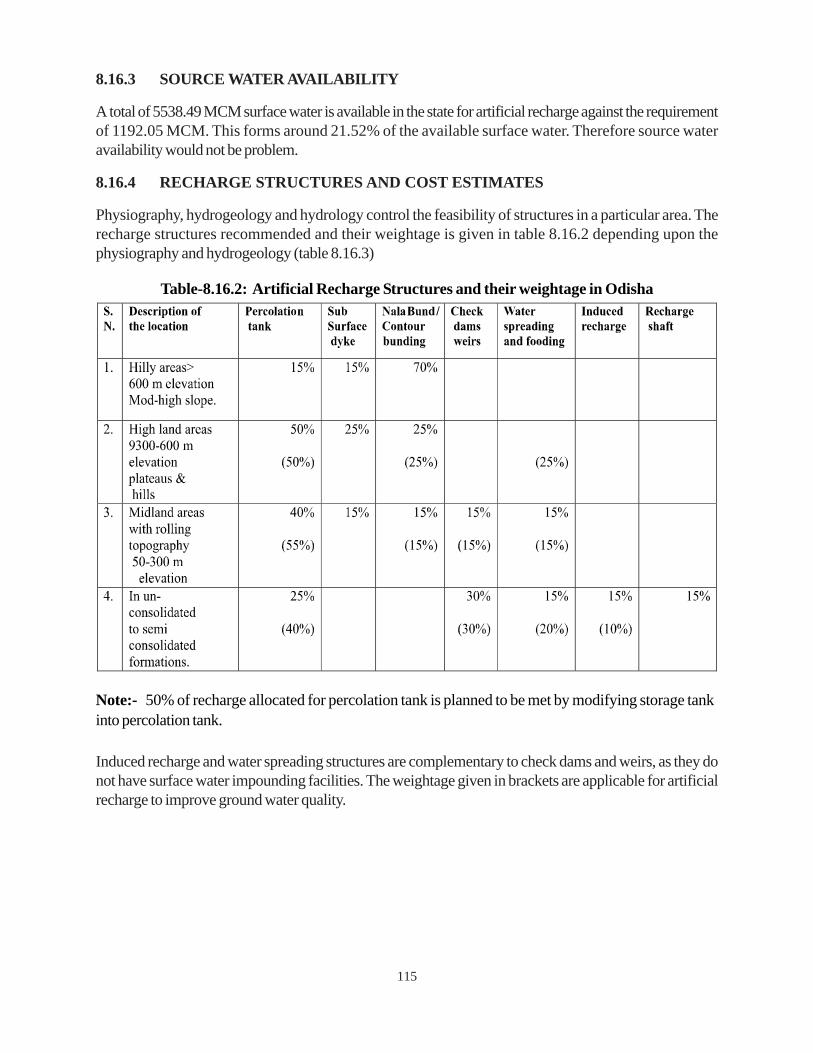
115
8.16.3 SOURCE WATER AVAILABILITY
A total of 5538.49 MCM surface water is available in the state for artificial recharge against the requirementof 1192.05 MCM. This forms around 21.52% of the available surface water. Therefore source wateravailability would not be problem.
8.16.4 RECHARGE STRUCTURES AND COST ESTIMATES
Physiography, hydrogeology and hydrology control the feasibility of structures in a particular area. Therecharge structures recommended and their weightage is given in table 8.16.2 depending upon thephysiography and hydrogeology (table 8.16.3)
Table-8.16.2: Artificial Recharge Structures and their weightage in Odisha
Induced recharge and water spreading structures are complementary to check dams and weirs, as they donot have surface water impounding facilities. The weightage given in brackets are applicable for artificialrecharge to improve ground water quality.
Note:- 50% of recharge allocated for percolation tank is planned to be met by modifying storage tankinto percolation tank.
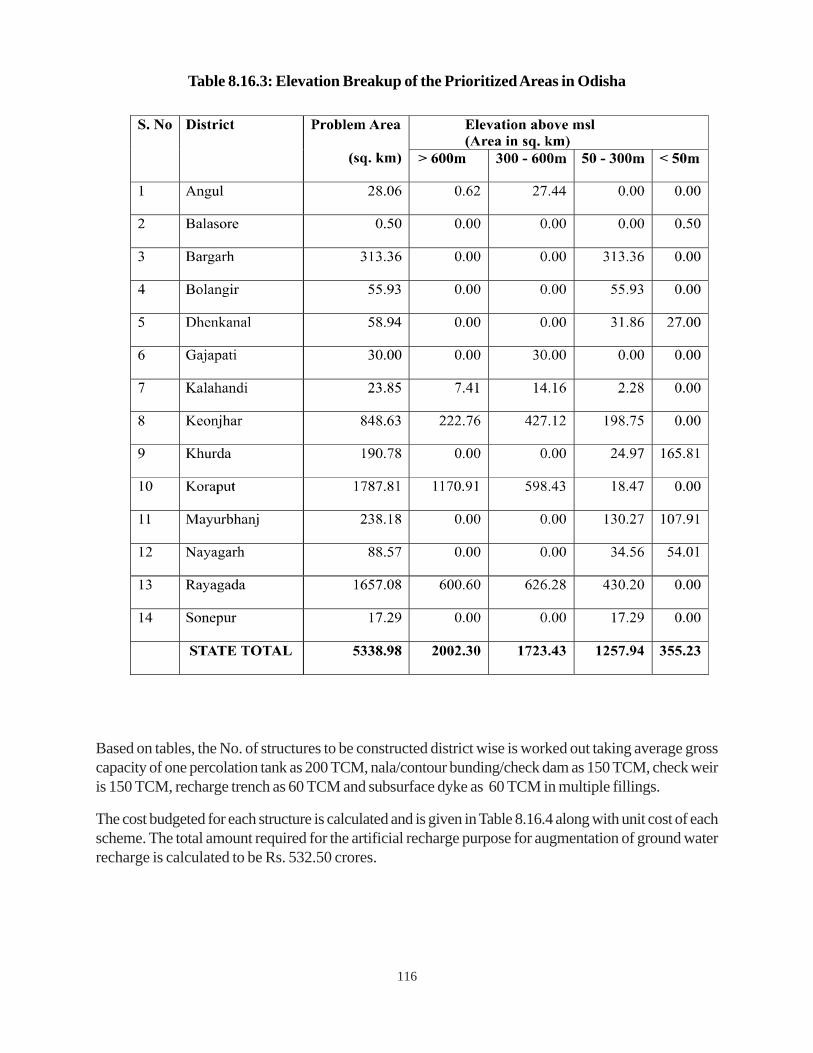
116
Based on tables, the No. of structures to be constructed district wise is worked out taking average grosscapacity of one percolation tank as 200 TCM, nala/contour bunding/check dam as 150 TCM, check weiris 150 TCM, recharge trench as 60 TCM and subsurface dyke as 60 TCM in multiple fillings.
The cost budgeted for each structure is calculated and is given in Table 8.16.4 along with unit cost of eachscheme. The total amount required for the artificial recharge purpose for augmentation of ground waterrecharge is calculated to be Rs. 532.50 crores.
Table 8.16.3: Elevation Breakup of the Prioritized Areas in Odisha
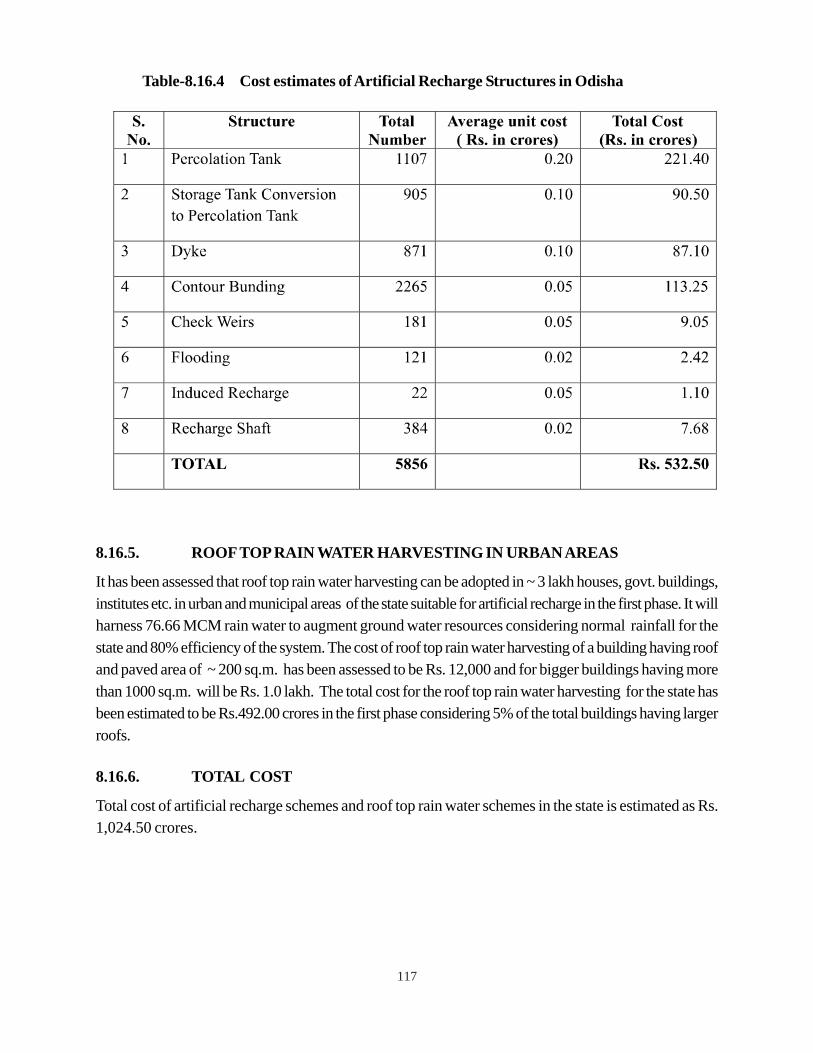
117
Table-8.16.4 Cost estimates of Artificial Recharge Structures in Odisha
8.16.5. ROOF TOP RAIN WATER HARVESTING IN URBAN AREAS
It has been assessed that roof top rain water harvesting can be adopted in ~ 3 lakh houses, govt. buildings,institutes etc. in urban and municipal areas of the state suitable for artificial recharge in the first phase. It willharness 76.66 MCM rain water to augment ground water resources considering normal rainfall for thestate and 80% efficiency of the system. The cost of roof top rain water harvesting of a building having roofand paved area of ~ 200 sq.m. has been assessed to be Rs. 12,000 and for bigger buildings having morethan 1000 sq.m. will be Rs. 1.0 lakh. The total cost for the roof top rain water harvesting for the state hasbeen estimated to be Rs.492.00 crores in the first phase considering 5% of the total buildings having largerroofs.
8.16.6. TOTAL COST
Total cost of artificial recharge schemes and roof top rain water schemes in the state is estimated as Rs.1,024.50 crores.
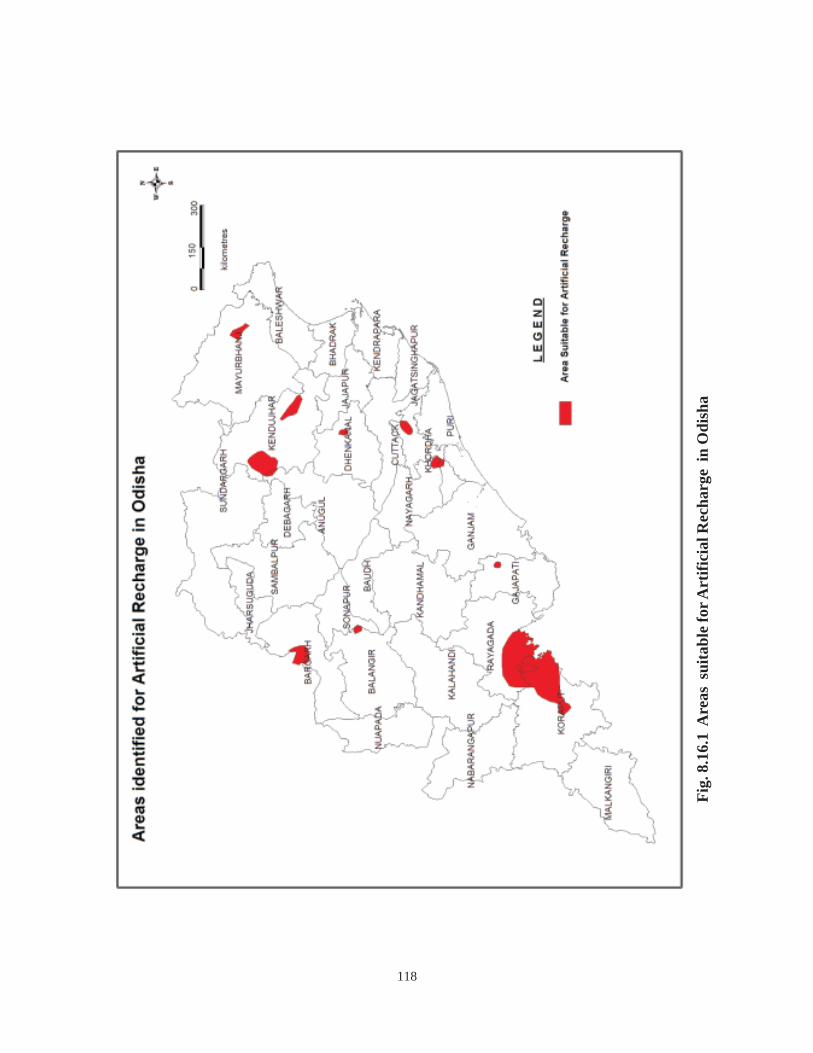
118
F
ig. 8
.16.
1 A
reas
sui
tabl
e fo
r Art
ifici
al R
echa
rge
in O
dish
a
119
8.17 PUNJABThe state of Punjab having total area of 50,362 sq.km. is occupied by Indus river basin and is drained bythree major rivers, the Ravi, the Beas and the Satluj apart from other drainage channels. About 90% of thearea is occupied by Quaternary alluvium and Tertiary formations outcrop as Siwalik hills ranges in northeasternpart of the State.
Ground water exploration carried out by CGWB down to a depth of 450 m, reveals existence ofthick fresh water aquifers throughout the State. These aquifers are laterally and vertically extensive andpersistent in nature. However, in southwestern parts, the thickness of fresh water aquifer is much less ascompared to the other parts because area is underlain by brackish / saline water. At places, the thicknessof fresh water bearing aquifer is even less than 10 m.
Local and discontinuous, fairly thick aquifers having fresh water down to 150 meters with average yield ofwells below 50 cu.m/hour exists in an area of about 12,350 sq.km. covering Muktsar, Faridkot, Moga,Bhatinda, Mansa, southern parts of Sangrur and Ferozepur districts. In a narrow strip extending fromsouth of Fazilka to north of Moga and also in the north eastern parts of Gurdaspur, Hoshiarpur, Nawanshahar,Patiala, Ropar districts and Anandpur Sahib valley of Ropar district, comprising an area of about 6900sq.kms., aquifers are regionally extensive and fairly thick down to 300 meters with an average yield ofwells between 50 – 150 m3/hours. In an area of about 29,280 sq.km. covering whole of Amritsar, Kapurthala,Fatehgarh Sahib, Ludhiana, Patiala districts and parts of Sangrur, Gurdaspur, Ferozepur, Patiala,Nawanshahar, Jalandhar and Ropar districts, regionally extensive and fairly thick aquifers down to 300meters with an average yield of wells above 150 m3/hour are occurring. Hilly terrain of about 11050sq.km. in parts of Ropar, Gurdaspur, Hoshiarpur and Nawanshahar districts is underlain by semi-consolidatedformations having limited yield potentials below 50 m3/hour except plateau area (beet area) in Garhshankarblock of Hoshiarpur district which has yield potential of 100 m3 to 200 m3/hr.
Ground water resources of state have been estimated as on 31.03.2009. The net annual ground wateravailability of state has been assessed to be 20.34 BCM. Net annual draft of the state has been estimatedto be 34.66 BCM. The average stage of ground water development in the state is 170%. Out of 142blocks assessed, 110 falls under ‘Over- exploited’ category, 3 in ‘Critical’, 2 as ‘Semi Critical’ and 23 as‘Safe’ category. The reason for this stage of ground water development are excessive withdrawal ofground water mainly to meet growing demands of agriculture in addition to industrial and domestic. Surfacewater resources in the state are limited and are decreasing due to climate change. Thus stress is more andmore on ground water. These over-exploited aquifers require augmentation for sustaining the ground waterabstraction structures.
8.17.1 IDENTIFICATION OF AREA
Based on the post monsoon depth to water level and long term ground water level trends, it has beenestimated that 43,340 sq. kms. area is feasible for artificial recharge (Fig. 8.17.1).
8.17.2 SUBSURFACE STORAGE SPACE AND WATER REQUIREMENT
The thickness of available unsaturated zone (below 3 m bgl) is estimated by considering the differentranges of water levels on block-wise basis. The different range of depth to water at 3 m interval is averagedto arrive at thickness of effective unsaturated zone. The total volume of unsaturated strata is calculated byconsidering the depth to water level and area of unsaturated thickness of different range. This volume thenmultiplied by average specific yield of 12% to arrive at the net amount of water required to be rechargedby artificial methods to saturate the aquifer up to 3 m bgl . This is estimated as 52,684 MCM. Based onthe experience gained in the field experiments, an average recharge efficiency of 75% of the individual
120
structure is only possible. Therefore, to arrive at the total volume of actual source water required at thesurface, the volume of water required for artificial recharge is calculated and multiplied by 1.33 ( i.e.reciprocal of 0.75 ). A total of 70,071 MCM of surface water is required in the state for artificial recharge.
8.17.3 SOURCE WATER AVAILABILITY
The quantity of non-committed surplus surface water in the Punjab state has been estimated to be only1200.99 MCM against the requirement of 70,071 MCM.
8.17.4 RECHARGE STRUCTURES AND COST ESTIMATES
The main recharge structures feasible in the state are recharge shaft, horizontal trench with or withoutinjection wells and check dams. The average cost of a recharge shaft to recharge 0.015 MCM water willbe around Rs. 2.50 lakh and of check dam to recharge 0.04 MCM will be around Rs. 40 lacs. It has beenestimated that 79,924 artificial structures are required to recharge the available surplus water in the state.The total cost of 79,924 recharge structures will be around Rs. 2021.47 crores. The district wise numberof structures feasible and cost estimates is given in table 8.17.1.
8.17.5 AREA BENEFITED
The impact of artificial recharge to ground water will be mainly all around the structures due to gradient ofwater table. The impact will be maximum during post monsoon period and a distinct rise in ground waterlevel will be observed in the recharge area as compared to area not receiving the additional recharge. It isestimated that influence of recharge scheme as proposed in Master Plan will be observed in about 26650sq. km. area and it will help to check in decline in water level. There will be rise in water level locally andmound will be formed around the recharge structures temporarily and ground water will flow in all thedirections, which will dissipate after wards. This will result in saving of energy, due to reduction in pumpinglift.
8.17.6 RAIN WATER HARVESTING IN URBAN AREAS
It has been assessed that roof top rainwater harvesting can be adopted in 15 lakh houses, govt buildings,institutes etc. in urban and municipal area of the state suitable for artificial recharge in the first phase. It willharness 187 MCM rain water to augment groundwater resources considering normal rainfall for the stateand 80% efficiency of the system. The cost of roof top rain water harvesting of a buildings having roof andpaved areas of ~ 200 sq.m in a cluster of 4-6 houses has been assessed to be Rs. 30,000/- and for biggerbuilding having more than 1000 sq.m will be Rs. 1.0 lakh. The total cost for the roof top rain waterharvesting for the state has been estimated to be Rs. 1650 crore in the first phase considering 3 lakhstructures for houses on cluster basis and 75,000 structures for government/institutional buildings.
8.17.7 ARTIFICIAL RECHARGE FROM TREATED SEWAGE WATER
Besides rainfall, ample scope also exists to recharge treated sewage water, which is disposed away fromthe towns without any purposeful gain. The treated sewage water can also be used as source for artificialrecharge after ascertaining the suitability of chemical quality. In Ludhiana, Jalandhar and Amritsar towns,the sewage treatment plants are under construction and the water of these plants can be used for artificialrecharge on their completion.
8.17.8 TOTAL COST
The cost of artificial recharge for surplus monsoon runoff of 1201 MCM will be Rs.2021.47 crores. Thecost to harvest rainwater from roof top of urban areas will be Rs.1650 crores. Thus the total cost forimplementing artificial recharge schemes in the state will be of the order of Rs. 3671.47 crores.
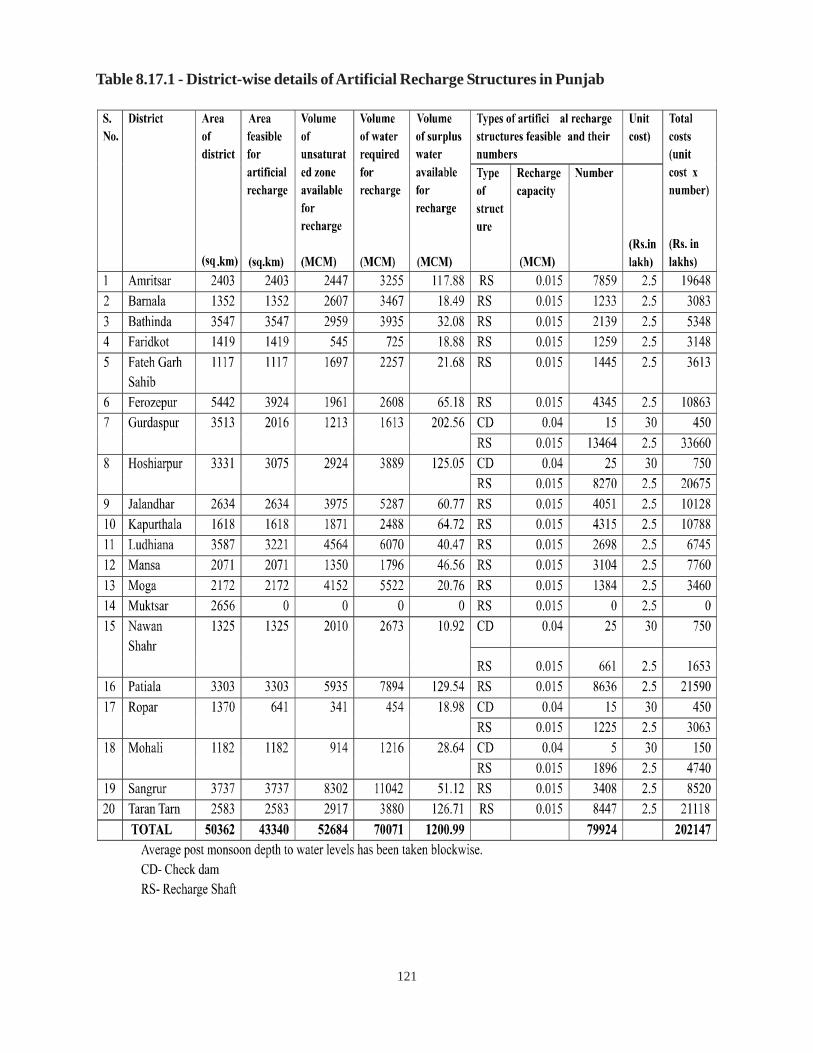
121
Table 8.17.1 - District-wise details of Artificial Recharge Structures in Punjab

122
Fig.8.17.1 Areas Suitable for Artificial Recharge in Punjab
123
8.18 RAJASTHAN
Rajasthan is the driest and most water deficient state of India. The state is divided into 14 river basins,which cover eastern, northern and southern river catchments. Luni is the only river west of Aravalli and inremaining Western Rajasthan the drainage is internal in the desert sand.
The numbers of Critical and Over-exploited blocks have increased from 140 to 166 between 2004 and2009. Out of a total of 239 assessment units (Blocks / Mandals/ Talukas) in the state, 166 have beencategorized as ‘Over-exploited’ as on 31st March 2009,.There are 25 ‘Critical’ assessment units and oneblock (Taranagar) having saline ground water (CGWB, 2009).
8.18.1 IDENTIFICATION OF AREA
The areas feasible for artificial recharge have been demarcated into following three categories:
• Areas showing declining trend (more than 0.2m/yr) and water level between 3 and 9 m bgl.
• Areas showing declining trend (more than 0.1m/yr) and water level between 9 and 20 m bgl.
• Water level more than 20 m bgl (Fig. 8.18.1)
8.18.2 SUBSURFACE STORAGE SPACE AND WATER REQUIREMENT
The thickness of available unsaturated zone (below 8 mbgl) of above 3 categories is estimated by consideringthe different ranges of water level. The total volume of unsaturated strata is calculated by considering andunsaturated thickness of different ranges. This volume is then multiplied by average specific yield of differentaquifers to arrive at the net amount of water required which is to be recharged by artificial recharge tosaturate the aquifer up to 8 m bgl. The storage space available in the feasible areas of the state is 2724364MCM. (table-8.18.1)
8.18.3 SOURCE WATER AVAILABILITY
The amount of surface water considered for planning the artificial recharge is 860 MCM. Plan proposesthat 70% of it i.e. 602 MCM can be stored in percolation tanks, 10 % i.e.86 MCM can be stored inanicuts and the rest 20% i.e. 172 MCM through recharge shafts. Therefore, a total of 3010 percolationtanks, 860 Anicuts and 5733 Recharge Shafts are proposed in the identified areas of Rajasthan for artificialrecharge. District wise list is given in table-8.18.1. Basin wise details are given in table-8.18.2.
8.18.4 RECHARGE STRUCTURE AND COST ESTIMATES
Most of the artificial ground water recharge structures will be located in such areas where the stage ofgroundwater development is either overexploited or critical caused by excessive development of groundwaterresulting in sharp decline in water level. A total number of 3010 percolation tanks, 860 Anicut and 5733recharge shafts are proposed (table-8.18.1). Average cost of construction of a percolation tank of 200TCM single filling storage capacity, Anicut average capacity of 100 TCM and recharge shaft of averagecapacity of 30 TCM has been considered in the computation. A total of Rs. 1566 crores are estimated toundertake the construction of proposed recharge structures. (table -8.18.1).
124
8.18.5 AREA BENEFITTED
Assured irrigation to be brought by percolation tank shall be around 90300 ha, by anicuts 2907 ha and byrecharge shafts 30958 ha. Therefore total 124165 ha of additional land could be brought under assuredirrigation in the feasible areas by considering delta factor as 0.5.
8.18.6 ROOF TOP RAIN WATER HARVESTING IN URBAN AREAS
It has been assessed that roof top rain water harvesting can be adopted in ~ 5 lakh houses, govt. buildings,institutes etc. in urban and municipal areas of the state suitable for artificial recharge in the first phase. It willharness 44.42 MCM rain water to augment ground water resources considering normal rainfall for thestate and 80% efficiency of the system. The cost of roof top rain water harvesting of a building having roofand paved area of ~ 200 sq.m. has been assessed to be Rs. 12,000 and for bigger buildings having morethan 1000 sq.m. will be Rs. 1.0 lakh. The total cost for the roof top rain water harvesting for the state hasbeen estimated to be Rs. 820 crores in the first phase considering 5% of the total buildings having largerroofs.
8.18.7 TOTAL COST
Total cost of artificial recharge schemes in the state including roof top rainwater harvesting is Rs. 2386crores.

125
Tabl
e 8.1
8.1:
Dis
tric
t wis
e det
ails
of A
rtifi
cial
Rec
harg
e Str
uctu
res i
n R
ajas
than
Res
ourc
eto
beha
rnes
sed
byE
stim
ated
cost
ofst
ruct
ure
Perc
olat
ion
tank
sA
nicu
tR
echa
rge
shaf
t
S.N
oD
istr
ict
Are
aof
dist
.A
rea
feas
ible
for
artif
icia
lre
char
ge
(sq.
km)
Volu
me
ofaq
uife
rav
aila
ble
for
rech
arge
(MC
M)
Volu
me
ofw
ater
requ
ired
for
rech
arge
(MC
M)
Volu
me
ofw
ater
avai
labl
efo
rre
char
ge
(MC
M)
MC
MN
o.M
CM
No.
MC
MN
o.
Perc
olat
ion
Tank
Ani
cut
Rec
harg
eSh
aft
Tota
lcos
t
(Rs.i
ncr
ores
)
12
34
56
78
910
1112
1314
1516
17
1A
jmer
8481
8481
1441
7711
9238
.90.
214
30.
140
0.03
244
58.6
31.
2313
.005
72.8
65
2A
lwar
8720
5539
9418
012
049
21.9
740.
270
0.1
220.
0314
328
.70.
677
7.62
236
.998
3B
answ
ara
5037
4925
3940
019
7018
.87
0.2
650.
117
0.03
8726
.65
0.52
34.
637
31.8
1
4B
aran
6955
6884
2065
228
2870
.87
0.2
255
0.1
660.
0338
610
4.55
2.03
20.5
7412
7.15
3
5B
arm
er28
387
6557
3803
0653
242
9.87
0.2
170.
110
0.03
135
6.97
0.30
87.
196
14.4
73
6B
hara
tpur
5044
2714
1357
020
358.
742
0.2
220.
19
0.03
539.
020.
277
2.82
512
.122
7B
hilw
ara
1045
510
321
4128
420
6419
.03
0.2
269
0.1
680.
0341
711
0.29
2.09
122
.226
134.
607
8B
undi
5500
5500
2200
0016
940
64.0
30.
222
80.
159
0.03
347
93.4
81.
814
18.4
9511
3.78
9
9C
hitto
rgar
h10
856
1079
619
4328
9716
75.8
30.
227
50.
170
0.03
415
112.
752.
153
22.1
213
7.02
2
10D
ausa
3420
3266
5552
271
6114
.662
0.2
440.
114
0.03
8418
.04
0.43
14.
477
22.9
48
11D
holp
ur30
0986
926
0739
110
.87
0.2
320.
18
0.03
4913
.12
0.24
62.
612
15.9
78
12D
unge
rpur
3770
3285
5190
260
13.8
70.
243
0.1
110.
0358
17.6
30.
338
3.09
121
.06
(Rs.i
ncr
ores
)
(sq.
km)
.
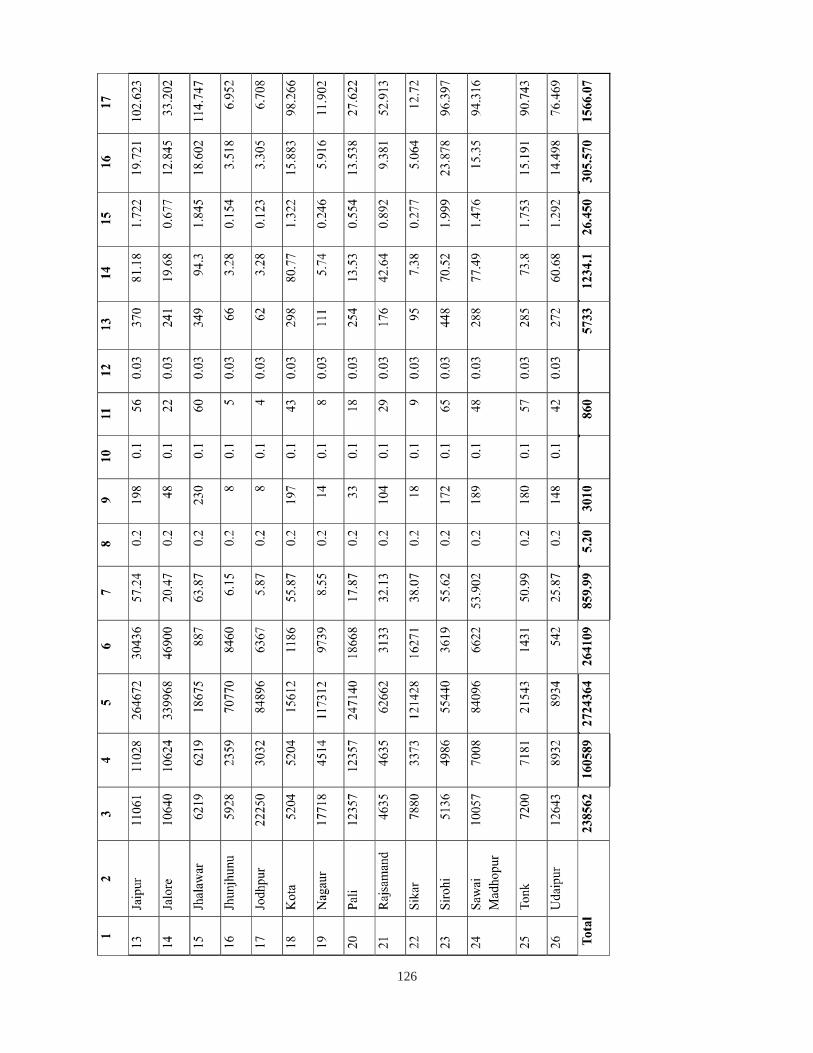
126
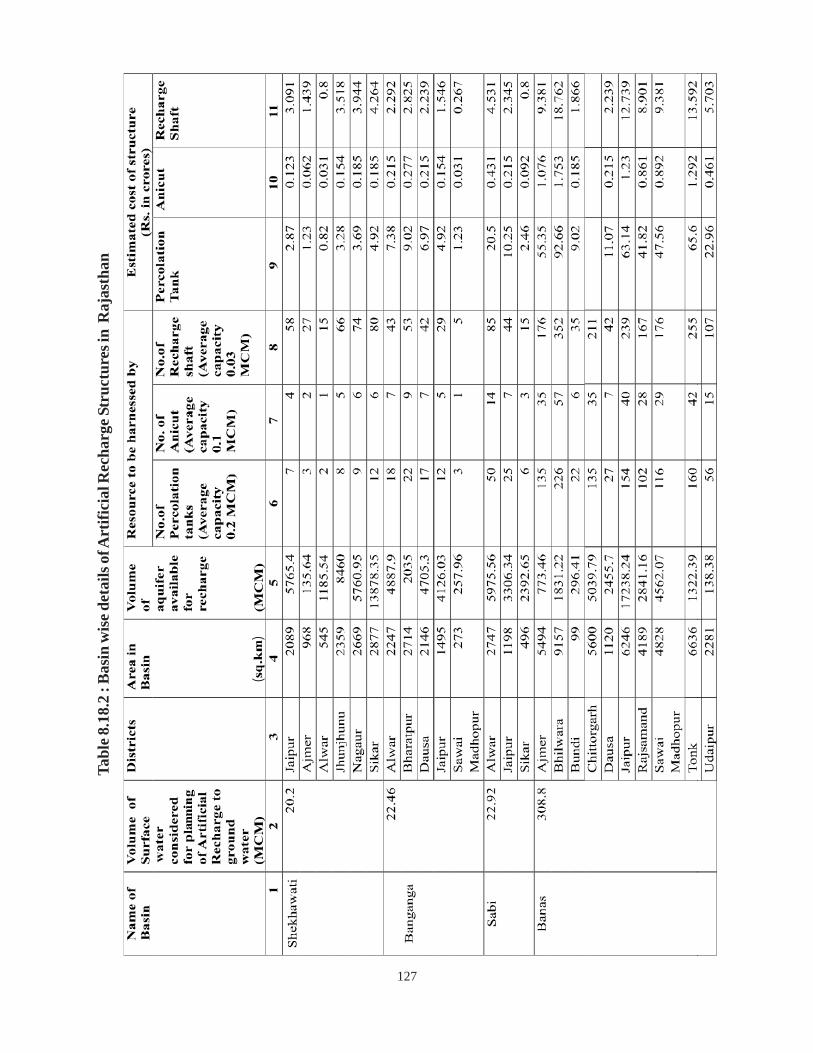
127
Tabl
e 8.1
8.2
: Bas
in w
ise d
etai
ls o
f Art
ifici
al R
echa
rge S
truc
ture
s in
Raj
asth
an
()
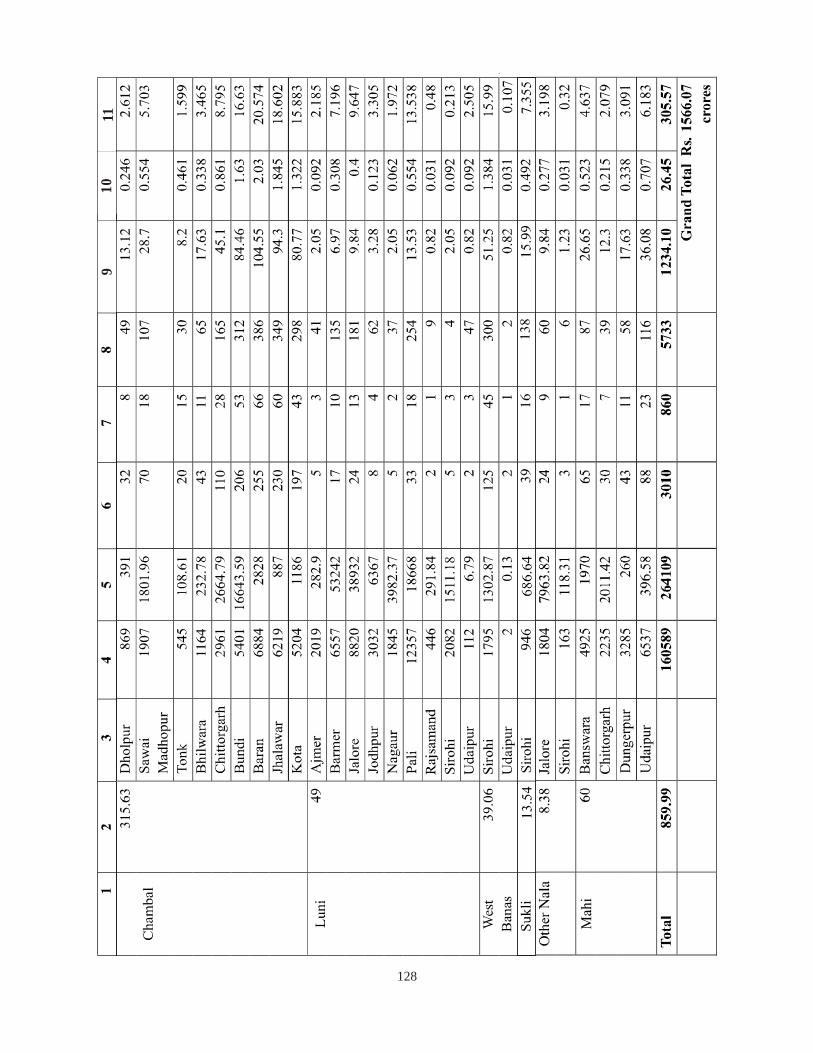
128
9 10
11

129
Fig.8.18.1 Areas identified for Artificial Recharge in Rajasthan
130
8.19 SIKKIM
Sikkim State, having an area of 7096 sq km. is constituted by four districts i.e.
1. South district
2. West district
3. East district
4. North district.
The state is drained by perennial Tista and Rangit rivers and their tributaries. The major river Tista, originatesfrom Tista-Khangse glacier drains the major part of the state. In spite of copious rainfall received to thetune of 2500 mm per annum extreme water scarcity is felt in the lean periods (January to April) especiallyin the rain shadow areas in parts of South,West and East districts. Although there is negligible groundwater development in the State of Sikkim, still there is scope for artificial recharge to ground water throughconstruction of contour trenches, slope terracing, nala bunds, gabions, check dams etc. may augment thedischarge from the springs, which are considered the lifeline in high altitude of Himalayas. Further toaugment the water availability in such sloping and high rainfall region, there is vast scope for roof toprainwater harvesting and rainwater harvesting in slopes through impermeable membrane.
8.19.1 IDENTIFICATION OF AREA
The proposed structures through rain water harvesting may act both for ground water replenishment andconservation and are generally adopted in this hilly State to provide – assured water supply during non-rainy seasons, and to provide sustainability to springs whose discharge reduces considerably during nonrainy season.
The State is dotted with number of springs which are mainly structurally controlled. These springs can bedeveloped for providing water. The spring water is transported under gravity for drinking water supply andirrigation. In order to provide sustainability of water supply and availability various recharge and conservationstructures in the feasible areas at higher elevation (Fig-8.19.1). The area identified for artificial recharge isabout 500 sq.km and volume of unsaturated zone available for recharge is 1000 MCM.
8.19.2 SOURCE WATER AVAILABILITY
Volume of unsaturated zone available for recharge is estimated to be 1000 MCM assuming post monsoonwater level as 5 m while volume of water required for recharge is estimated as 50 MCM. It is estimatedthat 277 MCM of water is available for ground water recharge.
8.19.3 RECHARGE AND CONSERVATION STRUCTURES AND COST ESTIMATE
Gabion structure, Check dam and Nala bund
In 1st or 2nd order streams to control siltation and also to harness surface water and augmentation ofrecharge in stream beds.
131
Subsurface dam/cement plug
In 1st or 2nd order streams to arrest base flow along the stream beds to enhance the water availability in thewatersheds.
8.19.3.1 Spring area development
To enhance the discharge of the springs, catchment area treatment or spring shed development withconstruction of contour trench, staggered contour trench, contour bund, slope terracing structures arehighly beneficial in such hilly and sloping terrain.
8.19.3.2 Roof top rain water harvesting and rain water harvesting along landscape
Rain water may be harvested directly through roofs and the accumulated water may be conserved for dayto day use. Since the state receives considerable amount of rainfall, such structures may be highly usefulespecially during the non-rainy months. Similarly ample quantity of rainwater can be harvested alonglandscape utilizing impermeable membrane (Polythene sheet etc.).
A plan for development and augmentation of ground water resources in the state is envisaged and it iscontemplated that 1400 springs development, 5000 roof top rain water harvesting structures, 325 nos.cement plugs and subsurface dykes, and 180 check dams/ gabion structures/nala bunds may be constructedin the state which would harness 277 MCM of water and would require a fund of Rs. 67.33 crores forconstruction purposes (table-8.19.1).
Table – 8.19.1 Rainwater Harvesting Structures and Cost Estimate in Sikkim
Type of structure No. of structure
Unit Cost Total cost Total volume of water harvested (MCM)
Life of structure
(in years) Spring Development with catchment area treatment
1400 3.0 4200.00 7.71 20
Gabions(G), Check dam (CD), Nala bund(NB)
180 4.0 720.00 10.00 G-5 CD-10
NB-10Cement plug,Subsurface Dam / Dyke
325 1.5 487.50 65.00 20
Roof top rain water harvesting (Houses)
4750 0.020 950.00 176.70 20
Roof top rain water harvesting (Govt. & Institutional)
250 1.5 375.00 9.30 5
Total 6905 6732.50 276.71
(Rs. in lakhs) (Rs. in lakhs)
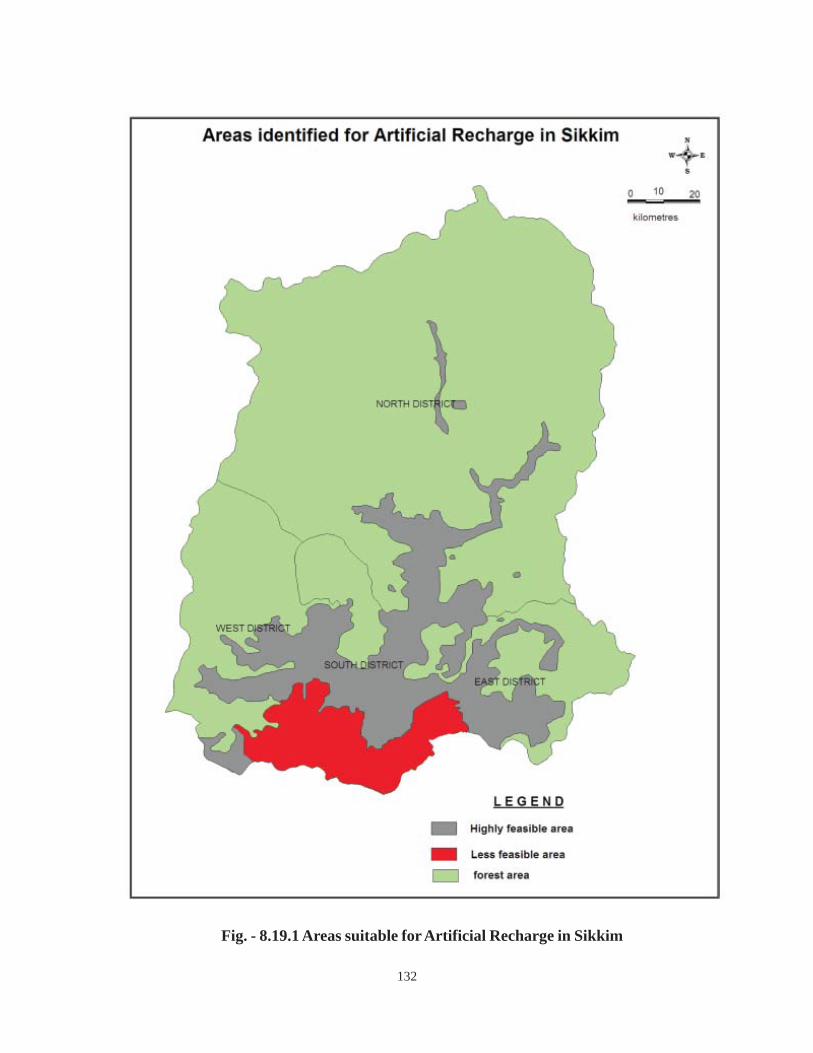
132
Fig. - 8.19.1 Areas suitable for Artificial Recharge in Sikkim
133
8.20 TAMIL NADU
Tamil Nadu spreads over an area of 130058 sq.km and has been divided into 30 districts excludingChennai urban district, which are further sub-divided into 384 blocks. The State of Tamil Nadu, along withthe enclaves constituting the Union Territory of Puducherry is characterized by diverse climatic, physiographicand hydrogeological conditions. The normal annual rainfall is of the order of 1008.1 mm (1901 – 1950).The contribution from south west monsoon is of the order of 525.1 mm (52%), while the contribution fromnorth east monsoon is of the order of 28% and non monsoon rainfall (January – May) is of the order of200.5 mm (20%). Development of ground water has already reached a critical stage in 175 blocks of thestate. Over exploitation of ground water in these areas has resulted in declining ground water levels,shortage in water supply, increased pumping lifts and consequent increase in power consumption.
The increased ground water development in pockets for the industrial use has resulted in ground watermining in such pockets warranting a long term remediation. The regional ground water development in thesedimentary aquifers of larger aerial extent for industrial and agricultural activity is on the rise in recentyears and the vulnerability of coastal aquifers for sea water ingress is noticed. The presence of pressurehead below 45 m in parts of Neyveli basin is the concern for the long-term ground water managementoptions.
The State and Central Agencies have already constructed artificial recharge structures under various schemes.Forest Department, Government of Tamil Nadu has constructed check dams in the high reaches ofreserved forest area presently. The State Government has also proposal to construct check dams tosupplement rain fed irrigation and water scarcity areas and subsurface dykes across Palar river. All theseinformation has been taken into consideration while arriving at the number of additional structures.
8.20.1 IDENTIFICATION OF THE AREA
The area characterized by depth to water level more than 3 m during the post monsoon period coupledwith declining long term trend (Decade) is considered as area requiring artificial recharge. The scope forartificial recharge denotes the surface water availability & the ability of the aquifer to take in the water.
The area characterizing, both declining trend and depth to water level in different categories have beenidentified for artificial recharge to ground water in Tamil Nadu. In addition, the localized pockets of intensiveagriculture and industrial activity are identified by state agencies. Few sedimentary aquifers of multi layeredand multi quality system also needs special intervention to augment the shallow and deeper aquifers.
The rain fed areas in major part of hard rocks are also having the potential for the localized ground wateraugmentation by water conservation structures to supplement the rain water with even limited groundwater resources for a shorter duration.
The drinking water sources from the riverbed, springs and ground water system also requires localizedstabilization of the water availability. Hence, a holistic approach in all the districts covered by sedimentaryand crystalline rocks require site-specific recharge programme.
The present master plan envisages augmentation of ground water resources from the surplus monsoon runoff as well as periodic floodwater and also local transporting of surplus water from the water logged andother specific pockets to needy places. Information on ongoing schemes under various state and centralsector programs is collected and the balance requirement of the number of structures as well as budget
134
requirement for artificial recharge is estimated. The unit cost of the recharge structures from the stateexperience is taken in to consideration for the report. The design of structures are also made more flexiblebased on the feedback from the various implementing agencies in the state and the performance evaluationby CGWB in select project sites, viz., Gangavalli block, Salem District.
8.20.2 SUBSURFACE STORE SPACE AND WATER REQUIREMENT
The thickness of unsaturated zone for each category of depth to water level is arrived and 3 m is subtractedto get the unsaturated thickness available for recharge in the regional level. Average specific yield of 1.5%& 10% has been assumed for crystalline & sedimentary formations respectively. The status of pressurehead in hard rocks and select sedimentary rocks as well as the moisture requirement of the rain fed area inshallow water table pockets also considered for each distinct on the basis of micro level studies and blocklevel hydro-morphological map prepared by Institute of Remote Sensing, Anna university for Govt. ofTamil Nadu. The ground water resources map of each district prepared in the Year 2003 as part of FreshWater Year and the recommended artificial recharge structures for area specific formations are alsoconsidered. The density of various structures and design are inferred by the integrated hydrogeological setup and the status of ground water development as well as the feasibility of structures with source water.
The field experiments have shown that an average recharge efficiency of 75% of each structure is onlypossible; accordingly, the surface water required for artificial recharge is computed by multiplying thevolume of water required for saturating the aquifer up to 3 m bgl by 1.33. Volume of available sub surfacestorage is of the order of 215937.187 MCM and surface water requirement is of 5982.64 MCM. Thesource water availability is of the order of 712.295 MCM and it is noticed that source water availability isadequate to saturate the aquifer up to 3 m bgl in all the districts.
8.20.3 SOURCE WATER AVAILABILITY
The surface water availability has been computed using improved ‘Strange curve’ for each watershed in aproject entitled “Identification of Recharge areas Using Remote Sensing and GIS in Tamil Nadu, taken upby the Institute of Remote Sensing, Anna University, Chennai and sponsored by the Dept. of RuralDevelopment, Govt. of Tamil Nadu and Tamil Nadu Water Supply and Drainage Board. The same hasbeen utilized in this report for determining the surface water availability for each district. The map of areaidentified for artificial recharge has been superimposed over the block map and the blocks covering thecritical area either full or in part has been identified and the harnessable surface water for each of the blockshave been summed up to get the surface water availability for each district. Based on the estimates, districtwise recharge plan is given in table-8.20.1 and the areas identified are shown in Fig. 8.20.1
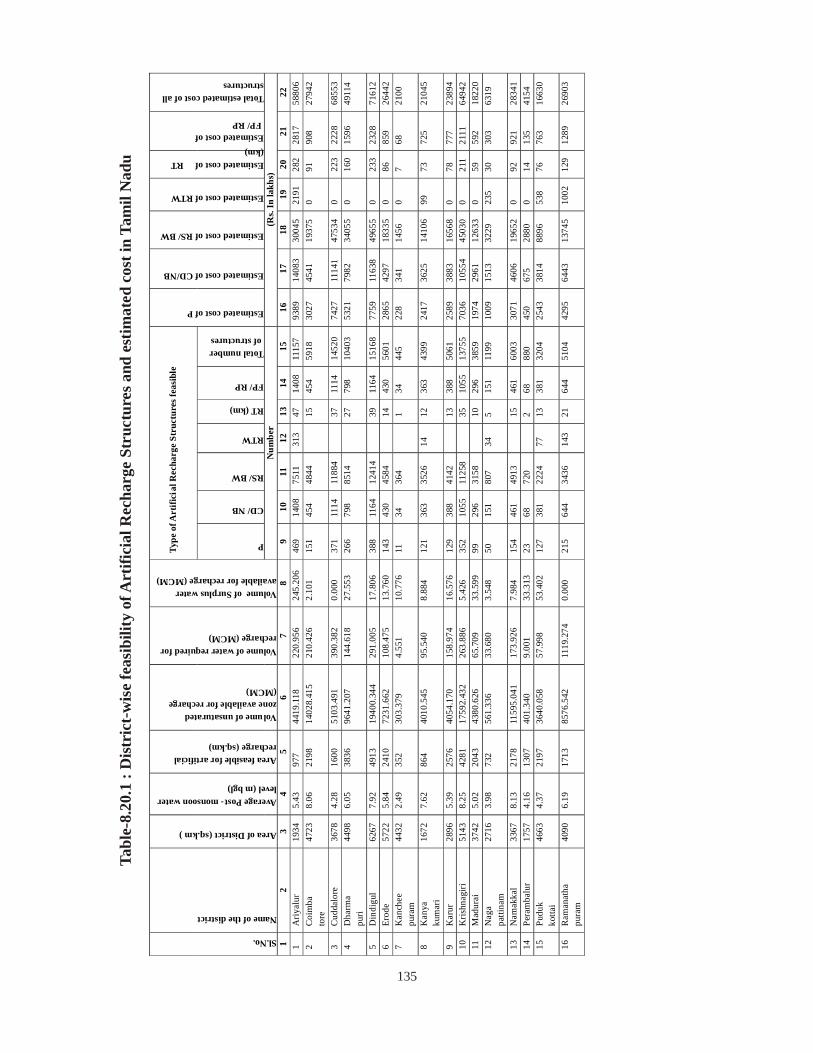
135
Type
of A
rtifi
cial
Rec
harg
e St
ruct
ures
feas
ible
P
CD/ NB
RS/ BW
RTW
RT (km)
FP/ RP
Total number of structures
Estimated cost of P
Estimated cost of CD/NB
Estimated cost of RS/ BW
Estimated cost of RTW
Estimated cost of RT (km) Estimated cost of FP/ RP
Total estimated cost of all structures
Sl.No.
Name of the district
Area of District (sq.km )
Average Post- monsoon water level (m bgl)
Area feasible for artificial recharge (sq.km)
Volume of unsaturated zone available for recharge (MCM)
Volume of water required for recharge (MCM)
Volume of Surplus water available for recharge (MCM)
Num
ber
(Rs.
In la
khs)
1
2 3
4 5
6 7
8 9
10
11
12
13
14
15
16
17
18
19
20
21
22
1 A
riyal
ur
1934
5.
43
977
4419
.118
22
0.95
6 24
5.20
6 46
9 14
08
7511
31
3 47
14
08
1115
7 93
89
1408
3 30
045
2191
28
2 28
17
5880
6 2
Coi
mba
to
re
4723
8.
06
2198
14
028.
415
210.
426
2.10
1 15
1 45
4 48
44
15
45
4 59
18
3027
45
41
1937
5 0
91
908
2794
2
3 C
udda
lore
36
78
4.28
16
00
5103
.491
39
0.38
2 0.
000
371
1114
11
884
37
11
14
1452
0 74
27
1114
1 47
534
0 22
3 22
28
6855
3 4
Dha
rma
puri
4498
6.
05
3836
96
41.2
07
144.
618
27.5
53
266
798
8514
27
798
1040
3 53
21
7982
34
055
0 16
0 15
96
4911
4
5 D
indi
gul
6267
7.
92
4913
19
400.
344
291.
005
17.8
06
388
1164
12
414
39
11
64
1516
8 77
59
1163
8 49
655
0 23
3 23
28
7161
2 6
Erod
e 57
22
5.84
24
10
7231
.662
10
8.47
5 13
.760
14
3 43
0 45
84
14
43
0 56
01
2865
42
97
1833
5 0
86
859
2644
2 7
Kan
chee
pu
ram
44
32
2.49
35
2 30
3.37
9 4.
551
10.7
76
11
34
364
1
34
445
228
341
1456
0
7 68
21
00
8 K
anya
ku
mar
i 16
72
7.62
86
4 40
10.5
45
95.5
40
8.88
4 12
1 36
3 35
26
14
12
363
4399
24
17
3625
14
106
99
73
725
2104
5
9 K
arur
28
96
5.39
25
76
4054
.170
15
8.97
4 16
.576
12
9 38
8 41
42
13
38
8 50
61
2589
38
83
1656
8 0
78
777
2389
4 10
K
rishn
agiri
51
43
8.25
42
81
1759
2.43
2 26
3.88
6 5.
426
352
1055
11
258
35
10
55
1375
5 70
36
1055
4 45
030
0 21
1 21
11
6494
2 11
M
adur
ai
3742
5.
02
2043
43
80.6
26
65.7
09
33.5
99
99
296
3158
10
296
3859
19
74
2961
12
633
0 59
59
2 18
220
12
Nag
a pa
ttina
m
2716
3.
98
732
561.
336
33.6
80
3.54
8 50
15
1 80
7 34
5
151
1199
10
09
1513
32
29
235
30
303
6319
13
Nam
akka
l 33
67
8.13
21
78
1159
5.04
1 17
3.92
6 7.
984
154
461
4913
15
461
6003
30
71
4606
19
652
0 92
92
1 28
341
14
Pera
mba
lur
1757
4.
16
1307
40
1.34
0 9.
001
33.3
13
23
68
720
2
68
880
450
675
2880
0
14
135
4154
15
Pu
duk
kotta
i 46
63
4.37
21
97
3640
.058
57
.998
53
.402
12
7 38
1 22
24
77
13
381
3204
25
43
3814
88
96
538
76
763
1663
0
16
Ram
anat
ha
pura
m
4090
6.
19
1713
85
76.5
42
1119
.274
0.
000
215
644
3436
14
3 21
64
4 51
04
4295
64
43
1374
5 10
02
129
1289
26
903
Tabl
e-8.
20.1
: D
istr
ict-
wis
e fe
asib
ility
of A
rtifi
cial
Rec
harg
e St
ruct
ures
and
est
imat
ed c
ost i
n Ta
mil
Nad
u

136
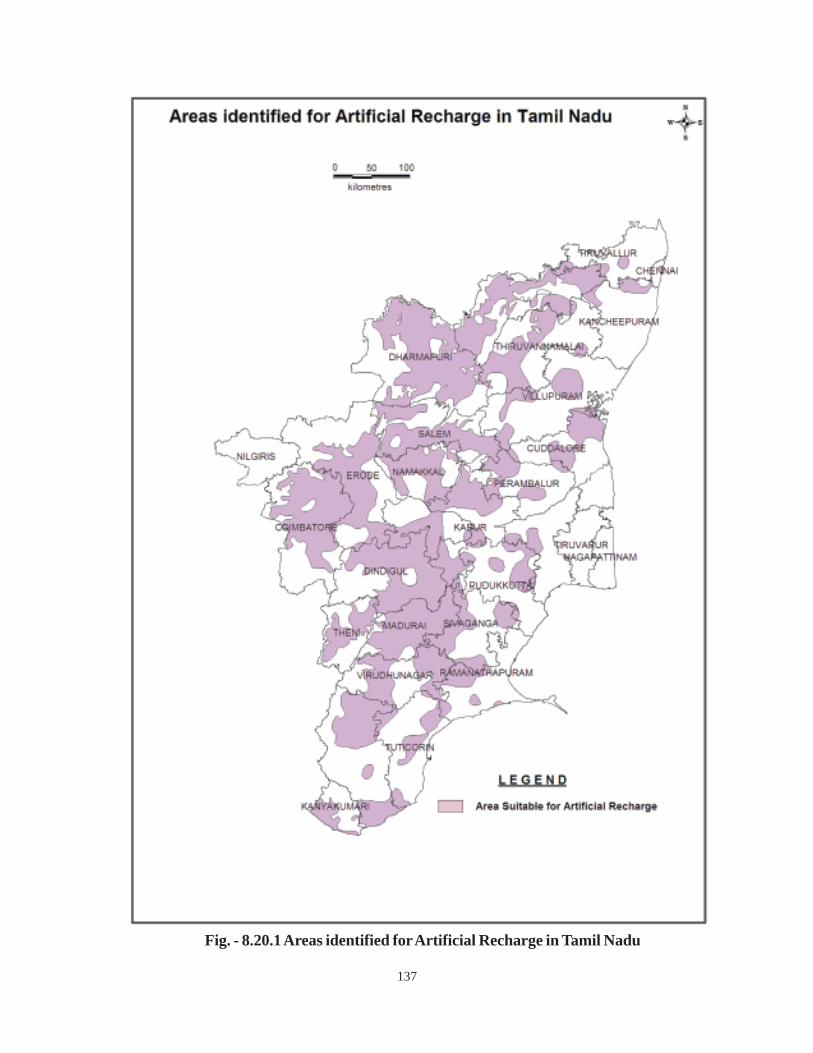
137
Fig. - 8.20.1 Areas identified for Artificial Recharge in Tamil Nadu
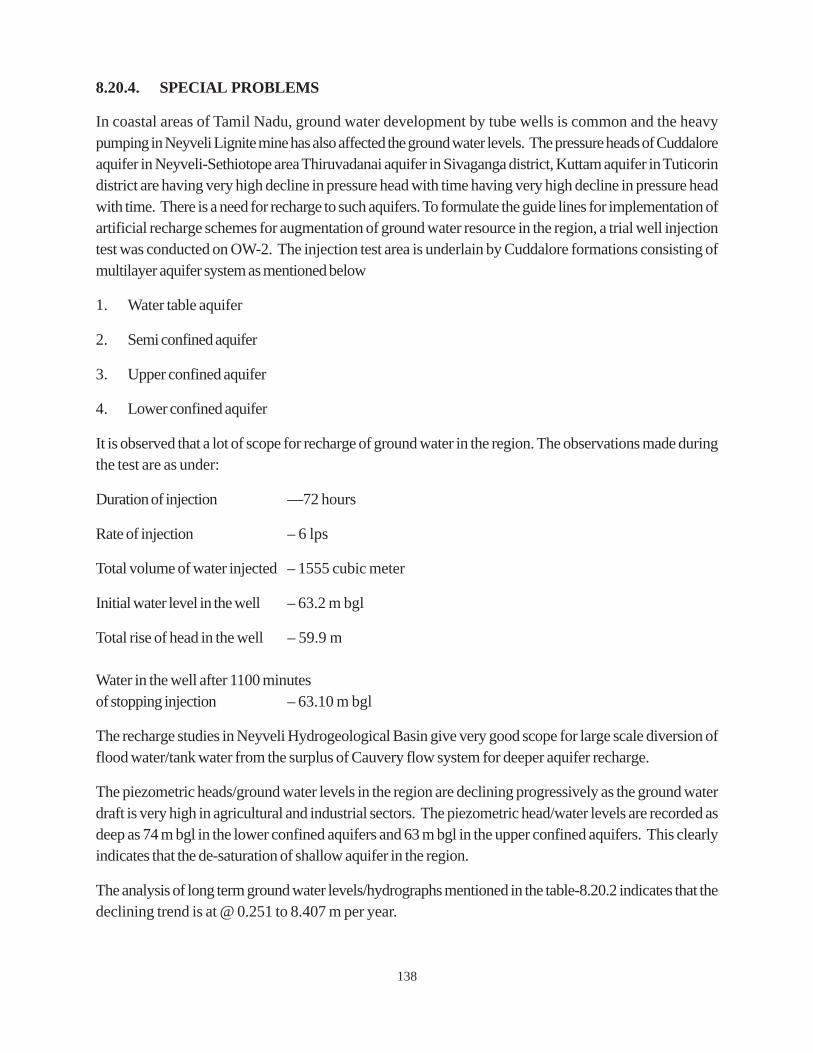
138
8.20.4. SPECIAL PROBLEMS
In coastal areas of Tamil Nadu, ground water development by tube wells is common and the heavypumping in Neyveli Lignite mine has also affected the ground water levels. The pressure heads of Cuddaloreaquifer in Neyveli-Sethiotope area Thiruvadanai aquifer in Sivaganga district, Kuttam aquifer in Tuticorindistrict are having very high decline in pressure head with time having very high decline in pressure headwith time. There is a need for recharge to such aquifers. To formulate the guide lines for implementation ofartificial recharge schemes for augmentation of ground water resource in the region, a trial well injectiontest was conducted on OW-2. The injection test area is underlain by Cuddalore formations consisting ofmultilayer aquifer system as mentioned below
1. Water table aquifer
2. Semi confined aquifer
3. Upper confined aquifer
4. Lower confined aquifer
It is observed that a lot of scope for recharge of ground water in the region. The observations made duringthe test are as under:
Duration of injection —72 hours
Rate of injection – 6 lps
Total volume of water injected – 1555 cubic meter
Initial water level in the well – 63.2 m bgl
Total rise of head in the well – 59.9 m
Water in the well after 1100 minutesof stopping injection – 63.10 m bgl
The recharge studies in Neyveli Hydrogeological Basin give very good scope for large scale diversion offlood water/tank water from the surplus of Cauvery flow system for deeper aquifer recharge.
The piezometric heads/ground water levels in the region are declining progressively as the ground waterdraft is very high in agricultural and industrial sectors. The piezometric head/water levels are recorded asdeep as 74 m bgl in the lower confined aquifers and 63 m bgl in the upper confined aquifers. This clearlyindicates that the de-saturation of shallow aquifer in the region.
The analysis of long term ground water levels/hydrographs mentioned in the table-8.20.2 indicates that thedeclining trend is at @ 0.251 to 8.407 m per year.

139
8.20.5 NEED FOR ARTIFICIAL RECHARGE TO GROUND WATER
• The ground water exploration reveals that the shallow aquifers up to 70 mbgl become desaturateddue to high ground water development in the region by number of tube wells for both agricultural aswell as Industrial uses.
• The decline of piezometric head with space and time in the region is monitored and deeper aquifer isnecessitating the need of artificial recharge of ground water.
• In view of the future ground water situation along the coast, creation of an artificial fresh ground waterbarrier is essential to arrest the sea water intrusion which can be created with the surplus run off/floodwater from Gadilam River or Veeranam and Perumal Eri tanks in monsoon periods.
• The shallow desaturated aquifer and the deep confined aquifers require artificial recharge with expertisefrom national and international institutions like PWD, Govt. of Tamil Nadu, CGWB, Govt. of Indiaand BRGM, France etc.
As a part of study, well field consisting of three tube wells have been constructed at Kil Kavarapalayam,Ariyalur district. The details of wells are furnished in the table- 8.20.3.
Table-8.20.2. Long term Trend of Ground Water levels around Neyveli area, Tamil Nadu
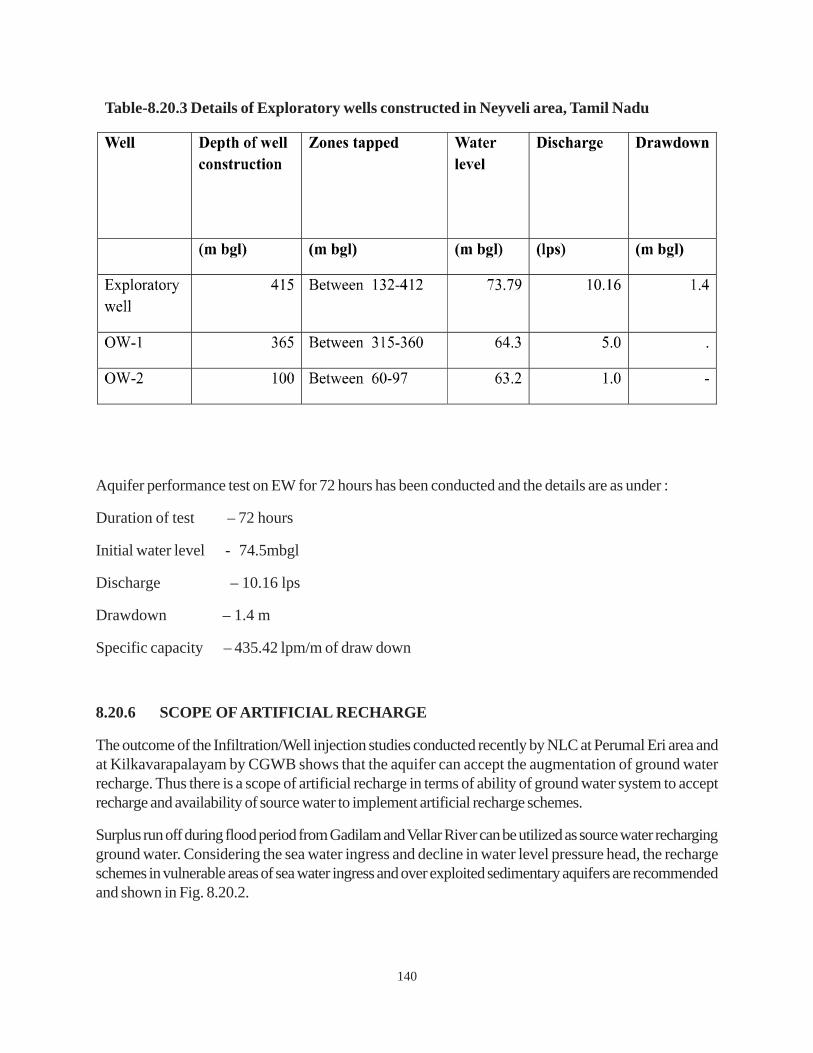
140
Table-8.20.3 Details of Exploratory wells constructed in Neyveli area, Tamil Nadu
Aquifer performance test on EW for 72 hours has been conducted and the details are as under :
Duration of test – 72 hours
Initial water level - 74.5mbgl
Discharge – 10.16 lps
Drawdown – 1.4 m
Specific capacity – 435.42 lpm/m of draw down
8.20.6 SCOPE OF ARTIFICIAL RECHARGE
The outcome of the Infiltration/Well injection studies conducted recently by NLC at Perumal Eri area andat Kilkavarapalayam by CGWB shows that the aquifer can accept the augmentation of ground waterrecharge. Thus there is a scope of artificial recharge in terms of ability of ground water system to acceptrecharge and availability of source water to implement artificial recharge schemes.
Surplus run off during flood period from Gadilam and Vellar River can be utilized as source water rechargingground water. Considering the sea water ingress and decline in water level pressure head, the rechargeschemes in vulnerable areas of sea water ingress and over exploited sedimentary aquifers are recommendedand shown in Fig. 8.20.2.
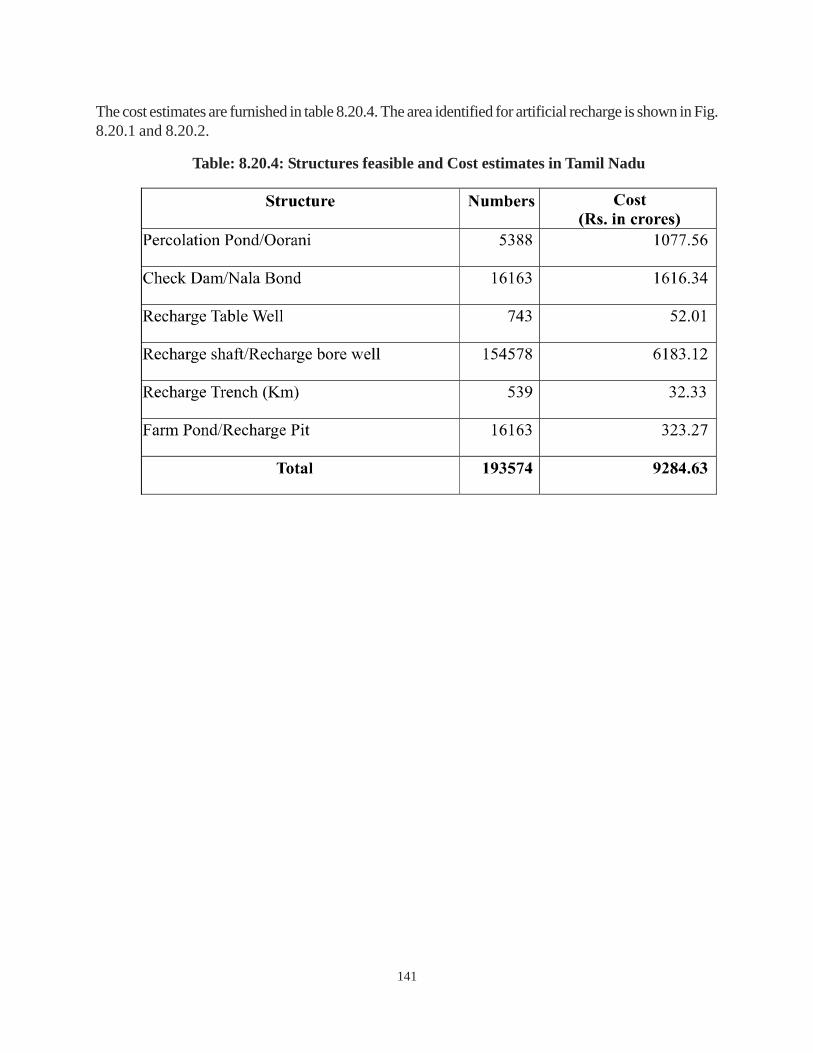
141
The cost estimates are furnished in table 8.20.4. The area identified for artificial recharge is shown in Fig.8.20.1 and 8.20.2.
Table: 8.20.4: Structures feasible and Cost estimates in Tamil Nadu
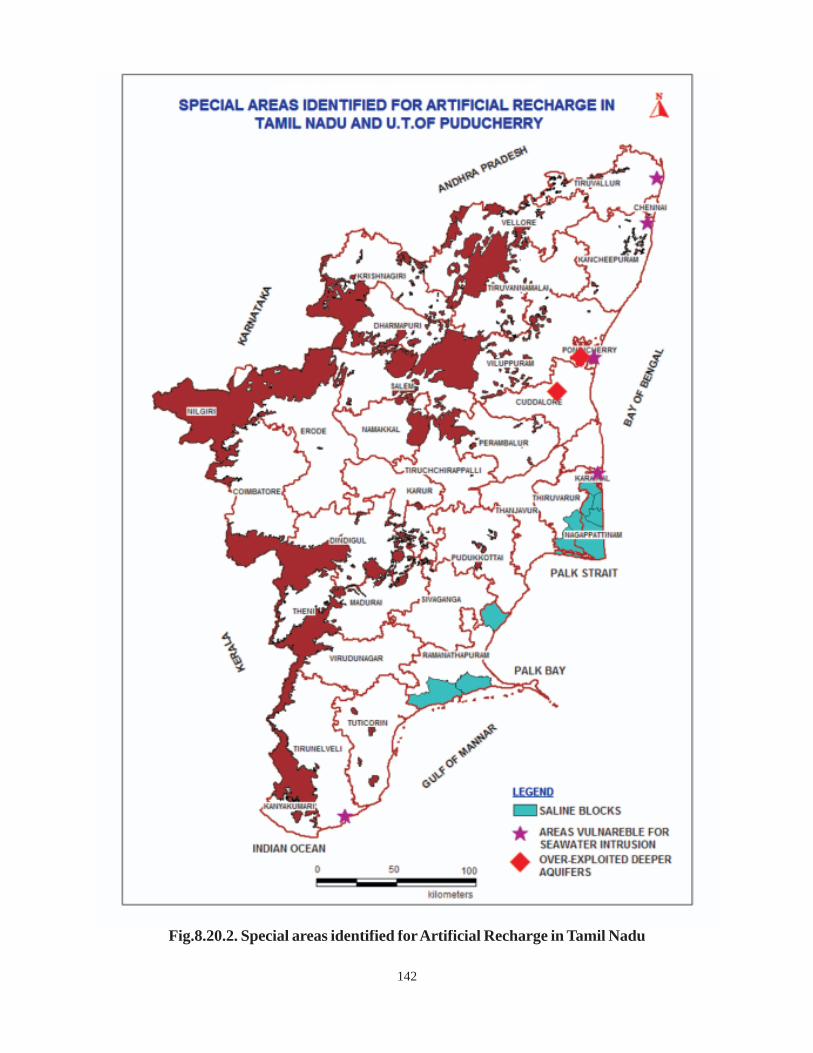
142
Fig.8.20.2. Special areas identified for Artificial Recharge in Tamil Nadu
143
8.21 UTTAR PRADESH
The State of Uttar Pradesh forms a part of vast Gangetic Alluvial Plain covering an area of 2,40,928 sq.km. The state is a part Ganga basin comprising of Yamuna, Ram Ganga, Gomti, Ghaghra and son subbasins. The alluvial plains and southern rocky terrain are main water bearing formations from point of viewof ground water availability. In view of relative importance of this valuable resource it becomes imperativeto adopt sound and scientific management of groundwater resources through formulation of district wiseRecharge Plan for the state of Uttar Pradesh which should address the broad array of problems like overdraft, pollution, poor quality and decline in ground water levels that have adverse impact on environmentand natural conditions and should be a guiding tool for administrators and policy makers. Thus the mostimportant issue is to identify the critical areas and thereafter provide appropriate designs for effectingartificial recharge to groundwater. The Master Plan for artificial recharge is prepared considering thehydrogeological and hydrological data base.
8.21.1 IDENTIFICATION OF AREA
The area identified for artificial recharge in the state has been taken as basin wise and district wise fortechnical and administrative convenience. Uttar Pradesh being a large state, the depth to water level mapprepared incorporates lot of extrapolation to the areas which are not properly represented by monitoringstations, resulting in inclusion of some of the unworthy area as suitable for recharge and rejection of worthyareas at places. In addition to above mentioned problem, due to the fact that administrative block wiseground water resource information is available and for administrative convenience the areas suitable forrecharge have been considered block wise. The block wise average depth to water levels and water leveltrends for last 10 years has been calculated for all the blocks of UP based on the data obtained fromexisting monitoring stations of State Ground Water Department, UP. In the Ground Water ResourceEstimation report other relevant information such as block wise area, normal annual rainfall, specific yieldvalues, annual recharge, ground water draft, stage of development etc. are also included. The district wiseannual normal rainfall has been taken from Statistical Hand Book of 2008. For identifying areas suitablefor artificial recharge, the feasibility of different ground water assessment units (administrative blocks) forartificial recharge has been considered. A total of 335 blocks falling in 52 districts covering 110783.14sq.km. area, (103621.93 sq. km for alluvial area and 7161.21 sq.km for hard rock area), have beenidentified as feasible for artificial recharge. Areas suitable for artificial recharge are shown in Fig.8.21.1
8.21.2 SUB-SURFACE STORAGE SPACE AND WATER REQUIREMENT
The thickness of available unsaturated zone (below 3 m bgl) of above four categories was estimated byconsidering the different ranges of water levels. The difference between average depth to water level in theblock and 3 m was calculated to arrive at thickness of effective unsaturated zone. The total volume ofunsaturated strata was calculated by multiplying unsaturated thickness of different range by area of the unit.This volume was then multiplied by average specific yield of 10% (0.1as fraction) for alluvium and 2%(0.02) for hard rock area to arrive at the net amount of water required which is to be recharged by artificialmethods to saturate the aquifer up to 3 m bgl. Thus net amount of water required to be recharged byartificial methods for the feasible areas of the state was calculated as 57831 MCM.

144
8.21.2.1 Surface Water Requirement
After assessing the actual volume of water was required for saturating the vadose zone, the actual requirementof source water. Based on the experience gained in the field experiments, an average recharge efficiency of75% of the individual structure is only possible. Therefore, to arrive at the total volume of actual sourcewater required at the surface, the volume of water required for artificial recharge was calculated andmultiplied by 1.33 (i.e. reciprocal of 0.75) . The district wise requirement of water has been given in table-8.21.1. The total requirement of actual surface water is thus estimated as 76915 MCM.
8.21.2.2 Source Water Availability
For the state of UP the precise data on surface water utilization was not available. Hence to calculatesurface water availability, 30% of monsoon rainfall has been considered as average monsoon run off and50% of which is considered as non-committed water availability. The 30% of monsoon rainfall has beentaken considering the erratic and localized rainfall pattern. Ensuring sufficient allocation for existing andongoing surface water conservation projects 40% of the non-committed surface water has been consideredfor preparing the present district recharge plan. Non committed surface water availability for recharge inGanga basins given in table 8.21.2.
8.21.3 RECHARGE STRUCTURES AND COST ESTIMATES
Based on Annual Gross Storage Capacity of Artificial Recharge and Water Conservation Structures andsurface water availability the number of structures has been arrived at. The cost of the percolation tanks,recharge shaft/dug well/ tube well recharge has been taken as Rs. 20 lakhs and Rs. 1.0 lakhs respectively,as per the earlier Master plan-2002 and also as per the cost estimates of Minor Irrigation and GroundWater Departments of Govt. of UP, in their ongoing schemes/ projects. The cost of check dam has beentaken as per the estimates of Minor Irrigation in the ongoing demonstrative projects.
Regions of Uttar Pradesh
Area Suitable For Recharge/ Conservation (ha)
Ganga Basin Alluvium Hard Rock
Volume of rechargeable unsaturated zone
(MCM)
Surface waterrequired (1.33 * Volume
(MCM)
10362193 716121 57831 76915
Table-8.21.2 Basin wise Non-committed Surface Water availability for recharge/ conservation in Uttar Pradesh
Table-8.21.1. Total requirement of actual surface water in Uttar Pradesh
Basin Area(ha) Non committed surface water availability for recharge/conservation
(MCM)
5185
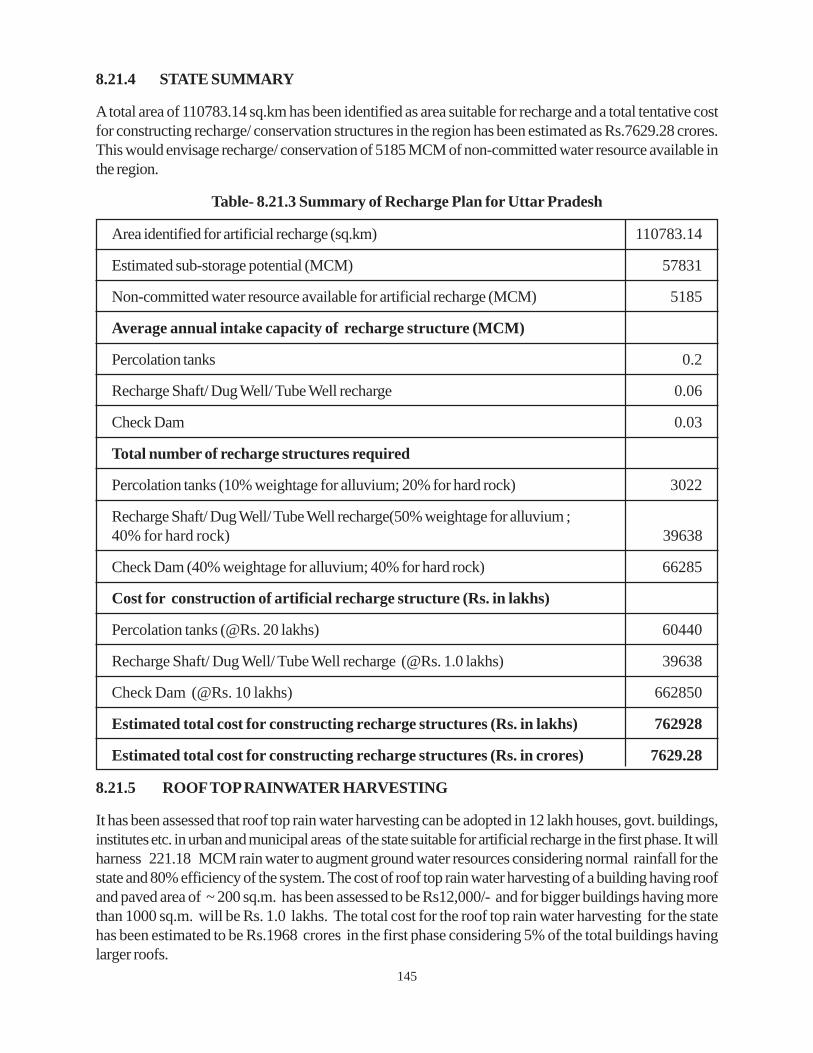
145
8.21.4 STATE SUMMARY
A total area of 110783.14 sq.km has been identified as area suitable for recharge and a total tentative costfor constructing recharge/ conservation structures in the region has been estimated as Rs.7629.28 crores.This would envisage recharge/ conservation of 5185 MCM of non-committed water resource available inthe region.
Table- 8.21.3 Summary of Recharge Plan for Uttar Pradesh
Area identified for artificial recharge (sq.km) 110783.14
Estimated sub-storage potential (MCM) 57831
Non-committed water resource available for artificial recharge (MCM) 5185
Average annual intake capacity of recharge structure (MCM)
Percolation tanks 0.2
Recharge Shaft/ Dug Well/ Tube Well recharge 0.06
Check Dam 0.03
Total number of recharge structures required
Percolation tanks (10% weightage for alluvium; 20% for hard rock) 3022
Recharge Shaft/ Dug Well/ Tube Well recharge(50% weightage for alluvium ;40% for hard rock) 39638
Check Dam (40% weightage for alluvium; 40% for hard rock) 66285
Cost for construction of artificial recharge structure (Rs. in lakhs)
Percolation tanks (@Rs. 20 lakhs) 60440
Recharge Shaft/ Dug Well/ Tube Well recharge (@Rs. 1.0 lakhs) 39638
Check Dam (@Rs. 10 lakhs) 662850
Estimated total cost for constructing recharge structures (Rs. in lakhs) 762928
Estimated total cost for constructing recharge structures (Rs. in crores) 7629.28
8.21.5 ROOF TOP RAINWATER HARVESTING
It has been assessed that roof top rain water harvesting can be adopted in 12 lakh houses, govt. buildings,institutes etc. in urban and municipal areas of the state suitable for artificial recharge in the first phase. It willharness 221.18 MCM rain water to augment ground water resources considering normal rainfall for thestate and 80% efficiency of the system. The cost of roof top rain water harvesting of a building having roofand paved area of ~ 200 sq.m. has been assessed to be Rs12,000/- and for bigger buildings having morethan 1000 sq.m. will be Rs. 1.0 lakhs. The total cost for the roof top rain water harvesting for the statehas been estimated to be Rs.1968 crores in the first phase considering 5% of the total buildings havinglarger roofs.
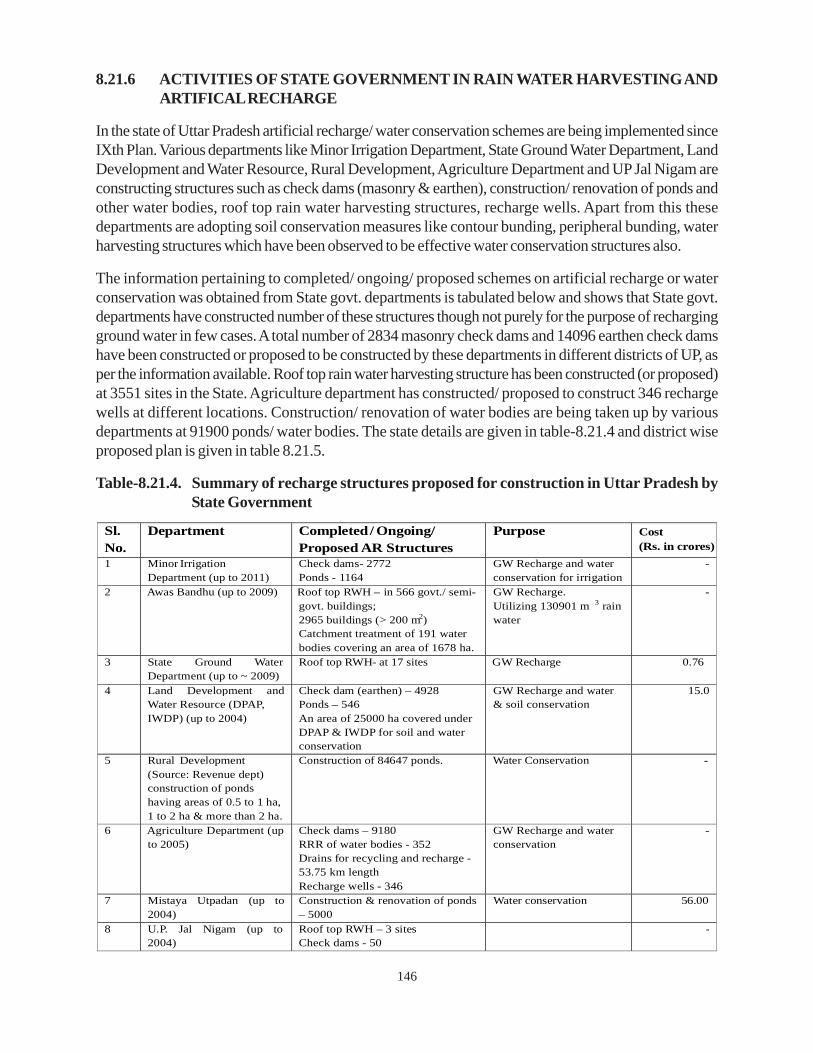
146
8.21.6 ACTIVITIES OF STATE GOVERNMENT IN RAIN WATER HARVESTING ANDARTIFICAL RECHARGE
In the state of Uttar Pradesh artificial recharge/ water conservation schemes are being implemented sinceIXth Plan. Various departments like Minor Irrigation Department, State Ground Water Department, LandDevelopment and Water Resource, Rural Development, Agriculture Department and UP Jal Nigam areconstructing structures such as check dams (masonry & earthen), construction/ renovation of ponds andother water bodies, roof top rain water harvesting structures, recharge wells. Apart from this thesedepartments are adopting soil conservation measures like contour bunding, peripheral bunding, waterharvesting structures which have been observed to be effective water conservation structures also.
The information pertaining to completed/ ongoing/ proposed schemes on artificial recharge or waterconservation was obtained from State govt. departments is tabulated below and shows that State govt.departments have constructed number of these structures though not purely for the purpose of rechargingground water in few cases. A total number of 2834 masonry check dams and 14096 earthen check damshave been constructed or proposed to be constructed by these departments in different districts of UP, asper the information available. Roof top rain water harvesting structure has been constructed (or proposed)at 3551 sites in the State. Agriculture department has constructed/ proposed to construct 346 rechargewells at different locations. Construction/ renovation of water bodies are being taken up by variousdepartments at 91900 ponds/ water bodies. The state details are given in table-8.21.4 and district wiseproposed plan is given in table 8.21.5.
Table-8.21.4. Summary of recharge structures proposed for construction in Uttar Pradesh byState Government
Sl. No.
Department Completed/
Ongoing/Proposed AR Structures
Purpose Cost(Rs. in crores)
1 Minor IrrigationDepartment (up to 2011)
Check dams- 2772 Ponds - 1164
GW Recharge and water conservation for irrigation
-
2 Awas Bandhu (up to 2009) Roof top RWH – in 566 govt./ semi-govt. buildings; 2965 buildings (> 200 m2) Catchment treatment of 191 water bodies covering an area of 1678 ha.
GW Recharge. Utilizing 130901 m 3 rain water
-
3 State Ground WaterDepartment (up to ~ 2009)
Roof top RWH- at 17 sites GW Recharge 0.76
4 Land Development andWater Resource (DPAP, IWDP) (up to 2004)
Check dam (earthen) – 4928 Ponds – 546 An area of 25000 ha covered under DPAP & IWDP for soil and water conservation
GW Recharge and water & soil conservation
15.0
5 Rural Development(Source: Revenue dept) construction of ponds having areas of 0.5 to 1 ha, 1 to 2 ha & more than 2 ha.
Construction of 84647 ponds. Water Conservation -
6 Agriculture Department (upto 2005)
Check dams – 9180 RRR of water bodies - 352 Drains for recycling and recharge - 53.75 km length Recharge wells - 346
GW Recharge and water conservation
-
7 Mistaya Utpadan (up to2004)
Construction & renovation of ponds – 5000
Water conservation 56.00
8 U.P. Jal Nigam (up to2004)
Roof top RWH – 3 sites Check dams - 50
-
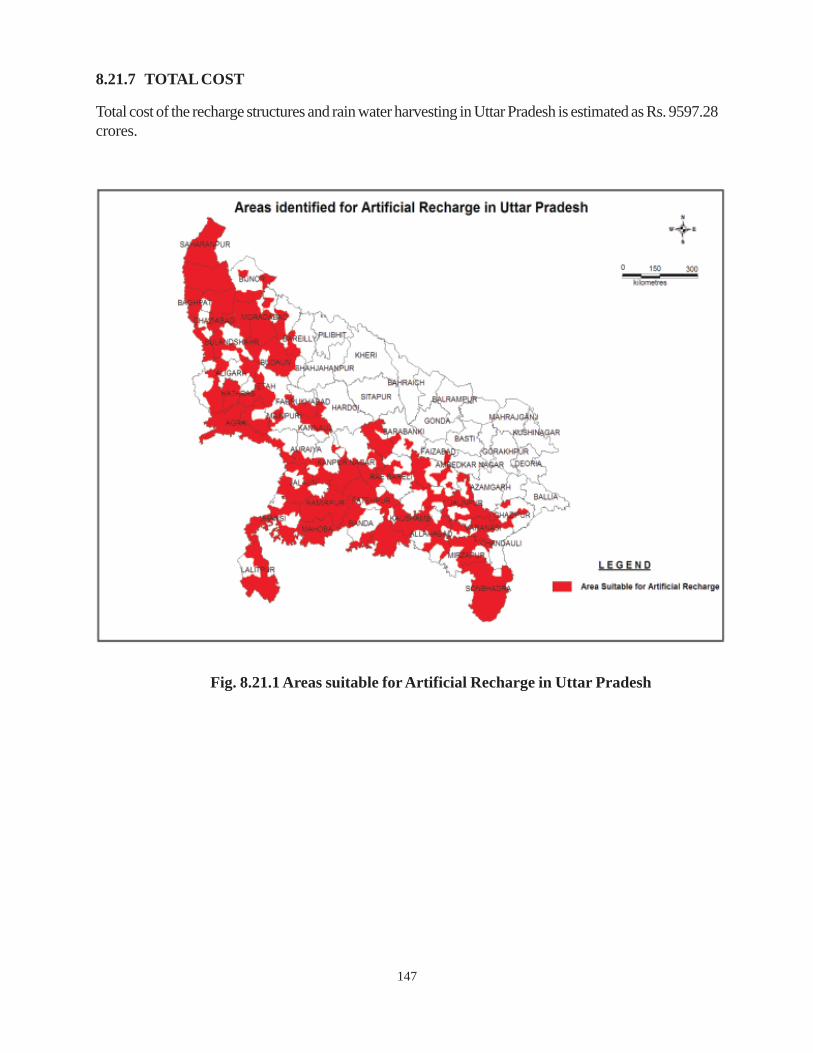
147
8.21.7 TOTAL COST
Total cost of the recharge structures and rain water harvesting in Uttar Pradesh is estimated as Rs. 9597.28crores.
Fig. 8.21.1 Areas suitable for Artificial Recharge in Uttar Pradesh
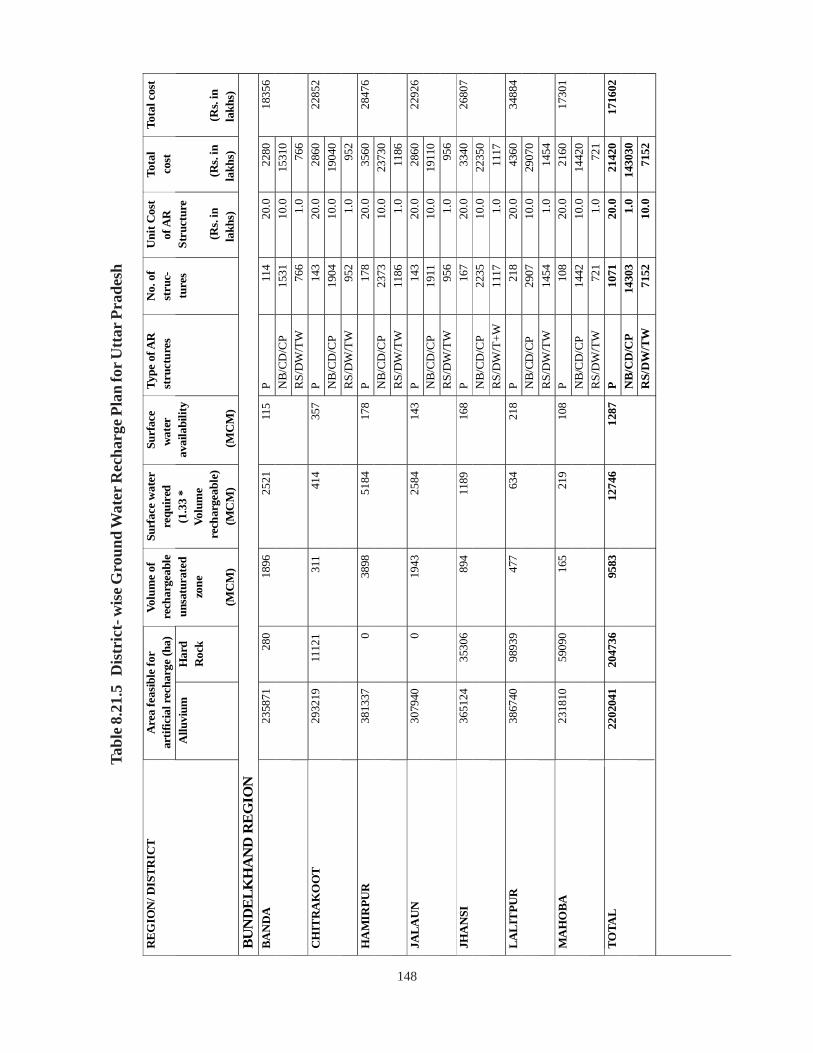
148
Tabl
e 8.2
1.5
Dis
tric
t- w
ise G
roun
d W
ater
Rec
harg
e Pla
n fo
r Utt
ar P
rade
sh
BUN
DE
LKH
AN
D R
EG
ION
Are
a fe
asib
le fo
r ar
tific
ial r
echa
rge
(ha)
R
EGIO
N/ D
IST
RIC
T
Allu
vium
H
ard
Roc
k
Volu
me
of
rech
arge
able
un
satu
rate
d zo
ne
(M
CM
)
Surf
ace
wat
er
requ
ired
(1
.33
* Vo
lum
e re
char
geab
le)
(MC
M)
Surf
ace
wat
er
avai
labi
lity
(M
CM
)
Type
of A
R
stru
ctur
es
No.
of
stru
c-tu
res
Uni
t Cos
t of
AR
St
ruct
ure
(R
s. in
la
khs)
Tota
l co
st
(R
s. in
lakh
s)
Tota
l cos
t
(Rs.
in
lakh
s)
P 11
4 20
.0
2280
N
B/C
D/C
P 15
31
10.0
15
310
BAN
DA
2358
71
280
1896
2521
115
RS/
DW
/TW
76
6 1.
0 76
6
1835
6 P
143
20.0
28
60
NB
/CD
/CP
1904
10
.0
1904
0 C
HIT
RA
KO
OT
2932
19
1112
1
311
414
357
RS/
DW
/TW
95
2 1.
0 95
2
2285
2 P
178
20.0
35
60
NB
/CD
/CP
2373
10
.0
2373
0 H
AM
IRPU
R
3813
37
0
3898
5184
178
RS/
DW
/TW
11
86
1.0
1186
2847
6 P
143
20.0
28
60
NB
/CD
/CP
1911
10
.0
1911
0 JA
LA
UN
3079
40
0
1943
2584
143
RS/
DW
/TW
95
6 1.
0 95
6
2292
6 P
167
20.0
33
40
NB
/CD
/CP
2235
10
.0
2235
0 JH
AN
SI
3651
24
3530
6
894
1189
168
RS/
DW
/T+W
11
17
1.0
1117
2680
7 P
218
20.0
43
60
NB
/CD
/CP
2907
10
.0
2907
0 L
AL
ITPU
R
3867
40
9893
9
477
634
218
RS/
DW
/TW
14
54
1.0
1454
3488
4 P
108
20.0
21
60
NB
/CD
/CP
1442
10
.0
1442
0 M
AH
OB
A
2318
10
5909
0
165
219
108
RS/
DW
/TW
72
1 1.
0 72
1
1730
1 P
1071
20
.0
2142
0 N
B/C
D/C
P 14
303
1.0
1430
30
TOTA
L
2202
041
2047
36
9583
1274
6
1287
R
S/D
W/T
W
7152
10
.0
7152
1716
02

149
Are
a fe
asib
le fo
r ar
tific
ial r
echa
rge
(ha)
R
EG
ION
/ DIS
TR
ICT
Allu
vium
H
ard
Roc
k
Volu
me
of
rech
arge
able
un
satu
rate
d zo
ne
(M
CM
)
Surf
ace
wat
er
requ
ired
(1
.33
* Vo
lum
e re
char
geab
le)
(MC
M)
Surf
ace
wat
er
avai
labi
lity
(M
CM
)
Type
of A
R
stru
ctur
es
No.
of
stru
c-tu
res
Uni
t Cos
t of
AR
St
ruct
ure
(R
s. in
la
khs)
Tota
l co
st
(R
s. in
lakh
s)
Tota
l cos
t
(Rs.
in
lakh
s)
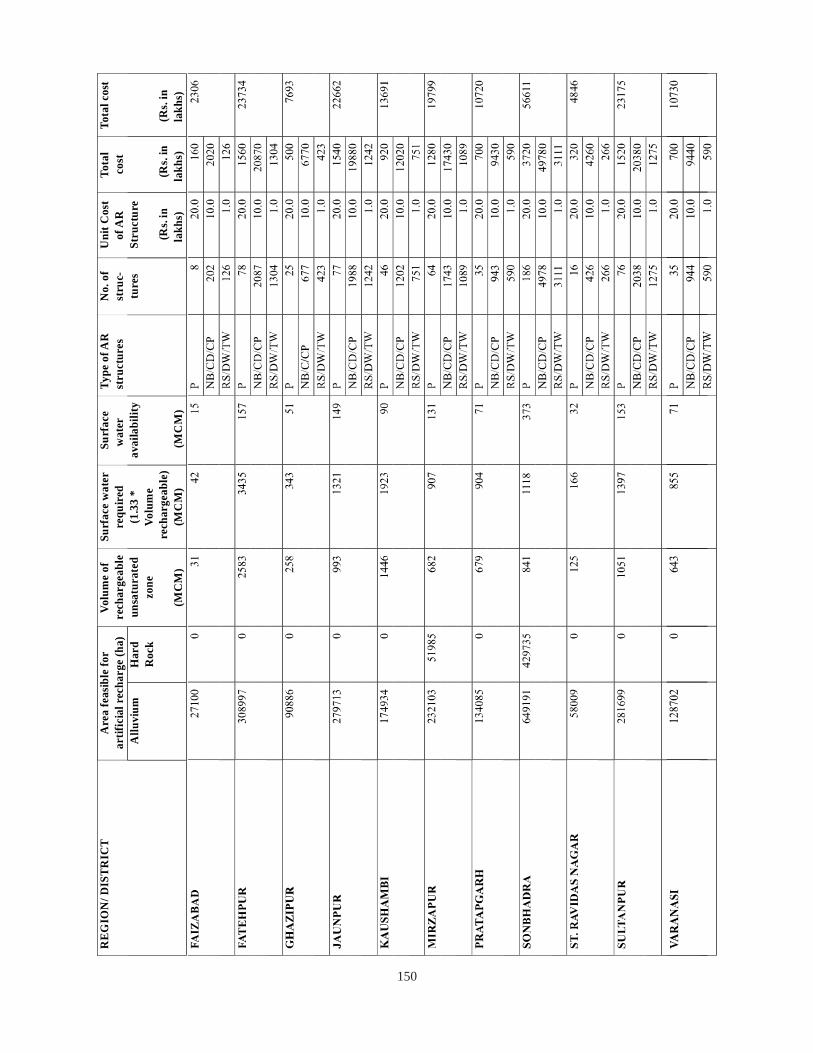
150
Are
a fe
asib
le fo
r ar
tific
ial r
echa
rge
(ha)
R
EG
ION
/ DIS
TR
ICT
Allu
vium
H
ard
Roc
k
Volu
me
of
rech
arge
able
un
satu
rate
d zo
ne
(M
CM
)
Surf
ace
wat
er
requ
ired
(1
.33
* Vo
lum
e re
char
geab
le)
(MC
M)
Surf
ace
wat
er
avai
labi
lity
(M
CM
)
Type
of A
R
stru
ctur
es
No.
of
stru
c-tu
res
Uni
t Cos
t of
AR
St
ruct
ure
(R
s. in
la
khs)
Tota
l co
st
(R
s. in
lakh
s)
Tota
l cos
t
(Rs.
in
lakh
s)
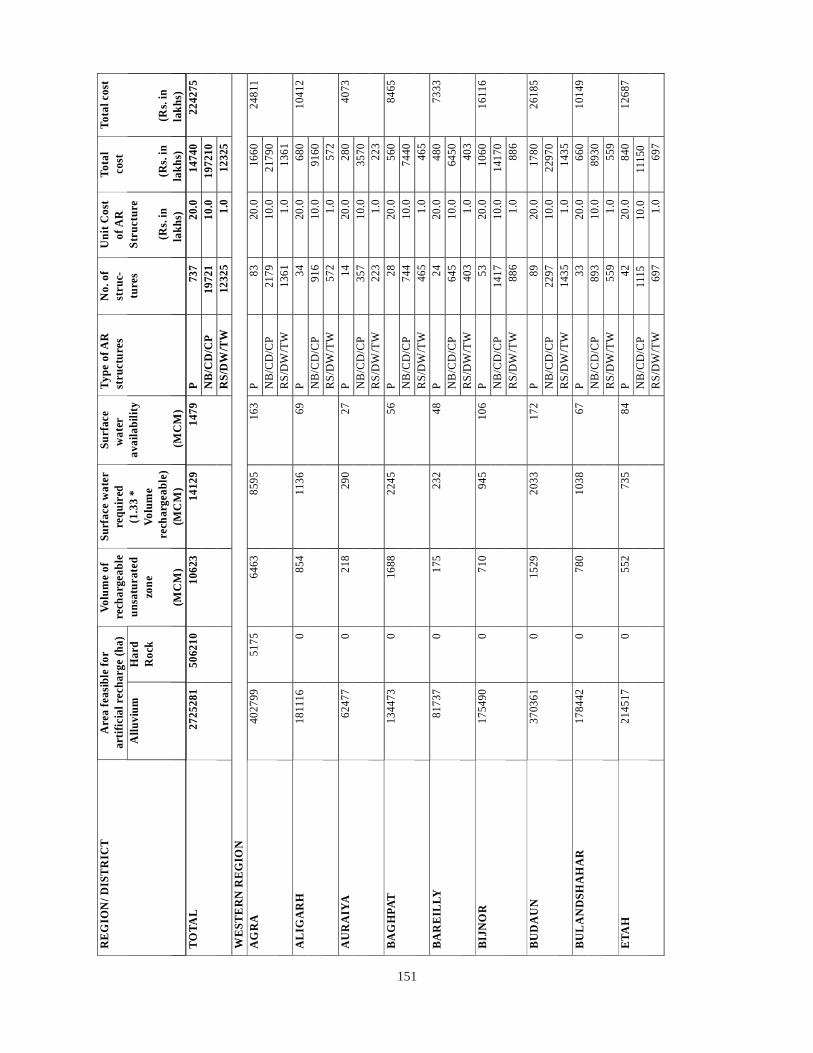
151
P73
720
.014
740
NB
/CD
/CP
1972
110
.019
7210
TOTA
L
2725
281
5062
10
1062
3
1412
9
1479
R
S/D
W/T
W12
325
1.0
1232
5
2242
75
WE
STE
RN
RE
GIO
N
P83
20.0
1660
NB
/CD
/CP
2179
10.0
2179
0A
GR
A
4027
99
5175
6463
8595
163
RS/
DW
/TW
1361
1.0
1361
2481
1 P
3420
.068
0N
B/C
D/C
P91
610
.091
60A
LIG
AR
H
1811
16
0
854
1136
69
RS/
DW
/TW
572
1.0
572
1041
2 P
1420
.028
0N
B/C
D/C
P35
710
.035
70A
UR
AIY
A
6247
7
0
218
290
27
RS/
DW
/TW
223
1.0
223
4073
P
2820
.056
0N
B/C
D/C
P74
410
.074
40B
AG
HPA
T
1344
73
0
1688
2245
56
RS/
DW
/TW
465
1.0
465
8465
P
2420
.048
0N
B/C
D/C
P64
510
.064
50B
AR
EIL
LY
8173
7
0
175
232
48
RS/
DW
/TW
403
1.0
403
7333
P53
20.0
1060
NB
/CD
/CP
1417
10.0
1417
0B
IJN
OR
1754
90
0
710
945
106
RS/
DW
/TW
886
1.0
886
1611
6
P89
20.0
1780
NB
/CD
/CP
2297
10.0
2297
0B
UD
AU
N
3703
61
0
1529
2033
172
RS/
DW
/TW
1435
1.0
1435
2618
5 P
3320
.066
0N
B/C
D/C
P89
310
.089
30B
UL
AN
DSH
AH
AR
1784
42
0
780
1038
67
RS/
DW
/TW
559
1.0
559
1014
9 P
4220
.084
0N
B/C
D/C
P11
1510
.011
150
ETA
H
2145
17
0
552
735
84
RS/
DW
/TW
697
1.0
697
1268
7
Are
a fe
asib
le fo
r ar
tific
ial r
echa
rge
(ha)
R
EG
ION
/ DIS
TR
ICT
Allu
vium
H
ard
Roc
k
Volu
me
of
rech
arge
able
un
satu
rate
d zo
ne
(M
CM
)
Surf
ace
wat
er
requ
ired
(1
.33
* Vo
lum
e re
char
geab
le)
(MC
M)
Surf
ace
wat
er
avai
labi
lity
(M
CM
)
Type
of A
R
stru
ctur
es
No.
of
stru
c-tu
res
Uni
t Cos
t of
AR
St
ruct
ure
(R
s. in
la
khs)
Tota
l co
st
(R
s. in
lakh
s)
Tota
l cos
t
(Rs.
in
lakh
s)

152
P17
20.0
340
NB/
CD
/CP
451
10.0
4510
ETA
WA
H
7909
5
0
2006
2668
34
RS/
DW
/TW
282
1.0
282
5132
P
1920
.038
0N
B/C
D/C
P50
910
.050
90FA
RR
UK
HA
BA
D
8734
5
0
965
1284
38
RS/
DW
/TW
318
1.0
318
5788
P
3920
.078
0N
B/C
D/C
P10
8110
.010
810
FIR
OZ
AB
AD
1999
05
0
788
1048
81
RS/
DW
/TW
676
1.0
676
1226
6 P
2320
.046
0N
B/C
D/C
P60
110
.060
10G
B N
AG
AR
1140
79
0
348
463
45
RS/
DW
/TW
376
1.0
376
6846
P
3020
.060
0N
B/C
D/C
P79
210
.079
20G
HA
ZIA
BAD
1501
49
0
779
1036
59
RS/
DW
/TW
495
1.0
495
9015
P
2320
.046
0N
B/C
D/C
P62
310
.062
30H
ATH
RA
S (M
AH
AM
AYA
NA
GA
R)
1232
44
0
1522
2024
47
RS/
DW
/TW
389
1.0
389
7079
P55
20.0
1100
NB
/CD
/CP
1473
10.0
1473
0J
P N
AG
AR
2114
12
0
1185
1575
110
RS/
DW
/TW
920
1.0
920
1675
0 P
2220
.044
0N
B/C
D/C
P58
210
.058
20K
AN
NA
UJ
9992
1
0
1074
1429
44
RS/
DW
/TW
364
1.0
364
6624
P
520
.010
0N
B/C
D/C
P12
410
.012
40K
ASH
I RA
M N
AG
AR
2388
2
0
100
133
9 R
S/D
W/T
W78
1.0
78
1418
P
1220
.024
0N
B/C
D/C
P32
510
.032
50M
AIN
PUR
I
6114
0
0
472
627
24
RS/
DW
/TW
203
1.0
203
3693
Are
a fe
asib
le fo
r ar
tific
ial r
echa
rge
(ha)
R
EGIO
N/ D
IST
RIC
T
Allu
vium
H
ard
Roc
k
Volu
me
of
rech
arge
able
un
satu
rate
d zo
ne
(M
CM
)
Surf
ace
wat
er
requ
ired
(1
.33
* Vo
lum
e re
char
geab
le)
(MC
M)
Surf
ace
wat
er
avai
labi
lity
(M
CM
)
Type
of A
R
stru
ctur
es
No.
of
stru
c-tu
res
Uni
t Cos
t of
AR
St
ruct
ure
(R
s. in
la
khs)
Tota
l co
st
(R
s. in
lakh
s)
Tota
l cos
t
(Rs.
in
lakh
s)
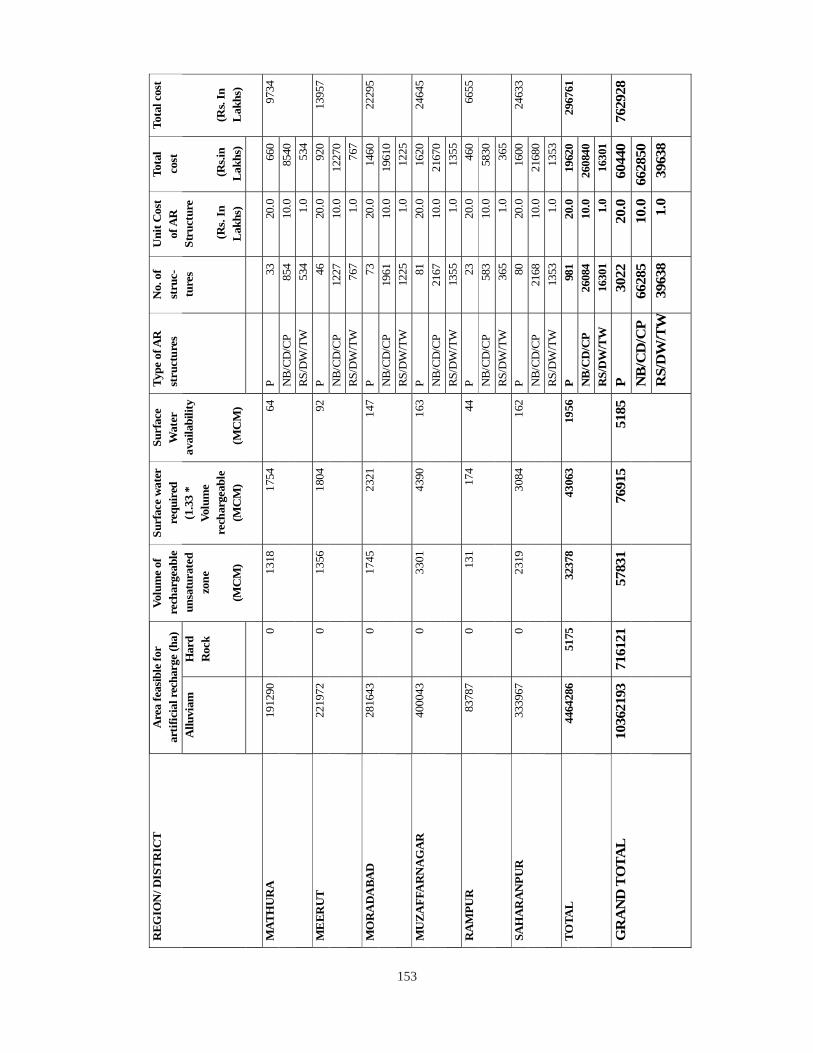
153
Are
a fe
asib
le fo
r ar
tific
ial r
echa
rge
(ha)
R
EGIO
N/ D
IST
RIC
T
Allu
viam
H
ard
Roc
k
Volu
me
of
rech
arge
able
un
satu
rate
d zo
ne
(M
CM
)
Surf
ace
wat
er
requ
ired
(1
.33
* Vo
lum
e re
char
geab
le
(MC
M)
Surf
ace
Wat
er
avai
labi
lity
(M
CM
)
Type
of A
R
stru
ctur
es
No.
of
stru
c-tu
res
Uni
t Cos
t of
AR
St
ruct
ure
(R
s. In
L
akhs
)
Tota
l co
st
(R
s.in
Lak
hs)
Tota
l cos
t
(Rs.
In
Lak
hs)
P
3320
.066
0N
B/C
D/C
P85
410
.085
40M
ATH
UR
A
1912
90
0
1318
1754
64
RS/D
W/T
W53
41.
053
4
9734
P
4620
.092
0N
B/C
D/C
P12
2710
.012
270
ME
ERU
T
2219
72
0
1356
1804
92
RS/D
W/T
W76
71.
076
7
1395
7 P
7320
.014
60N
B/C
D/C
P19
6110
.019
610
MO
RA
DA
BAD
2816
43
0
1745
2321
147
RS/D
W/T
W12
251.
012
25
2229
5 P
8120
.016
20N
B/C
D/C
P21
6710
.021
670
MU
ZA
FFA
RN
AG
AR
4000
43
0
3301
4390
163
RS/D
W/T
W13
551.
013
55
2464
5 P
2320
.046
0N
B/C
D/C
P58
310
.058
30R
AM
PUR
8378
7
0
131
174
44
RS/D
W/T
W36
51.
036
5
6655
P
8020
.016
00N
B/C
D/C
P21
6810
.021
680
SAH
AR
AN
PUR
3339
67
0
2319
3084
162
RS/D
W/T
W13
531.
013
53
2463
3 P
981
20.0
1962
0N
B/C
D/C
P26
084
10.0
2608
40TO
TAL
4464
286
5175
3237
8
4306
3
1956
R
S/D
W/T
W16
301
1.0
1630
1
2967
61
P30
2220
.060
440
NB
/CD
/CP
6628
510
.066
2850
GR
AN
D T
OTA
L
1036
2193
7161
21
5783
1
7691
5
5185
R
S/D
W/T
W
3963
81.
039
638
7629
28
154
8.22 UTTARAKHAND
The state of Uttarakhand, which comprises 13 districts, lies between 28°43’20" – 31°28’00" N latitudeand 77°34’06" – 81°01’31" E longitude and has a total geographical area of 53,483 km2. About 85% ofthe area of Uttarakhand state is occupied by Himalayan Mountain. Himalayan mountain is represented byNW-SE trending hill ranges which exhibit highly rugged youthful topography.The Great Himalayan rangeand Tethys are at places covered by snow. Geomorphologically, the area is divided into unit’s like highrelief glaciated area, structural hills, denudational hills, dissected fans, river terraces, flood plains etc. Thesouthern boundary of Uttarakhand Himalayas is covered by alluvium of Bhabar and Tarai.
Major part of the hilly area has a slope more than 20%. A slope of the magnitude of this order makes thearea unsuitable for groundwater development due to low groundwater potential. Administratively the stateis divided into thirteen (13) districts, namely, Chamoli, Uttarkashi, Rudraprayag, Pithoragarh, Pauri, Tehri,Almora, Nainital, Champawat, Bageshwar, Dehradun, Hardwar and Udham Singh Nagar.
In Himalayan Region groundwater mainly manifests in the form of springs. Groundwater mainly occursunder unconfined conditions and the water table follows the topography. The springs are both hot andcold. The hot water springs are generally found in Central Crystalline and are structurally controlled.About 25 hot springs are reported. The temperature ranges between 320C and 900C. The spring’sdischarge ranges from 1 to 10 lps. Out of 600 cold springs 330 are located in crystallines, 180 in quartzites,50 in shales / slates and 40 in carbonate rocks. The discharge of cold springs ranges from <1 to 30 lps.
The river terraces are most significant repository of groundwater comprising assorted material such asboulder, cobble, gravel, sand and clays. The terrace material has been tapped, at few places, through openwells and bore wells.
In Bhabar zone groundwater occurs under unconfined conditions. Water level is generally deep and observedas deep as 173.71 m bgl at Haldwani. The elevation of water level varies from 250 to 300 m above MSL.The hydraulic gradient is around 3m/km. The yield of the tube wells is observed up to 5540 lpm at adrawdown of 3 to 10 m. The hydraulic conductivity, as deciphered from pumping tests, ranges between 25and 250 m/day.
Tarai zone is characterized by moist, waterlogged area, which is gently sloping southwards (2.5 m/km).This zone is traversed by numerous perennial sluggish channels rendering the area swampy.
Drainage:
Uttarakhand state has a very prominent drainage system varying from first to fourth or fifth order. The maindrainage patterns are dendritic, trellis and rectangular. The drainage of Uttarakhand may be classified intofour viz. (1) Yamuna basin, (2) Ganga basin, (3) Ramganga basin and (4) Sarda basin. Each river has anumber of tributaries in Uttarakhand Himalaya.
Behavior of Ground Water Level
Depth to water level is monitored with the help of Ground Water Monitoring Stations. These stations areconfined to districts Haridwar and Udham Singh Nagar and part of Dehradun and Nainital. The other ninedistricts of the Uttarakhand state are occupied by lofty Himalayan peaks.
155
The depth to water level have been categorized (grouped) into five ranges i.e. 0-2 m, 2-5 m, 5-10 m, 10-15 m and 15-20 m. Majority of the monitoring stations (72%) in Dehradun districts falls within the range of10 to 20 m depth to water levels whereas 27 % falls within the range of 2 to 10 m bgl. District Haridwarshows entirely different behavior, where depth to water level is restricted within 2 to 10 m only during pre-monsoon. In Udham Singh Nagar District, majority of the monitoring stations (75 %) show depth range of2 to 5m. The station of Nainital always shows ground water level within 5 to 10 m.
8.22.1 WATER LEVEL FLUCTUATION
The water levels fluctuate seasonally in response to varying recharge and discharge. The main sources toground water recharge in the state are rainfall and return flow from irrigation. The discharge accounts fromground water pumping mainly for irrigation purpose and base flow. The water level fluctuation rangesbetween –0.39 and 10.80 m. Major part of the area shows water level rise where as rest of the areanearly 40 % shows fluctuation range of 0-2 and 2-4 m. On an average 2 m thickness (fluctuation) has beentaken for computation for getting unsaturated volume of aquifer thickness. Locally there are water leveldeclines around Rudrapur, Kichacha and Lalkuan areas.
8.22.2 SOURCE WATER AVAILABILITY:
The four major basins viz. Yamuna, Ganga, Ram Ganga and Sarda in Uttarakhand covers entire area ofstate .There is enormous quantity of surplus water flows down to the southward plain area .The surpluswater usually generated by run-off, base flow and snow melt. The assessment of volume of surface waterby such basins has not been quantified due to paucity of data, but it is obvious that rivers, rivulets, streamsand nala of Himalayan mountain are very much perennial. Only the first and some time second order ofstreams are seasonal in nature.
8.22.3 RECHARGE STRUCTURES AND COST ESTIMATES:
Physiographically the major parts of Uttarakhand state is hilly with localized small valleys through which theentire run-off passes .As the area is hilly with high slope the major part of the rainfall is lost as surface run-off. Apart from this the small rivers, nallas also act as carriers for base flow and spring water. In spite ofgood rain fall in hilly areas there is acute shortage of water especially during the summer. Further availabilityof water is restricted in these streams only .Thus the water in the streams should be harvested for irrigationand domestic needs through the various structures of rain water harvesting and water conservation measures.
Hydrogeologically, the area has been broadly grouped into hills (10 districts of Uttarakhand) and alluviumarea (3 districts). The broad valleys in hilly area are the feasible place for check dam construction wheregentle slope (less than 20%) prevails, whereas in the alluvium area (in foothill and beyond southward)check dam and percolation tanks are more appropriate. Roof top rain water harvesting can be adopted inboth the terrain; rather this should be given more emphasis on hilly areas specially.
Haridwar and Udham Singh Nagar districts have by and large plain topography. The district Udham SinghNagar is having very shallow water levels, hence localized artificial recharge structures like percolationponds/tanks and roof top rain water harvesting are to be adopted.
Almost 95 percent of the rainfall that falls in the catchments area goes out of the state as surface runoff dueto high slopes. It is thus important that this runoff is arrested to some extent by constructing gully plugs andcontour bunds. These structures arrest the surface runoff, increases the soil moisture, recharge the shallowground water aquifer and also increase the discharge of springs.

156
The district wise breakup of the type, number of structures and their cost are shown in table 8.22.1.
8.22.4 IDENTIFICATION OF AREA SUITABLE FOR RECHARGE:
Since 85% of Uttarakhand area is covered by lofty mountains, therefore the areas feasible for artificialrecharge is about 15% wherein site specific selection of structures is very important. The villages andagricultural field lying in the wider valleys with gentle slope (less than 20 %) are the only feasible area forartificial recharge structures. On this pretext, district wise identification of area suitable for recharge hassummarized in the following paragraphs:
Dehradun: Hydro-geologically, Dehradun valley (Doon) is most feasible area for artificial recharge structureslike, recharge shafts and percolation ponds due to the occurrence of unsaturated bouldary formations atshallower depth. Recharge shafts are suitable for artificial recharge to ground water. The recharge shaftswill also facilitates in ameliorating water logging in Dehradun urban area. In the recent time, the city ofDehradun is being expanding in full swing, in turn resulting to a concrete apron over the city area. Consequentlyless and less percolation of rain water occurs. Thus Doon valley is the effective & feasible area for artificialrecharge to ground water.
Haridwar: District Haridwar exhibits an entirely different topography and groundwater scenario. Thestructures feasible, in the fringe area, are gully plugs, gabions and check dams. But in the plain area likeBhagwanpur, Sultanpur, Manglaur, and Bahadrabad, percolation tanks, roof top rainwater harvesting andrecharge shafts are feasible.
Tehri: Tehri districts covers the physiographic situation of lesser to greater Himalaya in which the artificialrecharge of ground water can be practiced in the villages of Dhanaulti, Narendra Nagar and Pratap Nagaralong with the roof top rain water structures in the same town area.
Chamoli: The Tethyan Himalaya falls in the districts of Chamoli are fully covered with the Snow Mountainswith parts of Greater Himalayas also covered by snow. Chamoli is also predominantly covered by thenarrow valleys of Sarswati, Dhauli Ganga, Rishi Ganga, Birhi Ganga and Pinder River. The suitable sitesfor recharge structures can be constructed in the villages of Karnprayag, Pokhri, Chamoli, Joshimath,Tharali, and Gauchar.
Pauri: The valley of Nayar, East Nayar and West Nayar are the favorable place for check dam constructionwhereas roof top rain water structure can be constructed in the villages and towns like Srinagar, Pauri,Satpuli, Lansdowne and Dugadda.
Uttarkashi: North-Eastern part of Uttarkashi district is covered with snow clad mountain. River Yamunaand Ganga (Bhagirathi) originates from Yamunotri and Gomukh area of this district respectively. Theirlower reached at Purola, Barkot and Dunda area are somewhat suitable for check dam construction. Rooftop rain water harvesting structure can be practiced in Barkot, Dunda and Bhatwari villages.
Rudraprayag: Mandakini is the major river running almost north to south in the middle of district. Thedistrict also falls in the Greater Himalaya where steep and narrow gorges are predominant. Only thevillages like Augustmuni, Jakholi, Tilwara, Baramwari and Guptkashi can be selected for check damconstruction along with harvesting structures.
Almora: Narrow gorges and valleys are predominating in Almora district. However, the valleys of Ramganga,Kosi and Sarju River are the suitable place for check dam construction. Roof top rain water harvestingcan be adopted in the township of Ranikhet, Someshwar, Bhikiyasain and Bhanauli.
157
Nainital: Major part of Nainital district comes under Lesser Himalaya where highest mountain is havingaltitude of 2591 m. The southern fringe of the district is covered by the Bhabar and Tarai formation whichare traversed by numerous north to south flowing streams. Ramnagar, Kaladungi, Haldwani and Chorgaliaare the important places where check dam & percolation tanks can be constructed for recharge. Nainital,Bhimtal and Bhowali are the suitable towns for roof top rain water harvesting.
Champawat : Southern part of Champawat district have a east-west running narrow strip of Bhaber andTarai formation ,especially the area of Banbasa and Tanakpur in which check dam and percolation tanksare very much suitable to construct artificial recharge structures . In the lesser Himalayas Dayuri andPurnagiri temple area are suitable for recharge. Roof top rain water harvesting structures can be suitablyconstructed in the township of Champawat and Tanakpur.
Pithoragarh: The entire Pithoragarh district comes under Greater and Tethyan Himalayas. Nearly 35/40% mountains are snow covered where roof top rain water harvesting are the most viable option in theseareas. The valleys near Gangolihat, Dewalthal, Thal and Jauljibi are the favorable place for artificial recharge.These places are drained by the streams like Goriganga, Ramganga and Saryu.
Bageshwar: The entire area of Bageshwar comes under greater Himalaya where nearly 10/15% mountainsare snow covered. The river valleys of Gomati, Sarju and Ramganga in which villages like Baijnath, Gorur,Kapkot and Khantoli are situated can be selected for check dam construction. These villages are alsosuitable for roof top rain water harvesting.
Udham Singh Nagar: The entire area of Champawat lying in the Tarai belt in which depth to water levelis very shallow in nature except Jaspur and Kashipur area where check dam and percolation tanks aresuitable options. The roof top rain water harvesting can be practiced in the entire district.
8.22.5 SUB-SURFACE STORAGE SPACE AND WATER REQUIREMENT:
In Uttarakhand state, except Haridwar and Udham Singh Nagar all other districts exist with highly undulatingtopography where generally aquifer systems are very much localized. In the outer Himalaya whereveralluvium or valley deposits occurs they are relatively covered by bigger surface area than that of middleHimalayas. The depth to water level in these alluvium domain are very much variable than the plain area ofTarai and beyond in the Gengetic plain. Thus, subsurface storage space is herby generalized for 2m asunsaturated zone. Only for district Udham Singh Nagar storage space has been taken as one meter owingto their shallower nature of depth to water level.
For the seven districts of Garhwal division and six districts of Kumaun division the sub surface storagespace has been calculated as 26311 MCM whereas for their saturation, the volume of water required is6578 MCM.
The volume of source available for recharge has been computed on the basis of 70% of the average rainfall (1500 mm) which is the feasible area only. The area suitable for recharge in the State is given in Fig.8.22.1.
8.22.6 AREA BENEFITTED
The impact of artificial recharge to ground water will be mainly around the recharge structures due togradient of water table. The impact will be optimum during post monsoon period and distinct rise inground water level will be observed in the recharge area as compared to the discharge area. It is estimated
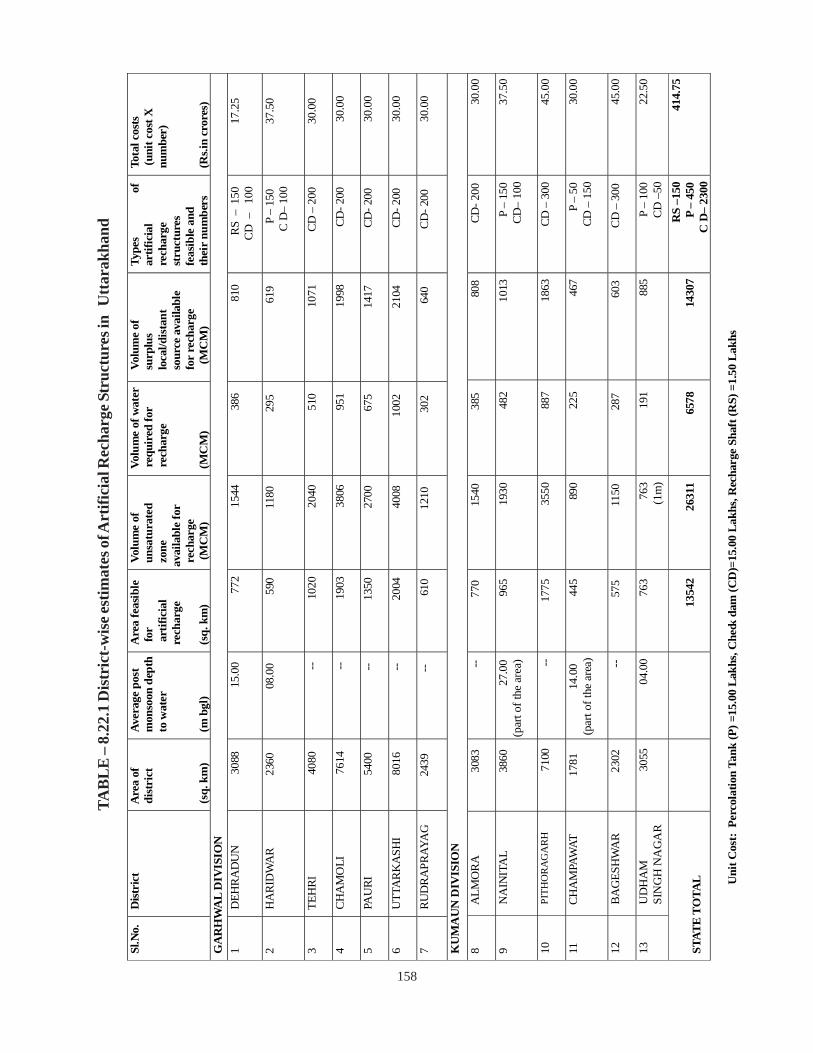
158
TAB
LE
– 8
.22.
1 D
istr
ict-
wis
e est
imat
es o
f Art
ifici
al R
echa
rge S
truc
ture
s in
Utt
arak
hand
Sl.N
o.D
istri
ctA
rea
ofdi
stri
ct
(sq.
km
)
Ave
rage
pos
t m
onso
on d
epth
to
wat
er
(m b
gl)
Are
a fe
asib
le
for
art
ifici
al
rech
arge
(s
q. k
m)
Volu
me
of
unsa
tura
ted
zo
ne
avai
labl
e fo
r
rech
arge
(M
CM
)
Volu
me
of w
ater
requ
ired
for
rech
arge
(M
CM
)
Volu
me
of
surp
lus
loca
l/dis
tant
so
urce
ava
ilabl
e fo
r re
char
ge
(M
CM
)
Type
sof
artif
icia
l re
char
ge
stru
ctur
es
feas
ible
and
th
eir
num
bers
Tota
l cos
ts
(uni
t cos
t X
num
ber)
(R
s.in
cror
es)
GA
RH
WA
L D
IVIS
ION
2 1
DEH
RA
DU
N30
8815
.00
772
1544
386
810
RS
–15
0C
D –
10
0 17
.25
2H
AR
IDW
AR
2360
08.0
059
011
8029
561
9P
–15
0C
D–
100
37.5
0
3TE
HRI
4080
--10
2020
4051
010
71C
D–
200
30.0
0
4C
HA
MO
LI76
14--
1903
3806
951
1998
CD-2
00
3
0.00
5PA
URI
5400
--13
5027
0067
514
17C
D-2
00
3
0.00
6U
TTA
RK
ASH
I80
16--
2004
4008
1002
2104
CD
-200
30.
00
7 R
UD
RA
PRAY
AG
2439
--61
012
1030
264
0C
D-2
00
3
0.00
KU
MA
UN
DIV
ISIO
N2
8A
LMO
RA
3083
--77
015
4038
580
8CD
-200
30
.00
9N
AIN
ITA
L38
6027
.00
(par
t of t
he a
rea)
96
519
3048
210
13P
–15
0C
D–
100
37
.50
10
PITH
OR
AG
AR
H
7100
--17
7535
5088
718
63CD
–30
0
45.0
0
11CH
AM
PAW
AT17
8114
.00
(par
t of t
he a
rea)
44
589
022
546
7P
–50
CD –
150
30.
00
12
B
AG
ESH
WA
R23
02--
575
1150
287
603
CD
–30
0
45.
00
13
U
DH
AM
SI
NG
H N
AG
AR
3055
04.0
076
376
3(1
m)
191
885
P–
100
CD
–50
2
2.50
STA
TE T
OTA
L
1
3542
263
11
65
7814
307
RS
–150
P
– 45
0 C
D–
2300
414
.75
Uni
t Cos
t: P
erco
latio
n Ta
nk (P
) =15
.00
Lak
hs, C
heck
dam
(CD
)=15
.00
Lak
hs, R
echa
rge
Shaf
t (R
S) =
1.50
Lak
hs
159
that influence of recharge scheme as proposed in master plan will be observed in about 13542 sq. km areaand it will help to check in decline in water level with the help of 6578 MCM recharge water.
Usually in the broader valleys of Himalayan Mountain and valley bottom, irrigation facilities are scarceduring post monsoon period. In these areas of check dam and percolation tank will be beneficial forsustainable irrigation during the lean periodfor existing cropping patteren.
8.22.7 ROOF TOP RAIN WATER HARVESTING:
It has been assessed that roof top rain water harvesting can be adopted in ~ 48250 houses, govt. buildings,institutes etc. in urban and municipal areas of the state suitable for artificial recharge in the first phase. It willharness 13.67 MCM rain water considering normal rainfall for the state and 80% efficiency of the system.The cost of roof top rain water harvesting of a building having roof and paved area of ~ 200 sq.m. hasbeen assessed to be Rs. 12,000 and for bigger buildings having more than 1000 sq.m. will be Rs. 1.50lakh. The total cost for the roof top rain water harvesting for the state has been estimated to be Rs.68.25crores in the first phase considering 5% of the total buildings having larger roofs.
8.22.8 ACTION TAKEN BY UTTARAKHAND STATE TO PROMOTE RAIN WATERHARVESTING:
The State Government (Avash and Shahari Vikas) has made rules for compulsory installation of rain waterharvesting system and directed to adopt rules in building by-laws. Accordingly, all the development authoritieshave made partial amendments in the prevalent house building and development bye-laws/ regulations.
109 traditional ponds and 104 percolation tanks have been constructed to conserve water. Besides theseschemes basin/ sub-basin catchments programme has been taken up by the project Management unit(PMU) under “Swajal Project” under the catchments areas conservation and management plan (CACMP).
8.22.9 TOTAL COST
Table 8.22.2 gives the summarized cost estimates for various types of structures feasible in Uttarakhandstate which works out to Rs. 483 crores.
Table-8.22.2 Summarized cost estimates for various types of structures feasible in Uttarakhand
Type of Structure Total No. of Structures
Unit cost (Rs. in crores)
Total cost (Rs. in crores)
Percolation Tank 450 0.15 67.50
Check Dam 2300 0.15 345.00Roof Top Rain Water harvesting structure 48250 0.0012-0.015 68.25
Recharge Shaft 150 0.01.50 2.25
Total 483.00

160
Fig. 8.22.1 – Areas suitable for Artificial Recharge in Uttarakhand
161
8.23 WEST BENGAL
The State of West Bengal has a total geographic area of 88,752 sq km., and has a population of 91,347,736as per 2011 census with a population density of 1029 per sq km. The average rainfall in the state is about1750 mm of which 1250 mm occurs during the period from June to September. While the hilly Himalayanregion receives the heaviest rainfall ranging from 2500 to 6000 mm, the southern districts in the plainsreceive on an average rainfall from 1125 to 1875 mm. There are three major river basins in the State,namely, the Ganga, Brahmaputra and Subarnarekha. The Tista, Torsa, Jaldhaka, etc., are the tributaries tothe river Brahmaputra. The Mahananda, Mayurakshi, Ajoy, Damodar, Dwarakeswar, Kasai, Jalangi, Churni,etc. are other tributaries to the river Ganga/Bhagirathi–Hugli river.
8.23.1 IDENTIFICATION OF AREA
Post monsoon average depth to water level maps and long-term trend in water level map has beensuperimposed over administrative boundary to identify and to prioritize the most feasible area for recharge.The areas considered fulfill the conditions mentioned below.
a) Water levels more than 9 m bgl with or without the falling trend
b) Water levels between 6 and 9 m bgl and declining trend of > 10 cm/yr
c) Area showing water levels between 6-9 m bgl with no declining trend
d) Areas showing water levels between 3 and 6 m bgl and declining trend of > 10 cm /yr
On the other hand the drought prone district underlying by hard crystalline basement rocks, traps and semiconsolidated to consolidated Gondwana formations at the shallower depth and lateritic area in Purulia,Western parts of Bankura, Birbhum and PaschimMedinipur district, the area having water level 3-6 m bglwith or without falling trend are considered for recharge.
The coastal blocks in the vicinity of sea in Purba Medinipur and South 24 Pargana district are left beyondthe purview of recharge considering the probability of discharge of recharged water in the sea. Depletionin piezometric surface is also found to occur in the urban area of Kolkata city and Haldia Industrial area.The level of ground water development in a block and the categorization are also given due importancewhile identifying the feasible area in a particular district. An area of 8335.84 sq km in hard rock terrain inparts of four districts and 28394.56 sq km in alluvial area is considered for recharge by suitable proposedrecharge structures in West Bengal under this plan (Fig. 8.23.1).
8.23.2 SUB-SURFACE STORGE AND WATER REQUIREMENT
The storage space available for recharge is determined by the average depth of the unsaturated zonebelow 3 m bgl in each prioritized sectors (average post monsoon water level-3m). The depth of unsaturationbeyond 3m is then multiplied by actual area considered for recharge in each sector to determine the netvolume of unsaturated volume considered for recharge. An additional area of 10% is added to the feasiblearea for recharge to arrive at actual area considered for recharge to account for upstream recharge effects
162
depending upon local/regional ground water flow direction. The sub surface storage potential in the state isestimated as 14931MCM.
The volume of water to be added for the optimal recharge of the aquifers in the identified area is calculatedby multiplying the available storage space with specific yield value of the particular aquifer materials. Afterassessing the volume of water required for saturating the vadose zone, the actual requirement of sourcewater is to be estimated.
Based on the experience gained in the pilot/experimental projects implemented in different hydrogeologicalsituations, an average recharge efficiency of 60 to 65% of the individual structure is considered. Thevolume of source water required for artificial recharge was calculated by multiplying a factor of 1.61 (i.e.reciprocal of 0.62). The gross volume of surface water required, as estimated, for artificial recharge in thestate is 17797 MCM. The availability of non committed source water is one of the primary requisite fordesigning any artificial recharge project. However, the data available of the surplus runoff is only on thebasin or the sub basin level, not exclusively for the requirement for the feasible area for the recharge,therefore for the present plan, 70% of the normal average monsoon rainfall receives on actual feasible areafor recharge is considered as available non committed surface runoff for that particular area.
8.23.3 RECHARGE STRUCTURES AND COST ESTIMATES
Considering the hydrogeological set up of the State, the following artificial recharge / conservation structuresare proposed to be constructed for augmentation & conservation of ground water resources.
Type of Terrain Type of Artificial Recharge Structure proposed
Hard rock & Hilly Areas 1. Percolation Tanks
2. Check dam
3. Gabion Structures /Contour bunds
4. Sub surface dykes
5. Dug well recharge /recharge shaft
Alluvial Areas 1. Percolation Tanks
2. Re-excavation of existing tanks with Recharge Shaft
3. Injection Well
Urban Areas 1. Roof-top Rain Water Harvesting Structures
The gross storage capacity & percentage of resources allocated for different artificial recharge structuresare presented in table 8.23.1.
(REET)
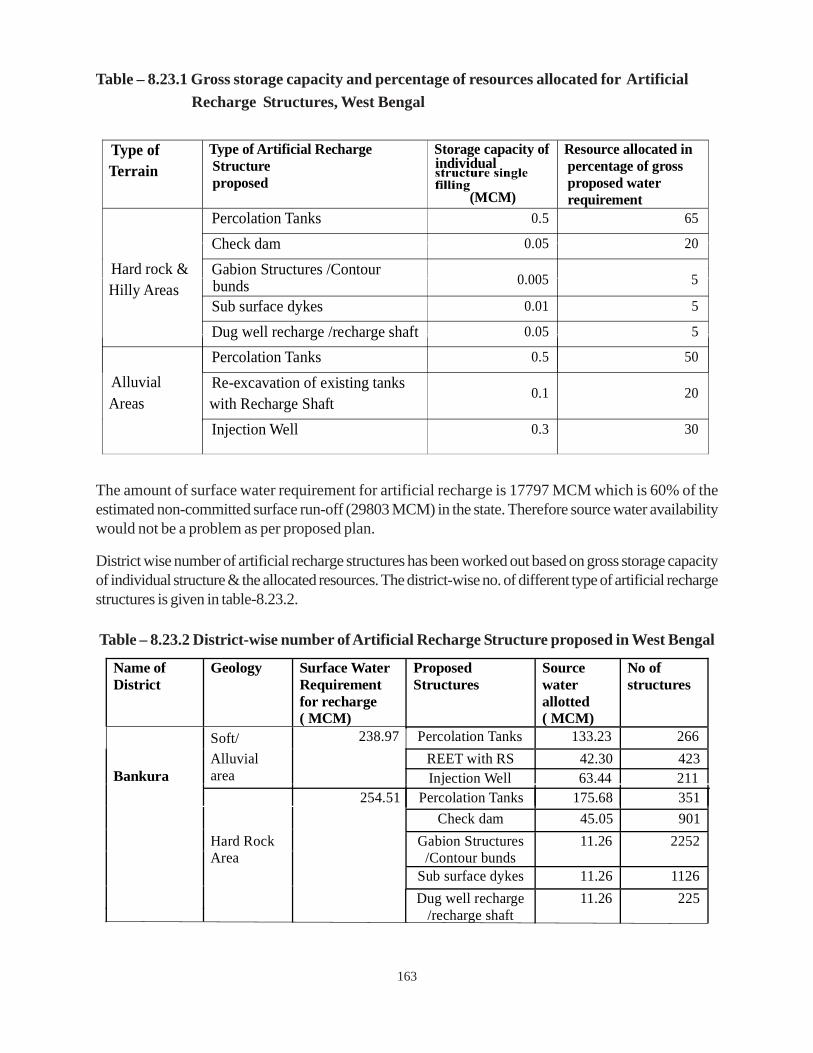
163
Table – 8.23.1 Gross storage capacity and percentage of resources allocated for Artificial
The amount of surface water requirement for artificial recharge is 17797 MCM which is 60% of theestimated non-committed surface run-off (29803 MCM) in the state. Therefore source water availabilitywould not be a problem as per proposed plan.
District wise number of artificial recharge structures has been worked out based on gross storage capacityof individual structure & the allocated resources. The district-wise no. of different type of artificial rechargestructures is given in table-8.23.2.
Recharge Structures, West Bengal
Type of Terrain
Type of Artificial Recharge Structure proposed
Storage capacity of individual
(MCM)
Resource allocated in percentage of gross proposed water requirement
Percolation Tanks 0.5 65
Check dam 0.05 20
Gabion Structures /Contour bunds 0.005 5
Sub surface dykes 0.01 5
Hard rock & Hilly Areas
Dug well recharge /recharge shaft 0.05 5
Percolation Tanks 0.5 50
Re-excavation of existing tanks with Recharge Shaft
0.1 20Alluvial Areas
Injection Well 0.3 30
Name of District
Geology Surface WaterRequirement for recharge ( MCM)
Proposed Structures
Source water allotted ( MCM)
No of structures
Soft/ Percolation Tanks 133.23 266Alluvial area
REET with RS 42.30 423
238.97 Injection Well 63.44 211
Percolation Tanks 175.68 351Check dam 45.05 901
Gabion Structures /Contour bunds
11.26 2252
Sub surface dykes 11.26 1126
Bankura
Hard Rock Area
254.51
Dug well recharge /recharge shaft
11.26 225
Table – 8.23.2 District-wise number of Artificial Recharge Structure proposed in West Bengal

164
Name of District
Geology Surface WaterRequirement for recharge ( MCM)
Proposed Structures
Source water allotted ( MCM)
No of structures
Birbhum Soft/ Percolation Tanks 751.29 1503Alluvial area
REET with RS 238.50 2385 1347.55
Injection Well 357.76 1193
Hard Rock Percolation Tanks 157.50 315
Area Check dam 40.38 808 Gabion Structures/
Contour bunds 10.10 2019
Sub surface dykes 10.10 1010
228.17
Dug well recharge /recharge shaft
10.10 202
Paschim Soft/ Percolation Tanks 1081.28 2163
Medinipur Alluvial area
REET with RS 343.26 3433
1939.44
Injection Well 514.90 1716
Hard Rock Percolation Tanks 246.72 493
Area Check dam 63.26 1265
Gabion Structures/
Contour bunds 15.82 3163
Sub surface dykes 15.82 1582
357.43
Dug well recharge /recharge shaft
15.82 316
Purulia Hard Rock Percolation Tanks 259.98 520Area Check dam 66.66 1333
Gabion Structures/
Contour bunds 16.67 3333
Sub surface dykes 16.67 1667
376.64
Dug well recharge /recharge shaft
16.67 333
Cooch behar Alluvial area
Percolation Tanks 10.99 22
REET with RS 3.49 35
19.71
Injection Well 5.23 17Darjeeling Hilly area Check dam 7.12 142
Gabion Structures/ Contour bunding
7.55 1510
16.09
Dug well recharge /recharge shaft
1.42 142
Percolation Tanks 1135.98 2272REET with RS 643.01 6430Injection Well 643.01 2143
Percolation Tanks 310.78 622REET with RS 175.92 1759Injection Well 175.92 586
Hooghly Alluvial area
2421.99
Haora Alluvial area
662.61
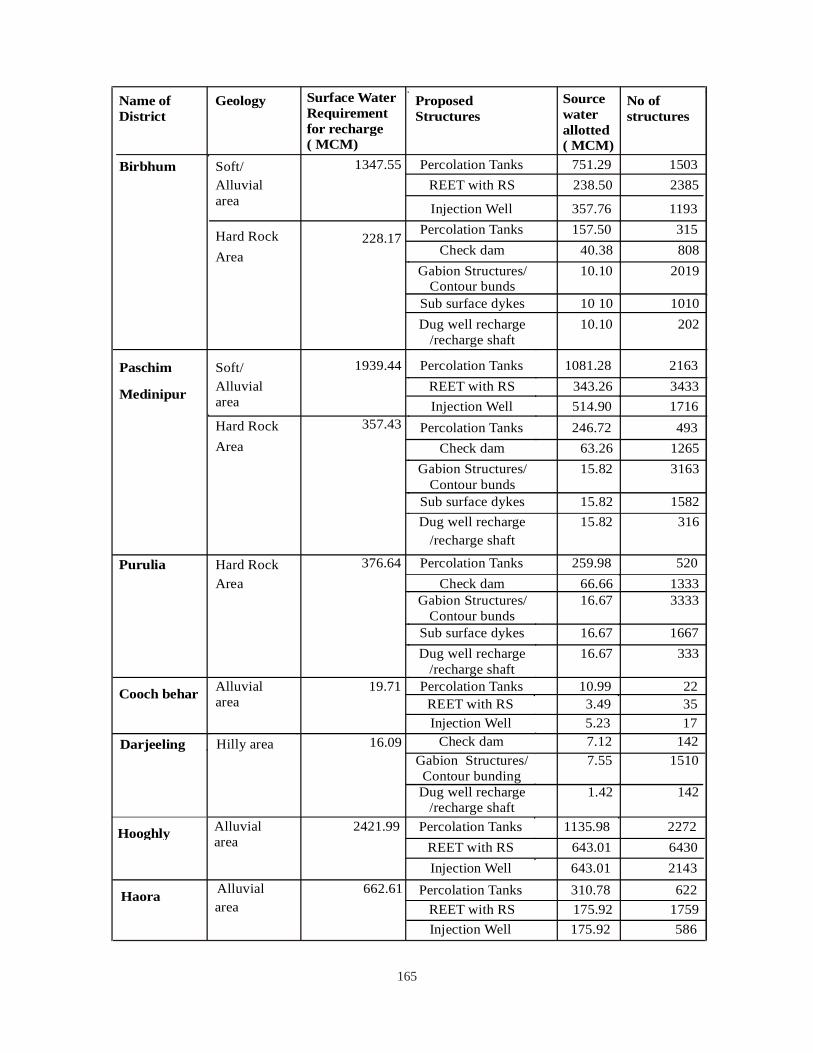
165
Name of District
Geology Surface WaterRequirement for recharge ( MCM)
Proposed Structures
Source water allotted ( MCM)
No of structures
Birbhum Soft/ Percolation Tanks 751.29 1503
Alluvial area
REET with RS 238.50 2385
1347.55
Injection Well 357.76 1193
Hard Rock Percolation Tanks 157.50 315
Area Check dam 40.38 808
Gabion Structures/
Contour bunds 10.10 2019
Sub surface dykes 10 10 1010
228.17
Dug well recharge /recharge shaft
10.10 202
Paschim Soft/ Percolation Tanks 1081.28 2163
Medinipur Alluvial area
REET with RS 343.26 3433
1939.44
Injection Well 514.90 1716Hard Rock Percolation Tanks 246.72 493Area Check dam 63.26 1265
Gabion Structures/ Contour bunds
15.82 3163
Sub surface dykes 15.82 1582
357.43
Dug well recharge /recharge shaft
15.82 316
Purulia Hard Rock Percolation Tanks 259.98 520 Area Check dam 66.66 1333
Gabion Structures/ Contour bunds
16.67 3333
Sub surface dykes 16.67 1667
376.64
Dug well recharge /recharge shaft
16.67 333
Cooch behar Alluvial area
Percolation Tanks 10.99 22
REET with RS 3.49 35
19.71 Injection Well 5.23 17
Darjeeling Hilly area Check dam 7.12 142
Gabion Structures/ Contour bunding
7.55 1510
16.09
Dug well recharge /recharge shaft
1.42 142
Percolation Tanks 1135.98 2272REET with RS 643.01 6430Injection Well 643.01 2143
Percolation Tanks 310.78 622REET with RS 175.92 1759Injection Well 175.92 586
Hooghly Alluvial area
2421.99
Haora Alluvial area
662.61
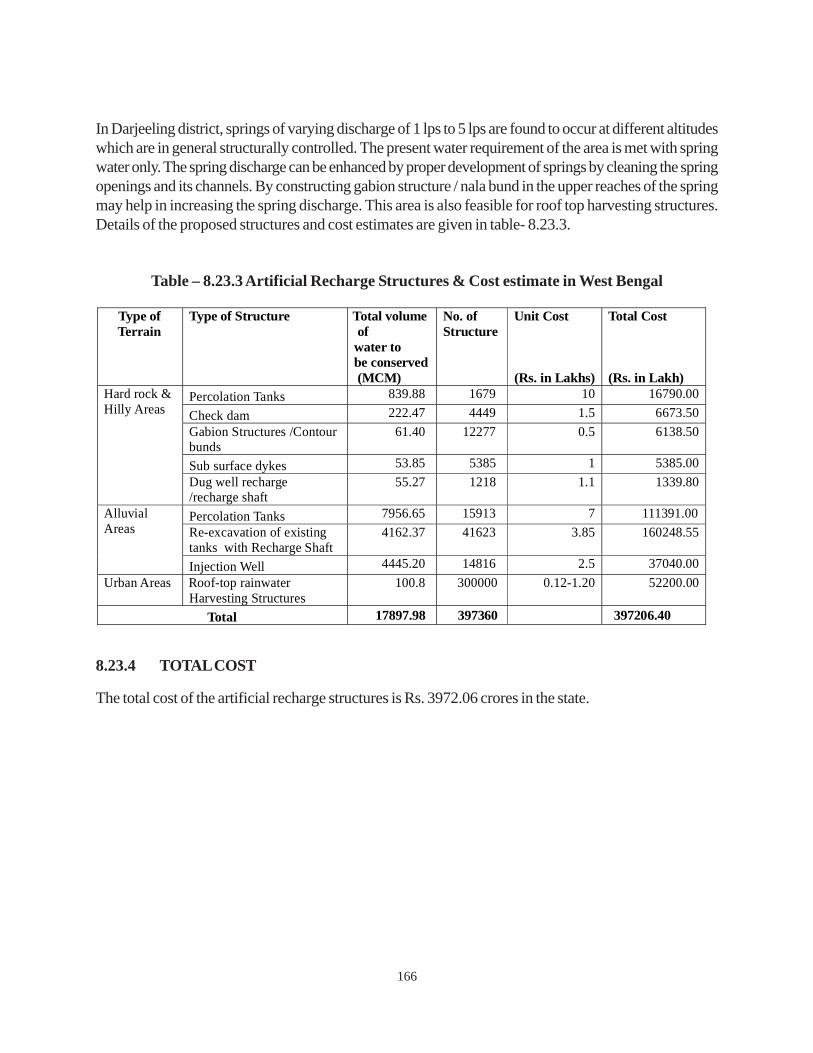
166
Table – 8.23.3 Artificial Recharge Structures & Cost estimate in West Bengal
Type of Terrain
Type of Structure Total volume of water to be conserved (MCM)
No. of Structure
Unit Cost (Rs. in Lakhs)
Total Cost (Rs. in Lakh)
Percolation Tanks 839.88 1679 10 16790.00Check dam 222.47 4449 1.5 6673.50Gabion Structures /Contour bunds
61.40 12277 0.5 6138.50
Sub surface dykes 53.85 5385 1 5385.00
Hard rock & Hilly Areas
Dug well recharge /recharge shaft
55.27 1218 1.1 1339.80
Percolation Tanks 7956.65 15913 7 111391.00Re-excavation of existing tanks with Recharge Shaft
4162.37 41623 3.85 160248.55Alluvial Areas
Injection Well 4445.20 14816 2.5 37040.00Urban Areas Roof-top rainwater
Harvesting Structures 100.8 300000 0.12-1.20 52200.00
Total 17897.98 397360 397206.40
8.23.4 TOTAL COST
The total cost of the artificial recharge structures is Rs. 3972.06 crores in the state.
In Darjeeling district, springs of varying discharge of 1 lps to 5 lps are found to occur at different altitudeswhich are in general structurally controlled. The present water requirement of the area is met with springwater only. The spring discharge can be enhanced by proper development of springs by cleaning the springopenings and its channels. By constructing gabion structure / nala bund in the upper reaches of the springmay help in increasing the spring discharge. This area is also feasible for roof top harvesting structures.Details of the proposed structures and cost estimates are given in table- 8.23.3.
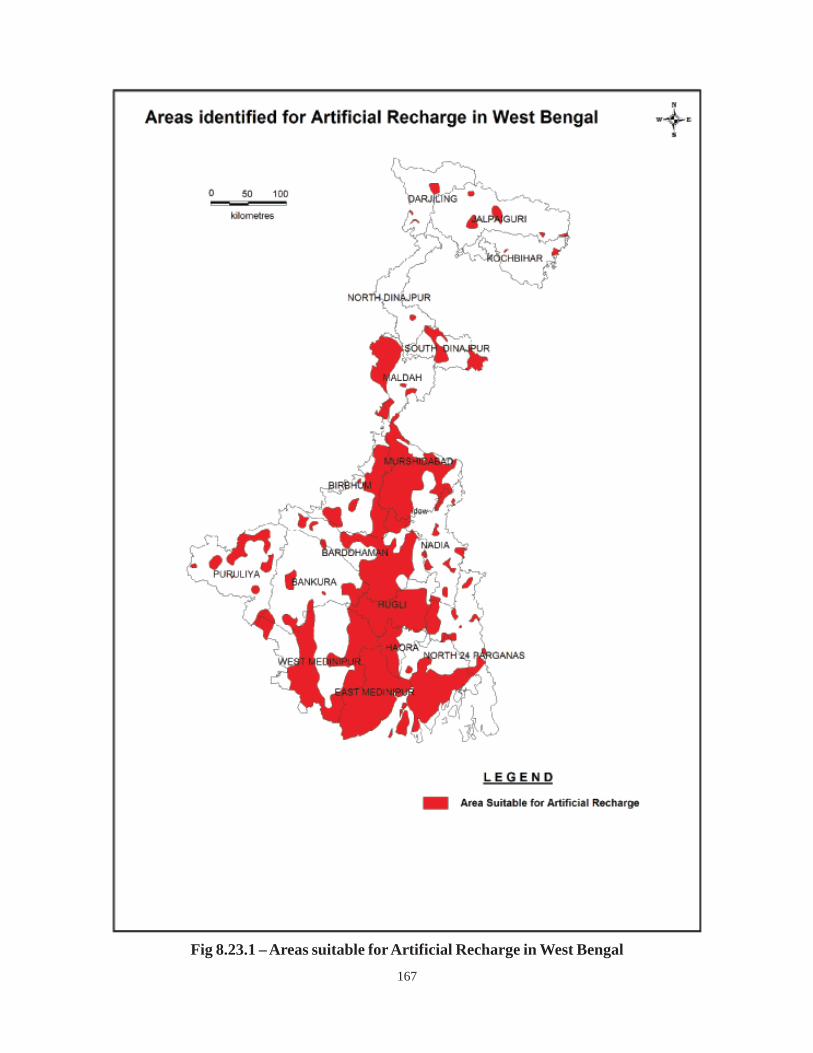
167
Fig 8.23.1 – Areas suitable for Artificial Recharge in West Bengal
168
8.24 ANDAMAN AND NICOBAR ISLANDS
Andaman and Nicobar group of Islands is constituted by three districts i.e. 1. North-Middle AndamanDistrict (2) South Andaman from the Northern group of Islands and the southern (3) Nicobar district,separated from each other by the deep sea of 10o channel. The Andaman group of Islands cover an areaof 6340 sq. km. and the Nicobar group 1953 sq. km. Mean annual rainfall of these Islands is over 3000mm. Perennial streams of the status of major river are absent in the Andaman and Great Nicobar Island.The major perennial streams in South Andaman are Dhanikhari, Protheropore Nala and Pema Nala etc.while in North-Middle Andaman Kalpong nala,Korang nala,Betapur nala, Rangat nala etc are the importantperennial streams. In Nicobar South Andaman are all small streams – the Dhanikhari being the largest. InNicobar District, Galathea and Alexandria rivers, Dhillon Nala, all in Great Nicobar island are the maindrainage channels.
Though the development of ground water is in low key, yet the artificial recharge and conservation structuresseem to provide a very good mechanism for augmentation of ground water resources in the Islands. Evenendowed with high rainfall, quick evaporation losses and proximity to sea facilitate high evapotranspiration,and huge base flow from the aquifers to the sea. To meet the crisis of ground water, artificial rechargestructures like percolation tank, cement plug and subsurface dykes as ground water conservation structureappears to be highly useful in the Islands. Presently in many Islands perennial springs ooze through thefractures and topographic lows which cater to a great extent to the village population. Keeping in view theimportance of springs, the development of these springs is needed with proper recharge structures andcatchment area treatment at appropriate locations, at the upstream of spring discharge.
Depending upon high rainfall in rainy months and scarcity of drinking water in the lean periods (Dec/Jan toApril), harvesting of rainwater is very old practice of the Islanders. The tribes in the Islands till date collectrainwater in green coconuts. Recently the Island administrations have started designing the roofs of Govt.buildings for harvesting of rain water from the roof top. This practice may be popularized in the entiredistricts of Andaman and Nicobar so that an appreciable quantity of rain water may be conserved throughproperly designed roofs and the water may be conserved for day to day use after rainy season. Similarlyartificial recharge through rooftop rainwater harvesting may be implemented in Neil, Havelock, Little Andamanand in parts of South Andaman in Port Blair while in Chowra and Car Nicobar in Nicobar District artificialrecharge through rooftop rainwater harvesting may be the best option for sustainable water supply.
Considering all the above modes of augmentation of ground water resources, a Master Plan for artificialrecharge to ground water, rain water harvesting and spring development has been prepared (Table-8.24.1and Fig.8.24.1& 8.24.2). The plan includes spring development (150 nos.), roof top harvesting forhouses (1150 nos.), roof top harvesting for Govt./Institutional buildings (50 nos.), check dam/ gabion/nalabund (320 nos.), cement plug (200 nos.), percolation tank (720 nos.) and sub-surface dykes (250 nos.).For construction of all these structures the cost is estimated as Rs.52.02 Crores. Total volume of watermay likely to be harvested through these structures would be around 96.20 MCM.

169
Table – 8.24.1 Cost estimate and Number of Structures proposed in Andaman and Nicobar
Type of structure No. ofstructure
Unit Cost (Rs. in lakh)
Total cost
(Rs. in lakh)
Total volume of water
harvested (MCM)
Spring Development 150 3.0 450 0.45Roof top rain water harvesting (Houses)
1150 0.50 575 0.55
Roof top rain water harvesting (Govt. & Institutional buildings)
50 4.5 225 0.12
Gabion, Check Dam, Nala bund 320 4.0 1280 32.00Cement Plug 200 1.5 300 12.00Percolation tank 720 2.6 1872 1.08Sub-surface dyke 250 2.0 500 50.00 Total 2840 5202 96.20

170
Fig. 8.24.1 Areas suitable for Artificial Recharge in Andaman district
Fig. 8.24.2 Areas suitable for Artificial Recharge in Nicobar district
171
8.25 CHANDIGARH
Chandigarh is a highly urbanized city and the rooftop of the buildings can be suitably used for artificialrecharge of the rainfall falling in Chandigarh. There is lot of green area too and some water bodies that canbe effectively utilized for recharging the rainfall runoff. In Chandigarh, there are two distinct aquifer systems– shallow and deep. Shallow aquifer occurs under semi-confined conditions and exists down to 20 to 30m below land surface. Deep aquifers below 40 m are under confined conditions. The piezometric head ofthe deep aquifers stands much below the water table of shallow aquifers and thus it can receive watereasily on being recharged artificially.
It is estimated that about 30.71 MCM (18.45 MGD) surface runoff is available in the city for recharge toground water during monsoons from the roads (15.89 sq.km), from rooftops of residential areas (30.19sq.km) from shopping areas (3.97 sq. km) and public and institutional building (7.94 sq. km). This isalmost equivalent to the water pumped out of aquifers and therefore, harvesting and recharging rainwaterwill go a long way in contributing towards sustainability of water supply. The total runoff generated duringan hour of 30 mm of rainfall would be 870000 m3. As per the prevailing hydrogeological conditions, themost suitable structure for artificial recharge to ground water in Chandigarh UT is trench cum rechargewell. The dimensions of the trench would be site specific and will depend on the water availability. Arecharge trench of 8 m x 2 m x 3 m capacity with twin recharge wells of 40 – 80 m. depth would store andrecharge ~ 100 m3 of rainfall run off water. It is estimated that a total of 8700 recharge structures wouldbe required to be constructed at an cost estimate of Rs. 652.50 crores at the rate of Rs. 7.50 lakh perstructure (table 8.25.1). Rain water harvesting will also address the problem of flooding due to overloadingof the storm water drains. Areas suitable for recharge with type of structures is shown in the Fig.8.25.1
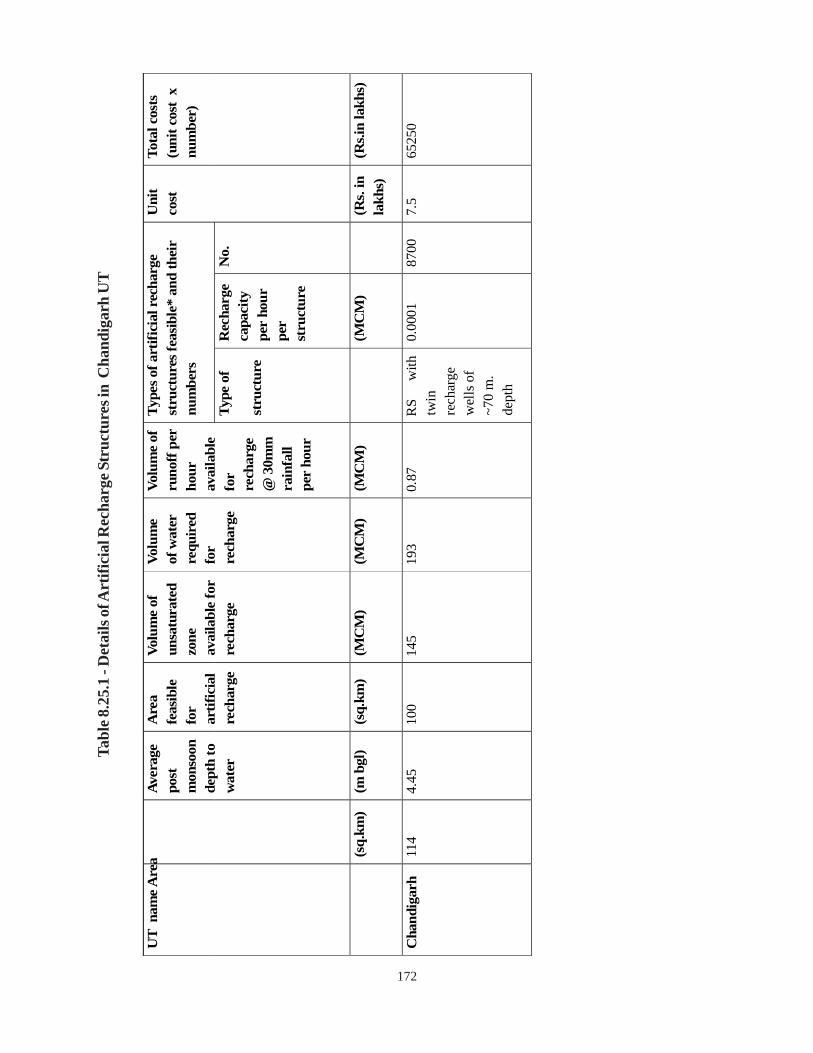
172
Tabl
e 8.2
5.1
- Det
ails
of A
rtifi
cial
Rec
harg
e Str
uctu
res i
n C
hand
igar
h U
T
Type
s of a
rtifi
cial
rec
harg
e st
ruct
ures
feas
ible
* an
d th
eir
num
bers
UT
nam
e A
rea
Aver
age
post
m
onso
on
dept
h to
w
ater
Are
a fe
asib
le
for
artif
icia
l re
char
ge
Volu
me
of
unsa
tura
ted
zone
av
aila
ble
for
rech
arge
Volu
me
of w
ater
re
quir
ed
for
rech
arge
Volu
me
of
runo
ff p
er
hour
av
aila
ble
for
rech
arge
@
30m
m
rain
fall
per
hour
Type
of
stru
ctur
e
Rec
harg
e ca
paci
ty
per
hour
pe
r st
ruct
ure
No.
Uni
t co
st
Tota
l cos
ts
(uni
t cos
t x
num
ber)
(sq.
km)
(m b
gl)
(sq.
km)
(MC
M)
(MC
M)
(MC
M)
(M
CM
)
(Rs.
in
lakh
s)
(Rs.i
n la
khs)
Cha
ndig
arh
114
4.45
100
145
193
0.87
RS
with
twin
re
char
ge
wel
ls o
f ~7
0 m
. de
pth
0.00
0187
007.
565
250
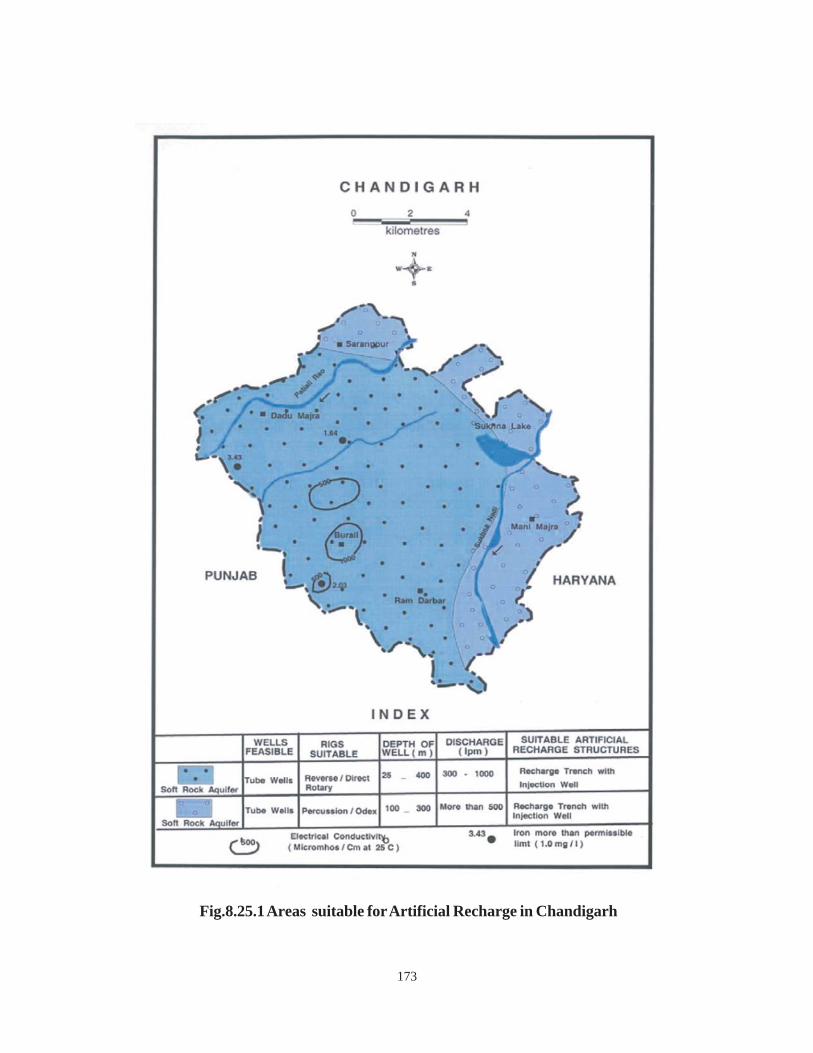
173
Fig.8.25.1 Areas suitable for Artificial Recharge in Chandigarh

174
8.26 DADRA AND NAGAR HAVELI
Union Territory of Dadra and Nagar Haveli (DNH) have geographical area of 491 sq. km. The UnionTerritory comprises of 2 parts namely; (i) Dadra which has only 3 villages and (ii) Nagar Haveli having 69villages. The Eastern part of the DNH is hilly with elevation ranging from 40 – 400 m amsl. The westernpart is plain with elevation up to 40 m amsl. The hilly terrain constitutes about 75 sq. km. of the total area.Annual rainfall is about 2311 mm. As per Census 2011, the total population of DNH is around 3,42,853out of which around 1,83,024 is rural population while 1,59,824 is Urban population. DNH is rich in forestwealth having 53% area under forest. The area is drained by Damanganga river and its tributaries namelyPiparia Nadi, Sakartond Nadi and Dudhni Nadi flowing towards west and Dongarkhadi towards east.
The area is underlain by Deccan Trap (basaltic lava flow) and is intruded by dolerite and trachyte dykes.Small and localized patches of alluvium also occur along river’s bank. Thickness of alluvium is within 9 m.The average depth to water level is 7.47 to 10.45 m bgl during pre-monsoon. However, during post-monsoon it is shallow and ranges between 3.17 to 8.8 m bgl. The average water level fluctuation is 1.65to 4.30 m bgl. The pre-monsoon water level rising trend observed in the range from 0.011 to 0.17 m yearwhile the post monsoon decline trend of 0.06 to 0.08 m /year is observed. However, due to shallow depthto ground water (0-3m) and rich forest cover, the possibilities for artificial recharge to ground water arelimited.
The population of the UT is widely scattered. There is acute shortage of water in summer in hamlets inspite of copious rainfall. Therefore, roof water harvesting is proposed in 1000 households, institutionaland other buildings of the UT. The average cost of roof water collection, transmission and recharge isestimated to be around Rs.15,000/- each. Thus total cost would be about Rs.1.5 crores. There is alsoneed to conserve surface run off near rural water supply schemes supported by check dams/ cement plugsand sub surface dykes at about 50 locations with unit cost of Rs.6 lakhs each. This will cost Rs.3.0 crores.In addition to this, 15 runoff water harvesting schemes are proposed in urban areas of DNH with unit costof Rs. 2.5 lakhs. This will cost Rs.37.5 lakhs (Area identified for Artificial Recharge to Ground Water ispresented in Fig.8.26.1). The total recharge including from roof top rain water harvesting will be 2.94MCM.
The total estimated cost of the rain water harvesting and run off conservation in the UT of Dadra andNagar Haveli is Rs.4.875 crores.
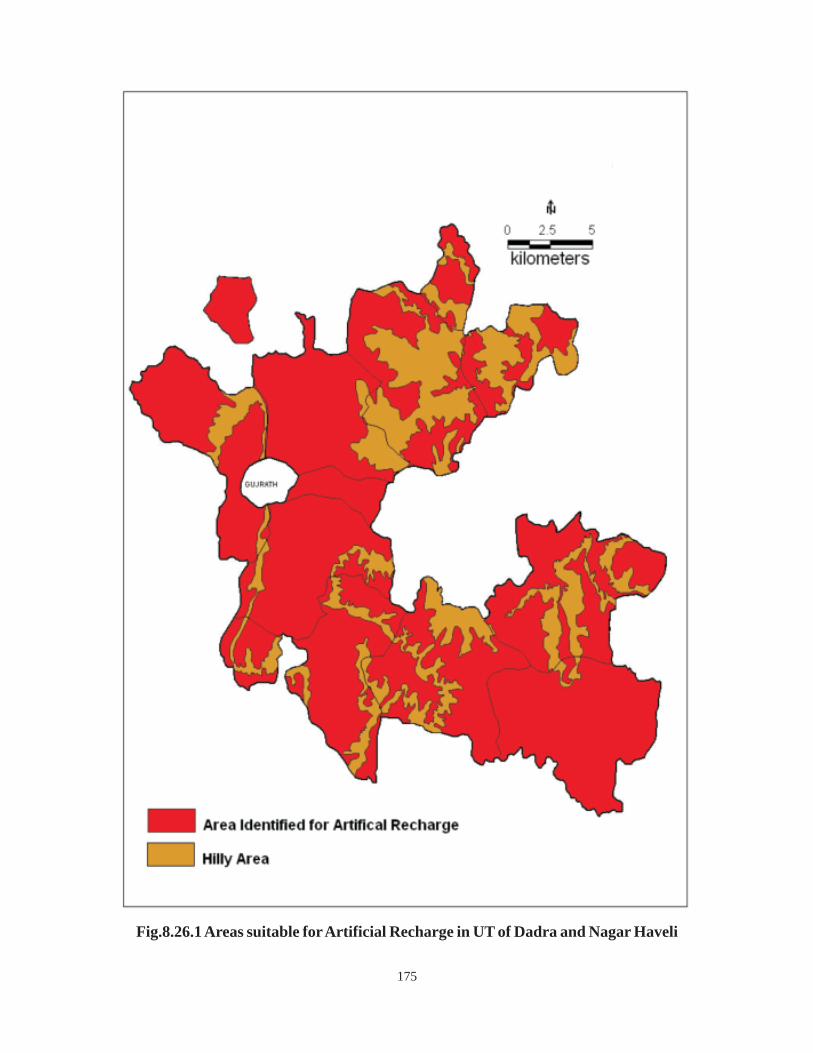
175
Fig.8.26.1 Areas suitable for Artificial Recharge in UT of Dadra and Nagar Haveli

176
8.27 DAMAN AND DIU
The Union Territory of Daman and Diu is constituted by two districts, namely Daman and Diu.
Both the districts of Daman and Diu are near Gujarat state, separated by about 700 kms from one another.The district of Daman is situated on the western coast of India between north latitude 20°27’ 58” and20°22’ 00” and between east longitude 72°49’ 42” and 72°54’ 43” . It is surrounded by Valsad districtof Gujarat state in North, East and South. Damanganga River passes through middle of Daman districtdividing it into two parts namely Moti Daman and Nani Daman. It has total area of 72 sq km; its north tosouth stretch is 11 kms and width from east to west is 8 kms. The altitude is 12 meters above the sea level.Diu district is an island on southern portion of Gujarat Peninsula. It is joined with Una Taluka of GujaratState by two bridges over a sea creek. The district of Diu is situated between the North latitude 20°44’34” and 20°42’ 00” and East longitude 71°00’ 24” and 70°52’ 26” . Its total area is 40 sq km with lengthfrom the extremes north and south, measures 4.6 kms and width from east to west measures 13.8 kms.The altitude is 6 meters above sea level. The topography is generally plain. The hillocks attain maximumheight of 30 meters. As per census report of 2011, population of Daman is 2,42,911 while Diu Island haspopulation of 52,056 souls. Most of the Diu Island area (44 %) is urbanized with tourism and fisherybusiness while Daman district area is relatively semi urban type and also have fishery and various type ofindustry as main occupation.
8.27.1 HYDROGEOLOGY AND FEASIBITY OF ARTIFICIAL RECHARGE
The area of Diu Island is underlain by Quaternary formation consisting of Milliolite rocks and stabilizedsand dunes. The Milliolite rocks (Lime Stone) form the main aquifer system of the area. Most of the aquifersystem down to 6 to 12 m depth below ground level is brackish to saline. The main source of water forboth domestic and industries is through piped water supply from inland areas of Gujarat State. The area ofDaman is underlain by the Deccan Trap Formation of Cretaceous – Eocene age, which occur as mainbasement rocks. The area along Damanganga River estuary and Kalu Nadi, Moti Daman part, is overlainby 10 to 18 m thick river terrace type alluvium formation. Like Diu Island, Daman area also has shallowground water condition with brackish to saline ground water below 10 to 15 m depth. Daman area getspiped water supply from Damanganga Weir projects from inland Vapi area of Gujarat State. For irrigation,canal water is available. Due to limited ground water development, average decadal (2000-09) post-monsoon ground water level in Diu and Daman area is around 3.25 and 3.50 m bgl respectively. Thedecadal ( 2000-09) water trend is +0.0067 m / year and +0.0045 m / year for Diu & Daman arearespectively.
Taking into consideration of shallow water level condition and more or less, stable ground water condition,area of Diu & Daman are not considered for construction of artificial recharge structures likes percolationtanks & check dams. However, taking into consideration of predominate semi urban and urban typeshabitat system, roof top rain water harvesting can be implemented for augmenting local ground waterresources. The Diu Island gets average monsoon rainfall of 750 to 850 mm while Daman area gets around1800 to 2000 mm by south west monsoon system during mid June to September / October months. Asper 2001 census data number of urban household in Diu and Daman are 6354 & 9422 respectively.Estimating 25% houses are suitable for harvesting and considering 40 sq m area per house, total 1.41 lakhsq m areas is available for roof top harvesting in Diu and Daman. The source water available for harvestinghas been taken as 60 % of average annual rainfall of the area, after making allowance for storm rain etc.,
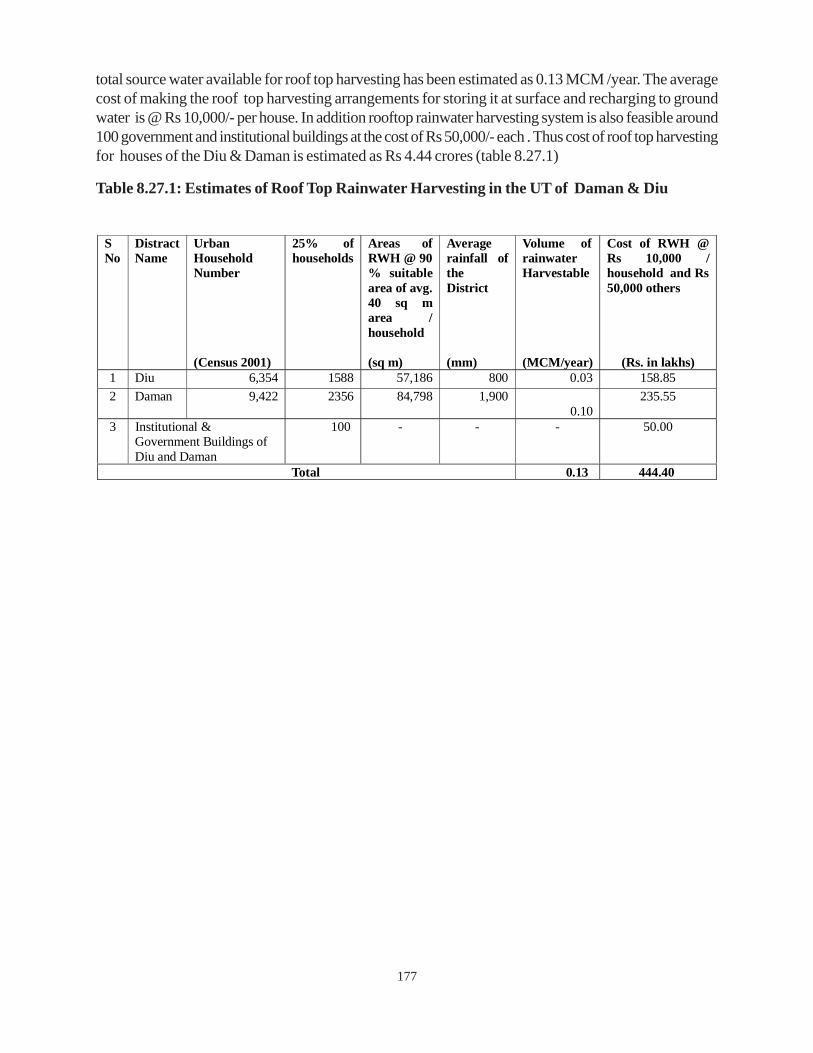
177
total source water available for roof top harvesting has been estimated as 0.13 MCM /year. The averagecost of making the roof top harvesting arrangements for storing it at surface and recharging to groundwater is @ Rs 10,000/- per house. In addition rooftop rainwater harvesting system is also feasible around100 government and institutional buildings at the cost of Rs 50,000/- each . Thus cost of roof top harvestingfor houses of the Diu & Daman is estimated as Rs 4.44 crores (table 8.27.1)
Table 8.27.1: Estimates of Roof Top Rainwater Harvesting in the UT of Daman & Diu
S No
Distract Name
Urban Household Number (Census 2001)
25% of households
Areas of RWH @ 90 % suitable area of avg. 40 sq m area / household (sq m)
Average rainfall of the District (mm)
Volume of rainwater Harvestable (MCM/year)
Cost of RWH @ Rs 10,000 / household and Rs 50,000 others
(Rs. in lakhs)
1 Diu 6,354 1588 57,186 800 0.03 158.85 2 Daman 9,422 2356 84,798 1,900
0.10 235.55
3 Institutional & Government Buildings of Diu and Daman
100 - - - 50.00
Total 0.13 444.40
178
8.28 LAKSHADWEEP
Lakshadweep is the tiniest Union Territory of India and lies about 220 to 440 km from coastal city ofCochin in Kerala. It is an archipelago consisting of 12 atolls, three reefs and five submerged banks. Of its36 islands covering an area of 32 sq. km., only 10 are inhabited. They are Andrott, Amini, Agatti, Bitra,Chetlat, Kadmat, Kalpeni, Kavaratti, Kiltan and Minicoy. Total population of Lakshadweep is 60650(2001 Census) with population density of 1895 persons per sq.km. About 49 percent of the populationresides in urban area.
The fresh ground water resource of the tiny coral atolls of Lakshadweep, by and large, occurs as lensesfloating in hydraulic continuity with seawater. The hydro-geological environment of these islands is complex.The terrain is mostly flat and the surface and near-surface coral medium is porous and permeable. Rainfall,averaging about 1600 mm annually, is the sole source of groundwater recharge in these islands. More than90 per cent of the potable water supply comes from ground water. Increasing demand for water hasresulted in water scarcity in the islands, mainly during summer months. Rainwater harvesting and storage isthe most suitable and cost-effective solution to the water scarcity problems in the Lakshadweep islands inview of the limited sub-surface storage available and the shallow water table conditions. The rainfalldistribution pattern of the Lakshadweep islands show that the average monthly rain fall is more than 40 mmfor eight months a year, from May to December. Further, most of the buildings are tiled roof or RCC roofsand hence ideal for roof water harvesting.
Considering the rainfall pattern, the rainwater harvesting systems may be designed to harvest the rainfallreceived in any two months of the year, except January, February, March and April to collect and storewater enough to meet the requirements of the population for about 100-120 days. In view of the availableroof area, social acceptance and the land availability, collection tanks with capacities of 5, 6, 7& 8m3 willbe ideal for type I, II, III & IV quarters respectively. For type V quarters, two tanks of 5m3 each may beconstructed. In other buildings like schools, colleges, hospitals, Dak bungalows etc. the tank capacity maybe decided as per the roof area and availability of land for construction of tank. For private buildings thecollection tanks of 5m3 is ideal.
The island wise status of roof water harvesting in operation, future scope and financial out lay required bothunder private sector and government sector, taking November and December months as the collectionperiod, are worked out and presented in table 8. 28.1. Based on the demand and availability of fund theschemes can be taken up in a phased manner along with other schemes such as desalination using wasteheat etc. The cost involved in construction of roof water harvesting structure is around Rs. 12/liter of tankcapacity inclusive of eve gutters and fittings, calculated as per schedule of rates for the UT. The total costof installation of rainwater harvesting systems for disaster preparedness/mitigation in the islands is of thetune of about Rs.30.50 crores.
This will sufficient to meet the drinking water demand for another 120 days at the rate of 8 lpcd forindividual households, even if the rainfall during the other four months is not harvested. The advantage ofroof water harvesting scheme over the other schemes is that it is self contained and once implemented theindividual beneficiary can manage, maintain, regulate and operate according to the requirements. Thissense of belonging, independent of government control, makes the scheme more acceptable for privatehouseholds.
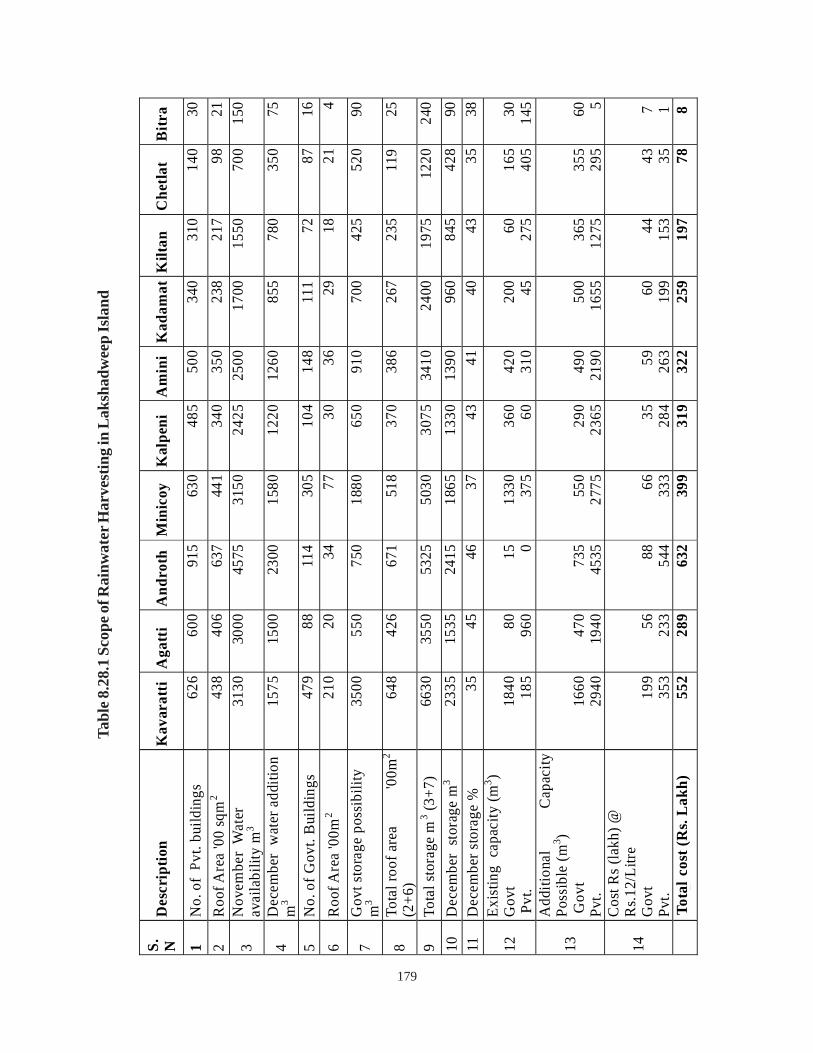
179
Tabl
e 8.2
8.1
Scop
e of R
ainw
ater
Har
vest
ing
in L
aksh
adw
eep
Isla
nd
S. ND
escr
iptio
nK
avar
atti
Aga
tti
And
roth
Min
icoy
Kal
peni
Am
ini
Kad
amat
Kilt
anC
hetla
tB
itra
1N
o.of
vt.b
uild
ings
626
600
915
630
485
500
340
310
140
30
2R
oofA
rea
'00
sqm
243
840
663
744
134
035
023
821
798
21
3N
ovem
ber
Wat
erav
aila
bilit
ym
331
3030
0045
7531
5024
2525
0017
0015
5070
015
0
4D
ecem
ber
wat
erad
ditio
nm
315
7515
0023
0015
8012
2012
6085
578
035
075
5N
o.of
Gov
t.B
uild
ings
479
8811
430
510
414
811
172
8716
6R
oofA
rea
'00m
221
020
3477
3036
2918
214
7G
ovts
tora
gepo
ssib
ility
m3
3500
550
750
1880
650
910
700
425
520
90
8To
talr
oofa
rea
'00m
2
(2+6
)64
842
667
151
837
038
626
723
511
925
9To
tals
tora
gem
3(3
+7)
6630
3550
5325
5030
3075
3410
2400
1975
1220
240
10D
ecem
ber
stor
age
m3
2335
1535
2415
1865
1330
1390
960
845
428
9011
Dec
embe
rsto
rage
%35
4546
3743
4140
4335
38
12Ex
istin
gca
paci
ty(m
3 )G
ovt
Pvt.
1840 18
580 96
015 0
1330 37
536
0 6042
031
020
0 4560 27
516
540
530 14
5
13
Add
ition
alC
apac
ityPo
ssib
le(m
3 )G
ovt
Pvt.
1660
2940
470
1940
735
4535
550
2775
290
2365
490
2190
500
1655
365
1275
355
295
60 5
14C
ostR
s(la
kh)@
Rs.1
2/Li
treG
ovt
Pvt.
199
353
56 233
88 544
66 333
35 284
59 263
60 199
44 153
43 357 1
1To
talc
ost(
Rs.
Lak
h)55
228
963
239
931
932
225
919
778
8
P

180
8.29 PUDUCHERRY
Union Territory of Puducherry has four districts namely Puducherry, Karaikal, Mahe and Yanam and itstotal area is 492 sq. km. Total population of the UT is 12,44,464 (2011 census) and 45% it is engaged inagriculture. Irrigation in Puducherry is mainly through tanks and tube wells.
Puducherry has average rainfall of 1205 mm. Geomorphology of the area is characterized by CoastalPlain, Flood Plains and Pediments. Sandstone and Limestone are main geological formations in the area.Depth to water level ranges between 6 to 35 m bgl. Ground water quality is not potable at places.
As per the water table and vulnerability to sea water ingress, need for artificial recharge is inferred andrecharge structures in the UT of Puducherry is proposed and given in table – 8.29.1
Table – 8.29.1: Artificial Recharge Structures in UT of Puducherry
Roof top rainwater is proposed to be undertaken in 100 govt./ institutional and 900 private buildingshaving average cost of @ Rs 1.25 lakhs & Rs. 20,000/- respectively. This will cost Rs. 3.05 crores andit will harness about 0.27 MCM of rain water. Total cost of the recharge schemes proposed in the UT ofPuducherry covering mainly Puduchery, Karaikal area and in limited way in Mahe and Yanam is Rs. 64.45crores.
Cost of proposed recharge structures (Rs in Lakhs)
Quantum of water recharged through proposed artificial recharge structures
(MCM) P CD/NBs RS/RWs RTWs RTs
(km)
Other Structures
Total Cost of allstructures
Sum of P
Sum of CD/ NB
Sum of RS/ RW
Sum of RTW
Sum of RT
(km)
Sum of others
Total Quantum of recharge potential created
300 3000 800 1750 90 200 6140 3 12 1 30 30 4 80(Rs. in lakhs)
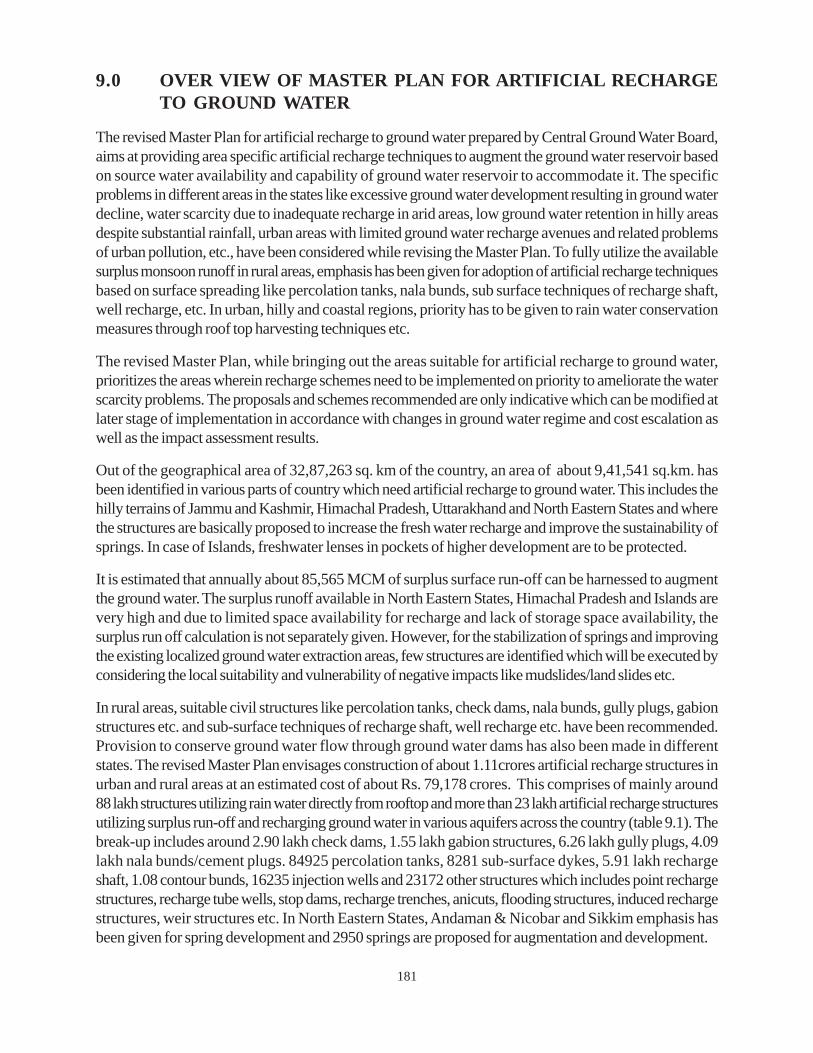
181
9.0 OVER VIEW OF MASTER PLAN FOR ARTIFICIAL RECHARGETO GROUND WATER
The revised Master Plan for artificial recharge to ground water prepared by Central Ground Water Board,aims at providing area specific artificial recharge techniques to augment the ground water reservoir basedon source water availability and capability of ground water reservoir to accommodate it. The specificproblems in different areas in the states like excessive ground water development resulting in ground waterdecline, water scarcity due to inadequate recharge in arid areas, low ground water retention in hilly areasdespite substantial rainfall, urban areas with limited ground water recharge avenues and related problemsof urban pollution, etc., have been considered while revising the Master Plan. To fully utilize the availablesurplus monsoon runoff in rural areas, emphasis has been given for adoption of artificial recharge techniquesbased on surface spreading like percolation tanks, nala bunds, sub surface techniques of recharge shaft,well recharge, etc. In urban, hilly and coastal regions, priority has to be given to rain water conservationmeasures through roof top harvesting techniques etc.
The revised Master Plan, while bringing out the areas suitable for artificial recharge to ground water,prioritizes the areas wherein recharge schemes need to be implemented on priority to ameliorate the waterscarcity problems. The proposals and schemes recommended are only indicative which can be modified atlater stage of implementation in accordance with changes in ground water regime and cost escalation aswell as the impact assessment results.
Out of the geographical area of 32,87,263 sq. km of the country, an area of about 9,41,541 sq.km. hasbeen identified in various parts of country which need artificial recharge to ground water. This includes thehilly terrains of Jammu and Kashmir, Himachal Pradesh, Uttarakhand and North Eastern States and wherethe structures are basically proposed to increase the fresh water recharge and improve the sustainability ofsprings. In case of Islands, freshwater lenses in pockets of higher development are to be protected.
It is estimated that annually about 85,565 MCM of surplus surface run-off can be harnessed to augmentthe ground water. The surplus runoff available in North Eastern States, Himachal Pradesh and Islands arevery high and due to limited space availability for recharge and lack of storage space availability, thesurplus run off calculation is not separately given. However, for the stabilization of springs and improvingthe existing localized ground water extraction areas, few structures are identified which will be executed byconsidering the local suitability and vulnerability of negative impacts like mudslides/land slides etc.
In rural areas, suitable civil structures like percolation tanks, check dams, nala bunds, gully plugs, gabionstructures etc. and sub-surface techniques of recharge shaft, well recharge etc. have been recommended.Provision to conserve ground water flow through ground water dams has also been made in differentstates. The revised Master Plan envisages construction of about 1.11crores artificial recharge structures inurban and rural areas at an estimated cost of about Rs. 79,178 crores. This comprises of mainly around88 lakh structures utilizing rain water directly from rooftop and more than 23 lakh artificial recharge structuresutilizing surplus run-off and recharging ground water in various aquifers across the country (table 9.1). Thebreak-up includes around 2.90 lakh check dams, 1.55 lakh gabion structures, 6.26 lakh gully plugs, 4.09lakh nala bunds/cement plugs. 84925 percolation tanks, 8281 sub-surface dykes, 5.91 lakh rechargeshaft, 1.08 contour bunds, 16235 injection wells and 23172 other structures which includes point rechargestructures, recharge tube wells, stop dams, recharge trenches, anicuts, flooding structures, induced rechargestructures, weir structures etc. In North Eastern States, Andaman & Nicobar and Sikkim emphasis hasbeen given for spring development and 2950 springs are proposed for augmentation and development.
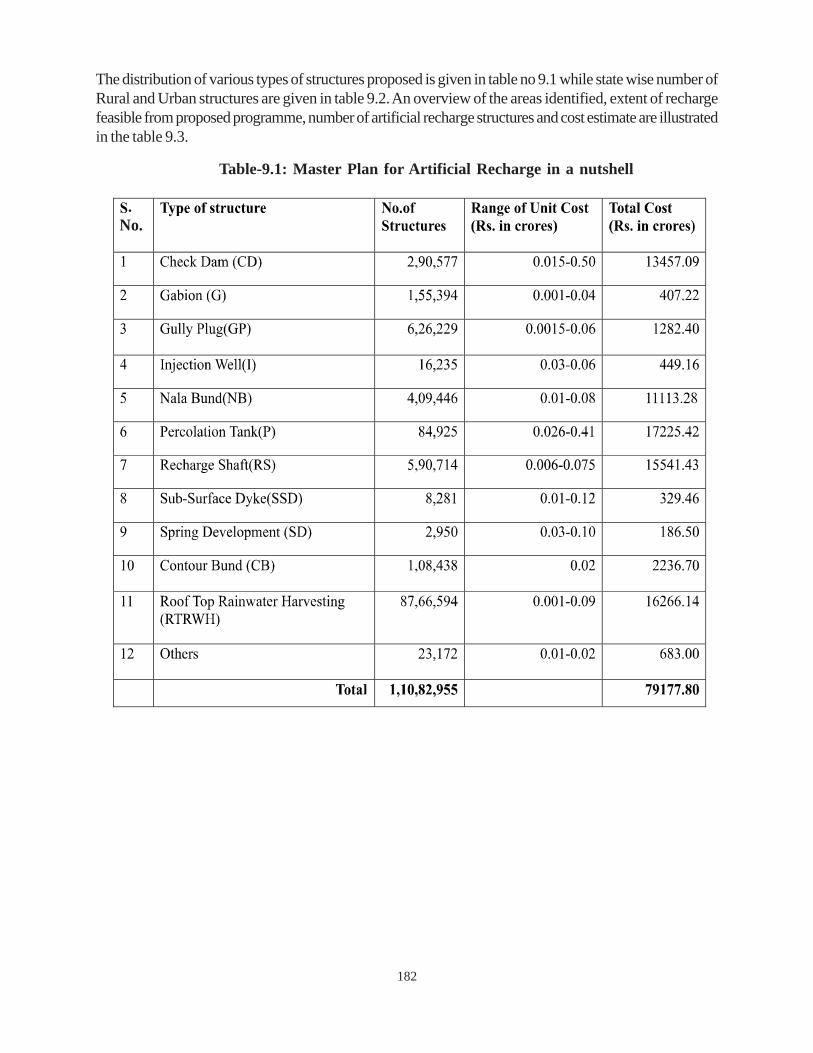
182
The distribution of various types of structures proposed is given in table no 9.1 while state wise number ofRural and Urban structures are given in table 9.2. An overview of the areas identified, extent of rechargefeasible from proposed programme, number of artificial recharge structures and cost estimate are illustratedin the table 9.3.
Table-9.1: Master Plan for Artificial Recharge in a nutshell
No..
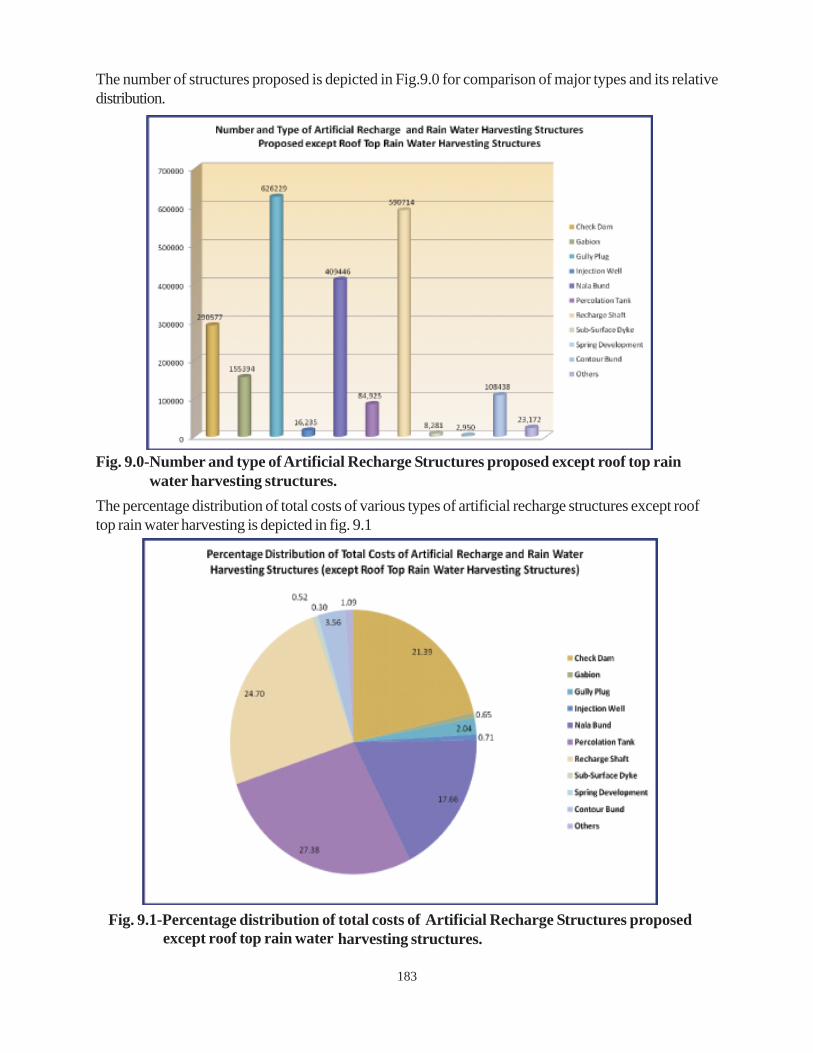
183
The number of structures proposed is depicted in Fig.9.0 for comparison of major types and its relativedistribution.
The percentage distribution of total costs of various types of artificial recharge structures except rooftop rain water harvesting is depicted in fig. 9.1
Fig. 9.0-Number and type of Artificial Recharge Structures proposed except roof top rain water harvesting structures.
Fig. 9.1-Percentage distribution of total costs of Artificial Recharge Structures proposedharvesting structures.except roof top rain water
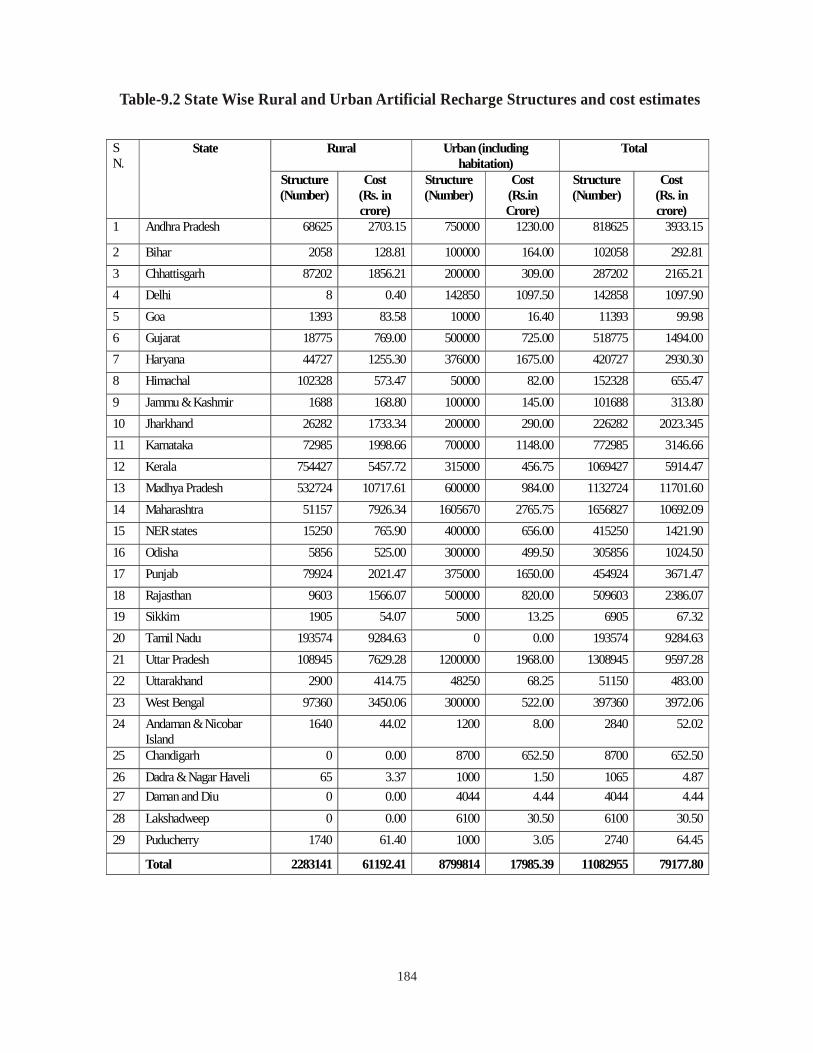
184
Table-9.2 State Wise Rural and Urban Artificial Recharge Structures and cost estimates
Rural Urban (including habitation)
Total S N.
State
Structure (Number)
Cost (Rs. in crore)
Structure (Number)
Cost (Rs.in Crore)
Structure (Number)
Cost (Rs. in crore)
1 Andhra Pradesh 68625 2703.15 750000 1230.00 818625 3933.15
2 Bihar 2058 128.81 100000 164.00 102058 292.81 3 Chhattisgarh 87202 1856.21 200000 309.00 287202 2165.21 4 Delhi 8 0.40 142850 1097.50 142858 1097.90 5 Goa 1393 83.58 10000 16.40 11393 99.98 6 Gujarat 18775 769.00 500000 725.00 518775 1494.00 7 Haryana 44727 1255.30 376000 1675.00 420727 2930.30 8 Himachal 102328 573.47 50000 82.00 152328 655.47 9 Jammu & Kashmir 1688 168.80 100000 145.00 101688 313.80 10 Jharkhand 26282 1733.34 200000 290.00 226282 2023.345 11 Karnataka 72985 1998.66 700000 1148.00 772985 3146.66 12 Kerala 754427 5457.72 315000 456.75 1069427 5914.47 13 Madhya Pradesh 532724 10717.61 600000 984.00 1132724 11701.60 14 Maharashtra 51157 7926.34 1605670 2765.75 1656827 10692.09 15 NER states 15250 765.90 400000 656.00 415250 1421.90 16 Odisha 5856 525.00 300000 499.50 305856 1024.50 17 Punjab 79924 2021.47 375000 1650.00 454924 3671.47 18 Rajasthan 9603 1566.07 500000 820.00 509603 2386.07 19 Sikkim 1905 54.07 5000 13.25 6905 67.32 20 Tamil Nadu 193574 9284.63 0 0.00 193574 9284.63 21 Uttar Pradesh 108945 7629.28 1200000 1968.00 1308945 9597.28 22 Uttarakhand 2900 414.75 48250 68.25 51150 483.00 23 West Bengal 97360 3450.06 300000 522.00 397360 3972.06 24 Andaman & Nicobar
Island 1640 44.02 1200 8.00 2840 52.02
25 Chandigarh 0 0.00 8700 652.50 8700 652.50 26 Dadra & Nagar Haveli 65 3.37 1000 1.50 1065 4.87 27 Daman and Diu 0 0.00 4044 4.44 4044 4.44 28 Lakshadweep 0 0.00 6100 30.50 6100 30.50 29 Puducherry 1740 61.40 1000 3.05 2740 64.45 Total 2283141 61192.41 8799814 17985.39 11082955 79177.80
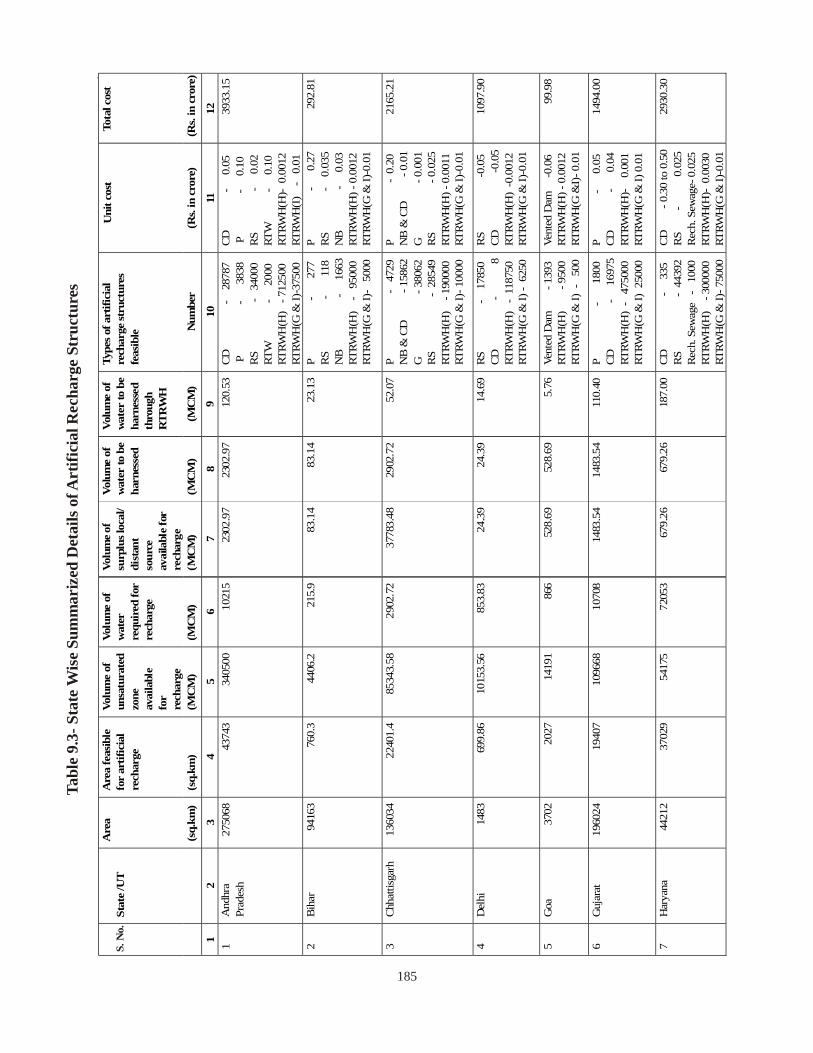
185
Tabl
e 9.
3- S
tate
Wis
e Su
mm
ariz
ed D
etai
ls o
f Art
ifici
al R
echa
rge
Stru
ctur
es
Are
aA
rea
feas
ible
for
artif
icia
lre
char
ge
Volu
me
ofun
satu
rate
dzo
neav
aila
ble
for
rech
arge
Volu
me
ofw
ater
requ
ired
for
rech
arge
Volu
meo
fsu
rplu
sloc
al/
dist
ant
sour
ceav
aila
ble
for
rech
arge
Volu
me
ofw
ater
tobe
harn
esse
d
Volu
me
ofw
ater
tobe
harn
esse
dth
roug
hR
TRW
H
Type
sofa
rtifi
cial
rech
arge
stru
ctur
esfe
asib
le
Uni
tcos
tTo
talc
ost
Stat
e/U
T
(sq.
km)
(sq.
km)
(MC
M)
(MC
M)
(MC
M)
(MC
M)
(MC
M)
Num
ber
(Rs.
incr
ore)
(Rs.
incr
ore)
12
34
56
78
910
1112
1A
ndhr
aPr
ades
h27
5068
4374
334
0500
1021
523
02.9
723
02.9
712
0.53
CD-
2878
7P
-38
38RS
-34
000
RTW
-20
00RT
RWH
(H)
-712
500
RTRW
H(G
&I)
-375
00
CD-
0.05
P-
0.10
RS-
0.02
RTW
-0.
10RT
RWH
(H)-
RTRW
H(I
)-
0.01
3933
.15
2Bi
har
9416
376
0.3
4406
.221
5.9
83.1
483
.14
23.1
3P
-27
7RS
-11
8N
B-
1663
RTRW
H(H
)-
9500
0RT
RWH
(G&
I)-
5000
P-
0.27
RS-
0.03
5N
B-
0.03
RTRW
H(H
)-0.
0012
RTRW
H(G
&I)-
0.01
292.
81
3Ch
hatti
sgar
h13
6034
2240
1.4
8534
3.58
2902
.72
3778
3.48
2902
.72
52.0
7P
-47
29N
B&
CD-1
5862
G-3
8062
RS-
2854
9RT
RWH
(H)
-190
000
RTRW
H(G
&I)
-100
00
P-
0.20
NB
&C
D-0
.01
G-0
.001
RS-0
.025
RTRW
H(H
)-0.
0011
RTRW
H(G
&I)-
0.01
2165
.21
4D
elhi
1483
699.
8610
153.
5685
3.83
24.3
924
.39
14.6
9RS
-17
850
CD-
8RT
RWH
(H)
-11
8750
RTRW
H(G
&I)
-62
50
RS
-0.0
5C
D-0
.05
RTRW
H(H
)-0
.001
2RT
RWH
(G&
I)-0.
01
1097
.90
5G
oa37
0220
2714
191
866
528.
6952
8.69
5.76
Vent
edD
am-1
393
RTRW
H(H
)-9
500
RTRW
H(G
&I)
-50
0
Vent
edD
am-0
.06
RTRW
H(H
)-0.
0012
RTRW
H(G
&I)
-0.0
1
99.9
8
6G
ujar
at19
6024
1940
710
9668
1070
814
83.5
414
83.5
411
0.40
P-
1800
CD-
1697
5RT
RWH
(H)
-47
5000
RTRW
H(G
&I)
2500
0
P-
0.05
CD-
0.04
RTRW
H(H
)-0.
001
RTRW
H(G
&I)
0.01
1494
.00
7H
arya
na44
212
3702
954
175
7205
367
9.26
679.
2618
7.00
CD-
335
RS-
4439
2Re
ch.S
ewag
e-
1000
RTRW
H(H
)-3
0000
0RT
RWH
(G&
I)-7
5000
CD
-0.3
0to
0.50
RS
-0.
025
Rec
h.Se
wag
e-0.
025
RTRW
H(H
)-0.
0030
RTRW
H(G
&I)-
0.01
2930
.30
S.N
o.
0.00
12
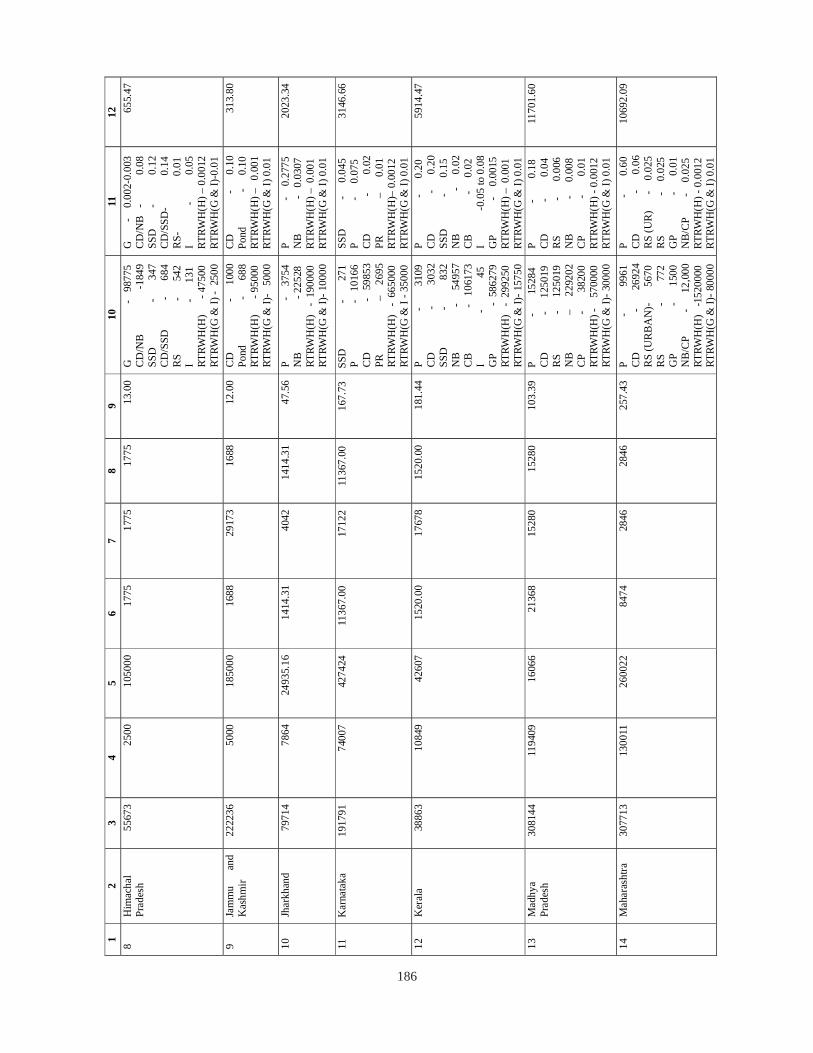
186
1 2
3 4
5 6
7 8
9 10
11
12
8
Him
acha
l Pr
ades
h 55
673
2500
10
5000
17
75
1775
17
75
13.0
0 G
-
987
75
CD
/NB
-
1849
SS
D
-
3
47
CD
/SSD
-
684
RS
-
542
I
-
1
31
RTRW
H(H
)
- 47
500
RT
RWH
(G &
I) -
250
0
G
-
0.
002-
0.00
3 C
D/N
B
-
0.08
SS
D
-
0
.12
CD
/SSD
-
0.1
4 R
S-
0.01
I
-
0.05
RT
RWH
(H) –
0.0
012
RTRW
H(G
& I)
-0.0
1
655.
47
9 Ja
mm
u an
d K
ashm
ir 22
2236
50
00
1850
00
1688
29
173
1688
12
.00
CD
-
100
0 Po
nd
-
68
8 RT
RWH
(H)
-
9500
0
RTRW
H(G
& I)
- 5
000
CD
-
0
.10
Pond
-
0.1
0 RT
RWH
(H) –
0.
001
RTRW
H(G
& I)
0.0
1
313.
80
10
Jhar
khan
d 79
714
7864
24
935.
16
1414
.31
4042
14
14.3
1 47
.56
P
-
3754
N
B
-
225
28
RTRW
H(H
) -
190
000
RT
RWH
(G &
I)- 1
0000
P
- 0
.277
5 N
B
-
0.0
307
RTRW
H(H
) – 0
.001
RT
RWH
(G &
I) 0
.01
2023
.34
11
Kar
nata
ka
1917
91
7400
7 42
7424
11
367.
00
1712
2 11
367.
00
167.
73
SSD
-
271
P
-
101
66
CD
- 5
9853
PR
–
269
5 RT
RWH
(H)
- 6
6500
0
RTRW
H(G
& I
- 350
00
SSD
-
0
.045
P
-
0.
075
CD
-
0
.02
PR
–
0.01
RT
RWH
(H)–
0.0
012
RTRW
H(G
& I)
0.0
1
3146
.66
12
Ker
ala
3886
3 10
849
4260
7 15
20.0
0 17
678
1520
.00
181.
44
P
-
3109
C
D
-
3
032
SSD
-
832
N
B
-
549
57
CB
-
106
173
I
-
45
GP
-
586
279
RTRW
H(H
) -
299
250
RT
RWH
(G &
I)- 1
5750
P
-
0.2
0 C
D
-
0.2
0 SS
D
-
0
.15
NB
-
0
.02
CB
-
0.
02
I
-0.
05 to
0.0
8 G
P
-
0.0
015
RTRW
H(H
) – 0
.001
RT
RWH
(G &
I) 0
.01
5914
.47
13
Mad
hya
Prad
esh
3081
44
1194
09
1606
6 21
368
1528
0 15
280
103.
39
P
-
15
284
CD
-
125
019
RS
-
125
019
NB
–
229
202
CP
-
3
8200
RT
RWH
(H) -
5
7000
0
RTRW
H(G
& I)
- 300
00
P
-
0.1
8 C
D
-
0.04
R
S
-
0
.006
N
B
-
0
.008
C
P
-
0.01
RT
RWH
(H) -
0.0
012
RTRW
H(G
& I)
0.0
1
1170
1.60
14
Mah
aras
htra
30
7713
13
0011
26
0022
84
74
2846
28
46
257.
43
P
-
9961
C
D
-
269
24
RS
(UR
BA
N)-
5670
R
S
-
7
72
GP
-
1500
N
B/C
P
-
12,0
00
RTRW
H(H
) -1
5200
00
RTRW
H(G
& I)
- 800
00
P
-
0.
60
CD
-
0
.06
RS
(UR
)
-
0.02
5 R
S
-
0
.025
G
P
-
0.01
N
B/C
P
-
0.
025
RTRW
H(H
) - 0
.001
2 RT
RWH
(G &
I) 0
.01
1069
2.09
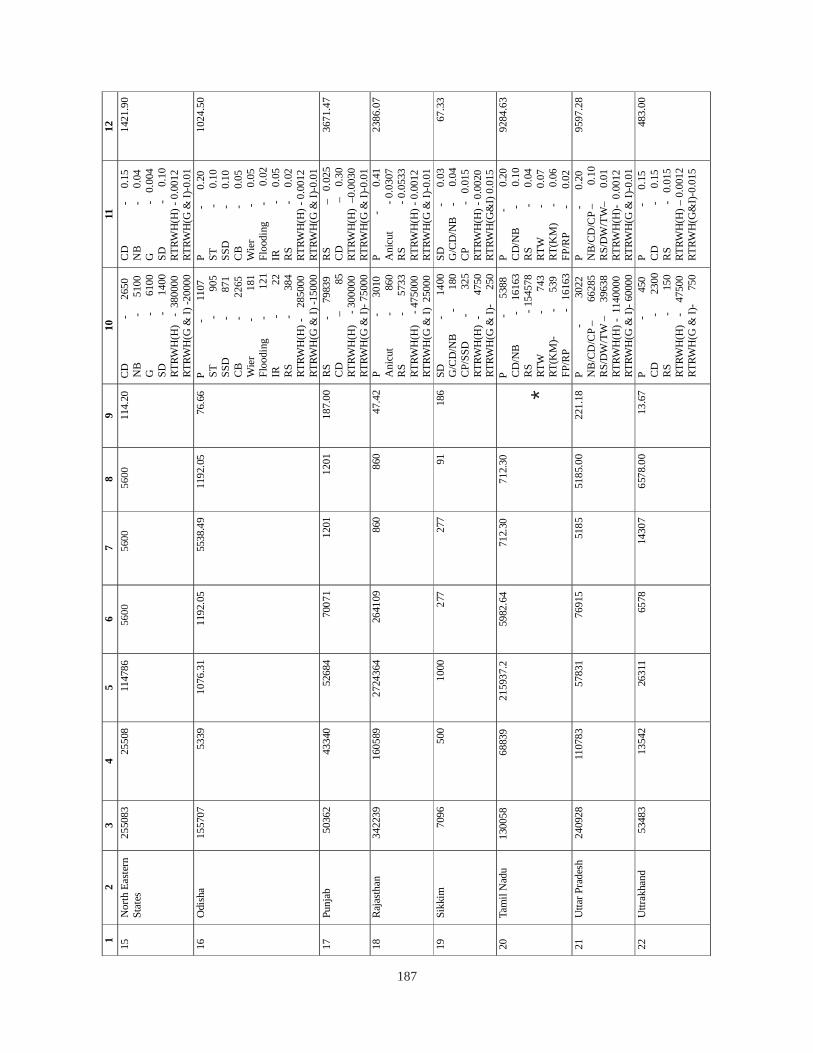
187
12
34
56
78
910
1112
15r
Nor
thEa
ste
nSt
ates
2550
8325
508
1147
8611
4.20
CD
-26
50N
B-
5100
G-
6100
SD-
1400
RTRW
H(H
)-
3800
00RT
RWH
(G&
I)-2
0000
CD
-0.
15N
B-
0.04
G-
0.00
4SD
-0.
10RT
RWH
(H)-
0.00
12RT
RWH
(G&
I)-0.
01
1421
.90
16O
dish
a15
5707
5339
1076
.31
1192
.05
5538
.49
1192
.05
76.6
6P
-11
07ST
-90
5SS
D-
871
CB
-22
65W
ier
-18
1Fl
oodi
ng-
121
IR-
22R
S-
384
RTRW
H(H
)-28
5000
RTRW
H(G
&I)
-150
00
P-
0.20
ST-
0.10
SSD
-0.
10C
B-
0.05
Wie
r-
0.05
Floo
ding
-0.
02IR
-0.
05R
S-
0.02
RTRW
H(H
)-0.
0012
RTRW
H(G
&I)-
0.01
1024
.50
17Pu
njab
5036
243
340
5268
470
071
1201
1201
187.
00R
S-
7983
9C
D–
85RT
RWH
(H)
-300
000
RTRW
H(G
&I)-
7500
0
RS
–0.
025
CD
–0.
30RT
RWH
(H)
–0.0
030
RTRW
H(G
&I)-
0.01
3671
.47
18R
ajas
than
3422
3916
0589
2724
364
2641
0986
086
047
.42
P-
3010
Ani
cut
-86
0R
S-
5733
RTRW
H(H
)-4
7500
0RT
RWH
(G&
I)25
000
P-
0.41
Ani
cut
-0.0
307
RS
-0.0
533
RTRW
H(H
)-0.
0012
RTRW
H(G
&I)-
0.01
2386
.07
19Si
kkim
7096
500
1000
277
277
9118
6SD
-G
/CD
/NB
-18
0C
P/SS
D-
325
RTRW
H(H
)-
4750
RTRW
H(G
&I)-
250
SD-
0.03
G/C
D/N
B-
0.04
CP
-0.
015
RTRW
H(H
)-0.
0020
RTRW
H(G
&I)
0.01
5
67.3
3
20Ta
mil
Nad
u13
0058
6883
921
5937
.259
82.6
471
2.30
712.
30P
-53
88C
D/N
B-
1616
3R
S-1
5457
8RT
W-
743
RT(K
M)-
-53
9FP
/RP
-16
163
P-
0.20
CD
/NB
-0.
10R
S-
0.04
RTW
-0.
07RT
(KM
)-
0.06
FP/R
P-
0.02
9284
.63
21U
ttarP
rade
sh24
0928
1107
8357
831
7691
551
8551
85.0
022
1.18
P-
3022
NB
/CD
/CP
–66
285
RS/
DW
/TW
–39
638
RTRW
H(H
)-11
4000
0RT
RWH
(G&
I)-60
000
P-
0.20
NB/
CD/C
P–
0.10
RS/
DW
/TW
–0.
01RT
RWH
(H)-
0.00
12RT
RWH
(G&
I)-0.
01
9597
.28
22U
ttrak
hand
5348
313
542
2631
165
7814
307
6578
.00
13.6
7P
-45
0C
D-
2300
RS
-15
0RT
RWH
(H)
-47
500
RTRW
H(G
&I)-
750
P-
0.15
CD
-0.
15R
S-
0.01
5RT
RWH
(H)–
0.00
12RT
RWH
(G&
I)-0
.015
483.
00
014
0
*
5600
5600
5600
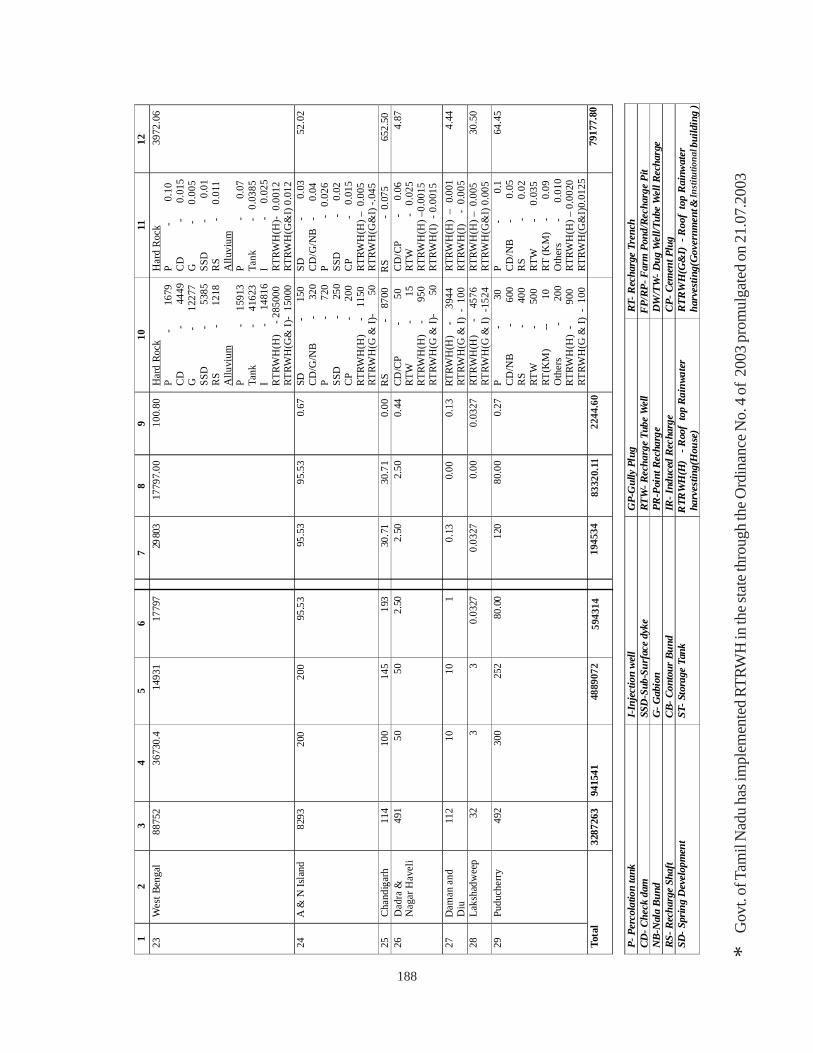
188
Gov
t. of
Tam
il N
adu
has i
mpl
emen
ted
RTRW
H in
the s
tate
thro
ugh
the O
rdin
ance
No.
4 o
f 20
03 p
rom
ulga
ted
on 2
1.07
.200
3*
12
34
56
78
910
1112
23W
estB
enga
l88
752
3673
0.4
1493
117
797
2980
317
797.
0010
0.80
Har
dRo
ckP
-16
79C
D-
4449
G-
1227
7SS
D-
5385
RS
-12
18A
lluvi
umP
-15
913
Tank
-41
623
I-
1481
6RT
RWH
(H)
-285
000
RTRW
H(G
&I)
-15
000
Har
dR
ock
P-
0.10
CD
-0.
015
G-
0.00
5SS
D-
0.01
RS
-0.
011
Allu
vium
P-
0.07
Tank
-0.
0385
I-
0.02
5RT
RWH
(H)-
0.00
12RT
RWH
(G&
I)0.
012
3972
.06
24A
&N
Isla
nd82
9320
020
095
.53
95.5
395
.53
0.67
SD-
150
CD
/G/N
B-
320
P-
720
SSD
-25
0C
P-
200
RTRW
H(H
)-
1150
RTRW
H(G
&I)-
50
SD-
0.03
CD
/G/N
B-
0.04
P-
0.02
6SS
D-
0.02
CP
-0.
015
RTRW
H(H
)–0.
005
RTRW
H(G
&I)
-.045
52.0
2
25C
hand
igar
h11
410
014
519
330
.71
30.7
10.
00R
S-
8700
RS
-0.
075
652.
5026
Dad
ra&
Nag
arH
avel
i49
150
502.
502.
502.
500.
44CD
/CP
-50
RTW
-15
RTRW
H(H
)-
950
RTRW
H(G
&I)-
50
CD
/CP
-0.
06RT
W-
0.02
5RT
RWH
(H)–
0.00
15RT
RWH
(I)
-0.0
015
4.87
27D
aman
and
Diu
112
1010
10.
130.
000.
13RT
RWH
(H)
-39
44RT
RWH
(G&
I)-
100
RTRW
H(H
)–
0.00
1RT
RWH
(I)
-0.
005
4.44
28La
ksha
dwee
p32
33
0.03
270.
0327
0.00
0.03
27RT
RWH
(H)
-45
76RT
RWH
(G&
I)-1
524
RTRW
H(H
)–0.
005
RTRW
H(G
&I)
0.00
530
.50
29Pu
duch
erry
492
300
252
80.0
012
080
.00
0.27
P-
30C
D/N
B-
600
RS
-40
0RT
W-
500
RT(K
M)
--10
Oth
ers
-20
0RT
RWH
(H)
-90
0RT
RWH
(G&
I)-
100
P-
0.1
CD
/NB
-0.
05R
S-
0.02
RTW
-0.
035
RT(K
M)
-0.
09O
ther
s-
0.01
0RT
RWH
(H)–
0.00
20RT
RWH
(G&
I)0.
0125
64.4
5
Tota
l32
8726
394
1541
7917
7.80
P-Pe
rcol
atio
nta
nkI-
Inje
ctio
nw
ell
GP-
Gul
lyPl
ugRT
-Rec
harg
eTr
ench
CD-C
heck
dam
SSD
-Sub
-Sur
face
dyke
RTW
-Rec
harg
eTu
beW
ell
FP/
RP-F
arm
Pond
/Rec
harg
ePi
tN
B-N
ala
Bun
dG
-Gab
ion
PR-P
oint
Rech
arge
DW
/TW
-Dug
Wel
l/Tub
eW
ellR
echa
rge
RS-R
echa
rge
Shaf
tC
B-Co
ntou
rBu
ndIR
-Ind
uced
Rec
harg
eC
P-Ce
men
tPlu
gSD
-Spr
ing
Dev
elop
men
tST
-Sto
rage
Tank
RTR
WH
(H)
-Roo
fto
pR
ainw
ater
harv
estin
g(H
ouse
)R
TRW
H(G
&I)
-Roo
fto
pR
ainw
ater
harv
estin
g(G
over
nmen
t&bu
ildin
g)
4889
072
5943
1419
4534
8332
0.11
2244
.60
Inst
itutio
nal
189
10.0 ROAD MAP OF IMPLEMENTATION
The implementation of the revised master plan at estimated cost of Rs. 79,178 crores is proposed with theparticipatory approach of State and Central Government agencies, Industries, NGO’s, VOs, communityand research institutions. The Revised Master Plan envisages the optimal level of harnessing rain waterharvesting in the country with a projection of the total present cost for completing the required structures.The priority areas are identified in water scarcity and water quality problem areas in various hydrogeologicalterrains. The high rainfall areas in the country have water scarcity in summer months and low rainfall areasare prone to water scarcity for the entire year. The need for implementing the rain water harvesting schemeis not only widely discussed in many forums and but also debated by the stake holders and unfortunately,the implementation is not to the desired level. The technical issues are also addressed in many seminars andinstitutions but same is yet to be translated into effective recharge program in ground. Also, the integratedapproach with concerned agencies are not effective in many areas However, the demonstrative artificialrecharge structures implemented by CGWB through various state agencies in an integrated manner duringXI five year plan period has proved to be successful. The implementation of the scheme involves numberof agencies/resources persons and site selection is to be done based on technical feasibility. The presentactivities under various schemes are to be properly integrated before taking new works. The entire rechargeto ground water program is planned to be completed in 10 years time, i.e. the twelfth and thirteenth planperiod itself. Presently, various schemes are taken up under following programmes.
• Watershed development
• Bharat Nirman
• Irrigated Agriculture modernization, water bodies restoration and management project (IAMWARM)
• Drought prone area programme (DPAP)
• National Watershed Development programme for rain fed areas (NWDPRA)
• NABARD assisted rainwater harvesting programme for augmentation of ground water recharge
• Rehabilitation of tanks identified by MLAs
• Command area development & Water Management program
• Mahatma Gandhi National Rural Employment Guarantee programme (MGNREGA)
• Water conservation in reserved forest area
• Dug well recharge program by NABARD and State agencies in seven States
• Local area development programme of M.P & M.L.A
There are many more state and central as well as Corporate Social Response (CSR) program and aidedprojects particularly in the drought prone and disaster prone areas implemented over years. The communitiesalso have the traditional RWH systems for storage of runoff in surface for direct use however with time theneed for recharge in aquifer system has gained priority. Some of the conservation and recharge schemes
190
make conflicts within the stake holders and there are number of irrigation tanks in southern states which areconverted into recharge systems by desilting and plugging the traditional tank irrigation sluices. Hence, thebasic approach of beneficial use of rain water in surface or sub-surface needs participatory communityapproach. The technical input in the form of GIS layers for locating recharge structures are executed insome states and the duplication of work by different agencies is also reported and hence optimum additionalstructures only recommended in the plan. The non filling of non system tanks even in good monsoon periodin parts of the hard rock terrain is inferred as the result of deficient soil moisture situation and deeper watertable thereby the generation of runoff is negligible. Such areas are identified and the surplus run off availablein part of watershed is considered for the natural flow downstream and additional structures are feasibleonly by transporting surplus water from adjoining watersheds and or diversion of flood water by a dedicatedcanal system. The micro level planning by state with district level data base is essential for actual formulationof schemes and only broad outline of the physical and financial targets for implementation in the coming tenyears are indicated in the plan.
10.1 CGWB SCHEME FOR XII PLAN PERIOD
It is recommended to consider a new scheme of artificial recharge under central sector scheme for theXIIth plan period with an outlay of Rs 5000 crores with Rs 500 crores in first year, 1000 crores each insecond and third year and 1250 crores each in fourth and fifth year. It will be a 100 % central assistance toinnovative schemes in identified areas for total water resources improvement in terms of quantity andquality. The prioritized areas include: the areas notified by CGWA (Presently 82 nos) which have to bebrought back into safe level for de-notification, areas identified for registration where stage of developmentis very high, coastal aquifers having threat of sea water ingress and other specific stress areas identified. Asper latest ground water resource assessment on 31st March, 2009 out of the 5842 assessment units in thecountry, 802 units have been categorized as ‘Over-exploited’, 169 are critical, 523 units are semi-critical.The areas which fall in these categories which require urgent interventions by artificial recharge, are locatedin states/UTs such as Andhra Pradesh (falling in districts Anantapur, Chittor, Kadapa, Karimnagar, Kurnool,Medak, Mehboobnagar, Nizamabad, Prakasham, Ranga Reddy, Warangal, East and West Godvari),Delhi (All districts except North and Central Delhi), Haryana (falling in districts Bhiwani, Faridabad, Gurgaon,Kaithal, Karnal, Kurukshetra, Mahendragarh, Panipat, Rewari, Sonepat, Sirsa and Yamunanagar), Kerala(falling in districts Trivendrum, Kasargod and Ernakulam) , Karnataka (falling in districts Banaglore-Rural& Urban, Belgaum, Chitraduga, Kolar, Tumkur), Punjab (falling in districts Amritsar, FategarhShib, Jalandhar,Kapurthala, Ludhiana, Manssa, Moga, Nwanshahr, Patiala, and Sangrur), Tamil Nadu (falling in districtsCoimbature, Dharmapuri, Dindigul, Krishnagiri, Nagapattinam, Namakkal, Salem, Theni, Tiruvallur,Tiruvannamalai, Tuticorin, Vellore, and Villupuram), Uttar Pradesh (falling in districts Agra, Budaun, Baghpat,Barielly, Hatras, JyotibaPhule Nagar, Moradabad, Saharanpur), West Bengal (falling in districts Murshidabadand Nadia), and Union territories of Puducherry and Diu. The recharge schemes proposed in respect ofover-exploited sedimentary aquifers like Neyveli aquifer, Tiruvandanai aquifer in Tamil Nadu, Rajahmundrysandstone in Andhra Pradesh, deeper aquifers (below 120 m depth) in notified area of Haldia, WestBengal, deepeer aquifers of Punjab and Haryana require multi agency recharge projects with internationalagency support also. Site selection should be taken up duly following hydrogeological conditions anddesign components of storage system and recharge methods.
The experience gained by demonstrative artificial recharge projects indicates the limited benefit from thecheck dams in comparison to percolation ponds and desilting of tanks. The prevailing working condition ofmany recharge structures is not satisfactory and the O&M cost is not available with the local bodies forrepairs. Also, providing additional structures like recharge shafts in ponds and recharge bore wells in
191
check dam , farm pond etc will have effective recharge and the total watershed approach for such workswere experimented successfully in Karuvattar watershed, Namakkal district, Tamil Nadu and such schemesare proposed in various states. The salient features of such completed schemes like Gangavalli blockinTamil Nadu, Injection well in Neyveli area, Water shed improvement in Karuvattar watershed, Rechargein Palla area, New Delhi, project in Lucknow can be replicated in other parts of the country.The thirteenthplan period should have additional Rs10,000 crores worth activity in similar pattern.
10.2 COMMUNITY PROGRAM
Part of the proposed recharge structures has to be implemented by the community in coming 10 years withformation of watershed wise beneficiary committee and getting fund under state sector with 10 % contributionfrom the community in the line of other state sector schemes like RRR work. An amount in the order of20,000 crores should come from the state sector and community, particularly for the O & M cost ofexisting and new recharge structures to be created in rural areas.
Roof top rain water harvesting should be made mandatory for urban and peri-urban areas by involvingurban bodies & communities. In Tamil Nadu, roof top rain water harvesting has been made mandatory. InAndhra Pradesh also, construction of rain water harvesting pit is made compulsory for issuing buildingplan. Similarly many states have made such provisions. As per the status of enactment of RTRWH byvarious states, it is mandatory for roof areas of 100 sq.m / 200 sq.m or above. As roof top harvesting fromindividual houses and recharge to ground water is the best option available, it is suggested for even smallroof top of 50 to 100 sq.m. In order to mitigate liquid and solid waste disposal problems, appropriatemeasures are being taken up for protecting the existing water bodies and aquifers by harnessing rain waterfrom roofs. Roof Top Rain Water Harvesting from cluster of houses will be more effective than adopting inindividual houses, particularly in case of urban areas. The state-wise roof top rain water harvesting proposalfor urban areas is to be covered under community program.
10.3 INDUSTRIES
The estimated cost of about 20,000 crores should be spent by the industries particularly who are using theground water as raw material and also for commercial use. CGWA has already given guidelines for theimplementation of RWH by industries, infra structure development agencies and mining industry that areseeking NOC for new projects or for expansion program and same should be made mandatory for theexisting industries also. In case there is no scope for artificial recharge in plant area due to geologicalconditions like lack of weathered thickness as well as occurrence of saline aquifer, where the rechargedwater can not be economically drawn from the aquifers, the storage in surface is the best option for directuse. However, on case to case basis, the industry is to be given mandatory instructions to harvest rainwater and recharge to ground water, atleast 2 % of total water pumped. Such recharge can be taken withinthe factory premises or at least in the watershed/sub basin within the respective state to improve overallground water scenario in the state. There are many industries viz. thermal plants/steel industry and otherwater intensive industries, tapping ground water to the tune of 40-50 MCM per year from river sources.Such industries should be given mandate for harvesting rain water and recharge ground water systemwhich will pave way for improving ground water situation in the entire region.
10.4 CENTRAL/ STATE GOVERNMENT SCHEMES
Presently, number of state and central government programs have regular budgetary program for waterharvesting, water conservation and sustainability of water sources for drinking water supply. The major

192
works are carried out by Forest Department, National Rain Fed Authority, Agriculture departments, DrinkingWater Supply departments, Panchayat Raj Institutions under MGNREGA work in particular, DrinkingWater supply Department of GOI under Drinking Water Mission for sustainability of sources like Oorani(pond), head works. A district level co-ordination committee under District Collector and select fundingAgency as well as implementing agency as members, is recommended to have an overall monitoring of therecharge program in accordance with the master plan and in an affective scientific and participatory approach.The estimated work of Rs. 24,178 crores in ten years for specific recharge to ground water in accordancewith the periodic assessment of the need and priority in the districts are recommended.The cost escalationwith time can be monitored and the ground water development and land use pattern change with time, theimpact of climate change and its ground reality can be periodically reviewed by the district, state andnational level ground water development and management committee.
The broad outline recommended for implementing the Revised Master Plan of artificial recharge to groundwater in the country will ensure the optimal recharge to ground water system in the country and improvethe water resources sustainability to various uses.
193
Annexure I-A
CONCEPT PAPER ON COMPREHENSIVE NATIONAL RECHARGE PROGRAMME INTHE COUNTRY
The dependency on groundwater has increased many folds during the recent years and the groundwaterextraction for irrigation, domestic and industries have resulted in lowering of water levels, long-term waterlevel declining trend and even drying up of wells. In order to regulate the groundwater development,Central Ground Water Board in association with State Ground Water Departments has computed DynamicGroundwater Resources and categorized blocks as Over Exploited, Critical, Semi Critical and Safe.
Central Ground Water Board had also taken up Pilot Artificial Recharge studies under Central SectorSchemes to augment the groundwater resources during VIII, IX & X Plans. The pilot schemes which weremostly point recharge program, have been executed through the State Agencies and NGOs with technicaland financial support of Central Ground Water Board. With the experience gained in Central SectorScheme, it was felt that artificial recharge schemes taken up with scientific approach in a compact areacould bring in more benefit and accordingly “Demonstrative Projects on Artificial Recharge to Groundwater”was envisaged as a pilot study, in over exploited blocks of the country.
Based on the Groundwater Resources Estimation, Central Ground Water Authority has notified areas forregistration of groundwater abstraction structures and regulation of groundwater extraction. DemonstrativeProjects on Artificial Recharge to groundwater have been taken up in selected notified blocks in thecountry to improve the overall groundwater situation in the block. One such study taken up in Gangavalliblock of Salem district in Tamil Nadu has proved the success of integrated scientific approach by stateagencies and also the constructive response from local people. The lessons learnt also include the need forlong term maintenance strategy and resolving the local disputes created by vested interest people. Thereluctance of the common people in participation in the recharge program is a social constraint which hasto be removed by mass awareness program and participatory approach in decision making on the type ofstructures as well as its location and maintenance. The philosophy of de-notifying the area due to improvedground water situation can be initiated by ensuring the application of modern irrigation practices andstabilizing the draft component also to change the “Over exploited” categorization to “Safe” category.Keeping this objective of increasing the recharge and reducing the draft, the line departments have toinitiate action plan. The best option lies in improving the recharge component in any well defined administrativeor natural boundary (Block/ Water shed) by an integrated scientific approach with people participatoryprogram. Such program also needs to include cost effective structures and best practices possible withoutdeteriorating the existing surface and ground water resources in terms of quantity and quality.
Central Ground Water Board had formulated a Master Plan for the whole country to recharge the shallowaquifer. The criteria considered for the selection of sites were as given below
• Post monsoon water level (>3 m bgl) & Declining long term water level trend (>0.1m/year)
• Post monsoon water level (>9 m bgl) with either rising or declining long term water level Trend
• Availability of uncommitted surplus run off
On the basis of experience in pilot studies under Central Sector Schemes, check dam and percolationponds were suggested as recharge structures. However, the experience had shown that these structures incombination with recharge wells would be more effective in recharging the aquifers. The desilting of the

194
existing structures may be given priority over new structures. Further, check dam should be the last optionand if necessary, it may be combined with recharge wells. The funding from various State and Centralagencies is utilized for augmentation of groundwater resources. The existing programmes under Central &State Assistance are as follows.
1. Watershed Development in which check dams and contour bunding etc are made which indirectlyaugment groundwater
2. Bharat Nirman in which water bodies are renovated to augment irrigation potential, which incidentallyincrease the recharge to groundwater.
3. IAMWARM (Irrigated Agriculture Modernization, Water Bodies Restoration and ManagementProject) whose objective is to improve the irrigation service delivery & augment the productivity byeffective water management. This covers the whole ambit of irrigation system, which would indirectlybenefit the groundwater system.
4. Drought Prone Area Programme, whose objectives have undergone change from modification ofinfrastructure to creation of rainwater harvesting and overall economic development through watershedactivities.
5. NWDPRA (National Watershed Development Programme for Rain fed Areas)
6. NABARD assisted Rainwater harvesting Programme for augmentation of groundwaterrecharge
7. Rehabilitation of tanks identified by MLAs
8. Command Area Development & Water Management Programme
9. NREGP (National Rural Employment Guarantee Programme)
10. Water Conservation in Reserved Forest Area
11. Dug Well Recharge Progamme by NABARD and State Departments in seven states.
12. Local Area Development Programme of M.P.& M.L.A
The schemes mentioned above show that though Governments have taken initiatives to improve the waterresources and in particular groundwater, the efforts are uncoordinated and their impacts are not in desiredmagnitude. The structures have become ineffective either due to non-maintenance after construction ordue to defective designs. Thus, there is a need to have a holistic view while planning the artificial rechargeschemes and dovetail the existing programmes to augment the groundwater resources so as to make theprecious resources sustainable.
It is also noticed that there are small fresh water lenses which may not show the continuous decline in levelor the pre monsoon water level may be less than 9 m where the artificial recharge is more essential. Thepost monsoon level may be also less than 3 m and the quality of ground water needs improvement by rainwater dilution. In order to accommodate more micro-level issues, it is mandatory to consider the localground slope, rainfall pattern, soil cover, lithological disposition and prevailing ground water developmentscenario as well as water quality aspects of the surface and sub-surface water resources. In order to give
195
more thrust on the long term benefit, the surplus run off consideration in a basin needs micro level catchmentsanalysis to know the most critical locations of water deficiency and the nearest area of surplus run off. Thelocal precipitation and also transported water needs to be considered in totality for the recharge scheme.The existing natural and man-made structures and their effectiveness in ground water recharge needsscrutiny before taking new ones. It is possible to repair and renovate existing stricture at less cost thanadding a new one. Also, rehabilitation of the defective design with suitable modification is more economicoption. Hence, a holistic scientific and social approach is desirable for the revision of master plan for thelocal level to the country. The approach should be from the local level to country than the reverse one asmade earlier.
Hence, there is an urgent need to revise the guidelines in the formulation of the artificial recharge schemesso that artificial recharge would be a part of Sustainable Management. The guidelines which can be used inthe formulation of scheme proposal can be enumerated as follows.
1. Criteria for selection of priority area
• Area characterized by declining post monsoon long term water level trend
• Area characterized by deeper post monsoon water level – Relative magnitude to the local environmentthan the earlier criteria of 3 m.
• The area having high stage of groundwater development (OE, Critical)
• The aquifer under stress needs to be considered for artificial recharge & priority to be given forrecharging at the recharge area of the confined aquifer, viz., crystalline-sedimentary contacts, palaeo-channels, beach terraces, upstream side of fractures/lineaments.
• The coastal aquifers vulnerable for the sea water ingress
2. Unit for formulation of Master Plan
It was envisaged in the earlier plan that the unit for formulation of the schemes inhard rock area be watershedand sedimentary be basin/sub-basin. Though, the unit for computations for formulation may be retained asin the earlier Master Plan, it would be better to convert the same to Block/Mandal, District and state whileformulating the scheme so as facilitate easier funding from administrative point of view. The design criteriaand priority areas and guidelines for preparation of Master Plan can be worked out for different agro-climatic and ground water development units of the country, viz., hard rock areas of Peninsular India,Coastal aquifers, Hilly regions of west coast, North eastern region, Himalayan region, Gangetic plain ,Desert regions of Western India .
3. Feasibility of using transported water for Artificial Recharge Schemes.
The earlier Master Plan had been prepared considering only the available uncommitted surplus run offrealized through rainfall. In the places, where there is a greater demand but characterized by lesser rainfallor absence uncommitted surplus run off, diversion from surplus area or even recharging of treated waterneed to be considered.
4. Database on available structures to be created.
The database on existing artificial recharge structures are to be created and a nodal department may beidentified by respective State Government for maintaining and updating of the database. The existing

196
structures created by different agencies along with their capacity would assist in determination of availableuncommitted surplus run off. In addition, this data can also be utilized to refine the groundwater resourcesestimation.
5. To consider the management of demand on groundwater while formulating ArtificialRecharge Schemes.
• Dovetail all the water resources development and conservation projects taken up by both State andCentral Governments and integrate the augmentation of groundwater resources, wherever feasible.
• Identify the areas not suitable for groundwater development and exclude them from artificial rechargeschemes and in such areas create alternative sources to meet the demand.
• Recharge Schemes for the area having brackish water problems.
• Bio-drainage programmes having water level up to 3 m bgl
• Diversion of flood water and use of treated water for artificial recharge schemes in places of lowavailability of source water.
• The Master Plan for artificial recharge to be made on watershed basis for hard rock terrains and subbasin wise for sedimentary terrains and may be translated on administrative units for execution.
• Bottom to top approach in working out the need and implementation is desirable to that of the top tobottom target oriented approach. In other words, the number of structures from Block to District toState to National Level should be compiled.
• Artificial Recharge Schemes should be implemented in the entire country in the phased manner bygiving annual work programme within the framework of Master Plan of the country
• The guidelines for the preparation and prioritization of the Master Plan for the various regions of thecountry will have many common factors but for the convergence on the type of priority to be fixedand nodal agency for preparation of the Master Plan and role and execution of project by linedepartments and other stake holders. The project formulation can be always given to an independentagency / consultant who will not have any component of execution for unbiased approach, bettertransparency and credibility. The different executing agencies may use the master plan as a guidelineand based on the priority and fund allotted by government, the recharge program is taken up withproper Operation and Maintance mechanism.
• The manual on artificial recharge prepared and made available in the website will be the basic guidelinefor the selection criteria of structures. The refinement of the design to meet the local condition can bemade by resource persons and the periodic impact assessment of the completed structures should forthe base for fine tuning the design criteria and development of new site specific, optimum cost designs.
197
Annexure- I B
GUIDELINES FOR REVISION OF CGWB MASTER PLAN OF ARTIFICIAL RECHARGE
The Master Plan on Artificial recharge (2002) had been prepared for the whole country taking the regionaldatabase for the formulation. It was based on the assumptions that the surplus monsoon runoff available ina basin is available uniformly throughout the basin where as it is not uniform in space and time. Thisavailability so worked out was for the entire sub basin and not exclusively for the requirement of theidentified areas for artificial recharge. The source water availability for identified areas for artificial rechargewas apportioned from total water availability in the basin. Hence it is imperative that estimation of surplusmonsoon run off in space and time for each basin / sub basin/unit is a pre-requisite for actually taking upany Artificial Recharge project.
However, the actual estimation of surplus run off is made complex by the following –
• Actual available monsoon runoff in space and time is highly variable.
• There are instances of monsoon rains of higher intensity generating substantial quantity of runoff,which have to be considered depending upon facilities to arrest or store in the areas where rechargeschemes are to be taken up.
• In hard rock areas, where the watertable is shallow and immediately after the rains, the water levelcomes up and stabilises in due course of time. The recharge from rainfall thereafter only generatesrejected recharge, which goes out as baseflow and joins the river/stream courses. This quantitybecomes substantial in later part of the monsoon.
Thus, need has been felt that formulation of Master Plan should address realistic natural conditions /boundaries and administrative needs. More emphasis should be made on demand side of ground waterwhile taking up any artificial recharge scheme – thus taking a holistic view involving all linked parameters –such as improvements in agricultural practices etc. This will decrease stress on ground water regime as atwin pronged strategy for bringing change in the ground water scenario of a particular area, which is theultimate objective. It is also imperative that the thrust should be from State Government so that the MasterPlan for artificial recharge would include not only the hydrogeological parameters, hydrological databasebut also the socio political considerations of the respective States. As State agencies would be involved inthe actual execution, this would eventually result in proper execution of the Master Plan as per the need ofthe respective States.
The Master Plan should basically address the three following points-
• Need for artificial recharge (The area should not be considered if there is no need)
• Scope for artificial recharge (The availability of source water and ability of the groundwater system toaccept the recharge should be ensured)
• Anticipated benefits from the artificial recharge program
Thus the crux of the issue is to identify the critical areas and thereafter provide appropriate designs foreffecting artificial recharge to groundwater.
198
Identification of Critical Areas
The area suitable for groundwater development can be considered for artificial recharge, while the areasnot suitable for groundwater development due to quality problem should also be identified and surfacestorage is preferable in such areas. The area suitable for groundwater development would depend ongroundwater potential, which indirectly depend on hydrogeology of the area. Thus the hydrogeology of thearea would be the foremost criteria in identifying the area suitable for groundwater development.
Within the areas suitable for artificial recharge, priority areas have to be identified to formulate artificialrecharge schemes. The priority can be assigned to an area on the basis of the following.
• Areas notified under State & Central Groundwater Authority
• Area showing declining water level trend during post monsoon
• Areas having higher Stage of groundwater development (>90%). The priority can be assigned to anarea in the descending order of Stage of Development (from highest to lowest)
• Water logging conditions with water level less than 3m below ground level, where Bio-drainage isnecessary.
• Area having water quality issues like brackish water in coastal and inland areas.
• Vulnerable aquifers with declining pressure heads.
Designs of Artificial Recharge Structures
The designs of artificial recharge structures depend on terrain conditions and the scope of artificial recharge.The various factors need to be considered in the design of the artificial recharge structures are listed below.
• Terrain specific designs, viz., Hard rock areas of Peninsular India, Coastal aquifers, Hilly regions ofWest coast, North eastern region, Himalayan region, Indo-Gangetic plain and Desert regions ofWestern India.
• Rural and Urban areas should be treated as separate entities and the designs need to accommodatethe inherent properties of these environments.
• Ability of the system to accept the recharge (available sub surface storage, aquifer parameters)
• Availability of source water considering the catchment area for each structure and uncommittedsurplus run off into the catchment area and quantity of committed run off to be allowed out todownstream side.
• In case of non-availability of source water in the priority area, design of structures should also providefor transfer of water from water surplus area to water deficit area.
• Treated water for artificial recharge also should be kept as one of the options in water deficit areas.
Artificial Recharge to Groundwater
It is proposed that artificial recharge to groundwater may be taken up as two pronged strategy viz., PointRecharge Schemes and Aquifer Recharge Schemes.
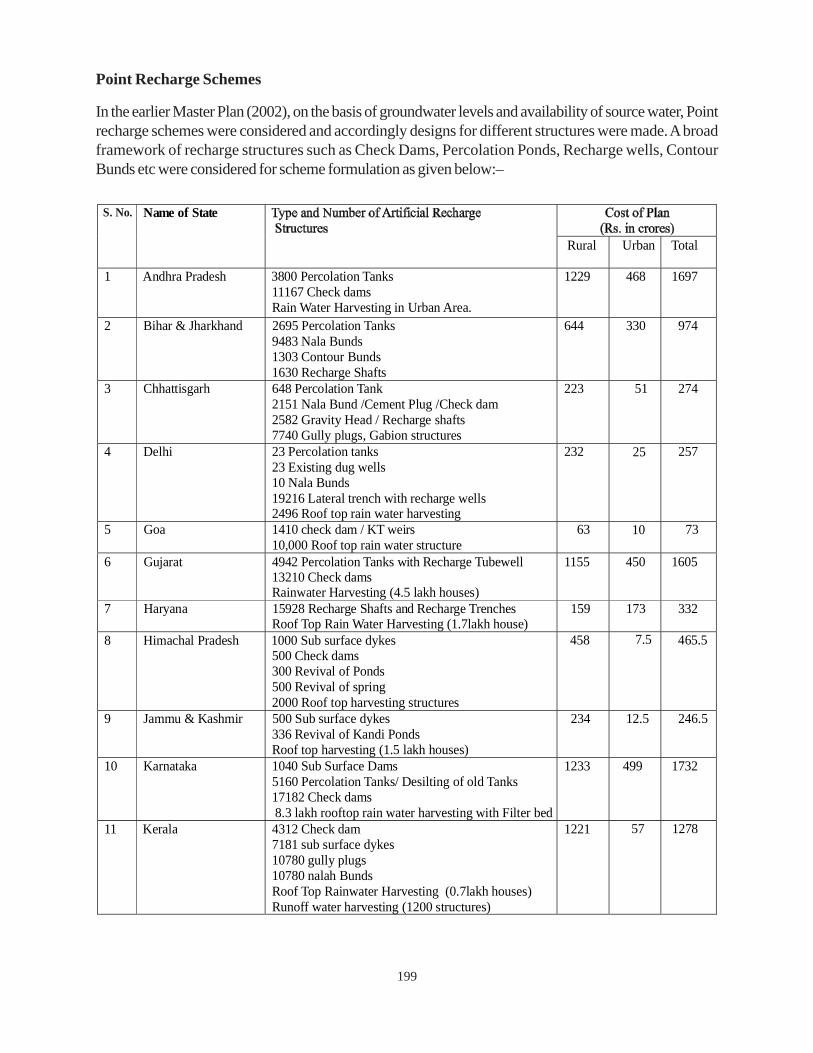
199
Point Recharge Schemes
In the earlier Master Plan (2002), on the basis of groundwater levels and availability of source water, Pointrecharge schemes were considered and accordingly designs for different structures were made. A broadframework of recharge structures such as Check Dams, Percolation Ponds, Recharge wells, ContourBunds etc were considered for scheme formulation as given below:–
Name of State
Rural Urban Total
1 Andhra Pradesh 3800 Percolation Tanks11167 Check dams Rain Water Harvesting in Urban Area.
1229 468 1697
2 Bihar & Jharkhand 2695 Percolation Tanks 9483 Nala Bunds 1303 Contour Bunds 1630 Recharge Shafts
644 330 974
3 Chhattisgarh 648 Percolation Tank2151 Nala Bund /Cement Plug /Check dam 2582 Gravity Head / Recharge shafts 7740 Gully plugs, Gabion structures
223 51 274
4 Delhi
23 Percolation tanks 23 Existing dug wells 10 Nala Bunds 19216 Lateral trench with recharge wells 2496 Roof top rain water harvesting
232 25 257
5 Goa 1410 check dam / KT weirs10,000 Roof top rain water structure
63 10 73
6 Gujarat 4942 Percolation Tanks with Recharge Tubewell13210 Check dams Rainwater Harvesting (4.5 lakh houses)
1155 450 1605
7 Haryana 15928 Recharge Shafts and Recharge TrenchesRoof Top Rain Water Harvesting (1.7lakh house)
159 173 332
8 Himachal Pradesh 1000 Sub surface dykes 500 Check dams 300 Revival of Ponds 500 Revival of spring 2000 Roof top harvesting structures
458 7.5 465.5
9 Jammu & Kashmir 500 Sub surface dykes 336 Revival of Kandi Ponds Roof top harvesting (1.5 lakh houses)
234 12.5 246.5
10 Karnataka 1040 Sub Surface Dams5160 Percolation Tanks/ Desilting of old Tanks 17182 Check dams 8.3 lakh rooftop rain water harvesting with Filter bed
1233 499 1732
11 Kerala
4312 Check dam 7181 sub surface dykes 10780 gully plugs 10780 nalah Bunds Roof Top Rainwater Harvesting (0.7lakh houses) Runoff water harvesting (1200 structures)
1221 57 1278
S. No.
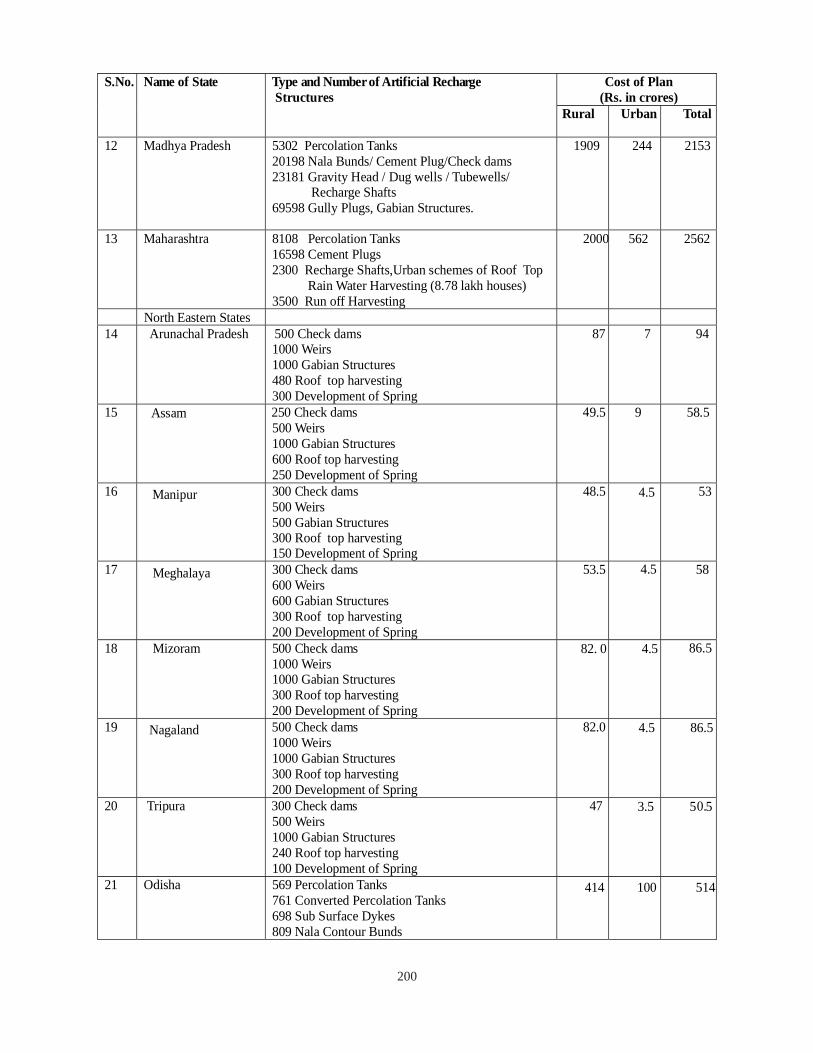
200
Cost of Plan (Rs. in crores)
S.No. Name of State Type and Numberof Artificial Recharge Structures
Rural Urban Total
12 Madhya Pradesh 5302 Percolation Tanks20198 Nala Bunds/ Cement Plug/Check dams 23181 Gravity Head / Dug wells / Tubewells/ Recharge Shafts 69598 Gully Plugs, Gabian Structures.
1909 244 2153
13 Maharashtra 8108 Percolation Tanks16598 Cement Plugs 2300 Recharge Shafts,Urban schemes of Roof Top Rain Water Harvesting (8.78 lakh houses) 3500 Run off Harvesting
2000 562 2562
North Eastern States14 Arunachal Pradesh 500 Check dams
1000 Weirs 1000 Gabian Structures 480 Roof top harvesting 300 Development of Spring
87 7 94
15 Assam 250 Check dams500 Weirs 1000 Gabian Structures 600 Roof top harvesting 250 Development of Spring
49.5 9 58.5
16 Manipur 300 Check dams500 Weirs 500 Gabian Structures 300 Roof top harvesting 150 Development of Spring
48.5 4.5 53
17 Meghalaya 300 Check dams600 Weirs 600 Gabian Structures 300 Roof top harvesting 200 Development of Spring
53.5 4.5 58
18 Mizoram 500 Check dams1000 Weirs 1000 Gabian Structures 300 Roof top harvesting 200 Development of Spring
82. 0 4.5 86.5
19 Nagaland 500 Check dams1000 Weirs 1000 Gabian Structures 300 Roof top harvesting 200 Development of Spring
82.0 4.5 86.5
20 Tripura 300 Check dams500 Weirs 1000 Gabian Structures 240 Roof top harvesting 100 Development of Spring
47 3.5 50.5
21 Odisha 569 Percolation Tanks761 Converted Percolation Tanks 698 Sub Surface Dykes 809 Nala Contour Bunds
414 100 514
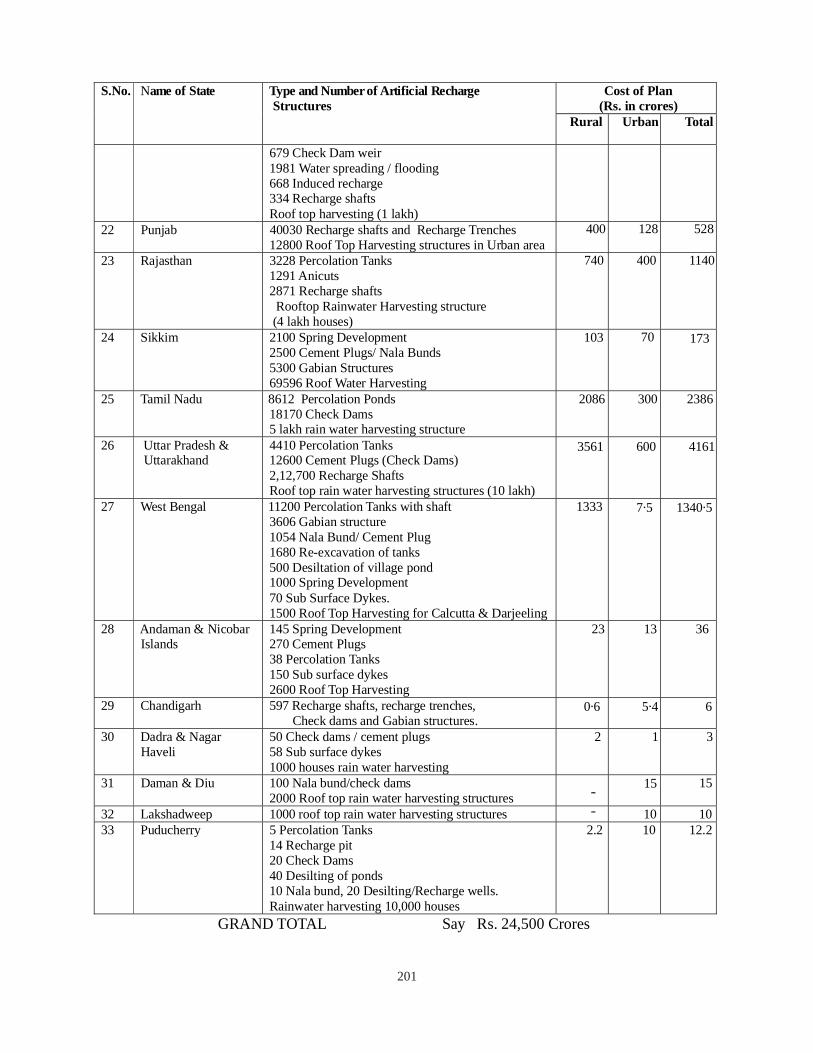
201
Cost of Plan (Rs. in crores)
S.No. Name of State Type and Number of Artificial Recharge Structures
Rural Urban Total
679 Check Dam weir 1981 Water spreading / flooding 668 Induced recharge 334 Recharge shafts Roof top harvesting (1 lakh)
22 Punjab 40030 Recharge shafts and Recharge Trenches12800 Roof Top Harvesting structures in Urban area
400 128 528
23 Rajasthan 3228 Percolation Tanks1291 Anicuts 2871 Recharge shafts Rooftop Rainwater Harvesting structure (4 lakh houses)
740 400 1140
24 Sikkim 2100 Spring Development2500 Cement Plugs/ Nala Bunds 5300 Gabian Structures 69596 Roof Water Harvesting
103 70 173
25 Tamil Nadu 8612 Percolation Ponds18170 Check Dams 5 lakh rain water harvesting structure
2086 300 2386
26 Uttar Pradesh & Uttarakhand
4410 Percolation Tanks 12600 Cement Plugs (Check Dams) 2,12,700 Recharge Shafts Roof top rain water harvesting structures (10 lakh)
3561 600 4161
27 West Bengal 11200 Percolation Tanks with shaft3606 Gabian structure 1054 Nala Bund/ Cement Plug 1680 Re-excavation of tanks 500 Desiltation of village pond 1000 Spring Development 70 Sub Surface Dykes. 1500 Roof Top Harvesting for Calcutta & Darjeeling
1333 7.5 1340.5
28 Andaman & Nicobar Islands
145 Spring Development 270 Cement Plugs 38 Percolation Tanks 150 Sub surface dykes 2600 Roof Top Harvesting
23 13 36
29 Chandigarh 597 Recharge shafts, recharge trenches, Check dams and Gabian structures.
0.6 5.4 6
30 Dadra & Nagar Haveli
50 Check dams / cement plugs 58 Sub surface dykes 1000 houses rain water harvesting
2 1 3
31 Daman & Diu 100 Nala bund/check dams2000 Roof top rain water harvesting structures
15 15
32 Lakshadweep 1000 roof top rain water harvesting structures 10 1033 Puducherry 5 Percolation Tanks
14 Recharge pit 20 Check Dams 40 Desilting of ponds 10 Nala bund, 20 Desilting/Recharge wells. Rainwater harvesting 10,000 houses
2.2 10 12.2
GRAND TOTAL Say Rs. 24,500 Crores
--
202
In view of the water scarcity, many States with their own fund or with central assistance, executed fairlygood number of point recharge schemes in last few years. The proposed number of structures given in theearlier master plan (2002) will be reduced in tune with the number of executed schemes. However, thefinancial outlay may be more or less same due to cost escalation. Hence, it is proposed that the existingCentral assistance schemes & State sponsored programmes can dovetail their programmes to suit artificialrecharge to groundwater requirements in their priority areas. The number of structures can be refined tosuit the priority of the respective States. The programmes can be executed through Panchayat Raj Institutions,NGOs and other State agencies taking the guidelines from the earlier master plan (2002). In addition,construction of structures under Local Area Development Fund of Member of Parliament & Member ofLegislative Assembly in consultation with local District Authorities should also be dovetailed.
CGWB has brought out a Manual on Artificial Recharge to Groundwater on the basis of the experiencesin formulating and executing artificial recharge schemes in the country under VIII, IX & X plan periods.The designs of the various structures given in the manual can be referred and modified if necessary to suitthe terrain conditions.
It is also suggested that a scientific database be created on the existing artificial recharge structures and anodal department nominated by respective State Government be entrusted with for coordinating the artificialrecharge schemes being executed through myriad of Central and State schemes. The Nodal Departmentalso should first create a scientific database and periodically update the database. This will not only assistin estimation of surplus uncommitted run off in area but also aid in the refinement of groundwater resources.The schemes for point recharge should be developed from Block level to District and then to State. TheState governments also may propose on the basis of their own priority so as to ensure more critical areasinitially.
Aquifer Recharge Schemes
It is also felt that in addition, artificial recharge to groundwater may be taken up in major stressed aquifersin the country, which would rejuvenate the aquifers to make them sustainable to meet the future demandand also emergent situations like tsunami, flood and drought etc. For example in Tamil Nadu, potentialCuddalore Aquifer, Orathanadu Aquifer, Tiruvadanai Aquifer etc can be recharged by diverting floodwaters or transported surplus from rivers using new advancements in technology. Central Ground WaterAuthority and state ground water authorities have notified few blocks/areas for registration and regulation.The deeper aquifers of Haldia in West Bengal are increasingly affected by increased ground water pumpingby industries. Large scale recharge to confined aquifers in the belt is essential. Similarly, Quilon and Alleppeyareas of Kerala are having number of deep tubewells, which may fail due to sea-water ingress. Suchaquifers need proper protection and remediation, if need be. Many sedimentary aquifers are under stresscondition in parts of West coast and East coast need recharge schemes. Similarly, other states might behaving similar potential aquifers that are being highly developed and such aquifers may be rejuvenatedusing artificial recharge techniques. Such attempts need participation of national and International institutionsin project mode, which can be implemented by MoWR as National projects for sustainable managementof ground water resources of India.
It is proposed that these aquifers may be identified jointly by CGWB & respective State agencies andaquifer mapping be attempted to decipher the aquifer geometry with the demarcation of recharge anddischarge areas. A group of experts from Central & State agencies may be constituted to formulate majorscheme proposals to recharge these aquifers. The source water can be either from the catchment or from
203
transport of source water from water surplus areas. Diversion of floodwater can also be attempted throughman-made waterways, which would also be beneficial in averting the flood damage recurring every year.
The recharge using canals/drains (exclusively) in overexploited areas with deeper water levels such as inparts of Punjab, Haryana and Rajasthan from Himalayan rivers/tributaries can be worked out. Similarlypossibilities of transporting water from shallow aquifers lying near active floodplains to water deficit areasshould be explored. In the state of Haryana, recharge to deeper aquifers can be taken up using defuncttubewells lying next to augmentation canal using spare monsoon water. Such major aquifer recharge andaquifer remediation of identified zones throughout the country is likely to cost around Rs 30,000/-croresthat needs fine tuning by respective states.
Most of the recharge schemes languish after completion is because of poor or no maintenance. Thisreduces effectiveness of recharge schemes to a great extent within few years of construction. Main reasonfor this is large quantity of silt that comes with rainwater. Moreover technology to exclude silt in runningwater before recharge should be developed. Thus, it is very important to keep separate funds underoperation and maintenance every year after construction. The recharge schemes should be maintained bya separate wing of state specially entrusted with this activity.
It is proposed that each scheme proposal be accompanied with Detailed Project Report (DPR) and abroad guideline for the preparation of DPR is given below.
1. Introduction
2. Background Information on the area giving hydrometeorology, hydrology & Hydrogeology
3. Need for Artificial Recharge
Scope for Artificial Recharge including source water availability and ability of aquifer to accept therecharge
4. Justification of the Scheme
5. Proposed Structures
6. Cost Estimates
7. Tentative Accrued Benefits
8. Time Schedule
9. Executing Agency Details
10. Operation & Maintenance of the Structures
11. Proposal for Impact Assessment Study by an Independent Agency
ANNEXURE
I Detailed Cost Estimate
II Time Schedule of Execution

204
III Certificate of Undertaking from the Executing Agency
IV Certificate of Undertaking for Operation & Maintenance
Post Execution
There should be a provision to hand over the structures to Panchayat Raj Institutions/linked department forpost maintenance. A definite budget provision for Operation and Maintenance of artificial recharge structuresshould be made and it may be collected from the beneficiaries on Own & Operate basis.
It is also proposed that an impact assessment study be made on the impact of these artificial rechargeschemes to study the efficacy of these techniques. In addition, the knowledge sharing of the impact will alsoensure the active participation of beneficiaries in operation and maintenance.
205
Annexure- I C
DRAFT GUIDELINES FOR CONVERTING OVER-EXPLOITED BLOCKS TO “SAFE”CATEGORY TAKING INTO CONSIDERATION ASPECTS OF WITHDRAWAL,RECHARGE, WATER USE PRACTICES ETC.
Ground Water Resource Estimation of the country as per GEC-1997 norms was conducted. The blockswhere the annual ground water recharge is less than the ground water draft for all uses have been categorizedas ‘Over-Exploited’. The stage of ground water development has been expressed in percentage. As perGEC-97, if the stage of ground water development of a particular block is more than 100% and the longterm water level trend shows a declining trend, the block has been categorized as over-exploited. Theseblocks all over the country have been identified and need special attention as far as ground water resourcemanagement is considered. In order to tackle the problem one must try to understand the cause behind theoverexploitation of ground water resource, which can be due to one of the following:-
A. Draft from ground water is mainly to meet irrigation demands
B. Draft from ground water is mainly to meet drinking/domestic demands
C. Draft from ground water is mainly to meet industrial requirements
D. Draft from ground water is for a combination of one or more of above mentioned factors
Once the real cause has been identified, the restoration of the overexploited block can be initiated tacklingthe root cause. Besides the above, water use practices and socio-economic nature of area have to be wellunderstood. The approach to bring overexploited block to safe category will be area specific dependingon the magnitude of above-mentioned causes. The block wise detailed approach should be as follows:-
Blocks where draft from ground water is mainly to meet irrigation demand
In most parts of country blocks that have been categorized as overexploited are due to agricultural needsof the local farmers as per current farming practices. The steps need to be initiated in following manner inthese blocks:-
It has been observed that it is very difficult to change the current farming practices that envisages shift fromwater intensive crops to less water consuming crops for one or other reason. Nevertheless efforts shouldbe continued towards that approach by providing farmers better crop remuneration in any form, bettermarketing of agriculture produce, more minimum support price etc. However, more emphasis should beon demand side management of ground water resources.
Numerous studies have been conducted by various agricultural universities to devise ways and means toreduce water demands of mainly crops like paddy and sugarcane among other crops. It has been provedthat paddy requires 30-40% less water if proper new techniques of plantation are adopted. Adoption ofsuch techniques can reduce the water demand significantly. Take for example case of a block where stageof ground water development is say 140 %, and if less water can be applied for irrigation due to innovativetechniques, draft from ground water can be considerably reduced. Thus adopting water saving on-farmtechniques will reduce demand for ground water by 35 %. This will result in lowering the ground waterdevelopment considerably. However, return flow from applied irrigation will also stand reduce and it isestimated that the block will come out of the overexploited category. Moreover, successful implementation
206
of farmers participatory approach and R&D activities in improvising irrigation efficiency can further easepressure on demand side.
In addition to above, efforts have to be done to tackle the supply side of ground water management byadopting artificial recharge techniques. Quantum of additional recharge has to be assessed utilizing surpluswater from all available sources such as surplus monsoon run-off, pond water etc. Area suitable forartificial recharge has to be identified and Recharge to the aquifers is increased using appropriate techniquesin a cost effective manner to maximize the output. In the example as discussed above, where the stage ofground water development has come down to 100 % from 140% by adopting on-farm managementtechniques, it is estimated that supply has to be increased by about 40%, which is spread equally throughout the area under consideration to bring it to safe category as per GEC-97.
Blocks where draft from ground water is mainly to meet drinking / domestic demands
There are few blocks that have become overexploited due to huge demand due to domestic needs. Suchsituation exists around major towns and metropolitans. These towns depend largely on ground water tocater for their requirements. State public health departments responsible for water supply should adoptmanagement of water resources while pumping ground water. Water conservation measures are requiredto be taken in conjunction with a strategy of reducing demand. Following steps are needed to be initiatedin these areas to overcome the precarious situation:-
• Recharge to ground water using monsoon runoff from rooftop rain water should be given top priority.No water falling on hard tops should be allowed to go waste as runoff.
• Residents should be made aware of the shortage of drinking water and its consequences by adoptingawareness programmes.
• All the major towns generate huge quantities of sewage water, which can be treated using appropriatetechnology and put to use for other purposes than drinking. This will surely reduce stress on freshground water as part of management on the supply side. Studies should be taken up to observe theimpact of such approach on the ground water system.
• Bulk users should be charged with appropriate rate based on consumption pattern.
Blocks where draft from ground water is mainly io meet industrial demands
There are certain industrial belts in the country, which are consuming huge quantities of ground waterresulting in steep water level decline in the immediate vicinity of the area. In the ground water resourceestimation whole of the block has been considered while only localized pockets are severely affected dueto large scale ground water pumping. However, the other part is suffering due to ground water mining andresultant environmental degradation due to failure of shallow wells. Another major problem emerging fromthe industrial belt is ground water pollution and resultant damage to fresh water aquifers. It has beenobserved that generally industrial areas are near to either agricultural areas or large population residesnearby. It is suggested that these areas be identified and ground water resources be computed separatelyexcluding agricultural and domestic areas. In case any industrial belts are causing severe ground waterdecline flowing steps should be initiated to overcome the problem
• The industrial belt should be notified for ground water regulation measures as directed by CentralGround Water Authority from time to time.
207
• The industries existing in the industrial belts should be asked to adopt rainwater harvesting measuresso that maximum rainwater is utilized for ground water recharge.
• In case industries are drawing water from shallow aquifers and deeper aquifers exist in the area,necessary directions should be issued to draw water only from deeper aquifers.
Blocks where draft from ground water is mainly to meet the miscellaneous demand
There are few blocks in the country where there is no specific industrial belt but large number of small scaleindustries does exist. These small scale industries pump large quantity of ground water for their industrialrequirements. The typical example in this case can be of Ludhiana City. Large number of local and migrantpopulation is engaged in such industries and is dependent on ground water resource only for their dailyneeds. Thus, domestic and industrial requirements put together have created a scenario where stage ofground water development has reached alarming proportions. It is necessary to organize the small scaleindustry by shifting them first as done in NCT Delhi where all industries inside the residential areas havebeen shifted to cities outskirts in a very systematic way. Effluent and sewage treatment plants be put inplace and industrial requirement be supplemented using treated water. The industries and residential areasshould be asked to adopt rainwater harvesting measures so that maximum rainwater is utilized for groundwater recharge and category of the block is reversed from Over-exploited to Safe.
According to GEC-97 computations as on March, 2004 it is observed that the stage of ground waterdevelopment of Over-exploited blocks vary greatly from near 100% to more than 300%. Hence it is veryimportant to priorities these blocks so that things improve in phased and systematic manner.
The Over-exploited blocks can be further put into sub-groups as follows:-
I. Stage of ground water development is more than 200%.
II. Stage of ground water development is 150% - 200%.
III. Stage of ground water development is in the range of 100% - 200%.
In the first phase, priority should be given to those blocks where stage of ground water development hasreached more than 200% followed by other categories.
208
References:
1) Manual on Artificial Recharge of Ground Water (1994)
2) National Perspective Plan for Recharge to Ground Water by Utilizing Surplus Monsoon Runoff(1996)
3) Guide on Artificial Recharge to Ground Water (1998)
4) Master Plan for Artificial Recharge to Ground Water in India, Govt. of India, Ministry of WaterResources, CGWB, New Delhi- February, 2002
5) Dynamic Ground Water Resource of India (As on March, 2004), Govt. of India, Ministry of WaterResources, CGWB, New Delhi -2006
6) Manual on Artificial Recharge to Ground Water , Govt. of India, Ministry of Water Resources,CGWB, New Delhi – September, 2007
7) Manual on Artificial Recharge of Ground Water (2009)
8) Select Case Studies “Rain Water Harvesting and Artificial Recharge (2011)
9) Dynamic Ground Water Resources of India (As on March, 2009), Govt. of India, Ministry of WaterResources, CGWB, New Delhi – 2012.
CONTRIBUTORS
Committee Members
Dr. N.Varadaraj, Regional Director, CGWB, SR, Hyderabad Chairman of the Committee
Sh. Manoj Srivastava, Regional Director, CGWB, WR, Jaipur Member
Dr. K.M. Najeeb, Regional Director, CGWB, SWR, Bangaluru Member
Sh. Sanjay Marwaha, Suptdg. Hydrogeologist, CGWB, NR, Lucknow Member Co-ordinator
Principal Contributors
All Regional Directors, CGWB
Other Contributors
Sh. Anoop Nagar, Suptdg. Hydrogeologist, CGWA, New Delhi
Sh. G.Sudarshan, Suptdg. Hydrogeologist, CGWB, SR, Hyderabad
Sh. Y. B. Kaushik, Scientist-D, CGWA, New Delhi
Dr. S. K. Gupta, Scientist-D,CGWB, New Delhi
Dr. P.N. Rao, Scientist-D,CGWB, SR, Hyderabad
Sh. S.K.Juneja, Scientist-D,CGWB, New Delhi
Sh. S.K.Sinha, Scientist-D,CGWB, Faridabad
Sh. G.Y. Setty, Scientist-C, CGWB, SR, Hyderabad
Dr. S. Subrmanian, Scientist-C, CGWB, SECR, Chennai
Sh. M. K. Garg, Scientist-B, CGWB, New Delhi
Sh. P. Yadaiah, Assistant Hydrogeologist, CGWB, New Delhi
Overall Supervision and Guidance
Sh. Sushil Gupta, Chairman, CGWB, Faridabad
RECYCLE
REUSE
RECHARGE
Central Ground Water Board
Ministry of Water Resources
New Delhi
Tel. : 011-23383561, 26175362
e-mail : [email protected]
website : www.cgwb.gov.in
dsUnzh; Hkwfe ty cksMZ Tky lalk/ku ea=ky;ubZ fnYyh
% nwjHkk"k 011& 23383561] 26175362bZ esy % [email protected]
osc lkbZV % www.cgwb.gov.in