master thesis - opus 4 · it takes a long time to write a master thesis, though not as long as it...
TRANSCRIPT
MASTER THESIS
TITLE:
AN ASSESSMENT OF CAMEROON’S RENEWABLE ENERGY RESOURCE POTENTIAL AND PROSPECTS FOR A SUSTAINABLE
ECONOMIC DEVELOPMENT
Presented by: Bobbo Nfor Tansi Matr.- No.: 2615426
Date of birth: 20 July 1982 Place of birth: Nkambe - Cameroon
Supervisors: Prof. Dr. rer. nat. Jürgen Ertel, Chair of Industrial Sustainability
Prof. Dr. Michael Scheffler, Chair of Lightweight Ceramics
Starting date: 27 May 2009
Submission date: 04 January 2010
Cottbus, 08. Feb. 2011
Brandenburg University of Technolgy Cottbus Faculty of Environmental Sciences and Process Engineering Course of Environmental and Resource Management
MASTERARBEIT
THEMA:
EINE BEWERTUNG DES POTENTIALS ERNEUERBARER ENERGIEN RESSOURCEN IN KAMERUN UND DIE AUSSICHTEN
FÜR EINE NACHHALTIGE WIRTSCHAFTSENTWICKLUNG
vorgelegt von: Bobbo Nfor Tansi Matr.-Nr.: 2615426
geboren am: 20. Juli 1982 in: Nkambe - Kamerun
Betreuer: Prof. Dr. rer. nat. Jürgen Ertel, Lehrstuhl: Neuwertwirtschaft
Prof. Dr. Michael Scheffler, Lehrstuhl: Leichtbaukeramik
Ausgabetermin: 27.05.2009
Abgabetermin: 04.01.2010
Cottbus, 08. Feb. 2011
Brandenburgische Technische Universität Cottbus Fakultät Umweltwissenschaften und Verfahrenstechnik Studiengang Environmental and Resource Management
i
Declaration
I hereby declare that this thesis is the result of my original work carried out at the
Brandenburg University of Technology Cottbus, Germany.
This research was an independent study under the supervision of Prof. Dr. rer. nat.
Jürgen Ertel (Chair of Industrial Sustainability, Brandenburg University of Technology
Cottbus, Germany) and Prof. Dr. Michael Scheffler (Chair of Lightweight Ceramics,
Brandenburg University of Technology Cottbus, Germany).
This thesis has never been submitted in part or in whole for a degree at any institution.
References to other sources or people’s work have been duly cited and acknowledged.
Signed by supervisors:
Prof. Dr. rer. nat. Jürgen Ertel. ………………………………………………………
Chair of Industrial Sustainability Brandenburg University of Technology Prof. Dr. Michael Scheffler. …………………………………………………………..
Chair of Lightweight Ceramics
Brandenburg University of Technology
ii
Dedication
I dedicate this piece of work to my mother Juliana Tansi.
“Dear Juliana Tansi,
I just thought I'd drop you a line and tell you how much you mean to me. I know you
must think I just took your love for granted and I wanted to tell you that I am sorry
that I never told you before...
Thanks, Mom, for carrying me under your heart all these months, putting up with the
million and one things all expectant mothers just "go through"...
Thanks for enduring whatever degree of pain you went through to bring me into this
world. And Mom, I do appreciate you sitting up nights trying to figure out why I was
crying, after you did your best to keep me dry, fed, and comfortable... and the 5,000
diapers a year, thank you for each one of them... and the teeth cutting period... I must
have driven you out of your mind... I'm sorry.
Now, too many years later, I thank you and I'm sorry I caused you so much pain,
worry and headaches... and for all the sleep you lost. And Mom, thanks for all the
love, attention, guidance, patience, and yes, the discipline.
If I ever did anything to make you feel that you failed somewhere, don't blame
yourself. I had to find out some things on my own. I only pray I find the wisdom to do
as well with my children.
Thanks, Mom, for doing all the right things at the right time and most of all... for being
MY MOM.”
iii
Acknowledgement
It takes a long time to write a master thesis, though not as long as it takes to lay some
rail track, surprisingly. I would here like to express my thanks to the people who have
been very helpful to me during the time it took me to write this thesis.
First, I thank my supervisors Prof. Dr. rer. nat. Jürgen Ertel and Prof. Dr. Michael
Scheffler, for their continuous support in the M. Sc. program. They were always there
to listen and to give advice. I will forever be grateful to Prof. Ertel, for his valuable
time that he devoted in correcting and guiding me during this time, and not only for
being there for my thesis, but also for inspiring me through his lectures, and guiding
me through my study project. The role of Prof. Scheffler in this direction of research
could also not be underestimated. He is responsible for involving me in the field of
renewable energy in the first place. He, alongside with Prof. Ertel, taught me how to
ask questions and express my ideas. They showed me different ways to approach a
research problem and the need to be persistent to accomplish any goal.
For this research, data were essential and collecting data is invariably a trying
experience. Data for this research could not be collected within the time frame
required for a master thesis. Hence, I would like to thank the following people and
institutions for their various support in making the data available for this study: NASA
for providing me with meteorological data for Cameroon, ARSEL Cameroon,
especially Etutu Shalman, for providing me with texts governing the energy sector in
Cameroon and finally CANMET for making available such a powerful software tool
as the RETScreen for free and also for their continues support and guidance through
emails when I got frustrated and stuck with the software. I would like to thank them
wholeheartedly. Without their generosity there would have been nothing to work with.
I am also greatly indebted to many teachers in the past: Mrs. Ngala Edith, Mr. Sama
Patrick (G.B.H.S Nkambe, Cameroon), Dr. Agyinge Christopher, Dr. Suh Emmanuel
and Dr. Njume Stephen (University of Buea, Cameroon) for getting me interested in
sciences and technology.
I owe a great deal to colleagues, students, friends and members of my class who have
helped extend my involvement in environmental sciences and renewable energy, and

iv
who, through their own research, comments and questions have encouraged, supported
and enlightened me. Many thanks goes to my other friends especially Susi Hammel,
for being there for me and taking the time to read through my work and help cut the
‘T”s dot the “I”s which I did miss during the writing.
Last, but not the least, I thank my family: my mum and dad, Juliana and Henry, for
giving me life in the first place, for educating me with aspects from both arts and
sciences, for unconditional support and encouragement to pursue my interests, even
when these went beyond boundaries of language, field and geography; my sister
Felista Tansi, for sharing her experience of the dissertation writing endeavor with me,
for listening to my complaints and frustrations, and for believing in me; thanks also
goes to my elder sister Joan Muyang Tansi, for endless support and patience; my
brothers Jimmy, George, Danilo, and Wilson, for reminding me that my research
should always be useful and serve good purposes for all humankind.
Finally and most importantly, as one who believes in the misery surrounding the
existence of a supernatural being, I here thank God for everything he has done in my
life, - from my very existence, - to the mundane parts of my life, including breathing,
walking, thinking, communicating, and sensing, as well as my free will and the ability
to love. I thank God for all those things that he has provided in my life, not only my
basic needs but some of my wants as well.
v
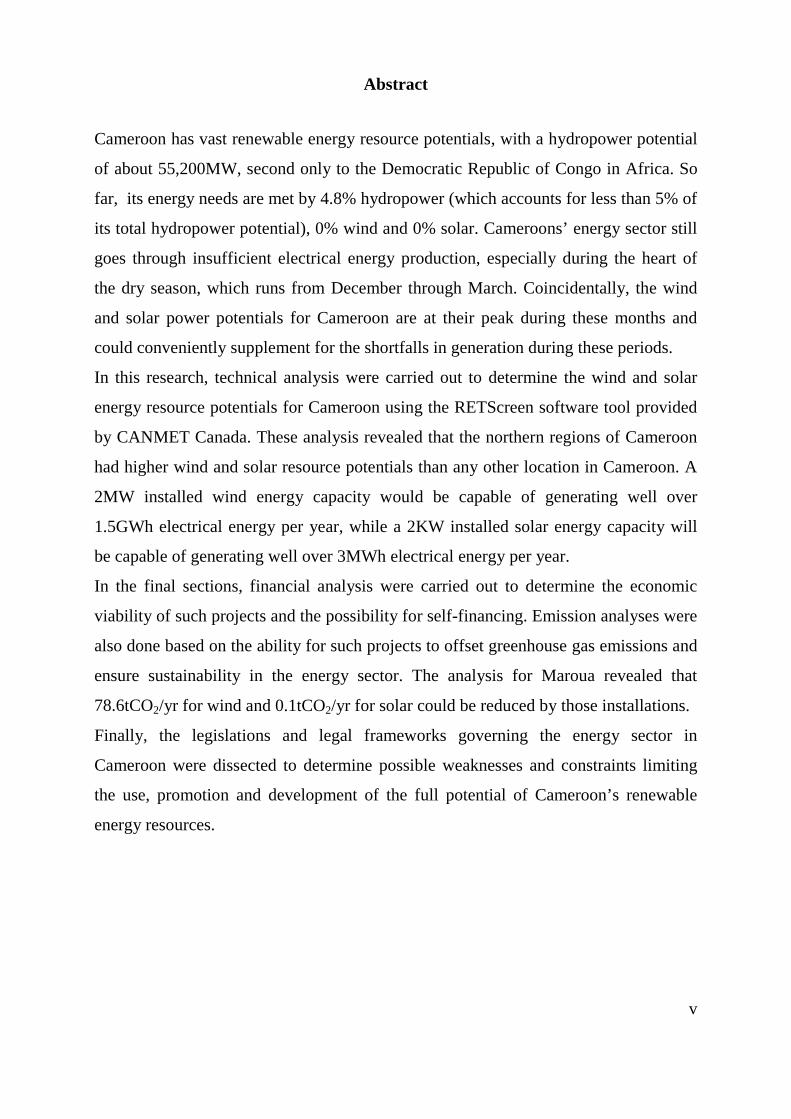
Abstract
Cameroon has vast renewable energy resource potentials, with a hydropower potential
of about 55,200MW, second only to the Democratic Republic of Congo in Africa. So
far, its energy needs are met by 4.8% hydropower (which accounts for less than 5% of
its total hydropower potential), 0% wind and 0% solar. Cameroons’ energy sector still
goes through insufficient electrical energy production, especially during the heart of
the dry season, which runs from December through March. Coincidentally, the wind
and solar power potentials for Cameroon are at their peak during these months and
could conveniently supplement for the shortfalls in generation during these periods.
In this research, technical analysis were carried out to determine the wind and solar
energy resource potentials for Cameroon using the RETScreen software tool provided
by CANMET Canada. These analysis revealed that the northern regions of Cameroon
had higher wind and solar resource potentials than any other location in Cameroon. A
2MW installed wind energy capacity would be capable of generating well over
1.5GWh electrical energy per year, while a 2KW installed solar energy capacity will
be capable of generating well over 3MWh electrical energy per year.
In the final sections, financial analysis were carried out to determine the economic
viability of such projects and the possibility for self-financing. Emission analyses were
also done based on the ability for such projects to offset greenhouse gas emissions and
ensure sustainability in the energy sector. The analysis for Maroua revealed that
78.6tCO2/yr for wind and 0.1tCO2/yr for solar could be reduced by those installations.
Finally, the legislations and legal frameworks governing the energy sector in
Cameroon were dissected to determine possible weaknesses and constraints limiting
the use, promotion and development of the full potential of Cameroon’s renewable
energy resources.
vi
Acronyms/Abbreviations
- AES SONEL National Electricity Company, Cameroon
- ALUCAM Aluminium Smelter Plant, Cameroon
- ARSEL Electricity Sector Regulatory Agency, Cameroon.
- CANMET Canada Centre for Mineral and Energy Technology
- CBA Cost Benefit Analysis
- CDM Clean Development Mechanism
- CO2 Carbon Dioxide
- CRC Carbon Reduction Commitment
- DTIE UNEP’s Division of Technology, Industry and Economics
- EEDRB Energy and Environmental Data Reference Bank
- EEF The Energy and Environment Foundation
- EIA US Energy Information Administration
- FCFA Central African Franc
- GDP Gross Domestic Product
- GEF Global Environment Facility
- GHG Greenhouse Gases
- GW Gigawatt
- GWh Gigawatt Hour
- IAEA International Atomic Energy Agency
- IEA International Energy Agency
vii
- kWh Kilowatt Hour
- MWh Megawatt Hour
- NASA National Aeronautics and Space Administration
- NGO Non-governmental Organization
- NRCan Natural Resources Canada
- OECD Organisation for Economic Co-operation and Development
- PCF World Bank's Prototype Carbon Fund
- PV Photovoltaic
- R&D Research and Development
- RE Renewable Energy
- REEEP Renewable Energy and Energy Efficiency Partnership
- RETs Renewable Energy Technologies
- SONARA National Oil Refining Company, Cameroon
- SWERA UNEP lead Solar and Wind Energy Resource Assessment Program
- UNEP United Nations Environment Program
- UNFCCC United Nations Framework Convention on Climate Change
- WB World Bank
- WCED World Commission on Environment and Development
viii
List of Figures
Figure 1-1: Map of Cameroon ........................................................................................ 1
Figure 1-2: Share of Total Primary Energy Supply in Cameroon 2005 ......................... 4
Figure 3-1: RETScreen's Five Step Analysis. ............................................................... 18
Figure 4-1: Map View of Locations Used for Technical Analysis ............................... 21
Figure 4-2: RETScreens' Start worksheet showing project information. ..................... 33
Figure 4-3: RETScreens Energy Model Worksheet. .................................................... 34
Figure 4-4: RETScreen's Tools Worksheet. ................................................................. 35
Figure 4-5: Graph of Average Annual wind speeds for various locations used. .......... 36
Figure 4-6: Mean monthly wind speeds in Cameroon (10m above ground) ................ 37
Figure 4-7: Cross Section of a Wind Turbine. .............................................................. 38
Figure 4-8: ENERCONS E-82 Wind turbine. .............................................................. 39
Figure 4-9: Average annual solar radiation for locations used ..................................... 46
Figure 4-10: Monthly solar radiation values for Garoua .............................................. 47
Figure 4-11: BP's SX3200 Solar Module. .................................................................... 47
Figure 5-1: Cumulative cash flow graph for Maroua (wind assessment). .................... 61
Figure 5-2: Cumulative cash flow graph for Garoua (wind assessment). .................... 62
Figure 5-3: Cumulative cash flow graph for Ngaoundéré (wind assessment). ............ 63
Figure 5-4: Cumulative cash flow graph for Garoua (Solar). ....................................... 65

ix
List of Tables
Table 4-1: Locations used for analysis. ........................................................................ 20
Table 4-2: Site reference and climate data for Maroua ................................................ 22
Table 4-3:Site reference and climate data for Garoua. ................................................. 23
Table 4-4: Site reference and climate data for Ngaoundéré. ........................................ 24
Table 4-5: Site reference and climate data for Bamenda. ............................................. 25
Table 4-6: Site reference and climate data for Bafia. ................................................... 26
Table 4-7: Site reference and climate data for Yaoundé. ............................................. 28
Table 4-8: Site reference and climate data for Douala ................................................. 29
Table 4-9: Site reference and climate data for Bertoua. ............................................... 30
Table 4-10: Site reference and climate data for Ebolowa. ............................................ 31
Table 4-11: Site reference and climate data for Fontem. .............................................. 32
Table 4-12: Power curve data for wind turbine ............................................................ 39
Table 4-13: Wind analysis results. ................................................................................ 41
Table 4-14: Monthly assessment results - Maroua ....................................................... 42
Table 4-15: Monthly assessment results - Garoua ........................................................ 43
Table 4-16: Monthly assessment results - Ngaoundéré. ............................................... 44
Table 4-17: Monthly assessment results - Bamenda .................................................... 45
Table 4-18: Solar analysis results. ................................................................................ 49
Table 4-19: Monthly assessment results - Maroua (Solar) ........................................... 50
Table 4-20: Monthly assessment results - Garoua (Solar) ............................................ 50
Table 4-21: Monthly assessment results - Ngaoundéré (Solar). .................................. 51
Table 4-22: Monthly assessment results - Bamenda (Solar) ........................................ 51
Table 4-23: Monthly assessment results - Bafia (Solar). .............................................. 52
Table 4-24: Monthly assessment results - Yaoundé (Solar) ......................................... 52
Table 4-25: Monthly assessment results - Douala (Solar). ........................................... 53
Table 4-26: Monthly assessment results - Bertoua (Solar). .......................................... 53
Table 4-27: Monthly assessment results - Ebolowa (Solar) ......................................... 54
Table 4-28: Monthly assessment results - Fontem (Solar) ........................................... 54
Table 5-1: Total initial costs of power projects. ........................................................... 58
x
Table 5-2: Financial parameters, wind analysis. ........................................................... 60
Table 5-3: Financial paramters, solar analysis. ............................................................. 64
Table 5-4: Financial analysis results and viability assessment - Solar resource. ......... 66
Table 6-1: GHG emission rates in Cameroon ............................................................... 69
Table 6-2: GHG offsets by wind for Garoua and Ngaoundéré. .................................... 71
Table 6-3: GHG offsets by solar for selected locations. ............................................... 71
xi
Table of Contents
Chapter 1 : Introduction .............................................................................................. 1
1.1 The Republic of Cameroon .................................................................................... 1
1.2 The Climate of Cameroon and Surface Meteorology ........................................... 2
1.3 The Energy Situation in Cameroon ....................................................................... 2
1.4 Renewable Energy ................................................................................................. 4
1.5 Overview of Cameroon’s Renewable Energy Resources ..................................... 5
1.5.1 Hydropower ..................................................................................................... 6
1.5.2 Biomass ........................................................................................................... 6
1.5.3 Wind ................................................................................................................ 6
1.5.4 Solar ................................................................................................................ 7
Chapter 2 : Aims and Objectives ................................................................................. 8
2.1 Rationale of the Study ........................................................................................... 8
2.2 Aims and Objectives of the Research .................................................................... 9
2.3 Thesis Outline. ..................................................................................................... 10
Chapter 3 : Methodology ........................................................................................... 12
3.1 Introduction ......................................................................................................... 12
3.2 Literature Review ................................................................................................ 12
3.3 RETScreen 4 International .................................................................................. 14
3.3.1 RETScreen Objectives ................................................................................... 15
3.3.2 Software and Data......................................................................................... 16
3.3.3 RETScreen 4 Features .................................................................................. 16
3.3.4 RETScreen’s Five Step Analysis ................................................................... 18
Chapter 4 : Technical Analysis .................................................................................. 20
4.1. Introduction ........................................................................................................ 20
xii
4.1.1 Far North Region - Maroua .......................................................................... 21
4.1.2 North Region – Garoua ................................................................................. 22
4.1.3 Adamawa Region – Ngaoundéré ................................................................... 23
4.1.4 North West Region – Bamenda ..................................................................... 24
4.1.5 West Region – Bafia ...................................................................................... 25
4.1.6 Centre Region – Yaoundé ............................................................................. 27
4.1.7 Littoral Region - Douala ............................................................................... 28
4.1.8 Eastern Region – Bertoua ............................................................................. 29
4.1.9 South Region – Ebolowa ............................................................................... 31
4.1.10 South West Region – Fontem ...................................................................... 32
4.2. Central-grid Connected 2,000kW Wind Energy ................................................ 36
Results and Discussions. ........................................................................................... 41
4.3 Isolated-grid Connected 2,000W Solar Energy ................................................... 45
Results and Discussions ............................................................................................ 49
Chapter 5 : Economic and Sustainability Analysis ................................................. 56
5.1 Introduction ......................................................................................................... 56
5.2 Renewable Energy and Economic Development. ............................................... 56
5.3 Cost Analysis ....................................................................................................... 57
5.4 Financial Analysis ............................................................................................... 59
5.4.1 Wind .............................................................................................................. 60
5.4.2 Solar .............................................................................................................. 64
Chapter 6 : Environmental Analysis ......................................................................... 68
6.1 Introduction ......................................................................................................... 68
6.2 Greenhouse Gas Emissions in Cameroon ........................................................... 69
6.3 Offsetting Greenhouse Gases by Wind ............................................................... 70
6.4 Offsetting Greenhouse Gases by Solar ................................................................ 71

xiii
Chapter 7 : Political and Regulatory Framework ................................................... 73
Chapter 8 : Conclusion ............................................................................................... 79
Chapter 9 : Recommendations .................................................................................. 82
References .................................................................................................................... 85
Appendix ...................................................................................................................... 89
1
Chapter 1 : Introduction
1.1 The Republic of Cameroon
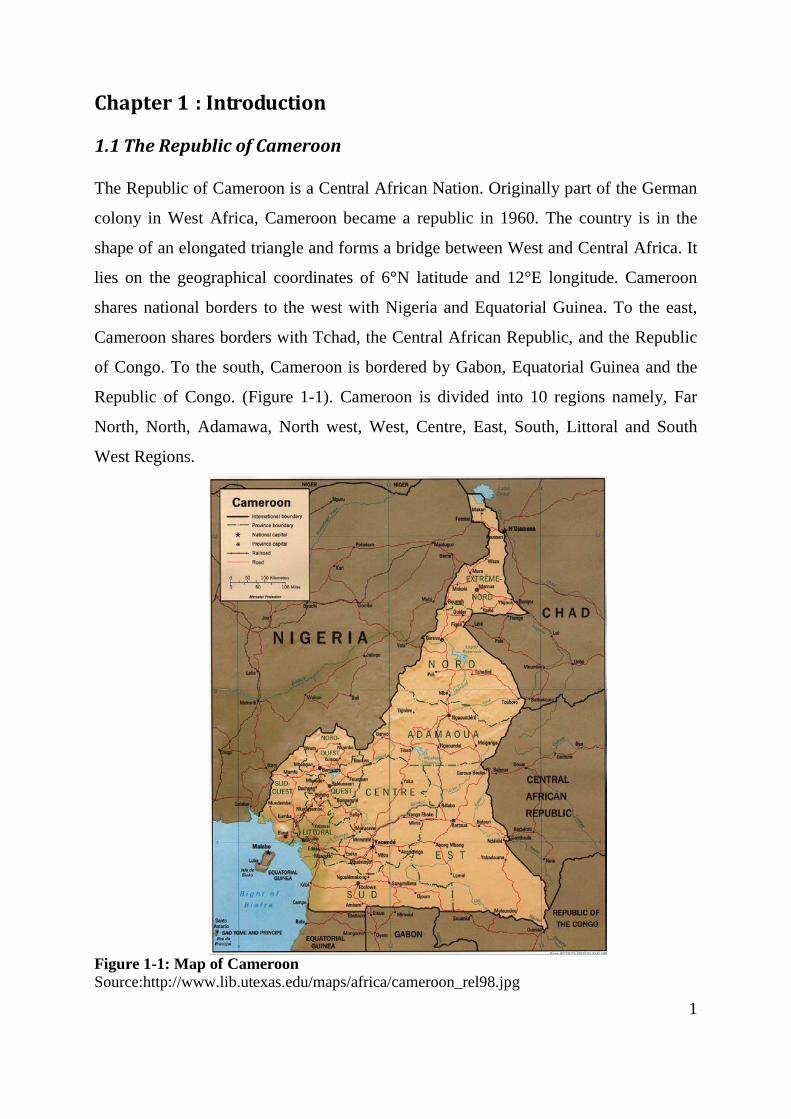
The Republic of Cameroon is a Central African Nation. Originally part of the German
colony in West Africa, Cameroon became a republic in 1960. The country is in the
shape of an elongated triangle and forms a bridge between West and Central Africa. It
lies on the geographical coordinates of 6°N latitude and 12°E longitude. Cameroon
shares national borders to the west with Nigeria and Equatorial Guinea. To the east,
Cameroon shares borders with Tchad, the Central African Republic, and the Republic
of Congo. To the south, Cameroon is bordered by Gabon, Equatorial Guinea and the
Republic of Congo. (Figure 1-1). Cameroon is divided into 10 regions namely, Far
North, North, Adamawa, North west, West, Centre, East, South, Littoral and South
West Regions.
Figure 1-1: Map of Cameroon Source:http://www.lib.utexas.edu/maps/africa/cameroon_rel98.jpg
2
Cameroon has a population of 16.32million inhabitants and a growth rate of about
2.02% (IERN, 2009). The human population of Cameroon is very unevenly distributed
with an estimated population density of 34.45 persons per square kilometer (IAEA,
2005). Some areas of the country have populations exceeding 100 persons per square
kilometer. The human population density in some parts of the country especially to the
southeast, is very low: approximately below 1 person per square kilometer (IERN,
2009). According to the IEA, Cameroon has a total surface area of 63,701 square
kilometers.
1.2 The Climate of Cameroon and Surface Meteorology
Cameroon has a tropical climate – humid in the south, but increasingly dry towards the
north. Along the coast, the average annual rainfall is about 4,060mm. In the semiarid
northwest, annual rainfall measures about 380mm. A dry season in the north lasts from
October to April. The average temperature in the south is 25°C, on the plateau it is
21°C and in the north it is 32°C (maps of world, 2009). Cameroon has mean annual
hours of sunshine per year of over 3000 hours and an average solar radiation intensity
of 240W/m² (IEA, NASA). In the sunny part of the country, the average solar
irradiance is estimated at 5.8kWh/day/m², while it is 4.9kWh/day/m² in the rest of the
country.
1.3 The Energy Situation in Cameroon
“Energy in Cameroon plays a pivotal role in shaping the economy of the country. With
reserves of oil and natural gas, Cameroon is following new policies to improve and
develop the sources of energy. A rise in global competition has led to the expansion of
the energy sector in Cameroon. Energy in Cameroon comprises of its oil and natural
gas reserves, hydroelectric energy etc. The major energy sources of Cameroon include
fuel wood, Hydropower and petroleum.
Cameroon began offshore oil production in 1977. Annual production has gradually
fallen since 1985, and the decline is expected to continue as existing reserves are
depleted. Output amounted to 76,600 barrels per day in 2001, down from 100,000
barrels per day in 1999. However, as of 2002, Cameroon was still sub-Saharan
3
Africa's fifth-largest crude oil producer. Hydroelectric energy is one of the major
energies in Cameroon. Cameroon currently relies heavily on hydro power for its
energy. Electrical energy is produced mostly by two major hydroelectric stations
located on the Sananga river. Nearly 60% of the power from these stations goes to the
aluminum smelter at Edéa ALUCAM. Cameroon's installed electrical capacity was
819,000 kW in 2001; total production of electricity in 2000 was 3.5 billion kWh, of
which 97.4% was from hydropower and the remainder from fossil fuels. Consumption
amounted to 3.4 billion kWh in 2000” (Encyclopedia of the nations, 2009). The energy
sector of Cameroon, is presently undergoing a smooth and steady development that
helps to attract foreign investors, but the current situation is not good enough to
prevent frequent power outages.
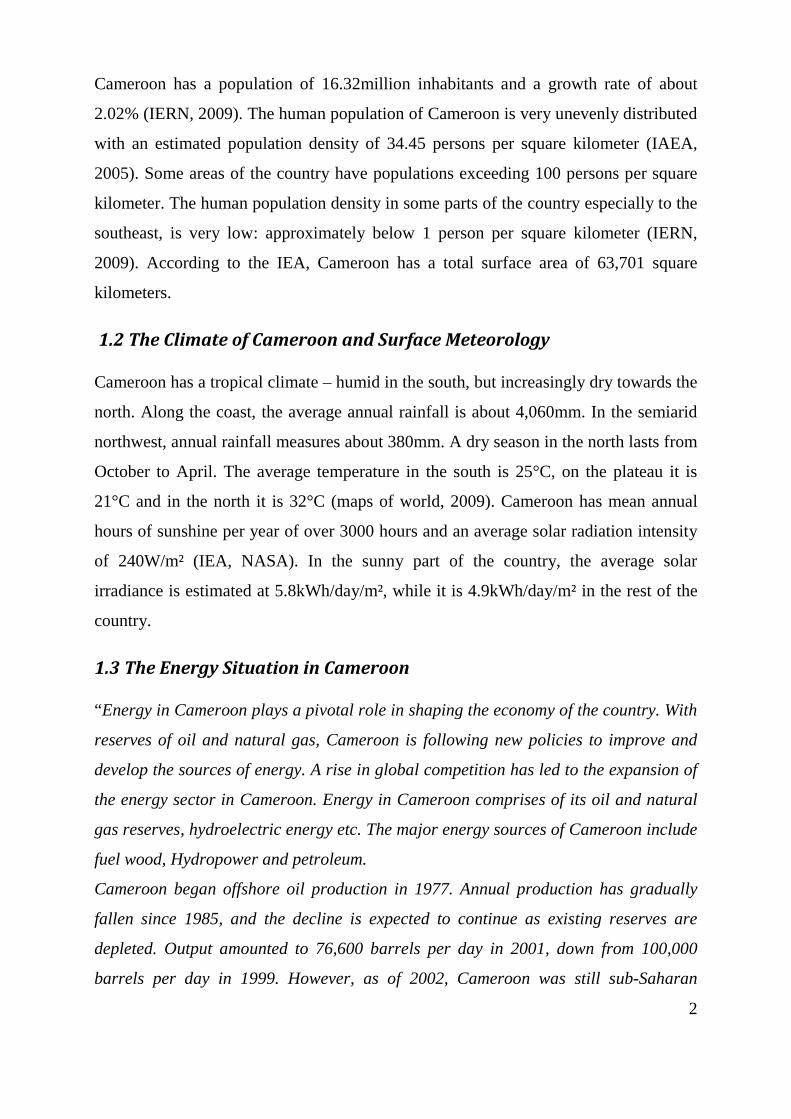
According to the IEA, the energy consumption of Cameroon is estimated at
3,490GWh. At present, 4.8% of its power needs are met by hydropower, 78% from
biomass and the rest is generated from oil (Figure 1-2). Technical data from AES
SONEL (the sole company in Cameroon responsible for generating, transmitting and
distributing electrical energy) factsheet 2009, indicates an installed electricity capacity
of 229MW including a 206 MW of thermal energy. AES SONEL generates 3,685GWh
electrical energy annually, 2,799 GWh of which is sold to the public. AES SONEL has
an access rate of 15%, including just 4% in rural areas. The rate of coverage of the
country is 46%, with 20 agencies and 117 offices serving a total of 553,186
subscribers. AES SONEL has a total of 43 electricity generation facilities, generating
95% hydroelectricity and 5% conventional thermal energy. These facilities constitutes:
- 3 hydropower plants (Songloulou 400 MW, daily modulation basin, Edea, 265
MW, run-of river power plant and Lagdo, 72 MW, head reservoir)
- 3 dam- reservoirs for regulating River Sanaga: Bamendjin, Mbakaou, Lagdo,
with a total of 7.3 Gm3
- 6 diesel thermal power plants connected to networks: Oyomabang, Bassa,
Logbaba, Bafoussam, Limbe, and Djamboutou and
- 31 isolated power plants.
Energy generated from these plants is transmitted across the country in two separate
networks: the northern network, powered by the Lagdo (80Mva) hydropower plant and
4
the Djamboutou (17Mva) diesel thermal power plant, and the southern grid is powered
by the hydropower plants of Songloulou (456Mva) and Edéa (275Mva) and 4 thermal
power plants: Oyomabang (40Mva), Bassa (25MVa) Logbaba (20Mva) and
Bafoussam (16MVa).
Figure 1-2: Share of Total Primary Energy Supply in Cameroon 2005 Source: IEA Energy statistics, www.iea.org/statistics/index
1.4 Renewable Energy
Renewable energy is energy generated from natural resources such as sunlight, wind,
rain, tides, and geothermal heat, which are renewable (naturally replenished)
(Wikipedia, 2009). In 2006, about 18% of global final energy consumption came from
renewables, with 13% coming from traditional biomass, such as wood-burning and 3%
from hydroelectricity. New renewables (small hydro, modern biomass, wind, solar,
geothermal, and biofuels) accounted for 2.4% and are growing very rapidly. The share
of renewables in electricity generation is around 18%, with 15% of global electricity
coming from hydroelectricity and 3.4% from new renewables (REN21, 2007).
Advantages and Benefits of Renewable Energies (ICRE, 2004)
- Renewable energy (RE) presents a more sustainable alternative to the use of
finite sources of energy.
- They reduce the reliance on energy imports and diversify energy supply mixes
by making use of locally available resources, thus contributing to energy
security.
5
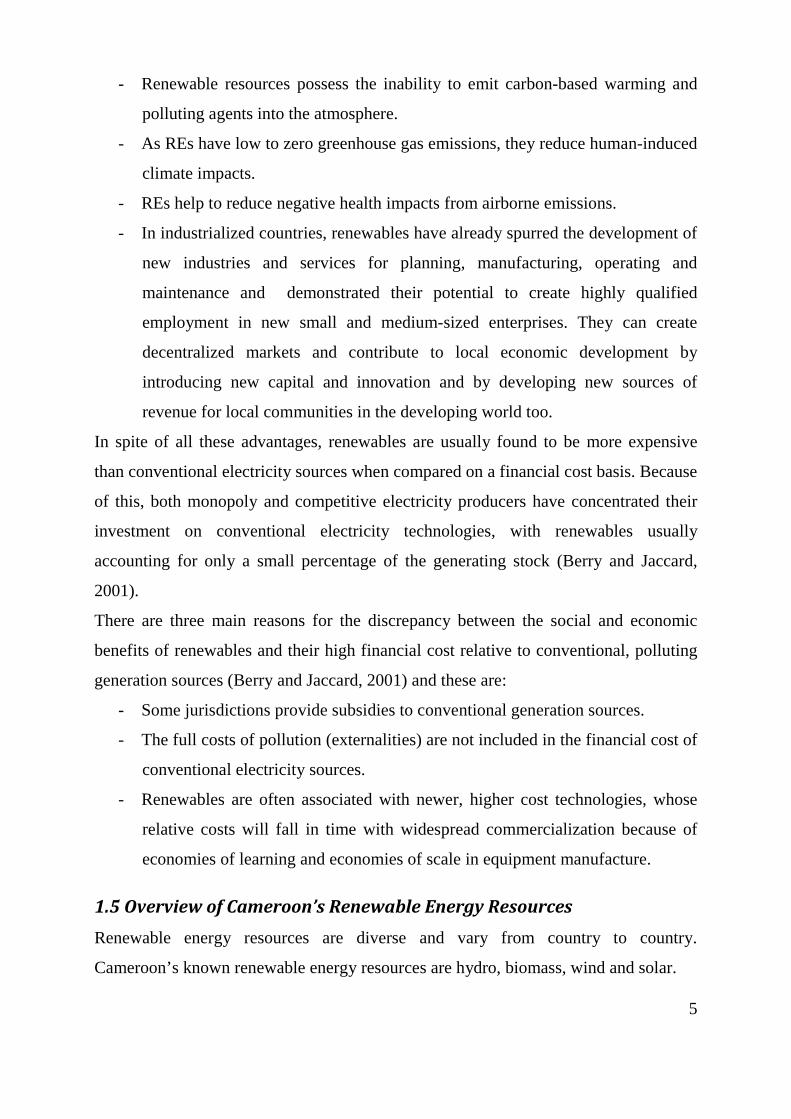
- Renewable resources possess the inability to emit carbon-based warming and
polluting agents into the atmosphere.
- As REs have low to zero greenhouse gas emissions, they reduce human-induced
climate impacts.
- REs help to reduce negative health impacts from airborne emissions.
- In industrialized countries, renewables have already spurred the development of
new industries and services for planning, manufacturing, operating and
maintenance and demonstrated their potential to create highly qualified
employment in new small and medium-sized enterprises. They can create
decentralized markets and contribute to local economic development by
introducing new capital and innovation and by developing new sources of
revenue for local communities in the developing world too.
In spite of all these advantages, renewables are usually found to be more expensive
than conventional electricity sources when compared on a financial cost basis. Because
of this, both monopoly and competitive electricity producers have concentrated their
investment on conventional electricity technologies, with renewables usually
accounting for only a small percentage of the generating stock (Berry and Jaccard,
2001).
There are three main reasons for the discrepancy between the social and economic
benefits of renewables and their high financial cost relative to conventional, polluting
generation sources (Berry and Jaccard, 2001) and these are:
- Some jurisdictions provide subsidies to conventional generation sources.
- The full costs of pollution (externalities) are not included in the financial cost of
conventional electricity sources.
- Renewables are often associated with newer, higher cost technologies, whose
relative costs will fall in time with widespread commercialization because of
economies of learning and economies of scale in equipment manufacture.
1.5 Overview of Cameroon’s Renewable Energy Resources Renewable energy resources are diverse and vary from country to country.
Cameroon’s known renewable energy resources are hydro, biomass, wind and solar.
6
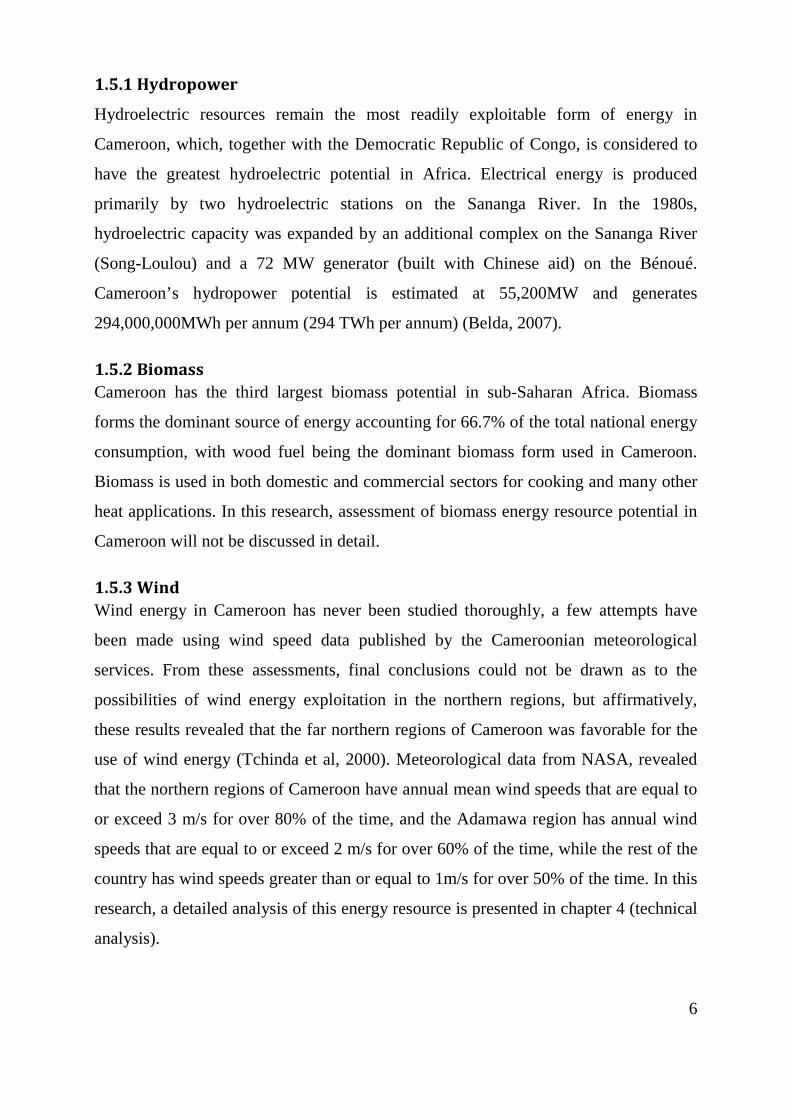
1.5.1 Hydropower
Hydroelectric resources remain the most readily exploitable form of energy in
Cameroon, which, together with the Democratic Republic of Congo, is considered to
have the greatest hydroelectric potential in Africa. Electrical energy is produced
primarily by two hydroelectric stations on the Sananga River. In the 1980s,
hydroelectric capacity was expanded by an additional complex on the Sananga River
(Song-Loulou) and a 72 MW generator (built with Chinese aid) on the Bénoué.
Cameroon’s hydropower potential is estimated at 55,200MW and generates
294,000,000MWh per annum (294 TWh per annum) (Belda, 2007).
1.5.2 Biomass Cameroon has the third largest biomass potential in sub-Saharan Africa. Biomass
forms the dominant source of energy accounting for 66.7% of the total national energy
consumption, with wood fuel being the dominant biomass form used in Cameroon.
Biomass is used in both domestic and commercial sectors for cooking and many other
heat applications. In this research, assessment of biomass energy resource potential in
Cameroon will not be discussed in detail.
1.5.3 Wind Wind energy in Cameroon has never been studied thoroughly, a few attempts have
been made using wind speed data published by the Cameroonian meteorological
services. From these assessments, final conclusions could not be drawn as to the
possibilities of wind energy exploitation in the northern regions, but affirmatively,
these results revealed that the far northern regions of Cameroon was favorable for the
use of wind energy (Tchinda et al, 2000). Meteorological data from NASA, revealed
that the northern regions of Cameroon have annual mean wind speeds that are equal to
or exceed 3 m/s for over 80% of the time, and the Adamawa region has annual wind
speeds that are equal to or exceed 2 m/s for over 60% of the time, while the rest of the
country has wind speeds greater than or equal to 1m/s for over 50% of the time. In this
research, a detailed analysis of this energy resource is presented in chapter 4 (technical
analysis).
7
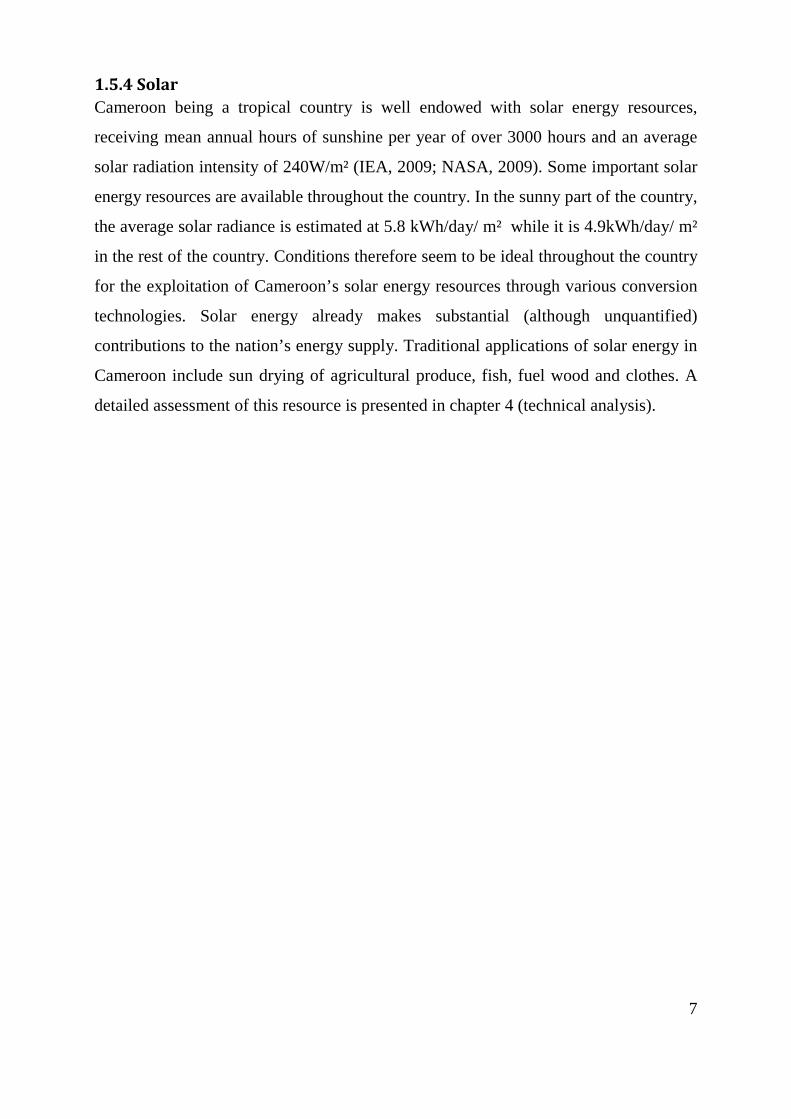
1.5.4 Solar Cameroon being a tropical country is well endowed with solar energy resources,
receiving mean annual hours of sunshine per year of over 3000 hours and an average
solar radiation intensity of 240W/m² (IEA, 2009; NASA, 2009). Some important solar
energy resources are available throughout the country. In the sunny part of the country,
the average solar radiance is estimated at 5.8 kWh/day/ m² while it is 4.9kWh/day/ m²
in the rest of the country. Conditions therefore seem to be ideal throughout the country
for the exploitation of Cameroon’s solar energy resources through various conversion
technologies. Solar energy already makes substantial (although unquantified)
contributions to the nation’s energy supply. Traditional applications of solar energy in
Cameroon include sun drying of agricultural produce, fish, fuel wood and clothes. A
detailed assessment of this resource is presented in chapter 4 (technical analysis).
8
Chapter 2 : Aims and Objectives
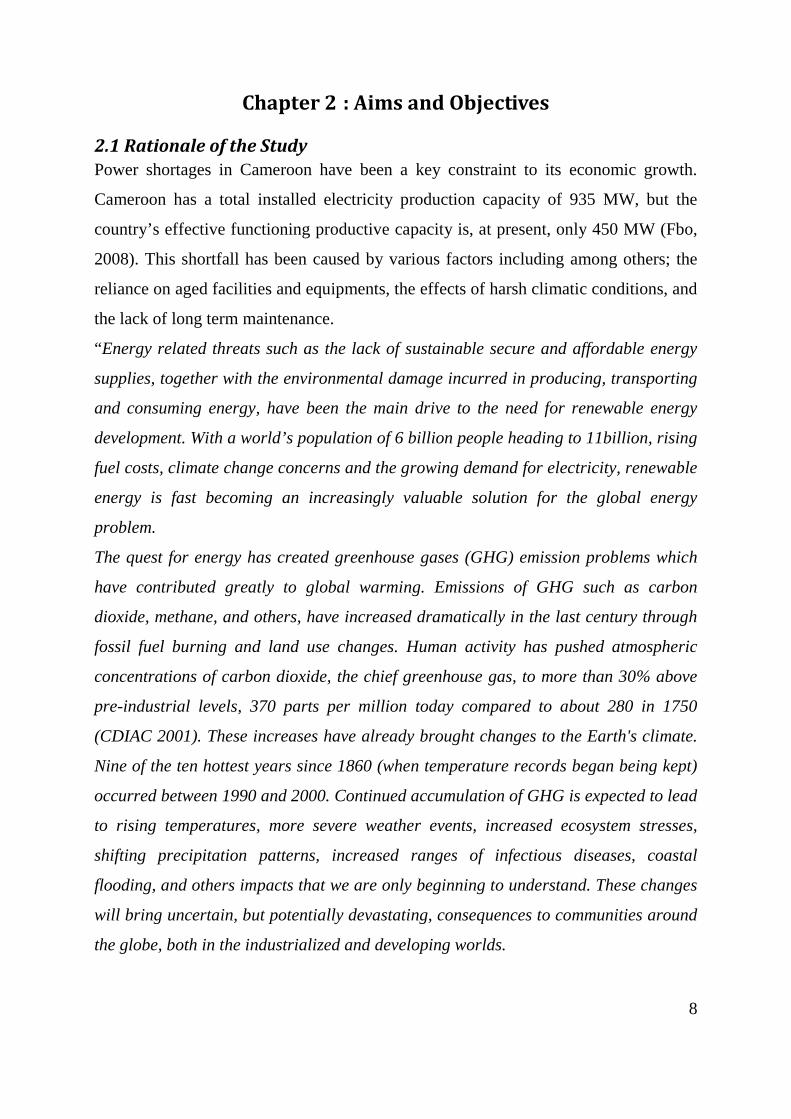
2.1 Rationale of the Study Power shortages in Cameroon have been a key constraint to its economic growth.
Cameroon has a total installed electricity production capacity of 935 MW, but the
country’s effective functioning productive capacity is, at present, only 450 MW (Fbo,
2008). This shortfall has been caused by various factors including among others; the
reliance on aged facilities and equipments, the effects of harsh climatic conditions, and
the lack of long term maintenance.
“Energy related threats such as the lack of sustainable secure and affordable energy
supplies, together with the environmental damage incurred in producing, transporting
and consuming energy, have been the main drive to the need for renewable energy
development. With a world’s population of 6 billion people heading to 11billion, rising
fuel costs, climate change concerns and the growing demand for electricity, renewable
energy is fast becoming an increasingly valuable solution for the global energy
problem.
The quest for energy has created greenhouse gases (GHG) emission problems which
have contributed greatly to global warming. Emissions of GHG such as carbon
dioxide, methane, and others, have increased dramatically in the last century through
fossil fuel burning and land use changes. Human activity has pushed atmospheric
concentrations of carbon dioxide, the chief greenhouse gas, to more than 30% above
pre-industrial levels, 370 parts per million today compared to about 280 in 1750
(CDIAC 2001). These increases have already brought changes to the Earth's climate.
Nine of the ten hottest years since 1860 (when temperature records began being kept)
occurred between 1990 and 2000. Continued accumulation of GHG is expected to lead
to rising temperatures, more severe weather events, increased ecosystem stresses,
shifting precipitation patterns, increased ranges of infectious diseases, coastal
flooding, and others impacts that we are only beginning to understand. These changes
will bring uncertain, but potentially devastating, consequences to communities around
the globe, both in the industrialized and developing worlds.
9
According to the Intergovernmental Panel on Climate Change (IPCC), the
authoritative scientific voice on climate change, without active efforts to reduce
emissions, the planet is expected to warm by an unprecedented 2.5 to 10o F during the
21st century. This rate of warming is much larger than the observed changes during
the 20th century and is very likely to be without precedent during at least the last
10,000 years.” (Earthtrends, 2001). Impacts of climate change are expected to be
severe. Taking unified global action against climate change, however, has proven
contentious. A shift from the use of natural gases and fossil fuel towards green and
renewable sources of energy is a big step to cutting the rate of GHG emissions.
Despite Cameroons vast renewable energy potentials, the performance of the power
sector in Cameroon since 2001 has been a disaster to its economy, going through
fluctuating and insufficient power generations. The sole dependence on hydropower
for electricity in Cameroon has significantly contributed to its energy problems with
increasing climatic changes leading to severe and prolonged draughts during the dry
season in Cameroon which runs between November and April. The majority of people
in Cameroon use biomass as their primary energy source (Figure 1-2), due in large to a
lack of electricity accessibility.
2.2 Aims and Objectives of the Research
This research work attempts to evaluate the potential of wind and solar energy of
Cameroon. It tries to establish the state of the art of electricity generation, transmission
and distribution in Cameroon, the problems it faces and the inability to meet the
current energy demand for Cameroon. In addition, the research seeks to examine and
assess the renewable energy sector and the possibility to revitalize the energy sector in
Cameroon in an environmentally friendly way. The research further examines the legal
framework of Cameroon and other government initiatives in as much as energy and
electricity are concerned. It also considers the potential role of renewable energy,
especially wind and solar, in improving the performance of the energy and electricity
sector in Cameroon. Thus, the specific considerations and objectives of this study are
as follows:
10
- Identify and document the prevailing state of electricity generation,
transmission, and distribution in Cameroon;
- Carry out a thorough assessment of the state of renewable energy development
in Cameroon;
- Identify the principal reasons and hurdles inhibiting at least a 99.99% energy
supply in Cameroon;
- Analyze the economic and sustainability likelihood for Cameroon buffered by a
boast in its energy sector by benefiting from the employment and use of
renewable energy technologies based on the implementation of strategies by
using a techno-economic viability analysis for future RE projects with the
RETScreen software tool;
- Recognize the legislations and initiatives formulated by the government of
Cameroon in an attempt to ameliorate its energy sector;
- Determine the environmental benefits from using RE based on the amount of
green house gas emissions that can be avoided;
- Proffer a plethora of recommendations that should serve as a comprehensive
strategy for an effective and efficient management of the electricity sector for a
sustainable development of Cameroon.
2.3 Thesis Outline.
Going backwards, this thesis begins with an introductory chapter, that presents the
Republic of Cameroon and its energy situation. It also introduces renewable energy
and gives an overview of the renewable energy resources in Cameroon.
This current chapter (chapter 2) provides substantial information on the perspectives,
motives and objectives underlying this dissertation. The chapter ends with this outline.
In the third chapter entitled “Methodology”, the methodology used in this thesis is
outlined and justified. It introduces the software tool (RETScreen) used in this
research to analyze the wind and solar potentials for Cameroon.
The fourth chapter provides the centre point of this research. It begins with an
introduction of the various study areas used, followed by the five step procedures used
in the analysis. It further describes the technical specifications of the wind turbine and
11
characteristic values used in the analyzes for the wind resource followed by results and
discussions for each of the locations analyzed. The remainder of the chapter looks at
the solar resource, giving the technical specifications for the solar module and
characteristic values used to analyzed the solar resource. The chapter ends with a
general discussion for the solar resource.
Chapter 5 provides an assessment of the financial viability for running running
potential wind power projects for three selected locations (Maroua, Garoua and
Ngoundere) and a potential solar power project for Garoua. It begins with an
assessment of the costs associated with purchasing, installing and running of such
projects. This is followed by financial analysis to determine if these projects could be
developed on a commercial scale and evaluate the possibility of self-financing which
is the basis for its economic importance.
In chapter 6, estimates of the greenhouse gas emission reduction (mitigation) potential
of the proposed project are presented in a conceptualized way.
A seventh chapter evaluates the environmental importance of RE with respect to GHG
emissions.
Finally, legislations and policies are fundamental to the effective and the efficient
management of renewable energy and energy as a whole. Therefore, the final section
of this dissertation explores and analysis the policy and legal frameworks regulating
the energy sector in Cameroon. It evaluates in general terms initiatives enacted by the
government of Cameroon to reduce the energy problems.
In the final section, chapters 8 and 9 provides conclusions and recommendations for a
possible enhancement of Cameroons’ economy by the use of renewable energy,
especially wind and solar.
Specifically, this thesis aims to provide the fundamental potential of Cameroons
renewable energy resources and the possibility to bypass the constraints limiting the
use, promotion and development of its full potentials. The research will serve as a
guide to all actors or stakeholders that have a stake in the regulation and use of
renewable energy in Cameroon. These stakeholders include international donor
agencies, the corporate world, Non-governmental organizations (NGOs) and
government policy makers.
12
Chapter 3 : Methodology
3.1 Introduction
The term methodology, in a broad perspective, refers to the process, principles and
procedures by which we approach problems and seek answers (Bogdan and Taylor,
1975). Methodology comprises data collection, organization and interpretation (Riley,
1963). It applies to how research is being conducted. The methodology employed in
this research is mainly through literature reviews, the use of the RETScreen software
tool for analysis and interviews. Neither field surveys nor site visits were undertaken
for this work.
It is evident that our assumptions, interest and goals influences methodological choices
(Bogdan and Taylor, 1975), and thereby the results. It is extremely important to
present how the different studies have been conducted. Apart from personal
observations and relevant information compiled from articles, government reports,
papers and books, information presented herein was obtained from/through the
following stakeholders.
- Representatives from all relevant government personnel;
- NGO’s;
- Staff and researchers.
Discussions were generated to identify constraints with regards to the energy sector in
Cameroon. These together with information obtained from secondary data were
transcribed and analyzed.
3.2 Literature Review
The wind power potential has never been considered as an alternative source of energy
in Cameroon. For that reason many researches took place to utilize renewable energy
especially wind energy in a full-fledged manner. In 2002, Tchinda and Kaptouom
discussed the prospect of wind power in the Adamawa and northern Cameroon
regions. It was observed that the northern region has annual mean wind speeds that are
equal to or exceed 2 m/s for over 53% of the time, while the Adamawa region has
13
annual wind speeds that are equal to or exceed 1 m/s for over 29% of the time. In their
research, calculations of the mean wind power density from a hypothetical aero
generator or water pumping system and the mean wind power from circular areas were
also made. In the northern regions, a very fruitful result would be achieved if
windmills were installed for producing wind energy for drinking water, irrigation and
electricity for small households, they concluded.
For the realization of this research work, relevant information in the international
scientific arena was collected, through diverse studies of literature from
textbooks/literature, international scientific journals, internet websites, reports by
governmental agencies and NGO’s. Substantial knowledge was gathered and a review
of what other scientists have written on issues concurring with the research topic was
made.
Major literature reviews were conducted to assemble information in the following
areas. The first was related to a description of the state and situation of energy
generation and consumption in Cameroon. The second was aimed at presenting the
rationale, objectives and outline of the workflow in this research. The third area was
used to give a detailed description of the tool used in the technical analysis to assess
the potential of RE generation in Cameroon (RETScreen International 4). Furthermore
a fourth section reviewed what the government of Cameroon has done in a bid to
improve the state of the energy sector. A final literature review was undertaken to
analysis and compare how sustainable the economy of Cameroon will be, employing
the use of wind and solar to generate energy to the current means. In addition, the
effects and improvements that will result from combining these technologies to the
current situation on the ground.
Software analysis
Prior to settling to the RETScreen, this research work was aimed at developing a
model for assessing the practicality of using renewable resources for electricity
production in Cameroon. In order to achieve this, wind speed and solar irradiance data
for major locations in Cameroon from the NASA Langley Research Centre
Atmospheric Science Data centre were to be used. This was to be estimated using
14
complicated calculations and complex equations in understanding and constructing
wind turbine generators as well as solar modules. Also, this had to involve a lot of
assumptions which could yield many errors and produce false results. In order to
minimize the error margin and obtain a more precise resultant value which will be as
close to the true value that would be obtained on the ground, it was imperative to
employ a standardized tool which is internationally accepted. An appropriate tool was
to have access to a rich database, be able to provide detailed information on equipment
suppliers and service providers around the globe. Secondly, this tool must be user
friendly and flexible without compromising on the technical details. The goal of the
latter is to be able to run models developed in this research to the appreciation and
understanding of the not so technical mind (specifically people without engineering
and financial backgrounds).
Several RETs and related software were identified and reviewed such as Hybrid2,
ViPOR, RET Finance, HOMER and PV WATTS. With the above points, the number
of software was narrowed down. The RETScreen software was selected because it
helps rapidly evaluates whether a proposed clean energy project makes sense and is
worth further consideration. Other software were equally good such as HOMER, but
was much more technical and less user friendly than the RETScreen software tool.
3.3 RETScreen 4 International
The RETScreen 4 International Clean Energy Project Analysis Software is an
innovative energy awareness, decision support and capacity building tool. It is
managed under the leadership and ongoing financial support of CANMET ENERGY
research centre of Natural Resources Canada’s NRCan. RETScreen is developed in
collaboration with a number of other governmental and multilateral organizations, and
with technical support from large network of experts from industry, government and
academia, such as NASA, REEEP, UNEP, DTIE, GEF, SWERA, PCF, EEF, WB and
Leonardo ENERGY Initiative. (RETScreen, 2005). The first version of the RETScreen
software was released in May 1998. Since then, it has become the most popular and
widely used RE feasibility analysis software in the world, with more than 186,000
downloads in 122 countries (RETScreen, 2005). The latest version RETScreen 4
15
international is a major development of the legacy versions consisting of 35 languages
covering more than two thirds of the world’s population.
3.3.1 RETScreen Objectives
The RETScreen International Clean Energy Decision Support Centre seeks to build the
capacity of planners, decision-makers and industry to implement renewable energy,
cogeneration and energy efficiency projects. This objective is achieved by developing
decision making tools (i.e. RETScreen software) that reduce the cost of pre-feasibility
studies; disseminating knowledge to help people make better decisions; and by
training people to better analyze the technical and financial viability of possible
projects. The broad aim of the centre’s partners is to foster increased market uptake of
renewable energy technologies (RETs) that reduce the reliance on conventional energy
sources and which help to protect the global environment. The centre’s main strategies
for achieving its objectives are as follows:
- Develop enabling tools;
- Transfer knowledge; and
- Provide project implementation.
A key principle is that the enabling tools developed by the centre must make it easier
for people to consider renewable energy projects at the critically important initial
planning stage, which is generally the best opportunity for introducing new
technologies (RETScreen, 2005). The enabling tools are also intended to significantly
reduce the duration and cost of the analysis itself, so that more RET projects can be
considered and ultimately, more will be built.
According to CANMET, 1991 numerous opportunities are currently being missed
around the world for implementing commercially viable clean energy projects because
various decision-makers still do not routinely consider them. National and regional
planners, industrial engineers, commercial and institutional building architects and
utility and community energy planners, for example, often fail to appreciate the
benefits of energy efficient and renewable energy technologies (RETs) at the critically
important initial planning stage, even when the technologies have proven to be cost
effective and reliable in similar situations elsewhere (CANMET, 1991). If clean
16
energy technologies are not considered and put on the table upfront in the decision-
making process, it is usually next to impossible for them to be considered in the
program development or project implementation stages. This results to projects being
missed that could help countries meet energy needs locally, and in a sustainable way,
while reducing GHG emissions, saving money, increasing energy security and self
reliance. These were the main objectives that led to the development of the
RETScreen.
3.3.2 Software and Data
RETScreen is the most comprehensive product of its kind, allowing engineers,
architects, and financial planners to model and analyze any clean energy project.
Decision-makers can conduct a five step standard analysis, including energy analysis,
cost analysis, emission analysis, financial analysis, and sensitivity/risk analysis.
The technologies included in RETScreen’s project models are all-inclusive, and
include both traditional and non-traditional sources of clean energy as well as
conventional energy sources and technologies. A sampling of these project models
include: energy efficiency (from large industrial facilities to individual houses),
heating and cooling (e.g., biomass, heat pumps, and solar air/water heating), power
(including renewables like solar, wind, wave, hydro, geothermal, etc. but also
conventional technologies such as gas/steam turbines and reciprocating engines), and
combined heat and power (or cogeneration).
Fully integrated into these analytical tools are product, project, hydrology and climate
databases (the latter with 4,700 ground-station locations plus NASA satellite data
covering the entire surface of the planet), as well as links to worldwide energy
resource maps. And, to help the user rapidly commence analysis, RETScreen has built
in an extensive database of generic clean energy project templates. There is no other
tool that helps conduct such an extensive analysis.
3.3.3 RETScreen 4 Features
In RETScreen 4, the software’s capabilities have been expanded from renewable
energy, cogeneration and discreet energy, to include a full range of financially viable

17
clean power, heating and cooling technologies and energy efficiency measures. This
has been improved through the expansion of climate data, required by the tool,
covering the entire surface of the planet, including central-grid connected, isolated-
grid connected and off-grid areas. The key output of this significant efforts in version
4 are as follows:
- Development of a new suite of models to evaluate energy efficiency measures
for residential, commercial and institutional buildings; communities; and
industrial facilities and processes.
- Expansion of the RETScreen climate database to 4,700 ground stations
locations around the globe and incorporation of the improved NASA surface
meteorology and solar energy dataset for populated areas directly into the
RETScreen software.
- Integration of the existing RETScreen models for renewable energy (eg wind
energy) and combined heat and power (CHP), along with the new models for
energy efficiency measures, all into one software file, and expansion of the
capabilities of existing models to evaluate technologies such as ocean current
and wave power.
- Translation of the integrated single software file and databases into 30
languages (eg Chinese, French, German)
- Broad dissemination of the tool via the RETScreen website.
The main principles and standard features of RETScreen models can be sumarized as
follows:
- Technical, financial and GHG analysis;
- Input requirements are simplified as much as possible while still allowing for
sufficient detail and accuracy, as appropriate for pre-feasibility and feasibility
studies;
- Financial analysis is based on the life cycle of the RE equipments;
- The analysis approach for all technology models is standardized to provide a
consistent “look and feel”, improve ease of use and allow for objective
comparisons of different RETs.
18
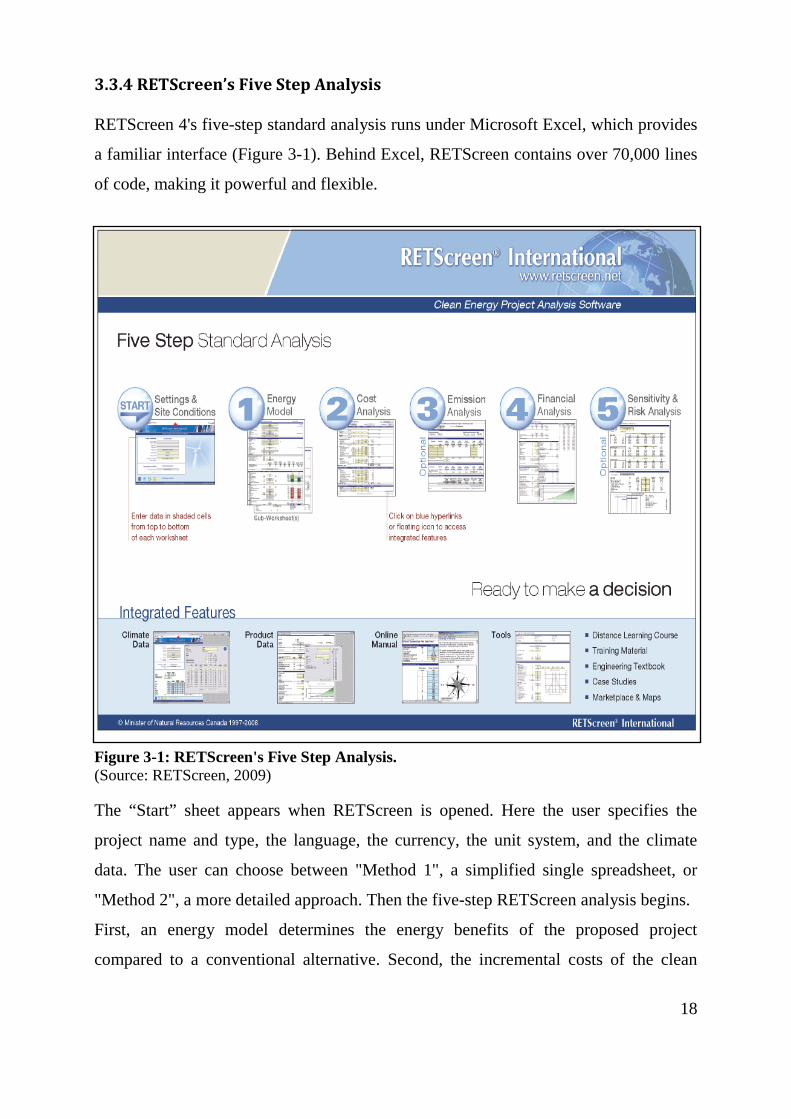
3.3.4 RETScreen’s Five Step Analysis
RETScreen 4's five-step standard analysis runs under Microsoft Excel, which provides
a familiar interface (Figure 3-1). Behind Excel, RETScreen contains over 70,000 lines
of code, making it powerful and flexible.
Figure 3-1: RETScreen's Five Step Analysis. (Source: RETScreen, 2009)
The “Start” sheet appears when RETScreen is opened. Here the user specifies the
project name and type, the language, the currency, the unit system, and the climate
data. The user can choose between "Method 1", a simplified single spreadsheet, or
"Method 2", a more detailed approach. Then the five-step RETScreen analysis begins.
First, an energy model determines the energy benefits of the proposed project
compared to a conventional alternative. Second, the incremental costs of the clean
19
energy project are evaluated. Third, an optional greenhouse gas analysis calculates the
emissions reductions associated with the project, according to a standardized
methodology developed in collaboration with the United Nations Environment
Program and the World Bank's Prototype Carbon Fund. Fourth, a financial summary
indicates whether the project is financially attractive, considering cash flows, taxation,
incentives, and emissions reductions credits. And fifth, a sensitivity and risk analysis
reveals how changes in inputs affect the viability of the project, in part through a
"Monte Carlo" simulation that reruns the analysis 500 times with random variations in
key parameters (RETScreen, 2005)
In addition to RETScreen's climate database, there is a product database of over 7,000
clean energy devices, ranging from wind turbines to fuel cells. A thousand page help
manual guides the user and explains clean energy technology. A host of tools performs
detailed engineering calculations directly applicable to RETScreen - for example, for
sizing a ground heat exchanger or estimating the thermal properties of a building
envelope - and helps with unit conversions, steam properties, GHG equivalencies and
more.
Apart from software, RETScreen offers a comprehensive distance learning course,
training material in many languages, a detailed textbook revealing the algorithms
behind RETScreen and providing background information on clean energy
technologies, case studies, and links to energy resource maps (RETScreen, 2005).
20
Chapter 4 : Technical Analysis
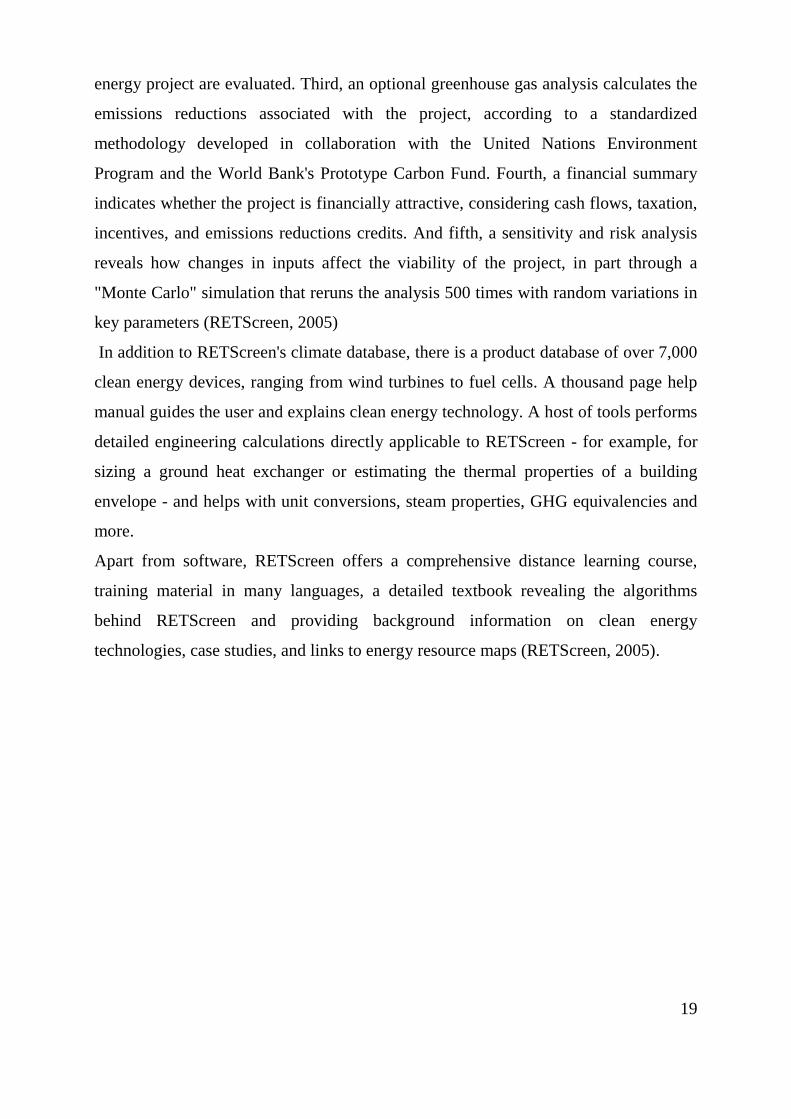
4.1. Introduction
For a comprehensive analysis of the renewable energy resource potential of Cameroon,
two major sources of renewable energy were considered. These were wind and solar.
Due in a large part to time constraint and the scope of a master thesis, other sources of
renewable energy such as biomass, combine heat and power, nuclear and geothermal
heat were not considered. Hydro was not considered based on the fact that it has
already been developed in Cameroon and is the main source of electricity generation.
The locations for this research were carefully selected. Firstly, the major criterion for
selection was the availability of meteorological data for the location. Meteorological
data for these locations were obtained through the RETScreen software from NASA.
Secondly, for the analysis to cover much of Cameroon, one location was selected for
each of the ten regions of Cameroon (Table 4-1, Figure 4-1). Because meteorological
data could not be readily obtained for a location in the western region of Cameroon,
Bafia, a location in the Centre region which is quite close to the western region, and
with available data was used to assess the potential for western region.
Table 4-1: Locations used for analysis
Site Region Location 1 Extreme North Maroua 2 North Garoua 3 Adamawa Ngaoundéré 4 North West Bamenda 5 West Bafia* 6 Centre Yaoundé 7 Littoral Douala 8 East Bertoua 9 South Ebolowa 10 South West Fontem
21
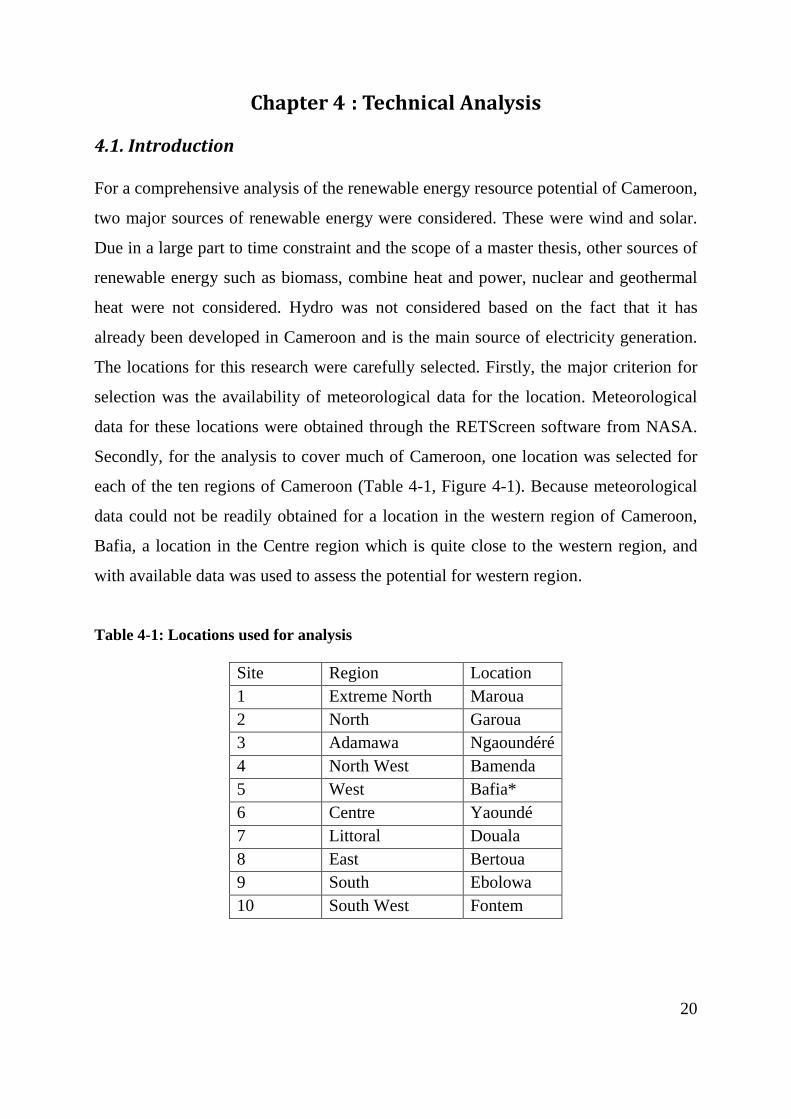
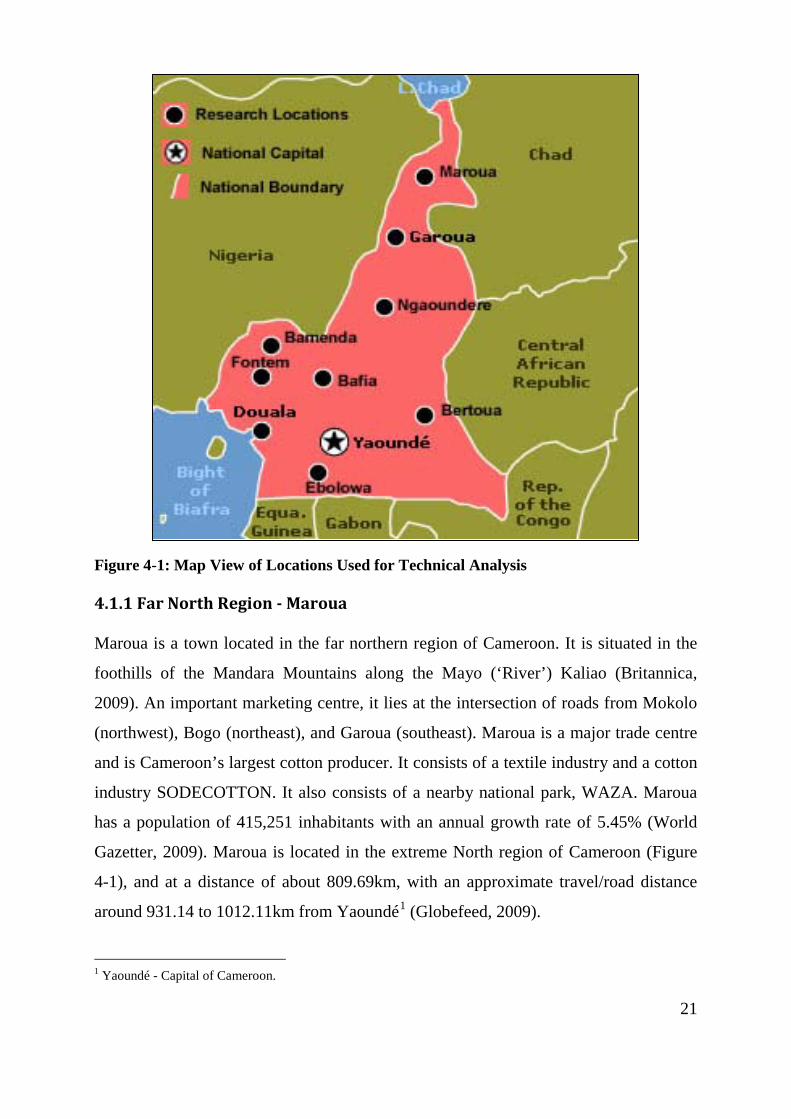
Figure 4-1: Map View of Locations Used for Technical Analysis
4.1.1 Far North Region - Maroua
Maroua is a town located in the far northern region of Cameroon. It is situated in the
foothills of the Mandara Mountains along the Mayo (‘River’) Kaliao (Britannica,
2009). An important marketing centre, it lies at the intersection of roads from Mokolo
(northwest), Bogo (northeast), and Garoua (southeast). Maroua is a major trade centre
and is Cameroon’s largest cotton producer. It consists of a textile industry and a cotton
industry SODECOTTON. It also consists of a nearby national park, WAZA. Maroua
has a population of 415,251 inhabitants with an annual growth rate of 5.45% (World
Gazetter, 2009). Maroua is located in the extreme North region of Cameroon (Figure
4-1), and at a distance of about 809.69km, with an approximate travel/road distance
around 931.14 to 1012.11km from Yaoundé1
1 Yaoundé - Capital of Cameroon.
(Globefeed, 2009).
22
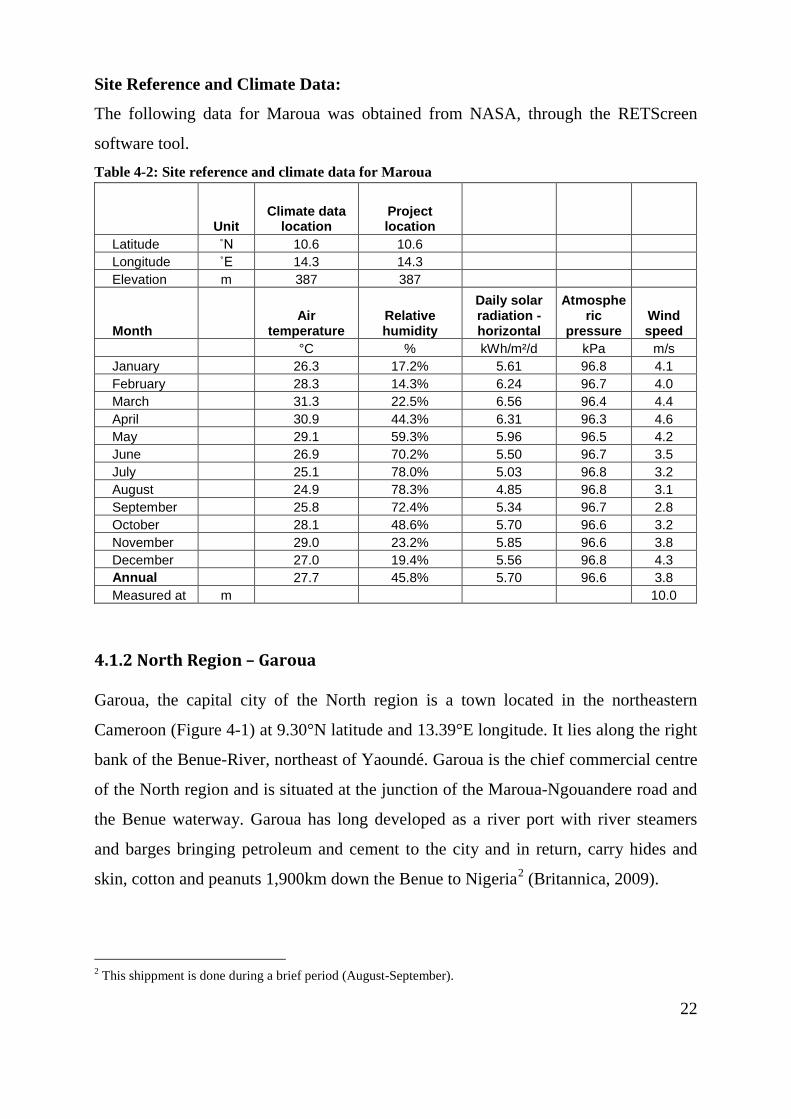
Site Reference and Climate Data:
The following data for Maroua was obtained from NASA, through the RETScreen
software tool. Table 4-2: Site reference and climate data for Maroua
Unit Climate data
location Project location
Latitude ˚N 10.6 10.6 Longitude ˚E 14.3 14.3 Elevation m 387 387
Month Air
temperature Relative humidity
Daily solar radiation - horizontal
Atmospheric
pressure Wind speed
°C % kWh/m²/d kPa m/s January 26.3 17.2% 5.61 96.8 4.1 February 28.3 14.3% 6.24 96.7 4.0 March 31.3 22.5% 6.56 96.4 4.4 April 30.9 44.3% 6.31 96.3 4.6 May 29.1 59.3% 5.96 96.5 4.2 June 26.9 70.2% 5.50 96.7 3.5 July 25.1 78.0% 5.03 96.8 3.2 August 24.9 78.3% 4.85 96.8 3.1 September 25.8 72.4% 5.34 96.7 2.8 October 28.1 48.6% 5.70 96.6 3.2 November 29.0 23.2% 5.85 96.6 3.8 December 27.0 19.4% 5.56 96.8 4.3 Annual 27.7 45.8% 5.70 96.6 3.8 Measured at m 10.0
4.1.2 North Region – Garoua
Garoua, the capital city of the North region is a town located in the northeastern
Cameroon (Figure 4-1) at 9.30°N latitude and 13.39°E longitude. It lies along the right
bank of the Benue-River, northeast of Yaoundé. Garoua is the chief commercial centre
of the North region and is situated at the junction of the Maroua-Ngouandere road and
the Benue waterway. Garoua has long developed as a river port with river steamers
and barges bringing petroleum and cement to the city and in return, carry hides and
skin, cotton and peanuts 1,900km down the Benue to Nigeria2
2 This shippment is done during a brief period (August-September).
(Britannica, 2009).
23
Garoua is connected to the entire nation by road, an airfield and a railway line. The
city has a population of 546,060 inhabitants with an annual growth rate of 5.46%
(World Gazetter, 2009). Garoua has a weaving factory supplied by nearby cotton
plantations, a textile research company and other industries such as leatherwork and
spinning.
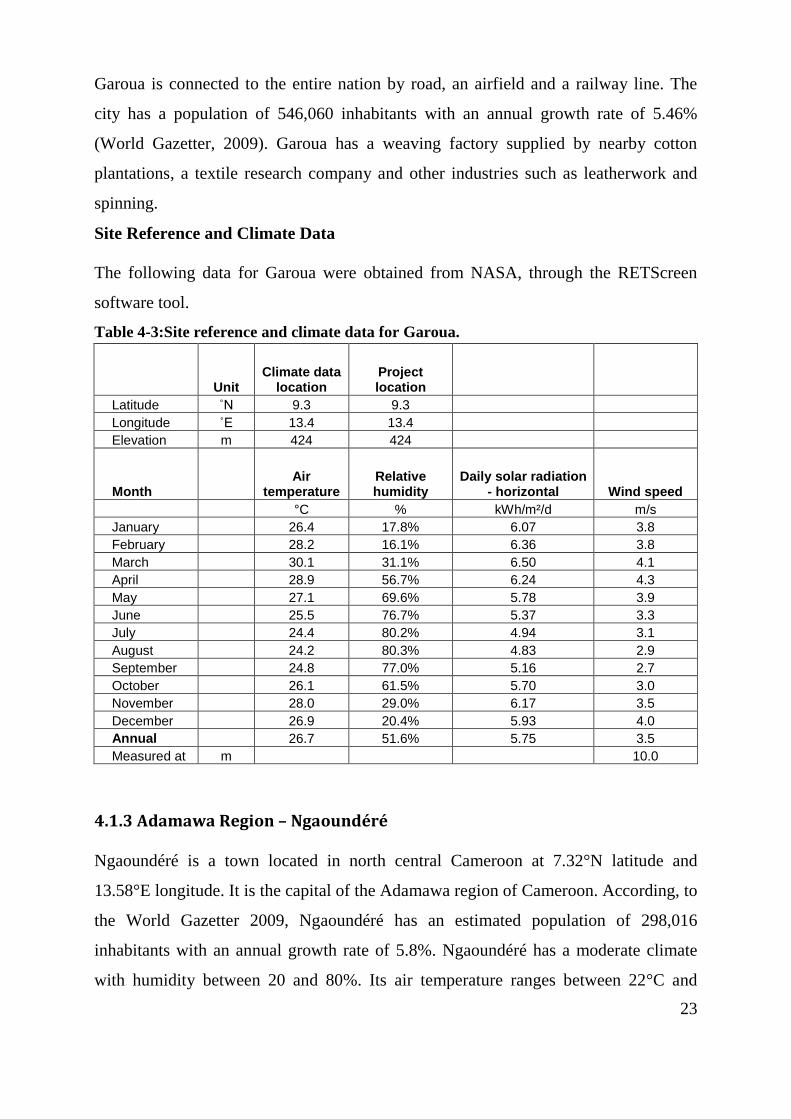
Site Reference and Climate Data
The following data for Garoua were obtained from NASA, through the RETScreen
software tool. Table 4-3:Site reference and climate data for Garoua.
Unit Climate data
location Project location
Latitude ˚N 9.3 9.3 Longitude ˚E 13.4 13.4 Elevation m 424 424
Month Air
temperature Relative humidity
Daily solar radiation - horizontal Wind speed
°C % kWh/m²/d m/s January 26.4 17.8% 6.07 3.8 February 28.2 16.1% 6.36 3.8 March 30.1 31.1% 6.50 4.1 April 28.9 56.7% 6.24 4.3 May 27.1 69.6% 5.78 3.9 June 25.5 76.7% 5.37 3.3 July 24.4 80.2% 4.94 3.1 August 24.2 80.3% 4.83 2.9 September 24.8 77.0% 5.16 2.7 October 26.1 61.5% 5.70 3.0 November 28.0 29.0% 6.17 3.5 December 26.9 20.4% 5.93 4.0 Annual 26.7 51.6% 5.75 3.5 Measured at m 10.0
4.1.3 Adamawa Region – Ngaoundéré
Ngaoundéré is a town located in north central Cameroon at 7.32°N latitude and
13.58°E longitude. It is the capital of the Adamawa region of Cameroon. According, to
the World Gazetter 2009, Ngaoundéré has an estimated population of 298,016
inhabitants with an annual growth rate of 5.8%. Ngaoundéré has a moderate climate
with humidity between 20 and 80%. Its air temperature ranges between 22°C and
24
27°C, with an annual average horizontal solar radiation of 5.65 kWh/m²/yr, and an
annual average wind speed of 3.3m/s measured at a height of 10m (NASA 2009).
Industries in the city include dairying, preparation of hides and skin, perfume
manufacture and cotton ginning. Major beauxite deposits are exploited to the south.
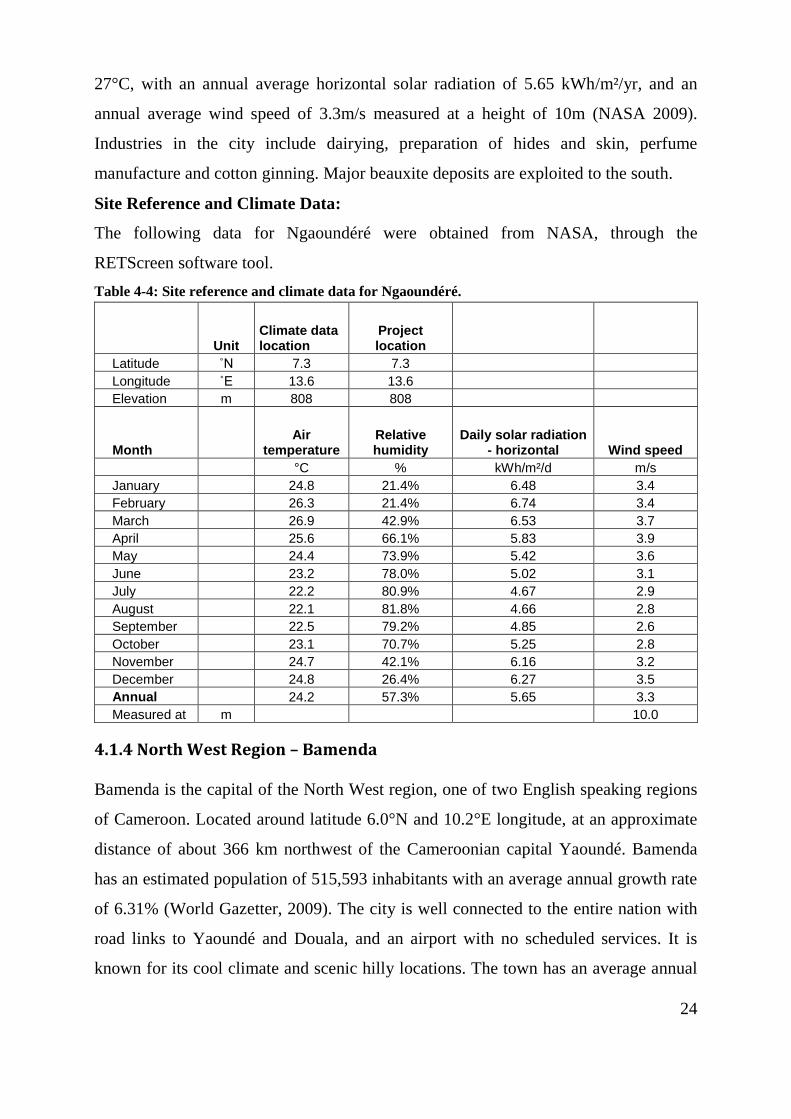
Site Reference and Climate Data:
The following data for Ngaoundéré were obtained from NASA, through the
RETScreen software tool. Table 4-4: Site reference and climate data for Ngaoundéré.
Unit Climate data location
Project location
Latitude ˚N 7.3 7.3 Longitude ˚E 13.6 13.6 Elevation m 808 808
Month Air
temperature Relative humidity
Daily solar radiation - horizontal Wind speed
°C % kWh/m²/d m/s January 24.8 21.4% 6.48 3.4 February 26.3 21.4% 6.74 3.4 March 26.9 42.9% 6.53 3.7 April 25.6 66.1% 5.83 3.9 May 24.4 73.9% 5.42 3.6 June 23.2 78.0% 5.02 3.1 July 22.2 80.9% 4.67 2.9 August 22.1 81.8% 4.66 2.8 September 22.5 79.2% 4.85 2.6 October 23.1 70.7% 5.25 2.8 November 24.7 42.1% 6.16 3.2 December 24.8 26.4% 6.27 3.5 Annual 24.2 57.3% 5.65 3.3 Measured at m 10.0
4.1.4 North West Region – Bamenda
Bamenda is the capital of the North West region, one of two English speaking regions
of Cameroon. Located around latitude 6.0°N and 10.2°E longitude, at an approximate
distance of about 366 km northwest of the Cameroonian capital Yaoundé. Bamenda
has an estimated population of 515,593 inhabitants with an average annual growth rate
of 6.31% (World Gazetter, 2009). The city is well connected to the entire nation with
road links to Yaoundé and Douala, and an airport with no scheduled services. It is
known for its cool climate and scenic hilly locations. The town has an average annual
25
air temperature of 22.7°Cand an average annual horizontal solar radiation of 4.96
kWh/m²/yr (NASA, 2009). Comparatively, Bamenda has very low wind speeds in the
range of 1.5-2.5m/s measured at a height of 10m. The city’s humidity ranges between
40% and 80%.
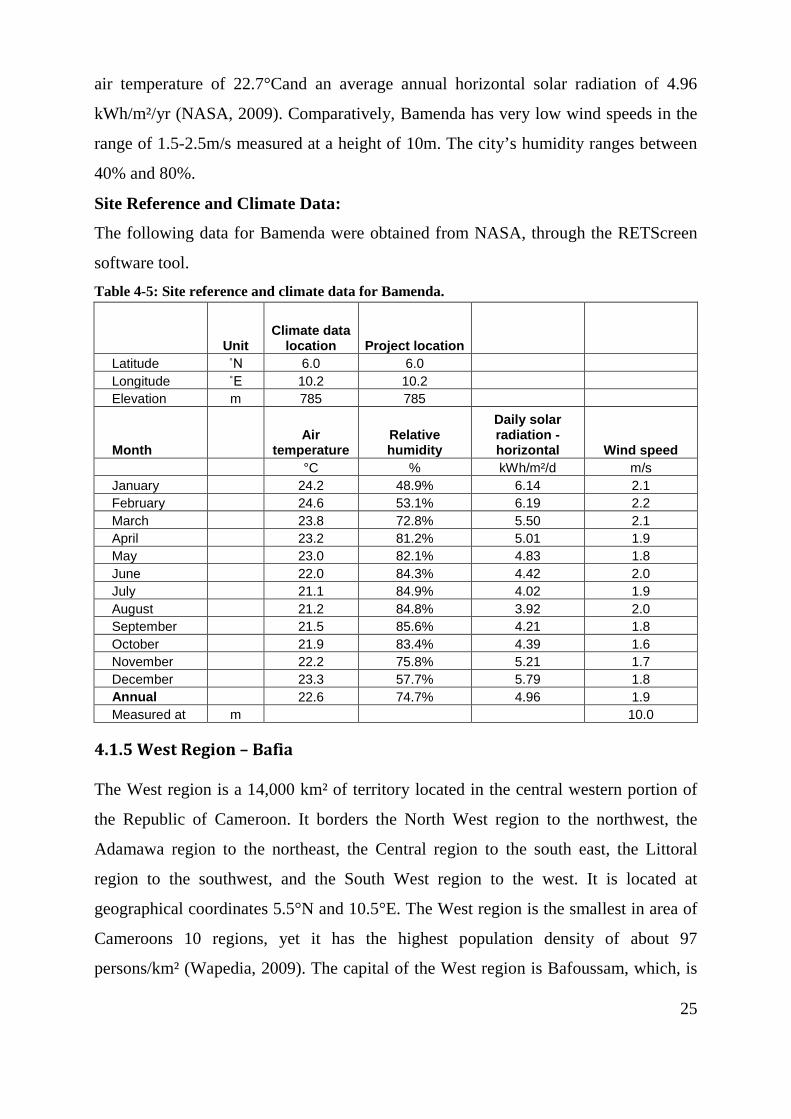
Site Reference and Climate Data:
The following data for Bamenda were obtained from NASA, through the RETScreen
software tool. Table 4-5: Site reference and climate data for Bamenda.
Unit Climate data
location Project location Latitude ˚N 6.0 6.0 Longitude ˚E 10.2 10.2 Elevation m 785 785
Month Air
temperature Relative humidity
Daily solar radiation - horizontal Wind speed
°C % kWh/m²/d m/s January 24.2 48.9% 6.14 2.1 February 24.6 53.1% 6.19 2.2 March 23.8 72.8% 5.50 2.1 April 23.2 81.2% 5.01 1.9 May 23.0 82.1% 4.83 1.8 June 22.0 84.3% 4.42 2.0 July 21.1 84.9% 4.02 1.9 August 21.2 84.8% 3.92 2.0 September 21.5 85.6% 4.21 1.8 October 21.9 83.4% 4.39 1.6 November 22.2 75.8% 5.21 1.7 December 23.3 57.7% 5.79 1.8 Annual 22.6 74.7% 4.96 1.9 Measured at m 10.0
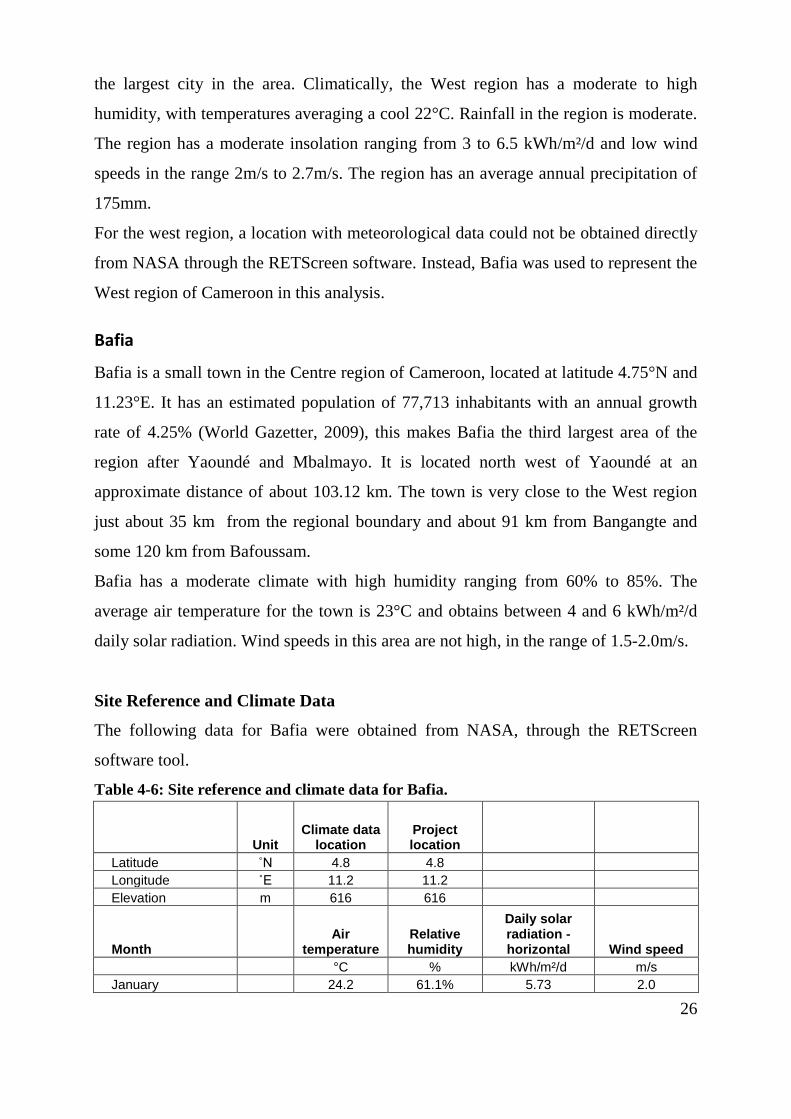
4.1.5 West Region – Bafia
The West region is a 14,000 km² of territory located in the central western portion of
the Republic of Cameroon. It borders the North West region to the northwest, the
Adamawa region to the northeast, the Central region to the south east, the Littoral
region to the southwest, and the South West region to the west. It is located at
geographical coordinates 5.5°N and 10.5°E. The West region is the smallest in area of
Cameroons 10 regions, yet it has the highest population density of about 97
persons/km² (Wapedia, 2009). The capital of the West region is Bafoussam, which, is
26
the largest city in the area. Climatically, the West region has a moderate to high
humidity, with temperatures averaging a cool 22°C. Rainfall in the region is moderate.
The region has a moderate insolation ranging from 3 to 6.5 kWh/m²/d and low wind
speeds in the range 2m/s to 2.7m/s. The region has an average annual precipitation of
175mm.
For the west region, a location with meteorological data could not be obtained directly
from NASA through the RETScreen software. Instead, Bafia was used to represent the
West region of Cameroon in this analysis.
Bafia
Bafia is a small town in the Centre region of Cameroon, located at latitude 4.75°N and
11.23°E. It has an estimated population of 77,713 inhabitants with an annual growth
rate of 4.25% (World Gazetter, 2009), this makes Bafia the third largest area of the
region after Yaoundé and Mbalmayo. It is located north west of Yaoundé at an
approximate distance of about 103.12 km. The town is very close to the West region
just about 35 km from the regional boundary and about 91 km from Bangangte and
some 120 km from Bafoussam.
Bafia has a moderate climate with high humidity ranging from 60% to 85%. The
average air temperature for the town is 23°C and obtains between 4 and 6 kWh/m²/d
daily solar radiation. Wind speeds in this area are not high, in the range of 1.5-2.0m/s.
Site Reference and Climate Data
The following data for Bafia were obtained from NASA, through the RETScreen
software tool.
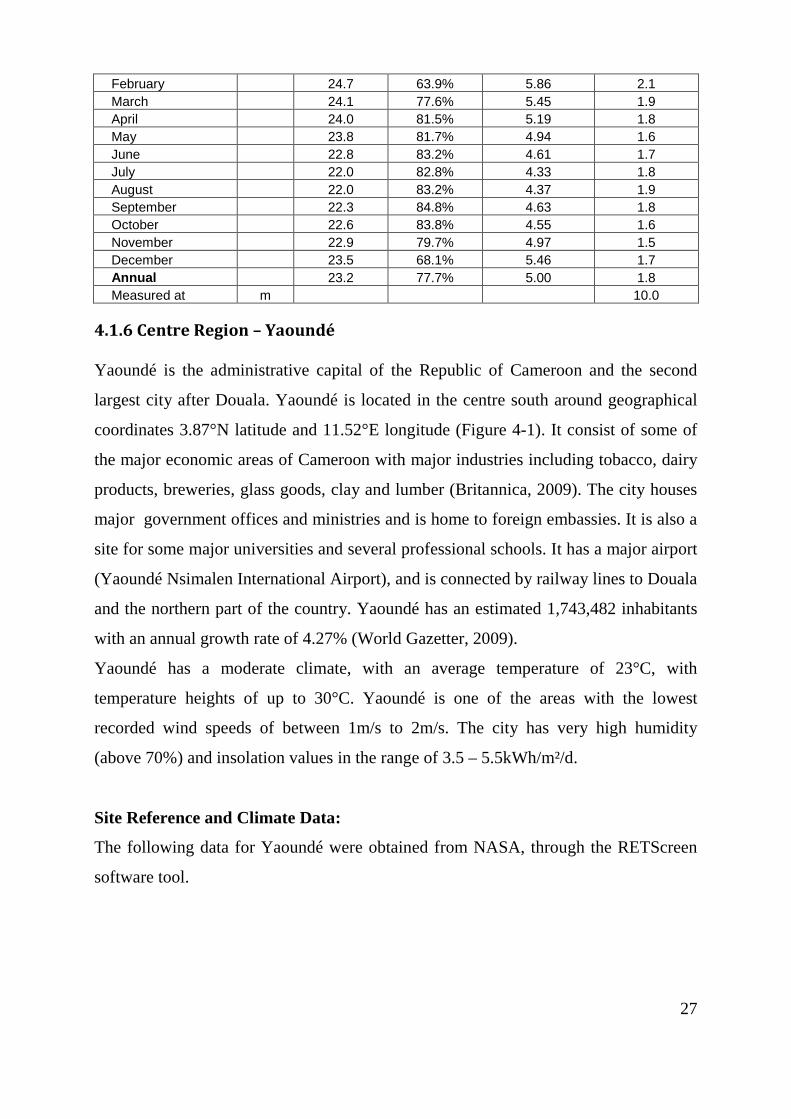
Table 4-6: Site reference and climate data for Bafia.
Unit Climate data
location Project location
Latitude ˚N 4.8 4.8 Longitude ˚E 11.2 11.2 Elevation m 616 616
Month Air
temperature Relative humidity
Daily solar radiation - horizontal Wind speed
°C % kWh/m²/d m/s January 24.2 61.1% 5.73 2.0
27
February 24.7 63.9% 5.86 2.1 March 24.1 77.6% 5.45 1.9 April 24.0 81.5% 5.19 1.8 May 23.8 81.7% 4.94 1.6 June 22.8 83.2% 4.61 1.7 July 22.0 82.8% 4.33 1.8 August 22.0 83.2% 4.37 1.9 September 22.3 84.8% 4.63 1.8 October 22.6 83.8% 4.55 1.6 November 22.9 79.7% 4.97 1.5 December 23.5 68.1% 5.46 1.7 Annual 23.2 77.7% 5.00 1.8 Measured at m 10.0
4.1.6 Centre Region – Yaoundé
Yaoundé is the administrative capital of the Republic of Cameroon and the second
largest city after Douala. Yaoundé is located in the centre south around geographical
coordinates 3.87°N latitude and 11.52°E longitude (Figure 4-1). It consist of some of
the major economic areas of Cameroon with major industries including tobacco, dairy
products, breweries, glass goods, clay and lumber (Britannica, 2009). The city houses
major government offices and ministries and is home to foreign embassies. It is also a
site for some major universities and several professional schools. It has a major airport
(Yaoundé Nsimalen International Airport), and is connected by railway lines to Douala
and the northern part of the country. Yaoundé has an estimated 1,743,482 inhabitants
with an annual growth rate of 4.27% (World Gazetter, 2009).
Yaoundé has a moderate climate, with an average temperature of 23°C, with
temperature heights of up to 30°C. Yaoundé is one of the areas with the lowest
recorded wind speeds of between 1m/s to 2m/s. The city has very high humidity
(above 70%) and insolation values in the range of 3.5 – 5.5kWh/m²/d.
Site Reference and Climate Data:
The following data for Yaoundé were obtained from NASA, through the RETScreen
software tool.
28
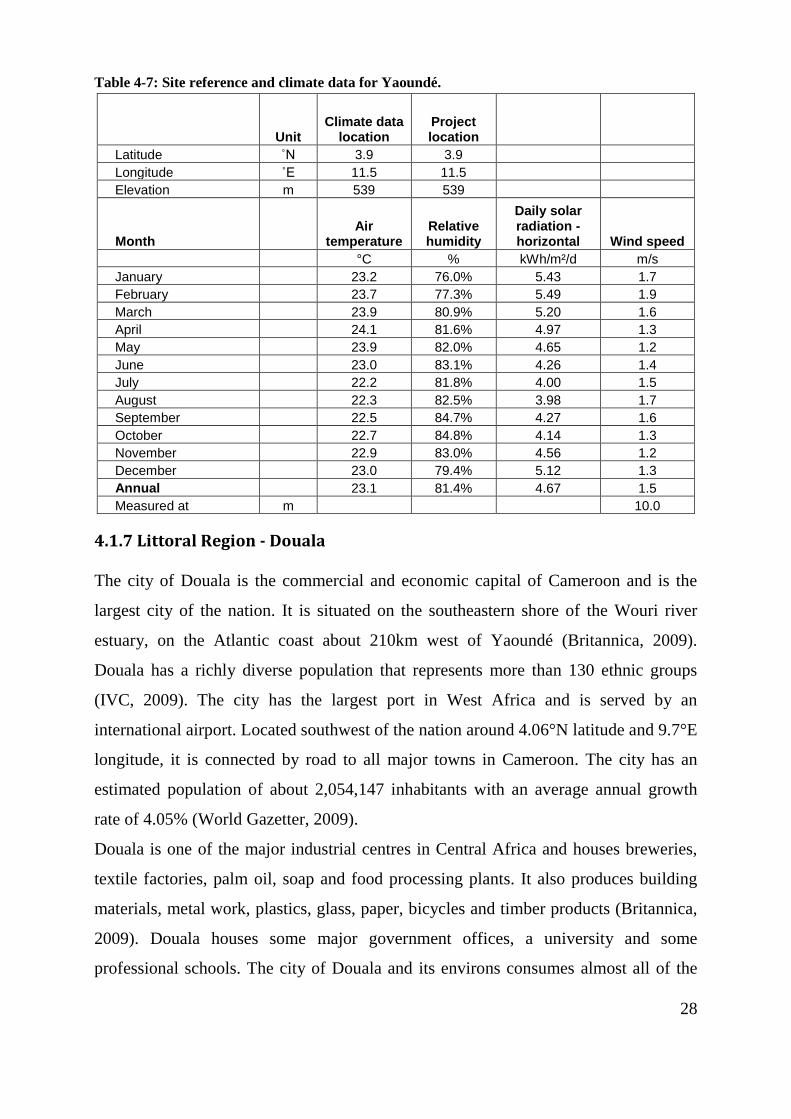
Table 4-7: Site reference and climate data for Yaoundé.
Unit Climate data
location Project location
Latitude ˚N 3.9 3.9 Longitude ˚E 11.5 11.5 Elevation m 539 539
Month Air
temperature Relative humidity
Daily solar radiation - horizontal Wind speed
°C % kWh/m²/d m/s January 23.2 76.0% 5.43 1.7 February 23.7 77.3% 5.49 1.9 March 23.9 80.9% 5.20 1.6 April 24.1 81.6% 4.97 1.3 May 23.9 82.0% 4.65 1.2 June 23.0 83.1% 4.26 1.4 July 22.2 81.8% 4.00 1.5 August 22.3 82.5% 3.98 1.7 September 22.5 84.7% 4.27 1.6 October 22.7 84.8% 4.14 1.3 November 22.9 83.0% 4.56 1.2 December 23.0 79.4% 5.12 1.3 Annual 23.1 81.4% 4.67 1.5 Measured at m 10.0
4.1.7 Littoral Region - Douala
The city of Douala is the commercial and economic capital of Cameroon and is the
largest city of the nation. It is situated on the southeastern shore of the Wouri river
estuary, on the Atlantic coast about 210km west of Yaoundé (Britannica, 2009).
Douala has a richly diverse population that represents more than 130 ethnic groups
(IVC, 2009). The city has the largest port in West Africa and is served by an
international airport. Located southwest of the nation around 4.06°N latitude and 9.7°E
longitude, it is connected by road to all major towns in Cameroon. The city has an
estimated population of about 2,054,147 inhabitants with an average annual growth
rate of 4.05% (World Gazetter, 2009).
Douala is one of the major industrial centres in Central Africa and houses breweries,
textile factories, palm oil, soap and food processing plants. It also produces building
materials, metal work, plastics, glass, paper, bicycles and timber products (Britannica,
2009). Douala houses some major government offices, a university and some
professional schools. The city of Douala and its environs consumes almost all of the
29
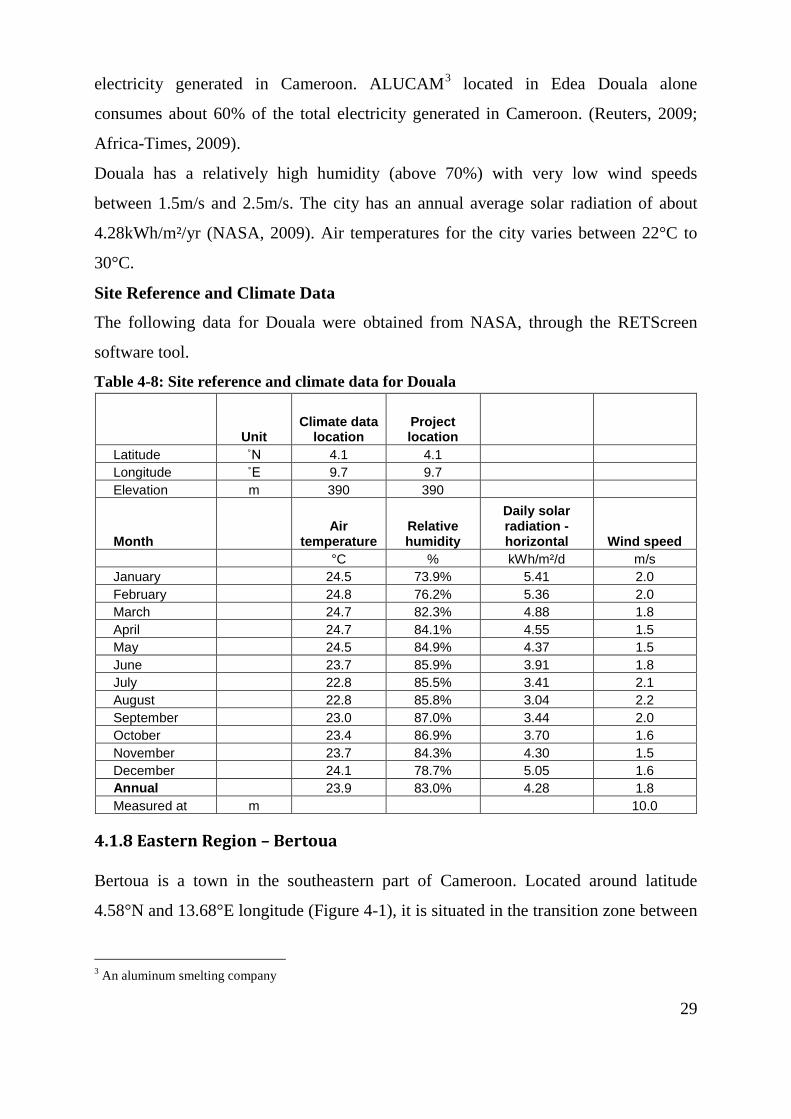
electricity generated in Cameroon. ALUCAM3
Douala has a relatively high humidity (above 70%) with very low wind speeds
between 1.5m/s and 2.5m/s. The city has an annual average solar radiation of about
4.28kWh/m²/yr (NASA, 2009). Air temperatures for the city varies between 22°C to
30°C.
located in Edea Douala alone
consumes about 60% of the total electricity generated in Cameroon. (Reuters, 2009;
Africa-Times, 2009).
Site Reference and Climate Data
The following data for Douala were obtained from NASA, through the RETScreen
software tool.
Table 4-8: Site reference and climate data for Douala
Unit Climate data
location Project location
Latitude ˚N 4.1 4.1 Longitude ˚E 9.7 9.7 Elevation m 390 390
Month Air
temperature Relative humidity
Daily solar radiation - horizontal Wind speed
°C % kWh/m²/d m/s January 24.5 73.9% 5.41 2.0 February 24.8 76.2% 5.36 2.0 March 24.7 82.3% 4.88 1.8 April 24.7 84.1% 4.55 1.5 May 24.5 84.9% 4.37 1.5 June 23.7 85.9% 3.91 1.8 July 22.8 85.5% 3.41 2.1 August 22.8 85.8% 3.04 2.2 September 23.0 87.0% 3.44 2.0 October 23.4 86.9% 3.70 1.6 November 23.7 84.3% 4.30 1.5 December 24.1 78.7% 5.05 1.6 Annual 23.9 83.0% 4.28 1.8 Measured at m 10.0
4.1.8 Eastern Region – Bertoua
Bertoua is a town in the southeastern part of Cameroon. Located around latitude
4.58°N and 13.68°E longitude (Figure 4-1), it is situated in the transition zone between
3 An aluminum smelting company
30
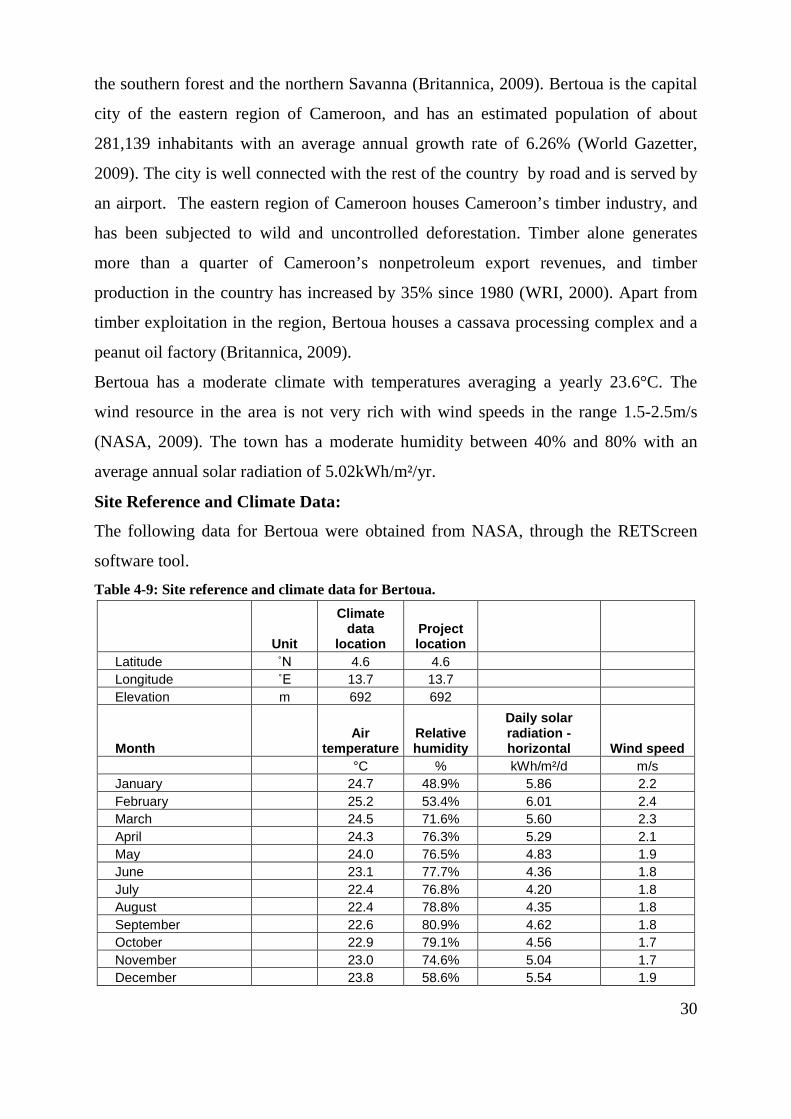
the southern forest and the northern Savanna (Britannica, 2009). Bertoua is the capital
city of the eastern region of Cameroon, and has an estimated population of about
281,139 inhabitants with an average annual growth rate of 6.26% (World Gazetter,
2009). The city is well connected with the rest of the country by road and is served by
an airport. The eastern region of Cameroon houses Cameroon’s timber industry, and
has been subjected to wild and uncontrolled deforestation. Timber alone generates
more than a quarter of Cameroon’s nonpetroleum export revenues, and timber
production in the country has increased by 35% since 1980 (WRI, 2000). Apart from
timber exploitation in the region, Bertoua houses a cassava processing complex and a
peanut oil factory (Britannica, 2009).
Bertoua has a moderate climate with temperatures averaging a yearly 23.6°C. The
wind resource in the area is not very rich with wind speeds in the range 1.5-2.5m/s
(NASA, 2009). The town has a moderate humidity between 40% and 80% with an
average annual solar radiation of 5.02kWh/m²/yr.
Site Reference and Climate Data:
The following data for Bertoua were obtained from NASA, through the RETScreen
software tool. Table 4-9: Site reference and climate data for Bertoua.
Unit
Climate data
location Project location
Latitude ˚N 4.6 4.6 Longitude ˚E 13.7 13.7 Elevation m 692 692
Month Air
temperature Relative humidity
Daily solar radiation - horizontal Wind speed
°C % kWh/m²/d m/s January 24.7 48.9% 5.86 2.2 February 25.2 53.4% 6.01 2.4 March 24.5 71.6% 5.60 2.3 April 24.3 76.3% 5.29 2.1 May 24.0 76.5% 4.83 1.9 June 23.1 77.7% 4.36 1.8 July 22.4 76.8% 4.20 1.8 August 22.4 78.8% 4.35 1.8 September 22.6 80.9% 4.62 1.8 October 22.9 79.1% 4.56 1.7 November 23.0 74.6% 5.04 1.7 December 23.8 58.6% 5.54 1.9
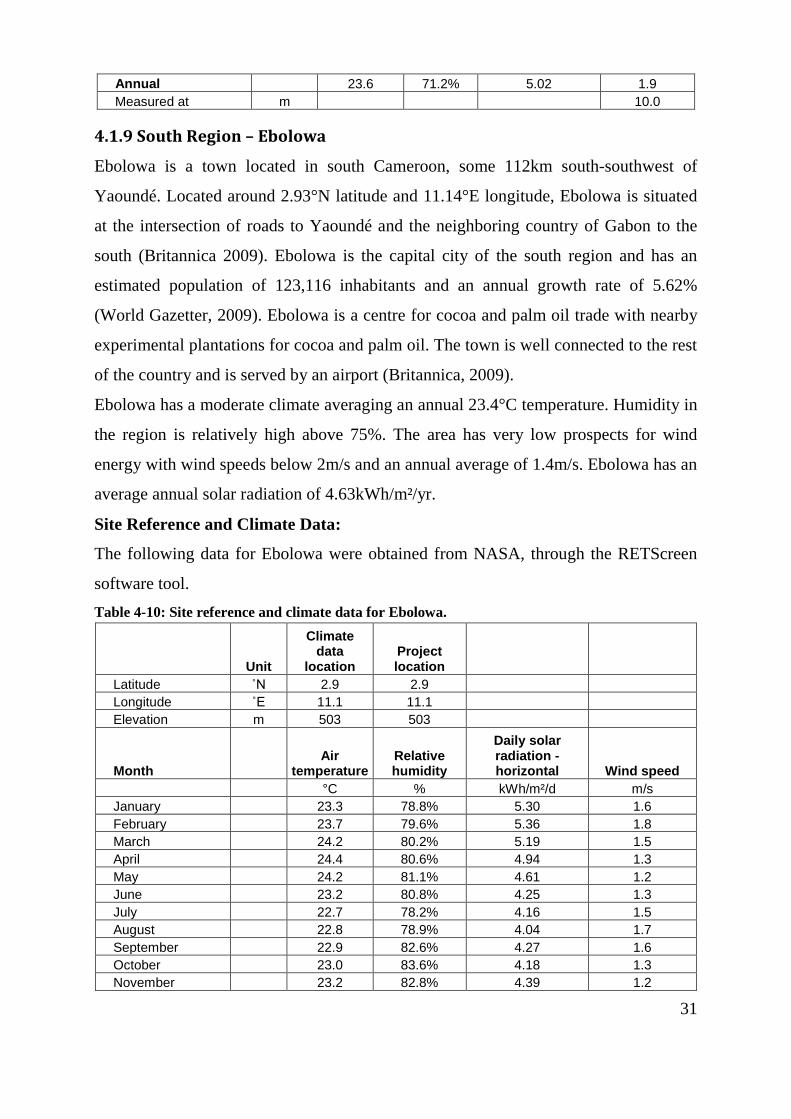
31
Annual 23.6 71.2% 5.02 1.9 Measured at m 10.0
4.1.9 South Region – Ebolowa
Ebolowa is a town located in south Cameroon, some 112km south-southwest of
Yaoundé. Located around 2.93°N latitude and 11.14°E longitude, Ebolowa is situated
at the intersection of roads to Yaoundé and the neighboring country of Gabon to the
south (Britannica 2009). Ebolowa is the capital city of the south region and has an
estimated population of 123,116 inhabitants and an annual growth rate of 5.62%
(World Gazetter, 2009). Ebolowa is a centre for cocoa and palm oil trade with nearby
experimental plantations for cocoa and palm oil. The town is well connected to the rest
of the country and is served by an airport (Britannica, 2009).
Ebolowa has a moderate climate averaging an annual 23.4°C temperature. Humidity in
the region is relatively high above 75%. The area has very low prospects for wind
energy with wind speeds below 2m/s and an annual average of 1.4m/s. Ebolowa has an
average annual solar radiation of 4.63kWh/m²/yr.
Site Reference and Climate Data:
The following data for Ebolowa were obtained from NASA, through the RETScreen
software tool. Table 4-10: Site reference and climate data for Ebolowa.
Unit
Climate data
location Project location
Latitude ˚N 2.9 2.9 Longitude ˚E 11.1 11.1 Elevation m 503 503
Month Air
temperature Relative humidity
Daily solar radiation - horizontal Wind speed
°C % kWh/m²/d m/s January 23.3 78.8% 5.30 1.6 February 23.7 79.6% 5.36 1.8 March 24.2 80.2% 5.19 1.5 April 24.4 80.6% 4.94 1.3 May 24.2 81.1% 4.61 1.2 June 23.2 80.8% 4.25 1.3 July 22.7 78.2% 4.16 1.5 August 22.8 78.9% 4.04 1.7 September 22.9 82.6% 4.27 1.6 October 23.0 83.6% 4.18 1.3 November 23.2 82.8% 4.39 1.2

32
December 23.2 80.9% 4.97 1.3 Annual 23.4 80.7% 4.63 1.4 Measured at m 10.0
4.1.10 South West Region – Fontem
The South West region is one of two English speaking regions of Cameroon. An
important economic centre, it consist of a petroleum refinery (SONARA), a sea port, a
university, and various plantations for rubber, cocoa and banana. It is also a great
centre for touristic attractions as it carries one of Africa’s largest volcanoes – Mount
Cameroon.
Fontem is one of two locations used in this research which is not the capital city of its
region. The selection was dependent on the availability of meteorological data for the
region/location from NASA through the RETScreen software. The town is located in
Manyu, in the South West region of Cameroon. Its geographical coordinates are
5.47°N latitude and 9.88°E longitude. Fontem has an estimated population of 20,342
inhabitants with a 1.83% annual growth rate (World Gazetter, 2009).
Fontem has an annual average air temperature of 22.9°Cwith very low wind speeds
averaging 1.8m/s. The humidity of the area is relatively high above 60%. Solar
radiation in the area is in the range between 3 and 6kWh/m²/d.
Site Reference and Climate Data:
The following data for Fontem were obtained from NASA, through the RETScreen
software tool. Table 4-11: Site reference and climate data for Fontem.
Unit
Climate data
location Project location
Latitude ˚N 5.5 5.5 Longitude ˚E 9.9 9.9 Elevation m 616 616
Month Air
temperature Relative humidity
Daily solar radiation - horizontal Wind speed
°C % kWh/m²/d m/s January 24.0 59.3% 5.81 2.0 February 24.3 63.9% 5.77 2.1 March 23.7 79.1% 5.35 1.9 April 23.6 83.8% 4.99 1.6 May 23.5 84.5% 4.68 1.6 June 22.5 86.5% 4.32 1.9 July 21.7 86.8% 3.86 1.9
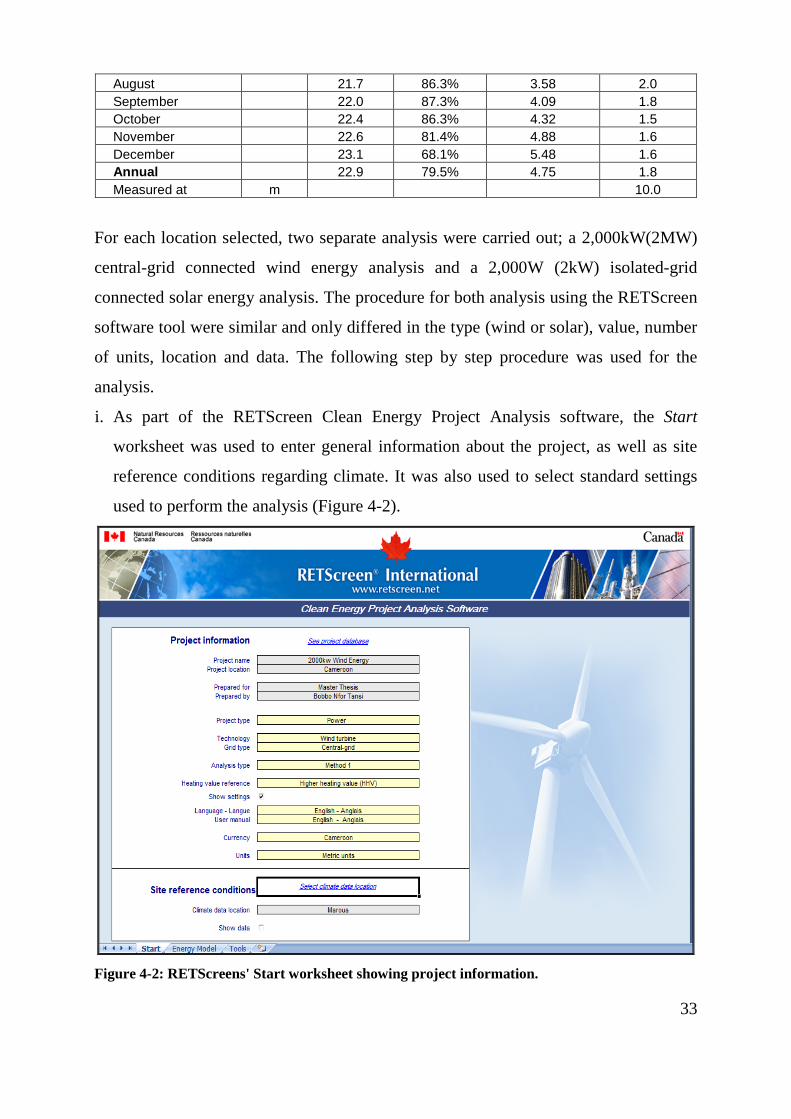
33
August 21.7 86.3% 3.58 2.0 September 22.0 87.3% 4.09 1.8 October 22.4 86.3% 4.32 1.5 November 22.6 81.4% 4.88 1.6 December 23.1 68.1% 5.48 1.6 Annual 22.9 79.5% 4.75 1.8 Measured at m 10.0
For each location selected, two separate analysis were carried out; a 2,000kW(2MW)
central-grid connected wind energy analysis and a 2,000W (2kW) isolated-grid
connected solar energy analysis. The procedure for both analysis using the RETScreen
software tool were similar and only differed in the type (wind or solar), value, number
of units, location and data. The following step by step procedure was used for the
analysis.
i. As part of the RETScreen Clean Energy Project Analysis software, the Start
worksheet was used to enter general information about the project, as well as site
reference conditions regarding climate. It was also used to select standard settings
used to perform the analysis (Figure 4-2).
Figure 4-2: RETScreens' Start worksheet showing project information.

34
ii. After all the general information for the analysis were entered, the energy
model worksheet was used to evaluate various types of energy efficiency
measures projects. This was then used to investigate the viability of energy
efficiency in the locations selected for wind and solar. This could also be used
for improvements in a wide range of residential, commercial, institutional
buildings, and industrial facilities, from single-family homes and apartment
complexes, to office buildings, hospitals, large pulp and paper mills.
The software can also be used to assess projects incorporating a variety of
energy efficiency measures associated with building envelope, ventilation,
lights, electrical equipment, hot water, pumps, fans, motors, process electricity,
process heat, process steam, steam losses, heat recovery, compressed air,
refrigeration, and more. It is useful for both new construction and retrofits.
Whole facilities can be modelled, or sub-systems and rooms can be studied
individually.
In this case, the energy model worksheet was used to evaluate the potential
output for a single 2MW wind turbine and 10 units of 200W solar modules
solar energy output (Figure 4-3).
Figure 4-3: RETScreens Energy Model Worksheet.

35
iii. Other steps involved in the analysis depend on which method selected. For this
analysis method 2 was selected, to give a more detailed analysis, performed
based on annual climate data and wind turbine(s) equipment data. With method
2 selected, the analysis consisted of three worksheets: the start sheet, the energy
model worksheet and a final (optional) tools worksheet. The tools worksheet
generally helps the user calculate a number of different values such as the
amount of methane gas available from a landfill site (Figure 4-4).
Figure 4-4: RETScreen's Tools Worksheet iv. Other worksheet/steps involved in the analysis included among others emission
analysis, financial, cost and risk analysis. These were illustrated in their
respective sections.

36
4.2. Central-grid Connected 2,000kW Wind Energy
Wind Energy Background
The kinetic energy in the wind is a promising source of renewable energy with
significant potential in many parts of the world. The energy that can be captured by
wind turbines is highly dependent on the local average wind speed. Regions that
normally present the most attractive potential are located near coasts, inland areas with
open terrain or on the edge of bodies of water. Some mountainous areas also have
good potential. In spite of these geographical limitations for wind energy project
siting, there is ample terrain in most areas of the world to provide a significant portion
of the local electricity needs with wind energy projects (Rangi et al., 1992).
An assessment was made to determine the feasibility of installing and generating
electrical energy from the wind resource in each of these locations from a single wind
turbine, connected to the central-grid. Data obtained from NASA indicated an average
annual wind speed value of between 1.4m/s and 3.8m/s at a height of 10m. Across the
nation, higher values were observed towards the northern part of the country (Figure
4-6). Maroua had the highest value of 3.8m/s while Ebolowa to the south, had the
lowest wind speed value of 1.4m/s (Figure 4-5).
Figure 4-5: Graph of Average Annual wind speeds for various locations used.
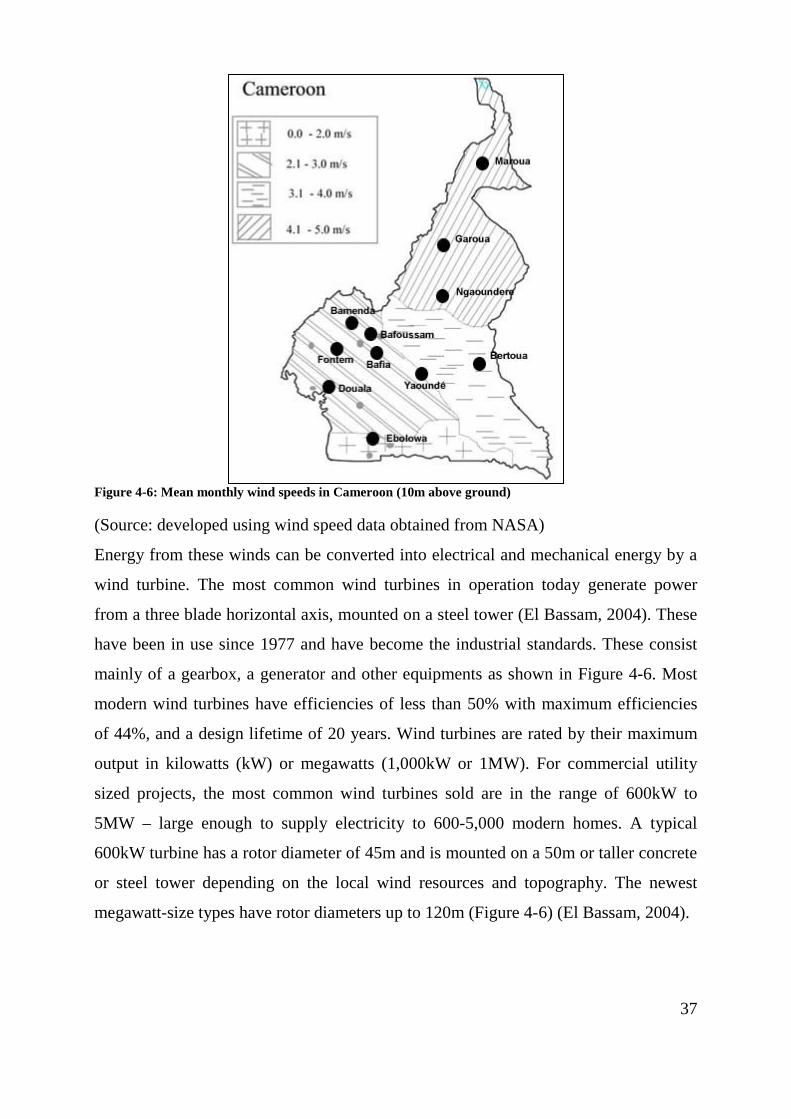
37
Figure 4-6: Mean monthly wind speeds in Cameroon (10m above ground)
(Source: developed using wind speed data obtained from NASA)
Energy from these winds can be converted into electrical and mechanical energy by a
wind turbine. The most common wind turbines in operation today generate power
from a three blade horizontal axis, mounted on a steel tower (El Bassam, 2004). These
have been in use since 1977 and have become the industrial standards. These consist
mainly of a gearbox, a generator and other equipments as shown in Figure 4-6. Most
modern wind turbines have efficiencies of less than 50% with maximum efficiencies
of 44%, and a design lifetime of 20 years. Wind turbines are rated by their maximum
output in kilowatts (kW) or megawatts (1,000kW or 1MW). For commercial utility
sized projects, the most common wind turbines sold are in the range of 600kW to
5MW – large enough to supply electricity to 600-5,000 modern homes. A typical
600kW turbine has a rotor diameter of 45m and is mounted on a 50m or taller concrete
or steel tower depending on the local wind resources and topography. The newest
megawatt-size types have rotor diameters up to 120m (Figure 4-6) (El Bassam, 2004).
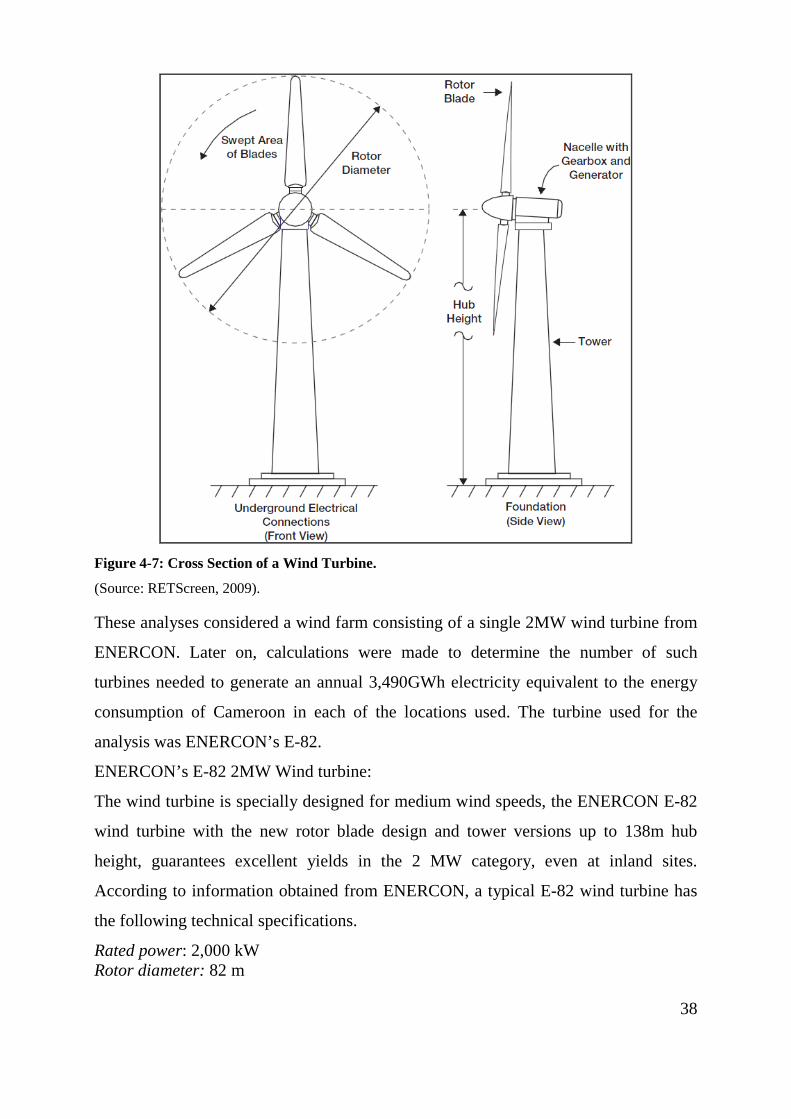
38
Figure 4-7: Cross Section of a Wind Turbine.
(Source: RETScreen, 2009).
These analyses considered a wind farm consisting of a single 2MW wind turbine from
ENERCON. Later on, calculations were made to determine the number of such
turbines needed to generate an annual 3,490GWh electricity equivalent to the energy
consumption of Cameroon in each of the locations used. The turbine used for the
analysis was ENERCON’s E-82.
ENERCON’s E-82 2MW Wind turbine:
The wind turbine is specially designed for medium wind speeds, the ENERCON E-82
wind turbine with the new rotor blade design and tower versions up to 138m hub
height, guarantees excellent yields in the 2 MW category, even at inland sites.
According to information obtained from ENERCON, a typical E-82 wind turbine has
the following technical specifications.
Rated power: 2,000 kW Rotor diameter: 82 m
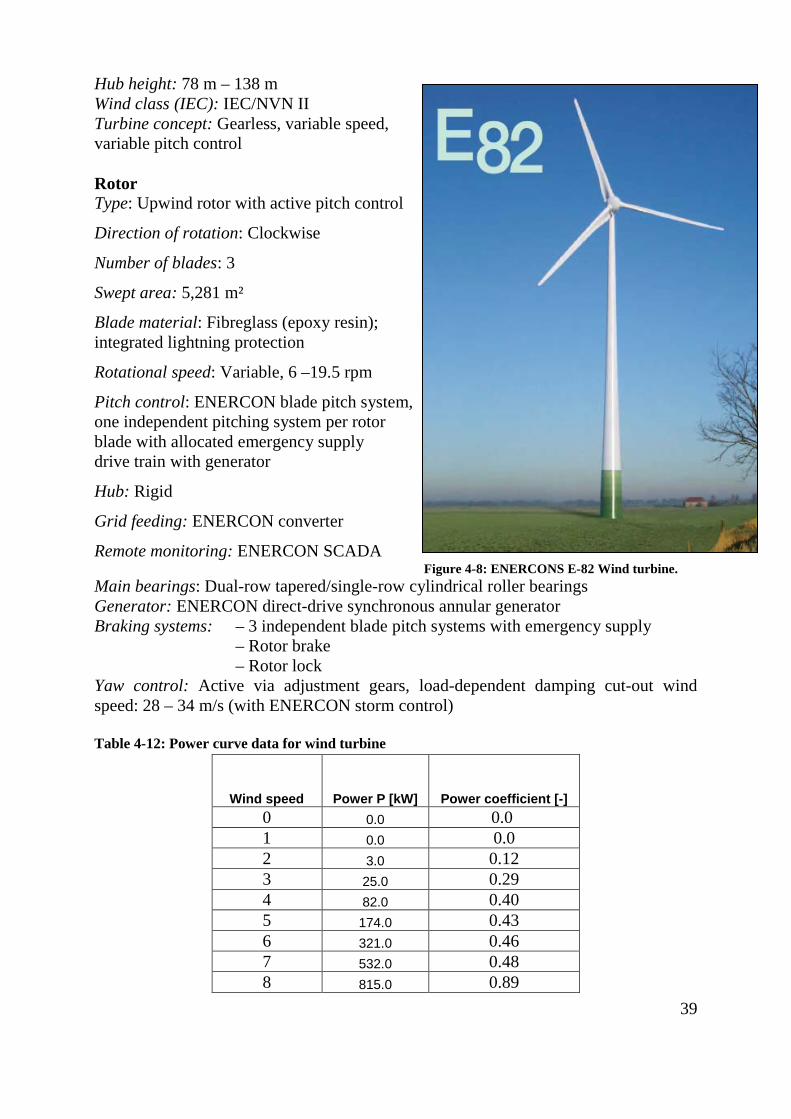
39
Hub height: 78 m – 138 m Wind class (IEC): IEC/NVN II Turbine concept: Gearless, variable speed, variable pitch control Rotor Type: Upwind rotor with active pitch control
Direction of rotation: Clockwise
Number of blades: 3
Swept area: 5,281 m²
Blade material: Fibreglass (epoxy resin); integrated lightning protection
Rotational speed: Variable, 6 –19.5 rpm
Pitch control: ENERCON blade pitch system, one independent pitching system per rotor blade with allocated emergency supply drive train with generator
Hub: Rigid
Grid feeding: ENERCON converter
Remote monitoring: ENERCON SCADA Figure 4-8: ENERCONS E-82 Wind turbine.
Main bearings: Dual-row tapered/single-row cylindrical roller bearings Generator: ENERCON direct-drive synchronous annular generator Braking systems: – 3 independent blade pitch systems with emergency supply
– Rotor brake – Rotor lock
Yaw control: Active via adjustment gears, load-dependent damping cut-out wind speed: 28 – 34 m/s (with ENERCON storm control) Table 4-12: Power curve data for wind turbine
Wind speed Power P [kW] Power coefficient [-] 0 0.0 0.0 1 0.0 0.0 2 3.0 0.12 3 25.0 0.29 4 82.0 0.40 5 174.0 0.43 6 321.0 0.46 7 532.0 0.48 8 815.0 0.89
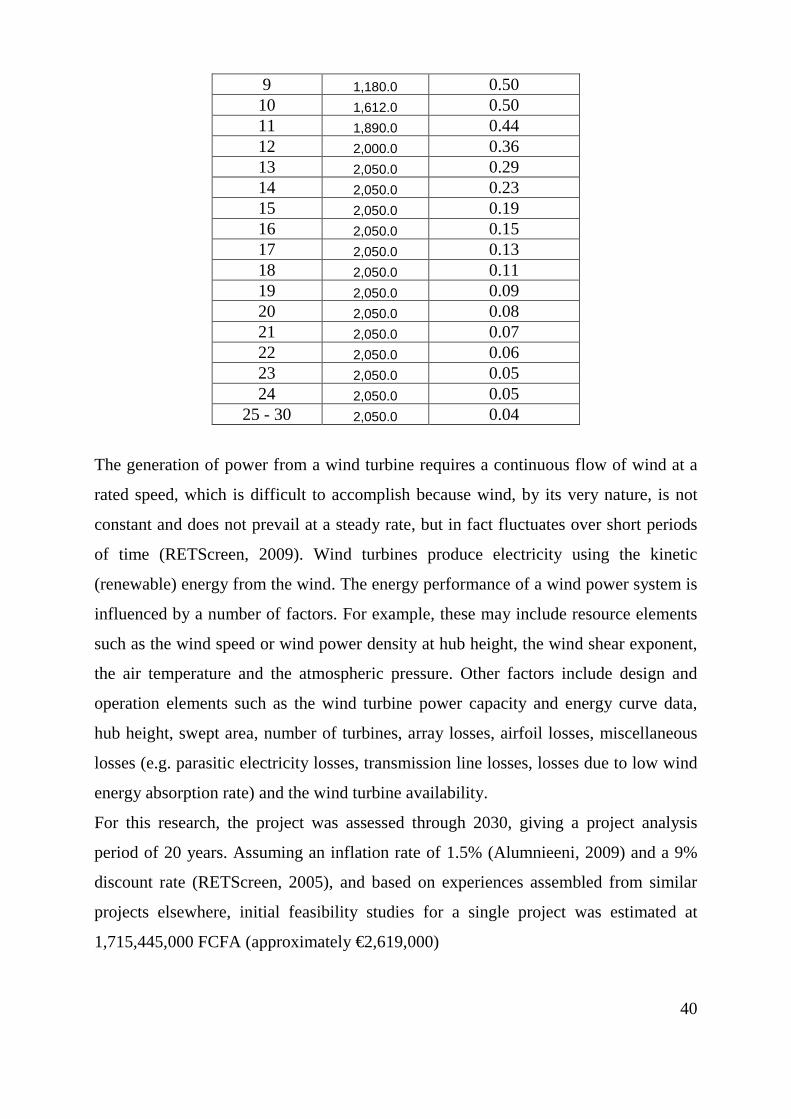
40
9 1,180.0 0.50 10 1,612.0 0.50 11 1,890.0 0.44 12 2,000.0 0.36 13 2,050.0 0.29 14 2,050.0 0.23 15 2,050.0 0.19 16 2,050.0 0.15 17 2,050.0 0.13 18 2,050.0 0.11 19 2,050.0 0.09 20 2,050.0 0.08 21 2,050.0 0.07 22 2,050.0 0.06 23 2,050.0 0.05 24 2,050.0 0.05
25 - 30 2,050.0 0.04
The generation of power from a wind turbine requires a continuous flow of wind at a
rated speed, which is difficult to accomplish because wind, by its very nature, is not
constant and does not prevail at a steady rate, but in fact fluctuates over short periods
of time (RETScreen, 2009). Wind turbines produce electricity using the kinetic
(renewable) energy from the wind. The energy performance of a wind power system is
influenced by a number of factors. For example, these may include resource elements
such as the wind speed or wind power density at hub height, the wind shear exponent,
the air temperature and the atmospheric pressure. Other factors include design and
operation elements such as the wind turbine power capacity and energy curve data,
hub height, swept area, number of turbines, array losses, airfoil losses, miscellaneous
losses (e.g. parasitic electricity losses, transmission line losses, losses due to low wind
energy absorption rate) and the wind turbine availability.
For this research, the project was assessed through 2030, giving a project analysis
period of 20 years. Assuming an inflation rate of 1.5% (Alumnieeni, 2009) and a 9%
discount rate (RETScreen, 2005), and based on experiences assembled from similar
projects elsewhere, initial feasibility studies for a single project was estimated at
1,715,445,000 FCFA (approximately €2,619,000)

41
The following summarizes the characteristics used in this research work to assess the
wind energy resource in each of the 10 locations used.
Base case: Central-grid
Capacity: 2,000kW (2MW)
Capacity factor: Calculated by RETScreen per site
Total (initial incremental) cost: FCFA 1,715,445,000 (approx. €2,619,000)
Cost for exporting electricity FCFA 40/kWh (€0.06/kWh)4
Array losses: 0.0%
Airfoil losses: 1.0%
Miscellaneous losses: 2.0%
Availability: 98%
Capacity factor: 9.9% (calculated)
With these values, the analyses were carried out as illustrated in section 4.1. The
analyses indicated that the northern regions of Cameroon were the sole areas where
wind energy proved to be resourceful. From the northern regions moving down
towards the south, the wind speeds decreases further south and hence the capacity for
wind energy approaches zero (Figure 4-6). The following results were obtained for all
the regions assessed.
Results and Discussions.
Table 4-13: Wind analysis results. Region Location Annual electricity
exported to grid [MWh]
No of plants to generate 3,490GWh
Extreme North Maroua 1,732 2,016 North Garoua 1,368 2,552 Adamawa Ngaoundéré 876 3,985 North West Bamenda 0 0 West Bafia* 0 0 Centre Yaoundé 0 0 Littoral Douala 0 0
4 FCFA 40/kWh is not the actual electricity cost in Cameroon. This was used as a baseline case scenario to obtain the minimum possible limits. Actual electricity costs are given in chapters 5 and 7 according to the Cameroonian laws governing the sale of electricity.
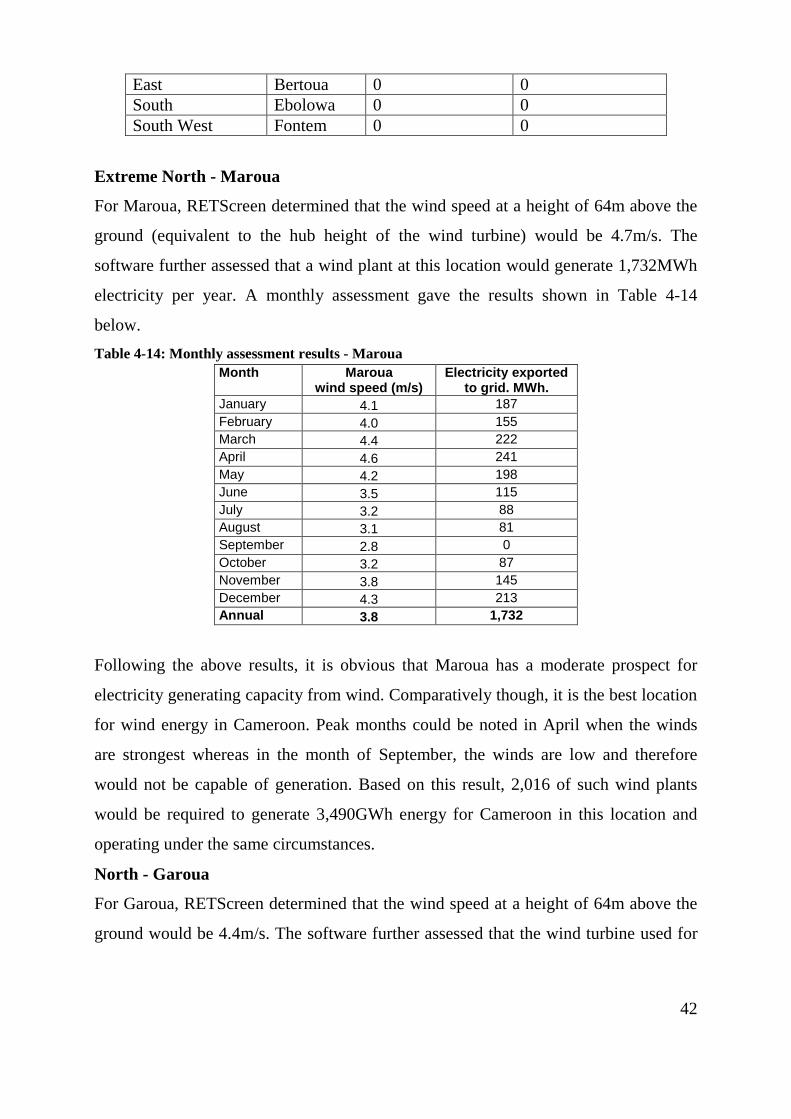
42
East Bertoua 0 0 South Ebolowa 0 0 South West Fontem 0 0
Extreme North - Maroua
For Maroua, RETScreen determined that the wind speed at a height of 64m above the
ground (equivalent to the hub height of the wind turbine) would be 4.7m/s. The
software further assessed that a wind plant at this location would generate 1,732MWh
electricity per year. A monthly assessment gave the results shown in Table 4-14
below. Table 4-14: Monthly assessment results - Maroua
Month Maroua wind speed (m/s)
Electricity exported to grid. MWh.
January 4.1 187 February 4.0 155 March 4.4 222 April 4.6 241 May 4.2 198 June 3.5 115 July 3.2 88 August 3.1 81 September 2.8 0 October 3.2 87 November 3.8 145 December 4.3 213 Annual 3.8 1,732
Following the above results, it is obvious that Maroua has a moderate prospect for
electricity generating capacity from wind. Comparatively though, it is the best location
for wind energy in Cameroon. Peak months could be noted in April when the winds
are strongest whereas in the month of September, the winds are low and therefore
would not be capable of generation. Based on this result, 2,016 of such wind plants
would be required to generate 3,490GWh energy for Cameroon in this location and
operating under the same circumstances.
North - Garoua
For Garoua, RETScreen determined that the wind speed at a height of 64m above the
ground would be 4.4m/s. The software further assessed that the wind turbine used for
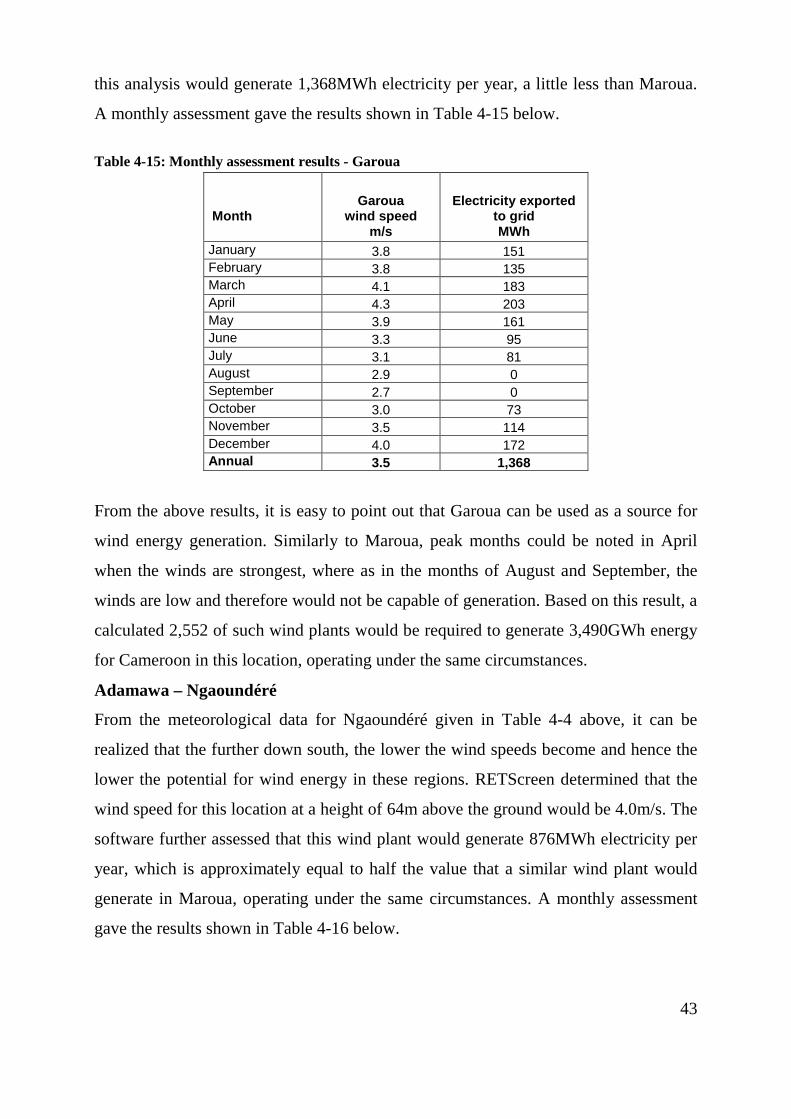
43
this analysis would generate 1,368MWh electricity per year, a little less than Maroua.
A monthly assessment gave the results shown in Table 4-15 below. Table 4-15: Monthly assessment results - Garoua
Month
Garoua wind speed
m/s
Electricity exported to grid MWh
January 3.8 151 February 3.8 135 March 4.1 183 April 4.3 203 May 3.9 161 June 3.3 95 July 3.1 81 August 2.9 0 September 2.7 0 October 3.0 73 November 3.5 114 December 4.0 172 Annual 3.5 1,368
From the above results, it is easy to point out that Garoua can be used as a source for
wind energy generation. Similarly to Maroua, peak months could be noted in April
when the winds are strongest, where as in the months of August and September, the
winds are low and therefore would not be capable of generation. Based on this result, a
calculated 2,552 of such wind plants would be required to generate 3,490GWh energy
for Cameroon in this location, operating under the same circumstances.
Adamawa – Ngaoundéré
From the meteorological data for Ngaoundéré given in Table 4-4 above, it can be
realized that the further down south, the lower the wind speeds become and hence the
lower the potential for wind energy in these regions. RETScreen determined that the
wind speed for this location at a height of 64m above the ground would be 4.0m/s. The
software further assessed that this wind plant would generate 876MWh electricity per
year, which is approximately equal to half the value that a similar wind plant would
generate in Maroua, operating under the same circumstances. A monthly assessment
gave the results shown in Table 4-16 below.
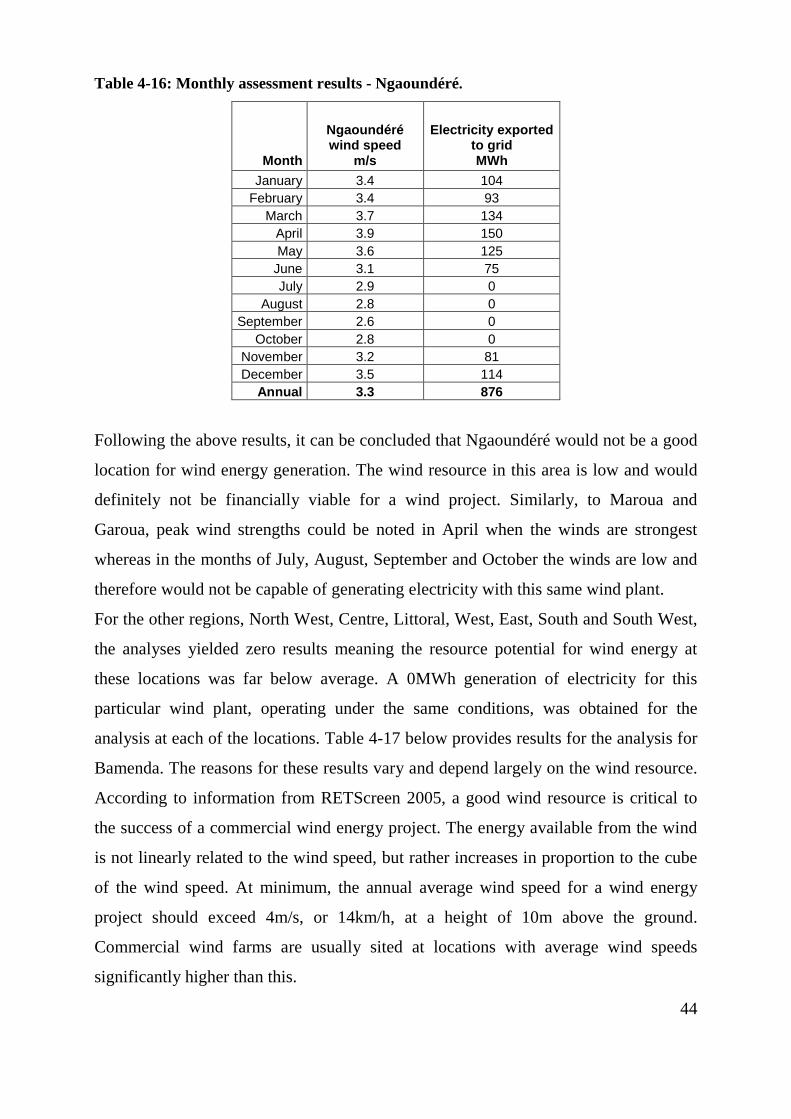
44
Table 4-16: Monthly assessment results - Ngaoundéré.
Month
Ngaoundéré wind speed
m/s
Electricity exported to grid MWh
January 3.4 104 February 3.4 93
March 3.7 134 April 3.9 150 May 3.6 125
June 3.1 75 July 2.9 0
August 2.8 0 September 2.6 0
October 2.8 0 November 3.2 81 December 3.5 114
Annual 3.3 876
Following the above results, it can be concluded that Ngaoundéré would not be a good
location for wind energy generation. The wind resource in this area is low and would
definitely not be financially viable for a wind project. Similarly, to Maroua and
Garoua, peak wind strengths could be noted in April when the winds are strongest
whereas in the months of July, August, September and October the winds are low and
therefore would not be capable of generating electricity with this same wind plant.
For the other regions, North West, Centre, Littoral, West, East, South and South West,
the analyses yielded zero results meaning the resource potential for wind energy at
these locations was far below average. A 0MWh generation of electricity for this
particular wind plant, operating under the same conditions, was obtained for the
analysis at each of the locations. Table 4-17 below provides results for the analysis for
Bamenda. The reasons for these results vary and depend largely on the wind resource.
According to information from RETScreen 2005, a good wind resource is critical to
the success of a commercial wind energy project. The energy available from the wind
is not linearly related to the wind speed, but rather increases in proportion to the cube
of the wind speed. At minimum, the annual average wind speed for a wind energy
project should exceed 4m/s, or 14km/h, at a height of 10m above the ground.
Commercial wind farms are usually sited at locations with average wind speeds
significantly higher than this.
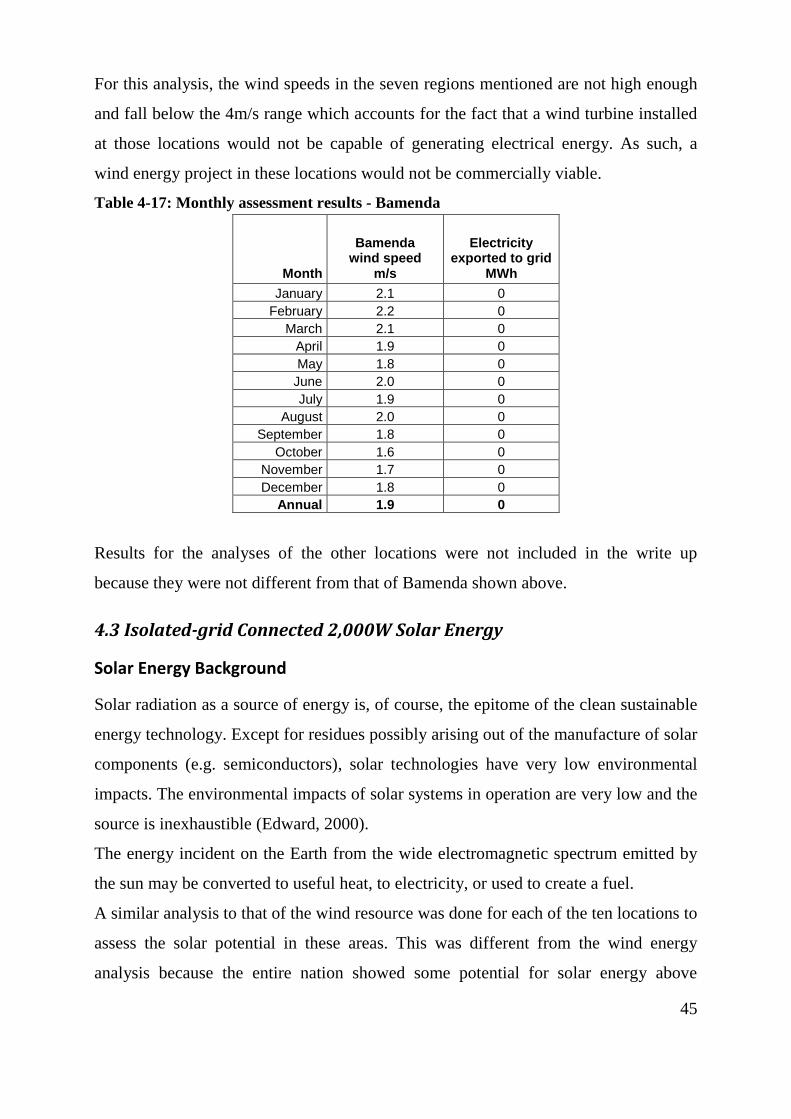
45
For this analysis, the wind speeds in the seven regions mentioned are not high enough
and fall below the 4m/s range which accounts for the fact that a wind turbine installed
at those locations would not be capable of generating electrical energy. As such, a
wind energy project in these locations would not be commercially viable. Table 4-17: Monthly assessment results - Bamenda
Month
Bamenda wind speed
m/s
Electricity exported to grid
MWh January 2.1 0
February 2.2 0 March 2.1 0
April 1.9 0 May 1.8 0
June 2.0 0 July 1.9 0
August 2.0 0 September 1.8 0
October 1.6 0 November 1.7 0 December 1.8 0
Annual 1.9 0
Results for the analyses of the other locations were not included in the write up
because they were not different from that of Bamenda shown above.
4.3 Isolated-grid Connected 2,000W Solar Energy
Solar Energy Background
Solar radiation as a source of energy is, of course, the epitome of the clean sustainable
energy technology. Except for residues possibly arising out of the manufacture of solar
components (e.g. semiconductors), solar technologies have very low environmental
impacts. The environmental impacts of solar systems in operation are very low and the
source is inexhaustible (Edward, 2000).
The energy incident on the Earth from the wide electromagnetic spectrum emitted by
the sun may be converted to useful heat, to electricity, or used to create a fuel.
A similar analysis to that of the wind resource was done for each of the ten locations to
assess the solar potential in these areas. This was different from the wind energy
analysis because the entire nation showed some potential for solar energy above
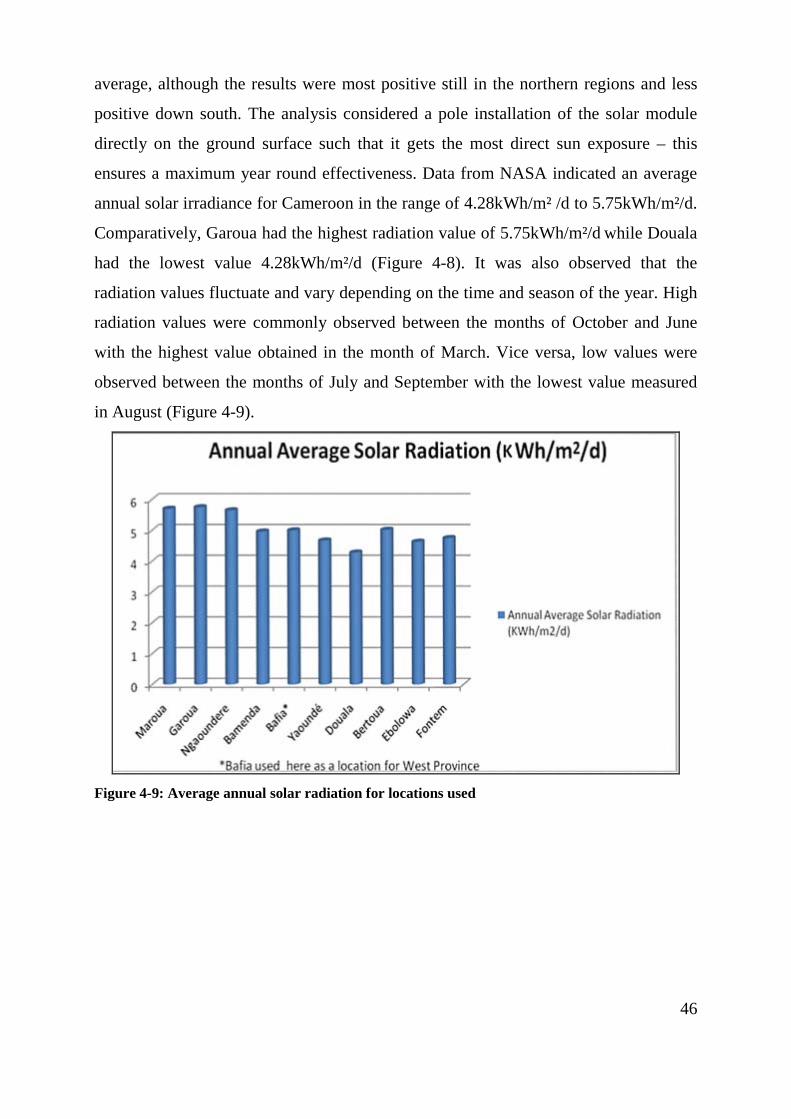
46
average, although the results were most positive still in the northern regions and less
positive down south. The analysis considered a pole installation of the solar module
directly on the ground surface such that it gets the most direct sun exposure – this
ensures a maximum year round effectiveness. Data from NASA indicated an average
annual solar irradiance for Cameroon in the range of 4.28kWh/m² /d to 5.75kWh/m²/d.
Comparatively, Garoua had the highest radiation value of 5.75kWh/m²/d while Douala
had the lowest value 4.28kWh/m²/d (Figure 4-8). It was also observed that the
radiation values fluctuate and vary depending on the time and season of the year. High
radiation values were commonly observed between the months of October and June
with the highest value obtained in the month of March. Vice versa, low values were
observed between the months of July and September with the lowest value measured
in August (Figure 4-9).
Figure 4-9: Average annual solar radiation for locations used
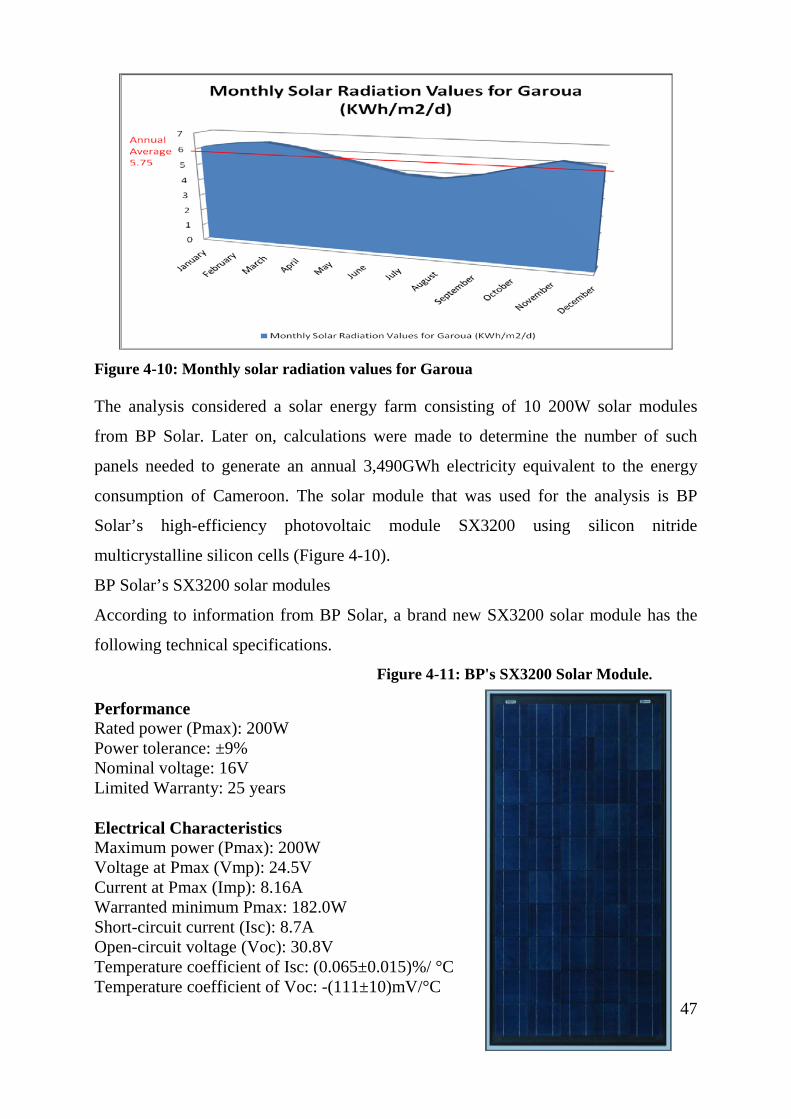
47
Figure 4-10: Monthly solar radiation values for Garoua
The analysis considered a solar energy farm consisting of 10 200W solar modules
from BP Solar. Later on, calculations were made to determine the number of such
panels needed to generate an annual 3,490GWh electricity equivalent to the energy
consumption of Cameroon. The solar module that was used for the analysis is BP
Solar’s high-efficiency photovoltaic module SX3200 using silicon nitride
multicrystalline silicon cells (Figure 4-10).
BP Solar’s SX3200 solar modules
According to information from BP Solar, a brand new SX3200 solar module has the
following technical specifications.
Figure 4-11: BP's SX3200 Solar Module.
Performance Rated power (Pmax): 200W Power tolerance: ±9% Nominal voltage: 16V Limited Warranty: 25 years Electrical Characteristics Maximum power (Pmax): 200W Voltage at Pmax (Vmp): 24.5V Current at Pmax (Imp): 8.16A Warranted minimum Pmax: 182.0W Short-circuit current (Isc): 8.7A Open-circuit voltage (Voc): 30.8V Temperature coefficient of Isc: (0.065±0.015)%/ °C Temperature coefficient of Voc: -(111±10)mV/°C
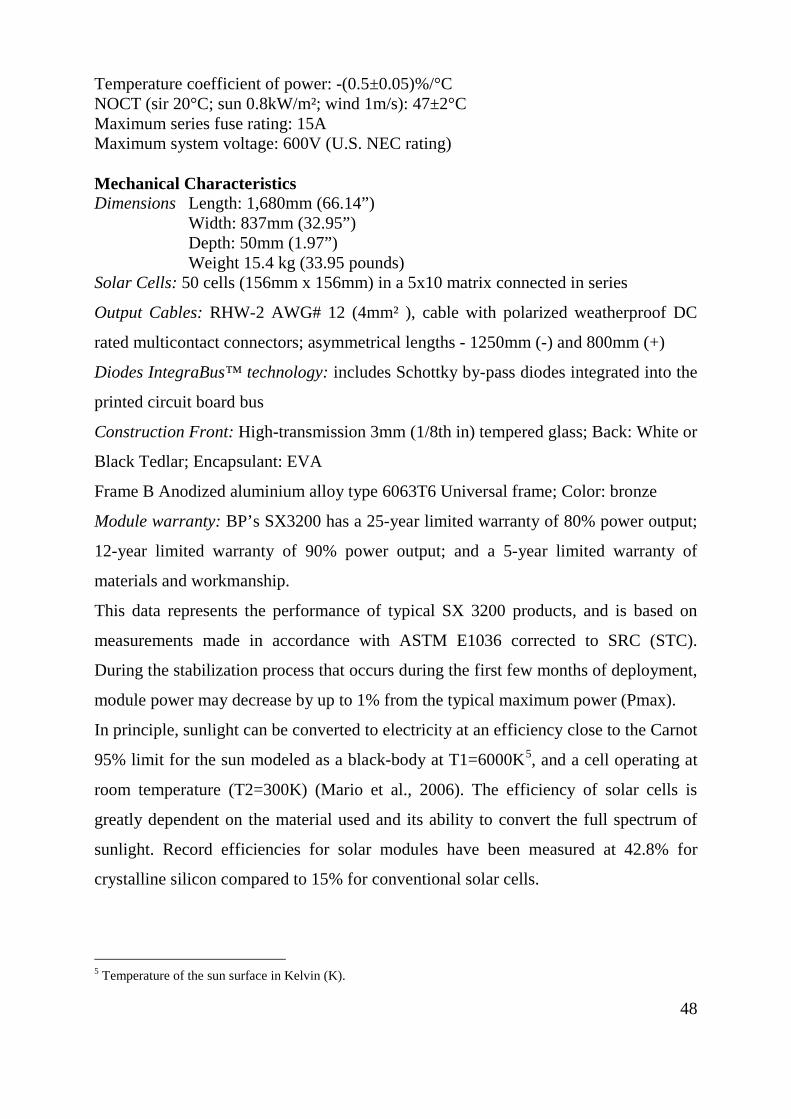
48
Temperature coefficient of power: -(0.5±0.05)%/°C NOCT (sir 20°C; sun 0.8kW/m²; wind 1m/s): 47±2°C Maximum series fuse rating: 15A Maximum system voltage: 600V (U.S. NEC rating) Mechanical Characteristics Dimensions Length: 1,680mm (66.14”)
Width: 837mm (32.95”) Depth: 50mm (1.97”) Weight 15.4 kg (33.95 pounds)
Solar Cells: 50 cells (156mm x 156mm) in a 5x10 matrix connected in series
Output Cables: RHW-2 AWG# 12 (4mm² ), cable with polarized weatherproof DC
rated multicontact connectors; asymmetrical lengths - 1250mm (-) and 800mm (+)
Diodes IntegraBus™ technology: includes Schottky by-pass diodes integrated into the
printed circuit board bus
Construction Front: High-transmission 3mm (1/8th in) tempered glass; Back: White or
Black Tedlar; Encapsulant: EVA
Frame B Anodized aluminium alloy type 6063T6 Universal frame; Color: bronze
Module warranty: BP’s SX3200 has a 25-year limited warranty of 80% power output;
12-year limited warranty of 90% power output; and a 5-year limited warranty of
materials and workmanship.
This data represents the performance of typical SX 3200 products, and is based on
measurements made in accordance with ASTM E1036 corrected to SRC (STC).
During the stabilization process that occurs during the first few months of deployment,
module power may decrease by up to 1% from the typical maximum power (Pmax).
In principle, sunlight can be converted to electricity at an efficiency close to the Carnot
95% limit for the sun modeled as a black-body at T1=6000K5
5 Temperature of the sun surface in Kelvin (K).
, and a cell operating at
room temperature (T2=300K) (Mario et al., 2006). The efficiency of solar cells is
greatly dependent on the material used and its ability to convert the full spectrum of
sunlight. Record efficiencies for solar modules have been measured at 42.8% for
crystalline silicon compared to 15% for conventional solar cells.
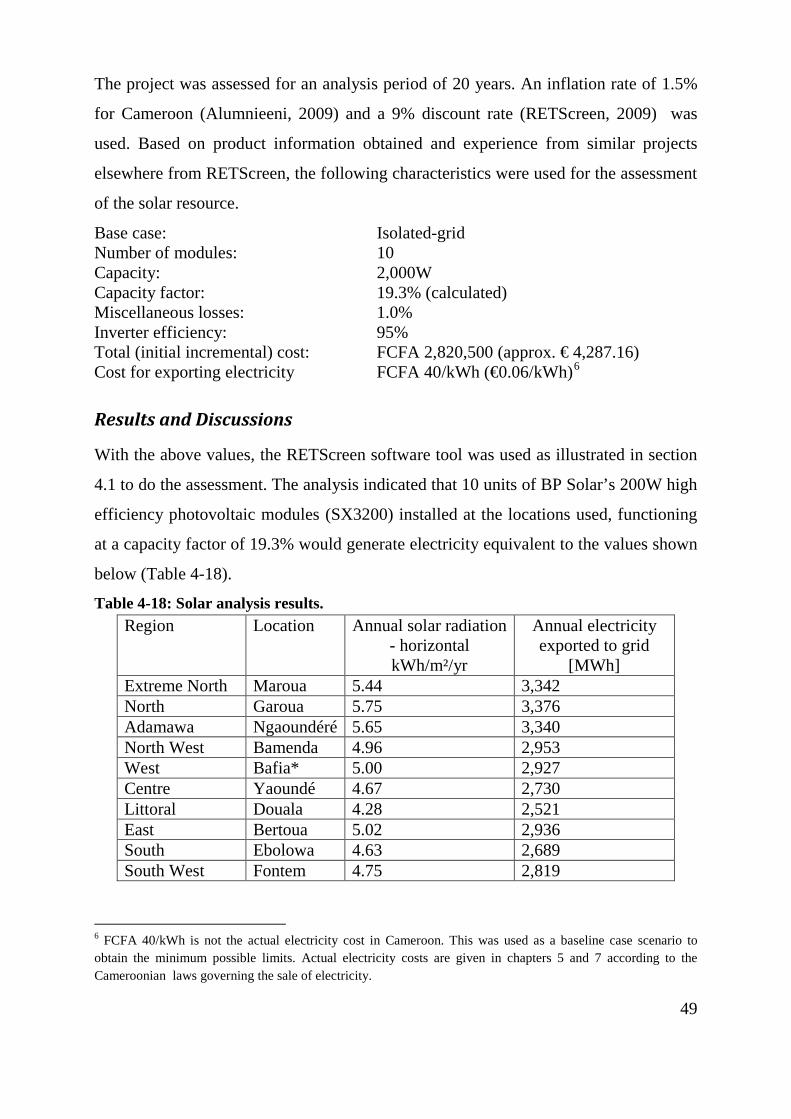
49
The project was assessed for an analysis period of 20 years. An inflation rate of 1.5%
for Cameroon (Alumnieeni, 2009) and a 9% discount rate (RETScreen, 2009) was
used. Based on product information obtained and experience from similar projects
elsewhere from RETScreen, the following characteristics were used for the assessment
of the solar resource.
Base case: Isolated-grid Number of modules: 10 Capacity: 2,000W Capacity factor: 19.3% (calculated) Miscellaneous losses: 1.0% Inverter efficiency: 95% Total (initial incremental) cost: FCFA 2,820,500 (approx. € 4,287.16) Cost for exporting electricity FCFA 40/kWh (€0.06/kWh)6
Results and Discussions
With the above values, the RETScreen software tool was used as illustrated in section
4.1 to do the assessment. The analysis indicated that 10 units of BP Solar’s 200W high
efficiency photovoltaic modules (SX3200) installed at the locations used, functioning
at a capacity factor of 19.3% would generate electricity equivalent to the values shown
below (Table 4-18).
Table 4-18: Solar analysis results. Region Location Annual solar radiation
- horizontal kWh/m²/yr
Annual electricity exported to grid
[MWh] Extreme North Maroua 5.44 3,342 North Garoua 5.75 3,376 Adamawa Ngaoundéré 5.65 3,340 North West Bamenda 4.96 2,953 West Bafia* 5.00 2,927 Centre Yaoundé 4.67 2,730 Littoral Douala 4.28 2,521 East Bertoua 5.02 2,936 South Ebolowa 4.63 2,689 South West Fontem 4.75 2,819
6 FCFA 40/kWh is not the actual electricity cost in Cameroon. This was used as a baseline case scenario to obtain the minimum possible limits. Actual electricity costs are given in chapters 5 and 7 according to the Cameroonian laws governing the sale of electricity.
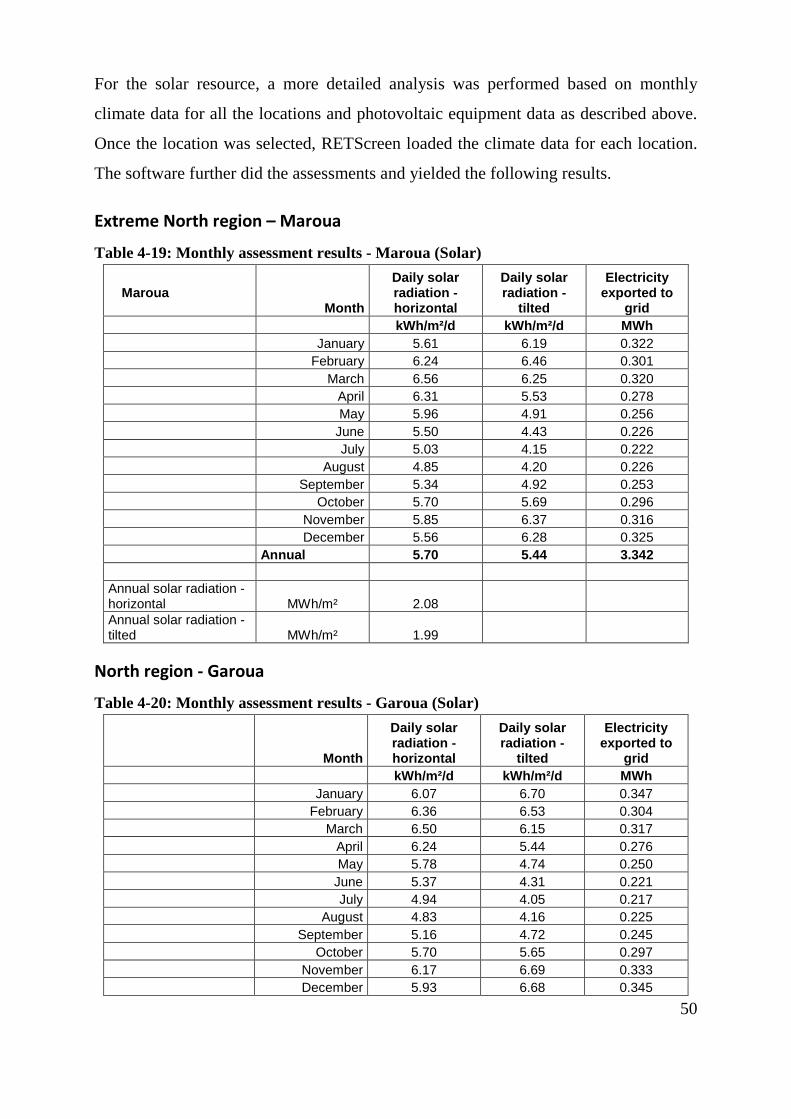
50
For the solar resource, a more detailed analysis was performed based on monthly
climate data for all the locations and photovoltaic equipment data as described above.
Once the location was selected, RETScreen loaded the climate data for each location.
The software further did the assessments and yielded the following results.
Extreme North region – Maroua
Table 4-19: Monthly assessment results - Maroua (Solar)
Maroua Month
Daily solar radiation - horizontal
Daily solar radiation -
tilted
Electricity exported to
grid kWh/m²/d kWh/m²/d MWh January 5.61 6.19 0.322 February 6.24 6.46 0.301 March 6.56 6.25 0.320 April 6.31 5.53 0.278 May 5.96 4.91 0.256 June 5.50 4.43 0.226 July 5.03 4.15 0.222 August 4.85 4.20 0.226 September 5.34 4.92 0.253 October 5.70 5.69 0.296 November 5.85 6.37 0.316 December 5.56 6.28 0.325 Annual 5.70 5.44 3.342 Annual solar radiation - horizontal MWh/m² 2.08 Annual solar radiation - tilted MWh/m² 1.99
North region - Garoua
Table 4-20: Monthly assessment results - Garoua (Solar)
Month
Daily solar radiation - horizontal
Daily solar radiation -
tilted
Electricity exported to
grid kWh/m²/d kWh/m²/d MWh January 6.07 6.70 0.347 February 6.36 6.53 0.304 March 6.50 6.15 0.317 April 6.24 5.44 0.276 May 5.78 4.74 0.250 June 5.37 4.31 0.221 July 4.94 4.05 0.217 August 4.83 4.16 0.225 September 5.16 4.72 0.245 October 5.70 5.65 0.297 November 6.17 6.69 0.333 December 5.93 6.68 0.345
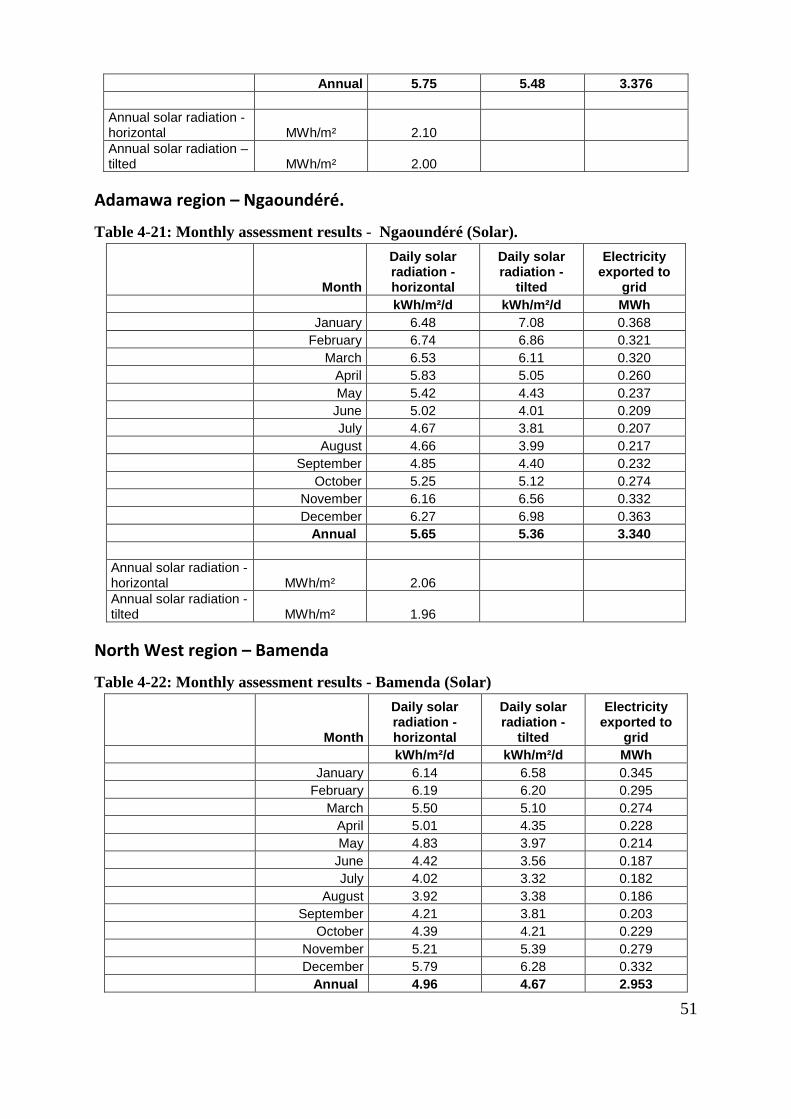
51
Annual 5.75 5.48 3.376 Annual solar radiation - horizontal MWh/m² 2.10 Annual solar radiation – tilted MWh/m² 2.00
Adamawa region – Ngaoundéré.
Table 4-21: Monthly assessment results - Ngaoundéré (Solar).
Month
Daily solar radiation - horizontal
Daily solar radiation -
tilted
Electricity exported to
grid kWh/m²/d kWh/m²/d MWh January 6.48 7.08 0.368 February 6.74 6.86 0.321 March 6.53 6.11 0.320 April 5.83 5.05 0.260 May 5.42 4.43 0.237 June 5.02 4.01 0.209 July 4.67 3.81 0.207 August 4.66 3.99 0.217 September 4.85 4.40 0.232 October 5.25 5.12 0.274 November 6.16 6.56 0.332 December 6.27 6.98 0.363 Annual 5.65 5.36 3.340 Annual solar radiation - horizontal MWh/m² 2.06 Annual solar radiation - tilted MWh/m² 1.96
North West region – Bamenda
Table 4-22: Monthly assessment results - Bamenda (Solar)
Month
Daily solar radiation - horizontal
Daily solar radiation -
tilted
Electricity exported to
grid kWh/m²/d kWh/m²/d MWh January 6.14 6.58 0.345 February 6.19 6.20 0.295 March 5.50 5.10 0.274 April 5.01 4.35 0.228 May 4.83 3.97 0.214 June 4.42 3.56 0.187 July 4.02 3.32 0.182 August 3.92 3.38 0.186 September 4.21 3.81 0.203 October 4.39 4.21 0.229 November 5.21 5.39 0.279 December 5.79 6.28 0.332 Annual 4.96 4.67 2.953
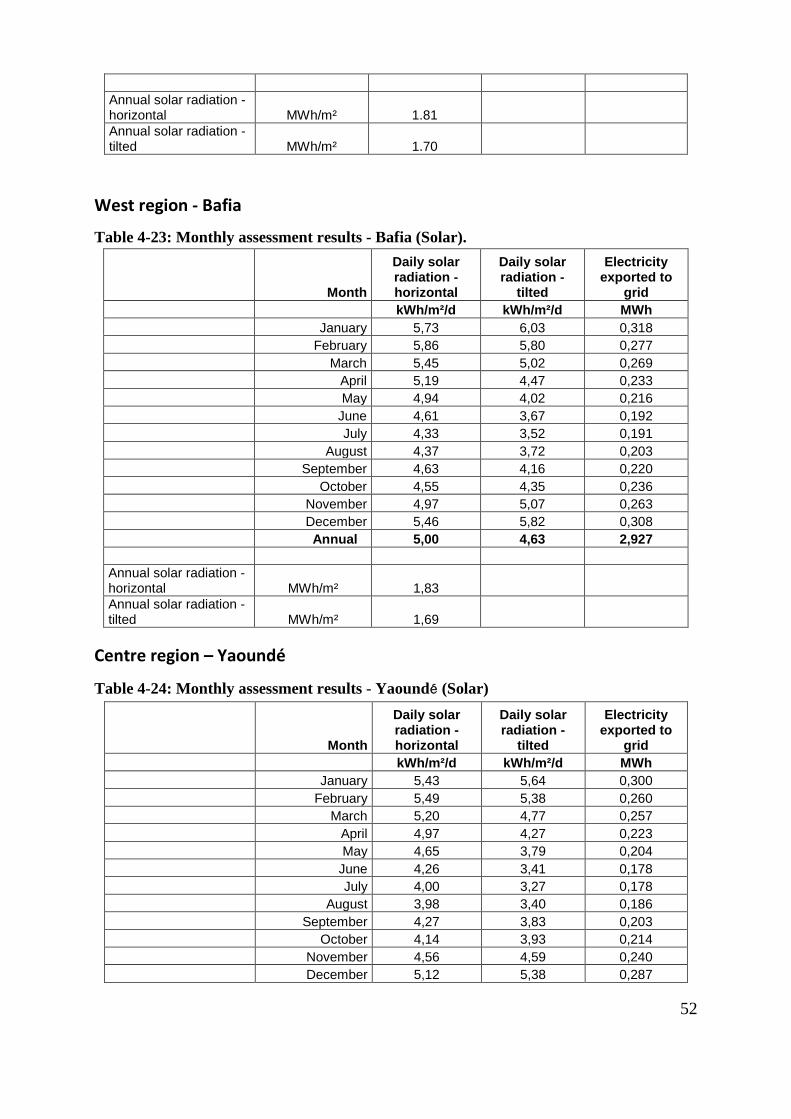
52
Annual solar radiation - horizontal MWh/m² 1.81 Annual solar radiation - tilted MWh/m² 1.70
West region - Bafia
Table 4-23: Monthly assessment results - Bafia (Solar).
Month
Daily solar radiation - horizontal
Daily solar radiation -
tilted
Electricity exported to
grid kWh/m²/d kWh/m²/d MWh January 5,73 6,03 0,318 February 5,86 5,80 0,277 March 5,45 5,02 0,269 April 5,19 4,47 0,233 May 4,94 4,02 0,216 June 4,61 3,67 0,192 July 4,33 3,52 0,191 August 4,37 3,72 0,203 September 4,63 4,16 0,220 October 4,55 4,35 0,236 November 4,97 5,07 0,263 December 5,46 5,82 0,308 Annual 5,00 4,63 2,927 Annual solar radiation - horizontal MWh/m² 1,83 Annual solar radiation - tilted MWh/m² 1,69
Centre region – Yaoundé
Table 4-24: Monthly assessment results - Yaoundé (Solar)
Month
Daily solar radiation - horizontal
Daily solar radiation -
tilted
Electricity exported to
grid kWh/m²/d kWh/m²/d MWh January 5,43 5,64 0,300 February 5,49 5,38 0,260 March 5,20 4,77 0,257 April 4,97 4,27 0,223 May 4,65 3,79 0,204 June 4,26 3,41 0,178 July 4,00 3,27 0,178 August 3,98 3,40 0,186 September 4,27 3,83 0,203 October 4,14 3,93 0,214 November 4,56 4,59 0,240 December 5,12 5,38 0,287

53
Annual 4,67 4,30 2,730 Annual solar radiation - horizontal MWh/m² 1,70 Annual solar radiation - tilted MWh/m² 1,57
Littoral region – Douala
Table 4-25: Monthly assessment results - Douala (Solar).
Month
Daily solar radiation - horizontal
Daily solar radiation -
tilted
Electricity exported to
grid kWh/m²/d kWh/m²/d MWh January 5,41 5,62 0,298 February 5,36 5,25 0,252 March 4,88 4,48 0,241 April 4,55 3,94 0,206 May 4,37 3,59 0,193 June 3,91 3,17 0,166 July 3,41 2,84 0,156 August 3,04 2,65 0,146 September 3,44 3,10 0,165 October 3,70 3,50 0,191 November 4,30 4,31 0,225 December 5,05 5,30 0,282 Annual 4,28 3,97 2,521 Annual solar radiation - horizontal MWh/m² 1,56 Annual solar radiation - tilted MWh/m² 1,45
East region – Bertoua
Table 4-26: Monthly assessment results - Bertoua (Solar).
Month
Daily solar radiation - horizontal
Daily solar radiation -
tilted
Electricity exported to
grid kWh/m²/d kWh/m²/d MWh January 5,86 6,17 0,324 February 6,01 5,95 0,283 March 5,60 5,16 0,276 April 5,29 4,55 0,236 May 4,83 3,94 0,211 June 4,36 3,49 0,183 July 4,20 3,42 0,186 August 4,35 3,70 0,202 September 4,62 4,15 0,219 October 4,56 4,36 0,236 November 5,04 5,15 0,267 December 5,54 5,91 0,312
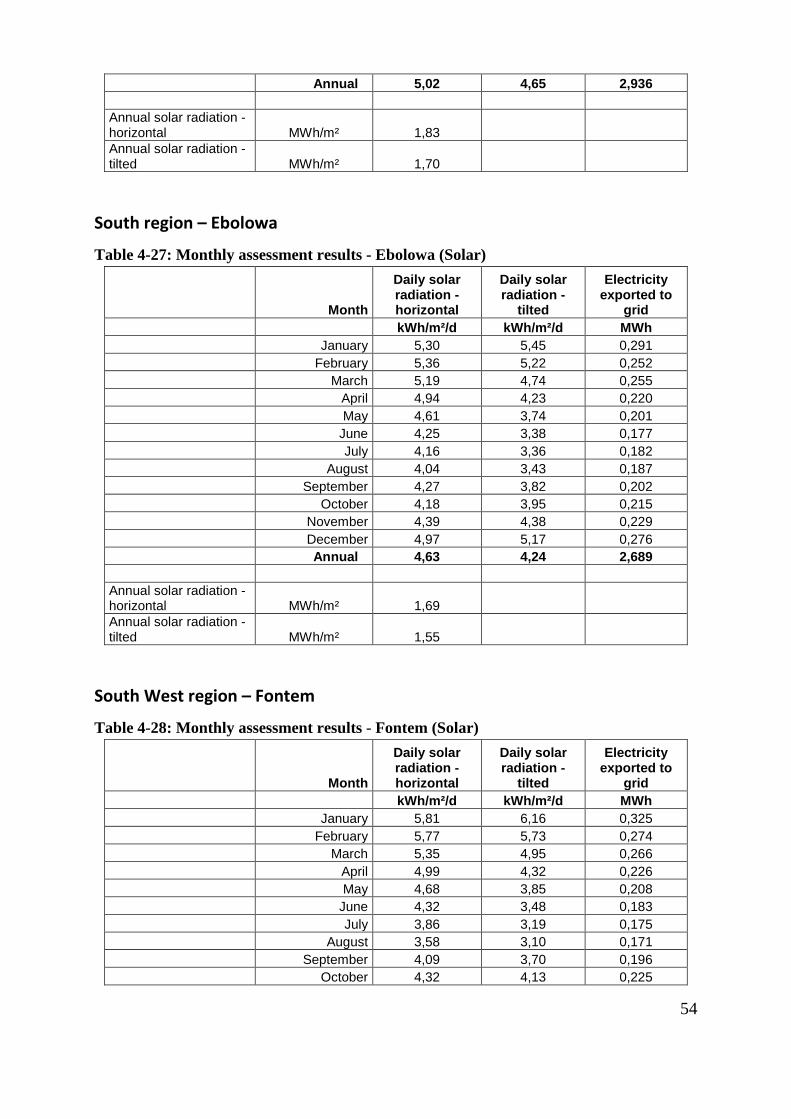
54
Annual 5,02 4,65 2,936 Annual solar radiation - horizontal MWh/m² 1,83 Annual solar radiation - tilted MWh/m² 1,70
South region – Ebolowa
Table 4-27: Monthly assessment results - Ebolowa (Solar)
Month
Daily solar radiation - horizontal
Daily solar radiation -
tilted
Electricity exported to
grid kWh/m²/d kWh/m²/d MWh January 5,30 5,45 0,291 February 5,36 5,22 0,252 March 5,19 4,74 0,255 April 4,94 4,23 0,220 May 4,61 3,74 0,201 June 4,25 3,38 0,177 July 4,16 3,36 0,182 August 4,04 3,43 0,187 September 4,27 3,82 0,202 October 4,18 3,95 0,215 November 4,39 4,38 0,229 December 4,97 5,17 0,276 Annual 4,63 4,24 2,689 Annual solar radiation - horizontal MWh/m² 1,69 Annual solar radiation - tilted MWh/m² 1,55
South West region – Fontem
Table 4-28: Monthly assessment results - Fontem (Solar)
Month
Daily solar radiation - horizontal
Daily solar radiation -
tilted
Electricity exported to
grid kWh/m²/d kWh/m²/d MWh January 5,81 6,16 0,325 February 5,77 5,73 0,274 March 5,35 4,95 0,266 April 4,99 4,32 0,226 May 4,68 3,85 0,208 June 4,32 3,48 0,183 July 3,86 3,19 0,175 August 3,58 3,10 0,171 September 4,09 3,70 0,196 October 4,32 4,13 0,225
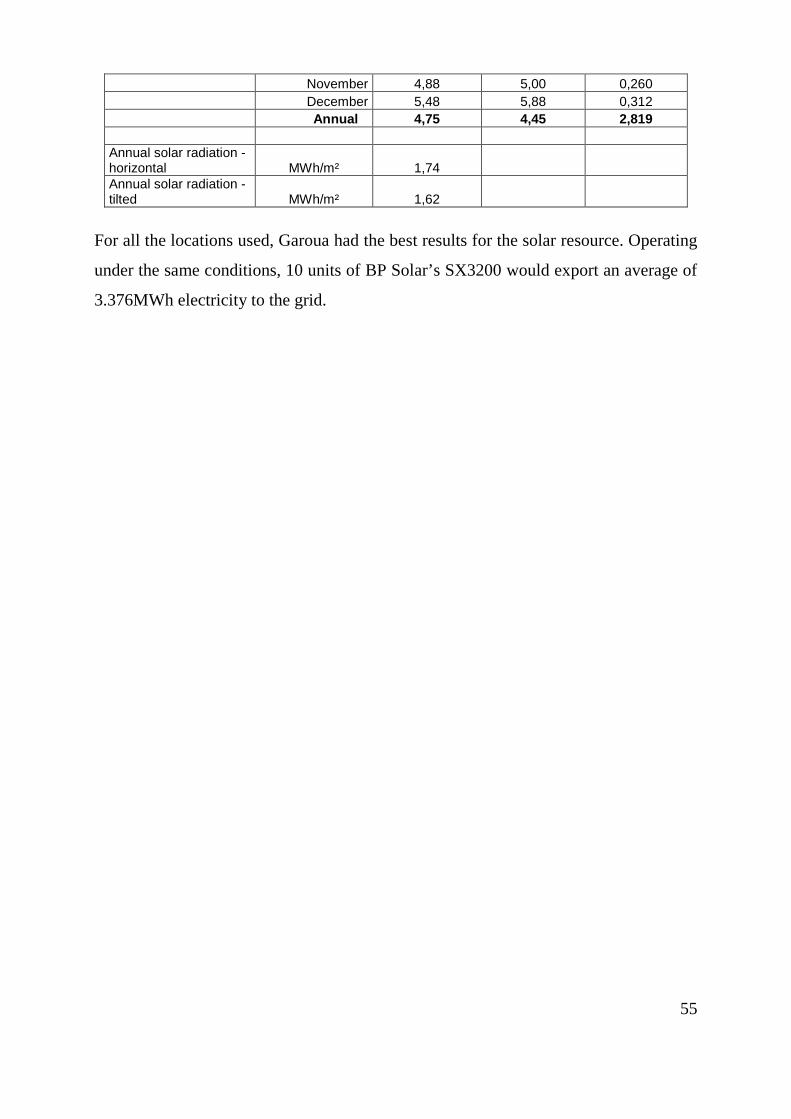
55
November 4,88 5,00 0,260 December 5,48 5,88 0,312 Annual 4,75 4,45 2,819 Annual solar radiation - horizontal MWh/m² 1,74 Annual solar radiation - tilted MWh/m² 1,62
For all the locations used, Garoua had the best results for the solar resource. Operating
under the same conditions, 10 units of BP Solar’s SX3200 would export an average of
3.376MWh electricity to the grid.
56
Chapter 5 : Economic and Sustainability Analysis
5.1 Introduction
“The importance of mineral and energy mineral resources cannot be overestimated.
Most critical among the resources is energy. Energy is the key which unlocks all other
natural resources. Without it the wheels of industry do not turn, no metals are mined
and smelted. No cars, trucks, trains, ships or airplanes could be built and if built, they
could not move without energy. Without energy, houses will remain cold and
unlighted, food will be uncooked. Fields could not be ploughed nor planted with the
ease and on the vast scale they are today by means of relatively little human labor.
Military defense as we know it today would not exist. Without energy resources we
would literally be back in the stone age. And without the use of energy and metals as
we use them today, it is probable that the world’s population would be reduced at
least one-half, some estimates say 90%” (Youngquist, 1997).
Hot newspaper captions such as “Power shortages hit Rio's Cameroon aluminium
plant, ALUCAM output nearly 40% below capacity”, is no good news for any
economy in the world. ALUCAM is one of Cameroon's largest industrial projects with
a turnover of 149 billion FCFA ($307.5 million) in 2008, representing 7% of industrial
output and 5% of export revenues. Growing household electricity demands, has led to
power rationing and frequent blackouts in Cameroon, and as a consequence has forced
companies in Cameroon to produce below capacity. This is not good news for the
company and its shareholders neither is it any good news for the Cameroonian
economy or the government which will also lose money in terms of export taxes.
There would be no forward direction for Cameroon’s economy, if a strong and steady
supply of energy is not guaranteed. Such a source of energy would definitely be
environmentally friendly, sustainable and cost effective.
5.2 Renewable Energy and Economic Development. Many experts have already pointed out the relationship between energy and economy.
In this line, Gerhard et al., 1988 shares the same view with Youngquist as he puts it,
that, the development of a national economy is closely related to its energy
57
consumption. For large scale industrialization of a country, it is imperative that animal
and human muscle power be substituted by machines, which require energy in the
form of electricity or fuel to function. The complete development of renewable energy
technologies will not only provide the economy and households with electrical energy
to function, but it will guarantee sustainability in the energy sector.
Also, the construction and maintenance of wind farms, solar plants and other
renewable energy projects create hundreds of thousands of jobs. Installing new wind
farms, for instance, creates temporary construction employment as laborers, carpenters
and millwrights build the forms and pour the concrete for the foundations of wind
turbines; operating engineers run the cranes that lift the towers; and electricians
perform the wiring. Permanent employment is also created operating and maintaining
these same machines.
According to CALPIRG 2002, Studies performed by the California Energy
Commission (2002), the Union of Concerned Scientists (2006), the University of
California-Berkeley (2004/2008) and the Centre for Energy Efficiency and Renewable
Technologies (2009), all confirm that renewable energy resources generate greater
employment than equivalent investments in fossil fuels. While the job impacts vary
according to specific technologies, a general rule of thumb is four to six times as many
jobs per MW as conventional coal or natural gas power supplies (REPP, 2005). For
example, natural gas power plants generate only about one job per megawatt (MW)
during construction and ongoing operations and maintenance, while equivalent
investments in solar photovoltaic power technologies would generate over seven jobs
per MW.
5.3 Cost Analysis
In order to determine the influence that renewable energies would be able to exert in to
the economy of Cameroon, it is imperative that a good analysis be done as to how
much cost is required to guarantee the complete installation, running and functioning
of the wind and solar devices used in the analysis above. In this section, the costs
presented were obtained from various sources and a comparison was made to obtain
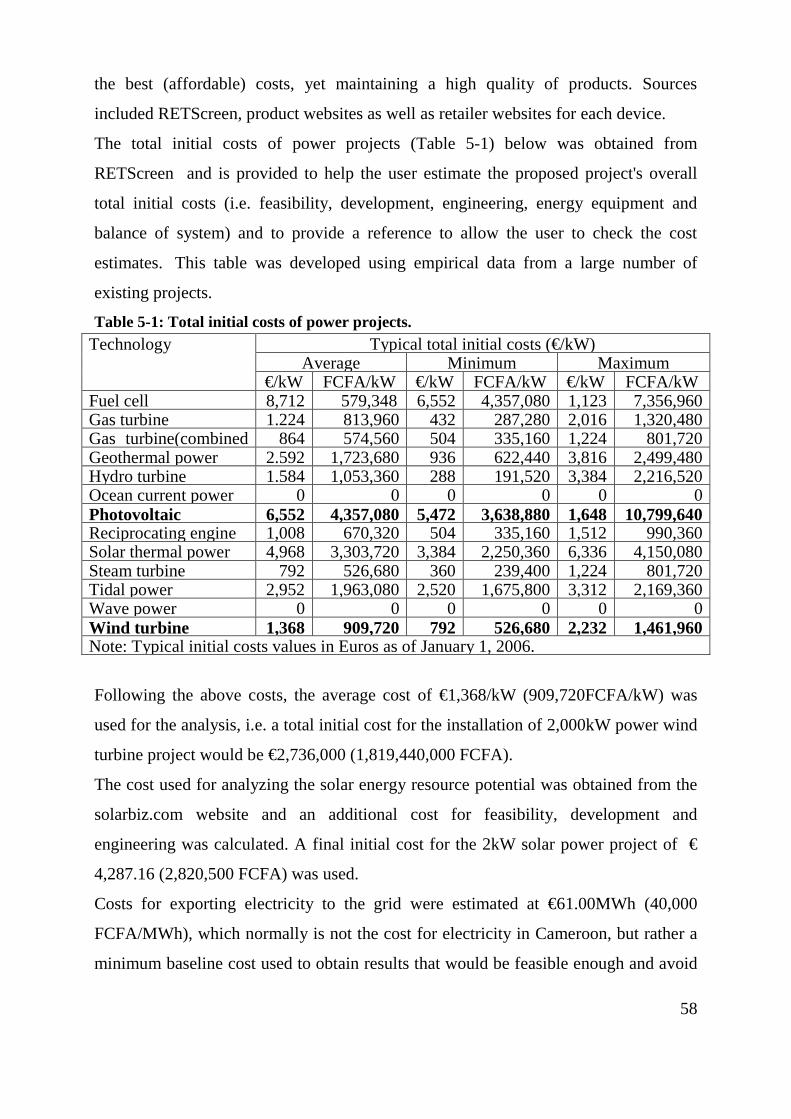
58
the best (affordable) costs, yet maintaining a high quality of products. Sources
included RETScreen, product websites as well as retailer websites for each device.
The total initial costs of power projects (Table 5-1) below was obtained from
RETScreen and is provided to help the user estimate the proposed project's overall
total initial costs (i.e. feasibility, development, engineering, energy equipment and
balance of system) and to provide a reference to allow the user to check the cost
estimates. This table was developed using empirical data from a large number of
existing projects.
Table 5-1: Total initial costs of power projects. Technology Typical total initial costs (€/kW)
Average Minimum Maximum €/kW FCFA/kW €/kW FCFA/kW €/kW FCFA/kW
Fuel cell 8,712 579,348 6,552 4,357,080 1,123
7,356,960 Gas turbine 1.224 813,960 432 287,280 2,016 1,320,480 Gas turbine(combined
864 574,560 504 335,160 1,224 801,720 Geothermal power 2.592 1,723,680 936 622,440 3,816 2,499,480 Hydro turbine 1.584 1,053,360 288 191,520 3,384 2,216,520 Ocean current power 0 0 0 0 0 0 Photovoltaic 6,552 4,357,080 5,472 3,638,880 1,648
10,799,640
Reciprocating engine 1,008 670,320 504 335,160 1,512 990,360 Solar thermal power 4,968 3,303,720 3,384 2,250,360 6,336 4,150,080 Steam turbine 792 526,680 360 239,400 1,224 801,720 Tidal power 2,952 1,963,080 2,520 1,675,800 3,312 2,169,360 Wave power 0 0 0 0 0 0 Wind turbine 1,368 909,720 792 526,680 2,232 1,461,960 Note: Typical initial costs values in Euros as of January 1, 2006.
Following the above costs, the average cost of €1,368/kW (909,720FCFA/kW) was
used for the analysis, i.e. a total initial cost for the installation of 2,000kW power wind
turbine project would be €2,736,000 (1,819,440,000 FCFA).
The cost used for analyzing the solar energy resource potential was obtained from the
solarbiz.com website and an additional cost for feasibility, development and
engineering was calculated. A final initial cost for the 2kW solar power project of €
4,287.16 (2,820,500 FCFA) was used.
Costs for exporting electricity to the grid were estimated at €61.00MWh (40,000
FCFA/MWh), which normally is not the cost for electricity in Cameroon, but rather a
minimum baseline cost used to obtain results that would be feasible enough and avoid
59
exaggerations compared to real life situations. Electricity costs in Cameroon according
to “Decision No. 17/DG/ARSEL of 25 January 2002 to fix prices exclusive of tax of
electricity sold by AES-SONEL” are given in chapter 7.
5.4 Financial Analysis The technical analysis could only determine areas in Cameroon where energy from
wind and solar could be obtained using the designated devices. It was realized that
there were areas where the same wind turbine would generate more electricity such as
Maroua than in others. Similarly, Garoua would in turn generate more electricity with
the solar devices than any other location in Cameroon. In this section, the financial
analysis gives an assessment of the viability, stability and profitability of a project for
each of these locations.
Generally, a financial analysis (accounting analysis, or financial statement analysis) is
performed by professionals who prepare reports using ratios that make use of
information taken from financial statements and other reports. These reports are
usually presented to top management as one of their bases in making business
decisions. Based on these reports, management may:
- Continue or discontinue its main operation or part of its business;
- Make or purchase certain materials in the manufacture of its product;
- Acquire or rent/lease certain machineries and equipment in the production of its
goods;
- Issue stocks or negotiate for a bank loan to increase its working capital;
- Make decisions regarding investing or lending capital;
- Take other decisions that allow management to make an informed selection on
various alternatives in the conduct of its business.
In this research, the analysis was carried out to determine the ability of the potential
projects to earn income and sustain an economic growth for a 20 year project analysis
period. This was done using the RETScreen software which facilitates the project
evaluation process with its financial parameters input items (e.g. discount rate, debt
ratio, etc.), and its calculated financial viability output items (e.g. IRR, simple
payback, NPV, etc.).
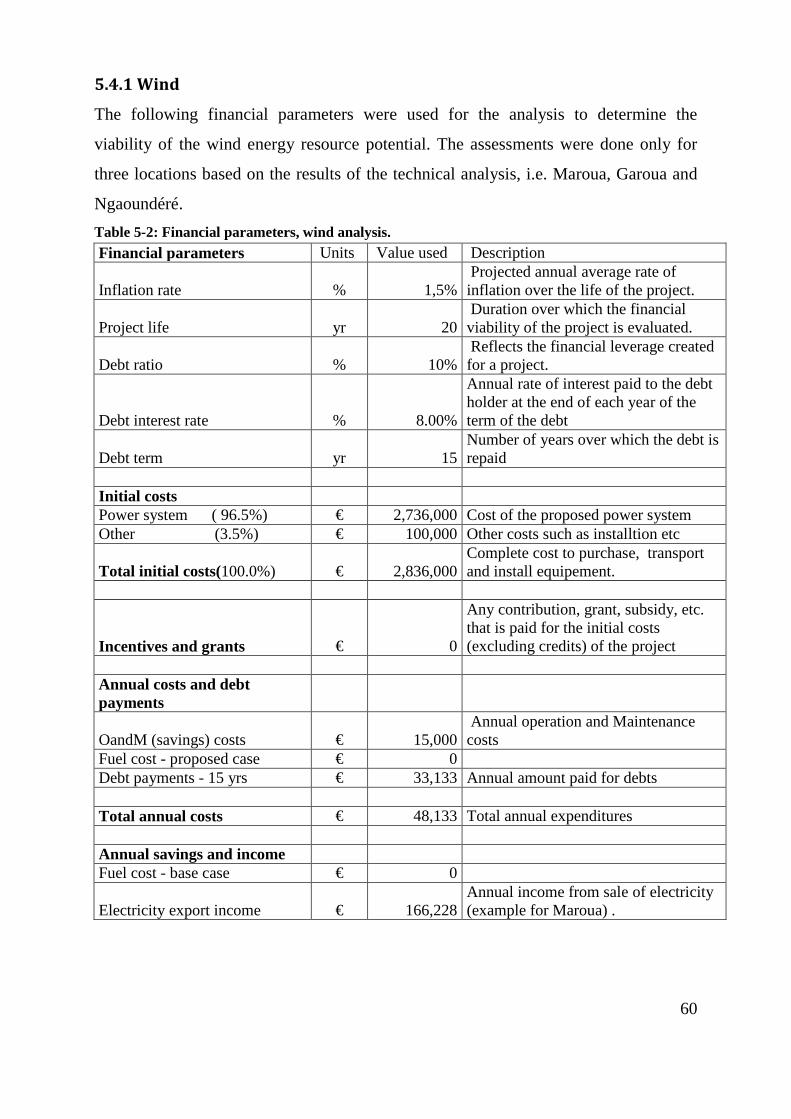
60
5.4.1 Wind
The following financial parameters were used for the analysis to determine the
viability of the wind energy resource potential. The assessments were done only for
three locations based on the results of the technical analysis, i.e. Maroua, Garoua and
Ngaoundéré. Table 5-2: Financial parameters, wind analysis. Financial parameters Units Value used Description
Inflation rate % 1,5% Projected annual average rate of inflation over the life of the project.
Project life yr 20 Duration over which the financial viability of the project is evaluated.
Debt ratio % 10% Reflects the financial leverage created for a project.
Debt interest rate % 8.00%
Annual rate of interest paid to the debt holder at the end of each year of the term of the debt
Debt term yr 15 Number of years over which the debt is repaid
Initial costs Power system ( 96.5%) € 2,736,000 Cost of the proposed power system Other (3.5%) € 100,000 Other costs such as installtion etc
Total initial costs(100.0%) € 2,836,000 Complete cost to purchase, transport and install equipement.
Incentives and grants € 0
Any contribution, grant, subsidy, etc. that is paid for the initial costs (excluding credits) of the project
Annual costs and debt payments
OandM (savings) costs € 15,000 Annual operation and Maintenance costs
Fuel cost - proposed case € 0 Debt payments - 15 yrs € 33,133 Annual amount paid for debts
Total annual costs € 48,133 Total annual expenditures
Annual savings and income Fuel cost - base case € 0
Electricity export income € 166,228 Annual income from sale of electricity (example for Maroua) .
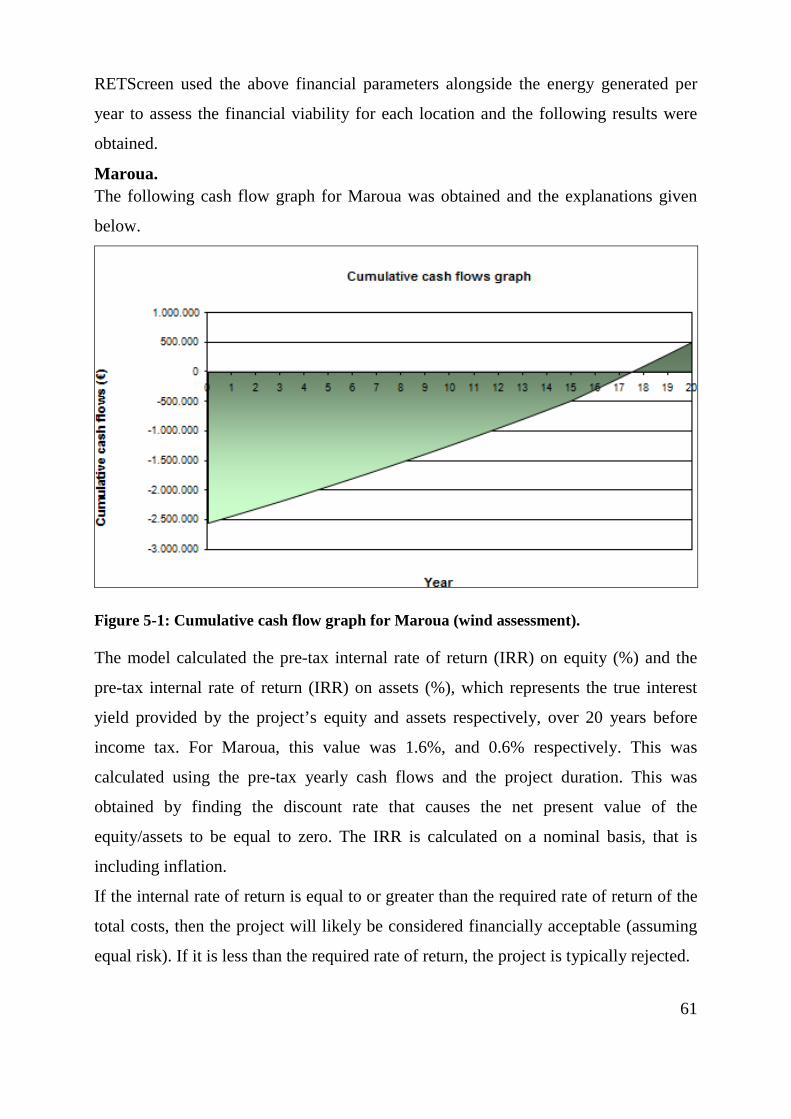
61
RETScreen used the above financial parameters alongside the energy generated per
year to assess the financial viability for each location and the following results were
obtained.
Maroua. The following cash flow graph for Maroua was obtained and the explanations given
below.
Figure 5-1: Cumulative cash flow graph for Maroua (wind assessment).
The model calculated the pre-tax internal rate of return (IRR) on equity (%) and the
pre-tax internal rate of return (IRR) on assets (%), which represents the true interest
yield provided by the project’s equity and assets respectively, over 20 years before
income tax. For Maroua, this value was 1.6%, and 0.6% respectively. This was
calculated using the pre-tax yearly cash flows and the project duration. This was
obtained by finding the discount rate that causes the net present value of the
equity/assets to be equal to zero. The IRR is calculated on a nominal basis, that is
including inflation.
If the internal rate of return is equal to or greater than the required rate of return of the
total costs, then the project will likely be considered financially acceptable (assuming
equal risk). If it is less than the required rate of return, the project is typically rejected.
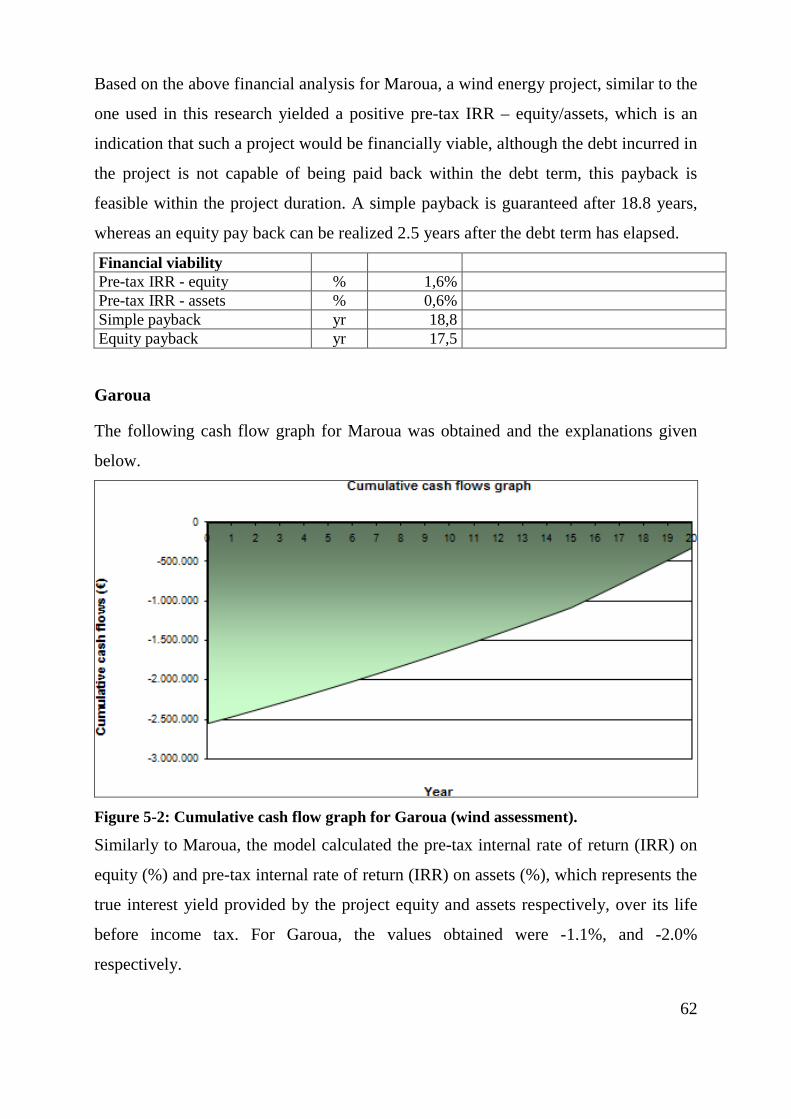
62
Based on the above financial analysis for Maroua, a wind energy project, similar to the
one used in this research yielded a positive pre-tax IRR – equity/assets, which is an
indication that such a project would be financially viable, although the debt incurred in
the project is not capable of being paid back within the debt term, this payback is
feasible within the project duration. A simple payback is guaranteed after 18.8 years,
whereas an equity pay back can be realized 2.5 years after the debt term has elapsed.
Financial viability Pre-tax IRR - equity % 1,6% Pre-tax IRR - assets % 0,6% Simple payback yr 18,8 Equity payback yr 17,5
Garoua
The following cash flow graph for Maroua was obtained and the explanations given
below.
Figure 5-2: Cumulative cash flow graph for Garoua (wind assessment).
Similarly to Maroua, the model calculated the pre-tax internal rate of return (IRR) on
equity (%) and pre-tax internal rate of return (IRR) on assets (%), which represents the
true interest yield provided by the project equity and assets respectively, over its life
before income tax. For Garoua, the values obtained were -1.1%, and -2.0%
respectively.
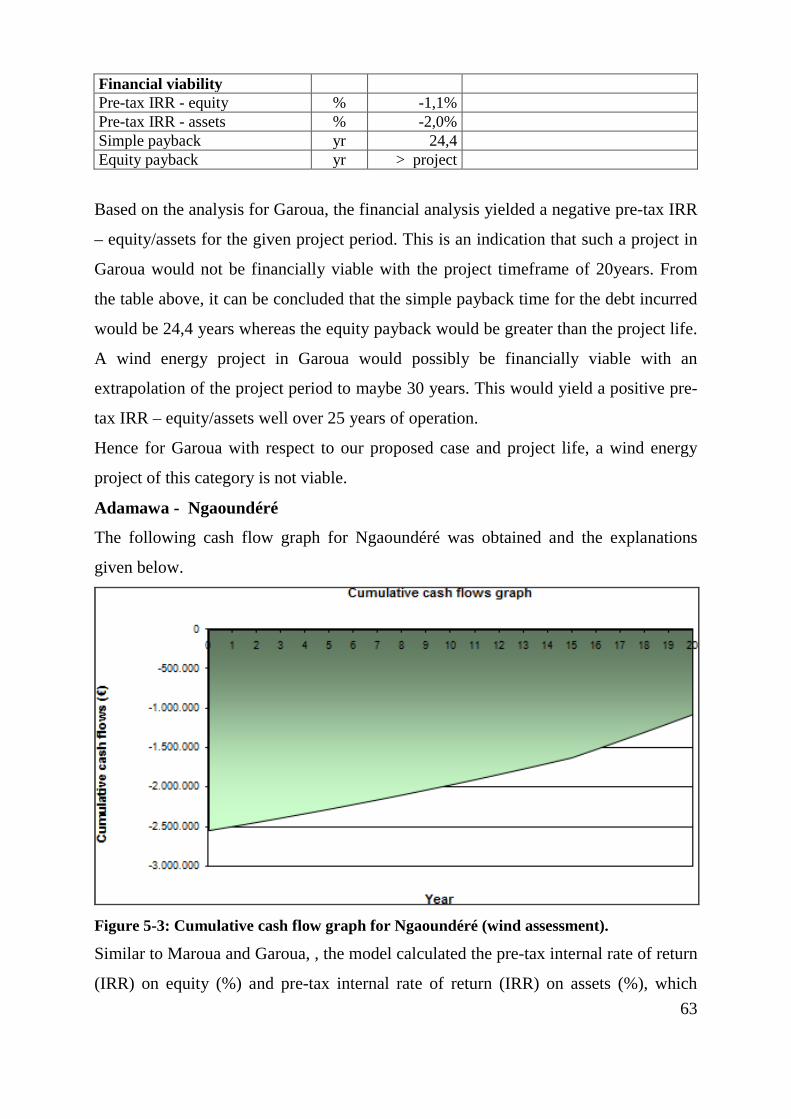
63
Financial viability Pre-tax IRR - equity % -1,1% Pre-tax IRR - assets % -2,0% Simple payback yr 24,4 Equity payback yr > project
Based on the analysis for Garoua, the financial analysis yielded a negative pre-tax IRR
– equity/assets for the given project period. This is an indication that such a project in
Garoua would not be financially viable with the project timeframe of 20years. From
the table above, it can be concluded that the simple payback time for the debt incurred
would be 24,4 years whereas the equity payback would be greater than the project life.
A wind energy project in Garoua would possibly be financially viable with an
extrapolation of the project period to maybe 30 years. This would yield a positive pre-
tax IRR – equity/assets well over 25 years of operation.
Hence for Garoua with respect to our proposed case and project life, a wind energy
project of this category is not viable.
Adamawa - Ngaoundéré
The following cash flow graph for Ngaoundéré was obtained and the explanations
given below.
Figure 5-3: Cumulative cash flow graph for Ngaoundéré (wind assessment).
Similar to Maroua and Garoua, , the model calculated the pre-tax internal rate of return
(IRR) on equity (%) and pre-tax internal rate of return (IRR) on assets (%), which
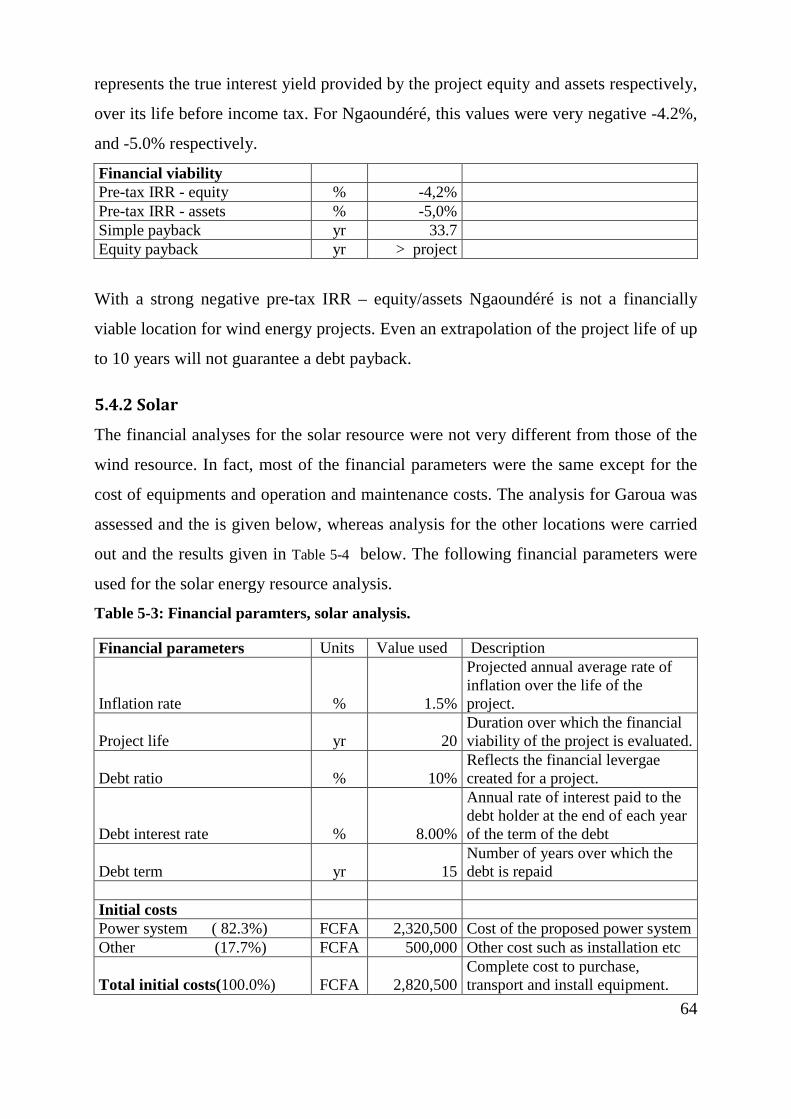
64
represents the true interest yield provided by the project equity and assets respectively,
over its life before income tax. For Ngaoundéré, this values were very negative -4.2%,
and -5.0% respectively.
Financial viability Pre-tax IRR - equity % -4,2% Pre-tax IRR - assets % -5,0% Simple payback yr 33.7 Equity payback yr > project
With a strong negative pre-tax IRR – equity/assets Ngaoundéré is not a financially
viable location for wind energy projects. Even an extrapolation of the project life of up
to 10 years will not guarantee a debt payback.
5.4.2 Solar
The financial analyses for the solar resource were not very different from those of the
wind resource. In fact, most of the financial parameters were the same except for the
cost of equipments and operation and maintenance costs. The analysis for Garoua was
assessed and the is given below, whereas analysis for the other locations were carried
out and the results given in Table 5-4 below. The following financial parameters were
used for the solar energy resource analysis.
Table 5-3: Financial paramters, solar analysis.
Financial parameters Units Value used Description
Inflation rate % 1.5%
Projected annual average rate of inflation over the life of the project.
Project life yr 20 Duration over which the financial viability of the project is evaluated.
Debt ratio % 10% Reflects the financial levergae created for a project.
Debt interest rate % 8.00%
Annual rate of interest paid to the debt holder at the end of each year of the term of the debt
Debt term yr 15 Number of years over which the debt is repaid
Initial costs Power system ( 82.3%) FCFA 2,320,500 Cost of the proposed power system Other (17.7%) FCFA 500,000 Other cost such as installation etc
Total initial costs(100.0%) FCFA 2,820,500 Complete cost to purchase, transport and install equipment.
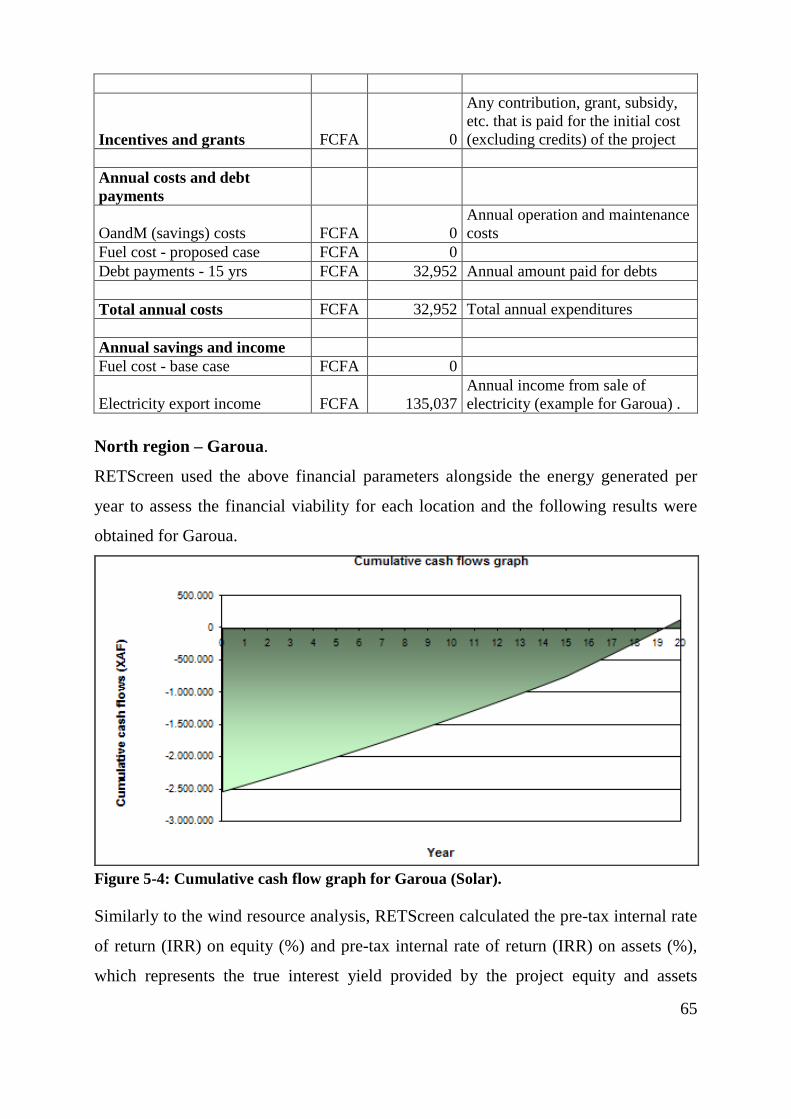
65
Incentives and grants FCFA 0
Any contribution, grant, subsidy, etc. that is paid for the initial cost (excluding credits) of the project
Annual costs and debt payments
OandM (savings) costs FCFA 0 Annual operation and maintenance costs
Fuel cost - proposed case FCFA 0 Debt payments - 15 yrs FCFA 32,952 Annual amount paid for debts
Total annual costs FCFA 32,952 Total annual expenditures
Annual savings and income Fuel cost - base case FCFA 0
Electricity export income FCFA 135,037 Annual income from sale of electricity (example for Garoua) .
North region – Garoua.
RETScreen used the above financial parameters alongside the energy generated per
year to assess the financial viability for each location and the following results were
obtained for Garoua.
Figure 5-4: Cumulative cash flow graph for Garoua (Solar).
Similarly to the wind resource analysis, RETScreen calculated the pre-tax internal rate
of return (IRR) on equity (%) and pre-tax internal rate of return (IRR) on assets (%),
which represents the true interest yield provided by the project equity and assets
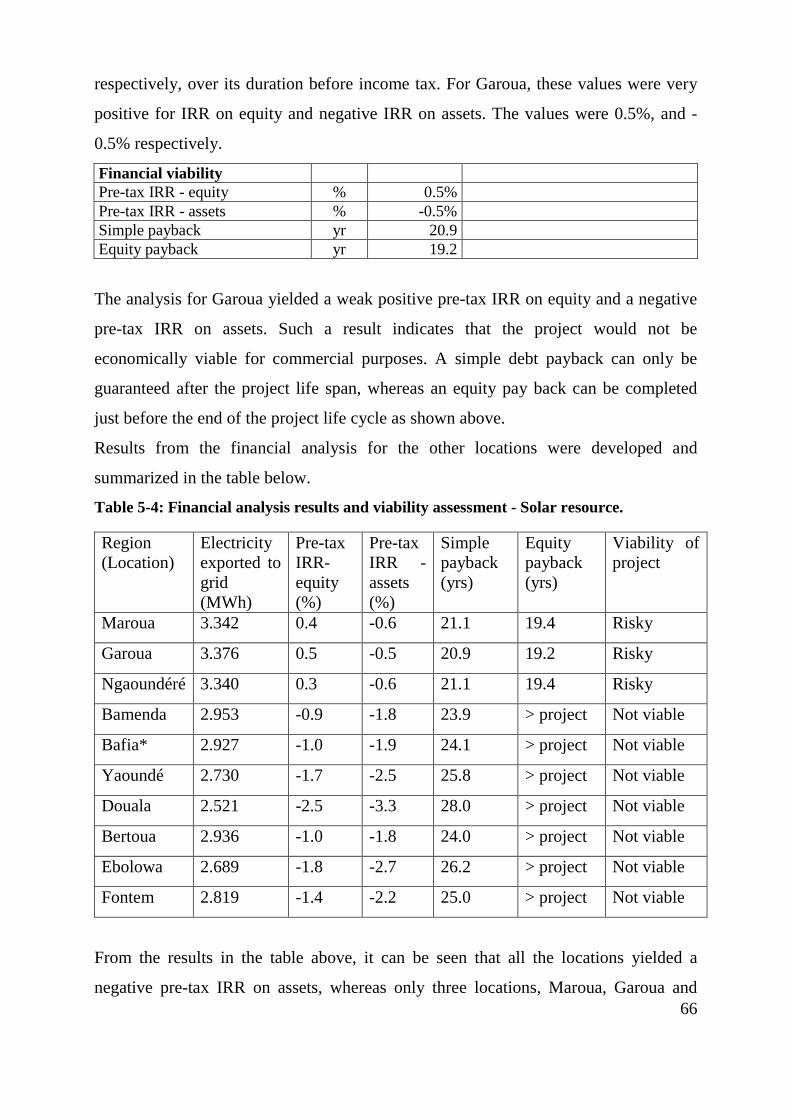
66
respectively, over its duration before income tax. For Garoua, these values were very
positive for IRR on equity and negative IRR on assets. The values were 0.5%, and -
0.5% respectively.
Financial viability Pre-tax IRR - equity % 0.5% Pre-tax IRR - assets % -0.5% Simple payback yr 20.9 Equity payback yr 19.2
The analysis for Garoua yielded a weak positive pre-tax IRR on equity and a negative
pre-tax IRR on assets. Such a result indicates that the project would not be
economically viable for commercial purposes. A simple debt payback can only be
guaranteed after the project life span, whereas an equity pay back can be completed
just before the end of the project life cycle as shown above.
Results from the financial analysis for the other locations were developed and
summarized in the table below.
Table 5-4: Financial analysis results and viability assessment - Solar resource.
Region (Location)
Electricity exported to grid (MWh)
Pre-tax IRR-equity (%)
Pre-tax IRR - assets (%)
Simple payback (yrs)
Equity payback (yrs)
Viability of project
Maroua 3.342 0.4 -0.6 21.1 19.4 Risky
Garoua 3.376 0.5 -0.5 20.9 19.2 Risky
Ngaoundéré 3.340 0.3 -0.6 21.1 19.4 Risky
Bamenda 2.953 -0.9 -1.8 23.9 > project Not viable
Bafia* 2.927 -1.0 -1.9 24.1 > project Not viable
Yaoundé 2.730 -1.7 -2.5 25.8 > project Not viable
Douala 2.521 -2.5 -3.3 28.0 > project Not viable
Bertoua 2.936 -1.0 -1.8 24.0 > project Not viable
Ebolowa 2.689 -1.8 -2.7 26.2 > project Not viable
Fontem 2.819 -1.4 -2.2 25.0 > project Not viable
From the results in the table above, it can be seen that all the locations yielded a
negative pre-tax IRR on assets, whereas only three locations, Maroua, Garoua and
67
Ngaoundéré could yield a positive pre-tax IRR on equity. Although these regions gave
positive results, a commercial solar projects on the scale analysed in this research, in
those locations were designated as risky. This is because the positive pre-tax IRR
values on equity were very weak, with the maximum value being that of Garoua,
which is just 0.5%.

68
Chapter 6 : Environmental Analysis
6.1 Introduction The environmental analysis seeks to assess the emission offsets in the environment
that can be achieved through the use of renewable energy instead of conventional
fossil fuel. This section looks at the most current documented rates of emissions for
electricity generation and other sources for Cameroon, mainly the emission of GHG.
Furthermore it brings out the best use of renewable energy in terms of minimizing CO2
and other pollutants.
GHGinclude water vapour, carbon dioxide (CO2), methane (CH4), nitrous oxide
(N2O), ozone (O3) and several classes of halo carbons (that is, chemicals that contain
carbon together with fluorine, chlorine and bromine). GHG allow solar radiation to
enter the Earth's atmosphere, but prevent some of the infrared radiation reflected by
the Earth's surface from escaping. Instead, this outgoing radiation is absorbed by the
GHG and then partially re-emitted as thermal radiation back to Earth, warming the
surface. GHG that are most relevant to energy project analysis are carbon dioxide,
methane and nitrous oxide. These gases are considered in the RETScreen emission
reduction analysis. RETScreen also considers the direct chemical contribution of
refrigerants (fluorocarbons) to greenhouse gas emissions resulting from the operation
of the base case and proposed case systems. Fluorocarbons include
chlorofluorocarbons (CFCs), hydrochlorofluorocarbons (HCFCs) and
hydrofluorocarbons (HFCs). They are used in a variety of applications including
refrigeration and air-conditioning systems. For many years, CFCs, such as CFC-11
and CFC-12, have been used widely, but due to the Montreal Protocol they are now
being replaced by HCFCs, such as HCFC-22 and HCFC-123 and HFCs, such as HFC-
23 and HFC-134a, because they exist for a shorter time in the atmosphere, addressing
the concern about ozone depletion. They can also have a significant impact on global
warming.
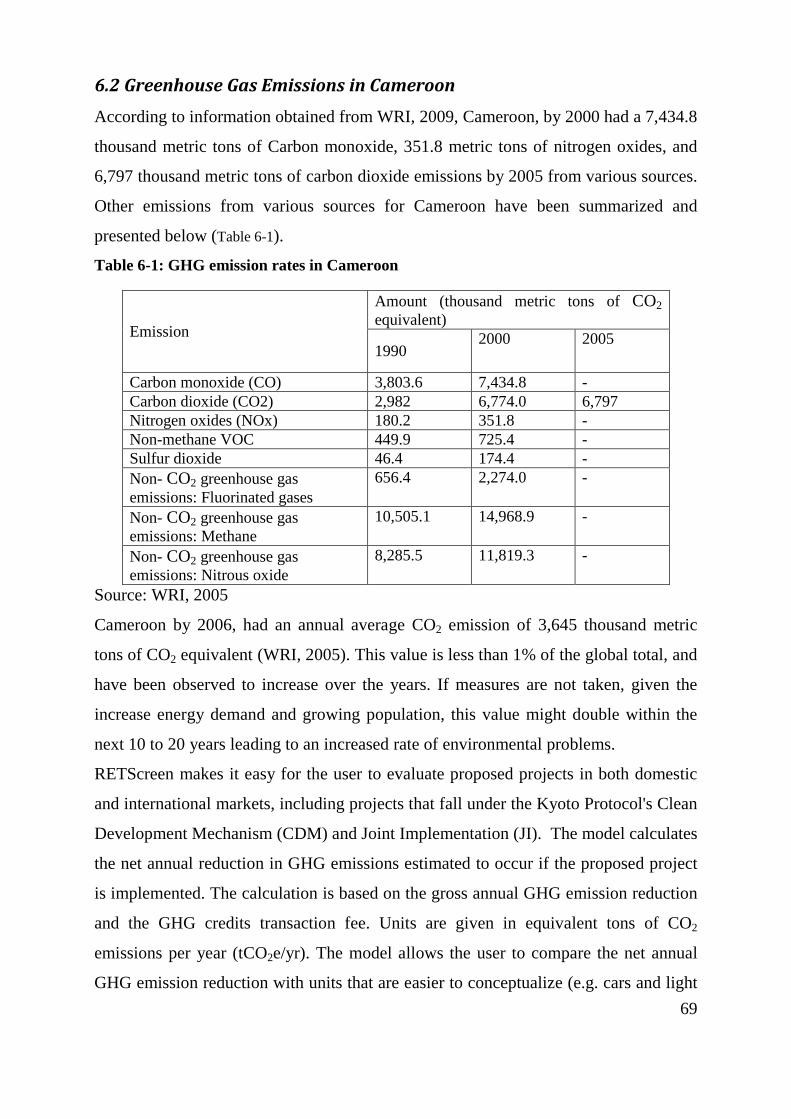
69
6.2 Greenhouse Gas Emissions in Cameroon According to information obtained from WRI, 2009, Cameroon, by 2000 had a 7,434.8
thousand metric tons of Carbon monoxide, 351.8 metric tons of nitrogen oxides, and
6,797 thousand metric tons of carbon dioxide emissions by 2005 from various sources.
Other emissions from various sources for Cameroon have been summarized and
presented below (Table 6-1).
Table 6-1: GHG emission rates in Cameroon
Emission
Amount (thousand metric tons of CO2 equivalent)
1990 2000 2005
Carbon monoxide (CO) 3,803.6 7,434.8 - Carbon dioxide (CO2) 2,982 6,774.0 6,797 Nitrogen oxides (NOx) 180.2 351.8 - Non-methane VOC 449.9 725.4 - Sulfur dioxide 46.4 174.4 - Non- CO2 greenhouse gas emissions: Fluorinated gases
656.4 2,274.0 -
Non- CO2 greenhouse gas emissions: Methane
10,505.1 14,968.9 -
Non- CO2 greenhouse gas emissions: Nitrous oxide
8,285.5 11,819.3 -
Source: WRI, 2005
Cameroon by 2006, had an annual average CO2 emission of 3,645 thousand metric
tons of CO2 equivalent (WRI, 2005). This value is less than 1% of the global total, and
have been observed to increase over the years. If measures are not taken, given the
increase energy demand and growing population, this value might double within the
next 10 to 20 years leading to an increased rate of environmental problems.
RETScreen makes it easy for the user to evaluate proposed projects in both domestic
and international markets, including projects that fall under the Kyoto Protocol's Clean
Development Mechanism (CDM) and Joint Implementation (JI). The model calculates
the net annual reduction in GHG emissions estimated to occur if the proposed project
is implemented. The calculation is based on the gross annual GHG emission reduction
and the GHG credits transaction fee. Units are given in equivalent tons of CO2
emissions per year (tCO2e/yr). The model allows the user to compare the net annual
GHG emission reduction with units that are easier to conceptualize (e.g. cars and light

70
trucks not used, barrels of oil not consumed, acres of forest land absorbing carbon etc).
The calculation is based on a GHG emission factor with (0.045) or without (0.039)
T&D (transmission and distribution) losses per MWh of electricity generated. Based
on these analysis RETScreen calculated the amount of GHG that could be offset for
the cases of this research. These results were divided based on the resource type and
are given below.
6.3 Offsetting Greenhouse Gases by Wind Calculations for reducing GHG for wind was done only for Maroua, Garoua, and
Ngaoundéré. Other locations were not taken into consideration because the wind
resource in these areas was assessed not strong enough to be capable of generating
electrical energy on a commercial scale. Although a wind project in Ngaoundéré was
analysed to be commercially not profitable, the analysis considered the location as
capable of offsetting GHG.
According to the analysis, a single ENERCON E-82 wind turbine installed in Maroua
generating an average 1,732MWh electricity a year, would be capable of reducing
78.6t CO2e/yr. Taking into consideration transmission and distribution (T&D) losses
of electricity (15% used in this case) a net annual GHG emission reduction for Maroua
would be 66.8t CO2e/yr. This value can be conceptualized as follows:
Equivalent to
- 12.2 cars and light trucks not used
- 28,718 liters of gasoline not consumed
- 155 barrels of crude oil not consumed
- 66.8 people reducing energy consumption by 20%
- 15.2 acres of forest land absorbing carbon
- 6.1 hectares of forest absorbing carbon and
- 23.0 tons of waste recycled.
The analysis for Garoua and Ngaoundéré were tabulated and are given below (Table
6-2).
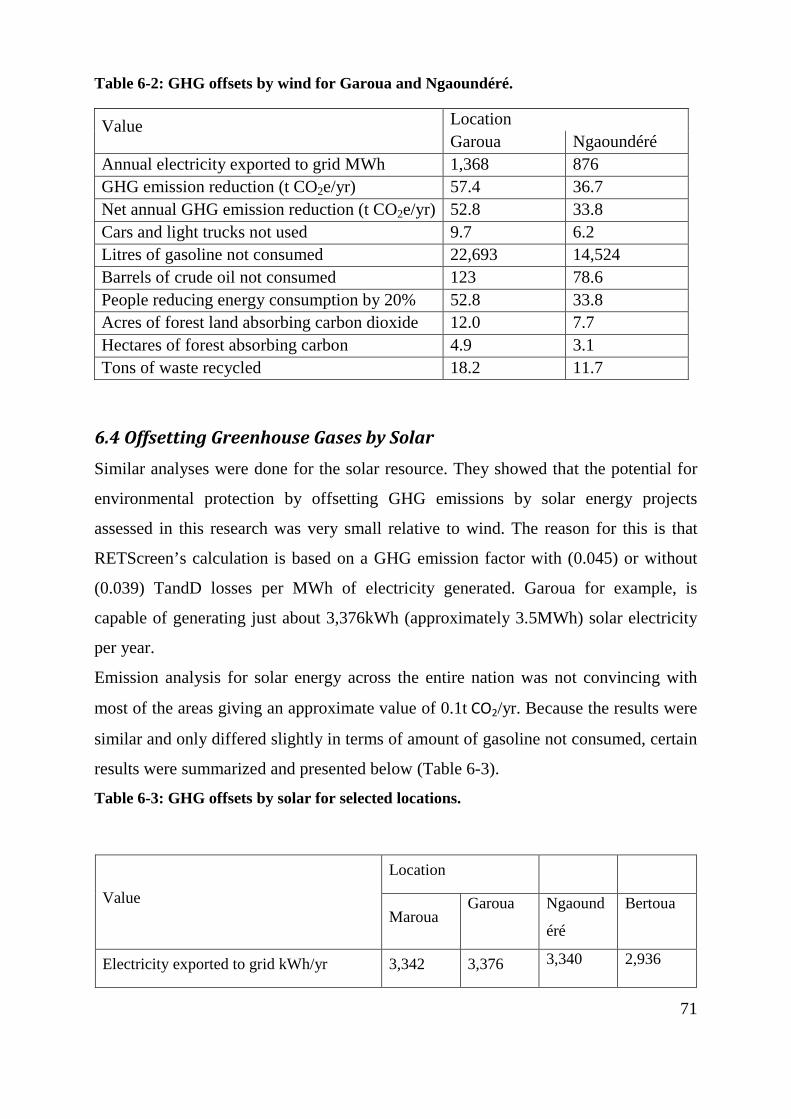
71
Table 6-2: GHG offsets by wind for Garoua and Ngaoundéré.
Value Location Garoua Ngaoundéré
Annual electricity exported to grid MWh 1,368 876 GHG emission reduction (t CO2e/yr) 57.4 36.7 Net annual GHG emission reduction (t CO2e/yr) 52.8 33.8 Cars and light trucks not used 9.7 6.2 Litres of gasoline not consumed 22,693 14,524 Barrels of crude oil not consumed 123 78.6 People reducing energy consumption by 20% 52.8 33.8 Acres of forest land absorbing carbon dioxide 12.0 7.7 Hectares of forest absorbing carbon 4.9 3.1 Tons of waste recycled 18.2 11.7
6.4 Offsetting Greenhouse Gases by Solar Similar analyses were done for the solar resource. They showed that the potential for
environmental protection by offsetting GHG emissions by solar energy projects
assessed in this research was very small relative to wind. The reason for this is that
RETScreen’s calculation is based on a GHG emission factor with (0.045) or without
(0.039) TandD losses per MWh of electricity generated. Garoua for example, is
capable of generating just about 3,376kWh (approximately 3.5MWh) solar electricity
per year.
Emission analysis for solar energy across the entire nation was not convincing with
most of the areas giving an approximate value of 0.1t CO2/yr. Because the results were
similar and only differed slightly in terms of amount of gasoline not consumed, certain
results were summarized and presented below (Table 6-3).
Table 6-3: GHG offsets by solar for selected locations.
Value
Location
Maroua Garoua
Ngaound
éré
Bertoua
Electricity exported to grid kWh/yr 3,342 3,376 3,340 2,936
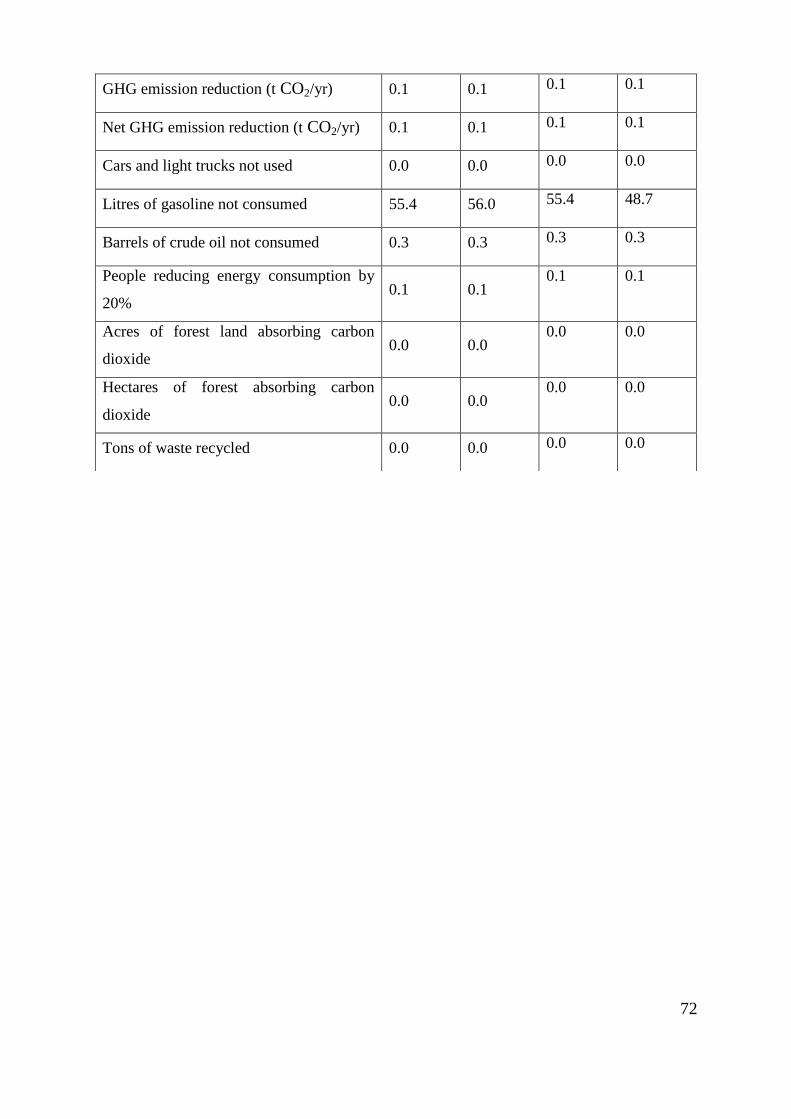
72
GHG emission reduction (t CO2/yr) 0.1 0.1 0.1 0.1
Net GHG emission reduction (t CO2/yr) 0.1 0.1 0.1 0.1
Cars and light trucks not used 0.0 0.0 0.0 0.0
Litres of gasoline not consumed 55.4 56.0 55.4 48.7
Barrels of crude oil not consumed 0.3 0.3 0.3 0.3
People reducing energy consumption by
20% 0.1 0.1
0.1 0.1
Acres of forest land absorbing carbon
dioxide 0.0 0.0
0.0 0.0
Hectares of forest absorbing carbon
dioxide 0.0 0.0
0.0 0.0
Tons of waste recycled 0.0 0.0 0.0 0.0
73
Chapter 7 : Political and Regulatory Framework
Introduction
In this section, a review of political and regulatory frameworks and laws put forward
by the Cameroonian government in the energy sector was carried out with emphasis on
renewable energy.
Since 1996, Cameroon has made major advances in the development of regulations for
its energy sector. In 1998, the Government of Cameroon (GOC) initiated a series of
policy and structural reforms to promote the efficient operations of the energy sector
and increase the role of the private sector in its future development. An Electricity
Law was adopted in 1998. The passage of a complementary Electricity Decree
followed in 2000 as well as the establishment of a sector regulator (ARSEL) and a
rural electrification agency (AER). The vertically integrated, formerly state owned
electricity company was privatized through a 20year concession in 2001. While
electricity access rates have improved since privatization, AES SONEL fell
significantly short of meeting its initial connection targets. Despite the GOC’s
commitment to privatization, a number of structural issues need to be addressed to
secure sustainable and affordable electricity development in the long run (SME, 2004).
There are no regulations in Cameroon dealing specifically with renewable energy. The
following are laws enacted by the Cameroonian government dealing with energy of
which renewable energy is a subset.
Decree N° 96/36/PM to set up a National Committee of The World Energy Council
This law was published on February 21st 1996 by the Prime Ministry of the Republic
of Cameroon, to set up in the Ministry in charge of energy A National Committee of
the World Energy Council. Article II of the decree stipulates the duties of the
committee, to prepare and ensure Cameroon’s participation in the meetings of the
World Energy Council, and monitor the enforcement of the recommendations of the
74
Council in Cameroon. Article III of the decree provides for the organization and
functioning of the committee.
Law N° 98/022 governing the electricity sector
Passed into law on the 24th of December 1998, this law governs the production from
any primary or secondary energy source, the conveyance distribution, the supply, the
import, export and sale of electricity by any company in Cameroon.
Part I of the law;
- lays down the conditions for producing, conveying, distributing, importing,
exporting and selling electricity;
- establishes the basis for fair competition in the electricity sector so as to
enhance its economic efficiency;
- determines the manner of checking the implementation of the specific
obligations by persons involved in non-competitive activities;
- determines the rules governing environmental and consumer protection in terms
of prices, the conditions of supply and the safety of the services;
- guarantees the continuity and quality of services.
By so doing, the law defines primary sources of energy as resources which exist in
their natural state on the territory of the Republic of Cameroon or are imported, and
which can either be used directly as fuel, such as organic matter (petroleum, crude oil,
schist, coal, peat, biomass, fuel gas); converted into other forms of energy; used as
nuclear energy; or be obtained from renewable sources of energy (water, solar energy,
wind and geothermal energy).
Renewable energy resources are: sources of energy that exist naturally and are
permanently renewed by nature.
Part III of the law stipulates the activities in the electricity sector and placed them
under one of the following legal schedules: concession; licensing, authorization;
declaration and the free scheme.
Decree N° 99/125 to set up the organization and functioning of The Electricity Sector Regulatory Agency.

75
This decree published in June 1999 by the Presidency of the Republic of Cameroon,
organized and laid down the conditions for the functioning of the Electricity Sector
Regulatory Agency, hereinafter referred to as the “Agency”, set up by Law N° 98/22
of 24th December 1998 governing the electricity sector. The Agency’s mission was to
regulate, control and monitor the activities of operators in the electricity sector and to
arbitrate disputes between electricity sector operators, upon referral by the parties.
Decree N° 99/193 relating to the organization and functioning of the rural electrification agency.
From a regulatory perspective, this decree published in September 1999 by the
Presidency of the Republic of Cameroon is responsible for promoting rural
electrification. In this capacity, it provides operators and consumers the technical and,
if necessary, financial assistance required for development of rural electrification.
Article II of the decree places the agency under the supervisory authority of the
government service in charge of electricity which, in this capacity, defines state policy
in the rural electrification sector.
Decree n° 2001/21/pm 29 January 2001, to fix the rates and the conditions of calculating, collecting and distributing royalties on activities in the electricity sector.
This decree clearly divides and fixes;
- The rates and the conditions of calculating, collecting and distributing royalties
in the electricity sector;
- The royalty paid on any activity falling under one of the schedules provided for
below, shall be based on the annual turnover exclusive of tax of the activity
carried out by the operator for the financial year ending during the previous
year;
- Exempts private production installations other than hydroelectric power plants,
of a capacity lower than or equal to 100 kW from the royalties that are the
subject of this decree.
76
Decision No. 17/DG/ARSEL of 25 January 2002 to fix prices exclusive of tax of electricity sold by AES-SONEL
Published by the Electricity Sector Regulatory Agency (ARSEL), this decision clearly
divides subscribers into the level of consumption and set prices applicable for each
group as follows.
1. Low Voltage Subscribers
Lighting for home and business use
- Social Range. Consumption lower than or equal to 110 kWh within the month:
50 CFAF/kWh.
- Normal Range. For all kWh consumed over 110 kWh: 64 CFAF/kWh.
- Public Lighting. Price applicable provided consumption takes place from 6.30
p.m. to 6 a .m: 33.6 CFAF per kWh.
2. Medium Voltage Subscribers
General schedule. The rate shall comprise two complementary elements:
- Annual fixed bonus per kW of subscribed power: 9.125 FCFA.
- Proportional rate per kWh consumed.
It shall depend on the number of hours of monthly consumption of the subscribed
power, and shall be calculated in accordance with the following table.
- Number of hours proportional rate
From 0 to 200 hours 40.5 FCFA/kWh
From 201 to 325 hours 37 FCFA/kWh
From 326 to 450 hours 33.5 FCFA/kWh
Over 450 hours 31.2 FCFA/kWh
Industrial Free Zones And Special Industrial Free Zones
The price shall comprise two complementary elements:
1. Annual fixed bonus per kW of subscribed power. It shall depend on the number
of hours of the annual consumption of the subscribed power, and shall be
calculated in accordance with the following table.
Number of hours fixed bonus
From 0 to 3, 900 hours 15, 612 CFAF/kW
77
From 3, 901 to 5, 400 10, 870 CFAF/kW
From 5, 401 hours to 6, 600 5, 437 CFAF/kW
Over 6, 600 NIL
2. Proportional price per kWh consumed. It shall depend on the number of hours of
monthly consumption of the subscribed power and shall be calculated in
accordance with the following table.
Number of hours proportional rate
From 0 to 200 hours 23.10 CFAF/kWh
From 201 to 325 hours 20.79 CFAF/kWh
From 326 to 450 hours 16.17 CFAF/kWh
Over 450 hours 11.55 CFAF/kWh
Enterprises set up in an Industrial Free Zone or in a Special Industrial Free Zone shall
be exempt from payment of advance on consumption. AES-SONEL shall keep any
advances on consumption collected before the signing of this decision. An increase of
10% of proportional prices shall be collected as guarantee in respect of the minimum
export rate of 80% of the production of the said enterprise set up in the Industrial Free
Zone or in the Special Industrial Free Zone. This deduction shall be retroceded at the
end of every financial year as credit upon justification of compliance with the export to
AES-SONEL of 80% of production.
3. High voltage subscribers
Sale prices of high voltage electricity to subscribers existing at the date of signature
of the concession and licence agreements of AES SONEL shall remain in force, and
shall be revised in accordance with the specifications of the framework concession
and licence agreement of the company.
Sale prices of high voltage electricity to new subscribers shall be fixed within the
framework of agreements signed with AES SONEL, upon approval by the Electricity
Sector Regulatory Board in accordance with the specifications of the framework
concession and license agreement of the company.
78
Decree N° 2003/243 of 12 December 2003 to set up an Energy Steering Committee
In an effort to support and supervise strategies for the management of energy crises
and for the finalization of the national energy plan, an energy steering committee was
set up in the Presidency of the Republic of Cameroon in 2003. The committee is
responsible for;
- developing and facilitating necessary synergies between different
administrations in determining the most appropriate strategies for short term
situations of energy crises;
- promoting and boosting consultations in view of finalizing the national energy
plan;
- suggesting any measure likely to favor the implementation of programs and
projects coming within the framework of strategies of energy crises situations.
Decree Nº2006/406 to set up the Electricity Development Corporation
In order to ensure the conservation of public patrimony in the electricity sector, a
public corporation – The Electricity Development Corporation (EDC) was set up on
November 29th 2006 by the President of the Republic of Cameroon. Under this
decree, the EDC is responsible for;
- managing for the account of the State, public patrimony in the electricity sector;
- studying, preparing or realizing in the electricity sector, any infrastructural
project that the state shall confide to it;
- participating in promoting private and public investments in the electricity
sector.
The GOC has so far indicated strong signals of its interest for the development of the
country’s energy services. With clarity of the roles as laid down by the laws and
decrees passed, as well as responsibilities of actors in the sector, a key milestone
would be an increase in the public budgetary fund. However, a continuing support of
the World Bank to the country through 20 active projects with a commitment value of
US$ 659.5 million as of September 2009 in various sectors would further leverage
GOC resources that could be directed to the energy sector (World Bank, 2009).
79
Chapter 8 : Conclusion In this research, a few goals discussed in section 2.2 could be achieved. The
contributions of this thesis are discussed in the following.
Technology and Infrastructure. As explained in section 1.3 and 2.1 Cameroons
inability to generate the full facet of its installed electricity capacity is largely due to
its poor infrastructure, and reliance on aging equipments. With an installed electricity
production capacity of 935MW, the energy sector is capable of producing just about
50% of this installed capacity. Also, its poor infrastructures accounts for the poor
coverage of the country and low access rates especially in rural areas. Technology
wise, Cameroon depends solely on hydro and thermal technologies for its electricity
production. Wind and solar have not been developed and fully integrated.
Resource Potentials with its estimated 55,200MW hydropower potential, Cameroon is
second only to the Democratic Republic of Congo in Africa in the domain of hydro.
Cameroon has huge potentials for biomass fuels which account for 78% of its primary
energy source. From the technical analysis presented in section 4, the northern regions
of Cameroon especially Maroua has promising potentials for wind energy. With a
single wind turbine installed in this location capable of generating an annual
1,732MWh electrical energy, the wind resource can be developed on a commercial
scale. The solar potential though very low compared to the wind resource is still
promising for commercial purposes in the northern regions of Cameroon. Apart from
the northern regions of the country, the wind and solar potentials are not good enough
to be developed for commercial purposes, but can still be exploited for small scale
micro projects, for instance, to enhance sustainable water supply pumps, food
processing and conservation, agriculture and low-cost building techniques for local
communities with little or no access to the national electricity grid.
Sustainability: sustainability is a term, or even a concept, that has been widely used in
recent years, especially regarding international development. Brundtland (1987), for
the World Commission on Environment and Development, has defined Sustainable
development as: “development that meet the needs of the present without
compromising the ability of future generations from meeting their own needs”. With
80
mean annual hours of sunshine per year of over 3,000 hours and annual mean wind
speeds that are equal to or exceed 2m/s for over 80% of the time, these prospective
technologies can guarantee a long term supply of Cameroon’s economy with energy
on a sustainable basis if fully developed.
Policy setbacks: Most legislations governing the energy sector in Cameroon reviewed
in section 7 of this research have shown that there are no direct laws or decrees
governing renewable energy in Cameroon. Most of these are regulatory texts
governing the energy sector as a whole. These policies have failed to promote and
encourage the incorporation and use of other sources of energy such as wind and solar,
by providing incentives and grants. Also these legislations and policies have fallen
short of strict guides and practices geared towards the conservation and protection of
these resources so as to guarantee a long term supply. This has been reflected in the
increasingly drying up of streams and rivers causing below capacity productions of
electricity in the sector.
Energy and the environment: The energy sector in Cameroon has suffered a lot of
effects from climatic changes, from the Sahara desert encroachment to the north, to
some major streams and rivers drying up during the dry seasons. This has been a major
blow to the electricity sector due to the fact that, it depends solely on hydro and
thermal power for the generation of electrical energy, leading to constant generations
below capacity during these periods.
Conclusively, the economy of Cameroon is not in a very good shape. Attempts made
by the Government of Cameroon to rehabilitate the economy would go in vain if there
is no boost in the energy sector. Cameroon has a plethora of unexploited renewable
resources, with a hydropower potential second only to Congo in Africa. These
potentials are there untapped, from hydropower, through biomass to wind and solar,
but the country still goes through insufficient supply of electricity.
The northern regions of Cameroon are highly endowed with vast wind and solar
potentials that can be exploited on a commercial scale and help improve energy and
electricity problems in Cameroon. Despite their low potentials for wind and solar,
other locations in Cameroon still possess some small but seasonal potentials. The
findings in this research could not be different, as some researches have already been
81
undertaken in an attempt to estimate the wind potentials in the northern regions of
Cameroon . But normally, there are a number of conflicting options as to where, how
and what can be done in revitalizing the energy sector in Cameroon, which demand
funding and the purpose of this research is to ascertain which of such projects will give
the best returns.
Looking at the fundamentals of the Cameroonian economy, there is a huge energy gap
that is acting as a key constraint to its development. Also, the gap between the demand
and supply of energy is not diminishing, instead it is constantly increasing with an
estimated 8%. For Cameroon to narrow or close this gap, it has to move on board by
developing its full potentials. The main question is, with the kind of institutional setup
and the regulations that are available now in the sector, is it possible for these
highlighted potentials to be moved into action? What can be changed, what can be
done in the institutions, what do we need to change in the technology, what do we
need to change in the infrastructure, what do we need to change even at the level of the
policies to ensure that these potentials are fully taken up?
Cameroon, like most other countries has been at the realm of corruption. But even in
the face of corruption, we cannot only advocate stopping the corruption, but also we
have to see what we can do to survive in the midst of those corruptions. There are
good projects and creative business opportunities that can be used to work a way out
and to immunize the threats of corruption. Corruption normally is not only at the top,
but from top to bottom and is driven by different incentives and motivations of the
people. For the man at the bottom, corruption means survival, and for the man at the
top, corruption is to plunder those resources directed towards development.
Corruption normally is a constraint in every domain, but we have to ensure not only
how we can eliminate corruption completely but also, how to reduce the ability of
corruption such that it is not a binding constraint in rolling out a project and the
development of our objectives.
82
Chapter 9 : Recommendations
Finally, the recommendations that could be drawn from this research work are that the
Government of Cameroon should develop a renewable energy plan, that will guarantee
a future energy supply that will be adequate, reliable, and affordable both to industries
to enable them to provide continuous employment and low-cost goods and services;
and to the ordinary citizens, to enable them to achieve a decent lifestyle. This plan
should also ensure that energy will be produced and used in a manner that promotes
sustainable development in the utilization of the country’s natural resources but at the
same time maintain the country’s overall economic competitiveness.
In order to attain this goal, there is a need to recognize the factors that hinder the
development of the full potential of renewable energy in Cameroon. This would
include those core issues that act as constraints to the development of renewable
energy resources. Mostly, those constraints that are amendable such as institutional set
up, technology, policy, regulations, and not geographical constraints. In order to look
in the direction that the Government of Cameroon can translate the potentials
highlighted above into action, the following recommendations have been set forth.
1. Diversify sources of energy
The over-dependence on hydropower as the main source of electricity has greatly
contributed to the growing energy problems in Cameroon. Cameroon certainly has the
second largest hydropower in Africa, but with the increasing global warming concerns
and desert encroachment to the north, the energy sector will still be at great risks if
other sources are not employed. A combination of hydro, wind, solar and thermal
technologies will not only eliminate below capacity productions, but will also
guarantee a continuous supply of energy. For example, during the heart of the dry
seasons between December and March, when streams are drying up and the water
power is not strong enough to supply the required capacity, the solar irradiance and
wind speeds for Cameroon are at their peaks and vice versa. With these technologies
in use, there will always be supplements to make up for the drawbacks of one source
by another.
83
2. Implement clear and direct policies
There is a need to improve the implementing rules and regulations to remove the
barriers in the expansion of renewable energy. Traditional policy of the government
must be further improved also to facilitate the energy sector’s transition to a
sustainable system with renewable energy as an increasingly prominent, viable and
competitive option.
3. Support development of expertise in RETs
In order to achieve a higher level of RET development and utilization in the country,
there is a need to build expertise in RET development and management through
enhanced training of Cameroonian professionals locally and abroad and the
government must endeavor to solicit funding possibilities to make this possible.
4. Enhance investment in non-power applications
Due to the lack of financing and lack of awareness, the country has not yet been ready
in terms of development of non-power applications, for example in geothermal fields.
People are yet to realize the benefits of using these technologies, especially geothermal
heat in terms of time saved in drying, owing to its higher temperature and non-
seasonality compared to sunlight.
5. Take advantage of international financing opportunities
The Government of Cameroon should support all private sector initiatives that can
draw on the financing instruments of the World Bank’s Prototype Carbon Fund (PCF),
the Global Environmental Facility (GEF) and the United Nations Framework
Convention on Climate Change (UNFCCC): Clean Development Mechanism/Joint
Implementation [CDM/JI], all of which are funding sources for clean energy projects.
The Ministries of Energy and Water, Finance, Environment and Nature Protection,
Industry, Mining and Technology Development as well as the Ministry of Scientific
Research and Innovation should provide more information and technical support to
organizations that intend to seek funding support from these international financing
schemes.
6. Improve awareness and interest in investment opportunities
To this fact, the utilization of wind and solar energy in the country serves as an
example. There has been limited private sector investment in wind energy
84
development. Another issue is the commercialization of hydropower technology.
There is a need to further develop and commercialize suitable micro hydro technology
in the country, even as hydropower technology for large and small projects is proven
and mature. The effect of this problem causes the country to remain dependent on
imported electro-mechanical equipment for micro hydro projects.
7. Learning, experimentation and accountability
Rather than prematurely trying to identify the most efficient technology to move
towards a sustainable energy system, there is an ongoing need for flexibility,
experimentation and learning. Instead of settling on solutions on the basis of costs (or
cost projections), more effort should be expended on R&D and commercialization of
promising technologies, so as to drive down their costs (Ivan and Gordon, 2009).
8. Implement an energy pricing policy
Adopt an energy pricing policy that will be able to satisfy the energy needs of
consumers of different income levels with consideration given to economic growth
promoting economically efficient allocation of resources in all economic sectors
including the renewable energy sector. Such a policy should be able to guarantee a rate
of return to enable self-financing as an acceptable contribution to the required
investments. Energy conservation should be a main objective of such a pricing policy.
In developing such a policy, constraints such as price stability, the prevention of
shocks on prices, avoidance of large price fluctuations, simplicity in the pricing
structure, simple metering and billing strategies and certain environmental aspects
through taxation should be carefully dealt with.
If the GOC weigh the renewable energy potentials on the basis of the constraints that
are inhibiting the development of its full potential and see how these can be overcome
to help its economy, they will be a long way ahead in revitalizing the country’s energy
sector and the already crippled economy of Cameroon.
9. Further research in the northern regions of Cameroon
Finally, there are almost always ways that a study could be improved or refined. The
Government of Cameroon should promote and sponsor researches in the northern
regions of Cameroon, to further and completely evaluate the full potential of wind and
solar in these northern regions.
85
References
- Africa- Times, 2009. Power shortages hit Rio's Cameroon aluminium plant. Available online at http://www.africa-times-news.com/2009/04/power-shortages-hit-rios-cameroon-aluminium-plant/ Date accessed 14-07-2009.
- Alumnieeni, 2009. Economic information about CAMEROON: Investment,
Population, GDP, Household income, Economie, Economia online, available at http://www.alumnieeni.com/zpop2/cameroon_eco_pop2.asp Date accessed 10-9-2009
- Belda Pascal, 2007. Cameroon – Energy and Mining. Ebizguides Cameroon
p116.
- Berry, T., Jaccard, M. 2001. The renewable portfolio standard: design considerations and an implementation survey. Energy Policy 29 (2001) 263-277. Elsevier.
- Bogdan, R. and Taylor, S.J; 1975. Introduction to qualitative research methods.
A phenomenological approach to the social science sciences. Wiley, New York
- BP, 2003. Bp statistical Review of World Energy. Online, Available at: www.bp.com/centres/energy2002/index.asp. Date accessed: 27 october 2009.
- Britannica, 2009 http://www.britannica.com/EBchecked/topic/366040/Maroua
- CALPIRG Charitable Trust, Renewables Work: Job Growth from Renewable
Energy Development in California, June 2002. The employment estimates included in this study were derived from data provided by the California Energy Commission and the Electric Power Research Institute.
- Carbon Dioxide Information Analysis Centre (CDIAC) Trends: A Compendium
of Data on Global Change. Oak Ridge, TN: Oak Ridge National Laboratory, U.S. Department of Energy.
- Earthtrends, 2001: World Resources Institute, Earth Trends‘ Climate
Protection In A Disparate World available online at http://Earthtrends.wri.org/features/view_feature.php?fid=31andtheme=3 and http://Earthtrends.wri.org/pdf_library/feature/cli_fea_protect.pdf accessed August 2009.
- Edward S. Cassidy, 2000: Prospects for Sustainable Energy, A Critical Assessment. Cambridge Univeristy Press. Cambridge.
86
- Encyclopedia of Nations, 2009, Energy and power - Cameroon - annual available at: http://www.nationsencyclopedia.com/Africa/Cameroon-ENERGY-AND-POWER.html#ixzz0bNRVbIOo
- Energy Information Administration (EIA). 1999. International Energy Annual
1999. Washington, DC: EIA.
- Energy Information Administration (EIA). 2001. International Energy Outlook 2001. Washington, DC: EIA.
- Fao, 2009, http://www.fao.org/DOCREP/006/Y4851E/y4851e0f.htm
- Fbo, 2008: Cameroon: Limbé Gas to Electricity Technical Assistance.
Available at https://www.fbo.gov. date accessed 06.10.2009.
- Fbo, 2008: Cameroon: Limbé Gas to Electricity Technical Assistance. Available at https://www.fbo.gov/index?s=opportunityandmode=formandid=70a334772dd12ad3d3c951fa74612559andtab=coreand_cview=1 date accessed 06.10.2009.
- Gerhard Oelert, Falk Auer, Klaus Pertz, 1988: Economic Issues of Renewable Energy Systems. Greven and Bechtold GmbH, D-5000 Cologne
- Globe feed, 2009.
http://distancecalculator.globefeed.com/Cameroon_Distance_Result.asp
- IAEA Library Cataloguing in Publication Data, Energy indicators for sustainable development : guidelines and methodologies. — Vienna : International Atomic Energy Agency, 2005. p.; 24 cm.
- IAEA, 2005. World fact book 2005, Energy and Environment Data Reference
Bank (EEDRB). Available at: http://www.iaea.org/inisnkm/nkm/aws/eedrb/data/CM-gd.htmlDate accessed. 30.
- ICRE. 2004. International Conference for Renewable Energies, Bonn,
Germany.
- IERN, 2009: Country statistics – Cameroon. Available online at http://www.iern.net/portal/page/portal/IERN_HOME/IERN_ARCHIV/Country_Factsheets/Country%20Factsheet?pId=3062009andpPath1=AfricaandpPath2=Cameroon. Accessed, July 2009.
- IPCC. 2001. Climate Change 2001: The Scientific Basis. Geneva: IPCC.
87
- Ivan Scrase and Gordon MacKerron, (Ed)2009. Energy for the Future. A New Agenda. Palgrave Macmillan. Basingstoke Hampshire. Pp 3-10.
- Ivan Scrase and Gordon MacKerron, 2009: Energy for the Future, A New
Agenda. Palgrave Macmillan. London. - IVC, 2009, http://www.ivc.org/douala__cameroon - Mapsof world, 2009: Information on Cameroon. Available online at
http://www.mapsofworld.com/country-profile/cameroon.html. Accessed, August 2009.
- Maxime Kleinpeter, 1995: Energy Planning and Policy. John Wiley and Sons. Chichester.
- NASA, 2009: NASA’s Satellite-derived Meteorological Data for any location
on Earth is provided for use with the RETScreen Software via the NASA Surface Meteorology and Solar Energy (SSE) Data Set.
- REN21, 2007: Energy for Development; The Potential Role of Renewable
Energy in Meeting the Millennium Development Goals. Available online at http://www.ren21.net/pdf/REN21_Report_RETs_for_MDGs.pdf accessed September 2009.
- RETScreen, 2005: Clean Energy Project Analysis, “RETScreen® Engineering and Cases Textbook” Third Edition, Minister of Natural Resources Canada. Available online at : http://www.retscreen.net/ang/12.php
- Reuters,2009: Power shortages hit Rio's Cameroon aluminium plant. Available online at http://www.reuters.com/article/rbssMiningMetalsSpecialty/idUSL767322920090407?pageNumber=2andvirtualBrandChannel=0 Date accessed 06.08.2009.
- Riley, M.W; (Ed.) 1963. Sociological Research. Harcourt, Brace and World,
New York.
- SME,2004 http://www.esmap.org/filez/activity/35200720209_AFCameroonSmallScaleSuppliers.pdf
- Wikipedia, 2009: Renewable Energy. Available online at
http://en.wikipedia.org/wiki/Renewable_energy accessed July 2009.
- World Bank, 2009: Projects and Programs – Cameroon. Available online at http://web.worldbank.org/external/default/main?menuPK=343845&pagePK=141155&piPK=141124&theSitePK=343813. accessed November 2009.

88
- WRI, 2005: Climate and Atmosphere, Carbon Dioxide Emissions by Source 2005 – Cameroon. Available online at http://Earthtrends.wri.org/pdf_library/data_tables/cli3_2005.pdf accessed December 2009.
- WRI, 2009: Report reveals threats to Cameroon's growing timber industry, available online at http://archive.wri.org/news.cfm?id=71 accessed June 2009.
- Youngquist, W. (1997) GeoDestinies: The inevitable control of Earth resources over nations and individuals. Portland, Oregon: National Book Company.

89
Appendix
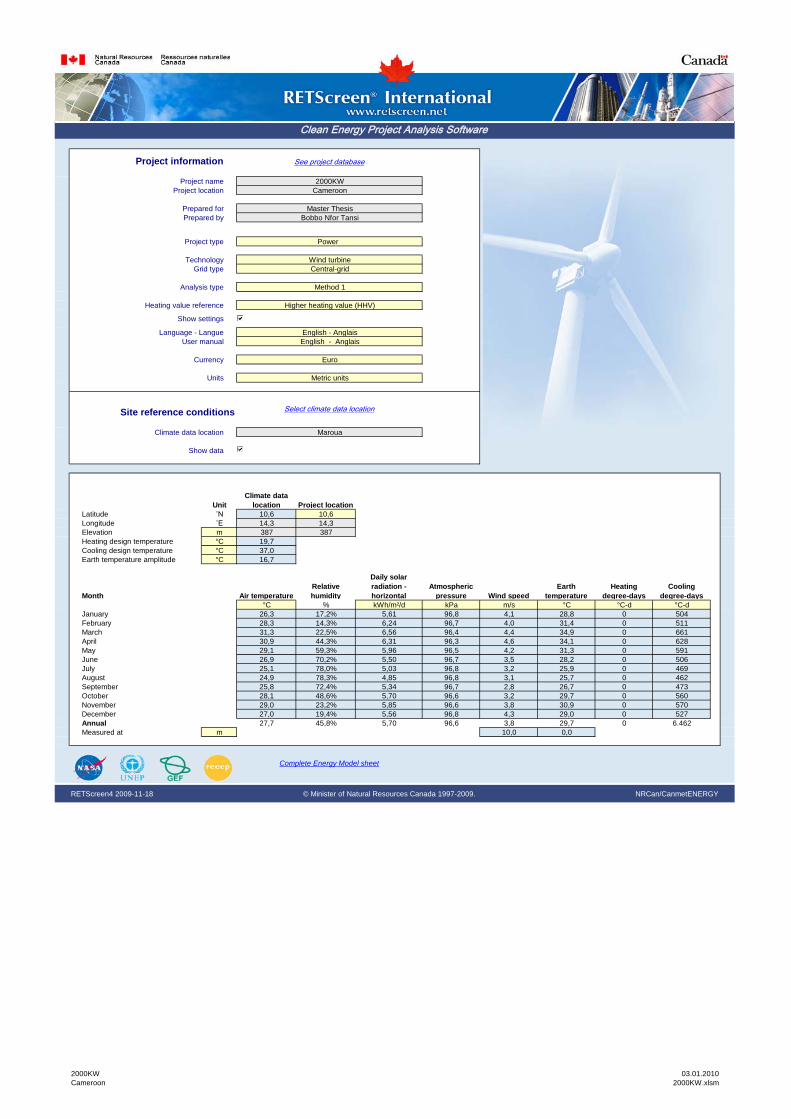
2000KWCameroon
03.01.20102000KW.xlsm
Project information
Project nameProject location
Prepared forPrepared by
Project type
TechnologyGrid type
Analysis type
Heating value reference
Show settings
Language - LangueUser manual
CurrencySymbol
Units
Climate data location
Show data
UnitClimate data
location Project locationLatitude ˚N 10,6 10,6Longitude ˚E 14,3 14,3Elevation m 387 387Heating design temperature °C 19,7Cooling design temperature °C 37,0Earth temperature amplitude °C 16,7
Month Air temperatureRelative humidity
Daily solar radiation - horizontal
Atmospheric pressure Wind speed
Earth temperature
Heatingdegree-days
Coolingdegree-days
°C % kWh/m²/d kPa m/s °C °C-d °C-dJanuary 26,3 17,2% 5,61 96,8 4,1 28,8 0 504February 28,3 14,3% 6,24 96,7 4,0 31,4 0 511March 31,3 22,5% 6,56 96,4 4,4 34,9 0 661April 30,9 44,3% 6,31 96,3 4,6 34,1 0 628May 29,1 59,3% 5,96 96,5 4,2 31,3 0 591June 26,9 70,2% 5,50 96,7 3,5 28,2 0 506July 25,1 78,0% 5,03 96,8 3,2 25,9 0 469August 24,9 78,3% 4,85 96,8 3,1 25,7 0 462September 25,8 72,4% 5,34 96,7 2,8 26,7 0 473October 28,1 48,6% 5,70 96,6 3,2 29,7 0 560November 29,0 23,2% 5,85 96,6 3,8 30,9 0 570December 27,0 19,4% 5,56 96,8 4,3 29,0 0 527Annual 27,7 45,8% 5,70 96,6 3,8 29,7 0 6.462Measured at m 10,0 0,0
RETScreen4 2009-11-18 © Minister of Natural Resources Canada 1997-2009. NRCan/CanmetENERGY
Clean Energy Project Analysis Software
Power
Site reference conditions
Cameroon
Master Thesis
Method 1
Higher heating value (HHV)
English - Anglais
Wind turbine
2000KW
Maroua
See project database
Select climate data location
Complete Energy Model sheet
English - Anglais
Euro
Metric units
Bobbo Nfor Tansi
Central-grid
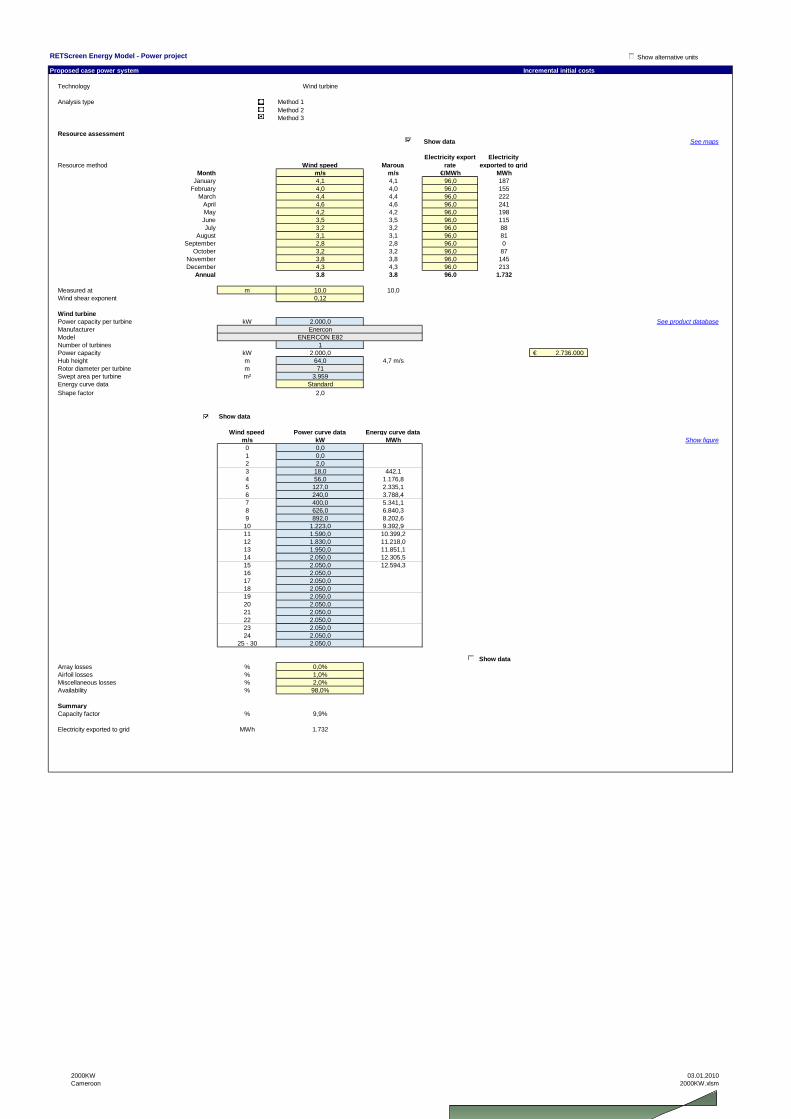
2000KWCameroon
03.01.20102000KW.xlsm
Incremental initial costs
Technology
Analysis type Method 1Method 2Method 3
Wind turbineResource assessmentResource method Wind speed Show data See maps
Resource method Wind speed MarouaElectricity export
rateElectricity
exported to gridMonth m/s m/s €/MWh MWh
January 4,1 4,1 96,0 187February 4,0 4,0 96,0 155
March 4,4 4,4 96,0 222April 4,6 4,6 96,0 241May 4,2 4,2 96,0 198June 3,5 3,5 96,0 115July 3,2 3,2 96,0 88
August 3,1 3,1 96,0 81September 2,8 2,8 96,0 0
October 3,2 3,2 96,0 87November 3,8 3,8 96,0 145December 4,3 4,3 96,0 213
Annual 3,8 3,8 96,0 1.732
Measured at m 10,0 10,0Wind shear exponent 0,12
Wind turbinePower capacity per turbine kW 2.000,0ManufacturerModelNumber of turbines 1Power capacity kW 2.000,0 2.736.000€ Hub height m 64,0 4,7 m/sRotor diameter per turbine m 71Swept area per turbine m² 3.959Energy curve data StandardShape factor 2,0
Show data
Wind speed Power curve data Energy curve datam/s kW MWh Show figure
0 0,01 0,02 2,03 18,0 442,14 56,0 1.176,85 127,0 2.335,16 240,0 3.788,47 400,0 5.341,18 626,0 6.840,39 892,0 8.202,610 1.223,0 9.392,911 1.590,0 10.399,212 1.830,0 11.218,013 1.950,0 11.851,114 2.050,0 12.305,515 2.050,0 12.594,316 2.050,017 2.050,018 2.050,019 2.050,020 2.050,021 2.050,022 2.050,023 2.050,024 2.050,0
25 - 30 2.050,0
Show dataArray losses % 0,0%Airfoil losses % 1,0% Unadjusted energy production MWh 1.999Miscellaneous losses % 2,0% Pressure coefficient 0,954Availability % 98,0% Temperature coefficient 0,958
Gross energy production MWh 1.732Summary Losses coefficient 0,95Capacity factor % 9,9% Specific yield kWh/m² 416Electricity delivered to load MWh 0Electricity exported to grid MWh 1.732
Fuel rate - proposed case power system €/MWh 0,00Electricity export rate €/MWh
Show alternative units
Proposed case power system
See product database
Per turbine
RETScreen Energy Model - Power project
Wind turbine
ENERCON E82Enercon

2000KWCameroon
03.01.20102000KW.xlsm
Emission Analysis
Base case electricity system (Baseline)
GHG emissionfactor
(excl. T&D)T&D
lossesGHG emission
factorCountry - region Fuel type tCO2/MWh % tCO2/MWhCameroon All types 0,039 8,0% 0,042
Electricity exported to grid MWh 1.732 T&D losses 8,0%
GHG emissionBase case tCO2 72,6Proposed case tCO2 5,8Gross annual GHG emission reduction tCO2 66,8GHG credits transaction fee % 0,0%Net annual GHG emission reduction tCO2 66,8 is equivalent to 28.718
GHG reduction incomeGHG reduction credit rate €/tCO2 0,00
Financial parametersInflation rate % 1,5%Project life yr 20Debt ratio % 10%Debt interest rate % 8,00%Debt term yr 15
Initial costsPower system € 2.736.000 96,5%other € 100.000 3,5%Total initial costs € 2.836.000 100,0%
Incentives and grants € 0 0,0%
Annual costs and debt paymentsO&M (savings) costs € 15.000Fuel cost - proposed case € 0Debt payments - 15 yrs € 33.133
€Total annual costs € 48.133
Annual savings and incomeFuel cost - base case € 0Electricity export income € 166.228
€Total annual savings and income € 166.228
Financial viabilityPre-tax IRR - equity % 1,6%Pre-tax IRR - assets % 0,6%Simple payback yr 18,8Equity payback yr 17,5
Financial Analysis
Litres of gasoline not consumed
Cumulative cash flows graph
Cum
ulat
ive
cash
flow
s (€
)
Year
-3.000.000
-2.500.000
-2.000.000
-1.500.000
-1.000.000
-500.000
0
500.000
1.000.000
0 1 2 3 4 5 6 7 8 9 10 11 12 13 14 15 16 17 18 19 20

2000WCameroun
03.01.20102000W.xlsm
Project information
Project nameProject location
Prepared forPrepared by
Project type
TechnologyGrid type
Analysis type
Heating value reference
Show settings
Language - LangueUser manual
CurrencySymbol
Units
Climate data location
Show data
UnitClimate data
location Project locationLatitude ˚N 9,3 9,3Longitude ˚E 13,4 13,4Elevation m 424 424Heating design temperature °C 19,4Cooling design temperature °C 35,6Earth temperature amplitude °C 15,8
Month Air temperatureRelative humidity
Daily solar radiation - horizontal
Atmospheric pressure Wind speed
Earth temperature
Heatingdegree-days
Coolingdegree-days
°C % kWh/m²/d kPa m/s °C °C-d °C-dJanuary 26,4 17,8% 6,07 96,3 3,8 28,8 0 507February 28,2 16,1% 6,36 96,2 3,8 31,1 0 509March 30,1 31,1% 6,50 96,0 4,1 33,2 0 623April 28,9 56,7% 6,24 96,0 4,3 31,0 0 566May 27,1 69,6% 5,78 96,2 3,9 28,3 0 530June 25,5 76,7% 5,37 96,3 3,3 26,2 0 464July 24,4 80,2% 4,94 96,4 3,1 25,0 0 445August 24,2 80,3% 4,83 96,4 2,9 24,9 0 441September 24,8 77,0% 5,16 96,4 2,7 25,5 0 445October 26,1 61,5% 5,70 96,3 3,0 27,1 0 500November 28,0 29,0% 6,17 96,2 3,5 29,6 0 539December 26,9 20,4% 5,93 96,3 4,0 28,8 0 525Annual 26,7 51,6% 5,75 96,3 3,5 28,3 0 6.094Measured at m 10,0 0,0
RETScreen4 2009-11-18 © Minister of Natural Resources Canada 1997-2009. NRCan/CanmetENERGY
Clean Energy Project Analysis Software
Power
Site reference conditions
Cameroun
Master Thesis
Method 1
Higher heating value (HHV)
English - Anglais
Photovoltaic
2000W
Garoua
See project database
Select climate data location
Complete Energy Model sheet
English - Anglais
Cameroon
Metric units
Bobbo Nfor Tansi
Isolated-grid
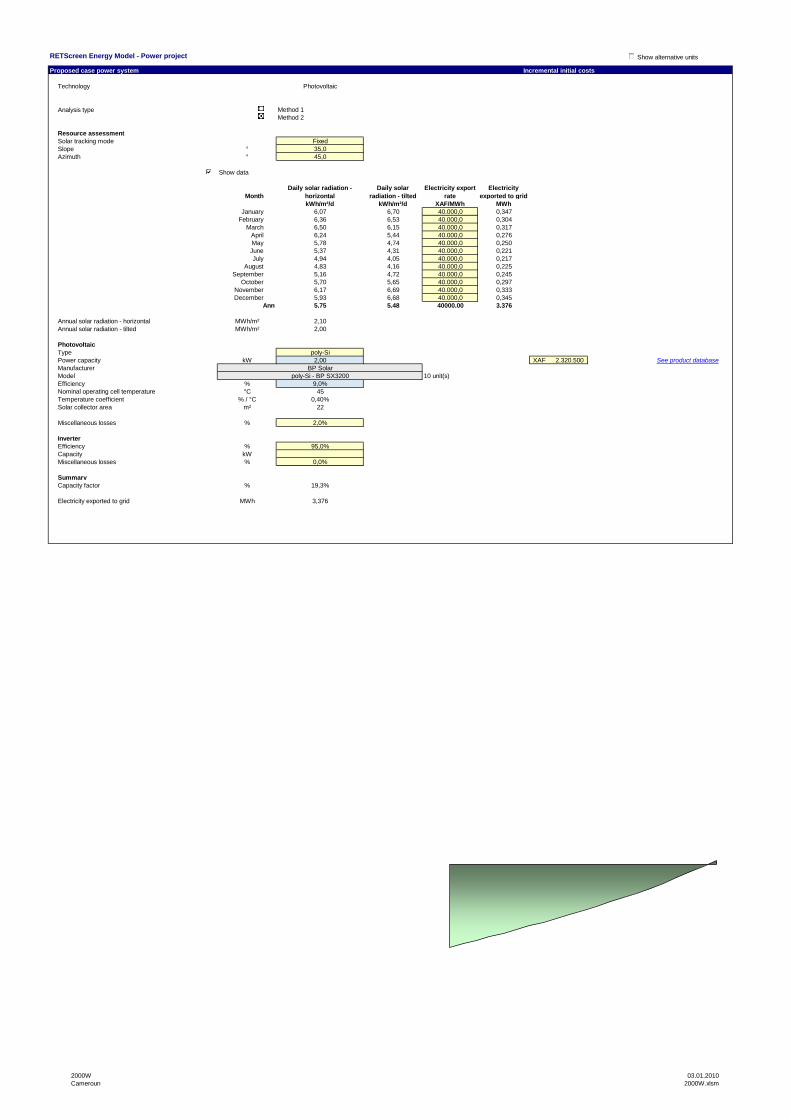
2000WCameroun
03.01.20102000W.xlsm
Incremental initial costs
Technology
Analysis type Method 1Method 2
PhotovoltaicResource assessmentSolar tracking mode FixedSlope ° 35,0Azimuth ° 45,0
Show data
MonthDaily solar radiation -
horizontalDaily solar
radiation - tiltedElectricity export
rateElectricity
exported to gridkWh/m²/d kWh/m²/d XAF/MWh MWh
January 6,07 6,70 40.000,0 0,347February 6,36 6,53 40.000,0 0,304
March 6,50 6,15 40.000,0 0,317April 6,24 5,44 40.000,0 0,276May 5,78 4,74 40.000,0 0,250June 5,37 4,31 40.000,0 0,221July 4,94 4,05 40.000,0 0,217
August 4,83 4,16 40.000,0 0,225September 5,16 4,72 40.000,0 0,245
October 5,70 5,65 40.000,0 0,297November 6,17 6,69 40.000,0 0,333December 5,93 6,68 40.000,0 0,345
Annu 5,75 5,48 40000,00 3,376
Annual solar radiation - horizontal MWh/m² 2,10Annual solar radiation - tilted MWh/m² 2,00
PhotovoltaicType poly-SiPower capacity kW 2,00 2.320.500XAF ManufacturerModel 10 unit(s)Efficiency % 9,0%Nominal operating cell temperature °C 45Temperature coefficient % / °C 0,40%Solar collector area m² 22Control methodMiscellaneous losses % 2,0%
InverterEfficiency % 95,0%Capacity kWMiscellaneous losses % 0,0%
SummaryCapacity factor % 19,3%Electricity delivered to load MWh 0,000Electricity exported to grid MWh 3,376
Fuel rate - proposed case power system XAF/MWh 0,00Electricity export rate XAF/MWh
Show alternative units
Proposed case power system
See product databaseBP Solar
poly-Si - BP SX3200
Maximum power point tracker
RETScreen Energy Model - Power project
Photovoltaic
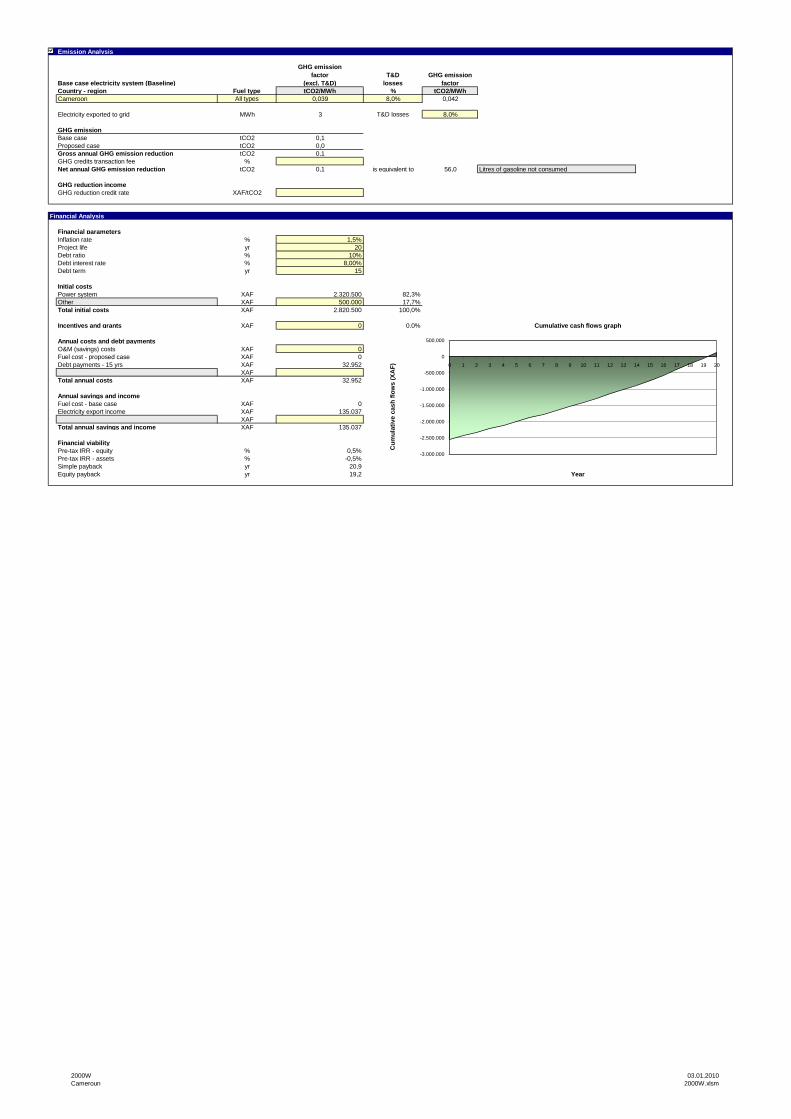
2000WCameroun
03.01.20102000W.xlsm
Emission Analysis
Base case electricity system (Baseline)
GHG emissionfactor
(excl. T&D)T&D
lossesGHG emission
factorCountry - region Fuel type tCO2/MWh % tCO2/MWhCameroon All types 0,039 8,0% 0,042
Electricity exported to grid MWh 3 T&D losses 8,0%
GHG emissionBase case tCO2 0,1Proposed case tCO2 0,0Gross annual GHG emission reduction tCO2 0,1GHG credits transaction fee %Net annual GHG emission reduction tCO2 0,1 is equivalent to 56,0
GHG reduction incomeGHG reduction credit rate XAF/tCO2
Financial parametersInflation rate % 1,5%Project life yr 20Debt ratio % 10%Debt interest rate % 8,00%Debt term yr 15
Initial costsPower system XAF 2.320.500 82,3%Other XAF 500.000 17,7%Total initial costs XAF 2.820.500 100,0%
Incentives and grants XAF 0 0,0%
Annual costs and debt paymentsO&M (savings) costs XAF 0Fuel cost - proposed case XAF 0Debt payments - 15 yrs XAF 32.952
XAFTotal annual costs XAF 32.952
Annual savings and incomeFuel cost - base case XAF 0Electricity export income XAF 135.037
XAFTotal annual savings and income XAF 135.037
Financial viabilityPre-tax IRR - equity % 0,5%Pre-tax IRR - assets % -0,5%Simple payback yr 20,9Equity payback yr 19,2
Financial Analysis
Litres of gasoline not consumed
Cumulative cash flows graph
Cum
ulat
ive
cash
flow
s (X
AF)
Year
-3.000.000
-2.500.000
-2.000.000
-1.500.000
-1.000.000
-500.000
0
500.000
0 1 2 3 4 5 6 7 8 9 10 11 12 13 14 15 16 17 18 19 20