master planning ohio’s fastest growing county water cover · master planning ohio’s fastest...
TRANSCRIPT

Delaware County Regional Sewer District OWEA Annual Conference June 28, 2017
Master Planning Ohio’s Fastest Growing County
DELAWARE COUNTY• Fastest growing County in Ohio
• Healthiest County in Ohio
• 2nd Happiest County in USA
• Wealthiest County in Ohio
• Most Educated County (>60% bachelor’s degree)
OWEA 2017 Annual Conference

REGIONAL SEWER DISTRICT• Discharge to 4 watersheds that include
drinking water supply sources, scenic rivers and recreational lakes
• Alum Creek• O’Shaughnessy Reservoir • Hoover Reservoir • Olentangy River
• 3 Water Reclamation Facilities• Alum Creek• OECC• Lower Scioto
• 3 land application/beneficial reuse facilities• Tartan Fields• Scioto Reserve• North Star
• 3 Small Package Plants
• Separate Sewers - Over 500 Miles of Sewers, 24 Pump Stations, and 10,000 Manholes
• Annual Budget of Over $22 Million
• 60 Operators, 10 Engineers, 5 Inspectors and 4 Administrative
• 0 overflows last year
• 33,000 Customers on the System
• Sewer Rates = $32/Month Flat Fee
OWEA 2017 Annual Conference
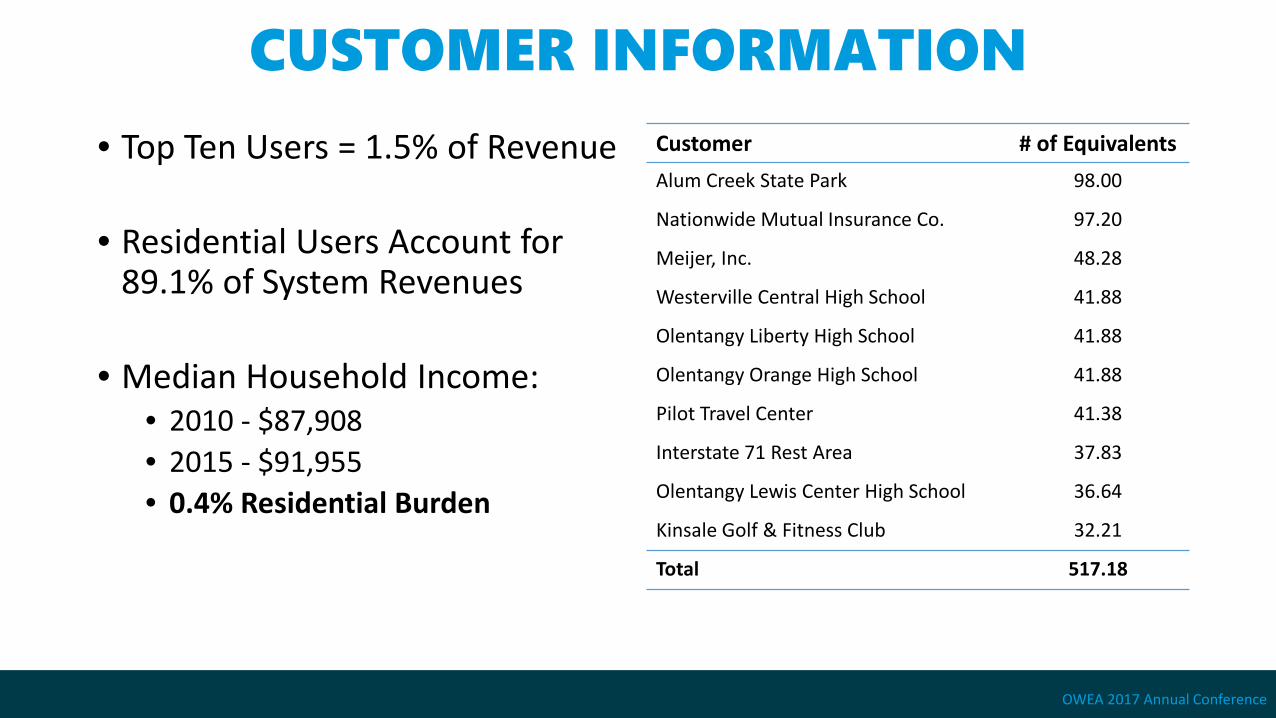
CUSTOMER INFORMATION• Top Ten Users = 1.5% of Revenue
• Residential Users Account for 89.1% of System Revenues
• Median Household Income:• 2010 - $87,908• 2015 - $91,955• 0.4% Residential Burden
Customer # of EquivalentsAlum Creek State Park 98.00
Nationwide Mutual Insurance Co. 97.20
Meijer, Inc. 48.28
Westerville Central High School 41.88
Olentangy Liberty High School 41.88
Olentangy Orange High School 41.88
Pilot Travel Center 41.38
Interstate 71 Rest Area 37.83
Olentangy Lewis Center High School 36.64
Kinsale Golf & Fitness Club 32.21
Total 517.18
OWEA 2017 Annual Conference

OWEA 2017 Annual Conference
REGIONAL SEWER DISTRICT
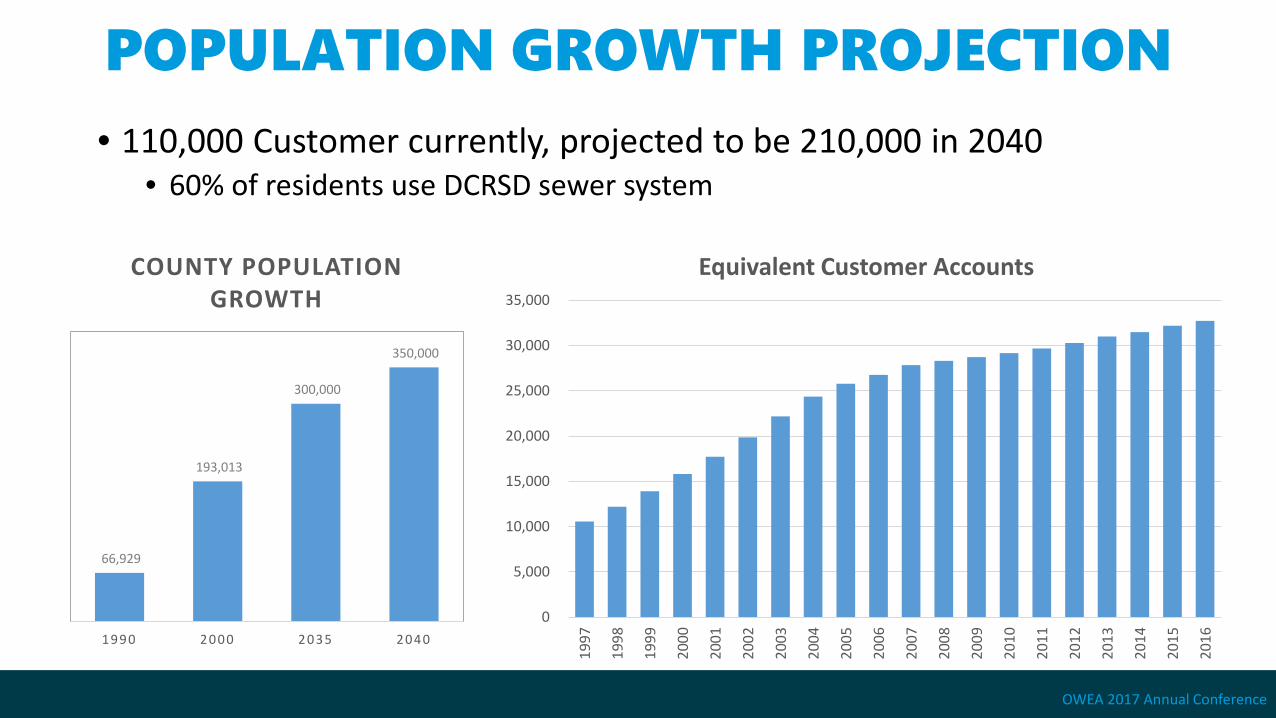
POPULATION GROWTH PROJECTION• 110,000 Customer currently, projected to be 210,000 in 2040
• 60% of residents use DCRSD sewer system
66,929
193,013
300,000
350,000
1990 2000 2035 2040
COUNTY POPULATION GROWTH
0
5,000
10,000
15,000
20,000
25,000
30,000
35,000
1997
1998
1999
2000
2001
2002
2003
2004
2005
2006
2007
2008
2009
2010
2011
2012
2013
2014
2015
2016
Equivalent Customer Accounts
OWEA 2017 Annual Conference

OWEA 2017 Annual Conference
EXISTING SYSTEM PROJECTS
OWEA 2017 Annual Conference
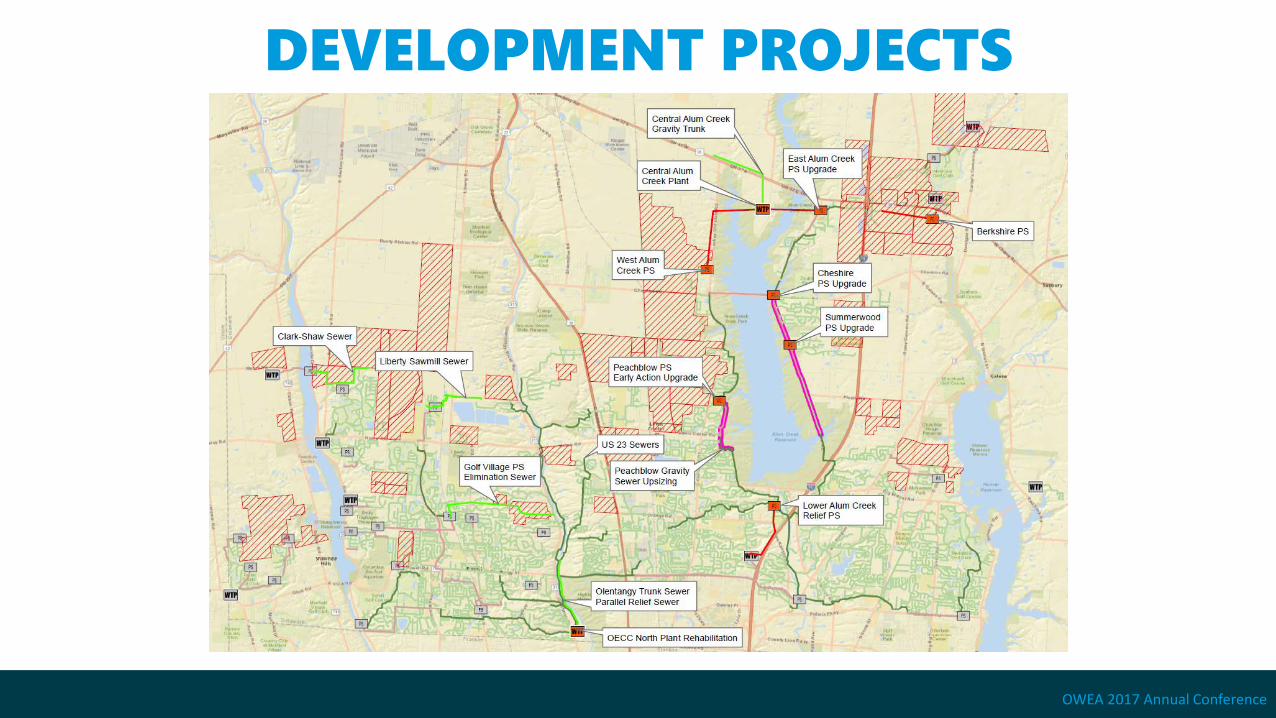
DEVELOPMENT PROJECTS
OWEA 2017 Annual Conference
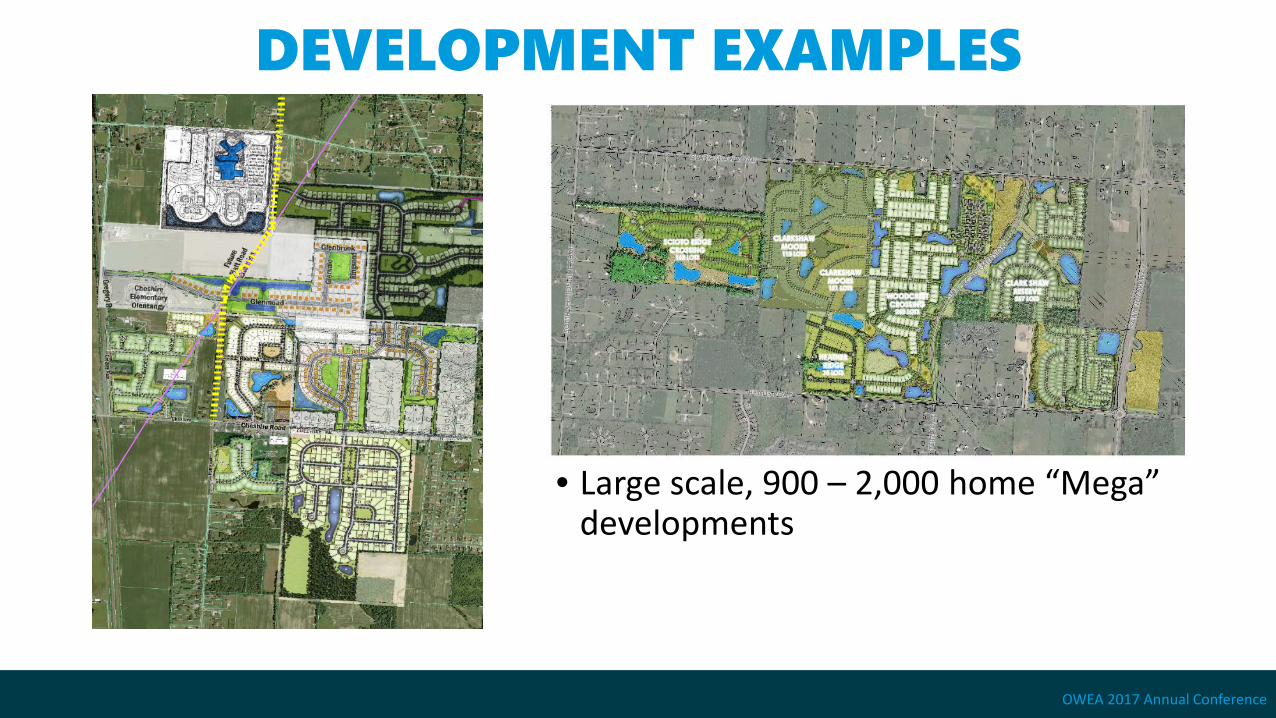
• Large scale, 900 – 2,000 home “Mega” developments
DEVELOPMENT EXAMPLES
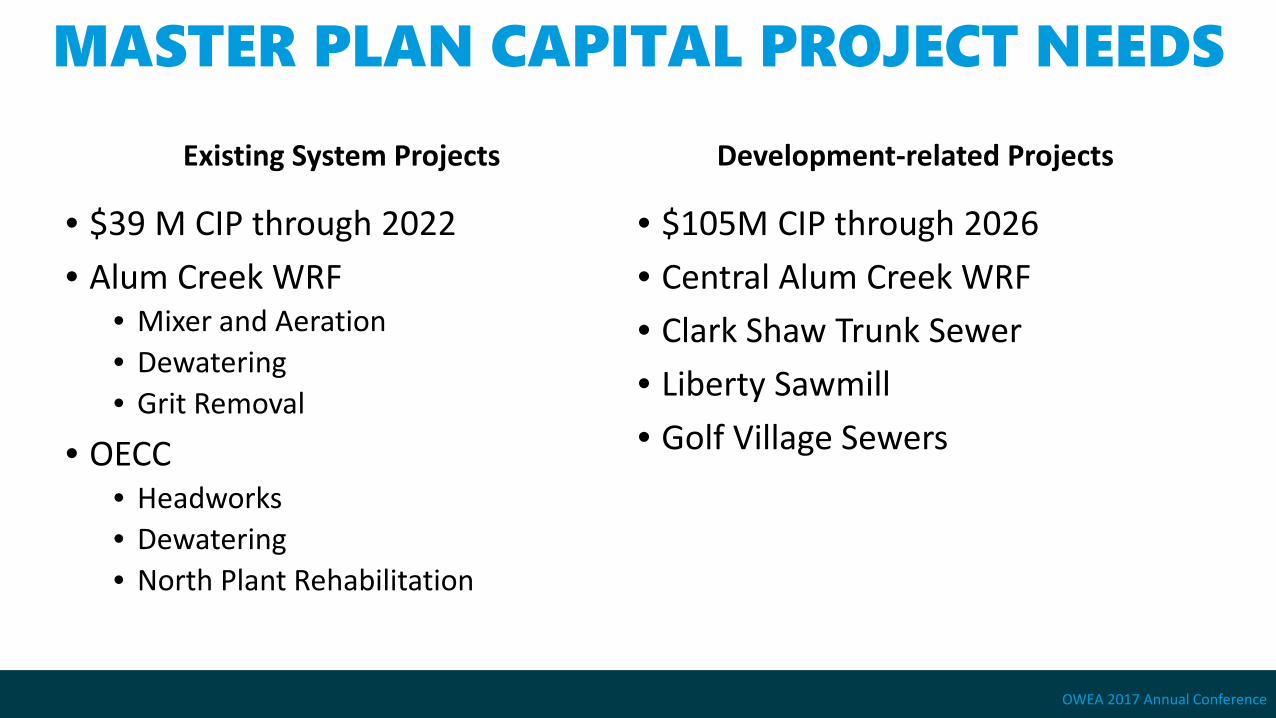
MASTER PLAN CAPITAL PROJECT NEEDS
Existing System Projects
• $39 M CIP through 2022• Alum Creek WRF
• Mixer and Aeration• Dewatering• Grit Removal
• OECC• Headworks• Dewatering• North Plant Rehabilitation
Development-related Projects
• $105M CIP through 2026• Central Alum Creek WRF• Clark Shaw Trunk Sewer• Liberty Sawmill• Golf Village Sewers
OWEA 2017 Annual Conference
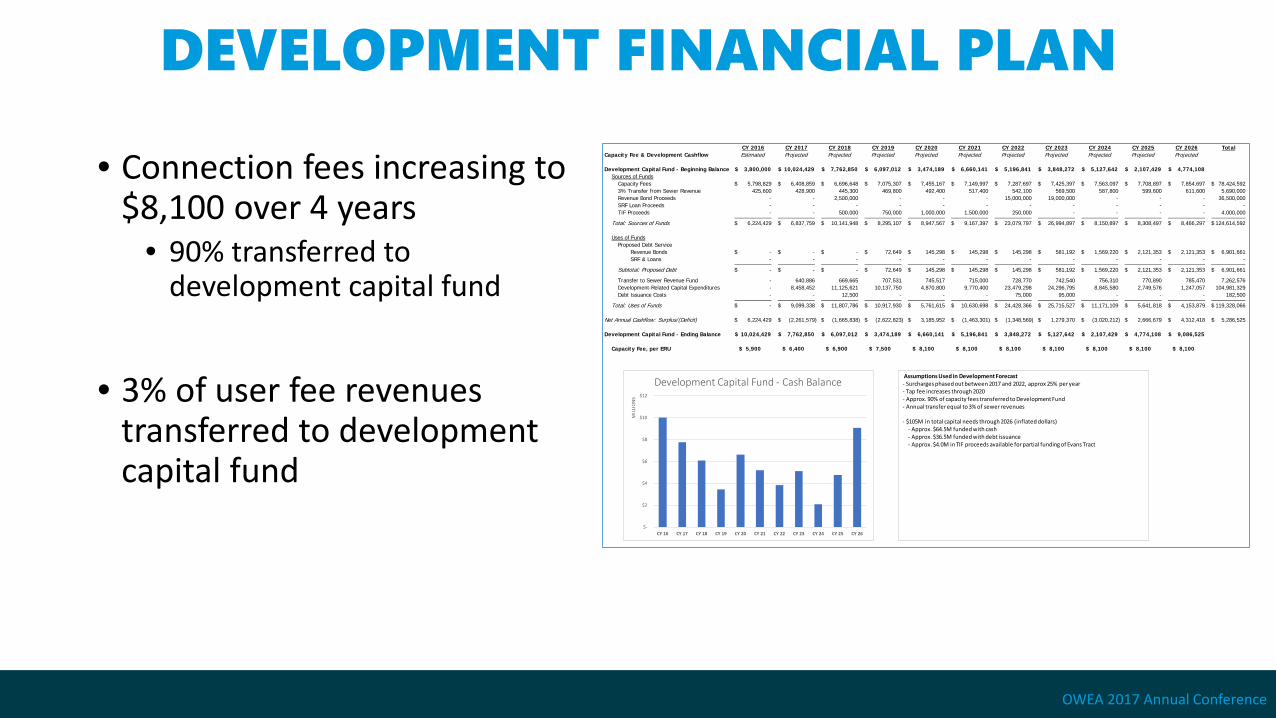
DEVELOPMENT FINANCIAL PLAN
• Connection fees increasing to $8,100 over 4 years
• 90% transferred to development capital fund
• 3% of user fee revenues transferred to development capital fund
OWEA 2017 Annual Conference
CY 2016 CY 2017 CY 2018 CY 2019 CY 2020 CY 2021 CY 2022 CY 2023 CY 2024 CY 2025 CY 2026 TotalCapacity Fee & Development Cashflow Estimated Projected Projected Projected Projected Projected Projected Projected Projected Projected Projected
Development Capital Fund - Beginning Balance 3,800,000$ 10,024,429$ 7,762,850$ 6,097,012$ 3,474,189$ 6,660,141$ 5,196,841$ 3,848,272$ 5,127,642$ 2,107,429$ 4,774,108$ Sources of Funds
Capacity Fees 5,798,829$ 6,408,859$ 6,696,648$ 7,075,307$ 7,455,167$ 7,149,997$ 7,287,697$ 7,425,397$ 7,563,097$ 7,708,897$ 7,854,697$ 78,424,592$ 3% Transfer from Sewer Revenue 425,600 428,900 445,300 469,800 492,400 517,400 542,100 569,500 587,800 599,600 611,600 5,690,000 Revenue Bond Proceeds - - 2,500,000 - - - 15,000,000 19,000,000 - - - 36,500,000 SRF Loan Proceeds - - - - - - - - - - - - TIF Proceeds - - 500,000 750,000 1,000,000 1,500,000 250,000 - - - - 4,000,000
Total: Sources of Funds 6,224,429$ 6,837,759$ 10,141,948$ 8,295,107$ 8,947,567$ 9,167,397$ 23,079,797$ 26,994,897$ 8,150,897$ 8,308,497$ 8,466,297$ 124,614,592$
Uses of FundsProposed Debt Service
Revenue Bonds -$ -$ -$ 72,649$ 145,298$ 145,298$ 145,298$ 581,192$ 1,569,220$ 2,121,353$ 2,121,353$ 6,901,661$ SRF & Loans - - - - - - - - - - - -
Subtotal: Proposed Debt -$ -$ -$ 72,649$ 145,298$ 145,298$ 145,298$ 581,192$ 1,569,220$ 2,121,353$ 2,121,353$ 6,901,661$
Transfer to Sewer Revenue Fund - 640,886 669,665 707,531 745,517 715,000 728,770 742,540 756,310 770,890 785,470 7,262,576 Development-Related Capital Expenditures - 8,458,452 11,125,621 10,137,750 4,870,800 9,770,400 23,479,298 24,296,795 8,845,580 2,749,576 1,247,057 104,981,329 Debt Issuance Costs - - 12,500 - - - 75,000 95,000 - - - 182,500
Total: Uses of Funds -$ 9,099,338$ 11,807,786$ 10,917,930$ 5,761,615$ 10,630,698$ 24,428,366$ 25,715,527$ 11,171,109$ 5,641,818$ 4,153,879$ 119,328,066$
Net Annual Cashflow: Surplus/(Deficit) 6,224,429$ (2,261,579)$ (1,665,838)$ (2,622,823)$ 3,185,952$ (1,463,301)$ (1,348,569)$ 1,279,370$ (3,020,212)$ 2,666,679$ 4,312,418$ 5,286,525$
Development Capital Fund - Ending Balance 10,024,429$ 7,762,850$ 6,097,012$ 3,474,189$ 6,660,141$ 5,196,841$ 3,848,272$ 5,127,642$ 2,107,429$ 4,774,108$ 9,086,525$
Capacity Fee, per ERU $ 5,900 $ 6,400 $ 6,900 $ 7,500 $ 8,100 $ 8,100 $ 8,100 $ 8,100 $ 8,100 $ 8,100 $ 8,100
$-
$2
$4
$6
$8
$10
$12
CY 16 CY 17 CY 18 CY 19 CY 20 CY 21 CY 22 CY 23 CY 24 CY 25 CY 26
MIL
LIO
NS
Development Capital Fund - Cash BalanceAssumptions Used in Development Forecast- Surcharges phased out between 2017 and 2022, approx 25% per year - Tap fee increases through 2020- Approx. 90% of capacity fees transferred to Development Fund- Annual transfer equal to 3% of sewer revenues
- $105M in total capital needs through 2026 (inflated dollars)- Approx. $64.5M funded with cash- Approx. $36.5M funded with debt issuance - Approx. $4.0M in TIF proceeds available for partial funding of Evans Tract

HOW DO WE FUND $150M IN CAPITAL PROJECTS?

UTILITY FINANCIAL PLANNING• As an enterprise fund, the utility must run like a self-supporting
business• Scale of operations, infrastructure, and investment requires
thoughtful planning for needs for existing and future customers
Objective: Balance system reliability, sustainability and financial integrity with customer costs & impacts
OWEA 2017 Annual Conference
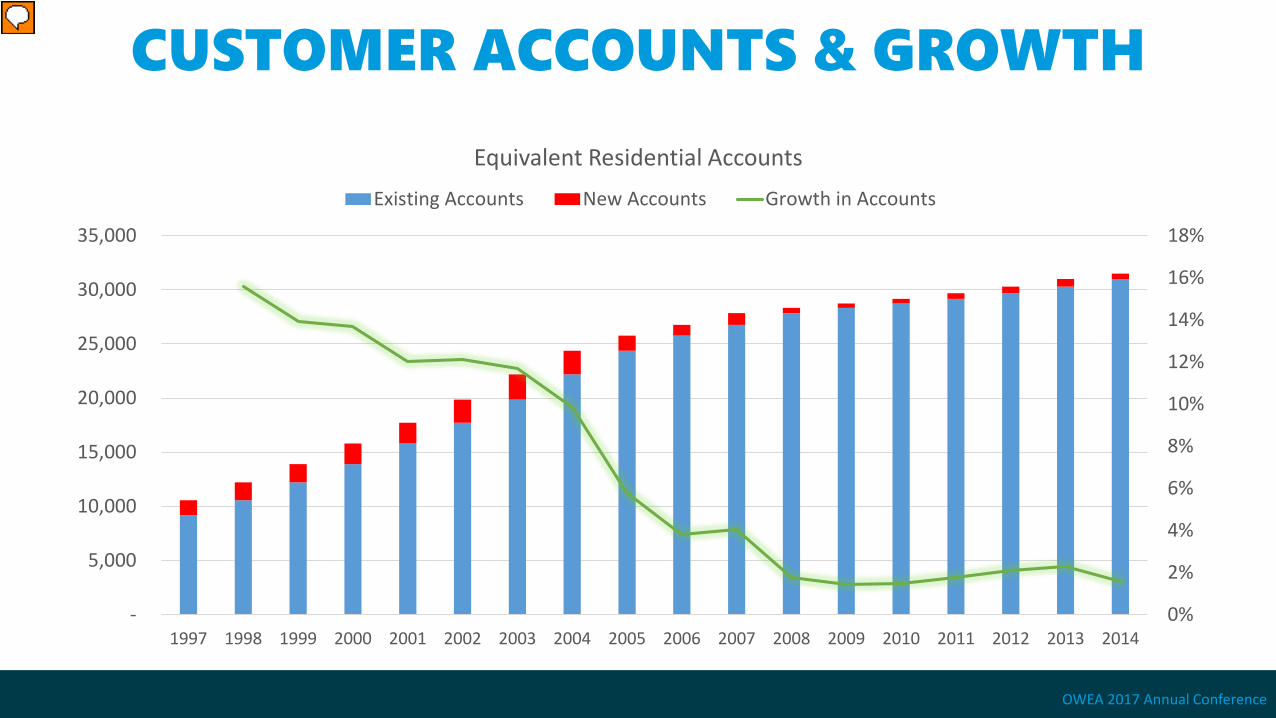
CUSTOMER ACCOUNTS & GROWTH
0%
2%
4%
6%
8%
10%
12%
14%
16%
18%
-
5,000
10,000
15,000
20,000
25,000
30,000
35,000
1997 1998 1999 2000 2001 2002 2003 2004 2005 2006 2007 2008 2009 2010 2011 2012 2013 2014
Equivalent Residential AccountsExisting Accounts New Accounts Growth in Accounts
OWEA 2017 Annual Conference
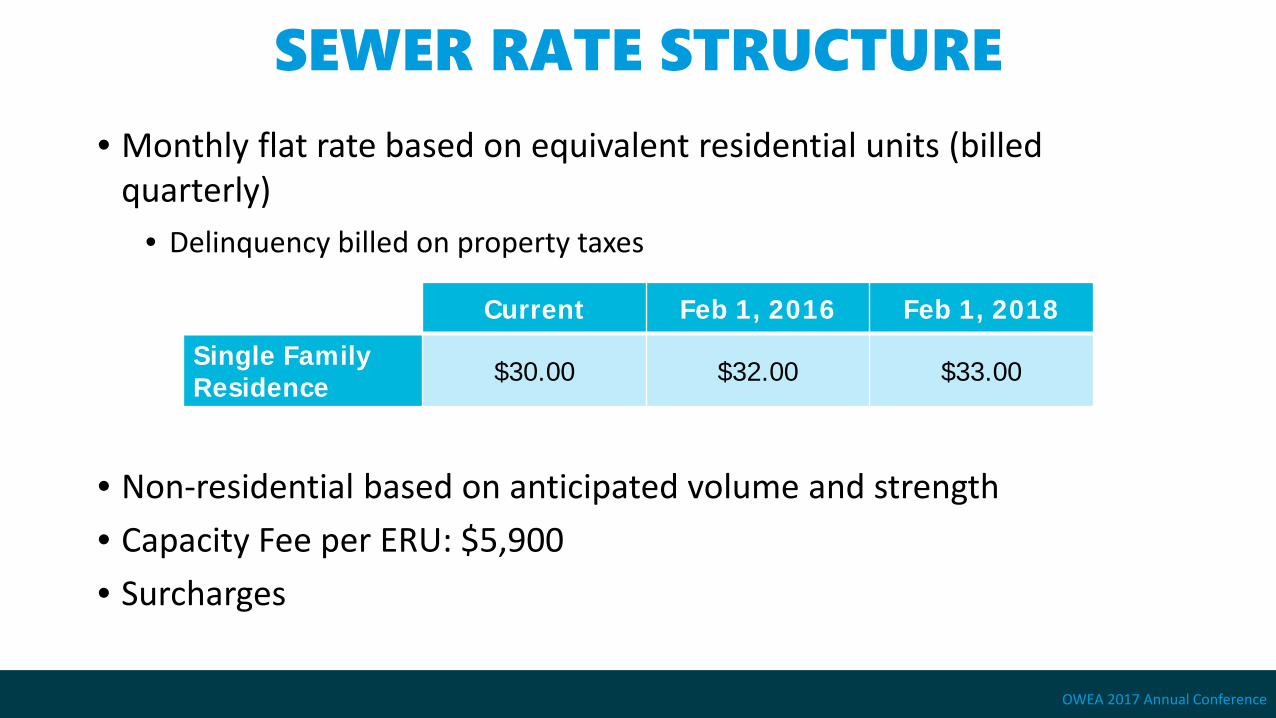
SEWER RATE STRUCTURE• Monthly flat rate based on equivalent residential units (billed
quarterly)• Delinquency billed on property taxes
• Non-residential based on anticipated volume and strength• Capacity Fee per ERU: $5,900• Surcharges
Current Feb 1, 2016 Feb 1, 2018Single Family Residence $30.00 $32.00 $33.00
OWEA 2017 Annual Conference

CAPACITY FEES• Capacity fees should recover:
• Cost of capital investment already made (System Buy-in)• Capital costs yet to be made (Marginal Incremental)
• Calculation based on:• Value of fixed assets and anticipated CIP• System capacity • Assumed gpd per new connection
• Defensibility is key!
$- $0.5 $1.0 $1.5 $2.0 $2.5 $3.0 $3.5
2010 2011 2012 2013 2014 2015
Mill
ions
Capacity Fee Revenue
OWEA 2017 Annual Conference

Multi-year Financial PlanRate/Revenue Adjustment Forecast
Financial Policies•Reserve Levels•Coverage Ratios
Revenues•Operating•Non-Operating
Expenses•O&M•Capital•Debt
• Cost increases primarily driven by expansion-related capital needs
• Revenues based on customer accounts and growth projections
• Financial policies can help guide the balancing process
OWEA 2017 Annual Conference
UTILITY FINANCIAL PLANNING

OPERATING FINANCIAL PLAN • Moderate growth in customer
accounts• Monthly rate increases
approved through 2024 • $39/month flat rate, average 3%
annually
• 3% of user revenues and 90% of capacity fees transferred to development capital fund
OWEA 2017 Annual Conference
Delaware Co. Regional Sewer DistrictFinancial Planning ModelCashflow Worksheet
CY 2015 CY 2016 CY 2017 CY 2018 CY 2019 CY 2020 CY 2021 CY 2022 CY 2023 CY 2024 CY 2025 CY 2026 TotalAnnual Cashflow Actual Actual Budget Projected Projected Projected Projected Projected Projected Projected Projected Projected
System RevenuesUser Charges 13,461,126$ 14,187,500$ 14,296,961$ 14,844,050$ 15,661,113$ 16,414,845$ 17,249,319$ 18,072,244$ 18,985,629$ 19,594,798$ 19,988,759$ 20,387,776$ 203,144,120$ Capacity Fees 5,696,507 5,798,829 6,408,859 6,696,648 7,075,307 7,455,167 7,149,997 7,287,697 7,425,397 7,563,097 7,708,897 7,854,697 84,121,099 Miscellaneous Revenue 1,750,155 1,260,450 1,291,661 1,322,999 1,354,431 1,386,000 1,417,042 1,448,787 1,481,316 1,514,634 1,548,709 1,583,586 17,359,770
Total: System Revenues 20,907,789$ 21,246,779$ 21,997,481$ 22,863,696$ 24,090,852$ 25,256,012$ 25,816,358$ 26,808,729$ 27,892,342$ 28,672,528$ 29,246,365$ 29,826,060$ 304,624,990$ 18.03% 1.62% 3.53% 3.94% 5.37% 4.84% 2.22% 3.84% 4.04% 2.80% 2.00% 1.98%
System ExpendituresOperating Expenses
Salary 3,240,204$ 3,538,031$ 3,695,000$ 3,787,375$ 3,882,059$ 4,076,162$ 4,279,970$ 4,493,969$ 4,718,667$ 4,954,601$ 5,202,331$ 5,462,447$ 51,330,818$ Benefits 1,519,892 1,657,630 1,767,000 1,873,020 1,985,401 2,144,233 2,315,772 2,501,034 2,701,116 2,917,206 3,150,582 3,402,629 27,935,515 Materials And Supplies 1,203,383 1,162,168 1,414,530 1,428,675 1,442,962 1,457,392 1,471,966 1,486,685 1,501,552 1,516,568 1,531,733 1,547,051 17,164,665 Services And Charges 3,067,337 3,353,633 3,523,000 3,558,230 3,593,812 3,629,750 3,666,048 3,702,708 3,739,735 3,777,133 3,814,904 3,853,053 43,279,345
Subtotal: Operating Expenses 9,030,816$ 9,711,463$ 10,399,530$ 10,647,300$ 10,904,235$ 11,307,538$ 11,733,756$ 12,184,396$ 12,661,071$ 13,165,507$ 13,699,550$ 14,265,180$ 139,710,343$ 7.79% 7.54% 7.09% 2.38% 2.41% 3.70% 3.77% 3.84% 3.91% 3.98% 4.06% 4.13%
Non-Operating ExpensesExisting Debt Service 3,865,163$ 3,861,864$ 3,863,313$ 3,865,338$ 3,866,488$ 3,867,763$ 3,864,863$ 3,861,638$ 3,866,638$ 801,238$ 803,038$ 799,038$ 37,186,376$
Proposed Debt Service -$ -$ -$ -$ 72,649$ 531,769$ 918,240$ 918,240$ 1,354,134$ 2,342,162$ 2,894,294$ 2,894,294$ 11,925,782$
Transfer to O&M Capital Fund 1,500,000 1,500,000 1,500,000 2,000,000 2,000,000 2,000,000 2,000,000 2,500,000 2,000,000 4,000,000 5,000,000 6,000,000 32,000,000$ Annual Capital Outlays 2,515,000 2,074,500 1,319,500 1,121,575 953,339 810,338 688,787 585,469 497,649 491,921 516,517 542,343 3% Transfer to Development Capital Fund - 425,600 428,900 445,300 469,800 492,400 517,400 542,100 569,500 587,800 599,600 611,600 6,094,300
Subtotal: Non-Operating Expenses 7,880,163$ 7,861,964$ 7,111,713$ 7,432,213$ 7,362,275$ 7,702,269$ 7,989,290$ 8,407,447$ 8,287,921$ 8,223,120$ 9,813,449$ 10,847,275$ 87,206,458$
Total: System Expenditures 16,910,978$ 17,573,426$ 17,511,243$ 18,079,513$ 18,266,510$ 19,009,807$ 19,723,046$ 20,591,843$ 20,948,992$ 21,388,627$ 23,512,999$ 25,112,455$ 226,916,801$
Net A nnual Cashflow: Surplus/ (Deficit ) 3,996,810$ 3,673,352$ 4,486,238$ 4,784,184$ 5,824,341$ 6,246,205$ 6,093,312$ 6,216,886$ 6,943,350$ 7,283,902$ 5,733,366$ 4,713,605$ 77,708,189$
Transfer to Capacity Fee Fund - (5,798,829) (5,767,973) (6,026,983) (6,367,776) (6,709,650) (6,434,997) (6,558,927) (6,682,857) (6,806,787) (6,938,007) (7,069,227) (71,162,015)$ Debt Funded with Development Fees - - - - 72,649 145,298 145,298 145,298 581,192 1,569,220 2,121,353 2,121,353 6,901,661
Net Cash Flow - Sewer Revenue Fund 3,996,810$ (2,125,476)$ (1,281,735)$ (1,242,800)$ (470,786)$ (318,147)$ (196,387)$ (196,744)$ 841,685$ 2,046,334$ 916,711$ (234,270)$ 13,447,834$
Sewer User Fee, per ERU $ 30.00 $ 32.00 $ 32.00 $ 33.00 $ 34.00 $ 35.10 $ 36.20 $ 37.30 $ 38.50 $ 39.00 $ 39.00 $ 39.00Capacity Fee, per ERU $ 5,900 $ 5,900 $ 6,400 $ 6,900 $ 7,500 $ 8,100 $ 8,100 $ 8,100 $ 8,100 $ 8,100 $ 8,100 $ 8,100
Reserve Fund Balances Fund TypeSewer Revenue Fund 662 Unrestricted 9,091,522$ 8,798,591$ 7,516,856$ 6,274,056$ 5,803,270$ 5,485,123$ 5,288,736$ 5,091,993$ 5,933,678$ 7,980,012$ 8,896,723$ 8,662,453$ O&M Capital Fund (1) 666 Unrestricted 6,512,779 14,207,164 12,800,164 11,295,264 5,733,365 7,583,365 6,472,605 2,486,494 4,486,494 8,486,494 13,486,494 19,486,494 Development Capital Fund (1) 667 Unrestricted - 10,024,429 7,762,850 6,097,012 3,474,189 6,660,141 5,196,841 3,848,272 5,127,642 2,107,429 4,774,108 9,086,525 Replacement Fund 665 Restricted 1,000,000 1,000,000 1,000,000 1,000,000 1,000,000 1,000,000 1,000,000 1,000,000 1,000,000 1,000,000 1,000,000 1,000,000 Bond Reserve Fund 664 Restricted 3,862,374 3,897,748 3,917,188 3,936,725 3,956,360 3,976,093 3,995,924 4,015,854 4,035,883 4,056,013 4,076,243 4,096,573
Total: Cash Reserve Fund Balance 20,466,675$ 37,927,931$ 32,997,057$ 28,603,057$ 19,967,184$ 24,704,722$ 21,954,106$ 16,442,612$ 20,583,697$ 23,629,948$ 32,233,567$ 42,332,046$ Net: Unrestricted Cash Balance 15,604,301 33,030,183 28,079,869 23,666,332 15,010,824 19,728,629 16,958,182 11,426,758 15,547,813 18,573,935 27,157,325 37,235,473
Days Cash on Hand 631 1,241 986 811 502 637 528 342 448 515 724 953 SRF Days Cash on Hand 367 331 264 215 194 177 165 153 171 221 237 222
$-
$5
$10
$15
$20
$25
CY 16 CY 17 CY 18 CY 19 CY 20 CY 21 CY 22 CY 23 CY 24 CY 25 CY 26
MIL
LIO
NS
Operating Cash Flow(Excludes Capacity Fee Revenue)
Operating Expenses Existing Debt ServiceProposed Debt Service Transfers to Capital FundsProjected Revenue
$-
$5
$10
$15
$20
$25
$30
$35
$40
$45
CY 16 CY 17 CY 18 CY 19 CY 20 CY 21 CY 22 CY 23 CY 24 CY 25 CY 26
MIL
LIO
NS
Cash BalanceUnrestricted Cash Restricted Cash Target Min
Financial Plan Assumptions
Customer Growth- 750 Residential ERUs added annually (2016-2020), 2.25% annualgrowth beyond 2020- 1.25% annual growth in commercial accounts
Unrestricted Cash Fund Balance Minimum: 360 Days of O&M Expenses
Development Capital Fund- Annual transfer equal to 3% of sewer revenues- Approx. 90% of capacity fees transferred to development fund
Operating Expenses increase by approx. 3.6% annually, based on estimated 2017 expenses
(1) Capital fund balances exclude debt proceeds

DEVELOPMENT FINANCIAL PLAN
• Connection fees increasing to $8,100 over 4 years
• 90% transferred to development capital fund
• 3% of user fee revenues transferred to development capital fund
OWEA 2017 Annual Conference
CY 2016 CY 2017 CY 2018 CY 2019 CY 2020 CY 2021 CY 2022 CY 2023 CY 2024 CY 2025 CY 2026 TotalCapacity Fee & Development Cashflow Estimated Projected Projected Projected Projected Projected Projected Projected Projected Projected Projected
Development Capital Fund - Beginning Balance 3,800,000$ 10,024,429$ 7,762,850$ 6,097,012$ 3,474,189$ 6,660,141$ 5,196,841$ 3,848,272$ 5,127,642$ 2,107,429$ 4,774,108$ Sources of Funds
Capacity Fees 5,798,829$ 6,408,859$ 6,696,648$ 7,075,307$ 7,455,167$ 7,149,997$ 7,287,697$ 7,425,397$ 7,563,097$ 7,708,897$ 7,854,697$ 78,424,592$ 3% Transfer from Sewer Revenue 425,600 428,900 445,300 469,800 492,400 517,400 542,100 569,500 587,800 599,600 611,600 5,690,000 Revenue Bond Proceeds - - 2,500,000 - - - 15,000,000 19,000,000 - - - 36,500,000 SRF Loan Proceeds - - - - - - - - - - - - TIF Proceeds - - 500,000 750,000 1,000,000 1,500,000 250,000 - - - - 4,000,000
Total: Sources of Funds 6,224,429$ 6,837,759$ 10,141,948$ 8,295,107$ 8,947,567$ 9,167,397$ 23,079,797$ 26,994,897$ 8,150,897$ 8,308,497$ 8,466,297$ 124,614,592$
Uses of FundsProposed Debt Service
Revenue Bonds -$ -$ -$ 72,649$ 145,298$ 145,298$ 145,298$ 581,192$ 1,569,220$ 2,121,353$ 2,121,353$ 6,901,661$ SRF & Loans - - - - - - - - - - - -
Subtotal: Proposed Debt -$ -$ -$ 72,649$ 145,298$ 145,298$ 145,298$ 581,192$ 1,569,220$ 2,121,353$ 2,121,353$ 6,901,661$
Transfer to Sewer Revenue Fund - 640,886 669,665 707,531 745,517 715,000 728,770 742,540 756,310 770,890 785,470 7,262,576 Development-Related Capital Expenditures - 8,458,452 11,125,621 10,137,750 4,870,800 9,770,400 23,479,298 24,296,795 8,845,580 2,749,576 1,247,057 104,981,329 Debt Issuance Costs - - 12,500 - - - 75,000 95,000 - - - 182,500
Total: Uses of Funds -$ 9,099,338$ 11,807,786$ 10,917,930$ 5,761,615$ 10,630,698$ 24,428,366$ 25,715,527$ 11,171,109$ 5,641,818$ 4,153,879$ 119,328,066$
Net Annual Cashflow: Surplus/(Deficit) 6,224,429$ (2,261,579)$ (1,665,838)$ (2,622,823)$ 3,185,952$ (1,463,301)$ (1,348,569)$ 1,279,370$ (3,020,212)$ 2,666,679$ 4,312,418$ 5,286,525$
Development Capital Fund - Ending Balance 10,024,429$ 7,762,850$ 6,097,012$ 3,474,189$ 6,660,141$ 5,196,841$ 3,848,272$ 5,127,642$ 2,107,429$ 4,774,108$ 9,086,525$
Capacity Fee, per ERU $ 5,900 $ 6,400 $ 6,900 $ 7,500 $ 8,100 $ 8,100 $ 8,100 $ 8,100 $ 8,100 $ 8,100 $ 8,100
$-
$2
$4
$6
$8
$10
$12
CY 16 CY 17 CY 18 CY 19 CY 20 CY 21 CY 22 CY 23 CY 24 CY 25 CY 26
MIL
LIO
NS
Development Capital Fund - Cash BalanceAssumptions Used in Development Forecast- Surcharges phased out between 2017 and 2022, approx 25% per year - Tap fee increases through 2020- Approx. 90% of capacity fees transferred to Development Fund- Annual transfer equal to 3% of sewer revenues
- $105M in total capital needs through 2026 (inflated dollars)- Approx. $64.5M funded with cash- Approx. $36.5M funded with debt issuance - Approx. $4.0M in TIF proceeds available for partial funding of Evans Tract
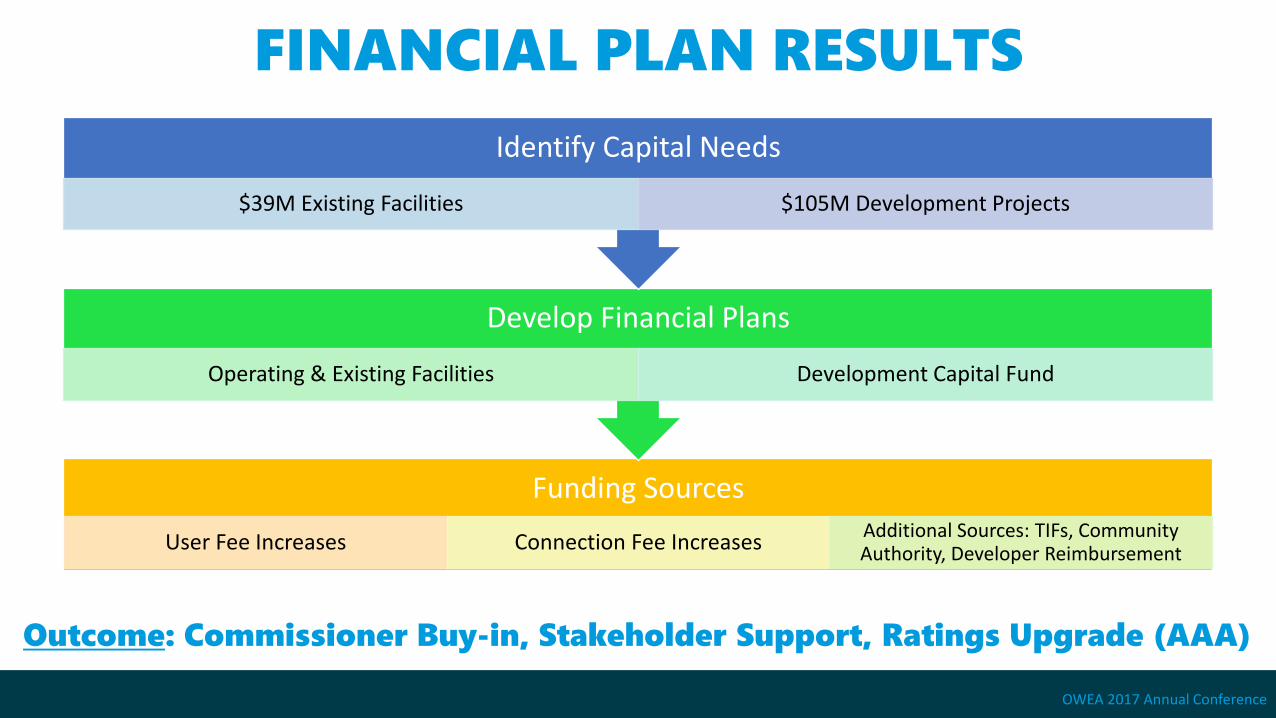
Funding Sources
User Fee Increases Connection Fee Increases Additional Sources: TIFs, Community Authority, Developer Reimbursement
Develop Financial Plans
Operating & Existing Facilities Development Capital Fund
Identify Capital Needs
$39M Existing Facilities $105M Development Projects
Outcome: Commissioner Buy-in, Stakeholder Support, Ratings Upgrade (AAA)
OWEA 2017 Annual Conference
FINANCIAL PLAN RESULTS
