master class on climate risk management using seasonal climate forecast information
DESCRIPTION
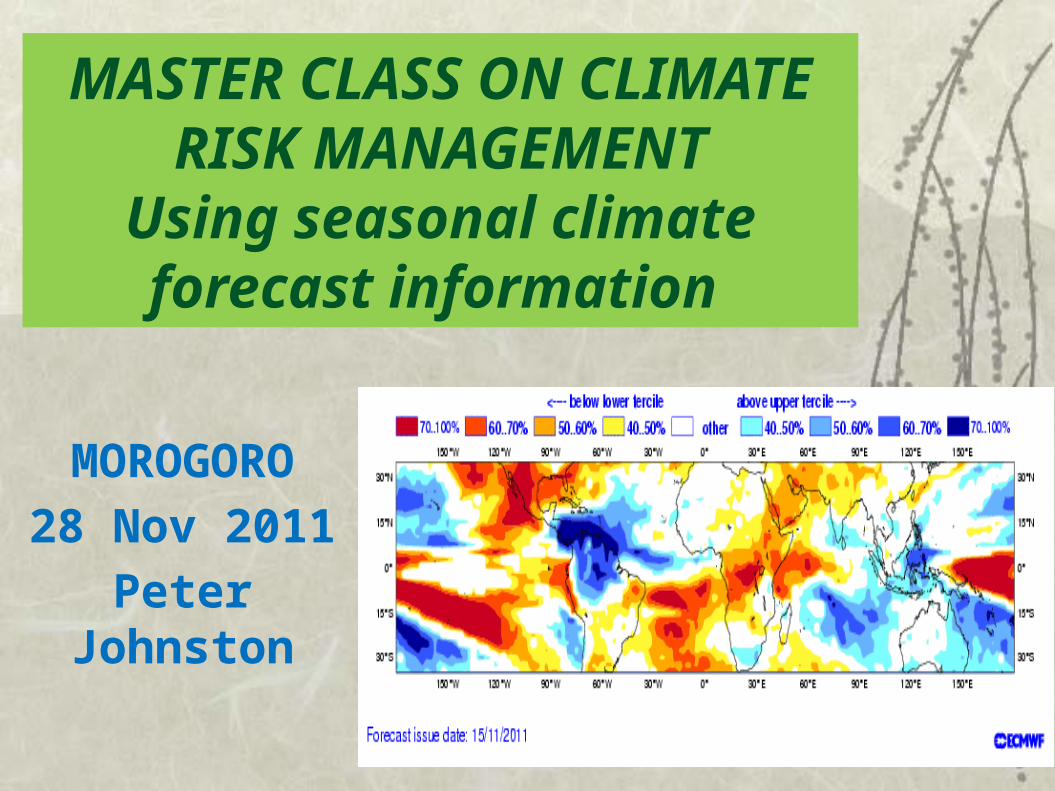
MASTER CLASS ON CLIMATE RISK MANAGEMENT Using seasonal climate forecast information. MOROGORO 28 Nov 2011 Peter Johnston. SEASONAL FORECASTING 3 month average. The theory behind them How are they made? Sources of SFs The message they convey Is it reliable? Their uptake and use - PowerPoint PPT PresentationTRANSCRIPT
MASTER CLASS ON CLIMATE RISK MANAGEMENT
Using seasonal climate forecast information
MOROGORO
28 Nov 2011
Peter Johnston

SEASONAL FORECASTING3 month average
The theory behind them– How are they made?
Sources of SFs The message they convey
– Is it reliable? Their uptake and use
– Opportunities– Barriers and limitations

Basic principles
Weather forecasts vs. climate forecasts– limit to predictability of weather (10-14 days)– but we can say something about climate beyond
that Methods: empirical vs. dynamic Forcing
– SSTs account for much of the variability in climate– Land surface?

Uncertainty
Sources of uncertainty Ensemble forecasts
– different initial conditions– different models
Systematic bias Different variables Deterministic vs. probabilistic

Producing the forecast
GCM– HadAM3
SSTs– forecast (SAWS)– persisted (NCEP)
Run the model!– 4-month spin-up– 6-month forecast– 10 ensemble members

Historically El-Nino is GENERALLY associated with dry (or wet) and warm conditions

The basis of most predictions are sea surface temperature (SST) anomalies. These can be monitored directly using:
● Satellites
● Buoys
● Ships

SST forecast from either:
1. persisted SSTs (good < 3 months into future)
2. Forecast SSTs (better > 3 months into future)
• dynamical ocean-atmosphere model
• statistical forecast
Making the rainfall forecast
Dynamical forecast using a GCM
Rainfall forecasts
Statistical forecast using a linear or non-linear model
e.g.CCA,EOF, SVD,ANN

However, forecasts are not ‘deterministic’ i.e. they do not say such and such WILL occur.
They are presented in terms of probability – represented by a probability density function (PDF – not the electronic document !)
To represent how this PDF changes with the forecast it must be ‘sampled’ many times :–
for a dynamic model make many different forecasts, each starting from different initial conditions
for a statistical model use a monte-carlo approach where the SSTs are perturbed slightly again from different initial conditions

Shift in the probability density function (PDF)
La Nina years (red) more frequently associated with high precipitation (to the right of the graph)

Changing PDF and uncertainty
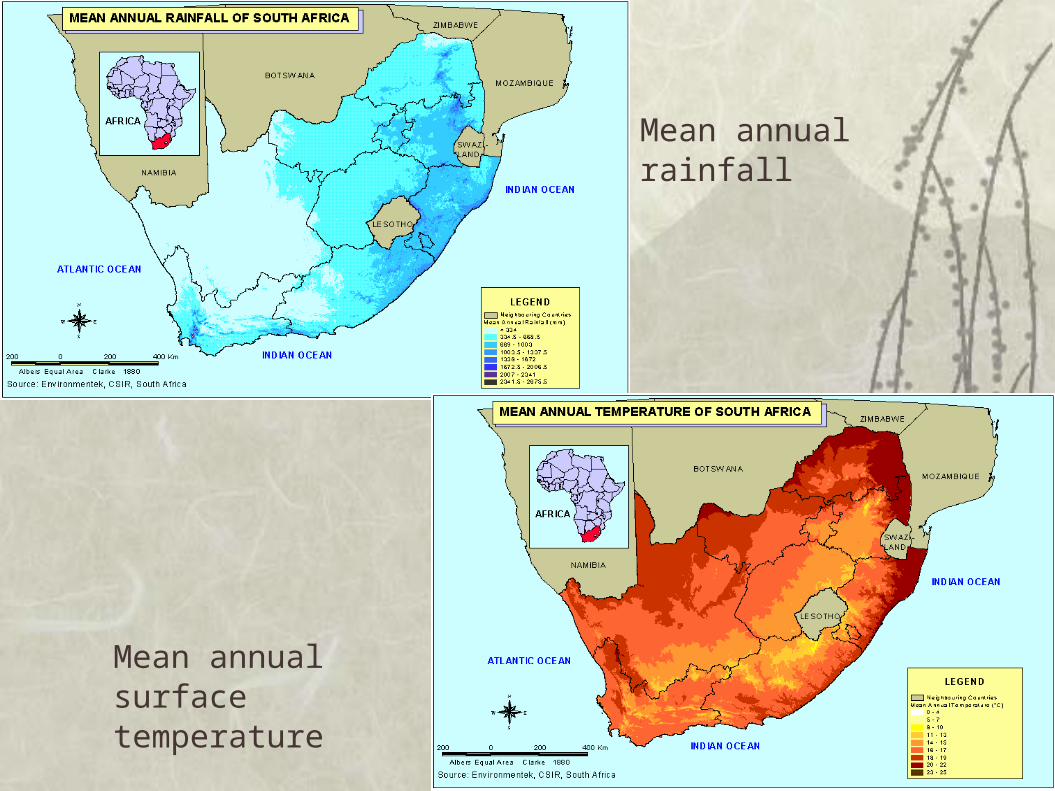
Mean annual rainfall
Mean annual surface temperature


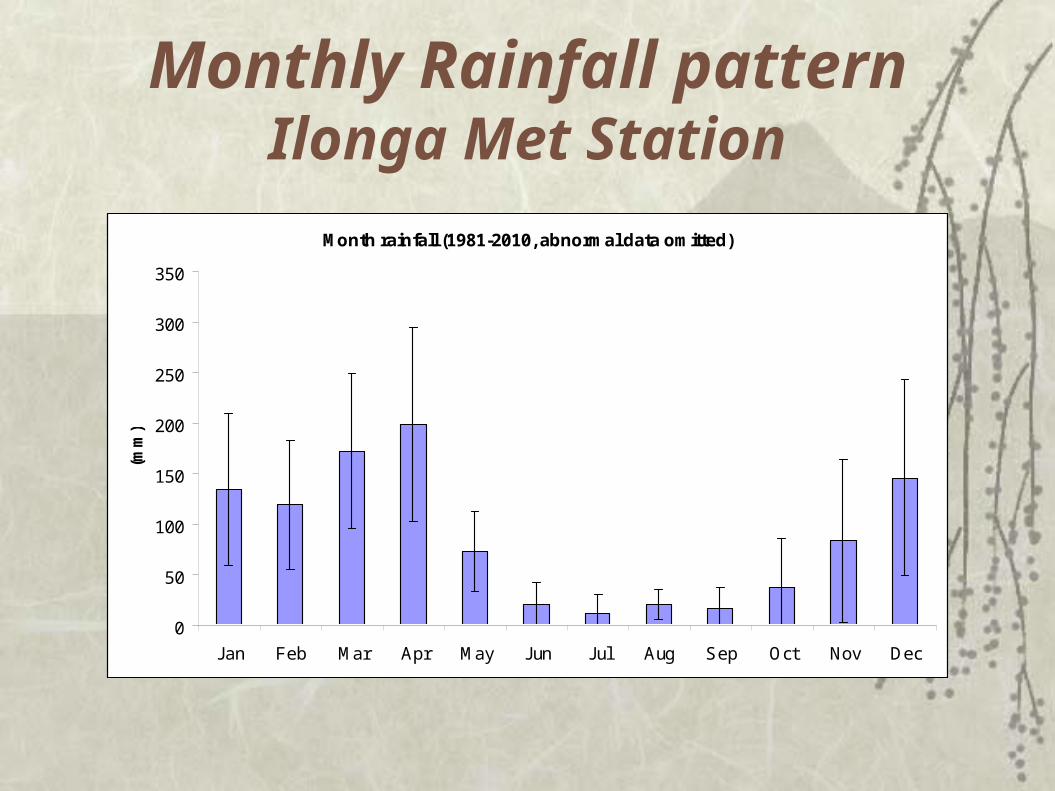
Monthly Rainfall patternIlonga Met Station
Month rainfall (1981-2010, abnormal data omitted)
0
50
100
150
200
250
300
350
Jan Feb Mar Apr May Jun Jul Aug Sep Oct Nov Dec
(mm
)

Time Series Jan-May rainfallJan-May rainfall
0
200
400
600
800
1000
1200
1986 1987 1988 1989 1990 1991 1992 1993 1994 1995 1996 1997 1998 1999 2000 2001 2002 2003 2004 2005 2006 2007 2008 2009 2010
(mm
)
Mean rainfall (Jan 1st to May 31st ) = 700mm
CV% = 23%

Time Series Jan-May rainfall
Rainfall Anomaly - 1986-2010 Jan-May rainfall (Mean = 700mm)
-300
-200
-100
0
100
200
300
400
1986 1987 1988 1989 1990 1991 1992 1993 1994 1995 1996 1997 1998 1999 2000 2001 2002 2003 2004 2005 2006 2007 2008 2009 2010
(mm
)

Dry Spells
Dry spells of 7 day duration occur every year in cropping period Jan15-May31st
Extend to 14 day dry spells in 8 of 24 seasons (33%) - 1990 ignored
Dry spells - 7 & 14 day duration (Jan 15-May31)
0
1
2
3
4
5
6
7
8
1986 1987 1988 1989 1990 1991 1992 1993 1994 1995 1996 1997 1998 1999 2000 2001 2002 2003 2004 2005 2006 2007 2008 2009 2010
No
_o
f_d
ry_
sp
ells
7days dry
14 days dry


HUMAN ELEMENTS OF CLIMATE FORECASTING
Impacts Applications Usefulness Accuracy Research Questions

Impacts Resource sectors
• Agriculture Commercial Emerging Informal
• Forestry• Water • Fishing
Commerce Utilities
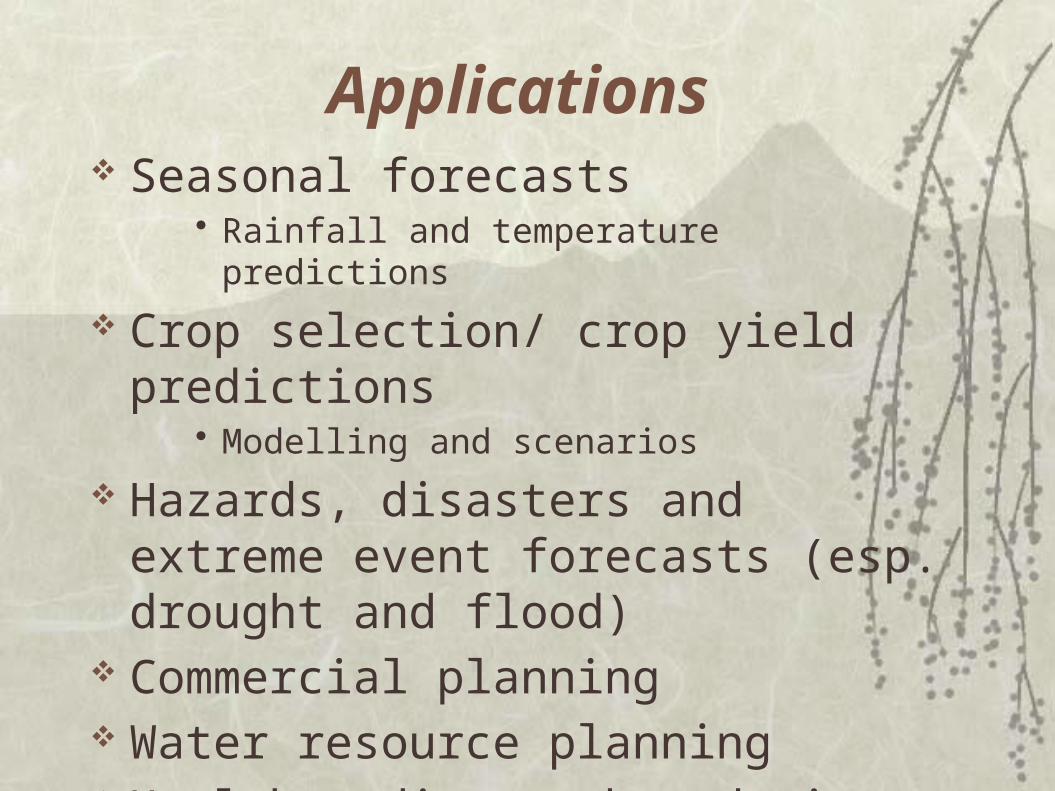
Applications Seasonal forecasts
• Rainfall and temperature predictions
Crop selection/ crop yield predictions• Modelling and scenarios
Hazards, disasters and extreme event forecasts (esp. drought and flood)
Commercial planning Water resource planning Health – disease boundaries

Usefulness Information content
• Spatial and temporal distribution of rainfall• Other optimal parameters
Information interpretation• Planting times• Growing seasons• Optimal crop selection
Information presentation and distribution• Format – probability• Media
– extension offices, word of mouth– Newspaper, radio, TV, internet
Accuracy Skill = Likelihood ? Probability/uncertainty = Reliability Verification Risk Consequences Liability Feedback sensitive

The Forecaster’s Quest
What is going to happen, and how confident are we that it will
happen?
How do we ensure that a forecast is useful and has value?

Research Questions What does the customer actually want? How will the information be presented? How will the users receive the information? How will forecast accuracy be conveyed? How can vulnerability to climatic variation
be reduced? How can traditional methods of forecasting
and planning complement scientific ones?


Seasonal Forecasts and agricultural decision-making
An inside perspective

Research Questions…
What do maize farmers find useful to assist decision making?
Why are farmers not making better use of the current forecasts?
Can farmers make ‘better’ decisions?

Activity
Forecast with more
than 1 month lead time
(greater lead time = less
Prediction of monthly
rainfall anomaly
Prediction of 3-
monthly average rainfall anomaly
Historical rainfall
probability (based on
ENSO)
Amount of Land prepared 1.83 1.50 2.08 1.69Crop Planting date 1.69 1.50 1.79 1.57 1 VERY USEFUL1.00-1.66Type of crops planted 1.77 1.86 2.07 1.64 2 USEFUL 1.66-2.33Selection of crop cultivars 2.23 2.15 2.21 2.07 3 NOT USEFUL 2.33-3.00Fertiliser purchase 2.36 2.00 2.00 2.23Irrigation planning 1.71 1.75 1.86 2.00Stocking rates 2.00 2.00 2.00 1.73Borrowing money 2.11 2.14 2.22 2.22
Activity
Approx date of onset of
rainfall
Approx date of
cessation of rainfall
Intra-seasonal distrib of rainfall
Approximate timing and duration of dry spells
Average temp
anomalies
Amount of Land prepared 1.31 1.54 1.46 1.38 2.08Crop Planting date 1.36 1.36 1.31 1.29 1.83Type of crops planted 1.43 1.43 1.38 1.38 2.00Selection of crop cultivars 2.15 1.93 1.85 1.92 2.00Fertiliser purchase 2.33 2.36 2.45 2.42 2.64Irrigation planning 2.14 2.00 1.71 1.86 2.14Stocking rates 2.09 2.10 2.10 1.90 2.25Borrowing money 2.60 2.40 2.30 2.20 2.56
What the commercial maize farmer would find useful…..

Approx date of onset of
rainfall
Approx date of
cessation of rainfall
Intra-seasonal distrib of rainfall
Approximate timing and duration of dry spells
Amount of Land prepared 1.31 1.54 1.46 1.38Crop Planting date 1.36 1.36 1.31 1.29Type of crops planted 1.43 1.43 1.38 1.38
Forecast with more
than 1 month lead time
Prediction of monthly
rainfall anomaly
Prediction of 3-
monthly average rainfall anomaly
Historical rainfall
probability (based on ENSO)
Amount of Land prepared 1.83 1.50 2.08 1.69Crop Planting date 1.69 1.50 1.79 1.57Type of crops planted 1.77 1.86 2.07 1.64

..in summary…..
High resolution prediction Advance notice of seasonal rainfall:
– Mid season dry spell– Onset– Distribution– Cessation
Follow up and updates Post season/monthly analyses

What the farmer thinks of forecasts…..
Farmers using forecasts: 83% find them ‘useful’
Random sample: 76% receive some sort of forecast 18% - Met Office, 64% another source (PP!) 33% trust the forecast Relevant: 23% very, 37% fairly, 21% not at all

What would he do differently?
68% crop selection 47% cultivar selection 63% planting planning

67 % understood ‘normal’ rainfall 79% using farmers interpreted
probability 33 % of random sample
– 64% - were confident – 33% of those were wrong
But do they understand..?
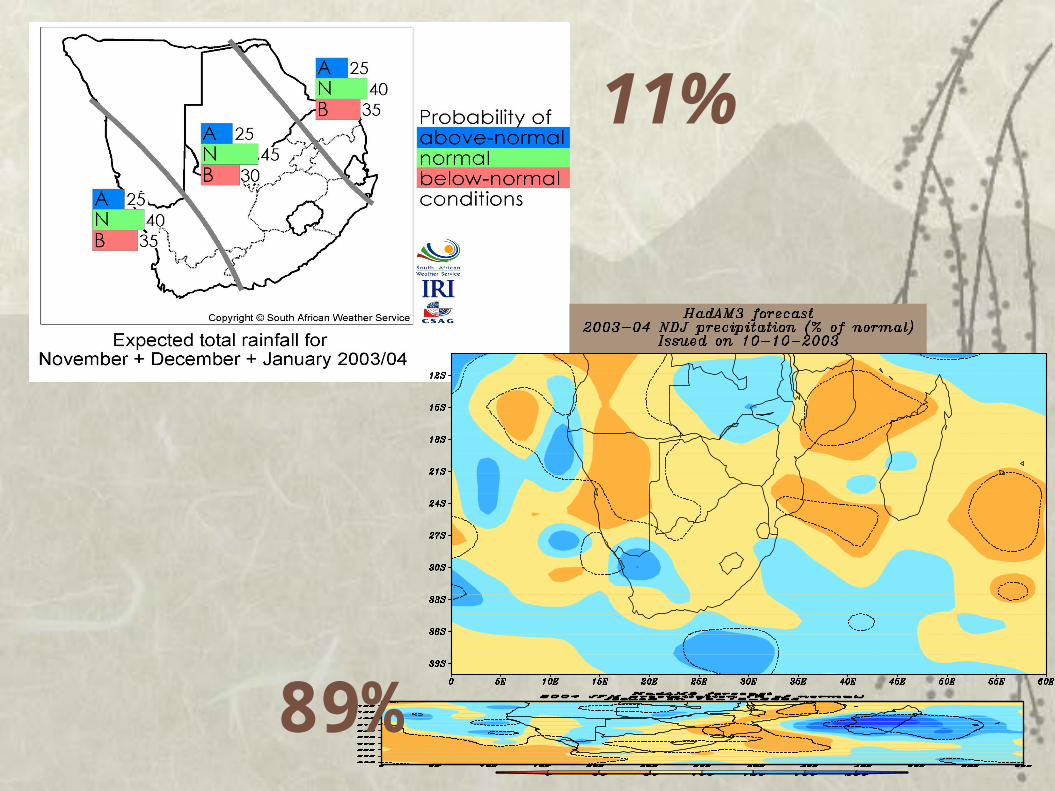
11%
89%
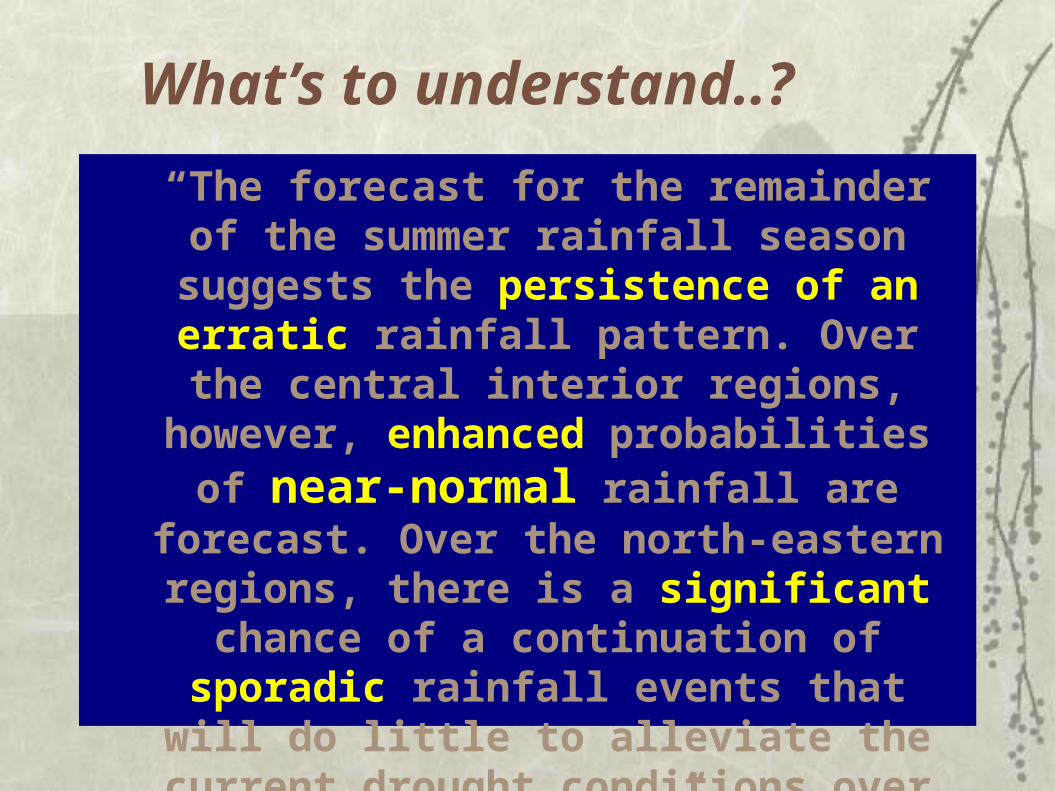
“The forecast for the remainder of the summer rainfall season suggests the persistence of an
erratic rainfall pattern. Over the central interior regions, however, enhanced
probabilities of near-normal rainfall are forecast. Over the north-eastern regions, there
is a significant chance of a continuation of sporadic rainfall events that will do little to
alleviate the current drought conditions over that area.”
What’s to understand..?
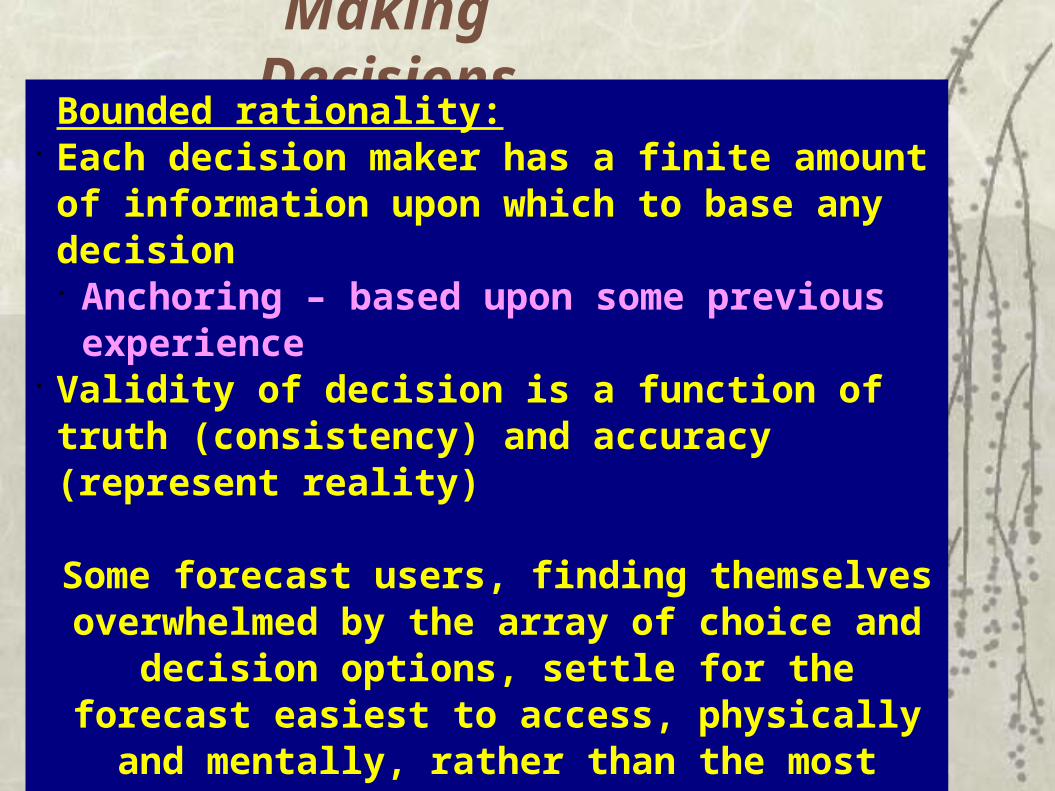
Making DecisionsBounded rationality:
• Each decision maker has a finite amount of information upon which to base any decision• Anchoring – based upon some previous
experience• Validity of decision is a function of truth (consistency) and accuracy (represent reality)
Some forecast users, finding themselves overwhelmed by the array of choice and decision options, settle for the forecast easiest to access,
physically and mentally, rather than the most suitable …

Making wrong decisions..
False expectations about various forecasting models and their outputs.
Insufficient understanding about the interpretation and application of a forecast to a specific case.
An inappropriate application or response based on forecast information.
(Farago et al 1997)

Living with a wrong decision…
‘Cognitive dissonance’: justification of one’s decision when ‘action’ disagrees with ‘attitude’
3 mental mechanisms to ensure that actions and attitudes are in harmony (reducing dissonance).
• Selective exposure – keeping within the walls• Post-decision reassurance – cost, time taken, irreversibility –
finding common ground from others who agreed with decision.• Minimal justification = greater attitudinal change – smaller rewards
get more positive reaction (cup-holders vs fuel consumption)

Need to know ….
What is involved in his decision making? What has the greatest influence? How to increase the finite sphere of
information How to increase the ability and
willingness to utilise SF’s

Fidelity/Bravery/Intelligence
Forecasts need to be honest and have intimate knowledge of user needs
Limitations of the forecast are the starting point
Probability and skill must be explained
Forecaster obligations..


Users have differing attitudes– disbelief – mistrust– cynical– misinterpretation– cognitive dissonance - reinforcing decisions
research required to compare the impact on commercial and emerging/s-scale farmers
farmers will use forecasts when they are good and ready….
Researcher’s obligations

or when the forecasts are good and ready….?
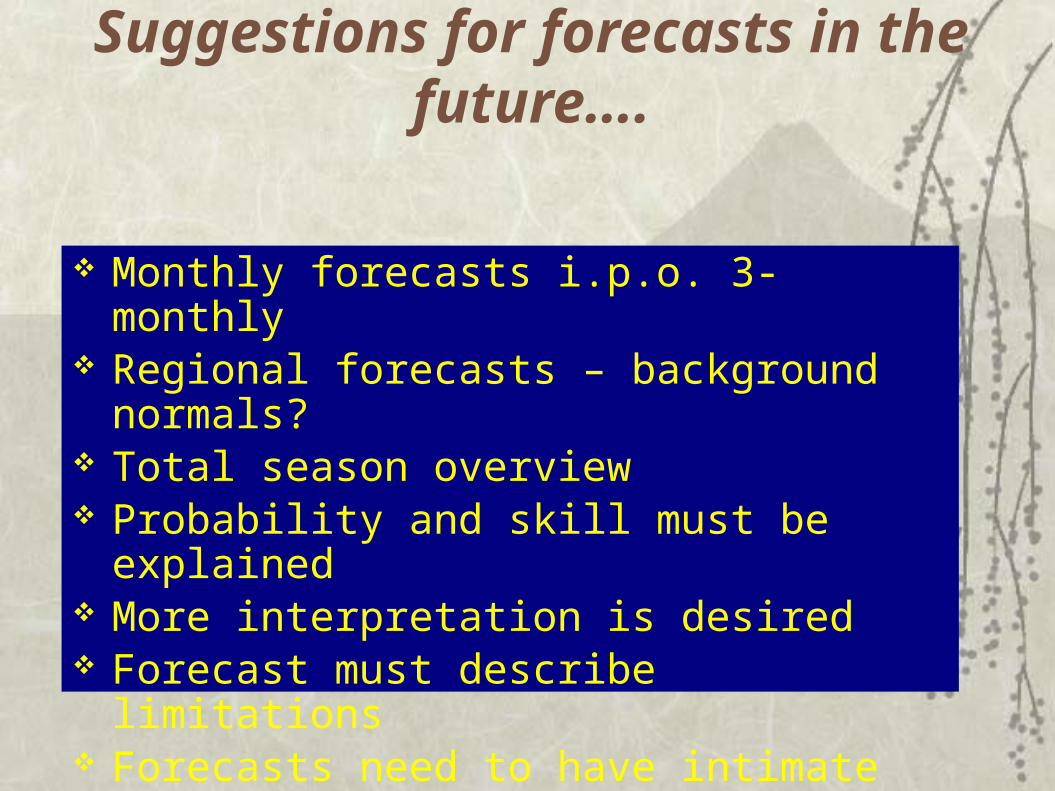
Monthly forecasts i.p.o. 3-monthly Regional forecasts – background normals? Total season overview Probability and skill must be explained More interpretation is desired Forecast must describe limitations Forecasts need to have intimate knowledge of user
needs – means identifying specific user sectors
Suggestions for forecasts in the future….


Applications of seasonal forecasts:
value, limitations and responsibilities
Maximising usefulness for end-users

Longer term forecasts11-30 day
http://dev2.weathersa.co.za/web/Content.asp?contentID=91

Seasonal forecasts? 3 month regional scale projections

Assumptions:
1. Seasonal Forecast have skill
2. Seasonal Forecasts have more skill when the ocean/atmosphere shows a definite signal AND during the usual rainy season
3. Forecasting chance of extremes most useful

Useful forecasts?
Access limitedDissemination poorUnderstanding lowUsefulness – marginalPotential benefits – medium to high

RequirementsTemperature outlook
• Overall• Extremes• Frost episodes?
Rainfall outlook• Overall seasonal prospects• Timing of Rainfall Onset• Mid-season drought• Cessation• Extremes

User responsesUseful for:
• crop and cultivar choice • land preparation – timing and amount • fertiliser purchases
Concerns:• Accuracy – will it be correct? Probability/likelihood/
confidence?• Skill – how often will a forecast be correct?• Scale – usefulness?• Consistency – will the forecast for a particular month
change in a subsequent forecast?• Will I be able to interpret and apply it?

2009/10 ENSO event – Limpopo Province, SA


The El Nino is being accompanied by a negative phase southern annular mode (SAM). 2 "dry" modes of circulation occurring concurrently and a therefore very dry seasonal forecast
October-November -December 2009There is 50% chance of below normal rainfall condition for the entire Limpopo Province (Dry conditions persist throughout the province for the period October, November and December which are normally our Rainy season )
November- December- January 2009/10The probability of receiving below normal rainfall is favourable (50%).
December- January -February 2010The probability of receiving below normal rainfall is favourable (50%).

BELOW NORMAL RAINFALL (DRY) CONDITIONS
Rainfed crop management Adjust planting density Encourage infiltration of storm water runoff Regular and strict scouting for pests and diseases to minimize
expenditure on chemical control Do not expand land under crop production unnecessarily Do not experiment with new and unknown crops/seeds and avoid
unnecessary capital investments Store water in wetlands and dams Reduce evaporation - mulching Consider a conservative fertilising strategy (expect low yields)

What happened?


The use of forecast information in various farm management decisions
(all farmers received forecasts)
Uptake of forecast per farm activity
0%
10%
20%
30%
40%
50%
60%
70%
80%
90%
100%
Amount ofLand
prepared
CropPlanting
date
Type ofcrops
planted
Selectionof cropcultivars
Fertiliserpurchase
Irrigationplanning
Stockingrates
Borrowing
money
Activity
% r
esp
on
den
ts
did not use
used

West Africa – crop management response to Climate Information

West Africa – water management response to Climate Information

West Africa – soil management response to Climate Information

Not enough information!
What will the ENSO event mean?– Delayed/earlier onset of rains?– Dry/wet months – drought/floods?– Hotter/cooler temperatures?
Which crops are more susceptible? Worst and best case scenarios… Typical responses in analogue years..

Verification showing success rate, times, regions
Ongoing work with onset dates etc
Explain uncertainty Don’t issue low-skill
forecasts Downscaling
methodologies Interpretation for
specific crops
-10.0-8.0-6.0-4.0-2.00.02.04.06.08.0
10.0
JFM FMA MAM AMJ MJJ JJA JAS ASO SON OND NDJ DJF
valu
e
3 months
W Cape (Wheat) overall index
Possible responses
-10.0-8.0-6.0-4.0-2.00.02.04.06.08.0
10.0
JFM FMA MAM AMJ MJJ JJA JAS ASO SON OND NDJ DJF
valu
e
3 months
Maize region Overall index

Communicating information Climate information should include
broad trends and future conditions Should also use crop/water modelling
for strategic planning Must keep up to date with best science Must determine value to individual user Use indigenous knowledge combined
with science to explain options for adaptation
Use tools to help interpretation
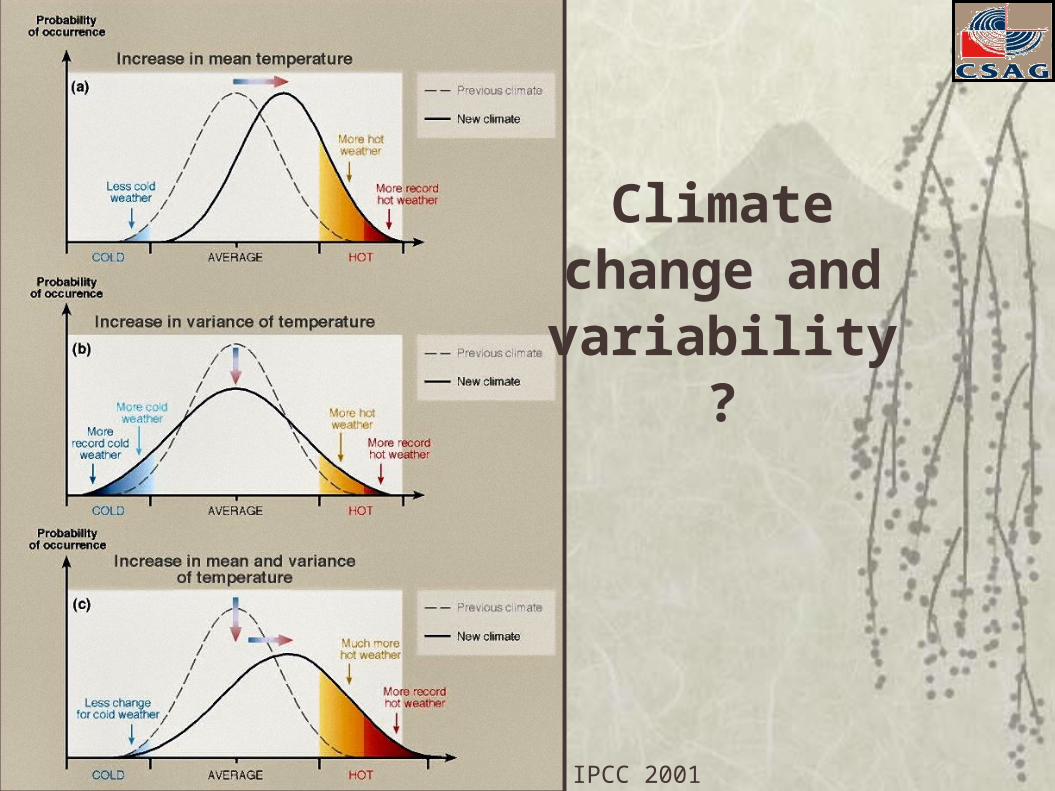
Climate change and variability?
IPCC 2001

NO CHANGE DRIER
Above normal
Normal
Below Normal
Above normal
Normal
Below Normal
Making sense of probability
AN:N:BN::33:33:33 AN:N:BN::25:25:50

50% BN
Above normal, 30
Normal, 30
Below Normal, 60
Above normal, 30
Normal, 30
Below Normal, 60
Above normal, 30
Normal, 30
Below Normal, 60
Above normal, 30
Normal, 30
Below Normal, 60
Above normal, 30
Normal, 30
Below Normal, 60
Above N = 25% (33.3)
Normal = 25% (33.3)
Below N = 50% (33.3)

Seasonal forecasts should:
be downscaled onto available stations or projected onto high-resolution, gridded, merged satellite-station data;
include relevant and predictable information about ‘weather-within-climate’ such as the number of rain days;
express uncertainty in transparent probabilistic terms, including the full forecast and climatological distributions;
be packaged with historic observations and hindcasts of the forecast variables.
Hansen et al 2011

Downscaling
Provides higher spatial resolution climate change projections from a range of General
Circulation Models (GCMs).

Downscaling
The challenge of bring confident large scale projections to scales of action and response
Future change

Downscaling requires local
data
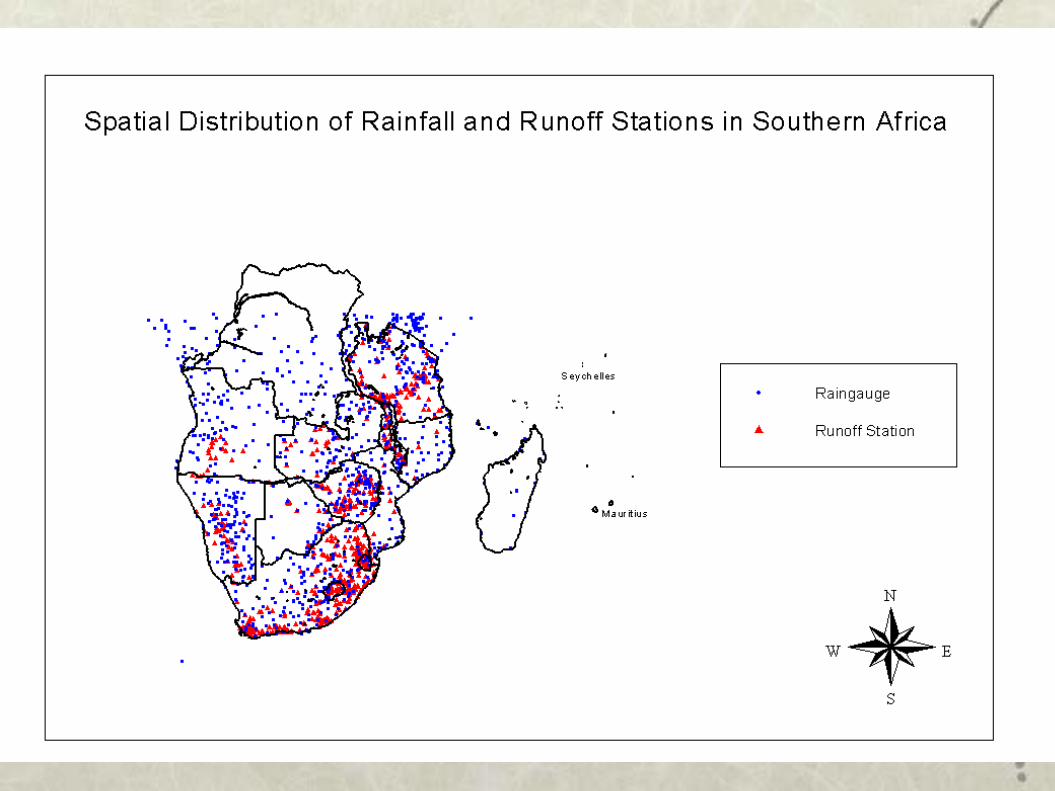


Reporting frequency to WMO from World Weather watch stations 1998-2002

Key institutional and policy changes Mainstream climate information, including SFs, into
agricultural R&D strategy. Develop capacity to use and effectively demand climate
information, perhaps beginning with national agricultural research systems.
The agricultural sector and particularly farmers must be given a degree of ownership and an effective voice in climate information products and services.
NMS need to be realigned, resourced and trained as providers of services for development and participants in the development process.
Meteorological data should be treated by national policy as a free public good and a resource for sustainable development across sectors

Take home thoughts We need to make seasonal forecasts even more useful –
can we do it through downscaling - recognising shortcomings?
Do we have the required institutional capacity and skills, such as station data?
Are agricultural extension services effective? Can climate change projection information fit into the
forecast dissemination networks that exist or will be created?
Could we use innovative ways of disseminating them – cell phone/food packaging?
Forecast co-ordination should facilitate seasonal forecasting progress


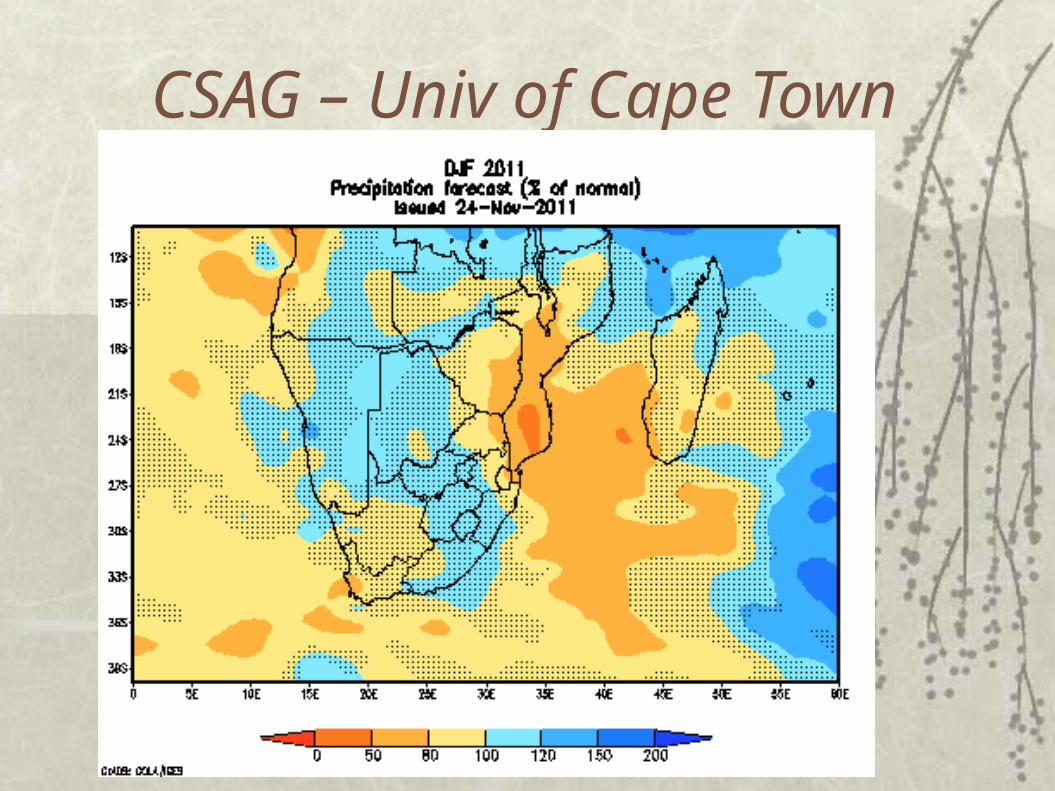
CSAG – Univ of Cape Town


IRI DJF 2012

NOAA CPC

http://www.icpac.net/

Figure 3: Greater Horn of Africa Consensus Climate Outlook for July to September 2011
Figure 1: July to September Long Term Mean Rainfall
Figure 2a: Rainfall Anomalies during July to September 1999
Figure 2b: Rainfall Anomalies during July to September 1989
Figure 2c: Rainfall Anomalies during July to September 1996

Consensus forecast for Sept-
Dec 2011

TanzaniaThe prevailing neutral ENSO conditions over the tropical Pacific Ocean and projected Sea Surface Temperature (SST) anomalies over Pacific, Indian and Atlantic Oceans as well as other factors that affect the climate in the country including atmospheric circulation processes that bring moisture into the region and local features have been analyzed. In the October-December 2011, season the SSTs where show a trend towards cooling which imply a likelihood of a weak La Nina conditions across the equatorial Pacific Ocean. The current warming over western Indian Ocean (coast of Eastern Africa) coupled with slightly cooling over Indonesia indicates presence of a mild positive Indian Ocean Dipole during the first two months of the season. However, these SSTs over Western Indian Ocean are expected to become neutral towards the end of the year 2011. Expected low level easterly winds towards the country are likely to decline slightly from November 2011. Westerly wind flow is likely to be enhanced and influence rainfall activities over greater part of the country from December 2011. The coming season is likely to be influenced by occurrences of Tropical Cyclones over south western Indian Ocean.

SEASONAL RAINFALL OUTLOOK
Short Rains (Vuli) The October to December season rains (Vuli) is more important for the north-eastern highlands, Northern coastal areas and most parts of Lake Victoria basin. The rains are expected to be above normal over Eastern parts of Lake Victoria Basin, northen coast, isles of Zanzibar and Pemba and western parts of Northeastern Highlands (Arusha region). Normal to above normal rainfall is expected over the most part of the country.
The short rains (Vuli) season is due to commence from second week of September over Lake Victoria, and gradually spread to other areas of bi-modal region. Lake Victoria Basin: (Kagera, Northern Kigoma, Mara, Mwanza and Northern Shinyanga regions):
Rains are expected to start during the second week of September 2011 over Kagera region and gradually spreading to other areas (Mwanza, Shinyanga, northern Kigoma (Kibondo) and Mara regions) during the second week of October, 2011. The rains are expected to be mainly above- normal over most areas.
Northern coastal areas and hinterland: (Dar es Salaam, Tanga, Coast, northeastern of Morogoro regions and isles of Unguja and Pemba): The rains are expected to commence during the second week of October 2011. These rains are expected to be above normal over most areas.
Northeastern highlands: (Kilimanjaro, Arusha and Manyara regions): Rains are expected to commence during the third and fourth week of October and are likely to be normal to above normal.

(ii) Seasonal Rains (November – April) Outlook: The November to April rainfall (Seasonal rains) is more important for the Western, Central, Southwestern highlands, Southern regions and Southern coast. The rains are likely to be normal to above normal over most of unimodal regions. However, parts of southern Lindi, eastern parts of Ruvuma and Mtwara regions rains are expected to be mainly normal during October to December, 2011.
The western areas: (Tabora, Rukwa and Kigoma regions): Rains are expected to start during the third and fourth week of November and are expected to be normal to above normal.
Central (Singida and Dodoma regions): Rains are expected to start during the fourth week of November and are likely to be normal to above normal.
Southwestern highlands: (Mbeya, Iringa and Southern Morogoro): Rains are expected to start during the third week of November and are likely to be normal to above normal.
Southern region and Southern Coast: (Ruvuma, Mtwara and Lindi regions): Rains are expected to start during the fourth week of November and are likely to be normal to above normal over western parts of Ruvuma region and mainly normal over eastern Ruvuma, southern Lindi and Mtwara regions.

