mass spectrometry solutions from leco -...
TRANSCRIPT

Mass Spectrometry Solutions from Mass Spectrometry Solutions from LECOLECOLECOLECO
Life Science & Chemical Analysis CentreSt. Joseph, Michigan, USASt. Joseph, Michigan, USA
OutlineOutline
• Brief History of LECO• Overview of Time-of-Flight mass spectrometry
– Comparison to scanning instruments– LECO’s TOF MS Instruments
• Spectral reproducibility• Spectral reproducibility• Fast spectral acquisition rates • Increased linear dynamic range• Deconvolution Overview
E i t l St di f• Experimental Studies for:– Sampling Rate– Deconvolution Capability– Usage as a High-Speed GC and GCxGC detectorUsage as a High Speed GC and GCxGC detector
• GCxGC Overview– GCxGC Theory– Experimental Examples
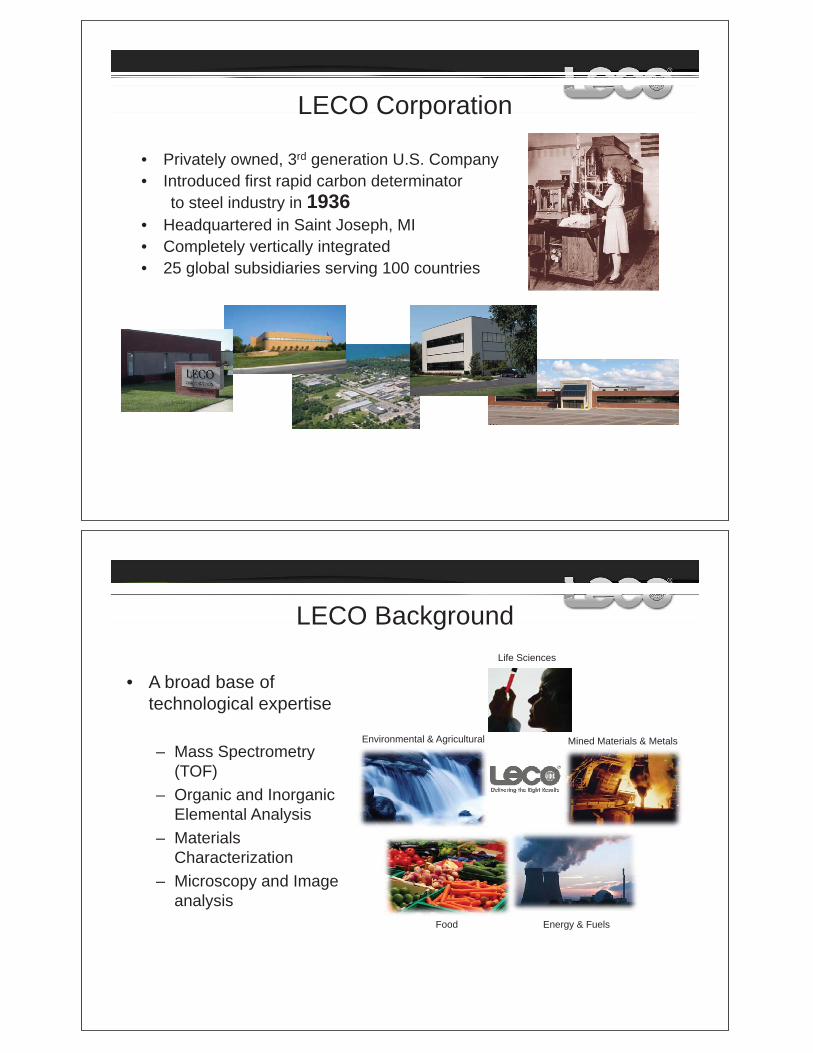
LECO CorporationLECO Corporation
• Privately owned, 3rd generation U.S. CompanyI t d d fi t id b d t i t• Introduced first rapid carbon determinatorto steel industry in 1936
• Headquartered in Saint Joseph, MI• Completely vertically integrated• 25 global subsidiaries serving 100 countries
LECO BackgroundLECO Background
• A broad base ofLife Sciences
A broad base oftechnological expertise
Mass SpectrometryMined Materials & MetalsEnvironmental & Agricultural
– Mass Spectrometry(TOF)
– Organic and Inorganic Elemental AnalysisElemental Analysis
– Materials CharacterizationMi d I– Microscopy and Imageanalysis
Energy & FuelsFood

Brief History of LECO in TOF MSBrief History of LECO in TOF-MS
• LECO has always been about “Delivering the Right Results”, sinceLECO has always been about Delivering the Right Results , sinceestablishment nearly 75 years ago
• Circa 1991 began collaboration with Indiana University on ICP-TOF.• Circa 1995 licensed Michigan State University DAS (ITR) and data
processing patentsprocessing patents.• Pegasus GC-TOF and GC x GC TOF systems 500 sps
– Pegasus 1996 – Pegasus II 1997– Pegasus II 1997– Pegasus III 2000– Pegasus 4D 2002– Pegasus HT 2005Pegasus HT 2005
• TruTOF HT benchtop GC-TOF 2007 80 sps• Citius High Res TOF (LC-HRT) 2011 200 sps• Pegasus High Res TOF (GC-HRT) 2011 200 spsPegasus High Res TOF (GC HRT) 2011 200 sps
LECO Separation SciencespDelivering the Right Results
2011 Pittcon Editor’s Gold AwardCitius LC-HRTPegasus GC-HRT
2011 Pittcon Editor s Gold Award
Pegasus 4D and HTTruTOF HT
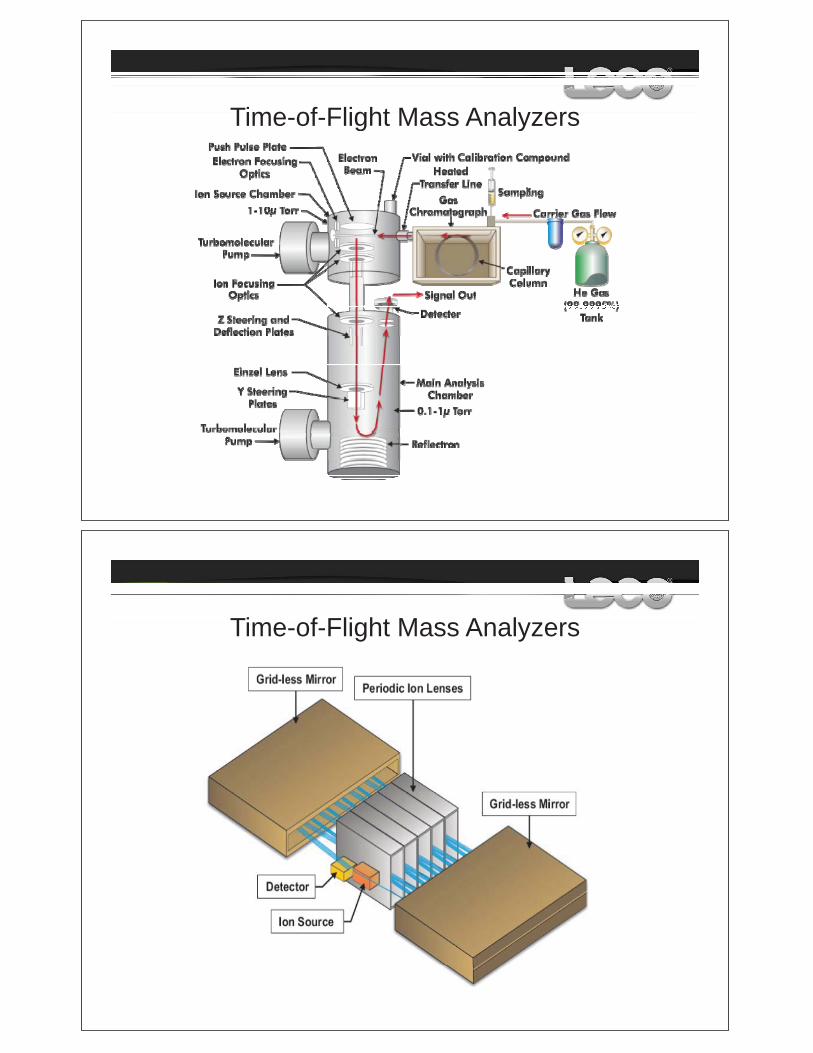
Time of Flight Mass AnalyzersTime-of-Flight Mass Analyzers
Time of Flight Mass AnalyzersTime-of-Flight Mass Analyzers
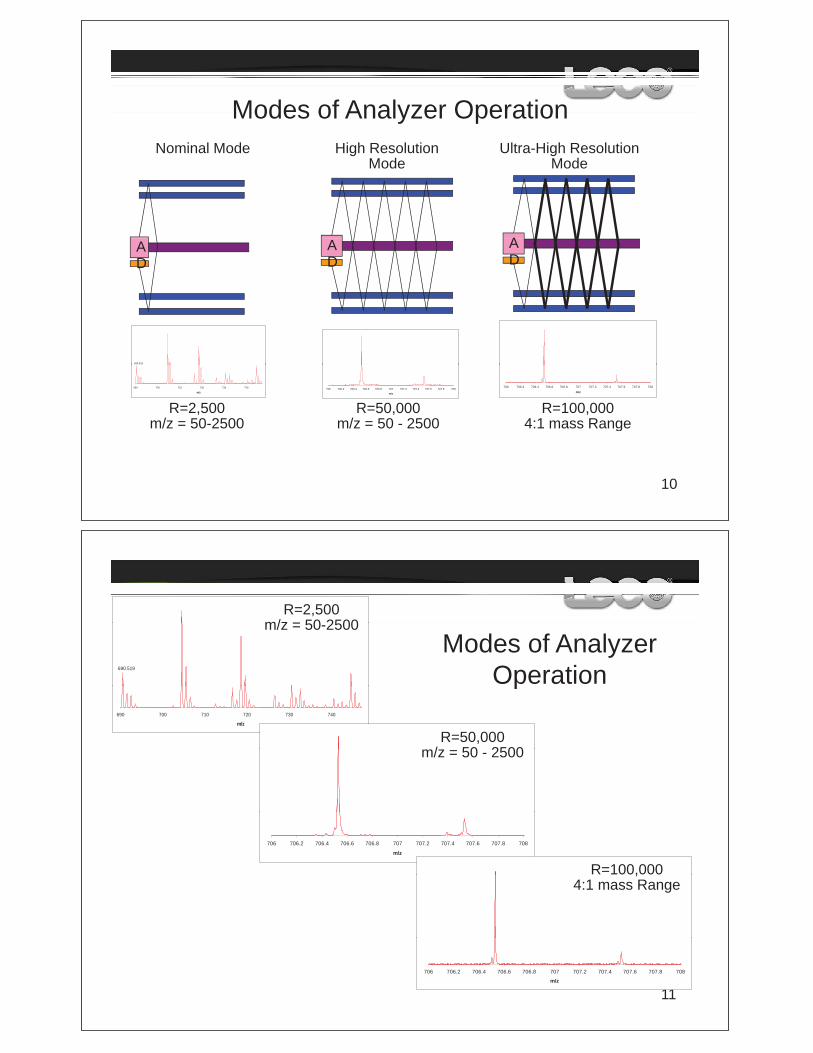
Modes of Analyzer OperationModes of Analyzer OperationHigh Resolution
ModeNominal Mode Ultra-High Resolution
Mode
Mirrors
AAD
AD
Lenses
Mirrors
AD
690.519
Mirrors
706 706.2 706.4 706.6 706.8 707 707.2 707.4 707.6 707.8 708
m/z
R=50,000m/z = 50 - 2500
690 700 710 720 730 740
m/z
R=2,500m/z = 50-2500
706 706.2 706.4 706.6 706.8 707 707.2 707.4 707.6 707.8 708
m/z
R=100,0004:1 mass Range
10
m/z 50 2500m/z 50 2500 4:1 mass Range
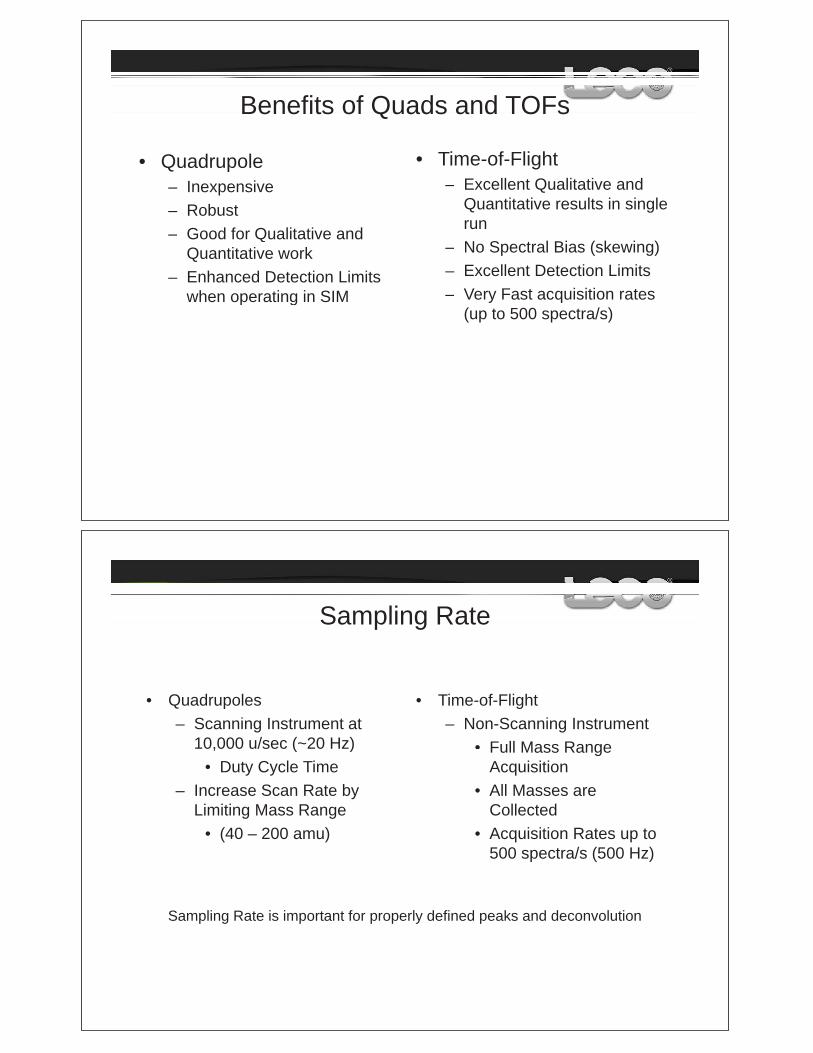
R=2,500m/z = 50 2500
690.519
Modes of Analyzer Operation
m/z = 50-2500
690 700 710 720 730 740
m/z
p
R=50,000/ 50 2500m/z = 50 - 2500
706 706.2 706.4 706.6 706.8 707 707.2 707.4 707.6 707.8 708
m/z
R=100,000,4:1 mass Range
11
706 706.2 706.4 706.6 706.8 707 707.2 707.4 707.6 707.8 708
m/z
Benefits of Quads and TOFsBenefits of Quads and TOFs
• Quadrupole • Time-of-Flight– Inexpensive– Robust– Good for Qualitative and
– Excellent Qualitative and Quantitative results in single runGood for Qualitative and
Quantitative work– Enhanced Detection Limits
when operating in SIM
– No Spectral Bias (skewing)– Excellent Detection Limits– Very Fast acquisition rates when operating in SIM y q
(up to 500 spectra/s)
Sampling RateSampling Rate
• Quadrupoles– Scanning Instrument at
10,000 u/sec (~20 Hz)
• Time-of-Flight– Non-Scanning Instrument
• Full Mass Range, ( )• Duty Cycle Time
– Increase Scan Rate by Limiting Mass Range
Full Mass RangeAcquisition
• All Masses are CollectedLimiting Mass Range
• (40 – 200 amu)Collected
• Acquisition Rates up to 500 spectra/s (500 Hz)
Sampling Rate is important for properly defined peaks and deconvolution

Proper Sampling RatesProper Sampling Rates
• Literature defines the proper sampling rate of a chromatographic detector to have an acquisition speed capable of delivering at least 10 points across a fully resolved peak to deliver accurate quantitative data
• For a 0 2s wide peak what acquisition rate would you choose?For a 0.2s wide peak, what acquisition rate would you choose?A) 10HzB) 20HzC) 50HC) 50HzD) 100HzE) 200Hz
Proper Sampling RatesProper Sampling Rates
• Most samples are complex and do not contain fully resolved chromatographic peaks – therefore some method of deconvolutionis needed.
• LECO has published results showing that the statistical power of deconvolution is optimal with 12 data points across peak width at half height

Spectral Acquisition RateSpectral Acquisition Rate1 Spectra/sec1 Spectra/sec
Peak definition is very poor.
Spectral Acquisition RateSpectral Acquisition Rate
Typical scanning instrument rate
2 Spectra/sec2 Spectra/sec
Automated peak find is not possible.
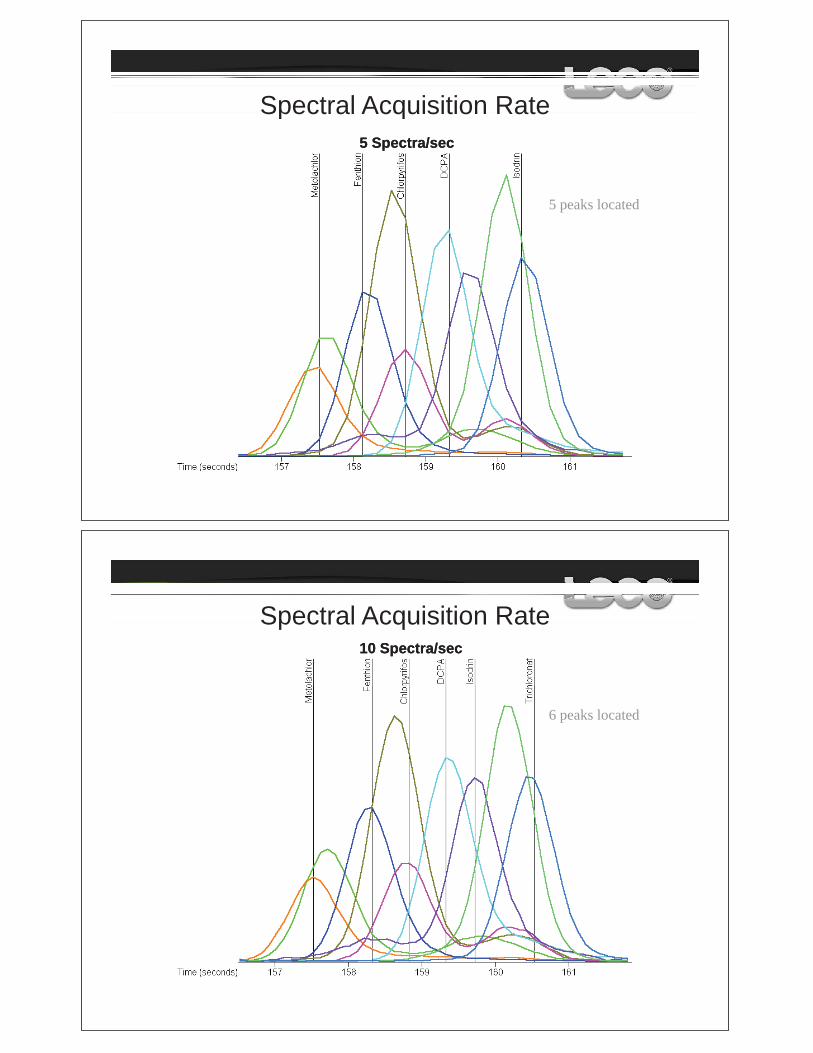
Spectral Acquisition RateSpectral Acquisition Rate5 Spectra/sec5 Spectra/sec
5 peaks located
Spectral Acquisition RateSpectral Acquisition Rate10 Spectra/sec10 Spectra/sec
6 peaks located
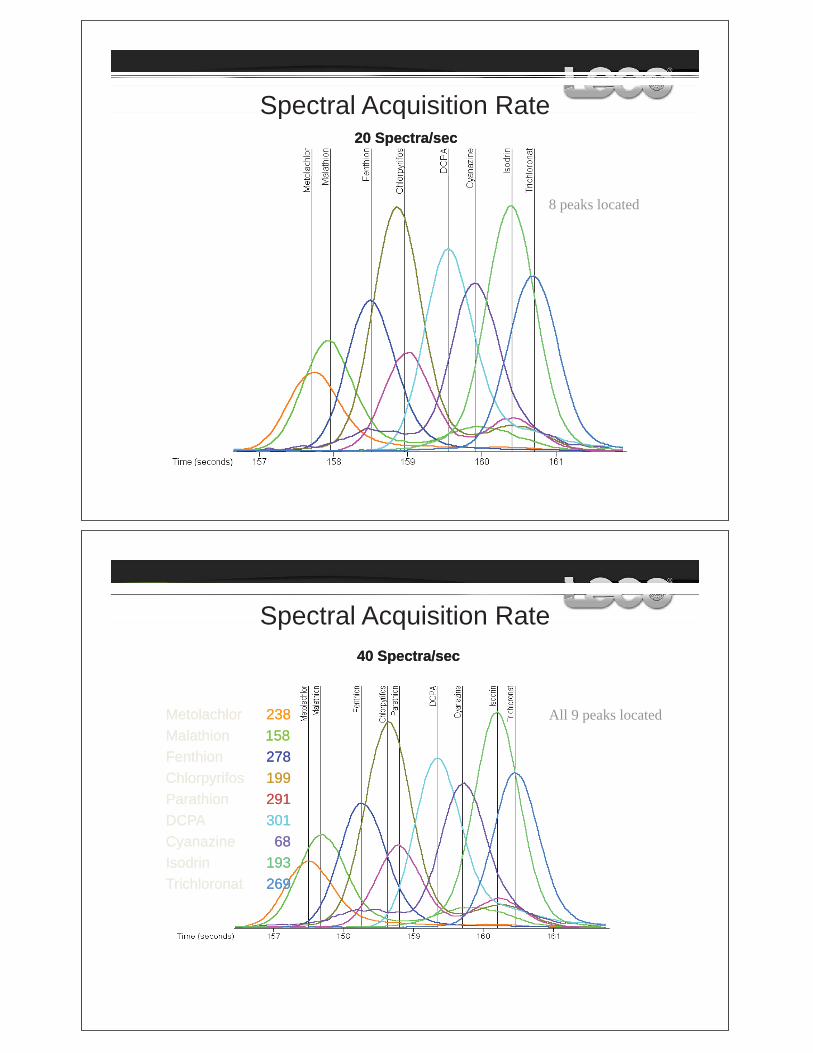
Spectral Acquisition RateSpectral Acquisition Rate20 Spectra/sec20 Spectra/sec
8 peaks located
Spectral Acquisition RateSpectral Acquisition Rate40 Spectra/sec40 Spectra/sec
MetolachlorMetolachlor 238238MalathionMalathion 158158
All 9 peaks located
FenthionFenthion 278278ChlorpyrifosChlorpyrifos 199199ParathionParathion 291291DCPADCPA 301301CyanazineCyanazine 6868IsodrinIsodrin 193193TrichloronatTrichloronat 269269

True Signal DeconvolutionTrue Signal Deconvolution
A correlated set of ions
EI Spectra
A correlated set of ionsreaches the detector
erC
alip
True Signal DeconvolutionTrue Signal DeconvolutionEI Spectra
erC
alip
e

Coelution of 3 PesticidesCoelution of 3 Pesticides
Fenthion 278Chlorpyrifos 199Parathion 291 < 550 ms >
Spectral Coelution of PesticidesSpectral Coelution of Pesticides
* *
****
FenthionChlorpyrifosParathion
***
**
**
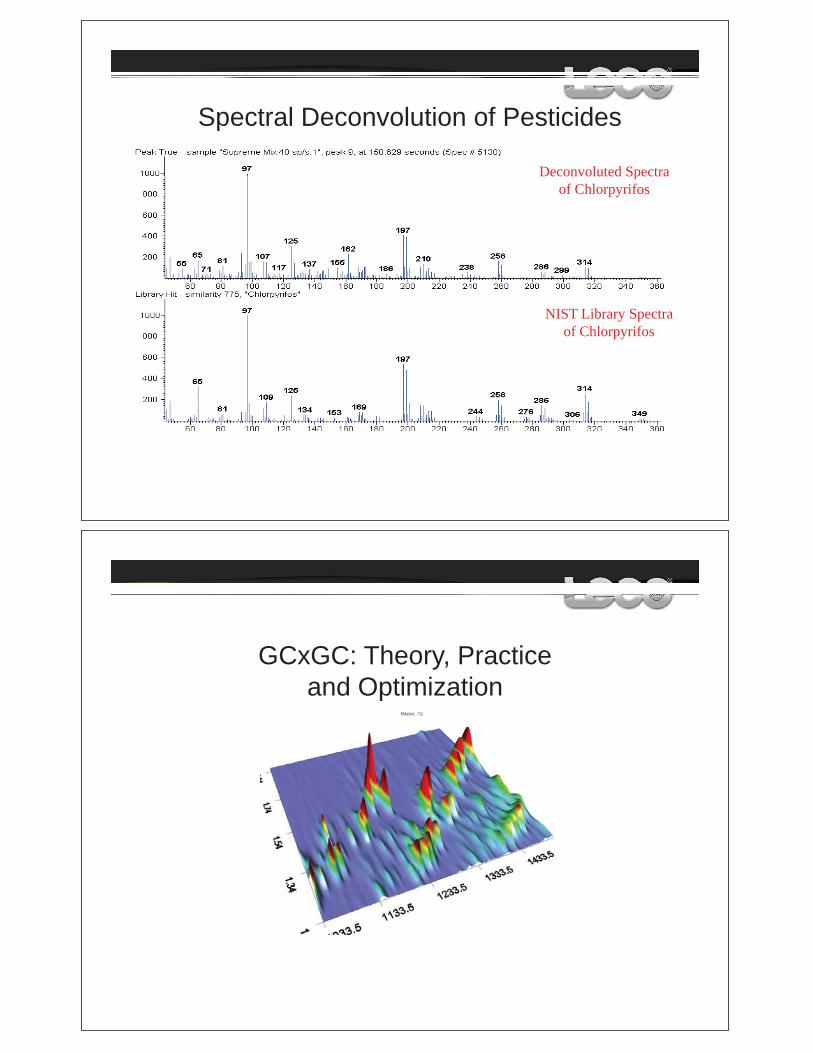
Spectral Deconvolution of PesticidesSpectral Deconvolution of Pesticides
Deconvoluted SpectraDeconvoluted Spectraof Chlorpyrifos
NIST Library Spectraof Chlorpyrifos
GCxGC: Theory, Practice and Optimizationand Optimization

Presentation OutlinePresentation Outline
• An Introduction to GCxGC– What is GCxGC?– GCxGC Hardware– Interpreting GCxGC Chromatograms
• Applicationspp– Environmental– Metabolomics– Petroleum
• Advanced Data Processing• Classifications• Scripting
37
What is GCxGC?What is GCxGC?
Multi-Dimensional Gas Chromatography2DGC GC GC– 2DGC vs. GCxGC
• 2DGC– Heart-Cutting
» Diverting a portion of effluent from a column onto a column» Diverting a portion of effluent from a column onto a columnof a different stationary phase
– Multiple Columns» Splitting the effluent from a column onto multiple columns
of differing stationary phasesof differing stationary phases
• GCxGC (Comprehensive Two-dimensional Gas Chromatography)– Comprehensive
All t i l th t t th 1 t di i l» All material that enters the 1st dimension column passes through the 2nd dimension column to the same detector
– Uses a “Modulator” to partition 1st column effluent as discrete plugs onto the 2nd dimension column
38

Heart-cutting (2DGC)Heart cutting (2DGC)
Detector “A”Stationary Phase “A”
Inlet Stationary Phase “A”
Detector “B”Stationary Phase “B”
39
Heart-cutting (2DGC)Heart cutting (2DGC)
DetectorDetector
Detector “A”
Detector “B”
43
Heart-Cut 2DGCHeart Cut 2DGC• Each column requires an independent detector
• Each Heart-Cut must be targeted at a specific coelution
T d t fil• Two data files
44
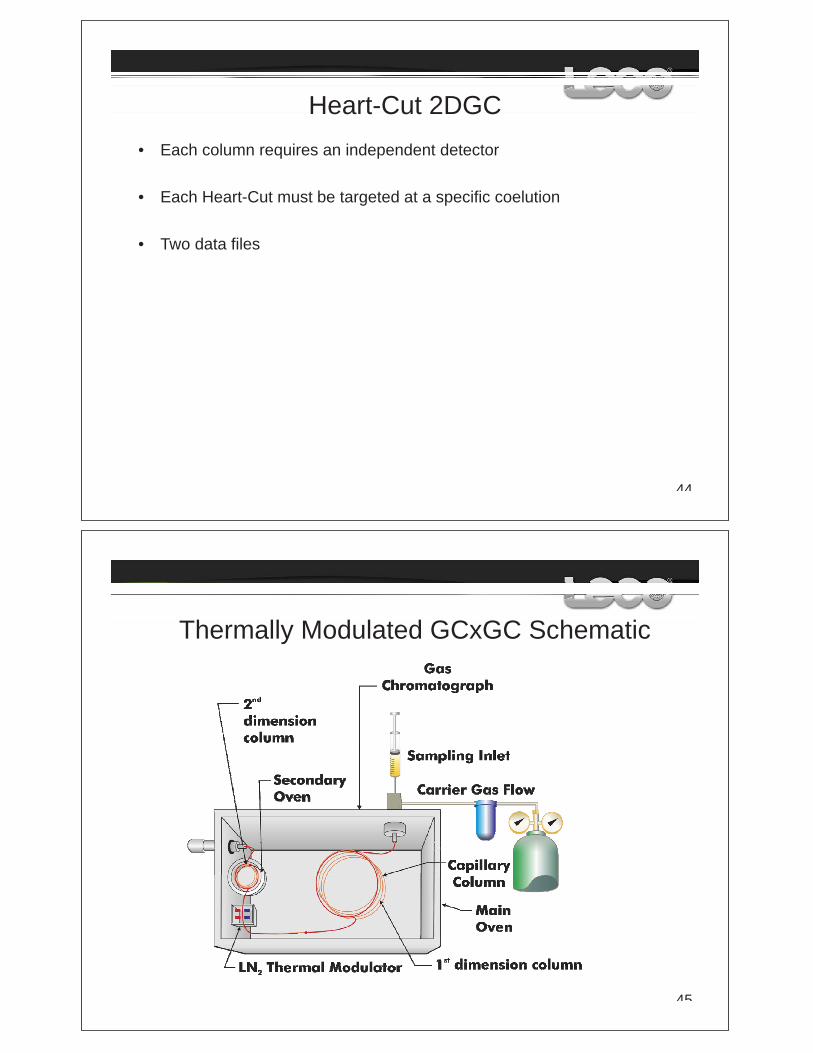
Th ll M d l t d GC GC S h tiThermally Modulated GCxGC Schematic
45

Simplified GCxGC FlowSimplified GCxGC Flow
DetectorModulatorInlet
1st Dimension Column 2nd Dimension Column
46
ModulationModulation
• Modulator has two functions in GCxGC:Modulator has two functions in GCxGC:
1) Collect and focus segments of effluent from the primary columncolumn
2) Act as the injector for the secondary column
47

Focusing in the Thermal ModulatorFocusing in the Thermal Modulator
Cold Zone
Relatively Broad 1st DimensionAnalyte Band
1st Dimension Column 2nd Dimension Column
48
Focusing in the Thermal ModulatorFocusing in the Thermal Modulator
54

Focusing in the Thermal ModulatorFocusing in the Thermal Modulator
56
Focusing in the Thermal ModulatorFocusing in the Thermal Modulator
Hot Zone
57

Detector Requirements for GCxGCDetector Requirements for GCxGC
Quantitation requires a minimum of 10 data points across a peak in order t d fi itto define it
50 ms peak width at base
N d 10 d t i t / kNeed 10 data points / peak
5 ms between data points
Minimum Required Sampling Rate:
60
50 ms200 Hz 200 Hz for a 50 ms wide peak
GCxGC HardwareGCxGC Hardware
Dual-Stage Quad-jet Thermal Modulator
• Utilizes LN2 or a Closed-loop Chiller for Cooling
• Utilizes an Secondary Oven for Independent Temperature Control of• Utilizes an Secondary Oven for Independent Temperature Control ofthe Individual Columns
• Modulation Occurs on the Beginning of the 2nd Dimension Columng g
61
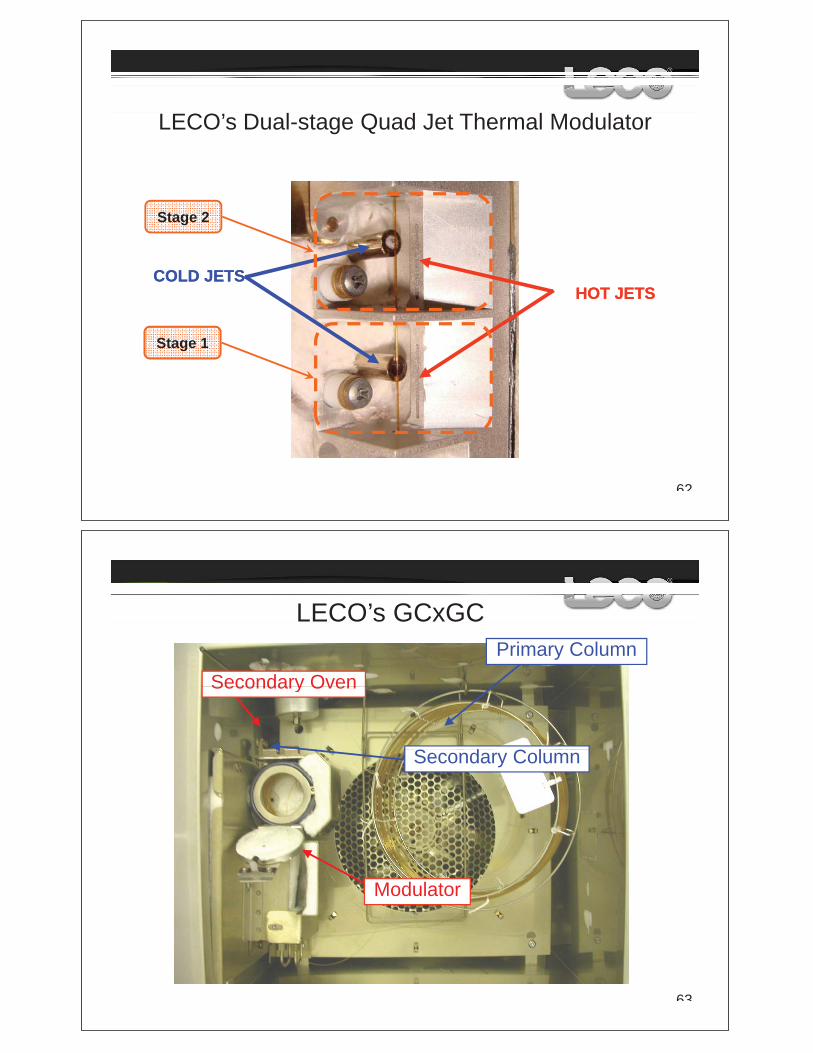
CO QLECO’s Dual-stage Quad Jet Thermal Modulator
Stage 2
COLD JETSCOLD JETSHOT JETSHOT JETS
Stage 1
62
LECO’s GCxGC
Secondary Oven
Primary Column
Secondary Oven
S d C lSecondary Column
Modulator
63

GCGC××GC: DualGC: Dual--stage Quadstage Quad--jet Thermal Modulationjet Thermal Modulation
1st Dimension Column 2nd Dimension Column
GCGC××GC: DualGC: Dual--stage Quadstage Quad--jet Thermal Modulationjet Thermal Modulation
Hot Jets
1 2
Hot Jets
1 2
Cold Jets
64
Cold Jets
GCxGC OverviewGCxGC Overview• GCxGC is accomplished through a series of rapid, independent 2nd
dimension separations
• The modulator serves two functions: focusing sections of 1st
dimension column effluent and acting as the injector for the 2nddimension column effluent and acting as the injector for the 2dimension column
• GCxGC is comprehensive All material that enters the 1st column• GCxGC is comprehensive. All material that enters the 1 columnpasses through the modulator, the 2nd column and on to the detector
82

GCxGC Overview• Primary column separates components
based on volatility and also generates wide bands
GCxGC Overview
wide bands
• The modulator focuses and re-injects time-fractions of the primary column effluent onto the second column for a second separation
– 5+ modulations per peak
• The second column performs a rapid p pseparation of each injected sample from the modulator based on polarity
– tm ~ 1.0 s for a 1.0m column
83
The GCxGC ProcessModulatorInlet
The signal as seen by the detector
0 25 I D
The GCxGC Process
Detector
0.25 mm I.D.0.10 mm I.D.
PrimaryColumn
SecondaryColumn
Th ffl t f th i l i f d d t d b th d l t i t
2nd
Col
umn
Sep
arat
ion
The effluent from the primary column is focused and segmented by the modulator intoa discrete “plug”. Each plug is then injected onto the secondary column by themodulator, where it is separated. The GCxGC process is a series of independentsecond column separations.
84
second column separations.
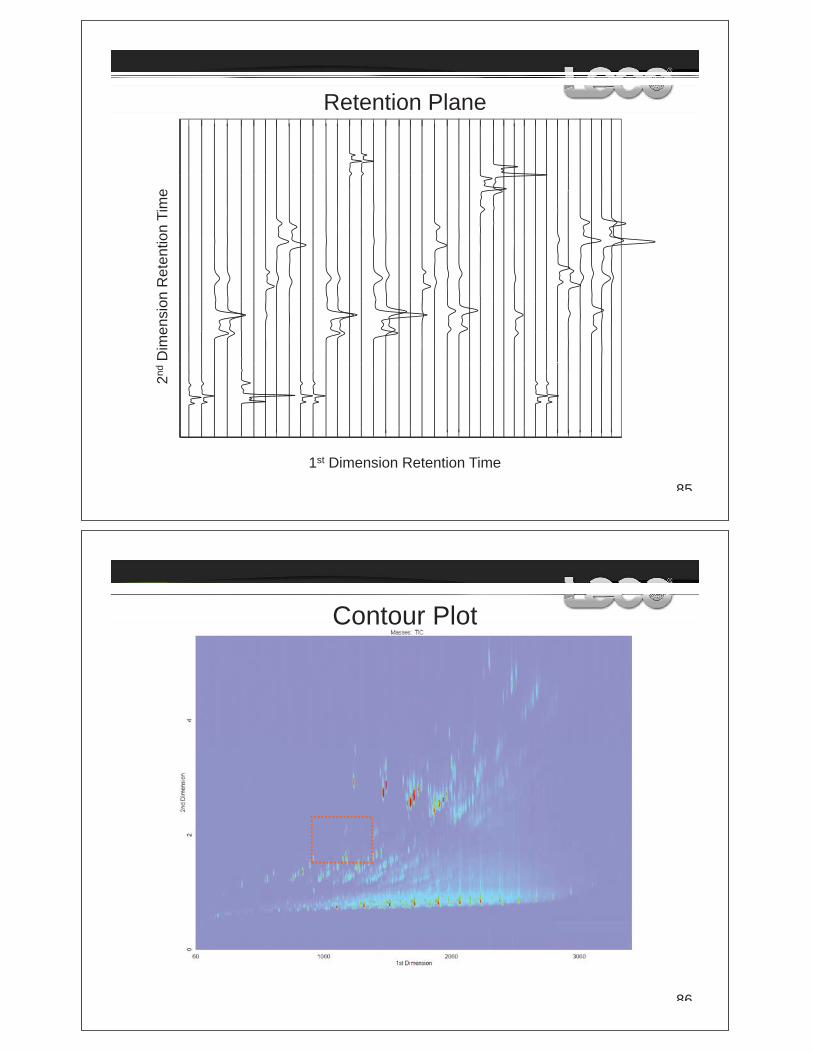
Retention Plane
on T
ime
on R
eten
tioD
imen
sio
2nd
85
1st Dimension Retention Time
Contour PlotContour Plot
86

Contour PlotContour Plot
87
Surface PlotSurface Plot
88

Features of a GCxGC Contour PlotFeatures of a GCxGC Contour Plot
Mor
e Alkyl-sub PhenanthrenesGCxGC of Raw Diesel
C1
C2
olar
ityW
ax)
Alkyl-sub Napthalenes
C2
Po (W
Alkyl-sub Benzenes
C1C2
C3 C4
C1 C2 C3
n-Alkanes
89
Boiling PointLower Higher
(5% diphenyl)
Less
GCxGC Applications
Environmental
Metabolomics
Petroleum• Diesel• Diesel• Gulf Oil Spill
90
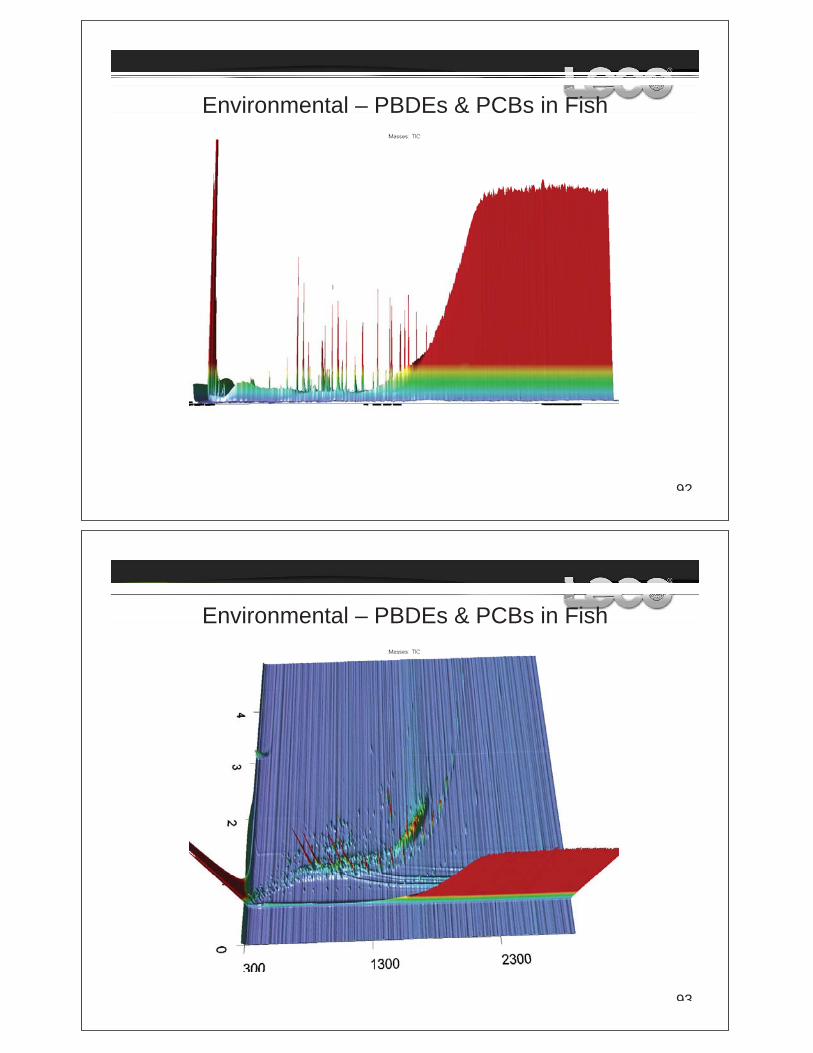
Environmental – PBDEs & PCBs in FishEnvironmental PBDEs & PCBs in Fish
92
Environmental – PBDEs & PCBs in FishEnvironmental PBDEs & PCBs in Fish
93

Environmental PBDEs & PCBs in FishEnvironmental – PBDEs & PCBs in Fish
94
Environmental – PBDEs & PCBs in FishEnvironmental PBDEs & PCBs in Fish
95

Environmental PBDEs & PCBs in FishEnvironmental – PBDEs & PCBs in Fish
tribromodiphenyl ether 5,8,11,14-eicosatetraynoic acid
dehydroabietic acid methyl ester
3-(4-Methoxyphenyl)-2-propenoic acid 2-ethylhexyl ester
5-heptyldihydro- 2(3H)-furanone
96
Environmental PBDEs & PCBs in FishEnvironmental – PBDEs & PCBs in Fish
5 8 11 14-eicosatetraynoic acidtribromodiphenyl ether
5,8,11,14-eicosatetraynoic acid
dehydroabietic acid methyl ester
5 heptyldihydro 2(3H) furanone5-heptyldihydro- 2(3H)-furanone
97
3-(4-Methoxyphenyl)-2-propenoic acid 2-ethylhexyl ester

Pre-Asparagus Consumption
9999
Post-Asparagus Consumption
1010

Post-Asparagus Consumption
1010
1010
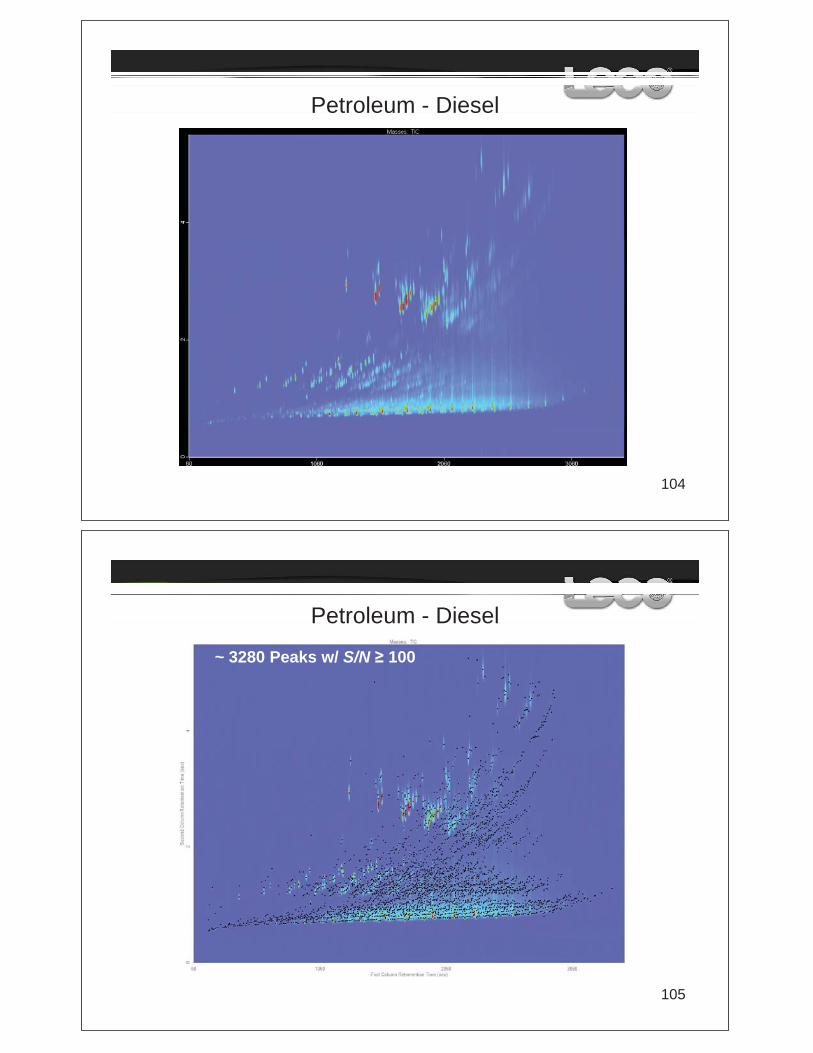
Petroleum - DieselPetroleum Diesel
104
Petroleum - DieselPetroleum Diesel
~ 3280 Peaks w/ S/N 100
105
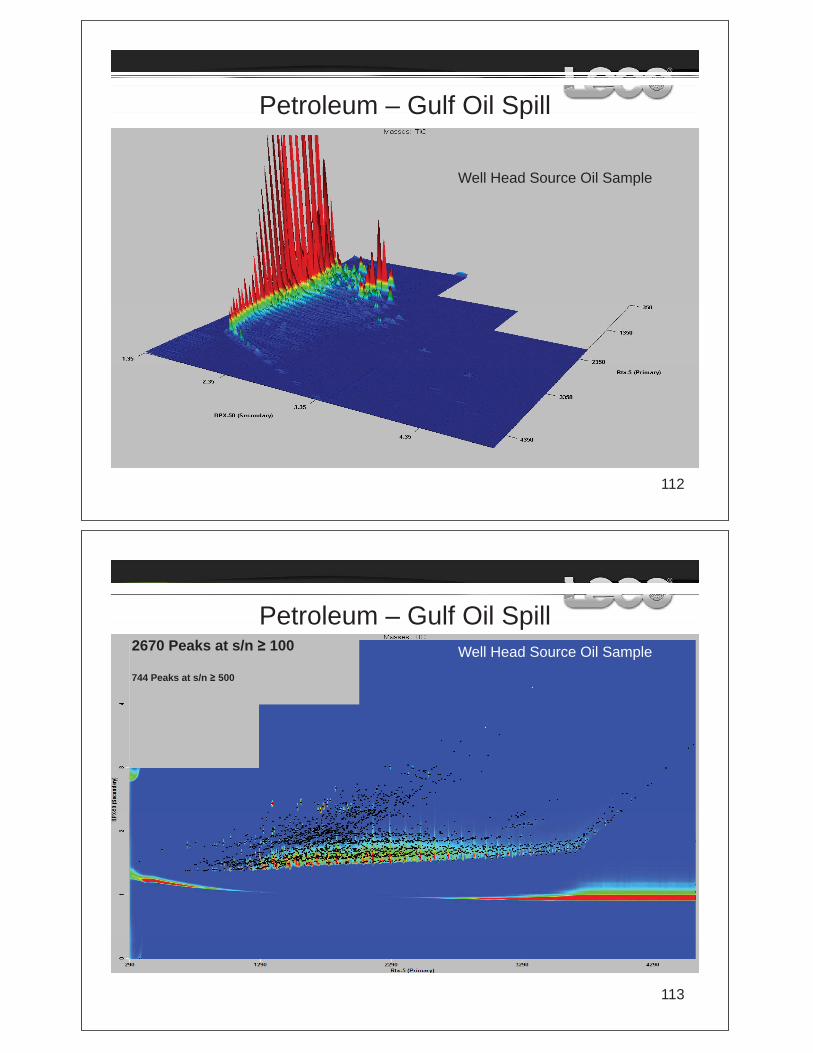
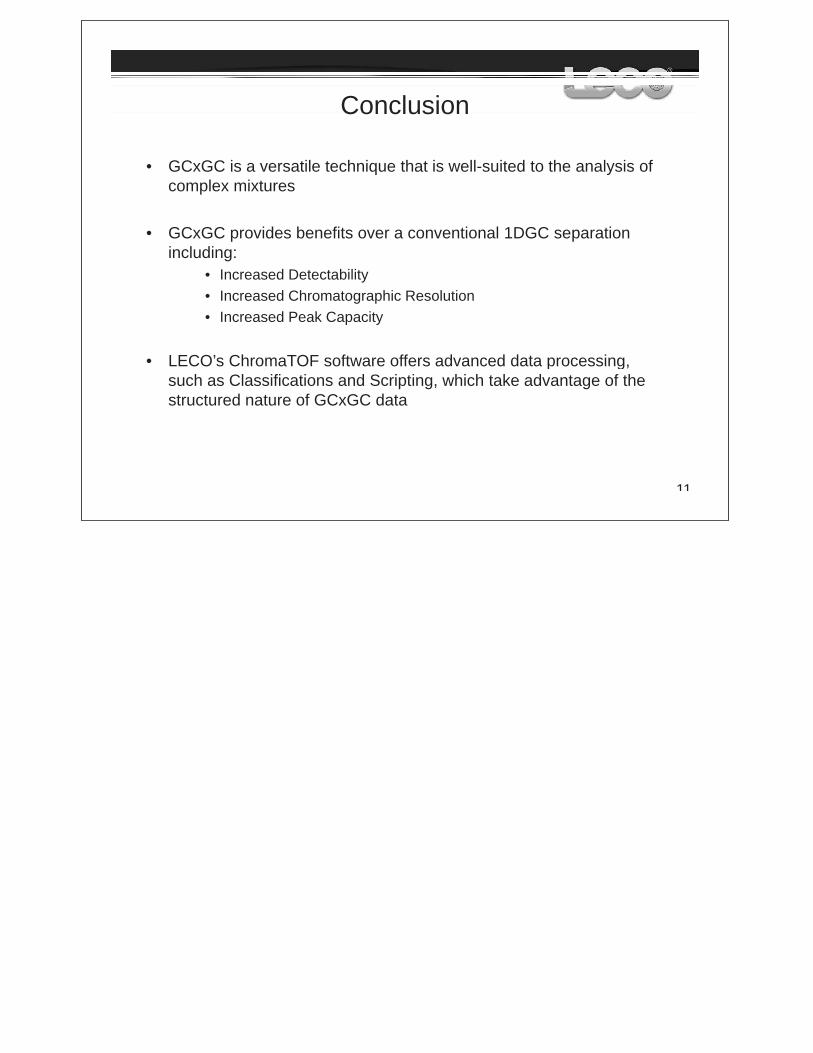
Petroleum – Gulf Oil SpillPetroleum Gulf Oil Spill
Well Head Source Oil SampleWell Head Source Oil Sample
112
Petroleum – Gulf Oil SpillPetroleum Gulf Oil Spill2670 Peaks at s/n 100
744 Peaks at s/n 500
Well Head Source Oil Sample
113
ConclusionConclusion
• GCxGC is a versatile technique that is well-suited to the analysis of complex mixtures
• GCxGC provides benefits over a conventional 1DGC separationp pincluding:
• Increased Detectability• Increased Chromatographic Resolutiong p• Increased Peak Capacity
• LECO’s ChromaTOF software offers advanced data processing,LECO s ChromaTOF software offers advanced data processing,such as Classifications and Scripting, which take advantage of the structured nature of GCxGC data
11