mass haul diagram - wordpress.com...mass haul diagrams to construct the mass haul diagram manually:...
TRANSCRIPT

MASS HAUL
DIAGRAM
Topic 3
Objective:
• Explain the basic concepts of the Mass Haul Diagram.
• Define the use of Mass Haul Diagram.
• Explain the methods used in the haulage of large volumes of earthwork calculation .
• Explain the method used in calculating the haulage of large volumes of earthwork for construction

INTRODUCTION
Mass-haul diagrams (MHD) are used to compare the economics
of the various methods of earthwork distribution on road or railway
construction schemes. With the combined use of the MHD plotted
directly below the longitudinal section of the survey centre-line, one
can find :
The distances over which ‘cut and fill’ will balance.
Quantities of materials to be moved and the direction of movement.
Areas where earth may have to be borrowed or wasted and the
amounts involved.
The best policy to adopt to obtain the most economic use of plan.
Mass Haul Diagrams
• Diagrammatic representation of
earthwork volumes along a linear
profile
• Horizontal stationing is plotted along
the X-axis
• Net earthwork values are plotted
along the Y-axis
Mass Haul Diagrams
• An Earthwork Profile is a plot of the net
earthwork along a roadway or airstrip
• Net cut values are plotted above the X-
axis (positive Y value)
• Net fill values are plotted below the X-
axis (negative Y value)
• Presents a picture of the earthwork
requirements

Mass Haul Diagrams
• Upward sloping curves indicate
(rising left to right) indicate a cut
• Downward sloping (falling left to
right) curves occur in a fill section
• Peaks indicate a change from cut to
fill and valleys occur when the
earthwork changes from fill to cut

Mass Haul Diagrams• The cumulated volume of earthwork at the
horizontal axis (Y=0) is 0
• When a horizontal line intersects two or more
points along the curve, the accumulated volumes at
those points are equal
• A negative value at the end of the curve indicates
that borrow is required to complete the fill
• A positive value at the end of the curve indicates
that a waste operation will be the net result
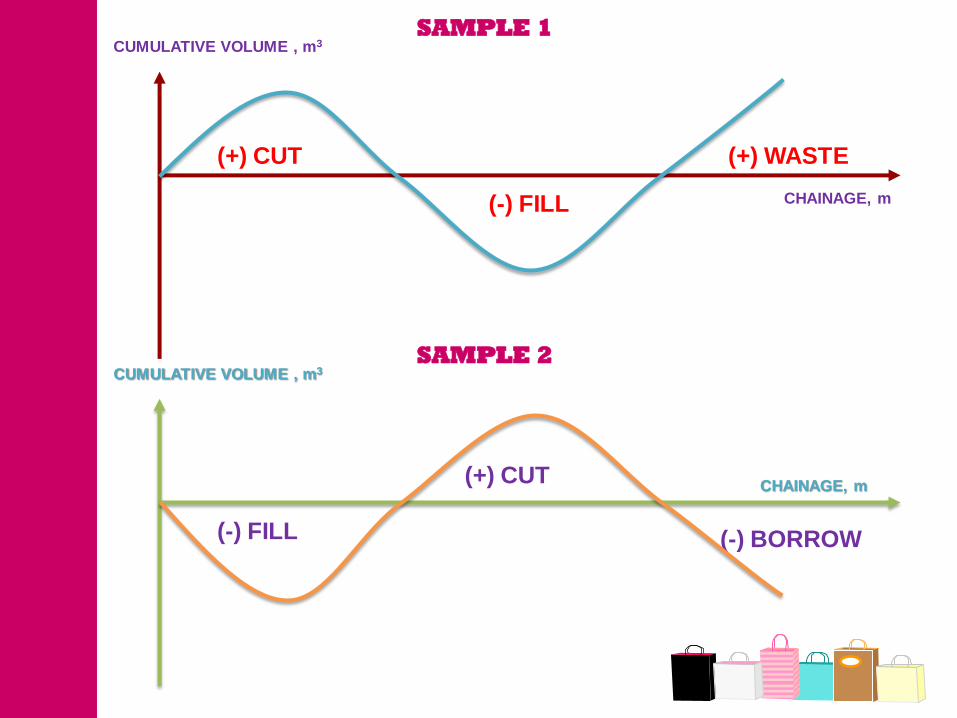
(+) CUT
(-) FILL
(+) WASTE
CUMULATIVE VOLUME , m3
CHAINAGE, m
SAMPLE 1
(+) CUT
(-) FILL (-) BORROW
CUMULATIVE VOLUME , m3
CHAINAGE, m
SAMPLE 2
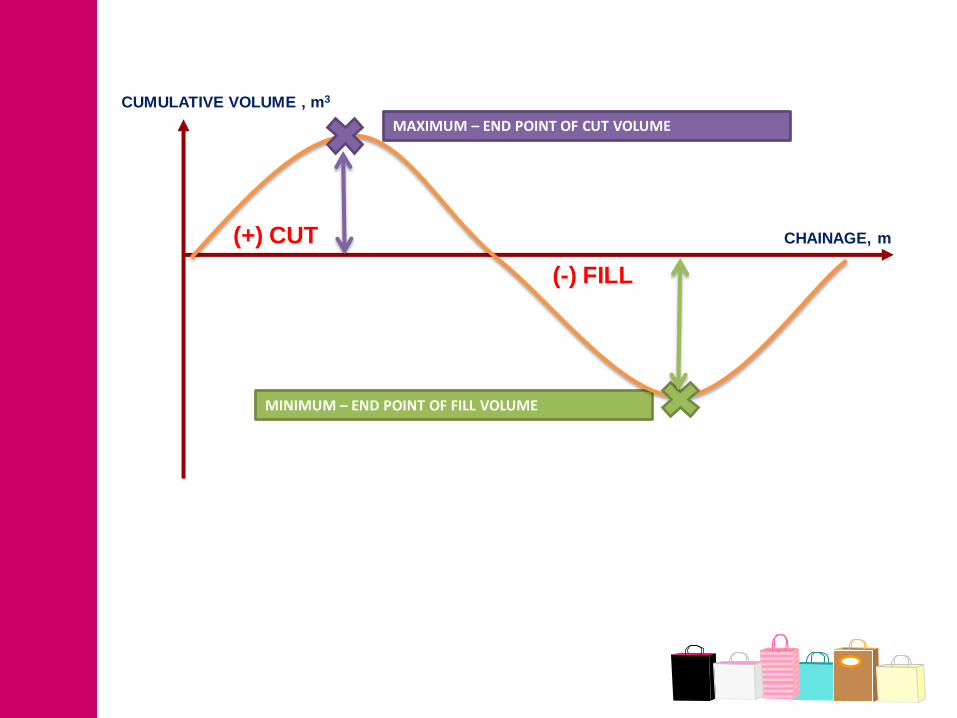
(+) CUT
(-) FILL
CUMULATIVE VOLUME , m3
CHAINAGE, m
MAXIMUM – END POINT OF CUT VOLUME
MINIMUM – END POINT OF FILL VOLUME

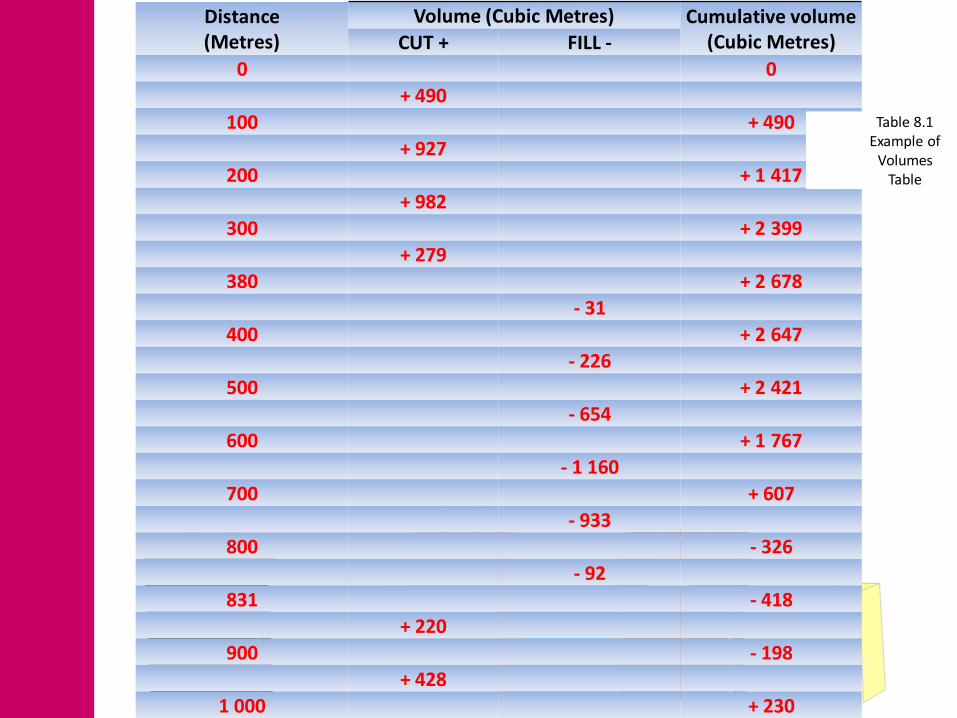
Mass Haul DiagramsTo construct the Mass Haul Diagram manually:
• Compute the net earthwork values for each
station, applying the appropriate shrink factor
• Net cuts have a positive value, net fills have a
negative value
• The value at the first station (origin) = 0
• Plot the value of each succeeding station which
equals the cumulative value to that point, i.e.,
the value at i = net cut/filla+b+c+…i
Distance(Metres)
Volume (Cubic Metres) Cumulative volume(Cubic Metres)CUT + FILL -
0 0
+ 490
100 + 490
+ 927
200 + 1 417
+ 982
300 + 2 399
+ 279
380 + 2 678
- 31
400 + 2 647
- 226
500 + 2 421
- 654
600 + 1 767
- 1 160
700 + 607
- 933
800 - 326
- 92
831 - 418
+ 220
900 - 198
+ 428
1 000 + 230
Table 8.1 Example of
Volumes Table
Characteristics of Mass Curve: 1- Rising sections of the mass curve indicates areas where excavating exceeds fill, whereas falling sections indicate where fill exceeds excavation. 2- Steep slopes reflect heavy cuts & Fills, while flat slopes indicate areas fro small amount of earthwork. 3- The difference in ordinates between any two points indicate net excess of excavation over embankment or vise versa. 4- Any horizontal line dawn to intersect two points within the same curve indicates a balance of excavation (cut) and embankment (fill) quantities between the two points. 5- Points of zero slope represent points where roadway goes from cut to fill or from fill to cut. 6- The highest or the lowest points of the mass haul diagram represents the crossing points between the grade line (roadway level) and natural ground level.
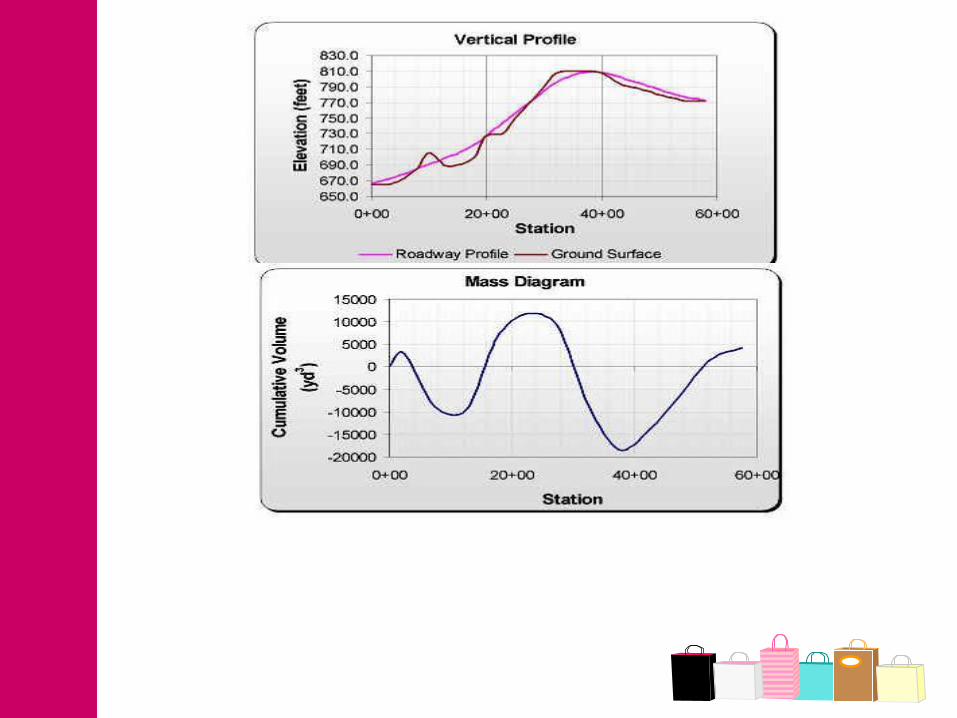

Mass Haul Diagram
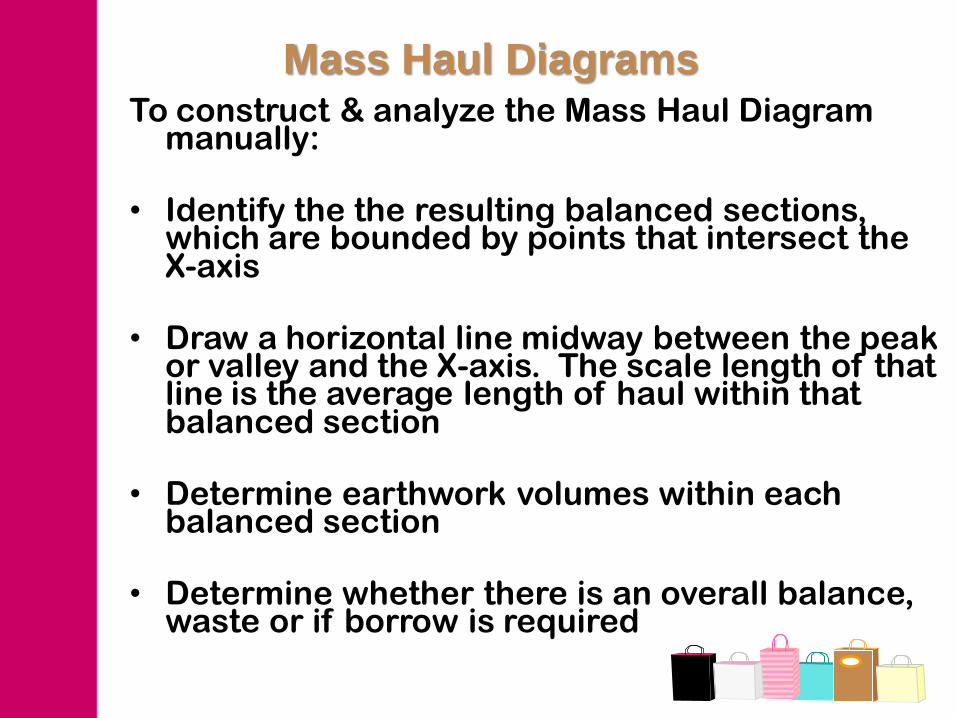
Mass Haul DiagramsTo construct & analyze the Mass Haul Diagram
manually:
• Identify the the resulting balanced sections, which are bounded by points that intersect the X-axis
• Draw a horizontal line midway between the peak or valley and the X-axis. The scale length of that line is the average length of haul within that balanced section
• Determine earthwork volumes within each balanced section
• Determine whether there is an overall balance, waste or if borrow is required
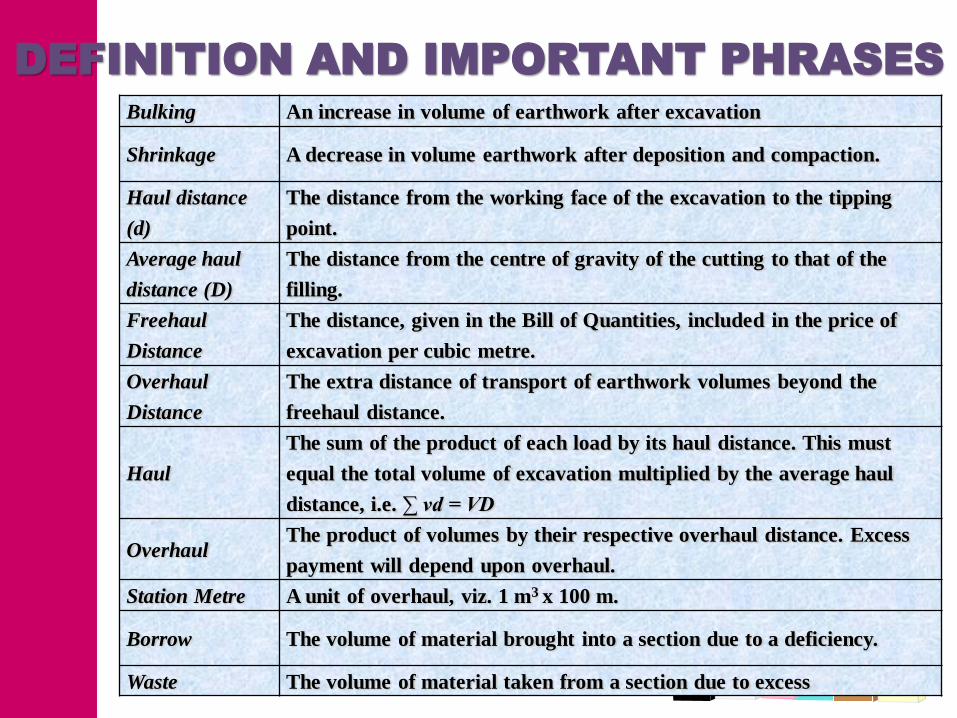
DEFINITION AND IMPORTANT PHRASES
Bulking An increase in volume of earthwork after excavation
Shrinkage A decrease in volume earthwork after deposition and compaction.
Haul distance
(d)
The distance from the working face of the excavation to the tipping
point.
Average haul
distance (D)
The distance from the centre of gravity of the cutting to that of the
filling.
Freehaul
Distance
The distance, given in the Bill of Quantities, included in the price of
excavation per cubic metre.
Overhaul
Distance
The extra distance of transport of earthwork volumes beyond the
freehaul distance.
Haul
The sum of the product of each load by its haul distance. This must
equal the total volume of excavation multiplied by the average haul
distance, i.e. ∑ vd = VD
OverhaulThe product of volumes by their respective overhaul distance. Excess
payment will depend upon overhaul.
Station Metre A unit of overhaul, viz. 1 m3 x 100 m.
Borrow The volume of material brought into a section due to a deficiency.
Waste The volume of material taken from a section due to excess

CASE 1 Chainage
(m)Volume of cutting
(m3)Volume of fill (m3)
0
100 22275
200 13902
300 2268
400 17744
500 14256
600 900
Calculate the cumulative volume with Shrinkage Factor 10%
SolutionChainage
(m)Volume of cutting (m3)
Volume of fill (m3)
Shrinkagevolume (10%)
Skrinkagevolume corrected
Correctedvolume
Cumulative volume (m3)
(1) (2) (3) (4) (5)= (3)+(4) + for cut
- for fill
0 0 0
100 22275 +22275 22275
200 13902 +13902 36177
300 2268 226.8 2494.8 -2494.8 33682.2
400 17744 1774.4 19518.4 -19518.4 14163.8
500 14256 1425.6 15684.6 -15684.6 -1517.8
600 900 90 990 -990 -2057.8
+
+
+

-5000
0
5000
10000
15000
20000
25000
30000
35000
40000
0 100 200 300 400 500 600
CU
MU
LATI
VE
VO
LUM
E ,m
3
CHAINAGE, m
CASE 1 - MASS HAUL DIAGRAMME (CUMULATIVE VOLUME VS CHAINAGE)
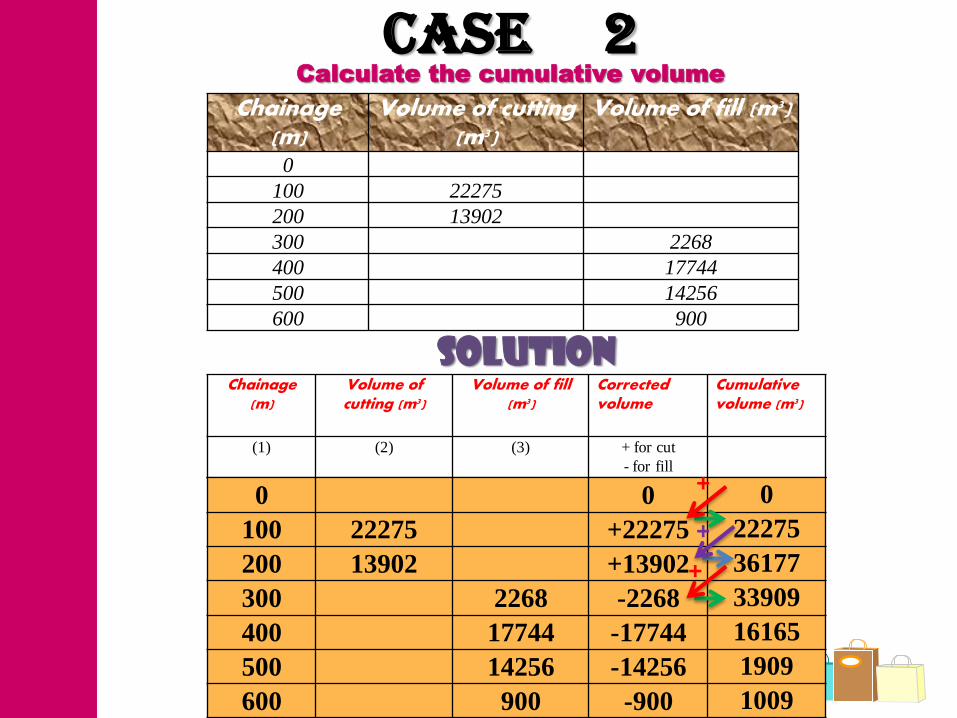
CASE 2 Chainage
(m)Volume of cutting
(m3)Volume of fill (m3)
0
100 22275
200 13902
300 2268
400 17744
500 14256
600 900
Calculate the cumulative volume
SolutionChainage
(m)Volume of cutting (m3)
Volume of fill (m3)
Correctedvolume
Cumulative volume (m3)
(1) (2) (3) + for cut
- for fill
0 0 0
100 22275 +22275 22275
200 13902 +13902 36177
300 2268 -2268 33909
400 17744 -17744 16165
500 14256 -14256 1909
600 900 -900 1009
+
+
+
0
5000
10000
15000
20000
25000
30000
35000
40000
0 100 200 300 400 500 600
CU
MU
LATI
VE
VO
LUM
E ,m
3
CHAINAGE, m
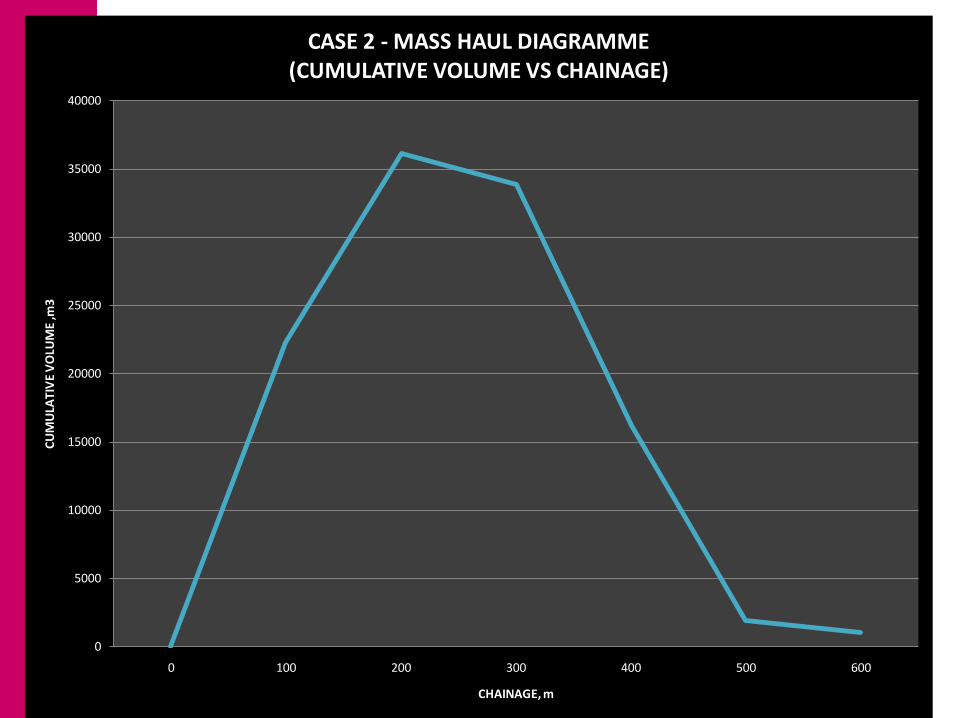
CASE 2 - MASS HAUL DIAGRAMME (CUMULATIVE VOLUME VS CHAINAGE)
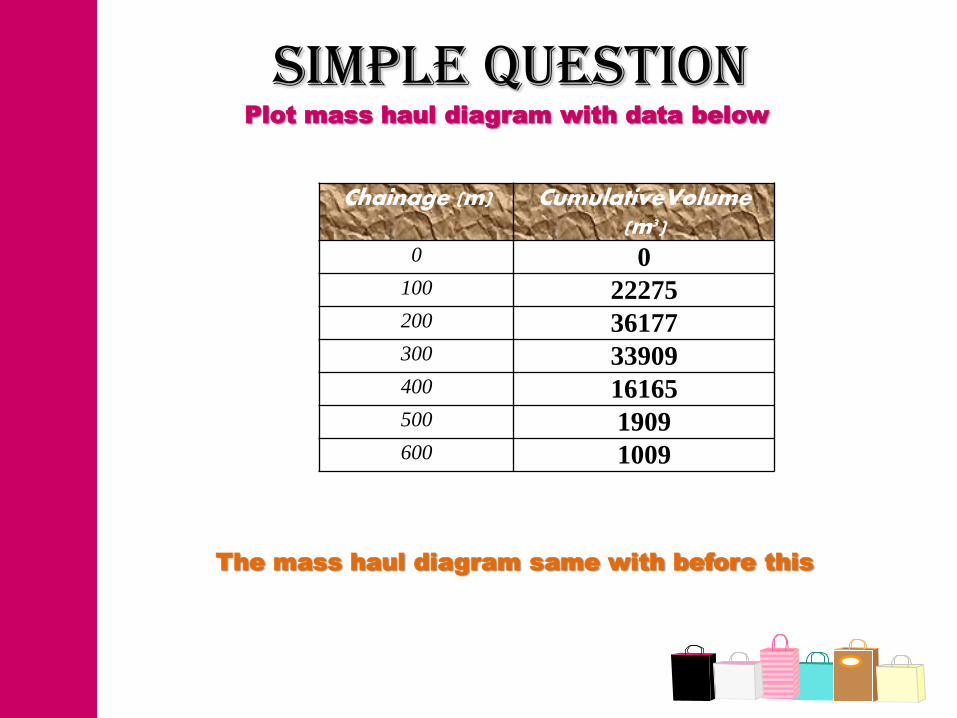
SIMPLE QUESTION
Chainage (m) CumulativeVolume(m3)
0 0100 22275200 36177300 33909400 16165500 1909600 1009
Plot mass haul diagram with data below
The mass haul diagram same with before this
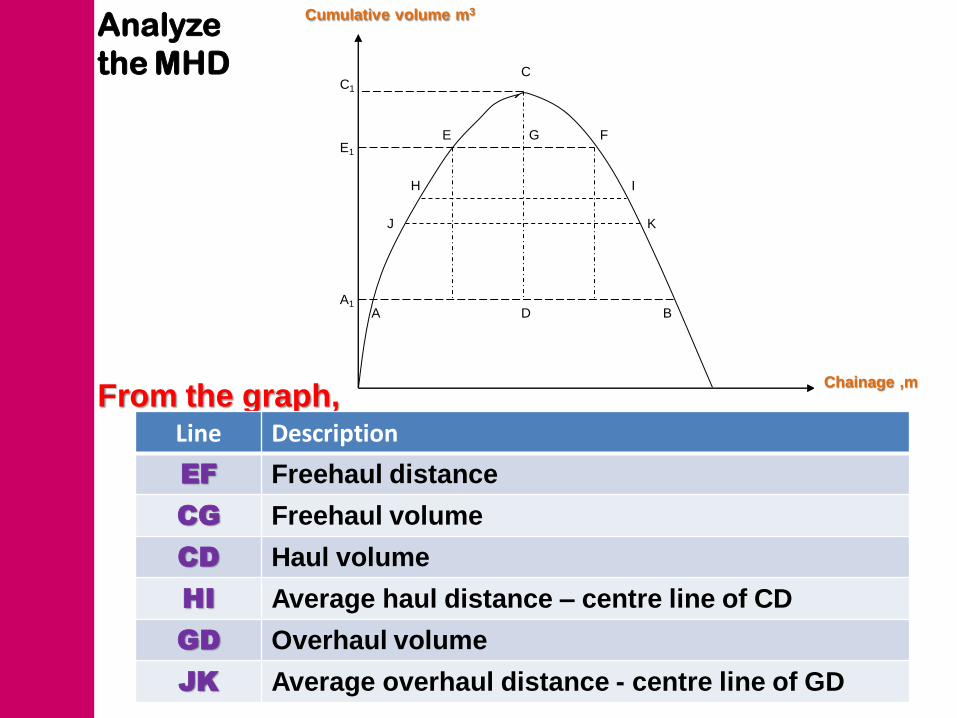
Analyze
the MHD
Rantaian (m)
Isipadu Kumulatif (m3)
A B
C
D
E FG
H I
J K
A1
E1
C1
Gambarajah 7.2 : Lengkung Gambarajah Urungan Padu
Cumulative volume m3
Chainage ,m
From the graph,Line Description
EF Freehaul distance
CG Freehaul volume
CD Haul volume
HI Average haul distance – centre line of CD
GD Overhaul volume
JK Average overhaul distance - centre line of GD
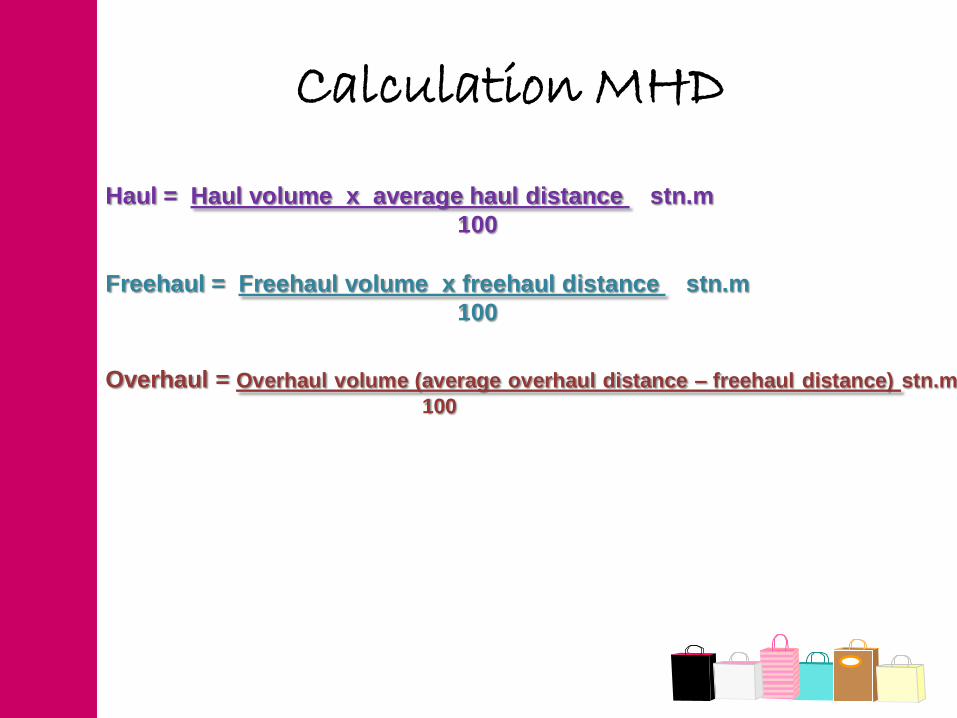
Calculation MHD
Overhaul = Overhaul volume (average overhaul distance – freehaul distance) stn.m
100
Freehaul = Freehaul volume x freehaul distance stn.m
100
Haul = Haul volume x average haul distance stn.m
100

Cost of earthwork
TOTAL COST OF EARTHWORK
Freehaul prices in freehaul distance
= freehaul volume x freehaul distance x freehaulprices
Overhaul prices in freehauldistance
= overhaul volume x freehaul distance x freehaulprices
Overhaul prices in overhaul distance
= overhaul volume x (average overhaul distance –freehaul distance) x overhaul prices
Borrow prices = borrow volume x borrow prices
Waste prices = waste volume x waste prices

End of topic
• Exercise