maryland offshore wind developmentenergy.maryland.gov/documents/maryland offshore wind...
TRANSCRIPT

Maryland Offshore Wind Development:
Regulatory Environment,
Potential Interconnection Points, Simplified Investment Model,
and Select Conflict Areas
A Study Commissioned by The Maryland Energy Administration
Center for Integrative Environmental Research (CIER) University of Maryland
April 2010

Research Team Yohan Shim Research Associate, Center for Integrative Environmental Research, and Department of Civil and Environmental Engineering University of Maryland Andrew Blohm Faculty Research Assistant, Center for Integrative Environmental Research, University of Maryland Sean Williamson Faculty Research Assistant, Center for Integrative Environmental Research, University of Maryland Jeremy Peichel Graduate Research Assistant, Center for Integrative Environmental Research, University of Maryland Matthias Ruth Director, Center for Integrative Environmental Research, and Roy F. Weston Chair for Natural Economics University of Maryland Junming Zhu Graduate Research Assistant, Center for Integrative Environmental Research, University of Maryland
Cover Photo: LM Glasfiber The Center for Integrative Environmental Research (CIER) at the University of Maryland addresses complex environmental challenges through research that explores the dynamic interactions among environmental, economic and social forces and stimulates active dialogue with stakeholders, researchers and decision makers. Researchers and students at CIER, working at local, regional, national and global scales, are developing strategies and tools to guide policy and investment decisions. For additional information, please visit www.cier.umd.edu.
1
Table of Contents Acknowledgements ................................................................................................................................. 4
List of Figures ......................................................................................................................................... 5
List of Tables ........................................................................................................................................... 5
List of Acronyms and Definitions Used ................................................................................................. 6
Summary of GIS Files and Metadata ...................................................................................................... 7
Executive Summary .............................................................................................................................. 10
1. Introduction ............................................................................................................................... 10
2. Major Findings .......................................................................................................................... 11
3. Limitations ................................................................................................................................ 13
4. Future Research ........................................................................................................................ 14
5. References ................................................................................................................................. 15
I. An Assessment of the Policy and Regulatory Context for Offshore Wind in Maryland ................... 17
1. Introduction ............................................................................................................................... 17
2. Renewable Portfolio Standards ................................................................................................. 18
3. Development in Federal Waters: The Role of the Minerals Management Service ................... 19
4. PJM Generator Interconnection Process ................................................................................... 21
4.1. Generation Interconnection Planning Process .................................................................. 22
4.2. Generation and Transmission Interconnection Facility Construction Phase..................... 23
4.3. Markets and Operations Phase .......................................................................................... 24
5. Role of the Federal Energy Regulatory Commission and Maryland Public Service Commission
in Offshore Wind Transmission ........................................................................................................ 24
6. References ................................................................................................................................. 26
7. Appendices ................................................................................................................................ 29
Appendix A: Renewable Portfolio Standard Implementation Schedule (Source: PSC, 2009a) ... 29
II. An Assessment of Potential Interconnection Points for Offshore Wind .......................................... 30
1. Introduction ............................................................................................................................... 30
2. Delmarva Peninsula Transmission Grid: Planned System Upgrades and Status ...................... 30
2.1. Proposed PJM Backbone Projects (PJM, 2008c) .............................................................. 31
2.2. RTEP Upgrades on the Delmarva Peninsula (Proposed) .................................................. 33
3. Interconnecting to the Onshore Transmission Grid .................................................................. 34
3.1. Case Study: Bluewater Wind–Potential Impacts on the Transmission System and
Network Reinforcement ................................................................................................................ 35
4. Optimal Interconnection Points ................................................................................................ 38
2
5. References ................................................................................................................................. 40
III. An Investment Model: Collection and Transmission Systems for Offshore Wind Power ............. 44
1. Introduction ............................................................................................................................... 44
2. Offshore Wind-Europe and the United States ........................................................................... 45
2.1. European Experiences with Offshore Wind ...................................................................... 47
2.2. Planned Offshore Wind Projects in the United States....................................................... 48
2.2.1. Cape Wind – Cape Cod, Massachusetts ........................................................................ 49
2.2.2. Bluewater Wind - Bethany Beach, Delaware ............................................................... 49
2.2.3. New York City/Long Island Offshore Wind – Rockaway Peninsula, New York ......... 50
3. Bathymetry Data Analysis: Capabilities and Limitations of Offshore Wind Foundation
Technologies ..................................................................................................................................... 51
3.1. Bathymetry Data Analysis ................................................................................................ 52
4. Offshore Wind Farm Component Costs: Wind turbines, foundations, transmission and
collection systems ............................................................................................................................. 53
4.1. Wind Turbines and Foundations ....................................................................................... 54
4.2. Collection and Transmission System ................................................................................ 56
4.3. Collection System ............................................................................................................. 56
4.4. Analysis of characteristics and costs of three transmission systems ................................. 57
4.5. HVAC Transmission System ............................................................................................ 57
4.5.1. HVDC LCC Transmission System ............................................................................... 59
4.5.2. HVDC VSC Transmission System ............................................................................... 59
5. Scenario Analysis of Costs ....................................................................................................... 61
5.1. Scenario 1: 600 MW Wind Farm in Shallow Water with HVAC Transmission System . 62
5.2. Scenario 2: 1,000 MW Wind Farm in Deep Water with HVDC Transmission System ... 65
5.3. Findings: Cost Comparison of Scenarios 1 & 2 ................................................................ 68
6. References ................................................................................................................................. 69
7. Appendices ................................................................................................................................ 73
Appendix A: Existing and Planned Wind Farms in North West Europe, June 2007 (Source:
Offshore Wind Energy, http://www.offshorewindenergy.org) ..................................................... 73
Appendix B: Wind farms in North West Europe – Detailed Information (Source: Breton and Moe,
2009) ............................................................................................................................................. 74
Appendix C: Offshore Wind Turbine Manufacturers (Source: EWEA, 2009a) ........................... 75
Appendix D: Overview of the Different Types of Substructures (Source: EWEA, 2009a) ......... 77
Appendix E: Wind Turbines Above 50 m Diameter (Source: Duwind, 2001) ............................. 79
IV. Offshore Wind Turbines, Radar Functionality and mid-Atlantic Operations ................................. 81
1. Introduction ............................................................................................................................... 81
3
2. Radar-Wind Turbine Development Interactions ....................................................................... 81
2.1. Background ....................................................................................................................... 81
2.2. Radar Types ...................................................................................................................... 82
2.3. Interference Variables ....................................................................................................... 83
3. Mid-Atlantic Fixed Radar Facilities ......................................................................................... 84
3.1. Radar Facilities With High Likelihood of Interference .................................................... 84
3.1.1. NASA Wallops Flight Facility ...................................................................................... 84
3.1.2. Other Area Radar Facilities ........................................................................................... 86
4. Approach and Findings ............................................................................................................. 87
4.1. Data Layer Methodology .................................................................................................. 87
4.2. Findings for Wallops Flight Facility ................................................................................. 87
5. Mid-Atlantic Operations (Military and Research) .................................................................... 88
5.1. Areas with High Likelihood for Conflict .......................................................................... 89
5.1.1. VACAPES Operating Area ........................................................................................... 89
5.1.1.1. Flight Testing ............................................................................................................ 89
5.1.1.2. Munitions Deployment ............................................................................................. 90
5.1.1.3. General Training Exercises ....................................................................................... 90
5.1.1.4. Other Operations ....................................................................................................... 90
5.1.2. Wallops Flight Facility Range Hazard Area ................................................................. 90
5.1.3. Approach and Findings ................................................................................................. 91
6. Discussion and Conclusion ....................................................................................................... 91
7. References ................................................................................................................................. 92
8. Appendices ................................................................................................................................ 94
Appendix A: Maryland state waters and radar line-of-sight, Dover AFB (Source: FAA-DoD
2009) ............................................................................................................................................. 94
Appendix B :Radar line-of-sight, PAX NAS (Source: Linn, 2009).............................................. 96
Appendix C: Map of VACAPES Operating Area W-386 and specific sub-areas (Source: U.S.
DoD, 2001) ................................................................................................................................... 97

4
Acknowledgements
This report was written by a team consisting of Yohan Shim (CIER), Andrew Blohm (CIER), Sean
Williamson (CIER), Matthias Ruth (CIER), Junming Zhu (CIER), and Jeremy Peichel (CIER). The authors would like to thank the following individuals and organizations for the time and insight
they so generously offered to our research: Rick Owen, Naval Facilities Washington; Bill Mitchell,
PHI; Ray Bourland, PHI; Patuxent Naval Air Station, Ranges Sustainability Office; Roger Davis,
RSBP, LLC; Wayne Johnson, WICC, TranSystems; Michael Lee, MD PSC; John Sherwell, MD DNR;
and Maryland Department of Natural Resources. We also thank The Maryland Energy Administration
for supporting the research presented in this report.

5
List of Figures
Figure 1-PHI Substations and Transmission Lines on the Delmarva Peninsula (Source: Pepco Holding,
Inc., 2009), ................................................................................................................................... 12
Figure 2-PJM Interconnection Process Overview (Source: PJM, 2009) .............................................. 22 Figure 3-PJM Proposed Backbone projects (Source: PJM, 2009a) ...................................................... 32 Figure 4-Diagram of Direct Connection in PJM Queue T122 (Source: PJM, 2009f) .......................... 36 Figure 5-PJM Queue T122 System Upgrade – Cost Distribution (Source: PJM, 2009f) ..................... 37 Figure 6-PHI Substations and Transmission Lines on the Delmarva Peninsula (Source: Pepco
Holding, Inc., 2009) ..................................................................................................................... 39
Figure 7-Cape Wind Project, MA (Source: MMS, 2005) ..................................................................... 50 Figure 8-Bluewater Wind Project, DE (Source: DPL, 2009) ............................................................... 50 Figure 9-Long Island, New York City Offshore Wind Park Project (Source: Long Island Offshore
Wind Park, 2005) .......................................................................................................................... 51 Figure 10-Bathymetric Map: Water Depths of the Atlantic Ocean adjacent to Maryland .................... 53 Figure 11-Curve Fitting for WT Cost ($ million per unit) with respect to Wind Turbine Size (MW) .. 55 Figure 12-600 MW Wind Farm Layout with 3 MW Wind Turbines .................................................... 63 Figure 13-1,000 MW Wind Farm Layout with 5 MW Wind Turbines ................................................. 66 Figure 14-Cost Distribution for 600 MW Wind Farm Scenario ........................................................... 69 Figure 15-Cost Distribution for 1,000 MW Wind Farm Scenario ........................................................ 69 Figure 16-Measured Doppler Effect Caused by Wind Turbines (Source: U.S. DoD, 2006) ................ 84
List of Tables
Table 1-Geographic Information System (GIS) Data Files and Chapter of Use .................................... 7 Table 2-PJM Proposed Backbone Projects (Source: PHI, 2009a; AEP et al., 2009; PPL, 2008; PSE&G,
2009; PJM, 2009a; Allegheny Energy, 2009; Dominion, 2008) ................................................... 33 Table 3-Transmission Expansion Plans on the Delmarva Peninsula (Source: PJM, 2008c) ................ 33 Table 4-Average Investment Cost per MW: Offshore Wind Farms Horns Rev and Nysted (Source:
EWEA, 2009b) ............................................................................................................................. 47 Table 5-European Offshore Wind Farms (2001-2008) (Source: EWEA, 2009b) ................................. 48 Table 6-Proposed US Commercial Offshore Wind Projects (Source: MMS, 2009h) ........................... 49 Table 7-Component Costs: Turbines and Foundations ......................................................................... 54 Table 8-Cost of AC Collection Cables.................................................................................................. 56 Table 9-Component Cost: HVAC Transmission System ...................................................................... 58 Table 10-Component Cost: HVDC LCC Transmission System ........................................................... 59 Table 11-Component Cost: HVDC VSC Transmission System ........................................................... 60 Table 12-600 MW Wind Farm Parameters ........................................................................................... 63 Table 13-Cost for a 600 MW Offshore Wind Farm .............................................................................. 64 Table 14-1,000 MW Wind Farm Parameters ........................................................................................ 66 Table 15-Cost for a 1,000 MW Offshore Wind Farm ........................................................................... 67 Table 16-NASA Wallops Flight Facility Overview .............................................................................. 84 Table 17-Fixed Radar Systems and Parameters at WFF ....................................................................... 85 Table 18-WFF Radar Line-of-Sight Radii with Highlight of Tallest Radar Antenna ........................... 88
6
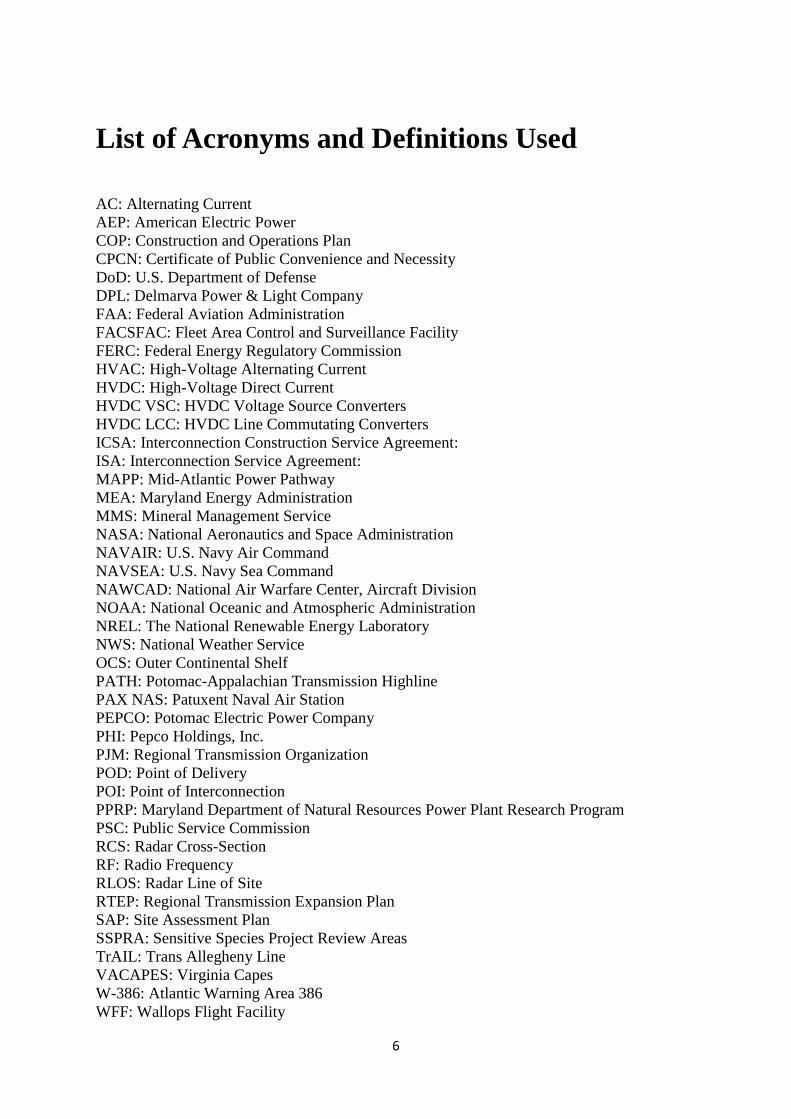
List of Acronyms and Definitions Used
AC: Alternating Current
AEP: American Electric Power
COP: Construction and Operations Plan
CPCN: Certificate of Public Convenience and Necessity
DoD: U.S. Department of Defense
DPL: Delmarva Power & Light Company
FAA: Federal Aviation Administration
FACSFAC: Fleet Area Control and Surveillance Facility
FERC: Federal Energy Regulatory Commission
HVAC: High-Voltage Alternating Current
HVDC: High-Voltage Direct Current
HVDC VSC: HVDC Voltage Source Converters
HVDC LCC: HVDC Line Commutating Converters
ICSA: Interconnection Construction Service Agreement:
ISA: Interconnection Service Agreement:
MAPP: Mid-Atlantic Power Pathway
MEA: Maryland Energy Administration
MMS: Mineral Management Service
NASA: National Aeronautics and Space Administration
NAVAIR: U.S. Navy Air Command
NAVSEA: U.S. Navy Sea Command
NAWCAD: National Air Warfare Center, Aircraft Division
NOAA: National Oceanic and Atmospheric Administration
NREL: The National Renewable Energy Laboratory
NWS: National Weather Service
OCS: Outer Continental Shelf
PATH: Potomac-Appalachian Transmission Highline
PAX NAS: Patuxent Naval Air Station
PEPCO: Potomac Electric Power Company
PHI: Pepco Holdings, Inc.
PJM: Regional Transmission Organization
POD: Point of Delivery
POI: Point of Interconnection
PPRP: Maryland Department of Natural Resources Power Plant Research Program
PSC: Public Service Commission
RCS: Radar Cross-Section
RF: Radio Frequency
RLOS: Radar Line of Site
RTEP: Regional Transmission Expansion Plan
SAP: Site Assessment Plan
SSPRA: Sensitive Species Project Review Areas
TrAIL: Trans Allegheny Line
VACAPES: Virginia Capes
W-386: Atlantic Warning Area 386
WFF: Wallops Flight Facility
7
Summary of GIS Files and Metadata
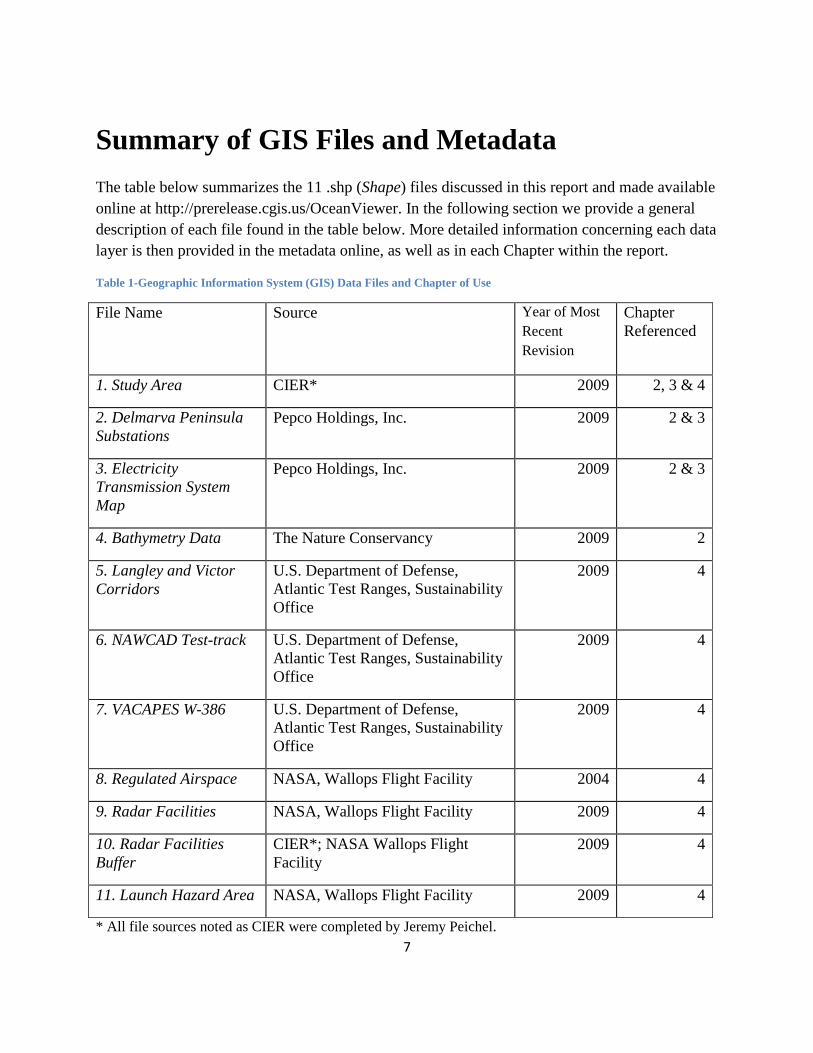
The table below summarizes the 11 .shp (Shape) files discussed in this report and made available
online at http://prerelease.cgis.us/OceanViewer. In the following section we provide a general
description of each file found in the table below. More detailed information concerning each data
layer is then provided in the metadata online, as well as in each Chapter within the report.
Table 1-Geographic Information System (GIS) Data Files and Chapter of Use
File Name Source Year of Most
Recent
Revision
Chapter
Referenced
1. Study Area CIER* 2009 2, 3 & 4
2. Delmarva Peninsula
Substations
Pepco Holdings, Inc. 2009 2 & 3
3. Electricity
Transmission System
Map
Pepco Holdings, Inc. 2009 2 & 3
4. Bathymetry Data The Nature Conservancy 2009 2
5. Langley and Victor
Corridors
U.S. Department of Defense,
Atlantic Test Ranges, Sustainability
Office
2009 4
6. NAWCAD Test-track U.S. Department of Defense,
Atlantic Test Ranges, Sustainability
Office
2009 4
7. VACAPES W-386 U.S. Department of Defense,
Atlantic Test Ranges, Sustainability
Office
2009 4
8. Regulated Airspace NASA, Wallops Flight Facility 2004 4
9. Radar Facilities NASA, Wallops Flight Facility 2009 4
10. Radar Facilities
Buffer
CIER*; NASA Wallops Flight
Facility
2009 4
11. Launch Hazard Area NASA, Wallops Flight Facility 2009 4
* All file sources noted as CIER were completed by Jeremy Peichel.

8
1. Study Area: Polygon represents the designated study area for offshore wind considered at this
time. The area is defined as extending 64 kilometers from the Maryland shoreline.
2. Delmarva Peninsula Substations: The points in this data file represent the locations of
substations on the Delmarva Peninsula that have the potential to serve as interconnection points
for offshore wind. A letter of the alphabet is used in place of substation name to refer to
individual substations. Pepco Holdings, Inc., which provided the data for this layer, has
classified this information as critical infrastructure and consequently we are unable to publish
both the name and location of each substation. The Federal Energy Regulatory Commission
(FERC) refers to the discretion of local utilities on matters pertaining to the classification of
critical infrastructure.
3. Electricity Transmission System Map: Lines represent the voltage and location of the
transmission grid on the Delmarva Peninsula. Pepco Holdings, Inc. provides the data for this
layer with supplementary data pertaining to planned improvements provided by PJM.
4. Bathymetry Data: The Nature Conservancy provides the underlying water depth data found in
this section. The depth data is broken into three separate categories based upon the anchoring
technologies necessary for operation. The three categories are defined as follows; first, shallow
water; less than 30 meters; second, transitional waters; 31 meters to 60 meters; and third, deep
water; anything greater than 60 meters.
5. Langley and Victor Corridors: Represents the airspace used by authorized U.S. Department of
Defense personnel as an exit/entrance flight path.
6. NAWCAD Test-track: Represents the airspace used by the National Air Warfare Center,
Aircraft Division as a supersonic test-track.
7. VACAPES W-386: Also known as Atlantic Warning Area W-386, this file represents the area
used by the U.S. Department of Defense to conduct training exercises, munitions deployment,
and flight-testing; operations are sub-surface, surface and airborne. The Langley and Victor
Corridor and the NAWCAD Test-track are sub-areas with the VACAPES W-386.
8. Regulated Airspace: Represents R-6604 or regulated airspace adjacent to the NASA Wallops
Flight Facility.
9. Radar Facilities: Represents the general area at NASA Wallops Flight Facility where fixed
radar facilities are located.
10. Radar Facilities Buffer: Represents radar line-of-sight from the fixed radar of greatest height
at NASA Wallops Flight Facility under four scenario wind turbine heights. The four scenarios

9
assume turbines of height equal to 113, 132, 151 and 182 meters (combined tower and blade)
above the surface of the water.
11. Launch Hazard Area: Represents area where impacts have historically occurred as a result
of operations at NASA Wallops Flight Facility (i.e., balloon and rocket launches).
10
Executive Summary
Matthias Ruth1, Andrew Blohm
1, Sean Williamson
1, Yohan Shim
1, Junming Zhu
1, Jeremy
Peichel1
1. Center for Integrative Environmental Research, Division of Research, University of Maryland,
College Park, MD, 20742, USA
1. Introduction
This study investigates four aspects of developing wind in waters offshore Maryland: the
regulatory and policy environment for offshore wind development, optimal interconnection
points for bringing offshore power onshore, estimated investment costs, and potential conflicts
between research and military activities, and wind farm siting. The Maryland Department of
Natural Resources and the Nature Conservancy are investigating other impacts (e.g. biological,
physical, and social).
First, we introduce the datasets that will be referenced throughout the chapters. We have
compiled information pertaining to existing transmission grid, planned transmission grid
improvements, substation locations, bathymetry data, and research and military sites (e.g. bases,
operations areas, and other zones of conflicting use) into Geographic Information Systems (GIS)
data files. These files are introduced in the table above titled “Geographic Information System
(GIS) Data Files and Chapter of Use,” which provides a broad outline of the geographic
information; additional file details are provided in the chapters that follow. The files can be
accessed online at [COASTAL ATLAS] and viewed through an Internet browser.
In Chapter 1 of the report we explore the policy environment in the State of Maryland, as well as
the regulatory environment concerning operations and development of offshore wind resources
in federal waters on the outer continental shelf (OCS).
Maryland is interested in exploring offshore wind, as one of a possible suite of renewable energy
technologies in order to address the anticipated growth in electricity demand as well as facilitate
compliance with the Renewable Portfolio Standards. Offshore wind holds the potential to
achieve both of these objectives while also mitigating visual and noise impacts that have been
associated with onshore wind farms. However, based on experiences within the U.S. to date,
wind farms will more than likely be sited far from shore in federal waters, which will require the
involvement of the Minerals Management Service (MMS). The role of MMS, PJM
11
Interconnection, and the Maryland Public Service Commission (PSC) and their processes are
explored in Chapter 1.
In Chapter 2, we explore the existing transmission grid on the Delmarva Peninsula, as well as
planned improvements. In that chapter we also discuss the best sites for interconnecting offshore
wind energy into the existing onshore transmission grid.
Next, in Chapter 3, we build a simplified investment model that explores potential costs of
developing offshore wind farms using existing literature, experiential data from previously built
and planned wind farms, and consultations with industry experts and vendors. Existing and
planned projects feature heavily in our assumptions including the Bluewater Wind and Cape
Wind projects in the United States, as well as several European Wind Farms such as Nysted and
Horns Rev. The chapter proceeds with the development of the investment model assumptions
before then running the model for two case studies, including a 600 MW shallow water wind
farm and a 1,000 MW deepwater application.
Last, in Chapter 4 we investigate potential conflicts between mid-Atlantic operations (i.e.,
military or research-based operations) and offshore wind development. The mid-Atlantic region
adjacent to Maryland’s coastline is used by a number of federal agencies (e.g., NASA, U.S.
Department of Defense) and the potential exists for conflict between any offshore wind
development and currently existing uses. Of particular focus in this section is the potential
impact offshore wind development might have on radar functionality.
2. Major Findings
Upon outlining regulatory and policy procedures in Chapter 1, we begin analysis in Chapter 2
with an investigation of potential interconnection points and find that based upon the limited
number of generator interconnection studies undertaken thus far, opportunities on the Delmarva
Peninsula are limited for interconnecting offshore wind resources with the transmission grid.
Potential options for addressing offshore wind interconnection include an offshore transmission
collection system for interconnecting multiple offshore wind projects as well as constructing
additional backbone transmission lines. Due to slower than expected load growth over the last
few years, the need for backbone transmission lines is being reevaluated by PJM. In this project,
we assume the MAPP line is constructed to Indian River. Further, we do not investigate the
impact of an offshore backbone line.
The transmission grid in the PJM region, especially in the mid-Atlantic, is dynamic with a
number of backbone projects proposed or already under construction. Particularly important to
this study is the proposed MAPP line, a bidirectional 640 kV HVDC cable that would travel
12
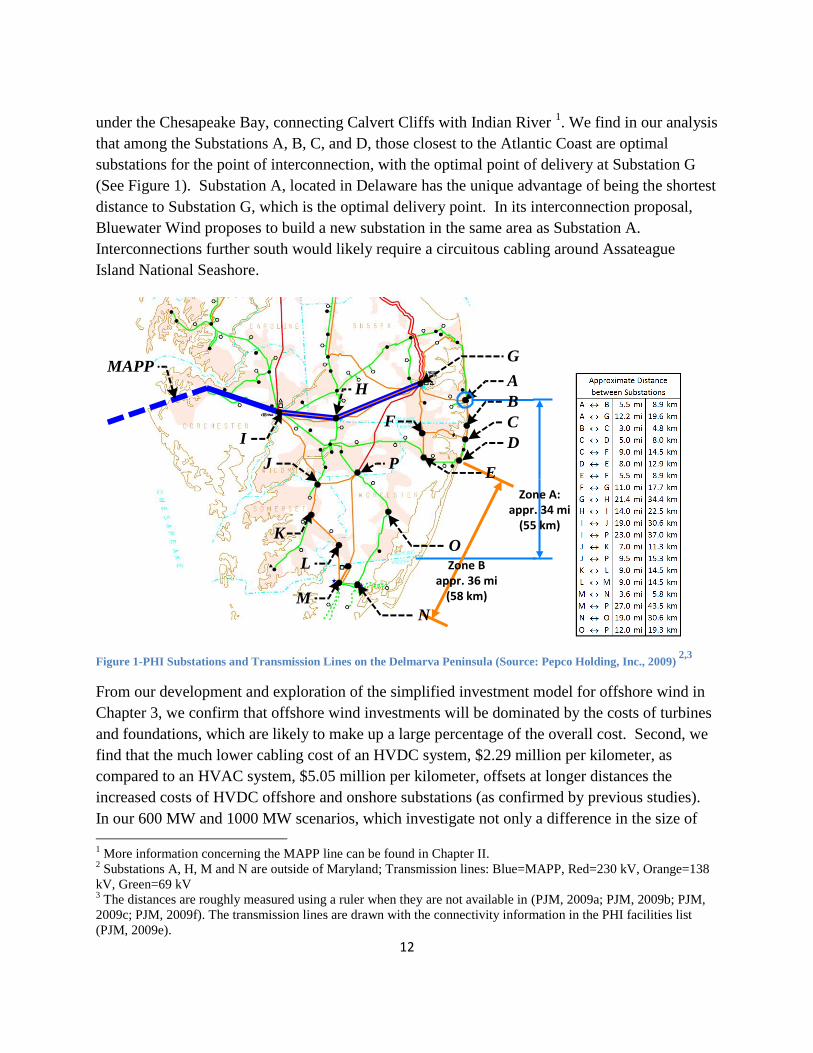
under the Chesapeake Bay, connecting Calvert Cliffs with Indian River 1. We find in our analysis
that among the Substations A, B, C, and D, those closest to the Atlantic Coast are optimal
substations for the point of interconnection, with the optimal point of delivery at Substation G
(See Figure 1). Substation A, located in Delaware has the unique advantage of being the shortest
distance to Substation G, which is the optimal delivery point. In its interconnection proposal,
Bluewater Wind proposes to build a new substation in the same area as Substation A.
Interconnections further south would likely require a circuitous cabling around Assateague
Island National Seashore.
Figure 1-PHI Substations and Transmission Lines on the Delmarva Peninsula (Source: Pepco Holding, Inc., 2009) 2,3
From our development and exploration of the simplified investment model for offshore wind in
Chapter 3, we confirm that offshore wind investments will be dominated by the costs of turbines
and foundations, which are likely to make up a large percentage of the overall cost. Second, we
find that the much lower cabling cost of an HVDC system, $2.29 million per kilometer, as
compared to an HVAC system, $5.05 million per kilometer, offsets at longer distances the
increased costs of HVDC offshore and onshore substations (as confirmed by previous studies).
In our 600 MW and 1000 MW scenarios, which investigate not only a difference in the size of
1 More information concerning the MAPP line can be found in Chapter II.
2 Substations A, H, M and N are outside of Maryland; Transmission lines: Blue=MAPP, Red=230 kV, Orange=138
kV, Green=69 kV 3 The distances are roughly measured using a ruler when they are not available in (PJM, 2009a; PJM, 2009b; PJM,
2009c; PJM, 2009f). The transmission lines are drawn with the connectivity information in the PHI facilities list
(PJM, 2009e).
A
C
D
F
G
H
I
J
K
L
M
O
P
MAPP
B
Zone Bappr. 36 mi
(58 km)
E
Zone A:appr. 34 mi
(55 km)
N
13
the wind farm but also its location (e.g. shallow versus deep water application) and transmission
system, we do not see a significant difference in the costs per kW as both projects have an
estimated cost of $1,850 per kW.
Regarding mid-Atlantic operations, we find that the potential for diminished radar functionality
exists at NASA’s Wallops Flight Facility, which is used by multiple parties ranging from the
FAA and NASA, to the United States Navy. However, the potential for diminished radar
functionality at other mid-Atlantic facilities as a result of wind development is unlikely and
depending on siting and other factors, impacts on the Wallops Flight Facility can be mitigated.
These findings apply strictly to fixed radar units. Conflict with U.S. military operations
occurring in the air or surface space adjacent to Maryland’s coastline including flight-testing,
training exercises and munitions deployment is very likely. This includes both the potential for
physical conflict and radar interference as it applies to mobile radar units (e.g., on aircraft or
naval vessels). However, through collaborative work with specific U.S. military and other users
of the mid-Atlantic space, the possibility for reconciling these conflicts exists.
3. Limitations
A number of limitations exist to fully understanding the potential conflicts between offshore
wind development and mid-Atlantic operations. First, the impact of wind turbines on fixed radar
is generally well understood and attempts to mitigate radar interference have been made (e.g.,
turbines made with stealth material). However, there is a great need for additional information
regarding the impact of wind turbines and mobile radar including both primary and secondary
radar operations. An examination of mobile radar interference and potential opportunities to
mitigate impacts would be valuable to users of radar and wind power companies alike.
Additionally, a lack of detail on military operations in the mid-Atlantic generally and VACAPES
W-386 specifically will serve as an impediment to wind development in Atlantic waters adjacent
to Maryland. In particular, more information about surface and subsurface operations (including
live training exercises) would clarify circumstances that could result in conflict. There are
serious national security concerns in disclosing this information, however, and the U.S.
Department of Defense must take precautions to maintain security. Upon receiving the
information available in this report, potential wind developers should collaboratively discuss
knowledge gaps and critical missing information with the U.S. Department of Defense and in
particular, the Patuxent Naval Air Station. By articulating specific areas of concern as a single
group, and by approaching military stakeholders with a clear and focused agenda, stakeholders
will be well positioned to engage in comprehensive and responsive planning.
14
Our investigation of optimal interconnection points for offshore wind generation into the onshore
transmission grid does not involve an established Pepco Holdings, Inc. transmission system
model or simulation tool to analyze the impacts on the transmission system and assess the
associated cost of reinforcement in the system. As a preliminary analysis, however, we identify
optimal interconnection points using a map of the transmission and substation networks on the
Delmarva Peninsula. The approximate locations of substations and the distances between
substations were collected from PHI, Inc., PJM RTEP and PJM T122 Impact Study (PHI, 2009d;
PJM, 2009c; PJM, 2009f). The transmission lines are drawn with the connectivity information in
the PHI facilities list (PJM, 2009e).
In our examination of investment costs for two hypothetical wind farms, a 600 MW and 1000
MW facility adjacent to Maryland’s coastline in the Atlantic Ocean, we depend largely on
existing literature, experiential data from wind farms built to date, as well as contacts within the
wind industry itself. However, in our analysis we do not include such factors as transport and
erection of wind turbines, foundations, design and project management, and environmental
analysis (EWEA, 2009b). Those factors are beyond our consideration because they tend to be
site dependent or vary over time (i.e., availability of installation vessels, weather and wave
conditions, water depth, soil conditions under water, proximity to ports, etc.).
4. Future Research
For future research we propose exploring the development or involvement of analytical models
and methods (e.g., a simulation optimization methodology) for a study of the operational
performance of the PHI transmission system, based on a scenario-driven approach for variability
of wind energy penetration into the grid and various N-1 contingency conditions (e.g., power
flow, line outage, and stability) on the transmission system. Combined with cost of
reinforcement due to the wind generation injection into the system, this study would provide the
optimal interconnection point and the optimal allowable injection of capacity without major
transmission upgrade or with the lowest impact and upgrade cost. The model that we would use
in the study would be a multi-period model, where, for example, a continuous power flow on a
transmission line is discretized into hourly or shorter or longer. Also the variability of wind
power would be represented with discrete probability distribution in the model (i.e., discrete
scenarios). So the model should be a multi-period stochastic model. To accomplish this work
would require additional cooperation with PHI including access to proprietary information
regarding power flow diagrams, power transfer limits and thermal limits on each transmission
line in the system, generator reactive powers, bus voltages and phases of all substations (Milano
et al., 2005; Deuse et al., 2003). PJM is a regional transmission organization, which manages the
wholesale electricity market for an interconnected power grid of 13 states and the District of
15
Columbia. We would refer to PJM’s offshore wind study, if available, or invite it to our study to
raise public confidence and accuracy and to avoid any inefficiency in our approach.
Research efforts concerned with the potential development of offshore wind in Maryland and
federal waters are ongoing. An interagency effort by MEA and the Maryland Department of
Natural Resources (DNR), with the assistance of the Nature Conservancy has yielded a
comprehensive marine spatial planning tool that offers guidance on the physical, biological and
human use characteristics of Maryland’s offshore resources, providing information to wind
energy developers and coastal stakeholders. (MEA, 2009) This information can be used to
further develop our own analysis in an optimization model for best use of offshore marine space
(i.e., optimal wind farm layout to minimize investment costs). This model would include
estimated wind farm component costs from Chapter 3, radar and military activity information
from Chapter 4, as well as information from DNR and Nature Conservancy included in their
Coastal Atlas. Further integration of the offshore model with the onshore transmission system
model would allow development of an aggregate model capable of determining both an optimal
interconnection point and the most desirable wind farm layout in such a way that minimizes
investment costs 4.
5. References
Gabriel S.A., J.A. Faria, and G.E. Moglen. 2005. A Multi-objective Optimization Approach to
Smart Growth in Land Development. Socio-Economic Planning Sciences 40: 212-248”.
Maryland Energy Administration. 2009. Maryland Energy Outlook. Available at
http://www.energy.state.md.us/documents/MEOdraftwithrecs120809.pdf.
Pepco Holdings, Inc. (PHI). 2009a. Mid-Atlantic Power Pathway. Available at
http://www.powerpathway.com/.
Pepco Holdings, Inc. (PHI). 2009b. Transmission and Interconnection: Reliability Standards.
Available at http://www.pjm.com/planning/planning-criteria/~/media/planning/planning-
criteria/pepco-planning-criteria.ashx.
Pepco Holdings, Inc. (PHI). 2009c. Integration of Wind Generation into the Transmission
System. Presented to the Maryland Department of Energy by William M. Gausman,
Senior Vice President, PHI. December 11, 2009.
4 Multi-objective optimization models have been applied to Smart Growth Planning in the State of Maryland and
provide a model for potentially addressing this issue. The project considered conflicting interests of various
stakeholders involved in land development decisions (e.g., government planners, environmentalist, conservationist,
and land developers) (Gabriel, SA et al., 2005).

16
Pepco Holdings, Inc. 2009d. Personal Communication via email and phone with Bill Mitchell.
Manager, Transmission Services. December, 2009. Newark, DE 19714.
Pepco Holdings, Inc. 2009e. Transmission and Interconnection Reliability Standards. Available
online: http://www.pjm.com/planning/planning-criteria/~/media/planning/planning-
criteria/pepco-planning-criteria.ashx.
17
I. An Assessment of the Policy and Regulatory
Context for Offshore Wind in Maryland
Andrew Blohm1, Junming Zhu
1, Sean Williamson
1
1. Center for Integrative Environmental Research, Division of Research, University of Maryland,
College Park, MD, 20742, USA
1. Introduction
In this chapter we identify the policy and regulatory context for offshore wind development in
waters adjacent to Maryland’s coastline. Offshore wind holds the potential to help Maryland
reach its Renewable Portfolio Standard (RPS) commitments, which require that 20 percent of
electricity sold in the state come from renewable resources by 2022. By 2022, Maryland
estimates an additional 7,500 GWh of electricity will be needed in spite of reductions in demand
as a result of demand side management programs and growing electricity output from other
renewable energy sources (MEA, 2009c). The State of Maryland would like to meet a portion or
all of the projected shortfall through development of Maryland’s renewable energy resources.
Not only would offshore wind development help Maryland meet its RPS goals, but it would also
provide ancillary benefits (e.g. jobs, wind industry development) and further position the State as
an environmental first mover.
This chapter is organized into four sections. In Section 2 we discuss Maryland’s RPS
commitments. Maryland is constrained for space in choosing sites for wind development within
its own territorial waters because state waters extend only 5.5 kilometers from the shoreline.
However, in 1945 President Truman extended United States territorial rights to cover all natural
resources on its continental shelf. In the United States, the Federal Energy Regulatory
Commission (FERC) and the Mineral Management Service (MMS) have permitting authority
over renewable energy activities in offshore federal waters. MMS has jurisdiction with regard
“to the production, transportation, or transmission of energy from non-hydrokinetic renewable
energy projects, including wind and solar”(MMS, 2009a). In Section 3, we therefore discuss the
role of MMS and pertinent regulations for operation in federal waters.
Next, in Section 4 we discuss the interconnection requirements as put forth in Manual 14a by
PJM Interconnection. We provide background information on the steps necessary for
interconnection with the onshore transmission grid. The links provided include detailed reports
on the generation interconnection requirements, which are available online. Finally, in Section 5,
18
we discuss the role of FERC and the Maryland Public Service Commission (PSC) in siting
transmission and power generation facilities in the state of Maryland.
2. Renewable Portfolio Standards
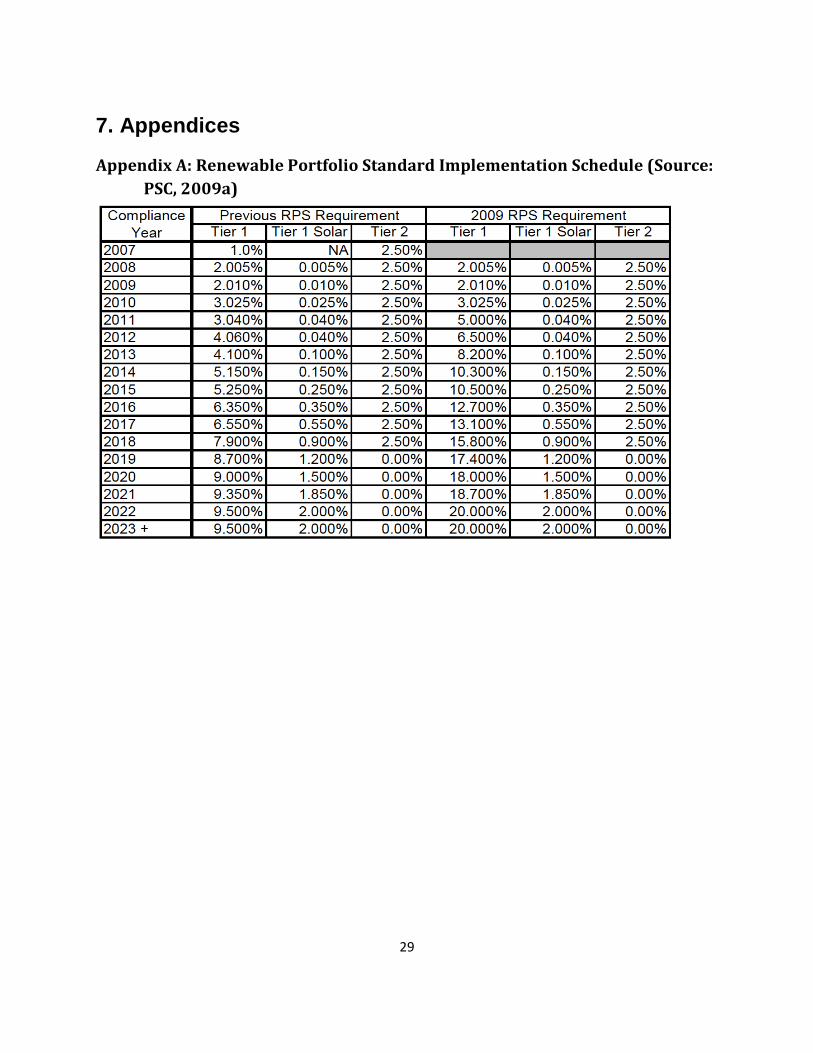
In May 2004, the Maryland legislature enacted the RPS, which requires electricity suppliers in
the state (e.g. utilities, competitive retail suppliers) to meet 20 percent of retail electricity sales
from renewable energy sources by 2022 (Tier 1 sources) (see Appendix A) (DSIRE, 2009)5.
Under the program, any load serving entity, which includes suppliers and utilities that provide
standard offer service, must meet annual renewable portfolio standards (PSC, 2009a). In 2007,
Maryland created a solar set-aside that requires 2 percent of Maryland’s RPS commitments to
come from solar sources. This solar set-aside starts in 2008 and requires Maryland load serving
entities to purchase solar renewable energy credits (SRECs) from in-state generation equivalent
to 0.005 percent of total retail electricity sales (see Appendix A for the implementation schedule)
(PSC, 2008). One SREC represents the environmental attributes of one megawatt-hour (MWh)
of solar energy generation. At this point in time, a similar wind carve-out does not exist and
would require a legislative mandate (PSC, 2009b).
Renewable energy sources are grouped into two tiers, Tier 1 and Tier 2. Tier 1 renewable energy
sources include solar, wind, qualifying biomass, methane from the anaerobic decomposition of
organic materials in a landfill or wastewater treatment plant, geothermal, poultry-litter
incineration facilities, and ocean energy, including energy from waves, tides, currents, and
thermal differences, fuel cells powered by methane or biomass, and small hydroelectric plants
(systems less than 30 megawatts in capacity and in operation as of January 1, 2004) (PSC, 2008;
DSIRE, 2009). Tier 2 resources are comprised of hydropower generation greater than 30
megawatts (MW) (other than pump storage) and waste-to-energy (PSC, 2008).
Beginning in 2006, electricity providers were required to provide 1 percent of their retail sales
from renewable energy sources. The percentage of electricity from renewable sources is then
gradually increased until 20 percent of retail sales come from Tier 1 renewable energy sources
(see Appendix A). Tier 2 resources can account for 2.50 percent of the RPS requirements during
the period 2006 to 2018 (PSC, 2008). However, after 2018 Tier 2 resources cannot be used as a
means to achieve RPS requirements (PSC, 2008).
5 Allowable renewable energy sources include solar thermal electric, photovoltaics, landfill gas, wind, biomass,
hydroelectric, geothermal electric, municipal solid waste, anaerobic digestion, tidal energy, wave energy, ocean
thermal, and fuel cells using renewable fuels (DSIRE, 2009).

19
To meet its RPS standards, utilities can purchase Renewable Energy Credits (RECs) from states
within the PJM region and adjacent to it (PSC, 2008). States are considered adjacent to the PJM
region if they share a border with it or if PJM partially overlaps (PSC, 2008). RECs may be
purchased from outside the area as defined above as long as the electricity generated flows into
the PJM region (PSC, 2008). Maryland can purchase RECs from renewable energy facilities
located in the following states: Pennsylvania, New Jersey, Delaware, District of Columbia,
Virginia, West Virginia, New York, North Carolina, Tennessee, Kentucky, Ohio, Indiana,
Illinois, Michigan, Wisconsin, and Iowa (other states may be eligible if energy is delivered into
the PJM region) (PSC, 2008). Beginning in 2011, Maryland H.B. 375 will restrict acceptable
RECs to resources within the PJM region or from a control area adjacent to the region (as long as
the electricity flows into PJM) (PSC, 2009b).
3. Development in Federal Waters: The Role of the Minerals Management Service
In this section we discuss the powers granted to the MMS under the Energy Policy Act of 2005.
We will then discuss the rulemaking process to govern the management of the Minerals
Management Service (MMS) Renewable Energy Program. Finally, we discuss the MMS process
towards developing offshore wind resource in federal waters (i.e. formation of a state task force,
request for expressions of interest from wind developers, etc.).
The MMS, within the U.S. Department of Interior, manages ocean energy and mineral resources
on the outer continental shelf (OCS) as well as federal and Indian mineral revenues to enhance
public and trust benefits, promote responsible use, and realize fair value. On August 8, 2005,
President George W. Bush signed into law the Energy Policy Act of 2005 (the Act), which grants
MMS new responsibilities over federal offshore alternative energy deployment and alternate uses
of offshore public lands (i.e. OCS). Section 388 of the Act provides an initiative to facilitate
increased alternative energy production on the OCS. It gives the Secretary of the Interior the
authority to grant a lease, easement or right-of way for activities on the OCS that produce or
support production, transportation, or transmission of energy from sources other than oil or gas.
It also gives the Department the authority to act as a lead agency for coordinating the permitting
process with other federal agencies and to monitor and regulate those facilities used for
alternative energy production and support services.
On April 9, 2009, MMS signed an MOU with FERC to clarify jurisdiction over renewable
energy projects on the OCS. Under the agreement, MMS has exclusive jurisdiction over the
production, transportation, or transmission of energy from non-hydrokinetic renewable energy
projects, including wind and solar. FERC has exclusive jurisdiction to issue licenses for the
20
construction and operation of hydrokinetic projects like wave energy and current energy, but
requires applicants to first obtain a lease through MMS. (MMS, 2009a)
On April 22, 2009, President Barack Obama announced the completion of the Department of the
Interior Final Renewable Energy Framework or rulemaking process to govern management of
the MMS Renewable Energy Program. MMS will continue coordination with stakeholders,
including congressional delegations, coastal states, federal agencies, industry, the environmental
community and the general public. It will establish task forces with states to facilitate dialogue
regarding OCS leasing with state, federal, local, and tribal governments. It will initiate
environmental studies, determine leasing priorities, prepare environmental compliance
documents, monitor activities and facility inspection, and initiate the commercial leasing process
and work with the state task forces to issue requests for interests. Key mandates for the
Renewable Energy Program include: safety, protection of the environment, coordination with
affected state and local governments and federal agencies, fair return for use of OCS lands, and
equitable sharing of revenue with states (MMS, 2009a; MMS, 2009b).
Deployment of power generation facilities requires commercial leases, which will be issued on a
competitive basis unless the Secretary determines after public notice (normally by issuing the
Request for Interest) that there is no competitive interest. For competitive commercial lease,
there is a competitive process including a call for information, area identification, proposed sale
notice, final notice, lease sale (auction), and award (MMS, 2009e). Subsequently, there will be a
6-month preliminary term, a 5-year site assessment term and a 25-year operations term of an
award. Within 6 months, the lessee must submit a Site Assessment Plan (SAP) describing
planned site characterization activities and including relevant site survey results. MMS conducts
required environmental compliance (e.g., National Environmental Policy Act, Coastal Zone
Management Act, Magnuson-Stevens Fishery Conservation and Management Act, National
Historic Preservation Act, Endangered Species Act) and technical reviews. Within 5 years of
SAP approval by MMS, the lessee must submit a Construction and Operations Plan (COP)
describing all activities and facilities to be installed and used to gather, transport, transmit,
generate, or distribute energy from the lease. MMS conducts additional required environmental
compliance and technical reviews. Two more reports are required before constructing and
installing facilities under an approved COP. One is a Facility Design Report (FDR), with details
of the design of facilities, including cables and pipelines, described in approved plans. The other
is a Fabrication and Installation Report, with details on how facilities will be built in accordance
with plans and FDR. Without going through a competitive process, applicants for a
noncompetitive lease also must go through SAP and COP processes, and leases are contingent on
SAP approval (MMS, 2009b; MMS, 2009f)
In the leasing process, task force development is the preferred first step towards coordination of
information, which aids in decision-making and ensures effective communication among parties.
21
The leasing process is established and coordinated by MMS, with participation from elected
officers of state, local and tribal governments and relevant federal agencies, such as U.S. Coast
Guard, EPA, etc. Following the regulatory framework, members can provide input in the
implementation of the MMS Renewable Energy Framework, such as recommendations regarding
preparation of required MMS notices and announcements, performance of environmental
analyses and identification environmental data needs (MMS, 2009d). Task force members have
the opportunity to review and comment on draft Requests for Interest by MMS prior to
publication in the Federal Register (MMS, 2009g). Currently, MMS has established task forces
with five States regarding OCS renewable energy activities, including Delaware, Massachusetts,
New Jersey, Rhode Island and Virginia.
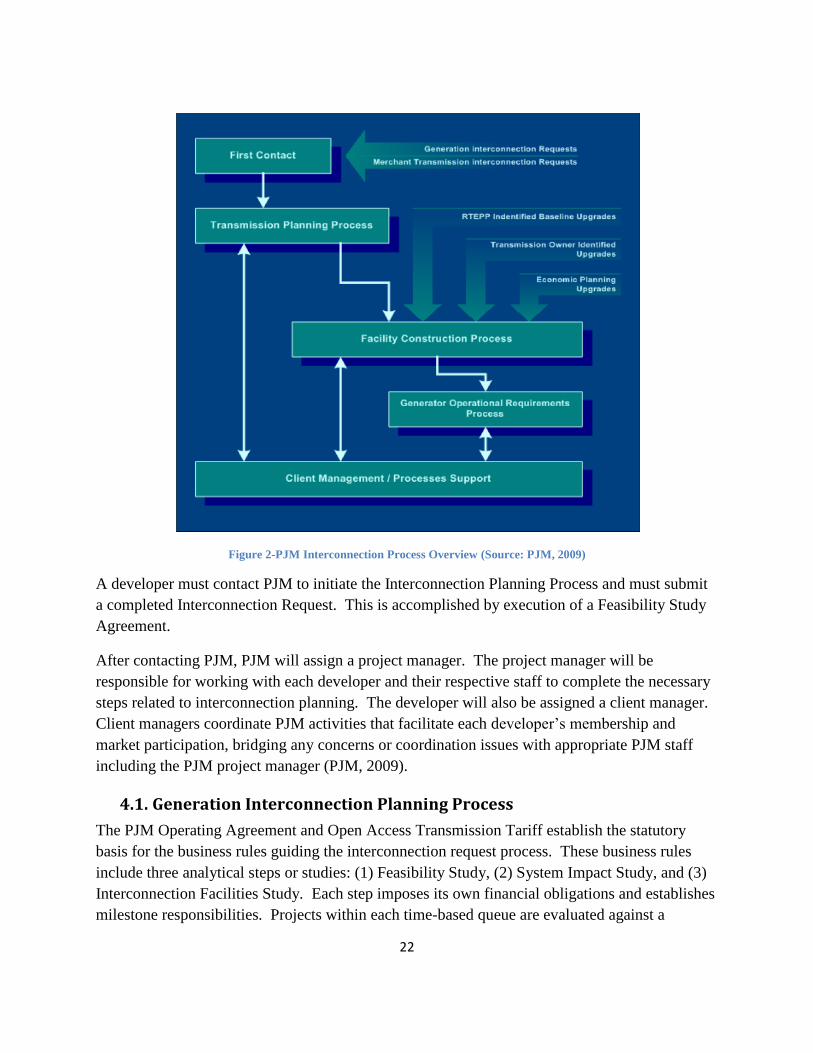
4. PJM Generator Interconnection Process
The PJM transmission system provides the network for delivery of the output from
interconnected generators to load centers for end-use customer consumption. Developers
requesting interconnection of a generating facility within the PJM regional transmission
organization (RTO) must follow PJM’s interconnection process (see Figure 2) (PJM, 2009).
22
Figure 2-PJM Interconnection Process Overview (Source: PJM, 2009)
A developer must contact PJM to initiate the Interconnection Planning Process and must submit
a completed Interconnection Request. This is accomplished by execution of a Feasibility Study
Agreement.
After contacting PJM, PJM will assign a project manager. The project manager will be
responsible for working with each developer and their respective staff to complete the necessary
steps related to interconnection planning. The developer will also be assigned a client manager.
Client managers coordinate PJM activities that facilitate each developer’s membership and
market participation, bridging any concerns or coordination issues with appropriate PJM staff
including the PJM project manager (PJM, 2009).
4.1. Generation Interconnection Planning Process
The PJM Operating Agreement and Open Access Transmission Tariff establish the statutory
basis for the business rules guiding the interconnection request process. These business rules
include three analytical steps or studies: (1) Feasibility Study, (2) System Impact Study, and (3)
Interconnection Facilities Study. Each step imposes its own financial obligations and establishes
milestone responsibilities. Projects within each time-based queue are evaluated against a
23
baseline benchmark set of studies in order to establish project-specific responsibility for system
enhancements; project evaluations are separate from general network upgrades suggested by the
results of baseline analyses. Each developer is encouraged to participate in the activities of the
Transmission Expansion Advisory Committee and its Regional Transmission Expansion Plan
(RTEP) Committee (PJM, 2009).
In the first stage, a developer must submit an Interconnection Request in the form of an executed
Generation or Transmission Interconnection Feasibility Study Agreement in addition to a study
deposit. The developer could request either of two forms of interconnection service, Capacity
Resource or Energy Resource service6. The request must include descriptions of the project
location, size, equipment configuration, anticipated in-service date, etc. After the request and
deposit are received, PJM assigns a system planning senior consultant as the team leader to
initiate and direct implementation of the study phases of the Generator and/or Transmission
Interconnection Process. During this phase, project location and size are identified (PJM, 2009).
After receipt of the Generation or Transmission Interconnection Feasibility Study results, if the
developer decides to proceed, an executed System Impact Study Agreement must be submitted to
PJM with the required deposit. The System Impact Study is a comprehensive regional analysis
of the impact associated with adding a new generation and/or transmission facility to the system.
One essential component of the System Impact Study is an evaluation of the project’s impact on
deliverability to PJM load with a particular focus on the PJM region where the new generator
and/or transmission facility will be sited. This Study identifies the system constraints related to
the project and the necessary attachment facilities, local upgrades, and network upgrades to
ensure project success (PJM, 2009).
After reviewing the results of the study, the developer must decide whether or not to proceed
with a Generation or Transmission Interconnection Facilities Study. If the developer decides to
proceed with the project, the results of the System Impact Study are integrated into the RTEP
process for development; the RTEP will subsequently be submitted to PJM’s Board of Managers
for approval. The developer will execute and return the Generation and/or Transmission
Interconnection Facilities Study Agreement and the required deposit. When completed, the
study will document the engineering design work necessary to begin construction (PJM, 2009).
4.2. Generation and Transmission Interconnection Facility Construction
Phase
Upon completion of the Interconnection Facility Study, PJM will furnish an Interconnection
Service Agreement (ISA) to be executed by the developer and any affected Interconnected
6 A capacity resource requires that energy be deliverable while an energy resource does not need to meet the same
requirement (DNR, 2010b).
24
Transmission Owners. The ISA defines the obligation of the developer with regards to cost
responsibility for any required system upgrades. The ISA also confers the rights associated with
the interconnection of a generator as a capacity resource and any operational restrictions or other
limitations on which those rights depend.
Construction of new Interconnection Facilities expected to interconnect a generator or
transmission project with the PJM Transmission Grid shall be performed in accordance with the
Standard Terms and Conditions as specified in an Interconnection Construction Service
Agreement (ICSA), which is executed jointly among the developer, PJM and the affected
Interconnected Transmission Owner(s). The ICSA specifies the developer’s option to build and
the general project timeline (PJM, 2008).
The complexities associated with the ISA/ICSA Implementation Phase of the Generator
Interconnection Projects warrant a project management model approach and an effective tool for
managing the activities and deliverables associated with the projects is a work breakdown
structure (PJM, 2008).
4.3. Markets and Operations Phase
The Generator Markets and Operations phase is initiated during the ISA and ICSA
implementation phase of the generator interconnection process. The Interconnection
Coordination Project Manager coordinates the activities of PJM Internal Coordination
(Operations Planning, System Operations, CR&T, PJMnet, EMS) and the developer to complete
the Generator Markets and Operations activities during this phase (PJM, 2010).
For more information on the PJM Generation and Transmission Interconnection Process See
PJM Manual 14a available at http://www.pjm.com/documents/manuals/manual-updates.aspx.
5. Role of the Federal Energy Regulatory Commission and Maryland Public Service Commission in Offshore Wind Transmission
This section explores the respective roles of FERC and the Maryland PSC with regard to the
challenge of connecting offshore generation to the onshore grid, with a particular focus on
Maryland waters.
FERC regulates the PJM Regional Transmission Organization and most utilities within the PJM
region (municipal power systems are excluded) (FERC, 2010). One of FERC’s primary roles is
to oversee the sale of wholesale electricity and ensure competition and non-discrimination of
25
utilities. Over the past two decades, FERC has been instrumental in ensuring competitive
electricity sales through open access transmission tariffs and the subsequent formation of RTOs
and breakdown of traditional vertical integration (FERC, 2009; PHI, 2010). Additional
regulatory responsibilities for FERC consist of overseeing mergers and certifying cogeneration
plants. FERC does not regulate the physical siting of electricity generation, transmission or
distribution facilities except under specific circumstances (FERC, 2010). Moreover, under
Section 1221 of the Energy Act of 2005, FERC has the authority to issue transmission
construction permits for facilities located in corridors designated as a “national interest electricity
transmission corridor,” by the U.S. Department of Energy7. The exact role FERC will play in
siting of transmission lines within the mid-Atlantic region depends on whether siting occurs in a
national interest electricity transmission corridor.
The PSC is likely to play an active role in the siting process within Maryland waters, but the
nature of this role is presently unclear. The PSC has several responsibilities within the State’s
power sector, including siting of generating facilities and overhead transmission lines as well as
supporting competitive retail electricity markets (PSC, 2009; PHI, 2010)8. PSC does not have
explicit authority to site underwater transmission cables at this time, but pending offshore wind
legislation in the Maryland General Assembly may clarify the role (MDNR, 2010). Within
Maryland, construction of a power plant or transmission line greater than 69 kV requires a
Certificate of Public Convenience and Necessity (CPCN) (PPRP, 2007). The Maryland Power
Plant Research Program (PPRP), within the Maryland DNR, is involved in the certification
process by helping to inform the PSC CPCN evaluation process through reviews of
environmental, engineering, and cost issues in addition to providing a set of licensing
recommendations (PPRP, 2007).
The traditional protocol for large new transmission lines (e.g., backbones) requires that prior to
any application for a CPCN with the PSC, PJM Interconnection must establish a need for new
transmission. This is evident in the recent suspension of the PSC permitting process of the Mid-
Atlantic Power Pathway (MAPP) line. It is expected that PJM Interconnection will re-evaluate
and confirm the need for the MAPP line before the PSC permitting process proceeds (PHI,
2010b). Whether a similar order of operations will be necessary for offshore interconnection and
transmission siting within Maryland remains to be seen.
7 The Atlantic coastal area from metropolitan New York southward through Northern Virginia is classified as
critical congestion areas, including most of Maryland’s Eastern Shore (U.S. DOE, 2006; NIETC, 2007). 8 The PSC does not have sole responsibility over transmission siting and approval and cannot unilaterally expedite
the process (PSC, 2009c).
26
6. References
Database of State Incentives for Renewables and Efficiency. 2009. Maryland Incentives/Policies
for Renewables & Efficiency. Available at
http://www.dsireusa.org/incentives/incentive.cfm?Incentive_Code=MD05R&state=MD&
CurrentPageID=1.
Federal Energy Regulatory Commission (FERC). 2009. Order No. 888: Promoting Wholesale
Competition Through Open Access Non-discrimatory Transmission Services by Public
Utilities; Recovery of Stranded Costs by Public Utilities and Transmitting Utilties.
Available online at http://www.ferc.gov/legal/maj-ord-reg/land-docs/order888.asp.
Federal Energy Regulatory Commission (FERC). 2010. Regulated Entities. Available online at
http://www.ferc.gov/industries/electric/gen-info/reg-ent.asp.
Maryland Energy Administration (MEA). 2009c. Request for Expressions of Interest and
Information: Maryland’s Offshore Wind Energy Deployment Strategy. Available at
http://energy.maryland.gov/documents/OffShoreREoI91509final.pdf.
Maryland Department of Natural Resources (MDNR). 2010. Personal Communication with
Chris Cortina via email on February 26, 2010. Maryland DNR, 580 Taylor Avenue,
Annapolis, MD 21401.
Maryland Department of Natural Resources (MDNR). 2010b. Personal Communication with
John Sherwell via email on February 26, 2010. Maryland DNR, 580 Taylor Avenue,
Annapolis, MD 21401.
Maryland Department of Natural Resources Power Plant Research Program (PPRP). 2007.
Power Plant Licensing in Maryland. Available online at
http://www.esm.versar.com/PPRP/licensing/licensing.html.
Minerals Management Service. 2009a. Offshore Renewable Energy Programs: The Role of
MMS in Renewable Energy. Available at
http://www.mms.gov/offshore/RenewableEnergy/FactSheets.htm.
Minerals Management Service. 2009b. Workshop on the Outer Continental Shelf Renewable
Energy Regulatory Framework. Available at
http://www.mms.gov/offshore/renewableenergy/.
Minerals Management Service. 2009c. Offshore Renewable Energy Programs: EPAct and MMS.
Available at www.mms.gov/offshore/RenewableEnergy/PDFs/EPActFactSheet.pdf.
Minerals Management Service. 2009d. Offshore Renewable Energy Programs: Task Force
Introduction. Available at

27
http://www.mms.gov/offshore/RenewableEnergy/PDFs/stateactivities/Presentation1Task
ForcePurpose120809.pdf.
Minerals Management Service. 2009e. Offshore Renewable Energy Programs: Introduction to
the MMS Leasing Process. Available at
http://www.mms.gov/offshore/RenewableEnergy/PDFs/stateactivities/Presentation2Leasi
ngProcess120809.pdf.
Minerals Management Service. 2009f. Offshore Renewable Energy Programs: Introduction to
the MMS Environmental Review Process. Available at
http://www.mms.gov/offshore/RenewableEnergy/PDFs/stateactivities/Presentation3Envir
onmentalPresentation120809.pdf.
Minerals Management Service. 2009g. Offshore Renewable Energy Programs: Introduction the
Request for Interest. Available at
http://www.mms.gov/offshore/RenewableEnergy/PDFs/stateactivities/Presentation5RFII
ntroduction120809.pdf.
Minerals Management Service. 2009h. Offshore Renewable Energy Programs: Virginia Task
Force meeting. Available at
http://www.mms.gov/offshore/RenewableEnergy/PDFs/stateactivities/Presentation6VCE
RC120809.pdf.
Pepco Holdings, Inc. 2010. Personal Communication via telephone January 29, 2010 with Ray
Bourland, Director and Counsel for Public Policy, Pepco Holdings, Inc. 701 9th
Street,
Washington D.C., 20068.
Pepco Holdings, Inc. 2010. PHI Requests Procedural Delay for MAPP Project. Available at
http://www.pepco.com/welcome/news/releases/archives/2010/article.aspx?cid=1316.
PJM. 2008. Generation and Transmission Interconnection Facility Construction. Available at
http://www.pjm.com/~/media/documents/manuals/m14c.ashx
PJM. 2009. Generation and Transmission Interconnection Process. Available at
http://www.pjm.com/~/media/documents/manuals/m14a.ashx
PJM. 2010. Generator Operational Requirements. Available at
http://www.pjm.com/~/media/documents/manuals/m14d.ashx
Public Service Commission (PSC). 2008. Frequently asked questions, Renewable Portfolio
Standards. Available at
http://webapp.psc.state.md.us/intranet/ElectricInfo/FAQ_new.cfm.
Public Service Commission (PSC). 2009a. Renewable Energy Portfolio Standard Report of 2009.
Available at
http://webapp.psc.state.md.us/Intranet/Reports/MD%20PSC%20Renewable%20Energy%
28
20Portfolio%20Standard%20Report%20of%202009%20with%20Data%20for%20Compl
iance%20Year%202007.pdf.
Public Service Commission (PSC). 2009b. Personal Communication via email with Michael Lee.
Director, Integrated Resource Planning. January, 2010. Baltimore, MD 21202.
Public Service Commission. 2009c. Ten Year Plan (2008-2017) of electric utilities in Maryland.
Available online at http://webapp.psc.state.md.us/Intranet/psc/Reports_new.cfm.
United States Department of Energy (DOE). 2006. National Electric Transmission Congestion
Study. Available online at http://nietc.anl.gov/congestionstudy/.
United States Department of Energy (DOE). 2007. National Electric Transmission Corridor
Report and the Ordered National Corridor Designations. National Corridor Designation
Maps. Available online at http://nietc.anl.gov/nationalcorridor/index.cfm.
29
7. Appendices
Appendix A: Renewable Portfolio Standard Implementation Schedule (Source:
PSC, 2009a)
30
II. An Assessment of Potential Interconnection
Points for Offshore Wind
Yohan Shim1, Andrew Blohm
1 Jeremy Peichel
1
1. Center for Integrative Environmental Research, Division of Research, University of Maryland,
College Park, MD, 20742, USA
1. Introduction
This chapter identifies potential interconnection points for offshore wind development adjacent
to Maryland’s coast. First, in Section 2 we discuss the transmission system in the region
operated by PJM Interconnection, focusing on proposed improvements including the MAPP line
and other upgrades planned on the Delmarva Peninsula. For each of these projects, we include a
brief synopsis of proposed routes or locations as well as their development 9. In Section 3 we
consider the case of Bluewater Wind and its proposals to interconnect a proposed offshore wind
facility to the transmission grid in Maryland and Delaware. That proposed project currently
provides the closest reference point to assess potential offshore wind generation in Maryland.
The impact and facilities studies undertaken for the Bluewater Wind project illustrate the
variation in the ability of the transmission system to interconnect with offshore wind. Finally, in
Section 4 we apply the lessons learned from the Bluewater Wind case study and discuss optimal
interconnection points.
2. Delmarva Peninsula Transmission Grid: Planned System Upgrades and Status
This section details planned transmission upgrades in PJM and corresponds to a Geographic
Information System data file that includes the transmission network on the Delmarva Peninsula
(e.g., existing and planned transmission upgrades, line voltages, and substation locations). In
this section we discuss the proposed backbone facilities before detailing the proposed MAPP line,
which would directly impact electricity transmission on the Delmarva Peninsula. Next, we
9 The transmission system (e.g. current transmission grid, including line voltages, planned expansions to the system,
substations) is available as a geographic information system data file.
31
discuss the proposed transmission upgrades, not considered as backbone projects, on the
Delmarva Peninsula.
2.1. Proposed PJM Backbone Projects (PJM, 2008c)
PJM Interconnection coordinates the movement of wholesale electricity in Maryland and all or
parts of 12 other states, as well as the District of Columbia. In order to resolve reliability criteria
violations PJM implements baseline upgrade projects; of which some are designated as
“backbone projects” due to their high degree of visibility within the stakeholder community.
Backbone upgrades are on the EHV (Extra High Voltage) System and typically resolve a wide
range of reliability criteria violations and market congestion issues (PJM, 2009a).
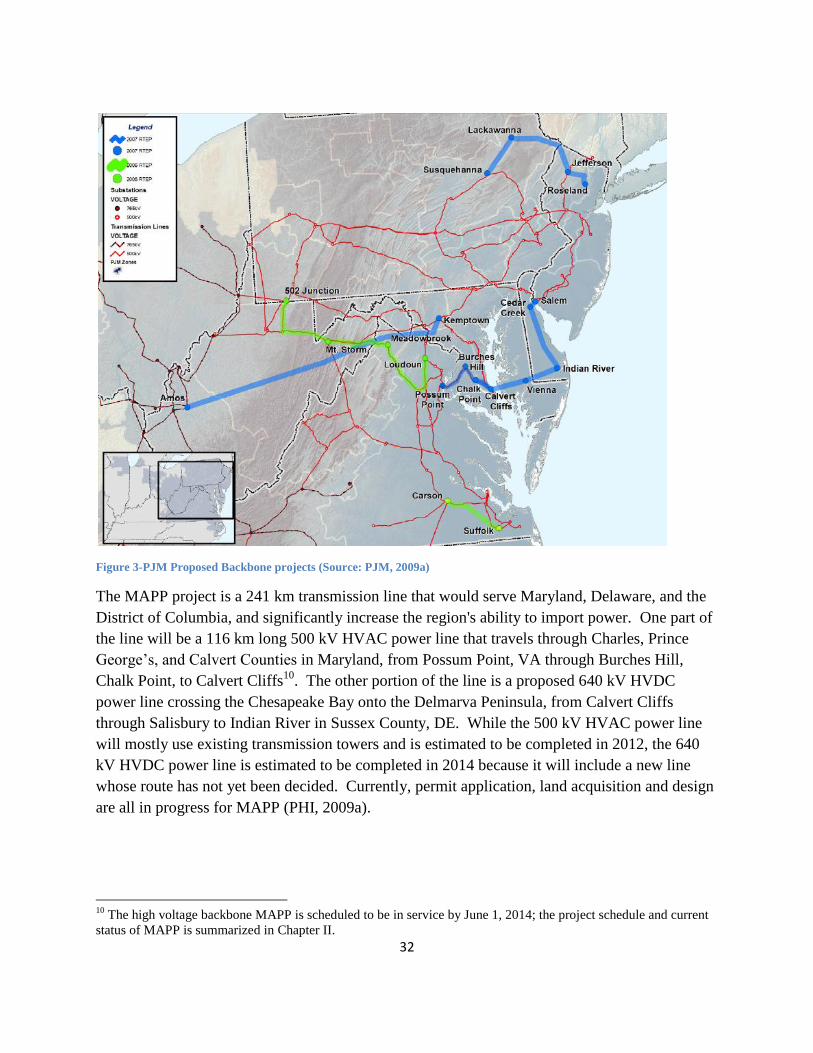
There are currently six backbone projects in the PJM queue (PJM, 2008c). In 2006, two projects
were proposed: 500 kV Trans Allegheny Line (TrAIL) and Carson-Suffolk 500 kV transmission
line. In 2007, four more backbone projects were proposed including a 500 kV Mid-Atlantic
Power Pathway (MAPP), a 765 kV Potomac-Appalachian Transmission Highline (PATH), the
Susquehanna-Roseland 500 k V transmission line and the Branchburg-Roseland-Hudson 500 kV
transmission line (see Figure 3 and Table 2).
32
Figure 3-PJM Proposed Backbone projects (Source: PJM, 2009a)
The MAPP project is a 241 km transmission line that would serve Maryland, Delaware, and the
District of Columbia, and significantly increase the region's ability to import power. One part of
the line will be a 116 km long 500 kV HVAC power line that travels through Charles, Prince
George’s, and Calvert Counties in Maryland, from Possum Point, VA through Burches Hill,
Chalk Point, to Calvert Cliffs10
. The other portion of the line is a proposed 640 kV HVDC
power line crossing the Chesapeake Bay onto the Delmarva Peninsula, from Calvert Cliffs
through Salisbury to Indian River in Sussex County, DE. While the 500 kV HVAC power line
will mostly use existing transmission towers and is estimated to be completed in 2012, the 640
kV HVDC power line is estimated to be completed in 2014 because it will include a new line
whose route has not yet been decided. Currently, permit application, land acquisition and design
are all in progress for MAPP (PHI, 2009a).
10
The high voltage backbone MAPP is scheduled to be in service by June 1, 2014; the project schedule and current
status of MAPP is summarized in Chapter II.
33
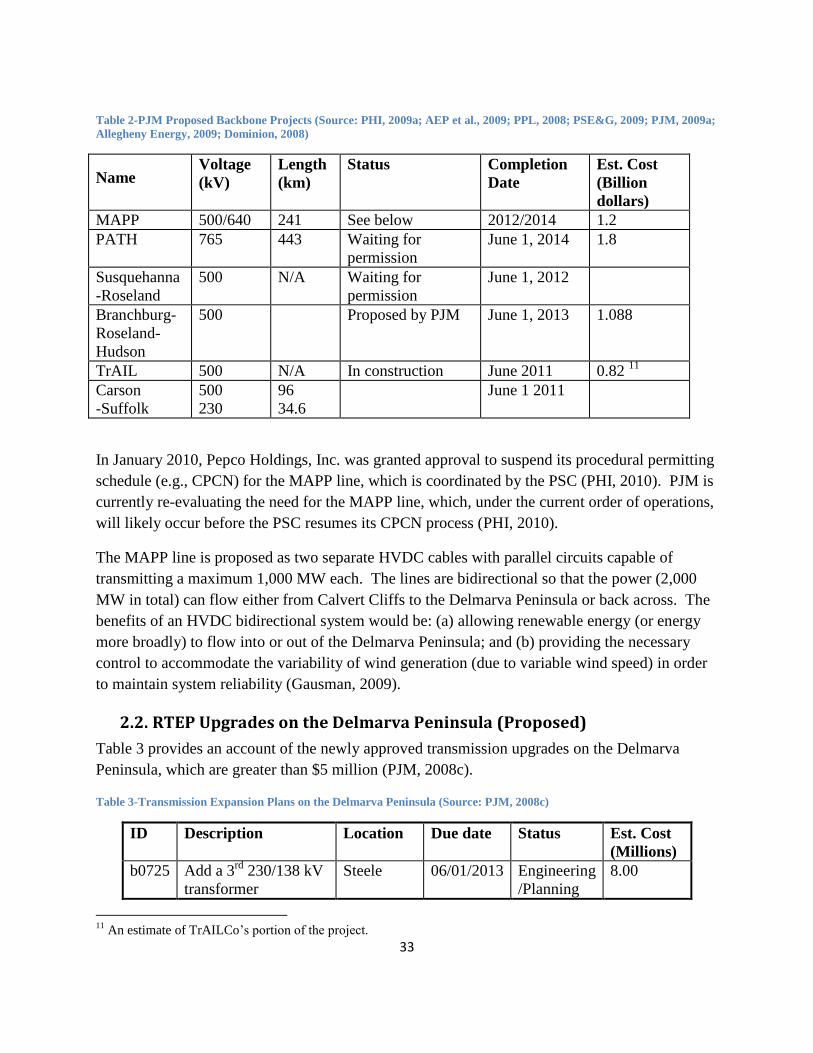
Table 2-PJM Proposed Backbone Projects (Source: PHI, 2009a; AEP et al., 2009; PPL, 2008; PSE&G, 2009; PJM, 2009a;
Allegheny Energy, 2009; Dominion, 2008)
Name Voltage
(kV)
Length
(km)
Status Completion
Date
Est. Cost
(Billion
dollars)
MAPP 500/640 241 See below 2012/2014 1.2
PATH 765 443 Waiting for
permission
June 1, 2014 1.8
Susquehanna
-Roseland
500 N/A Waiting for
permission
June 1, 2012
Branchburg-
Roseland-
Hudson
500 Proposed by PJM June 1, 2013 1.088
TrAIL 500 N/A In construction June 2011 0.82 11
Carson
-Suffolk
500
230
96
34.6
June 1 2011
In January 2010, Pepco Holdings, Inc. was granted approval to suspend its procedural permitting
schedule (e.g., CPCN) for the MAPP line, which is coordinated by the PSC (PHI, 2010). PJM is
currently re-evaluating the need for the MAPP line, which, under the current order of operations,
will likely occur before the PSC resumes its CPCN process (PHI, 2010).
The MAPP line is proposed as two separate HVDC cables with parallel circuits capable of
transmitting a maximum 1,000 MW each. The lines are bidirectional so that the power (2,000
MW in total) can flow either from Calvert Cliffs to the Delmarva Peninsula or back across. The
benefits of an HVDC bidirectional system would be: (a) allowing renewable energy (or energy
more broadly) to flow into or out of the Delmarva Peninsula; and (b) providing the necessary
control to accommodate the variability of wind generation (due to variable wind speed) in order
to maintain system reliability (Gausman, 2009).
2.2. RTEP Upgrades on the Delmarva Peninsula (Proposed)
Table 3 provides an account of the newly approved transmission upgrades on the Delmarva
Peninsula, which are greater than $5 million (PJM, 2008c).
Table 3-Transmission Expansion Plans on the Delmarva Peninsula (Source: PJM, 2008c)
ID Description Location Due date Status Est. Cost
(Millions)
b0725 Add a 3rd
230/138 kV
transformer
Steele 06/01/2013 Engineering
/Planning
8.00
11
An estimate of TrAILCo’s portion of the project.
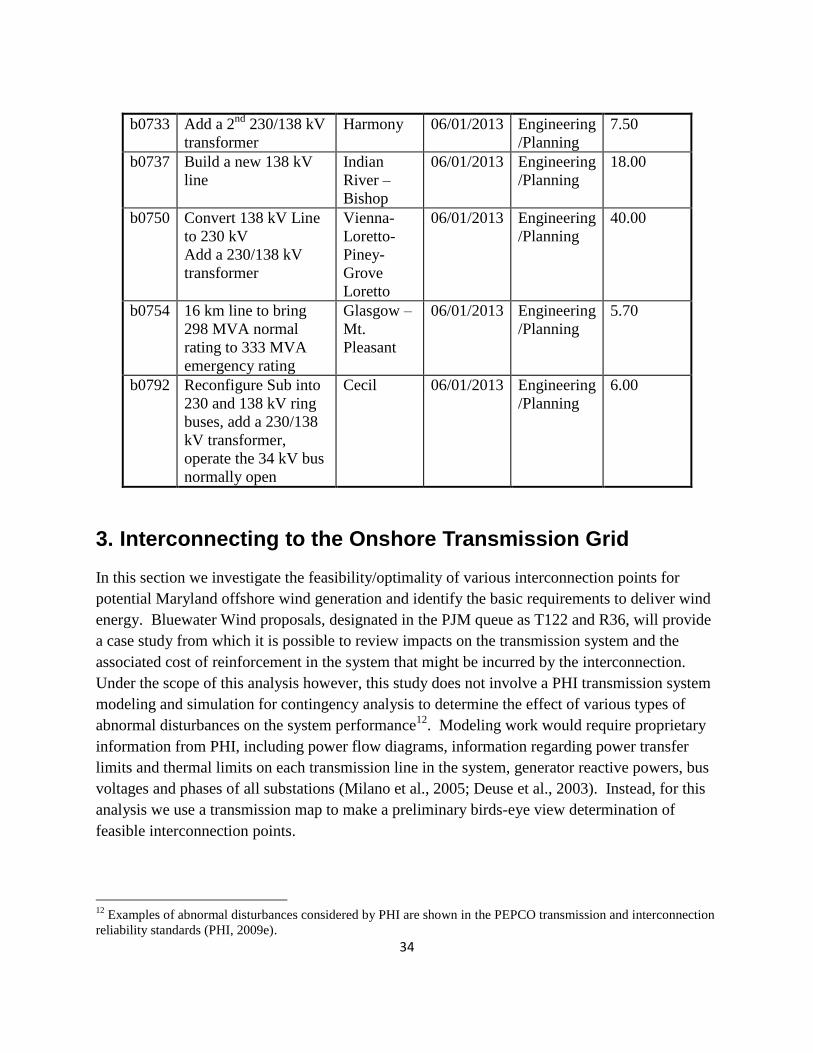
34
b0733 Add a 2nd
230/138 kV
transformer
Harmony 06/01/2013 Engineering
/Planning
7.50
b0737 Build a new 138 kV
line
Indian
River –
Bishop
06/01/2013 Engineering
/Planning
18.00
b0750 Convert 138 kV Line
to 230 kV
Add a 230/138 kV
transformer
Vienna-
Loretto-
Piney-
Grove
Loretto
06/01/2013 Engineering
/Planning
40.00
b0754 16 km line to bring
298 MVA normal
rating to 333 MVA
emergency rating
Glasgow –
Mt.
Pleasant
06/01/2013 Engineering
/Planning
5.70
b0792 Reconfigure Sub into
230 and 138 kV ring
buses, add a 230/138
kV transformer,
operate the 34 kV bus
normally open
Cecil 06/01/2013 Engineering
/Planning
6.00
3. Interconnecting to the Onshore Transmission Grid
In this section we investigate the feasibility/optimality of various interconnection points for
potential Maryland offshore wind generation and identify the basic requirements to deliver wind
energy. Bluewater Wind proposals, designated in the PJM queue as T122 and R36, will provide
a case study from which it is possible to review impacts on the transmission system and the
associated cost of reinforcement in the system that might be incurred by the interconnection.
Under the scope of this analysis however, this study does not involve a PHI transmission system
modeling and simulation for contingency analysis to determine the effect of various types of
abnormal disturbances on the system performance12
. Modeling work would require proprietary
information from PHI, including power flow diagrams, information regarding power transfer
limits and thermal limits on each transmission line in the system, generator reactive powers, bus
voltages and phases of all substations (Milano et al., 2005; Deuse et al., 2003). Instead, for this
analysis we use a transmission map to make a preliminary birds-eye view determination of
feasible interconnection points.
12
Examples of abnormal disturbances considered by PHI are shown in the PEPCO transmission and interconnection
reliability standards (PHI, 2009e).
35
Two geographic information system data layers, Transmission and Substation layers accompany
this section of the report. These files contain approximate substation locations as well as
transmission lines, voltages and locations, and the distance between each substation. It should be
noted that in this report we do not reveal substation names because of their classification by
Pepco Holdings, Inc as critical infrastructure. The transmission and substation data files can be
accessed online at the following web address, http://prerelease.cgis.us/OceanViewer.
3.1. Case Study: Bluewater Wind–Potential Impacts on the Transmission
System and Network Reinforcement
Integration of offshore wind energy into the onshore transmission grid requires consideration of
interconnection points that minimize network impacts so as to prevent contingent overloads on
the grid. For example, the impact study for project T122 in the queue, analyzed the network
impacts and necessary upgrades to the PHI transmission system caused by the integration of 600
MW of offshore wind generation13
. T122 plans proposed a 138 kV transmission system from
offshore wind farm facilities to Substation B (see Figure 4). However, the total cost of
reinforcing all necessary 69 kV, 138 kV, and 230 kV transmission cables, as well as the breakers
in local or remote substations coupled with Substation B was estimated to cost in excess of $200
million. In Figure 4 we illustrate the local substations cascaded with Substation B.
13
Queue T122, located approximately 20.9 - 24.1 km off of Ocean City, MD was proposed by Bluewater Wind
Maryland, LCC to interconnect an offshore wind energy of 600 MW to PHI’s transmission grid on the Delmarva
Peninsula. The offshore wind farm consisted of two hundred 3 MW wind turbine generators.
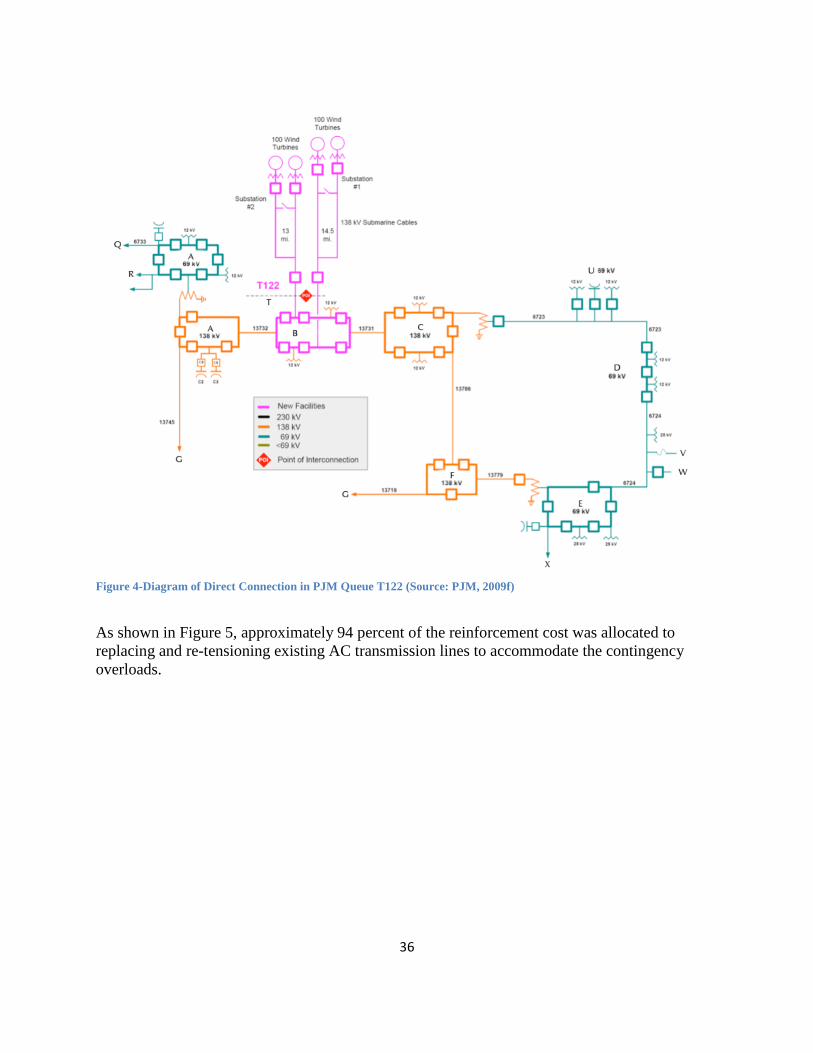
36
As shown in Figure 5, approximately 94 percent of the reinforcement cost was allocated to
replacing and re-tensioning existing AC transmission lines to accommodate the contingency
overloads.
Figure 4-Diagram of Direct Connection in PJM Queue T122 (Source: PJM, 2009f)
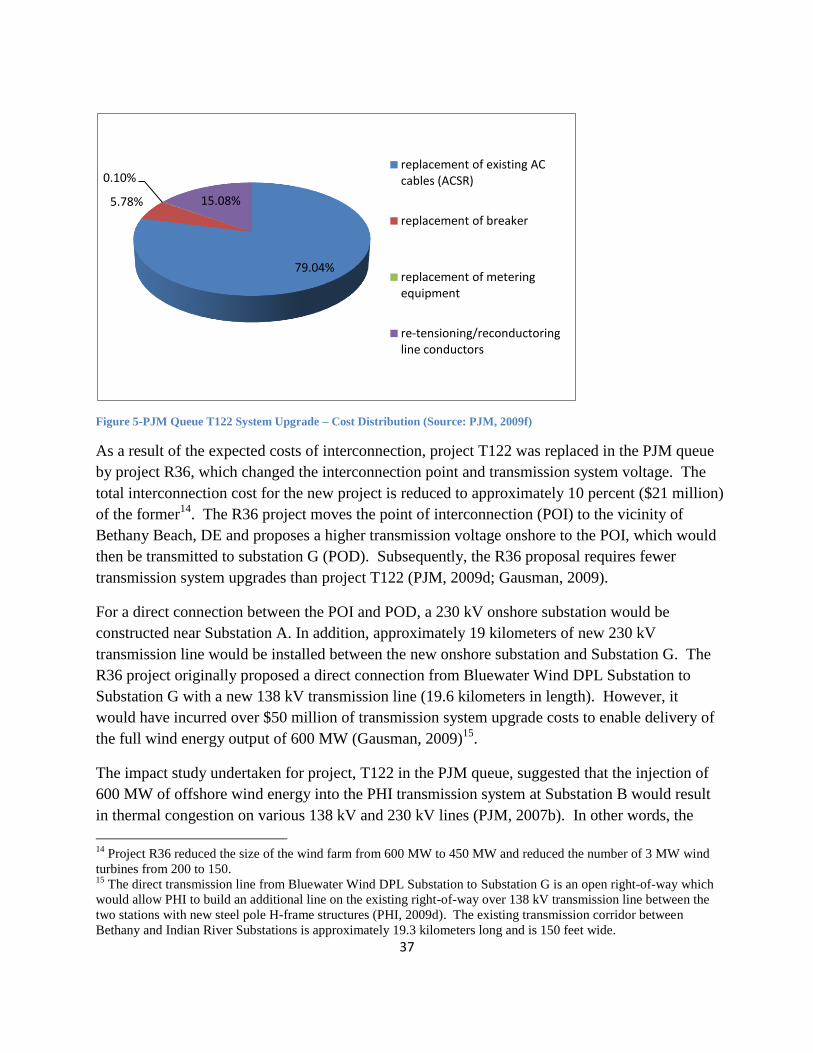
37
Figure 5-PJM Queue T122 System Upgrade – Cost Distribution (Source: PJM, 2009f)
As a result of the expected costs of interconnection, project T122 was replaced in the PJM queue
by project R36, which changed the interconnection point and transmission system voltage. The
total interconnection cost for the new project is reduced to approximately 10 percent ($21 million)
of the former14
. The R36 project moves the point of interconnection (POI) to the vicinity of
Bethany Beach, DE and proposes a higher transmission voltage onshore to the POI, which would
then be transmitted to substation G (POD). Subsequently, the R36 proposal requires fewer
transmission system upgrades than project T122 (PJM, 2009d; Gausman, 2009).
For a direct connection between the POI and POD, a 230 kV onshore substation would be
constructed near Substation A. In addition, approximately 19 kilometers of new 230 kV
transmission line would be installed between the new onshore substation and Substation G. The
R36 project originally proposed a direct connection from Bluewater Wind DPL Substation to
Substation G with a new 138 kV transmission line (19.6 kilometers in length). However, it
would have incurred over $50 million of transmission system upgrade costs to enable delivery of
the full wind energy output of 600 MW (Gausman, 2009)15
.
The impact study undertaken for project, T122 in the PJM queue, suggested that the injection of
600 MW of offshore wind energy into the PHI transmission system at Substation B would result
in thermal congestion on various 138 kV and 230 kV lines (PJM, 2007b). In other words, the
14
Project R36 reduced the size of the wind farm from 600 MW to 450 MW and reduced the number of 3 MW wind
turbines from 200 to 150. 15
The direct transmission line from Bluewater Wind DPL Substation to Substation G is an open right-of-way which
would allow PHI to build an additional line on the existing right-of-way over 138 kV transmission line between the
two stations with new steel pole H-frame structures (PHI, 2009d). The existing transmission corridor between
Bethany and Indian River Substations is approximately 19.3 kilometers long and is 150 feet wide.
79.04%
5.78%
0.10%
15.08%
replacement of existing AC cables (ACSR)
replacement of breaker
replacement of metering equipment
re-tensioning/reconductoring line conductors
38
current PHI transmission system appears to be unable to accommodate the significant offshore
wind resource available (MEA, 2009a; MEA, 2009b). However, because of the high
transmission capacity (up to 2,000 MW) the proposed MAPP line could help to address the issue
by handling the contingent overflow as well. Moreover, controllability of DC flow in the lines
would enable absorption and delivery of offshore power across Maryland without congestion.
4. Optimal Interconnection Points
The costs, projected in the impact and facilities studies of projects T122 and R36 in the PJM
queue, as well as the proposed introduction of the MAPP HVDC transmission backbone in the
Delmarva Peninsula present two considerations for choosing an optimal interconnection point in
the area: (a) wind energy needs to be transmitted via a high transmission voltage (i.e., 230 kV or
more) to reduce network impacts and the associated cost of transmission system upgrade and (b)
the closer the 230 kV (or higher voltage) substation at POD is to an HVDC transmission line, the
higher the reliability and deliverability of the transmission system. With these two rules we can
predict that optimal POI and POD for an offshore wind farm adjacent to Maryland’s Atlantic
coast.
Figure 6 shows two offshore zones in the Atlantic Ocean: Zone A is a 55 km region from
Substation A to the boundary of Maryland and Virginia. Zone A covers most of the ocean east
of Maryland; Zone B represents the offshore area along the Assateague Island National Seashore,
which is designated a Sensitive Species Project Review Areas (SSPRA) by the Department of
Natural Resources (DNR, 2003).
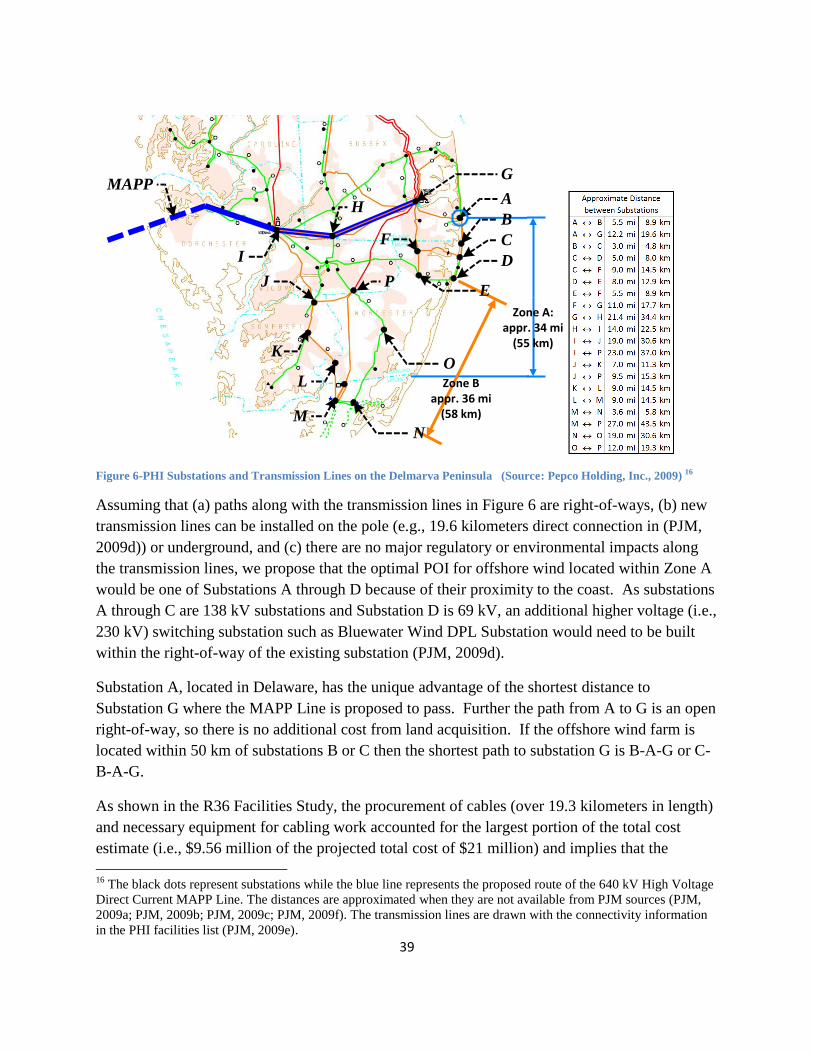
39
Figure 6-PHI Substations and Transmission Lines on the Delmarva Peninsula (Source: Pepco Holding, Inc., 2009) 16
Assuming that (a) paths along with the transmission lines in Figure 6 are right-of-ways, (b) new
transmission lines can be installed on the pole (e.g., 19.6 kilometers direct connection in (PJM,
2009d)) or underground, and (c) there are no major regulatory or environmental impacts along
the transmission lines, we propose that the optimal POI for offshore wind located within Zone A
would be one of Substations A through D because of their proximity to the coast. As substations
A through C are 138 kV substations and Substation D is 69 kV, an additional higher voltage (i.e.,
230 kV) switching substation such as Bluewater Wind DPL Substation would need to be built
within the right-of-way of the existing substation (PJM, 2009d).
Substation A, located in Delaware, has the unique advantage of the shortest distance to
Substation G where the MAPP Line is proposed to pass. Further the path from A to G is an open
right-of-way, so there is no additional cost from land acquisition. If the offshore wind farm is
located within 50 km of substations B or C then the shortest path to substation G is B-A-G or C-
B-A-G.
As shown in the R36 Facilities Study, the procurement of cables (over 19.3 kilometers in length)
and necessary equipment for cabling work accounted for the largest portion of the total cost
estimate (i.e., $9.56 million of the projected total cost of $21 million) and implies that the
16
The black dots represent substations while the blue line represents the proposed route of the 640 kV High Voltage
Direct Current MAPP Line. The distances are approximated when they are not available from PJM sources (PJM,
2009a; PJM, 2009b; PJM, 2009c; PJM, 2009f). The transmission lines are drawn with the connectivity information
in the PHI facilities list (PJM, 2009e).
A
C
D
F
G
H
I
J
K
L
M
O
P
MAPP
B
Zone Bappr. 36 mi
(58 km)
E
Zone A:appr. 34 mi
(55 km)
N
40
interconnection cost will increase with the distance between two onshore substations (PJM,
2009d). Thus minimizing the interconnection cost requires finding the shortest path from POI to
POD (e.g., shortest path problems in network models) (Winston and Venkataramanan, 2003).
However, in Zone B there are significant barriers to interconnection between any offshore wind
facilities and the onshore transmission grid. A lack of substations located near the coast would
likely require land acquisition costs for a new substation on the coast and a right-of-way to
Substations N and O. Additionally, Assateague Island National Seashore prevents a direct
connection to Substations N and O, resulting in a circuitous route around the Seashore17
. This
indirect routing would be necessary if an additional high voltage substation could not be
constructed on Assateague Island due to possible impact on the environmental resource area. In
this case, Substation N in Virginia would be the first option for a POI, but it would require
approximately 76.6 kilometers of cabling (on the shortest path N-M-L-K-J-I) in order to deliver
offshore wind energy to Substation I. Hence, for the given configuration of substations and
transmission lines on the Delmarva Peninsula, as well as our assumptions, we propose that
Substations A to D provide for the optimal POIs and Substation G for optimal POD.
5. References
Allegheny Energy, Inc. 2009. TrAIL. Available at http://aptrailinfo.com/.
American Electric Power (AEP) and Allegheny Energy, Inc. PATH. Available at
http://www.pathtransmission.com/
Deuse, J., K. Karoui, A. Bihain and J. Dubois. 2003. Comprehensive Approach of Power System
Contingency Analysis. Presented at 2003 IEEE Bologna Power Tech Conference, June
23-26, Bologna, Italy.
Dominion. 2008. Carson-Suffolk Line. Available at
http://www.dom.com/about/electrictransmission/carson/index.jsp.
Gausman, W. 2009. Integration of Wind Generation into the Transmission System. Presented to
the Maryland Department of Energy. December 11, 2009.
Green, J., A. Bowen, L.J. Fingersh, Y. Wan. 2007. Electrical Collection and Transmission
Systems for Offshore Wind Power. NREL/CP-500-41135. Available at
http://www.nrel.gov/wind/pdfs/41135.pdf.
International Energy Agency. 2005. Offshore wind experiences. IEA Publications. Paris, France,
75739. Available at http://www.iea.org/textbase/papers/2005/offshore.pdf.
17
We assume that the political and environmental costs of attempting to build a transmission line through the
national seashore preclude its consideration. Instead, we assume transmission cabling would go around the island.
41
Maryland Department of Natural Resources. 2003. Natural Heritage Program-Sensitive Species
Project Review Areas (SSPRA). Available online at
http://www.dnr.state.md.us/wildlife/sspra.asp.
Maryland Energy Administration (MEA). 2009a. Maryland Comprehensive Energy Outlook.
Available at
http://www.energy.state.md.us/documents/MDEnergySupplyandDemandOutlookDraft7-
31mtg.pdf.
Maryland Energy Administration (MEA). 2009b. Maryland Energy Outlook. Available at
http://www.energy.state.md.us/documents/MEOdraftwithrecs120809.pdf
Milano, F., C.A. Cañizares and M. Invernizzi. 2005. Voltage Stability Constrained OPF Market
Models considering N-1 Contingency Criteria. Electric Power Systems Research 74: 27-
36.
Musial, W., Butterfield, S., Ram, B. 2006. Energy from offshore wind. Presented at Offshore
Technology Conference. Houston, TX.
Nature Conservancy. 2009. GIS File-Bathymetry Data Layer. Available online at http://prerelease.cgis.us/OceanViewer
Pepco Holdings, Inc. (PHI). 2009a. Mid-Atlantic Power Pathway. Available at
http://www.powerpathway.com/.
Pepco Holdings, Inc. (PHI). 2009b. Transmission and Interconnection: Reliability Standards.
Available at http://www.pjm.com/planning/planning-criteria/~/media/planning/planning-
criteria/pepco-planning-criteria.ashx.
Pepco Holdings, Inc. (PHI). 2009c. Integration of Wind Generation into the Transmission
System. Presented to the Maryland Department of Energy by William M. Gausman,
Senior Vice President, PHI. December 11, 2009.
Pepco Holdings, Inc. 2009d. Personal Communication via email and phone with Bill Mitchell.
Manager, Transmission Services. December, 2009. Newark, DE 19714.
Pepco Holdings, Inc. 2009e. Transmission and Interconnection Reliability Standards. Available
online: http://www.pjm.com/planning/planning-criteria/~/media/planning/planning-
criteria/pepco-planning-criteria.ashx.
Pepco Holdings, Inc. 2010. PHI Requests Procedural Delay for MAPP Project. Available at
http://www.pepco.com/welcome/news/releases/archives/2010/article.aspx?cid=1316.
PJM. 2007a. Transmission Providers Facilities List. Available at http://www.pjm.com/markets-
and-operations/transmission-service/~/media/markets-ops/trans-service/trans-fac-
help.ashx.
42
PJM. 2007b. Generator Interconnection T122 Ocean Bay 600 MW Impact Study. Available at
http://www.pjm.com/planning/generation-interconnection/generation-queue-
withdraw.aspx.
PJM. 2008a. PJM Generator Interconnection R36 Bethany 450 MW Impact Re-Study. Available
at http://www.pjm.com/planning/generation-interconnection/generation-queue-
active.aspx.
PJM. 2008b. RTEP – Reliability Analysis Update. Available at
http://www.pjm.com/~/media/committees-groups/committees/teac/20081015/20081015-
reliability-analysis-update.ashx.
PJM. 2008c. Regional Transmission Expansion Plan Report. Available at
http://www.pjm.com/documents/reports/rtep-report.aspx.
PJM. 2009a. PJM backbone projects. Available at http://www.pjm.com/planning/rtep-upgrades-
status/backbone-status.aspx.
PJM. 2009b. Regional Transmission Upgrades and Status-Transmission Construction Status.
Available at http://www.pjm.com/planning/rtep-upgrades-status/construct-status.aspx.
PJM Transmission Expansion Advisory Committee (TEAC). 2009c. 2009 RTEP Assumptions.
Available at http://www.pjm.com/~/media/committees-
groups/committees/teac/20090313/20090313-reliability-analysis-update.ashx.
PJM. 2009d. PJM Generator Interconnection R36 Bethany 450 MW Facilities Study. Available
at http://www.pjm.com/planning/generation-interconnection/generation-queue-
active.aspx
PJM. 2009e. PJM Transmission Providers Facilities List. Available online:
http://www.pjm.com/markets-and-operations/transmission-service/~/media/markets-
ops/trans-service/trans-fac-help.ashx
PJM. 2009f. PJM Generator Interconnection T122 Ocean Bay 600 MW Impact Study. Available
at http://www.pjm.com/planning/generation-interconnection/generation-queue-
withdraw.aspx.
Potomac-Appalachian Transmission Highline, LLC. 2009. PATH. Available at
http://www.pathtransmission.com/default.asp.
PPL Electric Utilities. 2008. Susquehanna-Roseland Project. Available at
http://www.pplreliablepower.com/index.htm.
PSE&G. 2009. Susquehanna-Roseland Line. Available at
http://www.pseg.com/companies/pseandg/powerline/overview.jsp.
Talisman Energy. n.d.. Beatrice Demonstration Project Scoping Report. Available at
http://www.beatricewind.co.uk/home/default.asp.

43
Winston, W. L. and M. Venkataramanan. 2003. Introduction to Mathematical Programming (4th
ed). Brooks/Cole-Thomson Learning: p. 414-418.
44
III. An Investment Model: Collection and
Transmission Systems for Offshore Wind Power
Yohan Shim1, Andrew Blohm
1 Jeremy Peichel
1
1. Center for Integrative Environmental Research, Division of Research, University of Maryland,
College Park, MD, 20742, USA
1. Introduction
In this chapter we examine investment costs for two hypothetical wind farms adjacent to
Maryland’s coastline. In our scenario analysis we consider the influence of water depth and its
implications on foundation technology choices, transmission and collection systems, cable length,
and wind potential for the area on total investment cost for a 600 MW and 1,000 MW facility.
The organization of the chapter is as follows. We first explore the underlying assumptions
within our simplified investment model, then perform the model analysis and discuss the results.
In this study we rely heavily on existing literature, experiential data from wind farms built to
date, planning documents for wind farms yet to be constructed, as well as information from
contacts within the wind industry.
In Section 2 we discuss offshore wind projects in Europe and proposed projects in the United
States. We use the experiences in Europe and the United States to estimate component costs,
technology choice, wind farm configuration and interconnection costs associated with
developing offshore wind. Wind farm component costs are compiled from a variety of sources
including existing literature on offshore wind energy development in Europe as well as planned
projects in the United States, such as the planned 468 MW Cape Wind project in Nantucket
Sound, Massachusetts and the 450 MW Bluewater Wind project proposed offshore of Bethany
Beach, Delaware.
Section 3 focuses on bathymetry and wind data for areas off of Maryland’s shores. Water depth
will be a critical factor in determining the appropriate foundation system for a project and,
according to a study of European wind farms, foundation costs accounted for approximately 24
percent of total costs (Duwind, 2001). In our first scenario, we assume that offshore wind will be
sited in shallow water (less than 30 meters) for two reasons: first, only two projects have been
built in water depths greater than 30 meters; and second, shallow water predominates off the
45
coast of Maryland (within 64 kilometers of shore) (see Section 3.1)18
. In the second scenario, a
1,000 MW facility, we assume a deep-water application. It is likely that offshore wind in
deepwater applications will rely heavily on existing oil and natural gas platform technologies.
Section 4 discusses existing collection and transmission system technologies, as well as reviews
existing wind farm configurations. The choice of transmission system will depend on a number
of factors including the distance from the point of interconnection, as well as the capacity
constraints to receive input at those points.
In Section 5 we specify the underlying assumptions for a simplified investment model using our
review of literature before discussing the results from our model. The investment cost is
estimated for a given wind farm layout and given input parameters such as the number of wind
turbines, wind turbine size, wind turbine array and spacing, and length of collection and
transmission cables.
2. Offshore Wind-Europe and the United States
In this section we explore lessons learned from offshore wind in Europe before turning our
attention to proposed offshore wind projects in the United States. Europe has significantly more
offshore wind projects installed, while the United States has a number of projects in
development. Two projects in the United States -- Cape Wind and Bluewater Wind -- are
particularly important for informing assumptions within the investment model detailed in Section
5.
Offshore wind energy has many advantages over its onshore counterpart including greater and
less intermittent wind speed, space, aesthetic advantages, and proximity to population centers.
However, offshore wind is still about 50 percent more expensive than onshore wind (EWEA,
2009b).
First, stronger, steadier winds offshore can produce more wind energy, which offsets a portion of
the higher installation and operation costs. Weather models have shown a sharp increase in wind
speed as the distance from shore increases (Musial et al., 2006). The National Renewable
Energy Laboratory (NREL) estimates that 907 gigawatts (GW) of offshore wind resource is
viable for the zone of 9.6 - 92 kilometers off the coast of United States–Class 5 and 6 and some
Class 7 winds are available in this zone (Musial and Butterfield, 2004). About 10 percent or 98
GW of the wind energy potential is found in shallow water; mid-Atlantic states have a wind
18
The Beatrice Project is a demonstration project off the coast of Scotland that operates in water depths of 45 meters.
The Hywind Project is a demonstration project off the coast of Norway operated by StatoilHydro. The project
consists of a floating wind turbine and is located in over water depths of approximately 220 meters (Statoil, 2009).

46
energy potential of 82 GW in shallow water and 178.5 GW in deep water. Of the contiguous 48
states, 28 with coastal boundaries use 78 percent of the nation’s electricity; shallow water
offshore potential (less than 30m in depth) in 26 of 28 states would meet at least 20 percent of
their electricity needs (US DOE EERE, 2009).
Second, siting wind farms further from shore can mitigate some of the public acceptance issues
related to visual and noise impacts of the wind turbines (Musial et al., 2006)19
. Third, building
wind farms offshore offers a larger area for installation, which allows for installation of larger
turbines (Breton and Moe, 2009). Finally, adequate wind sites close to major urban load centers
can allow for shorter transmission lines.
There are many challenges in developing offshore wind energy as described in Breton and Moe
(2009). Higher investment costs for installing wind turbine towers and substructures and
underwater cabling between wind turbines are required, which is 1.5 - 2 times more expensive
than onshore (Breton and Moe, 2009). According to the European Wind Energy Association
(2009b) in both offshore and onshore applications, turbines account for the largest share of total
costs, 49 percent of total investment costs for offshore applications and 76 percent for onshore
applications (see Table 4). However, offshore wind farms require significant investments in
foundation and transmission systems, which can account for approximately 37 percent of the
total investment cost per MW. Meanwhile, similar costs for an onshore application (i.e., land
rent, grid connection, foundation, road construction) accounts for only 20 percent of the total
investment cost (EWEA, 2009b). EWEA (2009b) projects that investment costs for a new
offshore wind farm (near shore in shallow water) are currently in the range of 2.0 - 2.2 million
Euro/MW on average20
. The average cost is expected to decrease approximately 15 percent
(1.81 million Euro/MW or $2.5 million) by 2015.
19
Visual and noise impacts do not represent the entire set of issues related to offshore wind farms. The College of
Marine Studies, University of Delaware identified other impacts from a survey of Cape Cod, MA residents including
impacts on marine life, aesthetics, fishing impacts, and boating and yachting safety, etc. (Firestone and Kempton,
2006). 20
Given the current exchange rate of 1 euro equal to about $1.41, range of investment is on the order of $2.8 million
to $3.1 million (XE, 2010).
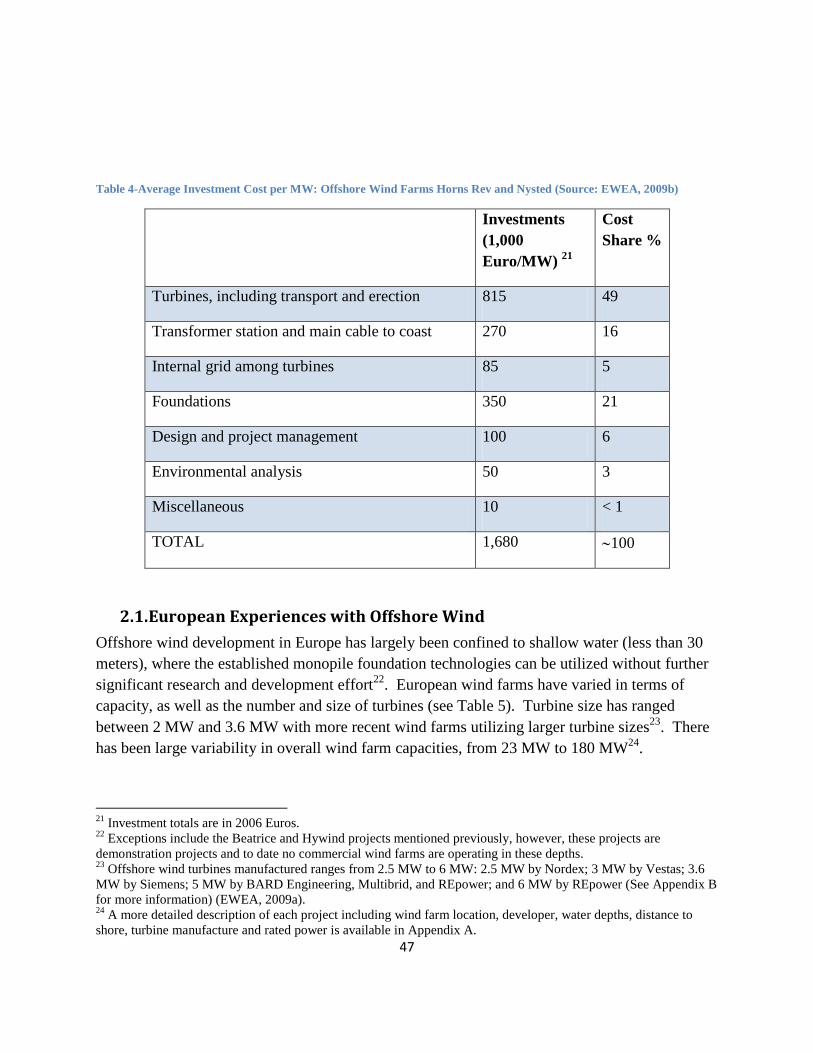
47
Table 4-Average Investment Cost per MW: Offshore Wind Farms Horns Rev and Nysted (Source: EWEA, 2009b)
Investments
(1,000
Euro/MW) 21
Cost
Share %
Turbines, including transport and erection 815 49
Transformer station and main cable to coast 270 16
Internal grid among turbines 85 5
Foundations 350 21
Design and project management 100 6
Environmental analysis 50 3
Miscellaneous 10 < 1
TOTAL 1,680 100
2.1. European Experiences with Offshore Wind
Offshore wind development in Europe has largely been confined to shallow water (less than 30
meters), where the established monopile foundation technologies can be utilized without further
significant research and development effort22
. European wind farms have varied in terms of
capacity, as well as the number and size of turbines (see Table 5). Turbine size has ranged
between 2 MW and 3.6 MW with more recent wind farms utilizing larger turbine sizes23
. There
has been large variability in overall wind farm capacities, from 23 MW to 180 MW24
.
21
Investment totals are in 2006 Euros. 22
Exceptions include the Beatrice and Hywind projects mentioned previously, however, these projects are
demonstration projects and to date no commercial wind farms are operating in these depths. 23
Offshore wind turbines manufactured ranges from 2.5 MW to 6 MW: 2.5 MW by Nordex; 3 MW by Vestas; 3.6
MW by Siemens; 5 MW by BARD Engineering, Multibrid, and REpower; and 6 MW by REpower (See Appendix B
for more information) (EWEA, 2009a). 24
A more detailed description of each project including wind farm location, developer, water depths, distance to
shore, turbine manufacture and rated power is available in Appendix A.
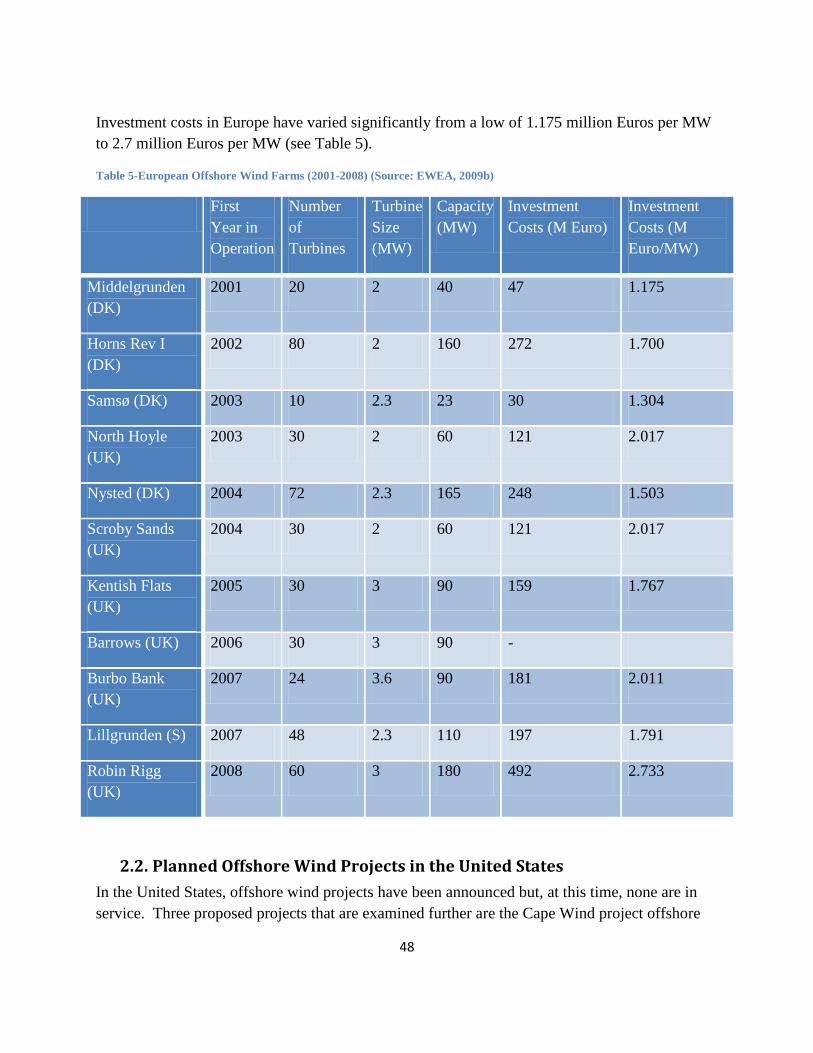
48
Investment costs in Europe have varied significantly from a low of 1.175 million Euros per MW
to 2.7 million Euros per MW (see Table 5).
Table 5-European Offshore Wind Farms (2001-2008) (Source: EWEA, 2009b)
First
Year in
Operation
Number
of
Turbines
Turbine
Size
(MW)
Capacity
(MW)
Investment
Costs (M Euro)
Investment
Costs (M
Euro/MW)
Middelgrunden
(DK)
2001 20 2 40 47 1.175
Horns Rev I
(DK)
2002 80 2 160 272 1.700
Samsø (DK) 2003 10 2.3 23 30 1.304
North Hoyle
(UK)
2003 30 2 60 121 2.017
Nysted (DK) 2004 72 2.3 165 248 1.503
Scroby Sands
(UK)
2004 30 2 60 121 2.017
Kentish Flats
(UK)
2005 30 3 90 159 1.767
Barrows (UK) 2006 30 3 90 -
Burbo Bank
(UK)
2007 24 3.6 90 181 2.011
Lillgrunden (S) 2007 48 2.3 110 197 1.791
Robin Rigg
(UK)
2008 60 3 180 492 2.733
2.2. Planned Offshore Wind Projects in the United States
In the United States, offshore wind projects have been announced but, at this time, none are in
service. Three proposed projects that are examined further are the Cape Wind project offshore
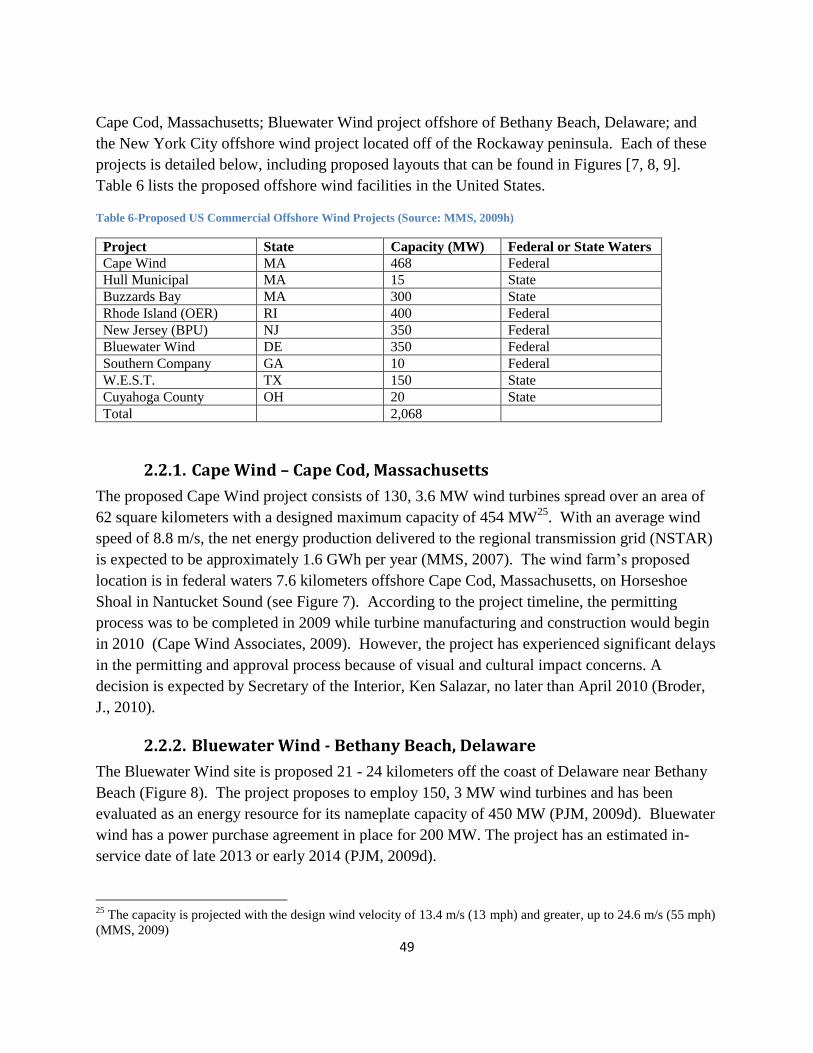
49
Cape Cod, Massachusetts; Bluewater Wind project offshore of Bethany Beach, Delaware; and
the New York City offshore wind project located off of the Rockaway peninsula. Each of these
projects is detailed below, including proposed layouts that can be found in Figures [7, 8, 9].
Table 6 lists the proposed offshore wind facilities in the United States.
Table 6-Proposed US Commercial Offshore Wind Projects (Source: MMS, 2009h)
Project State Capacity (MW) Federal or State Waters
Cape Wind MA 468 Federal
Hull Municipal MA 15 State
Buzzards Bay MA 300 State
Rhode Island (OER) RI 400 Federal
New Jersey (BPU) NJ 350 Federal
Bluewater Wind DE 350 Federal
Southern Company GA 10 Federal
W.E.S.T. TX 150 State
Cuyahoga County OH 20 State
Total 2,068
2.2.1. Cape Wind – Cape Cod, Massachusetts
The proposed Cape Wind project consists of 130, 3.6 MW wind turbines spread over an area of
62 square kilometers with a designed maximum capacity of 454 MW25
. With an average wind
speed of 8.8 m/s, the net energy production delivered to the regional transmission grid (NSTAR)
is expected to be approximately 1.6 GWh per year (MMS, 2007). The wind farm’s proposed
location is in federal waters 7.6 kilometers offshore Cape Cod, Massachusetts, on Horseshoe
Shoal in Nantucket Sound (see Figure 7). According to the project timeline, the permitting
process was to be completed in 2009 while turbine manufacturing and construction would begin
in 2010 (Cape Wind Associates, 2009). However, the project has experienced significant delays
in the permitting and approval process because of visual and cultural impact concerns. A
decision is expected by Secretary of the Interior, Ken Salazar, no later than April 2010 (Broder,
J., 2010).
2.2.2. Bluewater Wind - Bethany Beach, Delaware
The Bluewater Wind site is proposed 21 - 24 kilometers off the coast of Delaware near Bethany
Beach (Figure 8). The project proposes to employ 150, 3 MW wind turbines and has been
evaluated as an energy resource for its nameplate capacity of 450 MW (PJM, 2009d). Bluewater
wind has a power purchase agreement in place for 200 MW. The project has an estimated in-
service date of late 2013 or early 2014 (PJM, 2009d).
25
The capacity is projected with the design wind velocity of 13.4 m/s (13 mph) and greater, up to 24.6 m/s (55 mph)
(MMS, 2009)
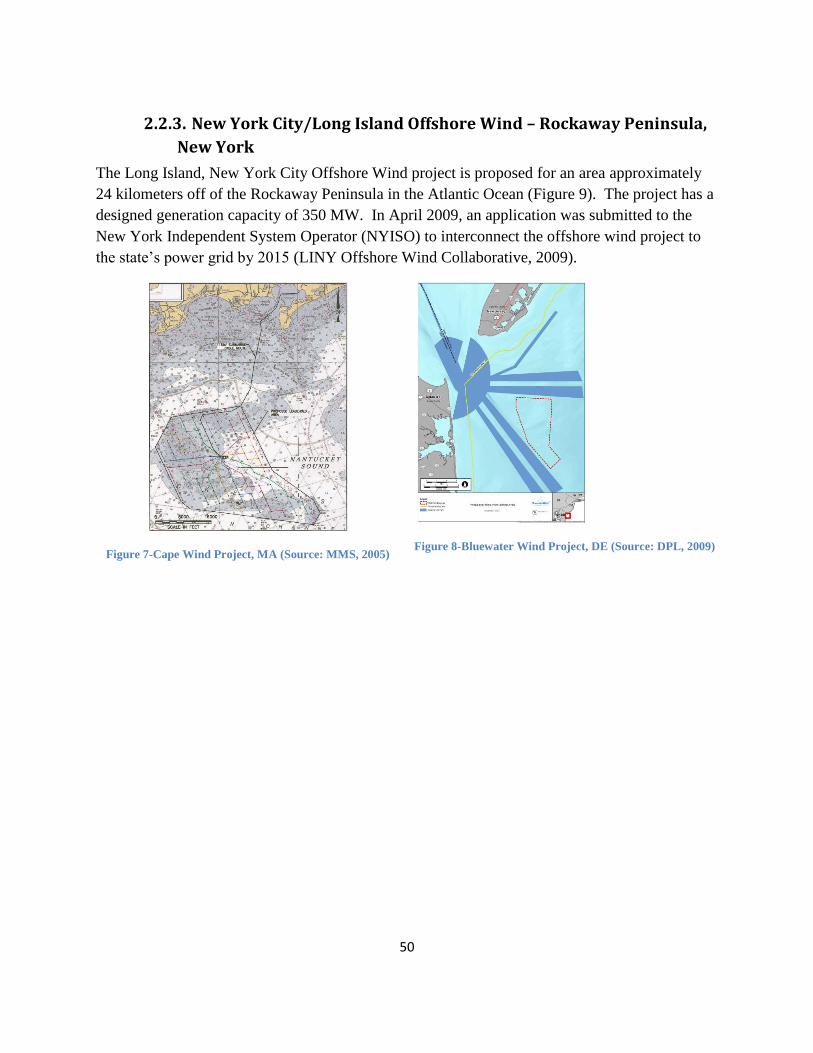
50
2.2.3. New York City/Long Island Offshore Wind – Rockaway Peninsula,
New York
The Long Island, New York City Offshore Wind project is proposed for an area approximately
24 kilometers off of the Rockaway Peninsula in the Atlantic Ocean (Figure 9). The project has a
designed generation capacity of 350 MW. In April 2009, an application was submitted to the
New York Independent System Operator (NYISO) to interconnect the offshore wind project to
the state’s power grid by 2015 (LINY Offshore Wind Collaborative, 2009).
Figure 7-Cape Wind Project, MA (Source: MMS, 2005)
Figure 8-Bluewater Wind Project, DE (Source: DPL, 2009)
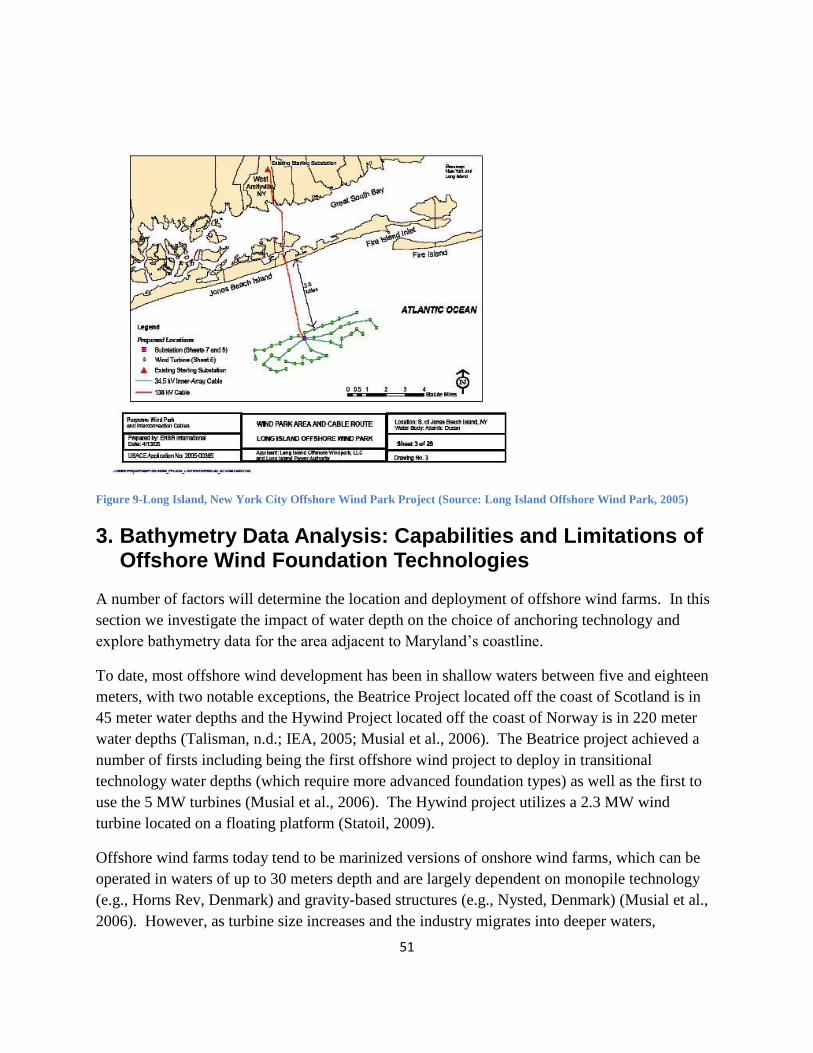
51
Figure 9-Long Island, New York City Offshore Wind Park Project (Source: Long Island Offshore Wind Park, 2005)
3. Bathymetry Data Analysis: Capabilities and Limitations of Offshore Wind Foundation Technologies
A number of factors will determine the location and deployment of offshore wind farms. In this
section we investigate the impact of water depth on the choice of anchoring technology and
explore bathymetry data for the area adjacent to Maryland’s coastline.
To date, most offshore wind development has been in shallow waters between five and eighteen
meters, with two notable exceptions, the Beatrice Project located off the coast of Scotland is in
45 meter water depths and the Hywind Project located off the coast of Norway is in 220 meter
water depths (Talisman, n.d.; IEA, 2005; Musial et al., 2006). The Beatrice project achieved a
number of firsts including being the first offshore wind project to deploy in transitional
technology water depths (which require more advanced foundation types) as well as the first to
use the 5 MW turbines (Musial et al., 2006). The Hywind project utilizes a 2.3 MW wind
turbine located on a floating platform (Statoil, 2009).
Offshore wind farms today tend to be marinized versions of onshore wind farms, which can be
operated in waters of up to 30 meters depth and are largely dependent on monopile technology
(e.g., Horns Rev, Denmark) and gravity-based structures (e.g., Nysted, Denmark) (Musial et al.,
2006). However, as turbine size increases and the industry migrates into deeper waters,
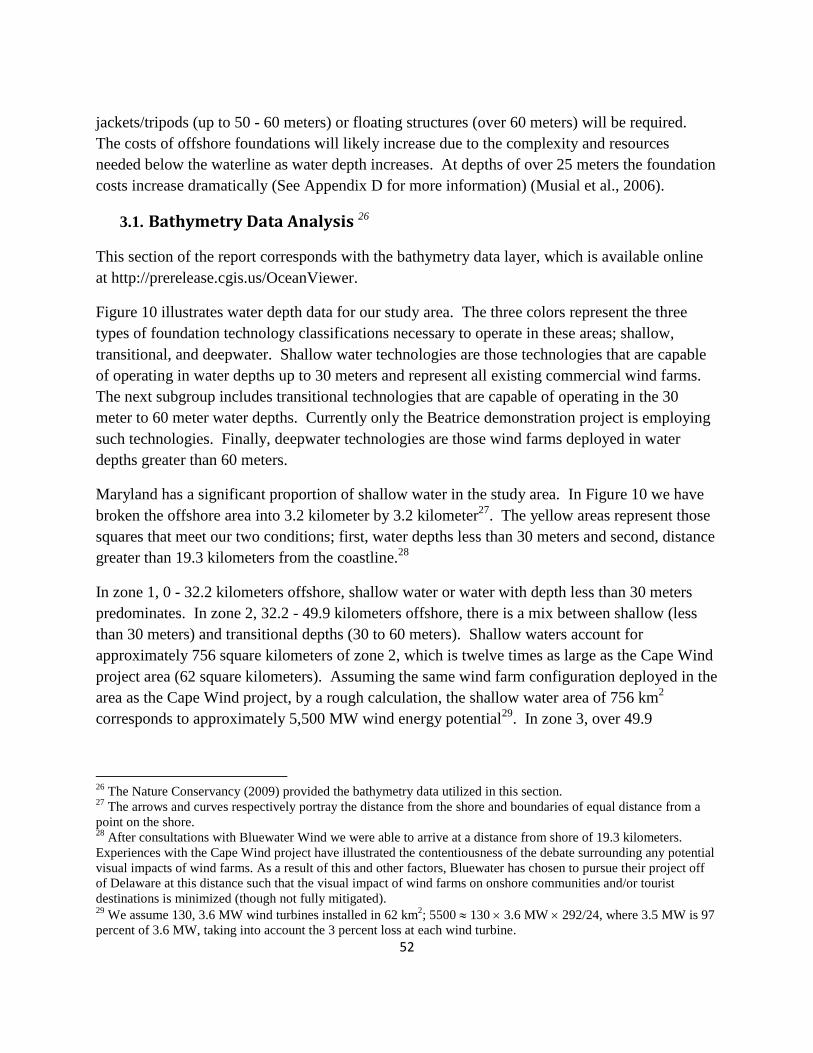
52
jackets/tripods (up to 50 - 60 meters) or floating structures (over 60 meters) will be required.
The costs of offshore foundations will likely increase due to the complexity and resources
needed below the waterline as water depth increases. At depths of over 25 meters the foundation
costs increase dramatically (See Appendix D for more information) (Musial et al., 2006).
3.1. Bathymetry Data Analysis 26
This section of the report corresponds with the bathymetry data layer, which is available online
at http://prerelease.cgis.us/OceanViewer.
Figure 10 illustrates water depth data for our study area. The three colors represent the three
types of foundation technology classifications necessary to operate in these areas; shallow,
transitional, and deepwater. Shallow water technologies are those technologies that are capable
of operating in water depths up to 30 meters and represent all existing commercial wind farms.
The next subgroup includes transitional technologies that are capable of operating in the 30
meter to 60 meter water depths. Currently only the Beatrice demonstration project is employing
such technologies. Finally, deepwater technologies are those wind farms deployed in water
depths greater than 60 meters.
Maryland has a significant proportion of shallow water in the study area. In Figure 10 we have
broken the offshore area into 3.2 kilometer by 3.2 kilometer27
. The yellow areas represent those
squares that meet our two conditions; first, water depths less than 30 meters and second, distance
greater than 19.3 kilometers from the coastline.28
In zone 1, 0 - 32.2 kilometers offshore, shallow water or water with depth less than 30 meters
predominates. In zone 2, 32.2 - 49.9 kilometers offshore, there is a mix between shallow (less
than 30 meters) and transitional depths (30 to 60 meters). Shallow waters account for
approximately 756 square kilometers of zone 2, which is twelve times as large as the Cape Wind
project area (62 square kilometers). Assuming the same wind farm configuration deployed in the
area as the Cape Wind project, by a rough calculation, the shallow water area of 756 km2
corresponds to approximately 5,500 MW wind energy potential29
. In zone 3, over 49.9
26
The Nature Conservancy (2009) provided the bathymetry data utilized in this section. 27
The arrows and curves respectively portray the distance from the shore and boundaries of equal distance from a
point on the shore. 28
After consultations with Bluewater Wind we were able to arrive at a distance from shore of 19.3 kilometers.
Experiences with the Cape Wind project have illustrated the contentiousness of the debate surrounding any potential
visual impacts of wind farms. As a result of this and other factors, Bluewater has chosen to pursue their project off
of Delaware at this distance such that the visual impact of wind farms on onshore communities and/or tourist
destinations is minimized (though not fully mitigated). 29
We assume 130, 3.6 MW wind turbines installed in 62 km2; 5500 130 3.6 MW 292/24, where 3.5 MW is 97
percent of 3.6 MW, taking into account the 3 percent loss at each wind turbine.
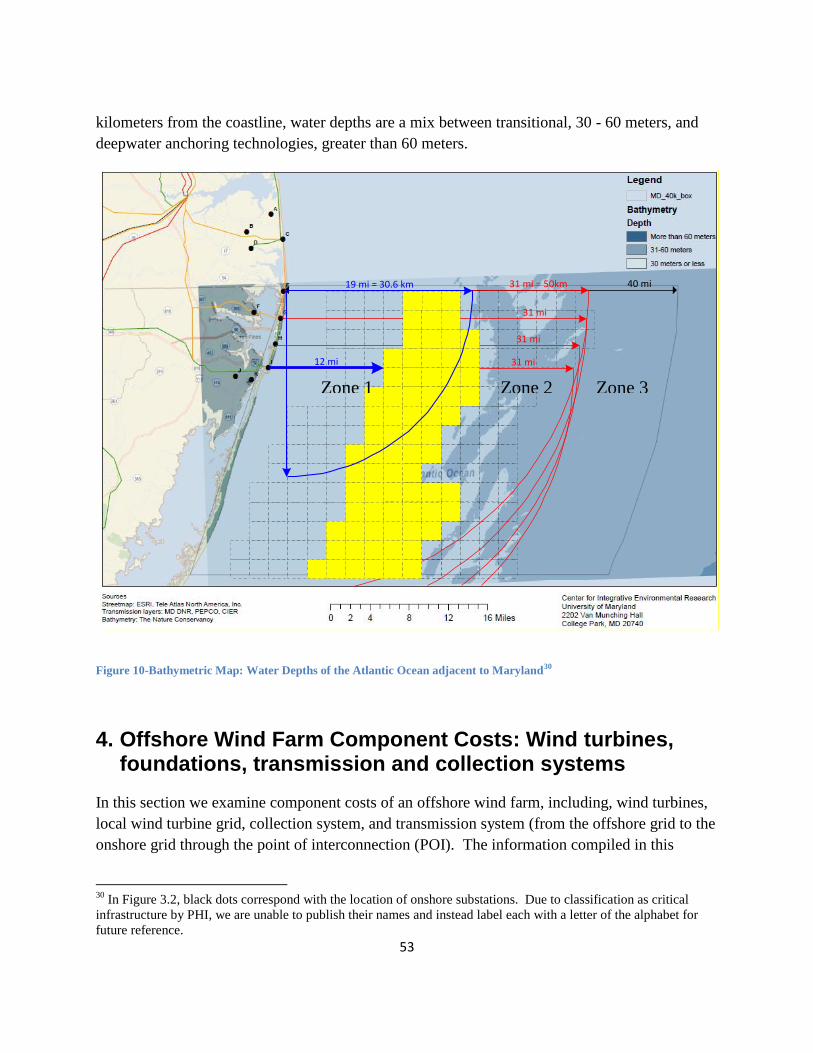
53
kilometers from the coastline, water depths are a mix between transitional, 30 - 60 meters, and
deepwater anchoring technologies, greater than 60 meters.
Figure 10-Bathymetric Map: Water Depths of the Atlantic Ocean adjacent to Maryland30
4. Offshore Wind Farm Component Costs: Wind turbines, foundations, transmission and collection systems
In this section we examine component costs of an offshore wind farm, including, wind turbines,
local wind turbine grid, collection system, and transmission system (from the offshore grid to the
onshore grid through the point of interconnection (POI). The information compiled in this
30
In Figure 3.2, black dots correspond with the location of onshore substations. Due to classification as critical
infrastructure by PHI, we are unable to publish their names and instead label each with a letter of the alphabet for
future reference.
40 mi 31 mi = 50km
31 mi
31 mi
31 mi
12 mi
19 mi = 30.6 km
Zone 1 Zone 2 Zone 3
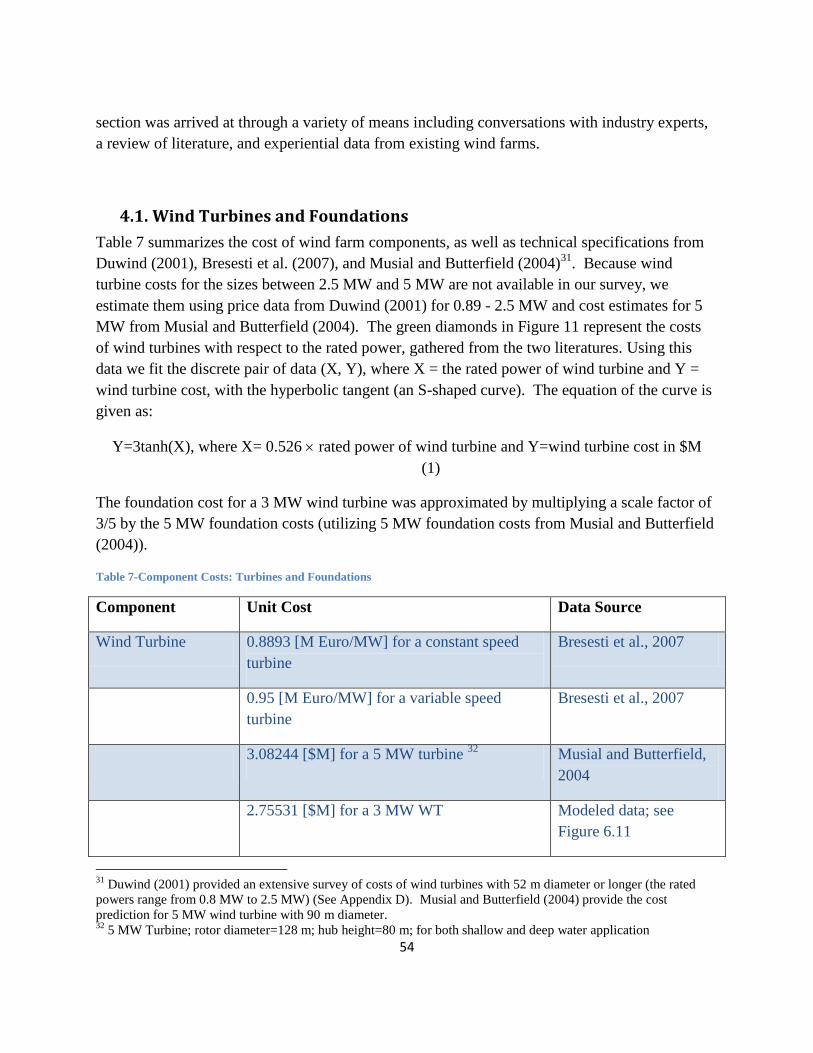
54
section was arrived at through a variety of means including conversations with industry experts,
a review of literature, and experiential data from existing wind farms.
4.1. Wind Turbines and Foundations
Table 7 summarizes the cost of wind farm components, as well as technical specifications from
Duwind (2001), Bresesti et al. (2007), and Musial and Butterfield (2004)31
. Because wind
turbine costs for the sizes between 2.5 MW and 5 MW are not available in our survey, we
estimate them using price data from Duwind (2001) for 0.89 - 2.5 MW and cost estimates for 5
MW from Musial and Butterfield (2004). The green diamonds in Figure 11 represent the costs
of wind turbines with respect to the rated power, gathered from the two literatures. Using this
data we fit the discrete pair of data (X, Y), where X = the rated power of wind turbine and Y =
wind turbine cost, with the hyperbolic tangent (an S-shaped curve). The equation of the curve is
given as:
Y=3tanh(X), where X= 0.526 rated power of wind turbine and Y=wind turbine cost in $M
(1)
The foundation cost for a 3 MW wind turbine was approximated by multiplying a scale factor of
3/5 by the 5 MW foundation costs (utilizing 5 MW foundation costs from Musial and Butterfield
(2004)).
Table 7-Component Costs: Turbines and Foundations
Component Unit Cost Data Source
Wind Turbine 0.8893 [M Euro/MW] for a constant speed
turbine
Bresesti et al., 2007
0.95 [M Euro/MW] for a variable speed
turbine
Bresesti et al., 2007
3.08244 [$M] for a 5 MW turbine 32
Musial and Butterfield,
2004
2.75531 [$M] for a 3 MW WT Modeled data; see
Figure 6.11
31
Duwind (2001) provided an extensive survey of costs of wind turbines with 52 m diameter or longer (the rated
powers range from 0.8 MW to 2.5 MW) (See Appendix D). Musial and Butterfield (2004) provide the cost
prediction for 5 MW wind turbine with 90 m diameter. 32
5 MW Turbine; rotor diameter=128 m; hub height=80 m; for both shallow and deep water application
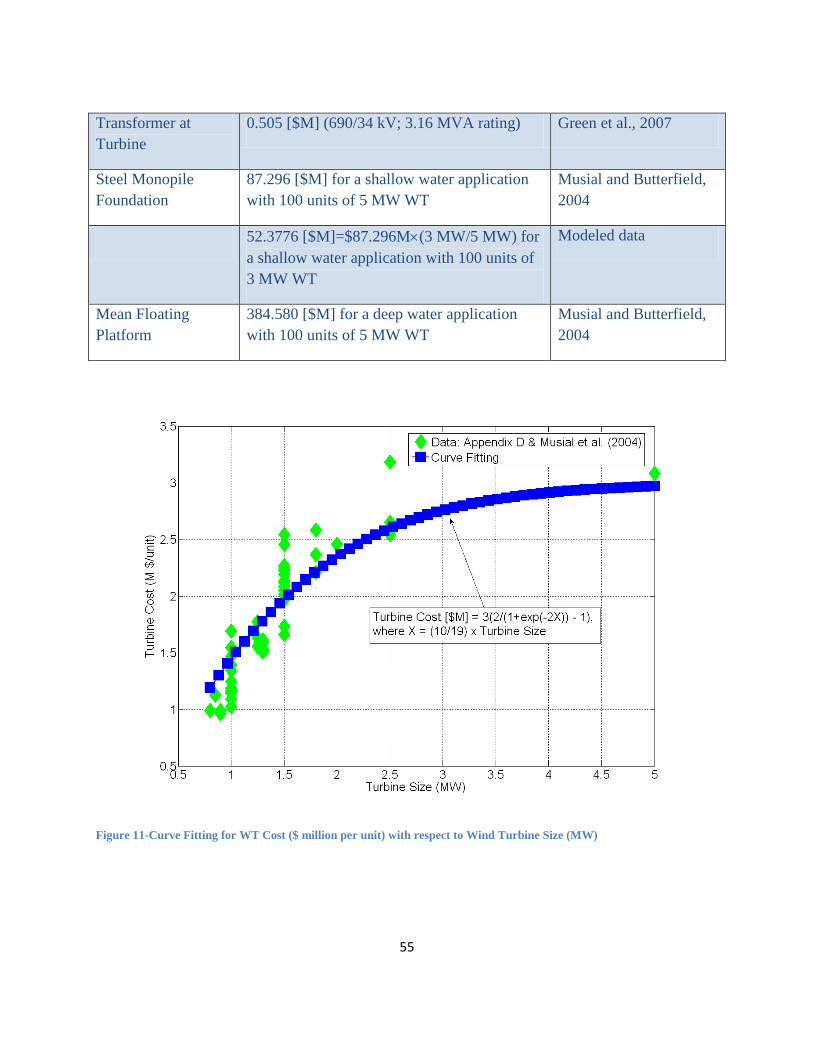
55
Transformer at
Turbine
0.505 [$M] (690/34 kV; 3.16 MVA rating) Green et al., 2007
Steel Monopile
Foundation
87.296 [$M] for a shallow water application
with 100 units of 5 MW WT
Musial and Butterfield,
2004
52.3776 [$M]=$87.296M(3 MW/5 MW) for
a shallow water application with 100 units of
3 MW WT
Modeled data
Mean Floating
Platform
384.580 [$M] for a deep water application
with 100 units of 5 MW WT
Musial and Butterfield,
2004
Figure 11-Curve Fitting for WT Cost ($ million per unit) with respect to Wind Turbine Size (MW)
56
4.2. Collection and Transmission System
In this section we investigate potential transmission technologies. We consider three
transmission technologies: HVAC, HVDC LCC (HVDC Line Commutating Converters), and
HVDC VSC (HVDC Voltage Source Converters). With a brief overview of the features of these
transmission solutions, the cost of each component along with the assumptions made will be
presented.
4.3. Collection System
Wind turbines generate power as an alternating current (AC) with a typical voltage of 33 kV.
The power generated by the wind turbine generators is collected in submarine cables buried in
the seabed. Wind turbines within a wind farm grid are interconnected at 33 kV to an offshore
substation located within the grid, where the low voltage is transformed (or stepped-up) to higher
voltage to match the voltage of the existing onshore utility transmission lines (e.g. 138 kV or 230
kV of Delmarva Power).
The collection system consists of transformers at wind turbines and medium-voltage submarine
cables. The transformer at each wind turbine steps up the low generation voltage (e.g. 690 V) to
a medium voltage (34 kV). The submarine cables, typically buried 1 - 2 m deep in the seabed,
connect wind turbines with an offshore substation. We assume that the generator voltage is 690
V, which is then stepped up to 34 kV by the transformer of a 3.16 MVA rated power. Both costs
of collection cables for specific conductor sizes and transformer unit cost are provided in Green
et al. (2007). Table 8 summarizes the unit costs for different conductor sizes of cables collected
from the reference.
Table 8-Cost of AC Collection Cables
Component Unit Cost Data Source
AC Collection
Cable
$152/m (XLPE 33
; 95
mm2)
Green et al., 2007
$228/m (XLPE; 150
mm2)
Green et al., 2007
$381/m (XLPE; 400
mm2)
Green et al., 2007
33
XLPE: Cross Linked Polyethylene Insulation
57
$571/m (XLPE; 630
mm2)
Green et al., 2007
$600/m (XLPE; 800
mm2)
Green et al., 2007
4.4. Analysis of characteristics and costs of three transmission systems
European wind projects have proven high-voltage AC (HVAC) as a feasible solution for
bringing offshore wind power onshore. Offshore wind projects in the United States, including
the Cape Wind and the Bluewater Wind projects, have also chosen the HVAC technology for
interconnecting offshore wind farms to the onshore transmission grids (i.e., NSTAR, DP&L).
However, HVAC cables become increasingly expensive beyond distances of 40 km owing to the
need for reactive power compensation (EASAC, 2009). HVDC has emerged as an attractive
solution for interconnections with longer transmission distances (above 50 km) owing to lower
power losses during transmission as well as lower costs of cables than HVAC (Green et al., 2007;
Wright et al., 2002). However, the disadvantage of HVDC is that the capital costs of AC-to-DC
converter stations (for both offshore and onshore) are higher than the corresponding substations
in HVAC transmission34
. In subsequent sections, we provide a brief description of each of the
three transmission systems and the costs of components of each system for a better
understanding of the relative characteristics of the capital costs of HVAC and HVDC
transmission systems.
4.5. HVAC Transmission System
The main components of high-voltage AC transmission system are: (a) offshore and onshore
substations including transformers and reactive compensators; and (b) three-core XLPE HVAC
cables. AC cable generates considerable reactive current, which decreases active power
transmitted through the cable. Bresesti et al. (2007) find that typical reactive powers are in the
range of 100 - 150 kVAR per km for 33 kV XLPE cables, 1,000 kVAR/km for 132 kV XLPE
cables, and 1,000 kVAR per km for 400 kV XLPE cables. Thus the longer the AC cable, the
more reactive power (kVAR) is generated. For a long transmission (e.g., 1040 km) reactive
compensators are installed at both offshore and onshore substations to compensate the reactive
power loss along the transmission line. Table 9 summarizes costs and characteristics of
transformers, reactive power compensators, switch gears and HVAC transmission cables with
installation costs acquired from Green et al. (2007) and Lazaridis (2005). Costs of 500 kV
submarine AC cables are obtained from a MAPP project description (PJM, 2008a).
34
The distinct characteristics of HVAC and HVDC transmission systems, in the context of submarine transmission,
are well described in Wright et al. (2002) and Negra et al. (2006).
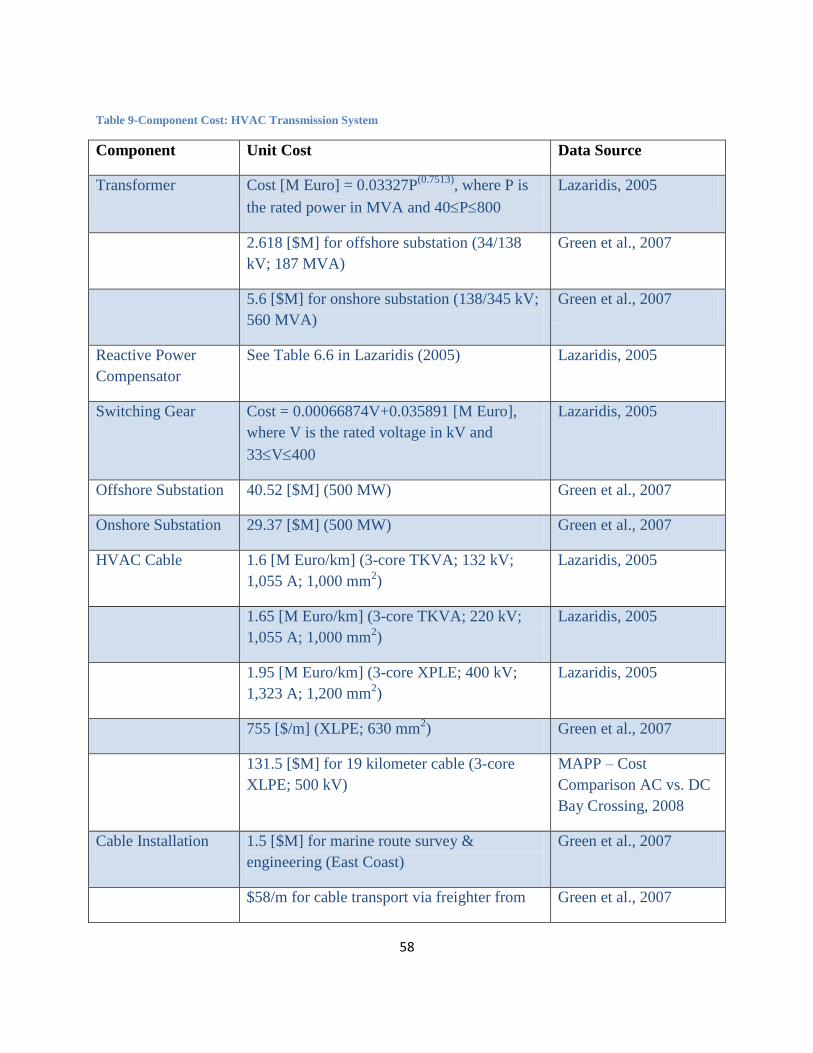
58
Table 9-Component Cost: HVAC Transmission System
Component Unit Cost Data Source
Transformer Cost [M Euro] = 0.03327P(0.7513)
, where P is
the rated power in MVA and 40P800
Lazaridis, 2005
2.618 [$M] for offshore substation (34/138
kV; 187 MVA)
Green et al., 2007
5.6 [$M] for onshore substation (138/345 kV;
560 MVA)
Green et al., 2007
Reactive Power
Compensator
See Table 6.6 in Lazaridis (2005) Lazaridis, 2005
Switching Gear Cost = 0.00066874V+0.035891 [M Euro],
where V is the rated voltage in kV and
33V400
Lazaridis, 2005
Offshore Substation 40.52 [$M] (500 MW) Green et al., 2007
Onshore Substation 29.37 [$M] (500 MW) Green et al., 2007
HVAC Cable 1.6 [M Euro/km] (3-core TKVA; 132 kV;
1,055 A; 1,000 mm2)
Lazaridis, 2005
1.65 [M Euro/km] (3-core TKVA; 220 kV;
1,055 A; 1,000 mm2)
Lazaridis, 2005
1.95 [M Euro/km] (3-core XPLE; 400 kV;
1,323 A; 1,200 mm2)
Lazaridis, 2005
755 [$/m] (XLPE; 630 mm2) Green et al., 2007
131.5 [$M] for 19 kilometer cable (3-core
XLPE; 500 kV)
MAPP – Cost
Comparison AC vs. DC
Bay Crossing, 2008
Cable Installation 1.5 [$M] for marine route survey &
engineering (East Coast)
Green et al., 2007
$58/m for cable transport via freighter from Green et al., 2007
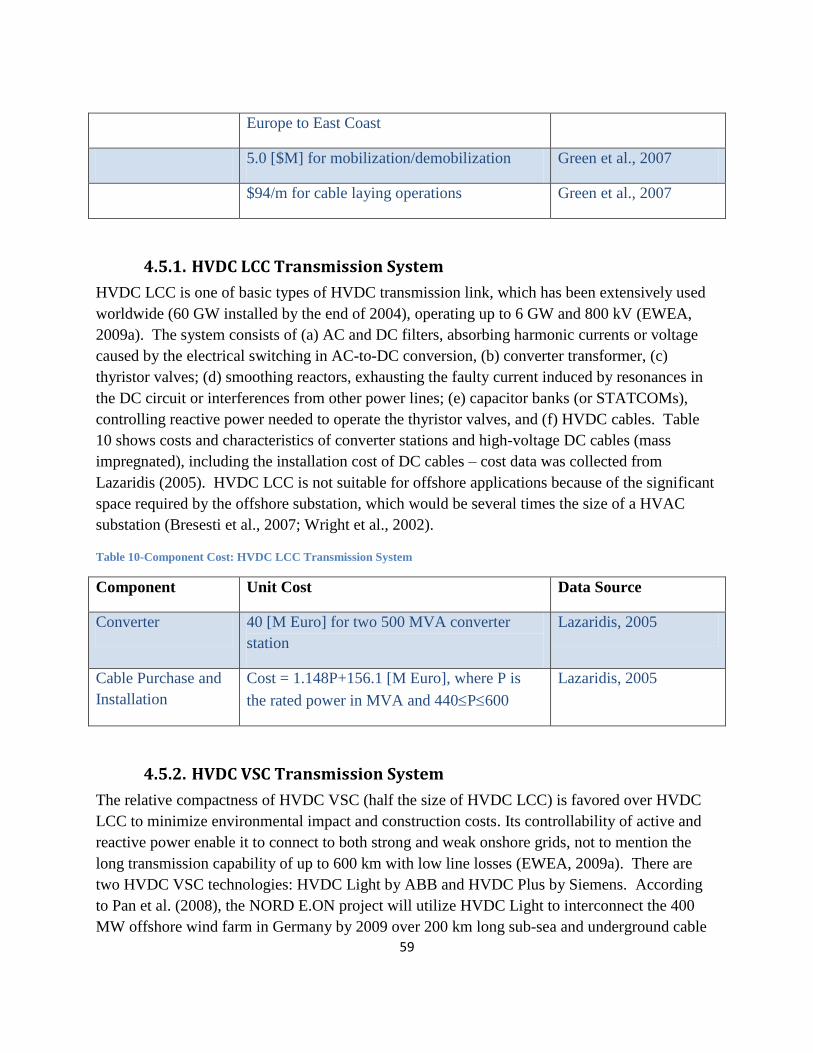
59
Europe to East Coast
5.0 [$M] for mobilization/demobilization Green et al., 2007
$94/m for cable laying operations Green et al., 2007
4.5.1. HVDC LCC Transmission System
HVDC LCC is one of basic types of HVDC transmission link, which has been extensively used
worldwide (60 GW installed by the end of 2004), operating up to 6 GW and 800 kV (EWEA,
2009a). The system consists of (a) AC and DC filters, absorbing harmonic currents or voltage
caused by the electrical switching in AC-to-DC conversion, (b) converter transformer, (c)
thyristor valves; (d) smoothing reactors, exhausting the faulty current induced by resonances in
the DC circuit or interferences from other power lines; (e) capacitor banks (or STATCOMs),
controlling reactive power needed to operate the thyristor valves, and (f) HVDC cables. Table
10 shows costs and characteristics of converter stations and high-voltage DC cables (mass
impregnated), including the installation cost of DC cables – cost data was collected from
Lazaridis (2005). HVDC LCC is not suitable for offshore applications because of the significant
space required by the offshore substation, which would be several times the size of a HVAC
substation (Bresesti et al., 2007; Wright et al., 2002).
Table 10-Component Cost: HVDC LCC Transmission System
Component Unit Cost Data Source
Converter 40 [M Euro] for two 500 MVA converter
station
Lazaridis, 2005
Cable Purchase and
Installation
Cost = 1.148P+156.1 [M Euro], where P is
the rated power in MVA and 440P600
Lazaridis, 2005
4.5.2. HVDC VSC Transmission System
The relative compactness of HVDC VSC (half the size of HVDC LCC) is favored over HVDC
LCC to minimize environmental impact and construction costs. Its controllability of active and
reactive power enable it to connect to both strong and weak onshore grids, not to mention the
long transmission capability of up to 600 km with low line losses (EWEA, 2009a). There are
two HVDC VSC technologies: HVDC Light by ABB and HVDC Plus by Siemens. According
to Pan et al. (2008), the NORD E.ON project will utilize HVDC Light to interconnect the 400
MW offshore wind farm in Germany by 2009 over 200 km long sub-sea and underground cable
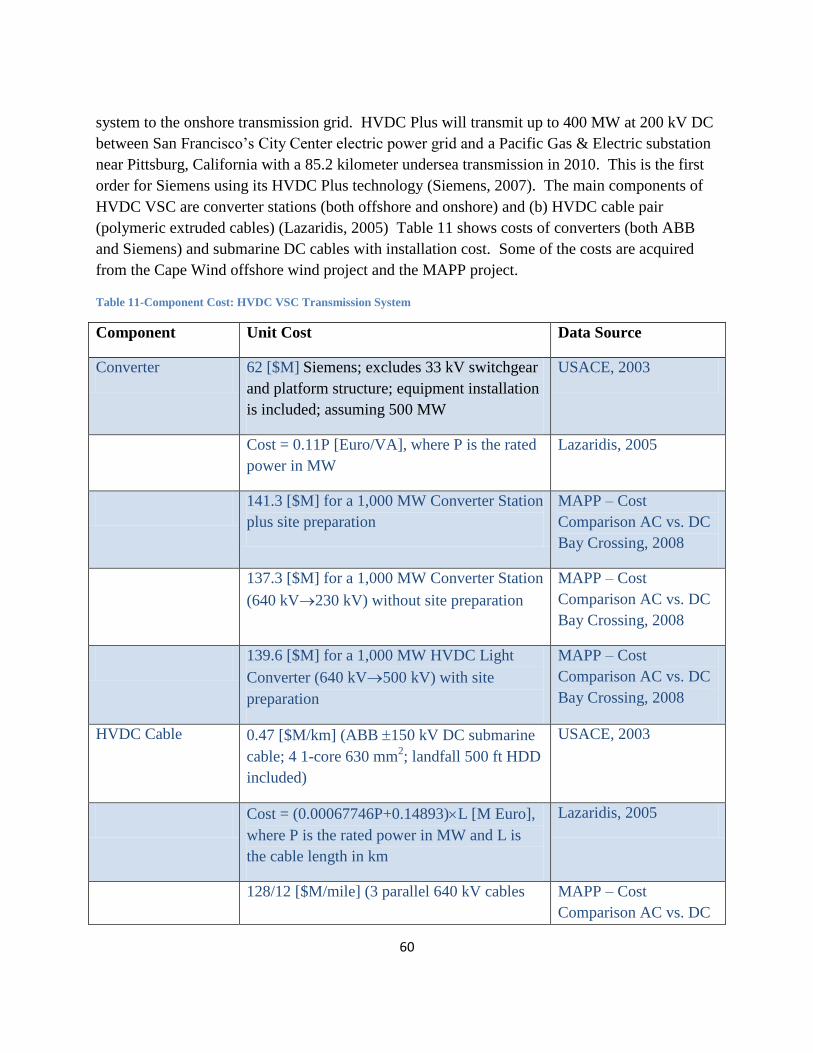
60
system to the onshore transmission grid. HVDC Plus will transmit up to 400 MW at 200 kV DC
between San Francisco’s City Center electric power grid and a Pacific Gas & Electric substation
near Pittsburg, California with a 85.2 kilometer undersea transmission in 2010. This is the first
order for Siemens using its HVDC Plus technology (Siemens, 2007). The main components of
HVDC VSC are converter stations (both offshore and onshore) and (b) HVDC cable pair
(polymeric extruded cables) (Lazaridis, 2005) Table 11 shows costs of converters (both ABB
and Siemens) and submarine DC cables with installation cost. Some of the costs are acquired
from the Cape Wind offshore wind project and the MAPP project.
Table 11-Component Cost: HVDC VSC Transmission System
Component Unit Cost Data Source
Converter 62 [$M] Siemens; excludes 33 kV switchgear
and platform structure; equipment installation
is included; assuming 500 MW
USACE, 2003
Cost = 0.11P [Euro/VA], where P is the rated
power in MW
Lazaridis, 2005
141.3 [$M] for a 1,000 MW Converter Station
plus site preparation
MAPP – Cost
Comparison AC vs. DC
Bay Crossing, 2008
137.3 [$M] for a 1,000 MW Converter Station
(640 kV230 kV) without site preparation
MAPP – Cost
Comparison AC vs. DC
Bay Crossing, 2008
139.6 [$M] for a 1,000 MW HVDC Light
Converter (640 kV500 kV) with site
preparation
MAPP – Cost
Comparison AC vs. DC
Bay Crossing, 2008
HVDC Cable 0.47 [$M/km] (ABB 150 kV DC submarine
cable; 4 1-core 630 mm2; landfall 500 ft HDD
included)
USACE, 2003
Cost = (0.00067746P+0.14893)L [M Euro],
where P is the rated power in MW and L is
the cable length in km
Lazaridis, 2005
128/12 [$M/mile] (3 parallel 640 kV cables MAPP – Cost
Comparison AC vs. DC
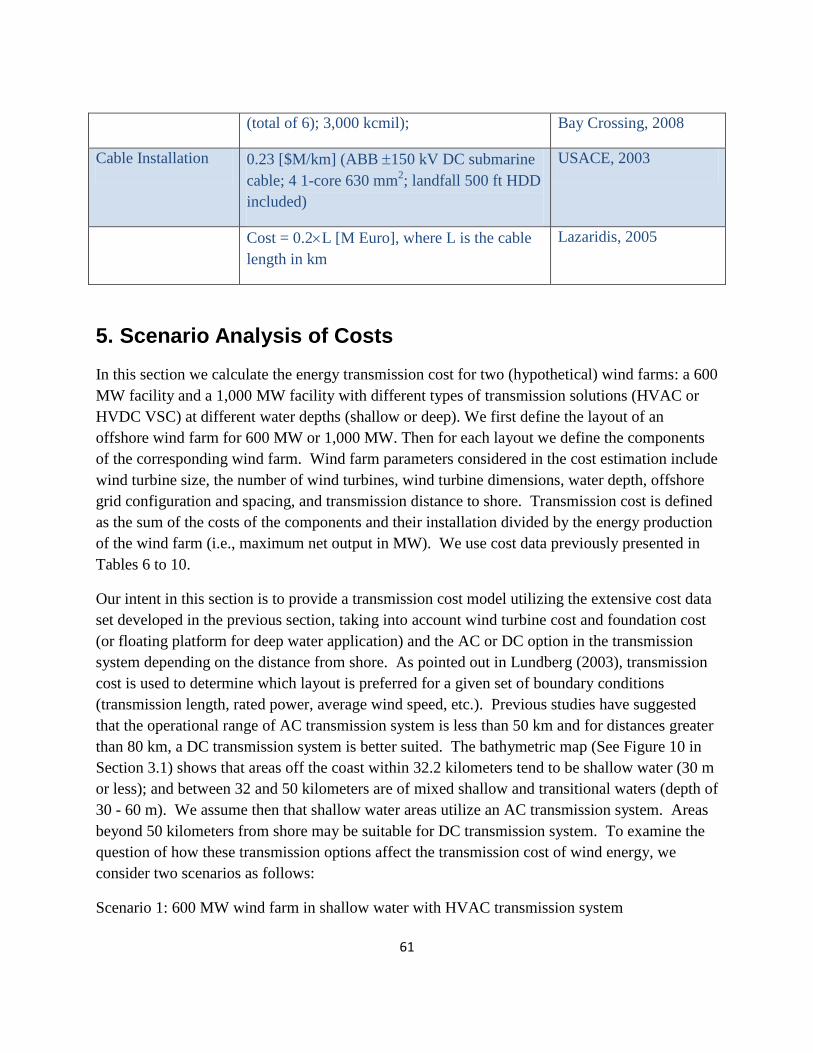
61
(total of 6); 3,000 kcmil); Bay Crossing, 2008
Cable Installation 0.23 [$M/km] (ABB 150 kV DC submarine
cable; 4 1-core 630 mm2; landfall 500 ft HDD
included)
USACE, 2003
Cost = 0.2L [M Euro], where L is the cable
length in km
Lazaridis, 2005
5. Scenario Analysis of Costs
In this section we calculate the energy transmission cost for two (hypothetical) wind farms: a 600
MW facility and a 1,000 MW facility with different types of transmission solutions (HVAC or
HVDC VSC) at different water depths (shallow or deep). We first define the layout of an
offshore wind farm for 600 MW or 1,000 MW. Then for each layout we define the components
of the corresponding wind farm. Wind farm parameters considered in the cost estimation include
wind turbine size, the number of wind turbines, wind turbine dimensions, water depth, offshore
grid configuration and spacing, and transmission distance to shore. Transmission cost is defined
as the sum of the costs of the components and their installation divided by the energy production
of the wind farm (i.e., maximum net output in MW). We use cost data previously presented in
Tables 6 to 10.
Our intent in this section is to provide a transmission cost model utilizing the extensive cost data
set developed in the previous section, taking into account wind turbine cost and foundation cost
(or floating platform for deep water application) and the AC or DC option in the transmission
system depending on the distance from shore. As pointed out in Lundberg (2003), transmission
cost is used to determine which layout is preferred for a given set of boundary conditions
(transmission length, rated power, average wind speed, etc.). Previous studies have suggested
that the operational range of AC transmission system is less than 50 km and for distances greater
than 80 km, a DC transmission system is better suited. The bathymetric map (See Figure 10 in
Section 3.1) shows that areas off the coast within 32.2 kilometers tend to be shallow water (30 m
or less); and between 32 and 50 kilometers are of mixed shallow and transitional waters (depth of
30 - 60 m). We assume then that shallow water areas utilize an AC transmission system. Areas
beyond 50 kilometers from shore may be suitable for DC transmission system. To examine the
question of how these transmission options affect the transmission cost of wind energy, we
consider two scenarios as follows:
Scenario 1: 600 MW wind farm in shallow water with HVAC transmission system
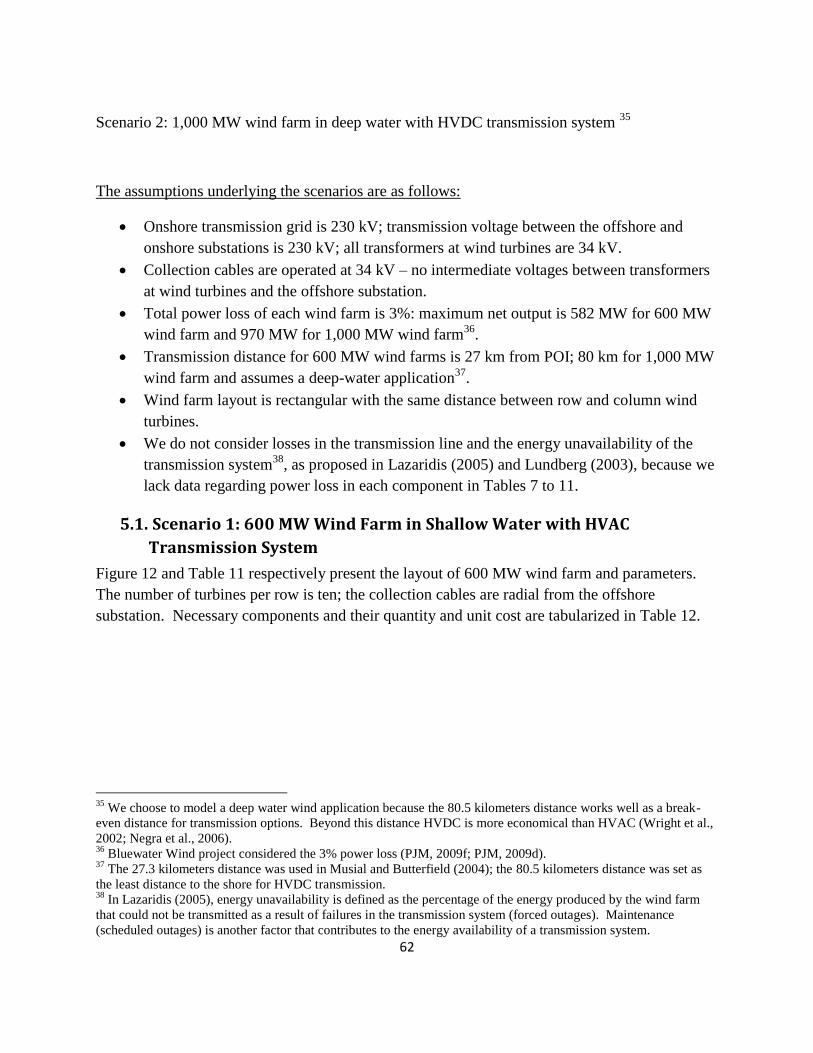
62
Scenario 2: 1,000 MW wind farm in deep water with HVDC transmission system 35
The assumptions underlying the scenarios are as follows:
Onshore transmission grid is 230 kV; transmission voltage between the offshore and
onshore substations is 230 kV; all transformers at wind turbines are 34 kV.
Collection cables are operated at 34 kV – no intermediate voltages between transformers
at wind turbines and the offshore substation.
Total power loss of each wind farm is 3%: maximum net output is 582 MW for 600 MW
wind farm and 970 MW for 1,000 MW wind farm36
.
Transmission distance for 600 MW wind farms is 27 km from POI; 80 km for 1,000 MW
wind farm and assumes a deep-water application37
.
Wind farm layout is rectangular with the same distance between row and column wind
turbines.
We do not consider losses in the transmission line and the energy unavailability of the
transmission system38
, as proposed in Lazaridis (2005) and Lundberg (2003), because we
lack data regarding power loss in each component in Tables 7 to 11.
5.1. Scenario 1: 600 MW Wind Farm in Shallow Water with HVAC
Transmission System
Figure 12 and Table 11 respectively present the layout of 600 MW wind farm and parameters.
The number of turbines per row is ten; the collection cables are radial from the offshore
substation. Necessary components and their quantity and unit cost are tabularized in Table 12.
35
We choose to model a deep water wind application because the 80.5 kilometers distance works well as a break-
even distance for transmission options. Beyond this distance HVDC is more economical than HVAC (Wright et al.,
2002; Negra et al., 2006). 36
Bluewater Wind project considered the 3% power loss (PJM, 2009f; PJM, 2009d). 37
The 27.3 kilometers distance was used in Musial and Butterfield (2004); the 80.5 kilometers distance was set as
the least distance to the shore for HVDC transmission. 38
In Lazaridis (2005), energy unavailability is defined as the percentage of the energy produced by the wind farm
that could not be transmitted as a result of failures in the transmission system (forced outages). Maintenance
(scheduled outages) is another factor that contributes to the energy availability of a transmission system.
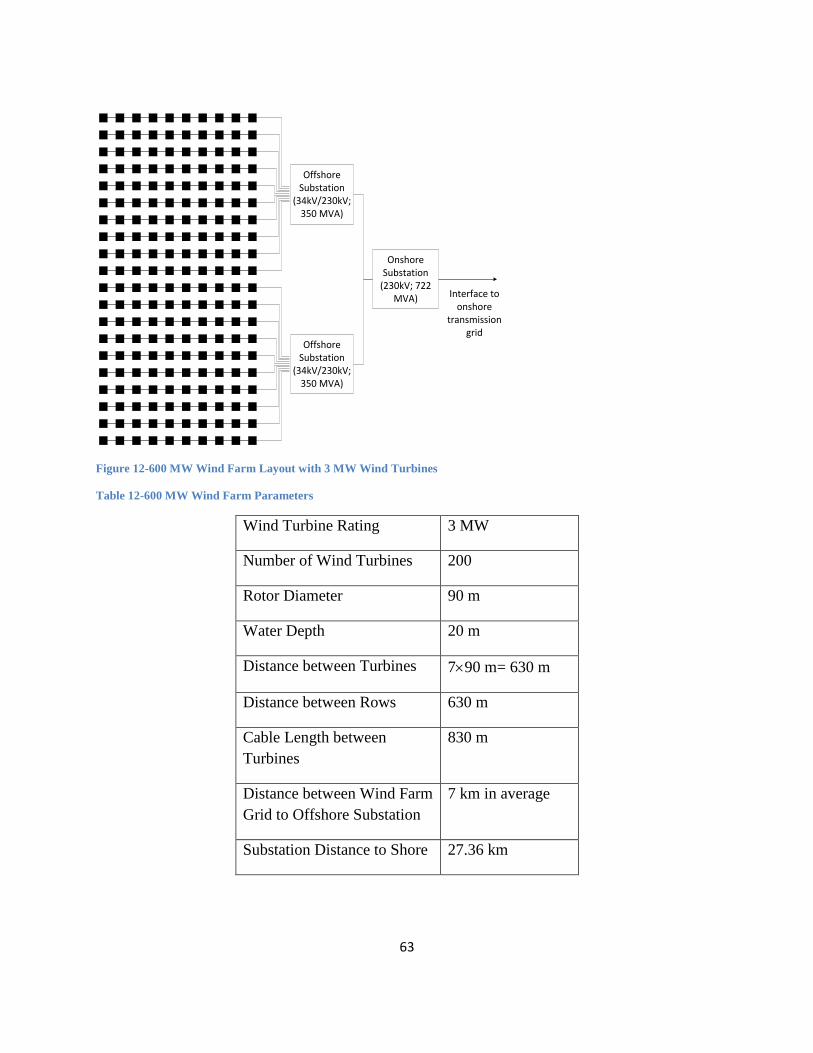
63
Figure 12-600 MW Wind Farm Layout with 3 MW Wind Turbines
Table 12-600 MW Wind Farm Parameters
Wind Turbine Rating 3 MW
Number of Wind Turbines 200
Rotor Diameter 90 m
Water Depth 20 m
Distance between Turbines 790 m= 630 m
Distance between Rows 630 m
Cable Length between
Turbines
830 m
Distance between Wind Farm
Grid to Offshore Substation
7 km in average
Substation Distance to Shore 27.36 km
OffshoreSubstation
(34kV/230kV;350 MVA)
OffshoreSubstation
(34kV/230kV;350 MVA)
OnshoreSubstation
(230kV; 722MVA) Interface to
onshoretransmission
grid
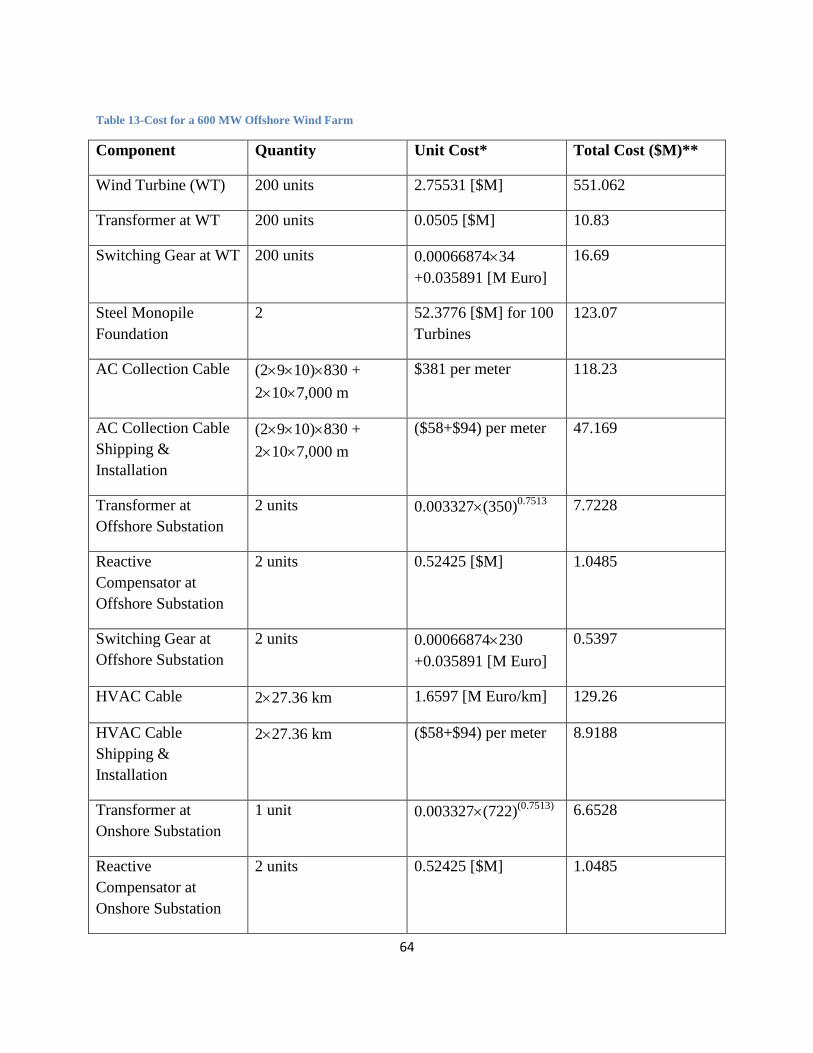
64
Table 13-Cost for a 600 MW Offshore Wind Farm
Component Quantity Unit Cost* Total Cost ($M)**
Wind Turbine (WT) 200 units 2.75531 [$M] 551.062
Transformer at WT 200 units 0.0505 [$M] 10.83
Switching Gear at WT 200 units 0.0006687434
+0.035891 [M Euro]
16.69
Steel Monopile
Foundation
2 52.3776 [$M] for 100
Turbines
123.07
AC Collection Cable (2910)830 +
2107,000 m
$381 per meter 118.23
AC Collection Cable
Shipping &
Installation
(2910)830 +
2107,000 m
($58+$94) per meter 47.169
Transformer at
Offshore Substation
2 units 0.003327(350)0.7513
7.7228
Reactive
Compensator at
Offshore Substation
2 units 0.52425 [$M] 1.0485
Switching Gear at
Offshore Substation
2 units 0.00066874230
+0.035891 [M Euro]
0.5397
HVAC Cable 227.36 km 1.6597 [M Euro/km] 129.26
HVAC Cable
Shipping &
Installation
227.36 km ($58+$94) per meter 8.9188
Transformer at
Onshore Substation
1 unit 0.003327(722)(0.7513)
6.6528
Reactive
Compensator at
Onshore Substation
2 units 0.52425 [$M] 1.0485
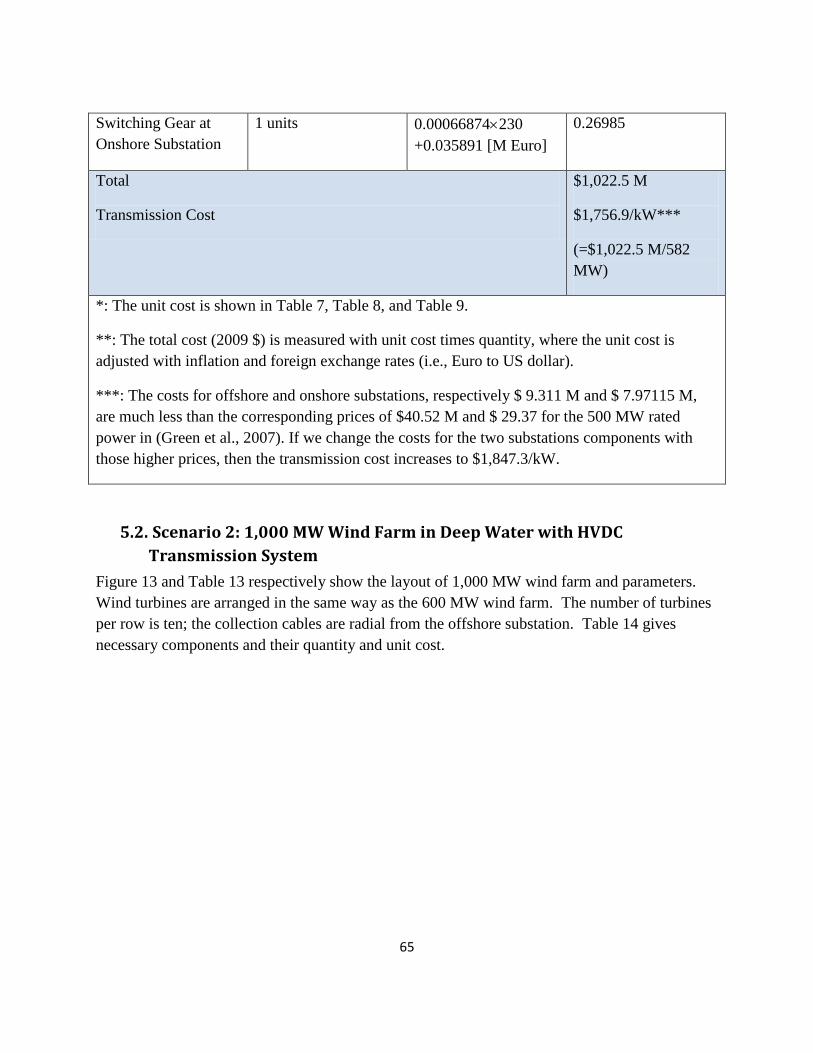
65
Switching Gear at
Onshore Substation
1 units 0.00066874230
+0.035891 [M Euro]
0.26985
Total
Transmission Cost
$1,022.5 M
$1,756.9/kW***
(=$1,022.5 M/582
MW)
*: The unit cost is shown in Table 7, Table 8, and Table 9.
**: The total cost (2009 $) is measured with unit cost times quantity, where the unit cost is
adjusted with inflation and foreign exchange rates (i.e., Euro to US dollar).
***: The costs for offshore and onshore substations, respectively $ 9.311 M and $ 7.97115 M,
are much less than the corresponding prices of $40.52 M and $ 29.37 for the 500 MW rated
power in (Green et al., 2007). If we change the costs for the two substations components with
those higher prices, then the transmission cost increases to $1,847.3/kW.
5.2. Scenario 2: 1,000 MW Wind Farm in Deep Water with HVDC
Transmission System
Figure 13 and Table 13 respectively show the layout of 1,000 MW wind farm and parameters.
Wind turbines are arranged in the same way as the 600 MW wind farm. The number of turbines
per row is ten; the collection cables are radial from the offshore substation. Table 14 gives
necessary components and their quantity and unit cost.
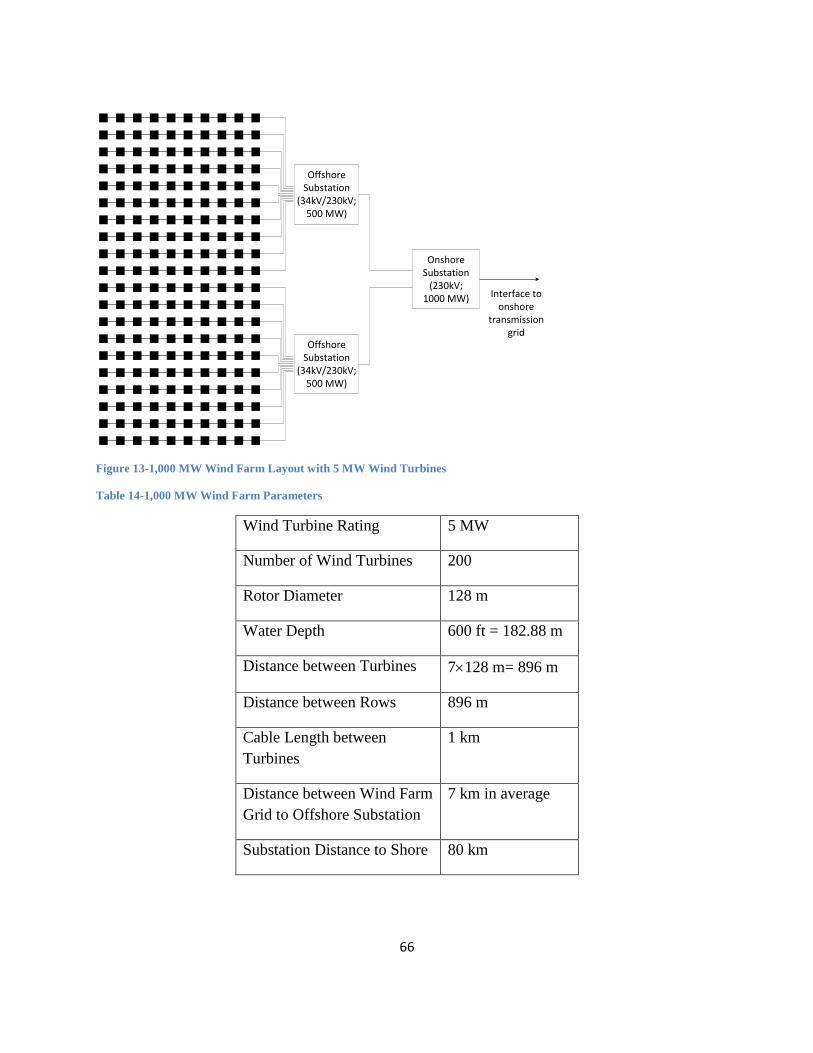
66
Figure 13-1,000 MW Wind Farm Layout with 5 MW Wind Turbines
Table 14-1,000 MW Wind Farm Parameters
Wind Turbine Rating 5 MW
Number of Wind Turbines 200
Rotor Diameter 128 m
Water Depth 600 ft = 182.88 m
Distance between Turbines 7128 m= 896 m
Distance between Rows 896 m
Cable Length between
Turbines
1 km
Distance between Wind Farm
Grid to Offshore Substation
7 km in average
Substation Distance to Shore 80 km
OffshoreSubstation
(34kV/230kV;500 MW)
OffshoreSubstation
(34kV/230kV;500 MW)
OnshoreSubstation
(230kV;1000 MW) Interface to
onshoretransmission
grid
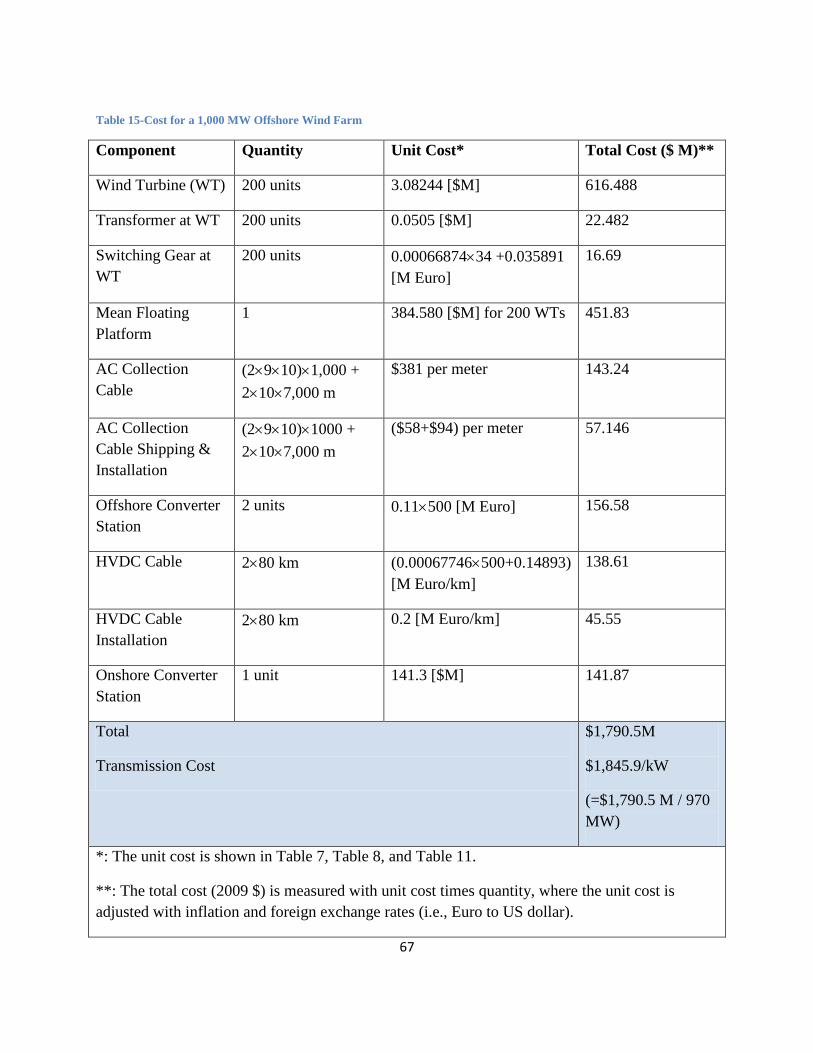
67
Table 15-Cost for a 1,000 MW Offshore Wind Farm
Component Quantity Unit Cost* Total Cost ($ M)**
Wind Turbine (WT) 200 units 3.08244 [$M] 616.488
Transformer at WT 200 units 0.0505 [$M] 22.482
Switching Gear at
WT
200 units 0.0006687434 +0.035891
[M Euro]
16.69
Mean Floating
Platform
1 384.580 [$M] for 200 WTs 451.83
AC Collection
Cable
(2910)1,000 +
2107,000 m
$381 per meter 143.24
AC Collection
Cable Shipping &
Installation
(2910)1000 +
2107,000 m
($58+$94) per meter 57.146
Offshore Converter
Station
2 units 0.11500 [M Euro] 156.58
HVDC Cable 280 km (0.00067746500+0.14893)
[M Euro/km]
138.61
HVDC Cable
Installation
280 km 0.2 [M Euro/km] 45.55
Onshore Converter
Station
1 unit 141.3 [$M] 141.87
Total
Transmission Cost
$1,790.5M
$1,845.9/kW
(=$1,790.5 M / 970
MW)
*: The unit cost is shown in Table 7, Table 8, and Table 11.
**: The total cost (2009 $) is measured with unit cost times quantity, where the unit cost is
adjusted with inflation and foreign exchange rates (i.e., Euro to US dollar).
68
5.3. Findings: Cost Comparison of Scenarios 1 & 2
Figures 14 and 15 present the cost distributions for the two scenarios. The results are
summarized as follows:
For both scenarios, the costs of the wind turbines and foundation systems (or floating platform)
account for more than 59% of total costs; collection systems (i.e. transformers and switching
gears at wind turbines, AC collection cables) represent the second largest portion of total costs.
For the HVAC transmission system, the cable cost ($138.2 M) requires a much larger investment
than offshore and onshore substations ($17.3 million altogether); for the HVDC transmission
system the offshore and onshore substations cost more than 1.5 times as much as DC cables.
The HVDC cables cost $2.29 million/km, which is much smaller than the HVAC cable cost of
$5.05 million/km. We find that that the greater cost of the HVDC offshore and onshore
substations at both ends of transmission line can be offset by lower cabling costs. However, the
difference in cabling costs alone does not compensate for the higher substation costs of an
HVDC transmission system. Thus, as has been confirmed in previous studies, HVDC may not
be an appropriate transmission option for shallow water applications.
In our 600 MW case study, we determine a cost estimate of $1,858.0 per kW, which is
significantly lower than the estimates produced by Green et al., 2007. We believe this is due to
differences in cost estimates of offshore and onshore substations. In our revised calculations
utilizing Green et al., 2007, transmission costs of an HVAC transmission system increases from
$1,756.9 per kW to $1,847.3 per kW, which is $1.4 per kW more than $1,845.9 per kW of the
transmission cost for the 1,000 MW wind farm.
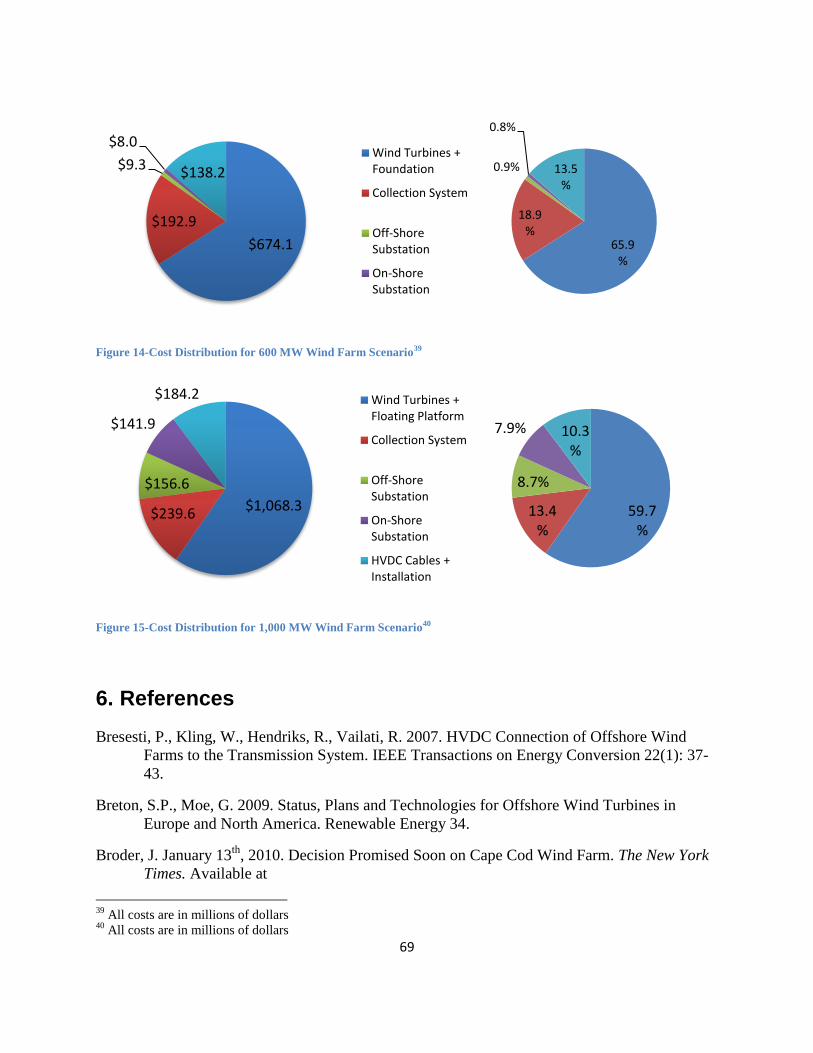
69
Figure 14-Cost Distribution for 600 MW Wind Farm Scenario39
Figure 15-Cost Distribution for 1,000 MW Wind Farm Scenario40
6. References
Bresesti, P., Kling, W., Hendriks, R., Vailati, R. 2007. HVDC Connection of Offshore Wind
Farms to the Transmission System. IEEE Transactions on Energy Conversion 22(1): 37-
43.
Breton, S.P., Moe, G. 2009. Status, Plans and Technologies for Offshore Wind Turbines in
Europe and North America. Renewable Energy 34.
Broder, J. January 13th
, 2010. Decision Promised Soon on Cape Cod Wind Farm. The New York
Times. Available at
39
All costs are in millions of dollars 40
All costs are in millions of dollars
$674.1
$192.9
$9.3
$8.0
$138.2
Wind Turbines + Foundation
Collection System
Off-Shore Substation
On-Shore Substation
65.9%
18.9%
0.9%
0.8%
13.5%
$1,068.3$239.6
$156.6
$141.9
$184.2 Wind Turbines + Floating Platform
Collection System
Off-Shore Substation
On-Shore Substation
HVDC Cables + Installation
59.7%
13.4%
8.7%
7.9% 10.3%

70
http://www.nytimes.com/2010/01/14/science/earth/14wind.html?scp=2&sq=ken%20salaz
ar&st=cse.
Cape Wind Associates. 2009. Cape Wind Project Timeline. Available at
http://www.capewind.org/article26.htm.
Danish Energy Authority (DEA). 2006. Offshore Wind Farms and the Environment: Danish
Experiences from Horns Rev and Nysted. Available at
www.bluewaterwind.com/pdfs/havvindm_korr_16nov_UK.pdf.
Delft University Wind Energy Research Institute (Duwind). 2001. Offshore Wind Energy: Ready
to Power a Sustainable Europe, Final Report. Concerted Action on Offshore Wind
Energy in Europe (CA-OWEE), December 2001. NNE5-1999-562, Report Reference:
Duwind 2001.006. Available at http://www.emu-consult.dk/includes/totalfinalreport.pdf.
Delmarva Power and Light and Bluewater Wind. 2009. Power Purchase Agreement. Available at
http://www.ceoe.udel.edu/Windpower/DE-Qs/bwwppa062308.pdf.
European Academics Science Advisory Council (EASAC). 2009. Transforming Europe’s
Electricity Supply – an Infrastructure Strategy for a Reliable, Renewable and Secure
Power System. Technical Report 11, Bulk Electrical Energy Transmission in Europe
Working Group. Available at http://eprints.ecs.soton.ac.uk/17564.
EWEA. 2009a. Oceans of Opportunity - Harnessing Europe’s largest domestic energy resource.
The European Wind Energy Association (EWEA). Available at
http://www.ewea.org/fileadmin/ewea_documents/documents/publications/reports/Offshor
e_Report_2009.pdf.
EWEA. 2009b. The Economics of Wind Energy. The European Wind Energy Association
(EWEA). Available at http://www.ewea.org/index.php?id=201.
Firestone, J., W. Kempton. 2006. Public opinion about large offshore wind power: Underlying
factors. Energy Policy 35: 1584-1598.
Garden State Offshore Energy. 2009. Garden State Offshore Energy-Proposed Wind Farm.
Available at http://www.gardenstatewind.com/.
Gausman, W. 2009. Integration of Wind Generation into the Transmission System. Presented to
the Maryland Department of Energy. December 11, 2009.
Green, J., Bowen, A., Fingersh, L., Wan, Y. 2007. Electrical Collection and Transmission
Systems for Offshore Wind Power. NREL/CP-500-41135. Available at
http://www.nrel.gov/wind/pdfs/41135.pdf.
Lazaridis, L. 2005. Economic Comparison of HVAC and HVDC Solutions for Large Offshore
Wind Farms under Special Consideration of Reliability. Master’s Thesis X-ETS/ESS-
0505. Royal Institute of Technology, Department of Electrical Engineering, Stockholm.
71
Long Island New York Offshore Wind Collaborative. 2009. Frequently asked questions.
Available at http://www.linycoffshorewind.com/faq.html.
Long Island Offshore Wind Park. 2005. Site Configuration. Available at
http://www.mms.gov/offshore/GOMESA/RenewableEnergy/LIOWPmap2.jpg.
Lundberg, S. 2003. Configuration Study of Large Wind Parks. Department of Electric Power
Engineering. Chalmers University of Technology, Göteborg, Sweden.
Minerals Management Service. 2007. Cape Wind Documentation. Available at
http://library.neit.edu/TLCScripts/interpac.dll?LabelDisplay&RecordNumber=59699&C
onfig=staff&Branch=,0,)
Minerals Management Service. 2009. Cape Wind Documentation. Available at
http://www.mms.gov/offshore/PDFs/CapeWindProjectPlanFiling2.pdf.
Musial, W., Butterfield, S. 2004. Future for Offshore Wind Energy in the United States. National
Renewable Energy Laboratory. NREL/CP-500-36313. Available at
http://www.nrel.gov/docs/fy04osti/36313.pdf (preprint)
Musial, W., Butterfield, S., Ram, B. 2006. Energy from Offshore Wind. National Renewable
Energy Laboratory. NREL/CP-500-39450. Available at
http://www.nrel.gov/wind/pdfs/39450.pdf.
Negra, N., Todorovic, J., Ackermann, T. 2006. Loss Evaluation of HVAC and HVDC
Transmission Solutions for Large Offshore Wind Farms. Electric Power Systems
Research 76: 916-927.
New York Power Authority. 2009. Offshore Wind Power Initiative Proposed for Great Lakes-
New York Power Authority to Examine Economic and Environmental Benefits, and
Technical and Financial Issues. Available at
http://www.nypa.gov/press/2009/090422a.htm.
Pan, J., Nuqui, R., Tang, L., Holmberg, P. 2008. VSC-HVDC Control and Application in
Meshed AC Networks. Presented at 2008 IEEE-PES General Meeting, Pittsburgh,
Pennsylvania, July 20-24.
PJM. 2008a. PJM 2008 RTEP – Reliability Analysis Update. Available at
http://www.pjm.com/~/media/committees-groups/committees/teac/20081015/20081015-
reliability-analysis-update.ashx.
PJM. 2009f. PJM Generator Interconnection T122 Ocean Bay 600 MW Impact Study. Available
at http://www.pjm.com/planning/generation-interconnection/generation-queue-
withdraw.aspx.
PJM. 2009d. PJM Generator Interconnection R36 Bethany 450 MW Facilities Study. September
2009. Available at http://www.pjm.com/planning/generation-interconnection/generation-
queue-active.aspx.
72
Siemens Power Transmission & Distribution, Inc. 2007. HVDC Plus Technology Cable
Information. Available at
http://w3.energy.siemens.com/cms/us/press/Pages/news_san_fransisco_hvdc_2007_09_2
5_1463320.aspx.
Statoil. 2009. The Hywind Demonstration Project. Available at
http://www.statoil.com/en/technologyinnovation/newenergy/renewablepowerproduction/
onshore/pages/karmoy.aspx.
Talisman Energy. (n.d.). Beatrice Demonstration Project Scoping Report. Available at
http://www.beatricewind.co.uk/home/default.asp.
USACE. 2003. Cape Wind Energy Project Draft Environmental Impact Statement (Appendix 3-
C: Transmission Issues for Offshore Wind Farms).Cape Wind Associates, LLC.
Available at http://www.nae.usace.army.mil/projects/ma/ccwf/app3c.pdf.
US DOE EERE. 2009. Wind Power Today. US DOE Energy Efficiency and Renewable Energy
(EERE). Available at http://www1.eere.energy.gov/windandhydro/pdfs/44889.pdf
Wind Powering America (WPA). 2009. Wind resource maps. Available at
http://www.windpoweringamerica.gov/wind_maps.asp.
Wright, S., Rogers, A., Manwell, F., Ellis A. 2002. Transmission Options for Offshore Wind
Farms in the United States. AWEA 2002. Available at
http://www.ceere.org/rerl/publications/published/2002/Transmission_Options_For_Offsh
ore_Wind_Farms_In_The_US,_AWEA_June_2002_.pdf.
XE. January 26, 2010. Online Currency Conversion. Available at http://www.xe.com/ucc/.
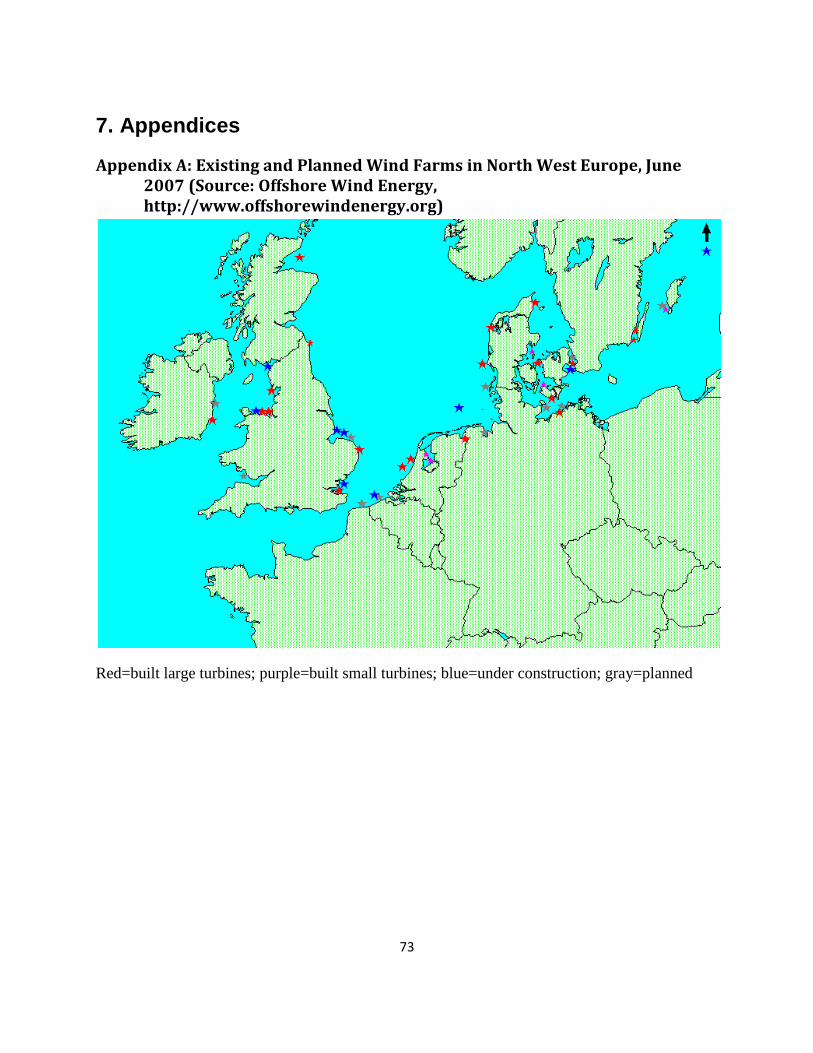
73
7. Appendices
Appendix A: Existing and Planned Wind Farms in North West Europe, June 2007 (Source: Offshore Wind Energy, http://www.offshorewindenergy.org)
Red=built large turbines; purple=built small turbines; blue=under construction; gray=planned
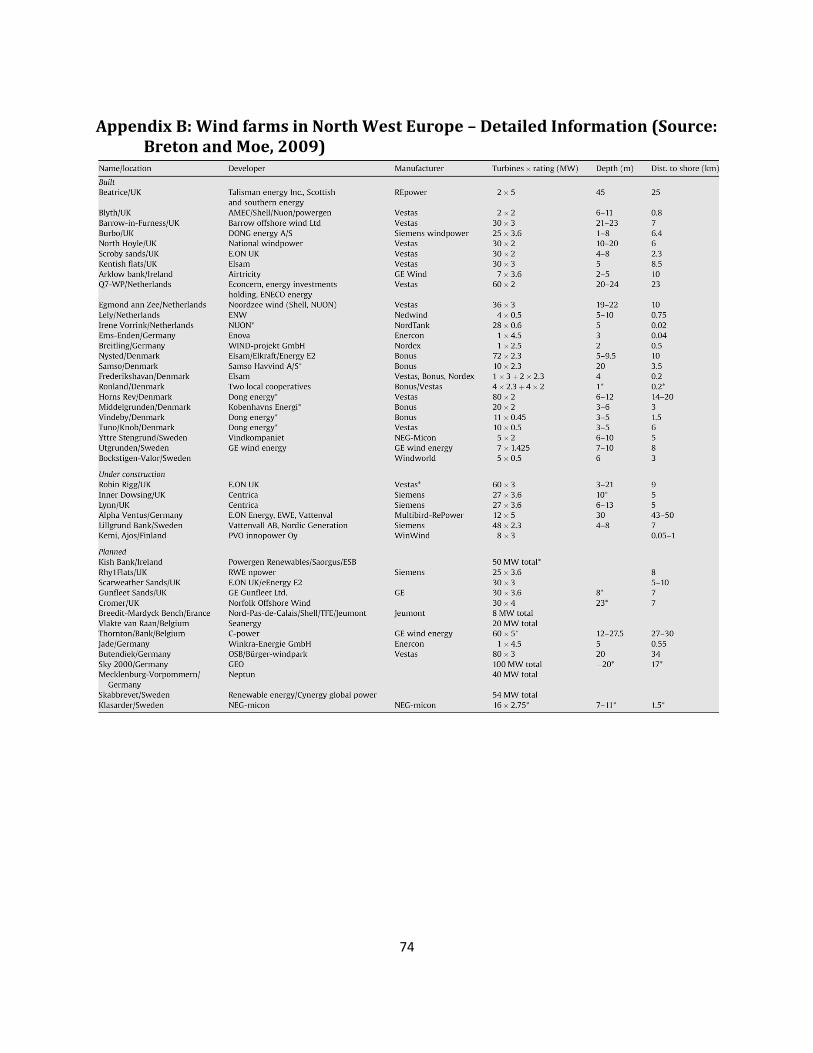
74
Appendix B: Wind farms in North West Europe – Detailed Information (Source: Breton and Moe, 2009)
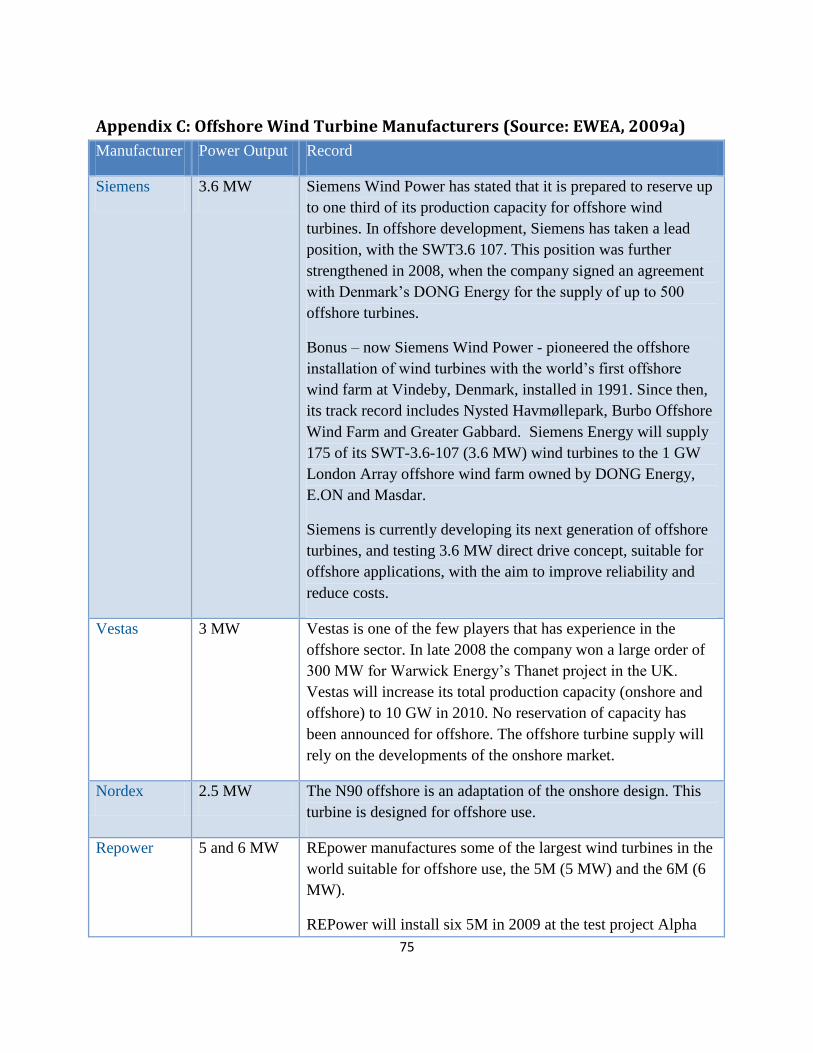
75
Appendix C: Offshore Wind Turbine Manufacturers (Source: EWEA, 2009a)
Manufacturer Power Output Record
Siemens 3.6 MW Siemens Wind Power has stated that it is prepared to reserve up
to one third of its production capacity for offshore wind
turbines. In offshore development, Siemens has taken a lead
position, with the SWT3.6 107. This position was further
strengthened in 2008, when the company signed an agreement
with Denmark’s DONG Energy for the supply of up to 500
offshore turbines.
Bonus – now Siemens Wind Power - pioneered the offshore
installation of wind turbines with the world’s first offshore
wind farm at Vindeby, Denmark, installed in 1991. Since then,
its track record includes Nysted Havmøllepark, Burbo Offshore
Wind Farm and Greater Gabbard. Siemens Energy will supply
175 of its SWT-3.6-107 (3.6 MW) wind turbines to the 1 GW
London Array offshore wind farm owned by DONG Energy,
E.ON and Masdar.
Siemens is currently developing its next generation of offshore
turbines, and testing 3.6 MW direct drive concept, suitable for
offshore applications, with the aim to improve reliability and
reduce costs.
Vestas 3 MW Vestas is one of the few players that has experience in the
offshore sector. In late 2008 the company won a large order of
300 MW for Warwick Energy’s Thanet project in the UK.
Vestas will increase its total production capacity (onshore and
offshore) to 10 GW in 2010. No reservation of capacity has
been announced for offshore. The offshore turbine supply will
rely on the developments of the onshore market.
Nordex 2.5 MW The N90 offshore is an adaptation of the onshore design. This
turbine is designed for offshore use.
Repower 5 and 6 MW REpower manufactures some of the largest wind turbines in the
world suitable for offshore use, the 5M (5 MW) and the 6M (6
MW).
REPower will install six 5M in 2009 at the test project Alpha
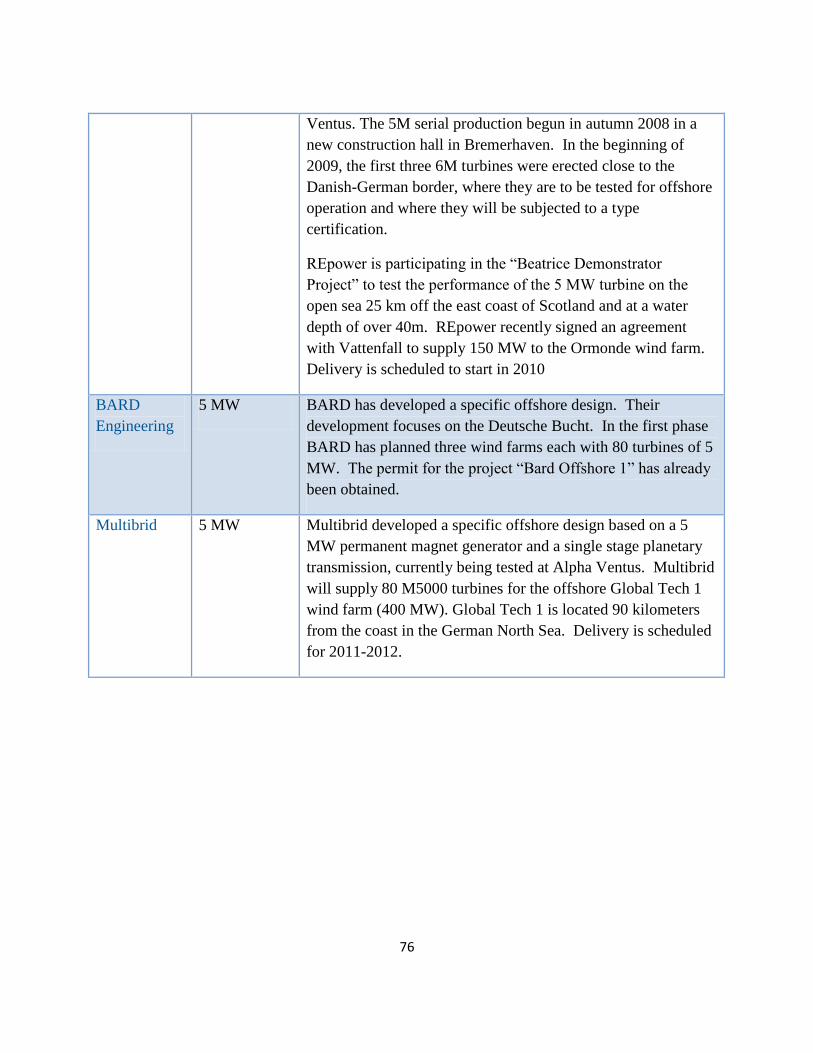
76
Ventus. The 5M serial production begun in autumn 2008 in a
new construction hall in Bremerhaven. In the beginning of
2009, the first three 6M turbines were erected close to the
Danish-German border, where they are to be tested for offshore
operation and where they will be subjected to a type
certification.
REpower is participating in the “Beatrice Demonstrator
Project” to test the performance of the 5 MW turbine on the
open sea 25 km off the east coast of Scotland and at a water
depth of over 40m. REpower recently signed an agreement
with Vattenfall to supply 150 MW to the Ormonde wind farm.
Delivery is scheduled to start in 2010
BARD
Engineering
5 MW BARD has developed a specific offshore design. Their
development focuses on the Deutsche Bucht. In the first phase
BARD has planned three wind farms each with 80 turbines of 5
MW. The permit for the project “Bard Offshore 1” has already
been obtained.
Multibrid 5 MW Multibrid developed a specific offshore design based on a 5
MW permanent magnet generator and a single stage planetary
transmission, currently being tested at Alpha Ventus. Multibrid
will supply 80 M5000 turbines for the offshore Global Tech 1
wind farm (400 MW). Global Tech 1 is located 90 kilometers
from the coast in the German North Sea. Delivery is scheduled
for 2011-2012.
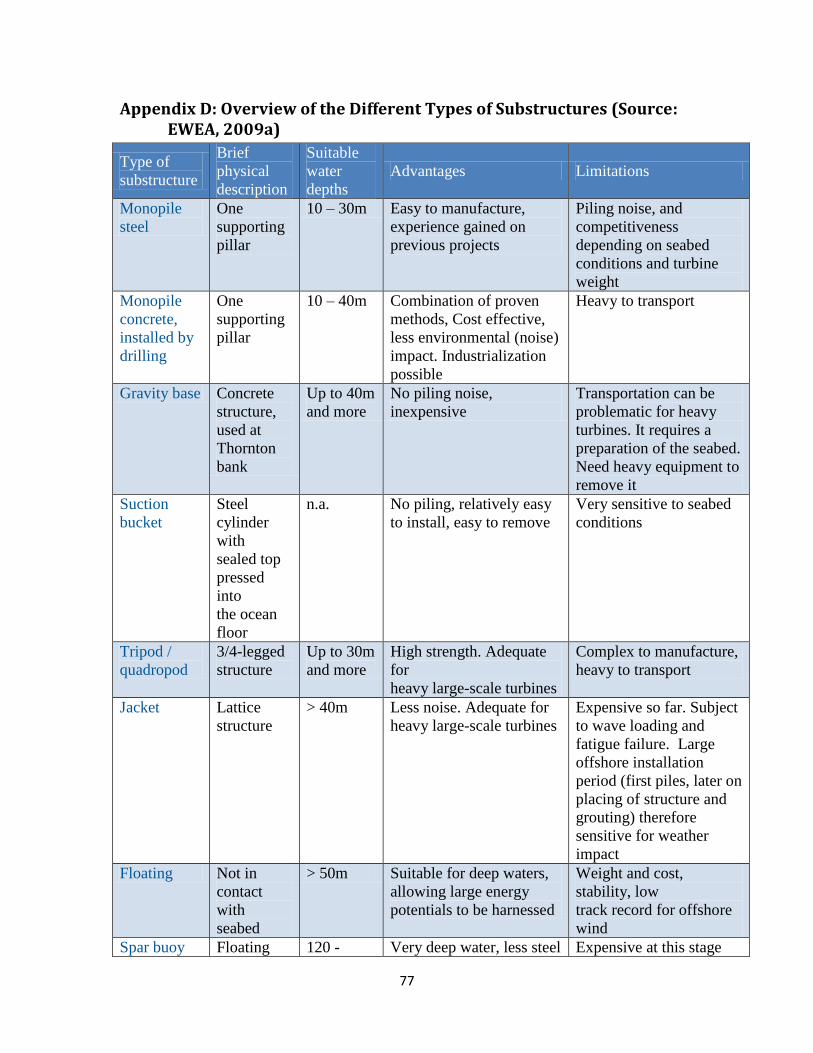
77
Appendix D: Overview of the Different Types of Substructures (Source: EWEA, 2009a)
Type of
substructure
Brief
physical
description
Suitable
water
depths
Advantages Limitations
Monopile
steel
One
supporting
pillar
10 – 30m Easy to manufacture,
experience gained on
previous projects
Piling noise, and
competitiveness
depending on seabed
conditions and turbine
weight
Monopile
concrete,
installed by
drilling
One
supporting
pillar
10 – 40m Combination of proven
methods, Cost effective,
less environmental (noise)
impact. Industrialization
possible
Heavy to transport
Gravity base Concrete
structure,
used at
Thornton
bank
Up to 40m
and more
No piling noise,
inexpensive
Transportation can be
problematic for heavy
turbines. It requires a
preparation of the seabed.
Need heavy equipment to
remove it
Suction
bucket
Steel
cylinder
with
sealed top
pressed
into
the ocean
floor
n.a. No piling, relatively easy
to install, easy to remove
Very sensitive to seabed
conditions
Tripod /
quadropod
3/4-legged
structure
Up to 30m
and more
High strength. Adequate
for
heavy large-scale turbines
Complex to manufacture,
heavy to transport
Jacket Lattice
structure
> 40m Less noise. Adequate for
heavy large-scale turbines
Expensive so far. Subject
to wave loading and
fatigue failure. Large
offshore installation
period (first piles, later on
placing of structure and
grouting) therefore
sensitive for weather
impact
Floating Not in
contact
with
seabed
> 50m Suitable for deep waters,
allowing large energy
potentials to be harnessed
Weight and cost,
stability, low
track record for offshore
wind
Spar buoy Floating 120 - Very deep water, less steel Expensive at this stage

78
Hywind
being
tested
steel
cylinder
attached to
seabed
700m
Semi
submersible
Floating
steel
cylinder
attached to
seabed
Blue H
Prototype
being
tested
in 113m
Deep water, less steel Expensive at this stage
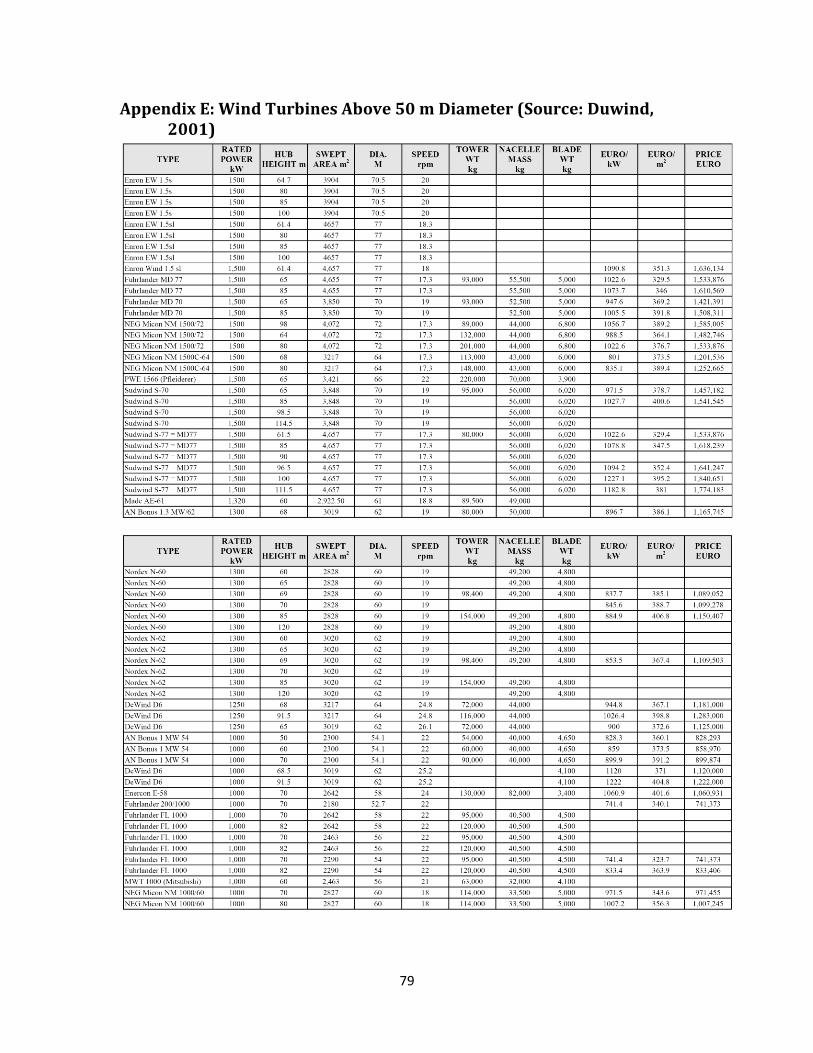
79
Appendix E: Wind Turbines Above 50 m Diameter (Source: Duwind, 2001)

80
81
IV. Offshore Wind Turbines, Radar
Functionality and mid-Atlantic Operations
Sean Williamson1, Jeremy Peichel
1
1. Center for Integrative Environmental Research, Division of Research, University of
Maryland, College Park, MD, 20742, USA
1. Introduction
This chapter provides background information on Maryland offshore wind development
and potential conflict areas and is intended to complement corresponding geographic
information system data files. The chapter focuses specifically on two areas of conflict:
mid-Atlantic radar functionality and offshore operations (i.e., military or research based
operations).
Section 2 provides a general overview of known interactions between wind turbines and
radar. Section 3 identifies potential fixed-radar interference in the mid-Atlantic region as
the result of wind development. Section 4 describes the methodology and findings of
radar-wind interaction specific to fixed-radar facilities at the NASA Wallops Flight
Facility. Section 5 transitions to potential conflicts between offshore operations and wind
development with a particular focus on the U.S. Military.
The study area for this research includes the entire Maryland Atlantic Ocean coastline
(North to South) out to 64 kilometers (West to East) (See file titled Study Area).
2. Radar-Wind Turbine Development Interactions
2.1. Background
Radar uses radio frequency (RF) radiation to sense objects in the atmosphere. The radar
transmitter emits RF radiation towards a target and a portion is reflected back as a signal
to a receiving antenna for processing. The processed signal is interpreted for a presence
in the atmosphere including weather or aircraft. The strength and quality of the reflected
signal depends on “the power of the transmitter, the distance to the target, atmospheric
effects, the radar cross section (RCS) of the target (i.e., reflective surface of the target),
presence of intervening objects, and antenna geometry (US DoD, 2006).” Functional,
82
unperturbed radars are able to detect, discern, and quantify among objects of interest
(Davis, 2009).
Depending on the circumstances, two characteristics of utility-scale wind turbines can
interfere with radar signals when positioned in the radar line-of-sight (RLOS). First, the
large size of wind turbines, particularly when clustered together as a farm, can create a
large RCS, which can prevent detection of objects beyond or near the turbines. This
effect is known as shadowing or static interference. Shadowing will cause targets
including aircraft to disappear or intermittently disappear and reappear. Second, the
rotation of the blades can create a Doppler frequency shift, which results in the turbine
appearing to be a moving object. This effect is known as clutter or dynamic interference.
Cluttering makes it difficult to distinguish wind turbines from aircraft, weather systems,
or other objects of interest.
2.2. Radar Types
Depending on the type of radar and the radar’s intended use, the presence of wind turbine
interference may be more or less significant. Radar types, which are defined by their use,
include air defense, missile early warning, weather observation, and air traffic control.
More generally, radars can be categorized as either primary or secondary surveillance
radars. Primary radars operate one-way, detecting object range and bearing while
secondary radars have the same capabilities as primary radars, but also rely on the
presence of transponders on targets (e.g., aircrafts), which convey additional information
including altitude and identity (Solanki, 2009). Finally, radars can be fixed in a single
location or mobile (e.g., mounted to a vessel or aircraft).
In 2006, the U.S. Department of Defense (DoD) released a report studying the effects of
wind farms on air defense (primary and secondary surveillance radars) and missile early
warning radars. Examination of the effects of wind turbines on weather radars and air
traffic control radars was relegated to National Oceanic and Atmospheric Administration
(NOAA) – National Weather Service (NWS) and the Federal Aviation Administration
(FAA), respectively (U.S. DoD, 2006).
Typical air defense radars detect and track larger objects, including aircraft, while missile
early warning radars are long-range radars expected to detect and track small objects (i.e.,
with low-RCS) at “extreme ranges with high confidence and accuracy (U.S. DoD, 2006).”
The DoD found that depending on variables such as the size of the wind turbines, the
number of turbines, and the distance of the turbines from the radar facility, the primary
radar signal may or may not be able to unambiguously detect and track objects of interest.
Although a secondary radar signal may enhance detection and tracking, the primary radar
signal alone must be able to unambiguously detect and track an object of interest.
Therefore, any ambiguous radar signal returns will, “negatively impact the readiness of
U.S. forces to perform air defense missions (U.S. DoD, 2006).”
83
The NWS operates the NEXRAD WSR-88D Doppler radar network to track weather.
Wind turbines impact the NEXRAD radars much as they do other radars via shadowing
and clutter. As a result, the presence of turbine interference may cause storms to be
masked or misinterpreted and false radar returns may lead to costly aircraft re-routing.
The NEXRAD network depends on primary radar returns and cannot mitigate turbine
interference with secondary radar signal returns (U.S. Department of Commerce - NOAA,
2009).
The FAA controls the National Airspace System with support from air traffic control
(ATC) radars. The National Airspace System relies on a network of DoD ATC radars
and FAA ATC radars to coordinate air traffic. ATC radars are also calibrated to detect
birds, which is a critical factor in preventing bird strikes. Wind turbine interference can
prevent ATC radar detection and tracking of both aircraft and birds. However, there tend
to be fewer problems tracking aircraft with ATC radars because these radars can rely on
both primary and secondary radar signal returns (Haggerty, 2009; U.S. DoD, 2006).
2.3. Interference Variables
The single most important factor in determining whether or not a wind turbine might
interfere with radar functionality is radar line-of-sight (RLOS), which is a function of the
Earth’s curvature, the elevation of the turbine above ground level, and the elevation of the
radar antenna above ground level. If a wind farm is not within a RLOS, then the
likelihood for interference is very low. If a wind farm is within a RLOS, then the
likelihood for and degree of interference increases as the farm is placed closer to the
radar facility (U.S. DoD, 2006). RLOS is discussed in more detail in the methodology
section below. An additional factor influencing interference is the number of turbines
and the amount of space occupied within the RLOS. More occupied space will create
more shadowing and probably more clutter. Other relevant factors influencing the
likelihood and degree of radar interference include radar frequency (bandwidth) and the
heading of the blades relative to the radar. The importance of these two factors is
demonstrated in analysis performed by the DoD (See Figure 16). Finally, preliminary
research reveals that the composition and surface design of wind turbines may be
modified to lessen radar interference (e.g., stealth-like design), however, much work
remains in this field and early results are inconclusive (Davis, 2009; Barras, 2009).
Radar frequency, blade heading, and turbine composition variables are not accounted for
in the data layers developed for the State of Maryland.
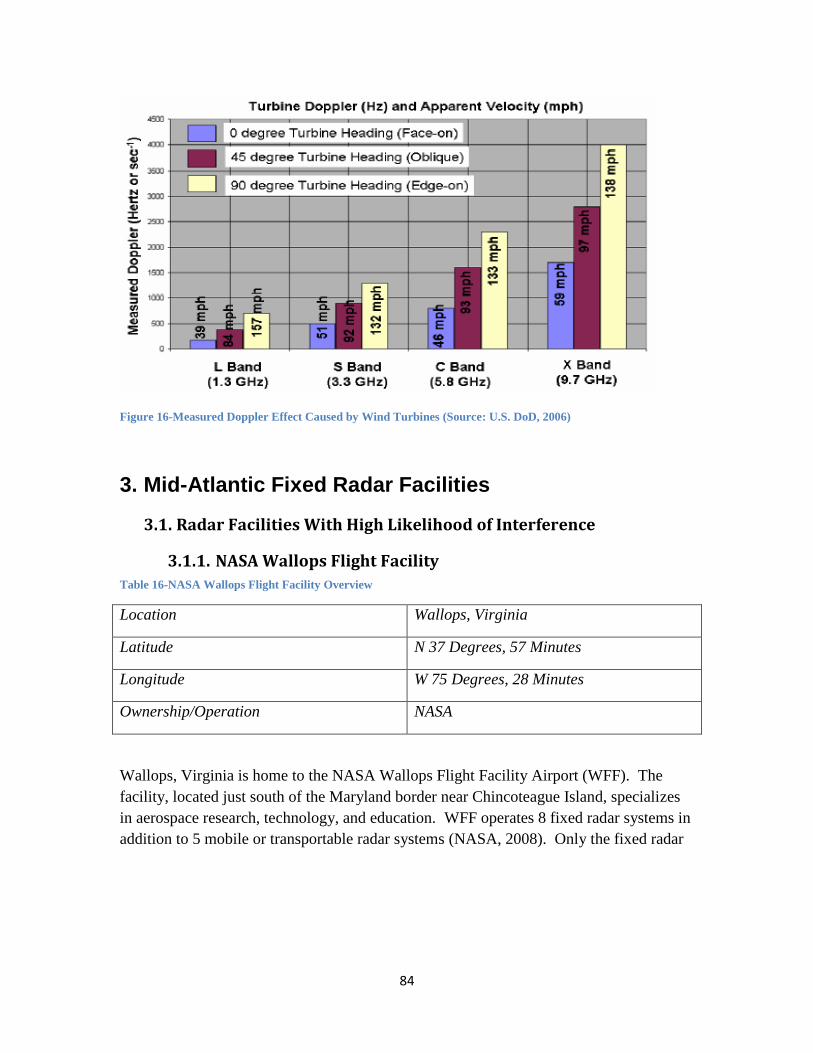
84
Figure 16-Measured Doppler Effect Caused by Wind Turbines (Source: U.S. DoD, 2006)
3. Mid-Atlantic Fixed Radar Facilities
3.1. Radar Facilities With High Likelihood of Interference
3.1.1. NASA Wallops Flight Facility
Table 16-NASA Wallops Flight Facility Overview
Location Wallops, Virginia
Latitude N 37 Degrees, 57 Minutes
Longitude W 75 Degrees, 28 Minutes
Ownership/Operation NASA
Wallops, Virginia is home to the NASA Wallops Flight Facility Airport (WFF). The
facility, located just south of the Maryland border near Chincoteague Island, specializes
in aerospace research, technology, and education. WFF operates 8 fixed radar systems in
addition to 5 mobile or transportable radar systems (NASA, 2008). Only the fixed radar
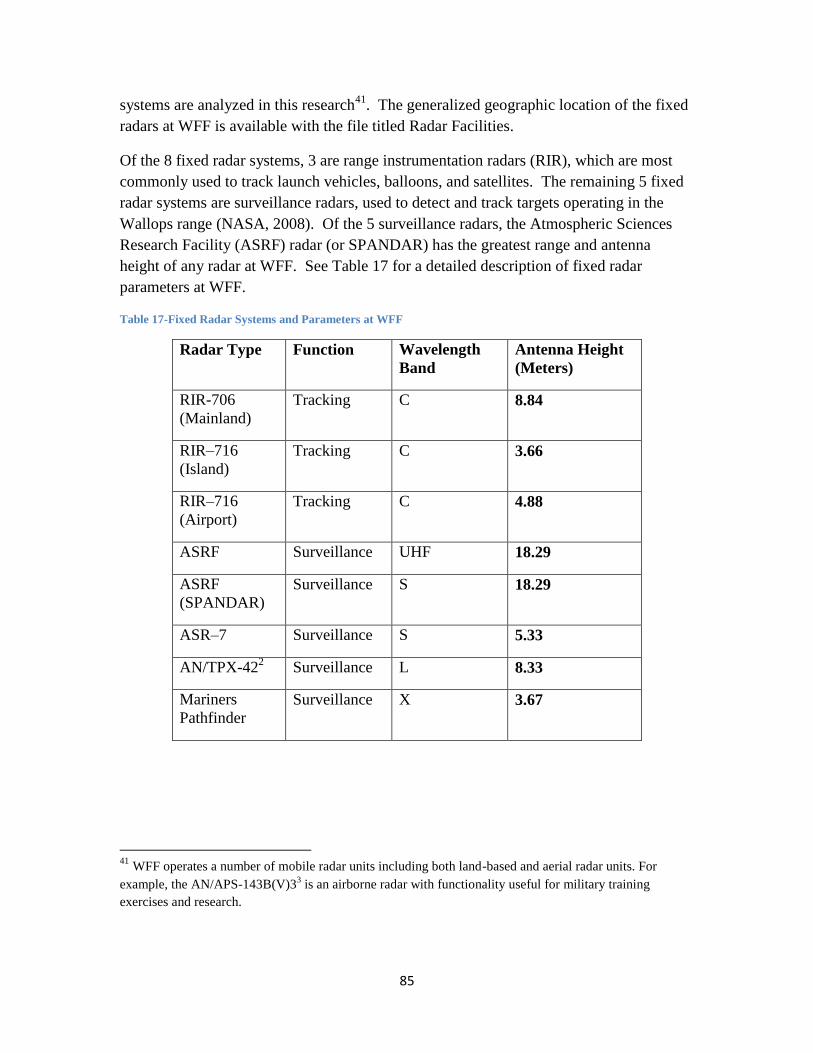
85
systems are analyzed in this research41
. The generalized geographic location of the fixed
radars at WFF is available with the file titled Radar Facilities.
Of the 8 fixed radar systems, 3 are range instrumentation radars (RIR), which are most
commonly used to track launch vehicles, balloons, and satellites. The remaining 5 fixed
radar systems are surveillance radars, used to detect and track targets operating in the
Wallops range (NASA, 2008). Of the 5 surveillance radars, the Atmospheric Sciences
Research Facility (ASRF) radar (or SPANDAR) has the greatest range and antenna
height of any radar at WFF. See Table 17 for a detailed description of fixed radar
parameters at WFF.
Table 17-Fixed Radar Systems and Parameters at WFF
Radar Type Function Wavelength
Band
Antenna Height
(Meters)
RIR-706
(Mainland)
Tracking C 8.84
RIR–716
(Island)
Tracking C 3.66
RIR–716
(Airport)
Tracking C 4.88
ASRF Surveillance UHF 18.29
ASRF
(SPANDAR)
Surveillance S 18.29
ASR–7 Surveillance S 5.33
AN/TPX-422
Surveillance L 8.33
Mariners
Pathfinder
Surveillance X 3.67
41
WFF operates a number of mobile radar units including both land-based and aerial radar units. For
example, the AN/APS-143B(V)33 is an airborne radar with functionality useful for military training
exercises and research.
86
Users and beneficiaries of the WFF facilities are diverse (NASA, 2008). Stakeholders of
radar quality at WFF include:
NASA
FAA
NOAA, which has a field site at WFF designed to collect environmental data via
telemetry 42
U.S. Department of Defense
o U.S. Navy (e.g., Surface Combat Systems Center and the Naval Air
Command (NAVAIR) out of the Patuxent Naval Air Station)
o U.S. Coast Guard
3.1.2. Other Area Radar Facilities
In addition to the facilities at WFF, Dover Air Force Base in Delaware and the Patuxent
Naval Air Station (PAX NAS) in Maryland were studied as mid-Atlantic radar facilities
that could be impacted by Maryland offshore wind development. Based on preliminary
research and the significant distance from the Maryland coastline relative to WFF, we
determine that radar facilities at Dover Air Force Base and PAX NAS are unlikely to be
impacted by Maryland offshore wind development.
Researchers utilized basic analysis tools and pre-existing findings to evaluate potential
radar conflicts at both Dover Air Force Base and PAX NAS. Existing literature indicates
that RLOS from Dover Air Force Base is unlikely to reach the study area. This
determination is based on the FAA Obstruction Evaluation/ Airport Airspace Analysis
(OE/AAA) Office and the DoD Preliminary Screening Tool (See Appendix A) (FAA and
U.S. DoD, 2009). Analysis of potential radar conflicts at PAX NAS, draws upon work
performed by Science Applications International Corporation (SAIC), Inc. (See
Appendix B) (Linn, 2009). The SAIC analysis revealed that RLOS from PAX NAS is
unlikely to reach the study area. None of the data layers accompanying this report
represent fixed radar operations at Dover Air Force Base or PAX NAS.
42
There is potential for wind turbines to interfere with telemetry though the degree to which this might
occur is likely less severe than radar interference (Davis, 2009).
87
4. Approach and Findings
This section pertains specifically to fixed radar operations originating at WFF and
demarcation of potential conflict areas off of Maryland’s coast.
4.1. Data Layer Methodology
The methodology for developing the WFF radar data layer focused on a criterion of radar
line-of-sight (RLOS). If a wind turbine or wind farm is not within radar LOS, then the
effects of the turbine on the signal will be negligible (U.S. DoD, 2006). RLOS can be
represented by an equation that expresses the distance of radar horizontal range (i.e., how
far on the horizon the radar will detect an object) given the height of the radar antenna
above ground level and the height of the object of interest (e.g., wind turbine) above
ground level. The Radar Horizon Range (RHRk) functions as the radial distance that
radar transmission will reach. The equation for RHRk is as follows:
RHRk = 4.12 (h + a)
RHRk = Radar Horizon Range (Km)
h = Antenna height (m)
a = Target altitude or height (m)
Four scenario wind turbine heights were adopted to evaluate the possibility for radar
conflict. The turbine heights are the summation of the tower height (above the ocean
surface) and the blade length. The scenario with the aggregate turbine height (tower and
blades) of 151 meters represents the most current technology while the other three
scenarios are based on proportional extrapolations of existing technology (Talisman, n.d.).
The scenario wind turbine heights are as follows:
182 meters based on 100 m tower (above surface) and 82 m blades
151 meters based on 88 m tower (above surface) and 63 m blades
132 meters based on 77 m tower (above surface) and 55 m blades
113 meters based on 66 m tower (above surface) and 47 m blades
4.2. Findings for Wallops Flight Facility
Based on the formula above, the known antenna heights of the eight fixed radars at WFF,
and working under four scenarios of variable turbine heights, RLOS radii were developed
(See Table 18).
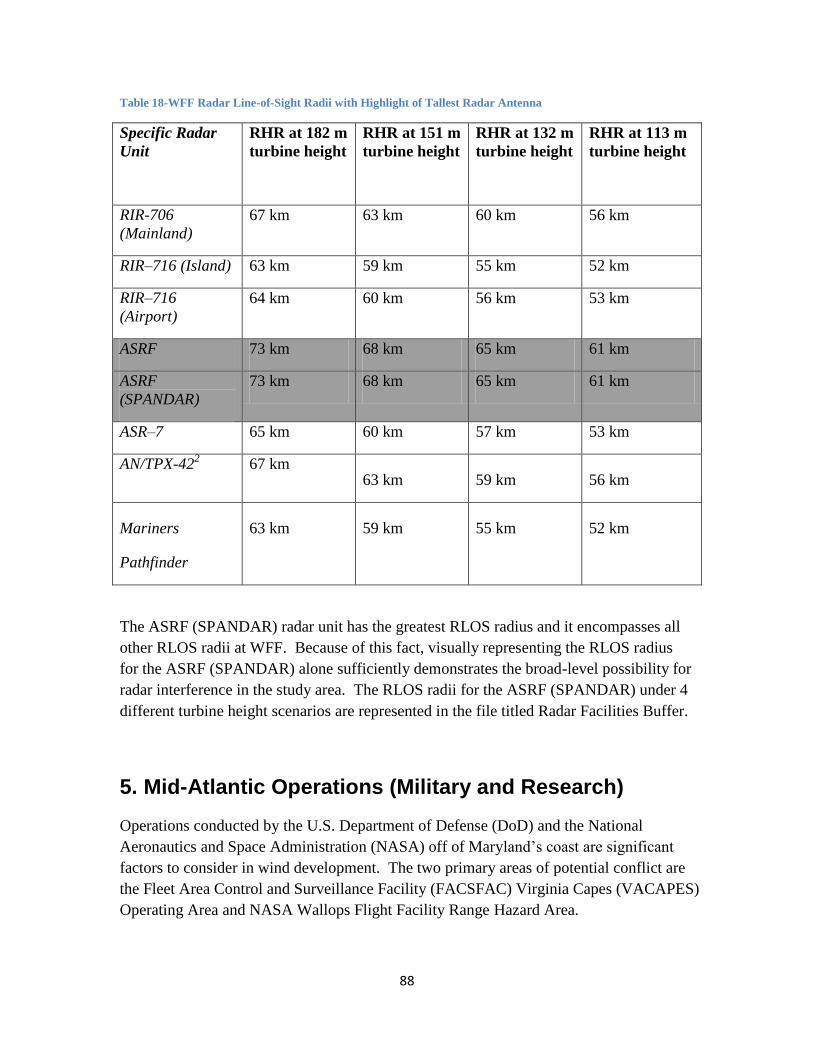
88
Table 18-WFF Radar Line-of-Sight Radii with Highlight of Tallest Radar Antenna
Specific Radar
Unit
RHR at 182 m
turbine height
RHR at 151 m
turbine height
RHR at 132 m
turbine height
RHR at 113 m
turbine height
RIR-706
(Mainland)
67 km 63 km 60 km 56 km
RIR–716 (Island) 63 km 59 km 55 km 52 km
RIR–716
(Airport)
64 km 60 km 56 km 53 km
ASRF 73 km 68 km 65 km 61 km
ASRF
(SPANDAR)
73 km 68 km 65 km 61 km
ASR–7 65 km 60 km 57 km 53 km
AN/TPX-422
67 km 63 km 59 km 56 km
Mariners
Pathfinder
63 km 59 km 55 km 52 km
The ASRF (SPANDAR) radar unit has the greatest RLOS radius and it encompasses all
other RLOS radii at WFF. Because of this fact, visually representing the RLOS radius
for the ASRF (SPANDAR) alone sufficiently demonstrates the broad-level possibility for
radar interference in the study area. The RLOS radii for the ASRF (SPANDAR) under 4
different turbine height scenarios are represented in the file titled Radar Facilities Buffer.
5. Mid-Atlantic Operations (Military and Research)
Operations conducted by the U.S. Department of Defense (DoD) and the National
Aeronautics and Space Administration (NASA) off of Maryland’s coast are significant
factors to consider in wind development. The two primary areas of potential conflict are
the Fleet Area Control and Surveillance Facility (FACSFAC) Virginia Capes (VACAPES)
Operating Area and NASA Wallops Flight Facility Range Hazard Area.
89
5.1. Areas with High Likelihood for Conflict
5.1.1. VACAPES Operating Area
The FACSFAC VACAPES Operating Area, which consists of air, surface, and
subsurface space, is operated by the U.S. Navy and accessible to the entire U.S. military.
The space consists of warning areas, restricted areas, military operating areas, air traffic
control assigned airspace, and surface/subsurface operating areas (Stewart, 2009). A
number of stakeholders use the VACAPES space including:
U.S. Navy [i.e., Tests and Evaluation, Air Command (NAVAIR), Sea Command
(NAVSEA)]
U.S. Air Force
U.S. Coast Guard
NASA
The specific space within the VACAPES Operating Area of most relevance to offshore
Maryland is Warning Area 386 (W-386). W-386 is special-use airspace located about 5.5
kilometers east of the Maryland Economic Zone. W-386 extends from surface to
unlimited altitude, except for the area west of longitude W 75 Degrees, 30 Minutes,
which is from surface to 1,999 feet (Appendix B) (Global Security, 2005; U.S. DoD,
2001; Owen, 2009). A number of military operations occur within W-386 including
flight-testing, munitions deployment, and general training exercises. Primary users of the
W-386 include Navy Air Command (NAVAIR) out of PAX NAS and Navy Sea
Command (NAVSEA), much of which comes out of Norfolk, Virginia.
For the purpose of understanding potential interactions between mobile radar and wind
turbines, it is important to note that military radar can only originate within W-386
(Owen, 2009). However, radar signals do not obey man-made boundaries and signal
interference could occur whether turbines are sited within W-386 or not.
Below is a summary of major types of operations that occur within W-386.
5.1.1.1. Flight Testing
Flight-testing, particularly supersonic flight-testing, occurs in the Naval Air Warfare
Center, Aircraft Division (NAWCAD) Test Track. Multiple flight tests are conducted on
a daily basis and tests are often at very high altitudes (Stewart, 2009). Possible conflicts
within the NAWCAD Test Track are physical and radar-based. The potential for
physical conflict exists with low-flying aircraft. The potential for radar-based conflict
exists with both fixed radar (e.g., WFF) and mobile radar (e.g., aircraft or vessel)
experiencing interference from wind-turbines.
90
In addition to supersonic flight-testing, helicopter operations are frequent in the southern
portion of W-386, which links up with air space connecting to the PAX NAS. Helicopters
are often low flying in this airspace (Stewart, 2009).
5.1.1.2. Munitions Deployment
Munitions deployment occurs within W-386 including air-to-air, air-to-surface, and
surface-to-surface missile, gunnery, and rocket exercises. Much of the munitions
deployment is inactive in the sense that explosives are not used. Inactive munitions
deployment still involves large objects or missiles that can do damage to personnel or
equipment. Hazardous, live-fire exercises are not uncommon (Stewart, 2009).
The likelihood for physical conflict in the study area is high given the deployment of
large, potentially damaging weaponry (live or dead). Furthermore, precise radar tracking
(fixed or mobile) of weapons could be degraded with the presence of wind turbines.
5.1.1.3. General Training Exercises
Sea-based and air-based training takes place in W-386. Sea based training exercises
frequently involve deploying U.S. Navy combat vessels and full crew with the goal of
simulating war-like events. For example, common training exercises simulate enemy
attack, which might require turning radars to full power to detect objects of interest
(Davis, 2009). As a result, wind turbine interference might degrade this simulation
experience. Additionally, vessels may cover a significant area during the course of a
training exercise. Mobility of vessels could be impaired by the presence of turbines in
W-386.
5.1.1.4. Other Operations
Another specific area within W-386 and the study area is the Langley Corridor, which is
used by Langley Air Force Base as an enter/exit route for aircraft. This space is within
64 kilometers of Maryland’s coast (Stewart, 2009).
5.1.2. Wallops Flight Facility Range Hazard Area
NASA’s Wallops FFA oversees a Range Hazard Area, which is an area in the Atlantic
Ocean designated for operational impacts (i.e., rockets, balloons). The Range Hazard
Area is fan-shaped beginning at the WFF launch site and extending 305.5 kilometers in a
southern and eastern direction. The affected area is roughly 72,000 square nautical
kilometers. The Range Hazard Area overlaps with the VACAPES Operational Area,
including W-386 (NASA, 2008).
The Range Hazard Area file accompanying this report represents where impacts have
historically occurred and is not a specially authorized area. Also, potential impact areas
91
vary from launch to launch, but frequently fall entirely within the Range Hazard Area
(Johnson, 2009).
5.1.3. Approach and Findings
The Ranges Sustainability Office at PAX NAS provided the VACAPES data layers
accompanying this report, which pertain specifically to W-386 (Sabella and Jarboe, 2009).
The VACAPES Operating Area encompasses the entire study area with the exception of
Maryland state waters between the coastline and W-386. (See the file titled VACAPES
W-386). Of particular relevance to the area off of Maryland's coast are the NAWCAD
Test Track (File titled NAWCAD Test-track) and the Langley Corridor (File titled
Langley-Victor Corridors), both of which are included as separate data layers within the
VACAPES W-386 data layer.
The NASA WFF Facilities Management Branch provided the Range Hazard Area data
layers accompanying this report (Johnson, 2009). A small portion of the NASA WFF
Range Hazard Area overlaps with the study area. (See the file titled Range Hazard Area).
Furthermore, regulated airspace R-6604, which is used and monitored by WFF, is
included in the data layers although the airspace is significantly south of the study area
and unlikely to conflict directly with wind development. (See file titled Regulated
Airspace).
6. Discussion and Conclusion
Limitations exist to fully understanding the potential for conflicts between offshore wind
development and mid-Atlantic operations. A deficit of literature on how mobile radar
devices interact with wind turbines is a hurdle to identifying potential conflict.
Additionally, more information about surface and subsurface military operations
(including live training exercises) would improve understanding of possible conflict areas
and encourage wind developers to further explore the waters adjacent to Maryland.
In conclusion, the potential for diminished radar functionality exists at NASA’s Wallops
Flight Facility, which would impact many stakeholders. The potential for diminished
radar functionality at other mid-Atlantic facilities, including PAX NAS and Dover Air
Force Base, is unlikely. These findings apply to fixed radar units only and further
research into potential conflict with mobile radars is needed. U.S. military operations in
the air or surface space adjacent to Maryland’s coastline are likely to be a source of
conflict for wind development, but with more information regarding specific offshore
military activities, it may be possible to abate conflict.
92
7. References
Barras, C. October, 2009. Stealthy wind turbines aim to disappear from radar screens.
New Scientist, 15(22), 23. Available at:
http://www.newscientist.com/article/dn18032-stealthy-wind-turbines-aim-to-
disappear-from-radar-screens.html.
Davis, R. Personal Communication in person. December 15, 2009. Atlantic Test Ranges/
RSBP, LLC., Patuxent River, Maryland, 20670.
Federal Aviation Administration and Department of Defense. Obstruction Evaluation/
Airport Airspace Analysis (OE/AAA) Preliminary Screening Tool. Available at
https://oeaaa/external/gisTools/gisAction.jsp?action=showLongRangeRadarToolF
orm.
Global Security.org. Virginia Capes Operating Area VACAPES OPAREA. Available at
http://www.globalsecurity.org/military/facility/vacapes.htm.
Haggerty, K. Personal Communication via telephone. November 24, 2009. Federal
Aviation Administration. Washington, DC, 20591.
Johnson, W. Personal Communication via email. December 11, 2009. NASA WFF,
Facilities Management Branch. Wallops, VA, 23337.
Linn, J. December, 2009. Atlantic Test Range Radar Antenna Wind Turbine Viewshed.
Unpublished Map. Science Applications International Corporation, Inc. McLean,
VA, 22102.
National Aeronautics and Space Administration (NASA) - Goddard Space Flight Center.
2008. Wallops Flight Facility Range User’s Handbook. Available at:
http://sites.wff.nasa.gov/multimedia/docs/wffruh.pdf
Owen, R. Personal Communication via email. December 16, 2009. Naval Facilities
Engineering Washington. Washington, DC, 20374.
Sabella, R., and C. Jarboe. Personal Communication via email. December 18, 2009.
NAVAIR, Ranges Sustainability Office. Patuxent River, MD, 20670.
Solanki, A. Personal Communication via telephone. November 23, 2009. Maryland
Aviation Administration. Baltimore/Washington International Airport, Maryland,
21240.
Stewart, J. Personal Communication in-person. December 15, 2009. Atlantic Test Ranges.
Patuxent River, MD, 20670.
Talisman Energy. n.d.. Beatrice Demonstration Project Scoping Report. Available at
http://www.beatricewind.co.uk/home/default.asp.
93
U.S. Department of Commerce - National Oceanic and Atmospheric Administration
(NOAA) - National Weather Service (NWS). Radar Operations Center: Wind
Farm Interactions With NEXRAD Radar. Available at
http://www.roc.noaa.gov/WSR88D/WindFarm/WindFarm_Index_GreatFalls.aspx
?wid=*.
U.S. Department of Defense – Navy. 2001. Fleet Area Control and Surveillance Facility
Virginia Capes: Operations Manual. Available at
http://www.vacapes.navy.mil/inc/cmodules/dms/download-
rel.php?secid=19&id=0&filesystem_id=4012.
U.S. Department of Defense (DoD) - Office of the Director of Defense Research and
Engineering. 2006. Report to the Congressional Defense Committees: The Effect
of Windmill Farms on Military Readiness. Available at
www.defenselink.mil/pubs/pdfs/WindFarmReport.pdf.
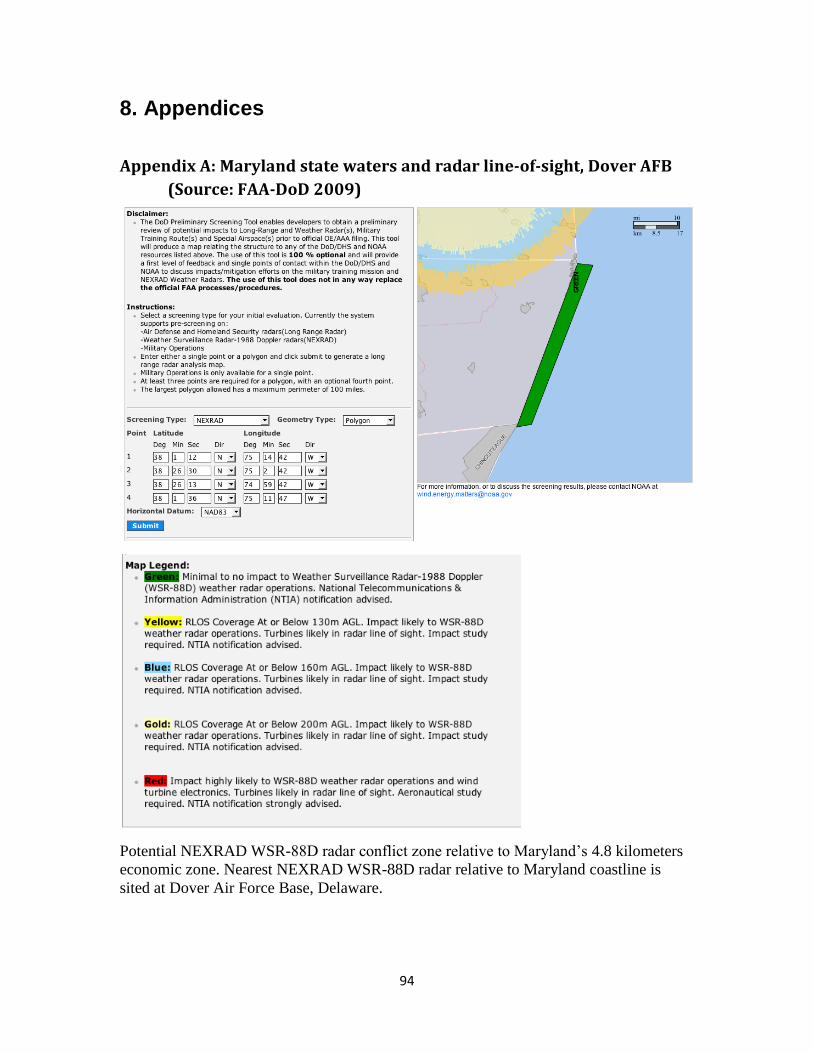
94
8. Appendices
Appendix A: Maryland state waters and radar line-of-sight, Dover AFB
(Source: FAA-DoD 2009)
Potential NEXRAD WSR-88D radar conflict zone relative to Maryland’s 4.8 kilometers
economic zone. Nearest NEXRAD WSR-88D radar relative to Maryland coastline is
sited at Dover Air Force Base, Delaware.
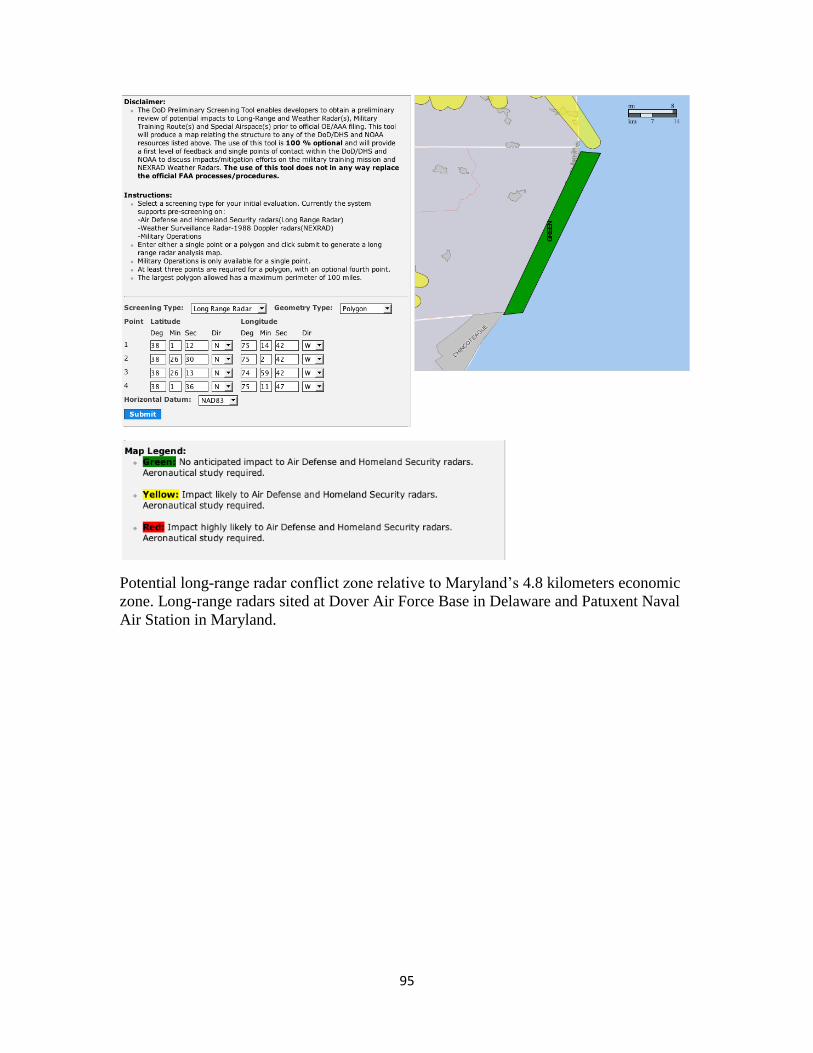
95
Potential long-range radar conflict zone relative to Maryland’s 4.8 kilometers economic
zone. Long-range radars sited at Dover Air Force Base in Delaware and Patuxent Naval
Air Station in Maryland.
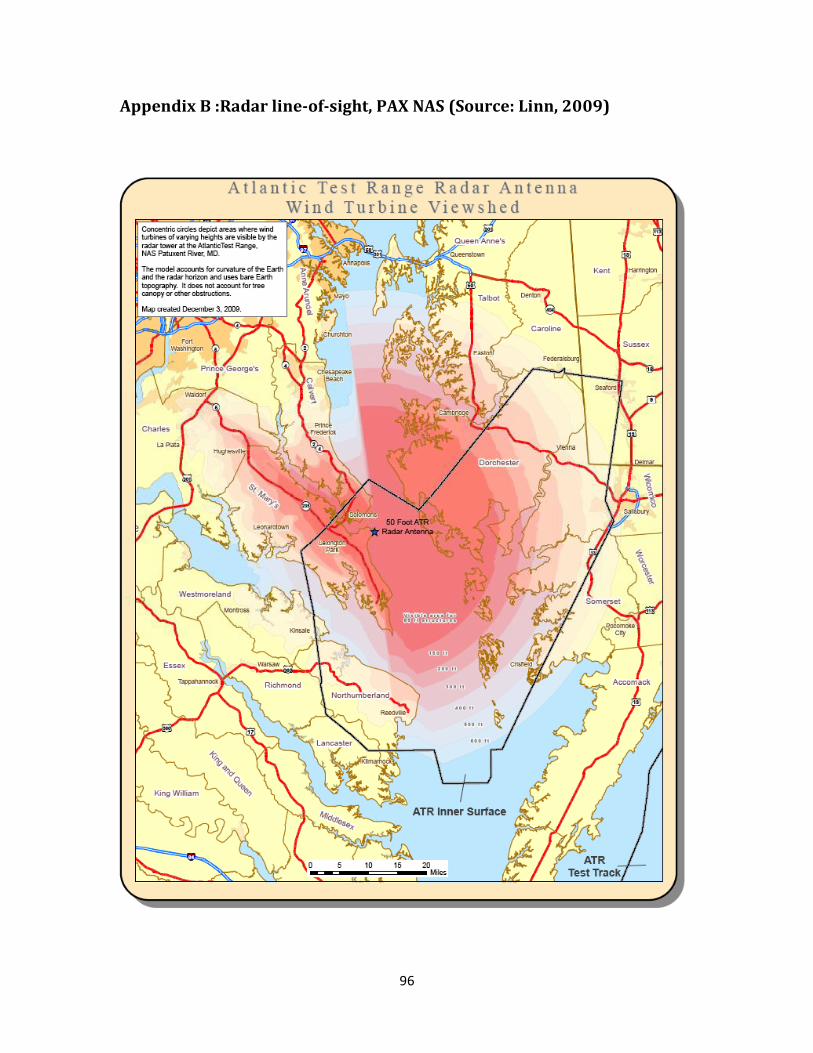
96
Appendix B :Radar line-of-sight, PAX NAS (Source: Linn, 2009)
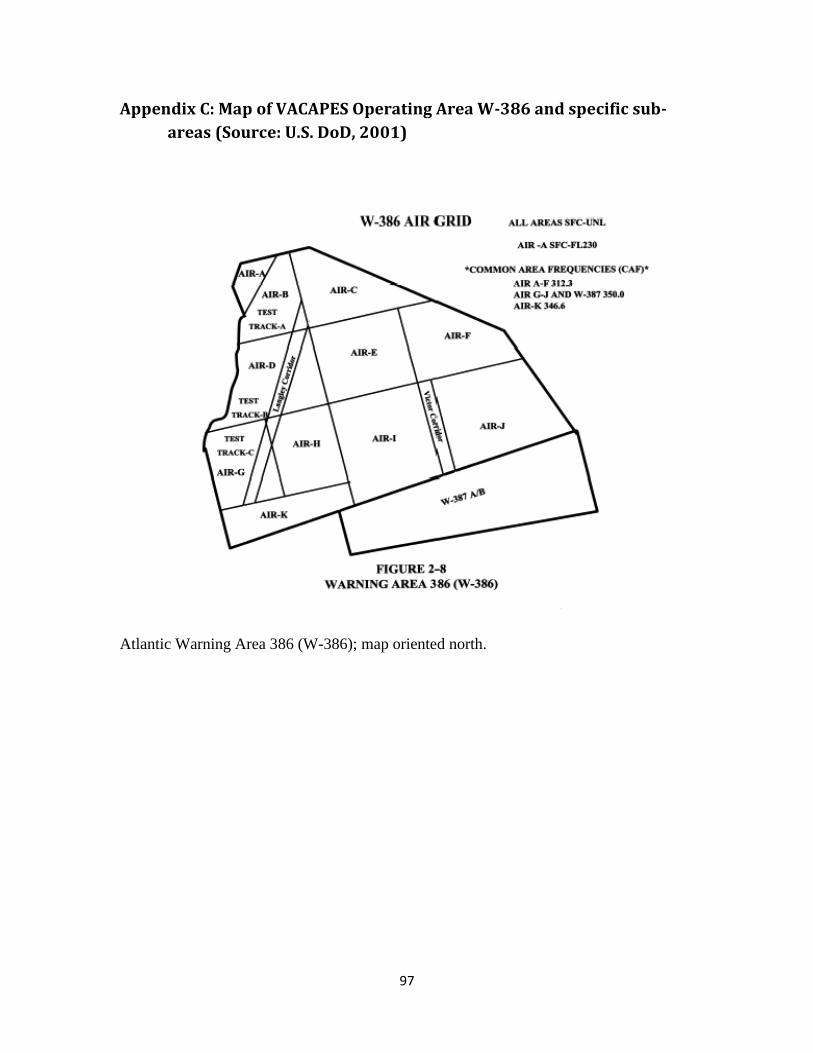
97
Appendix C: Map of VACAPES Operating Area W-386 and specific sub-
areas (Source: U.S. DoD, 2001)
Atlantic Warning Area 386 (W-386); map oriented north.