mars 2002 financial part business plan pointe-noire airport bot – concession project
TRANSCRIPT
Mars 2002
Financial Part
Business Plan
Pointe-Noire AirportPointe-Noire Airport
BOT – CONCESSION PROJECT
Business Plan - Table of Content
• Executive Summary • Initial Investments• Development Costs• Revenues• Operational Expenses• Annual Profits• Cash Flow• ROI
• Appendixes
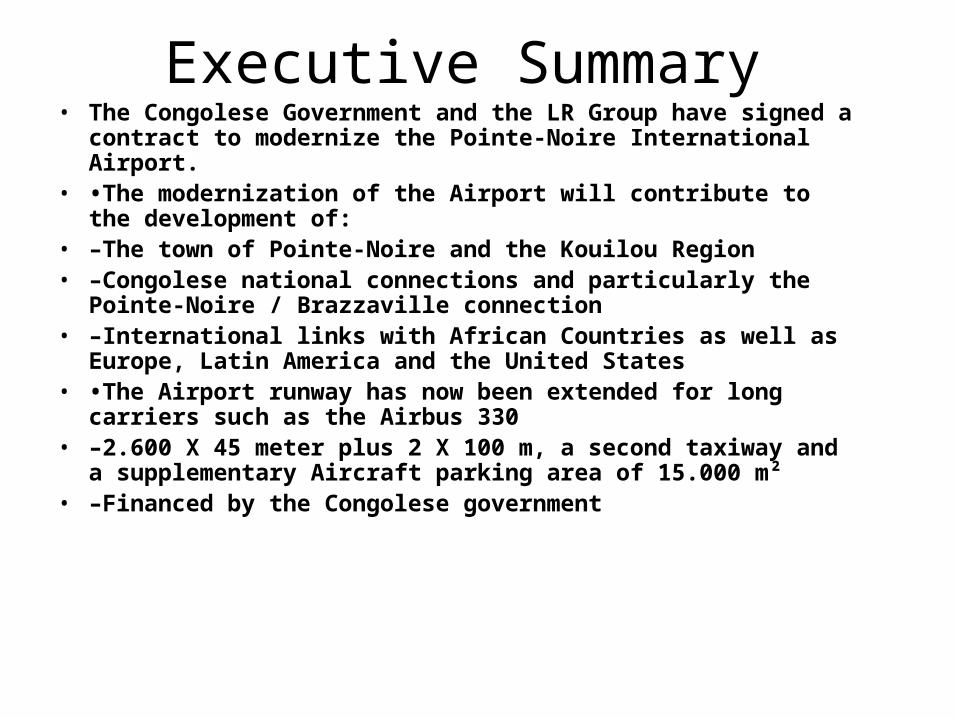
Executive Summary• The Congolese Government and the LR Group have signed a
contract to modernize the Pointe-Noire International Airport.• •The modernization of the Airport will contribute to the
development of:• –The town of Pointe-Noire and the Kouilou Region • –Congolese national connections and particularly the Pointe-Noire /
Brazzaville connection• –International links with African Countries as well as Europe, Latin
America and the United States• •The Airport runway has now been extended for long carriers such
as the Airbus 330• –2.600 X 45 meter plus 2 X 100 m, a second taxiway and a
supplementary Aircraft parking area of 15.000 m²• –Financed by the Congolese government
Executive Summary
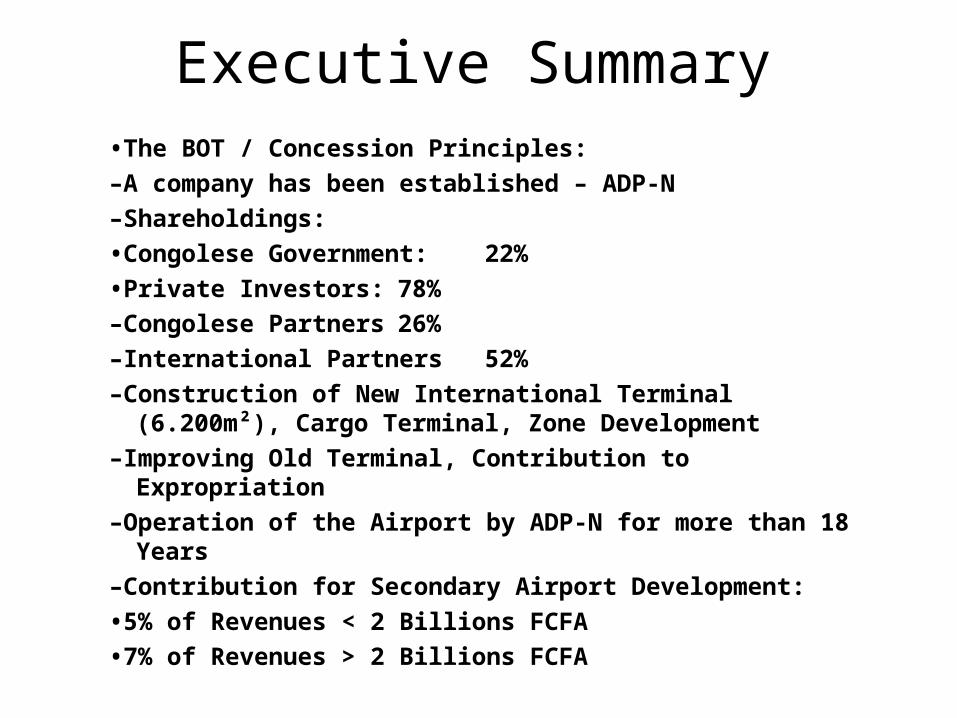
•The BOT / Concession Principles:
–A company has been established – ADP-N
–Shareholdings:
•Congolese Government: 22%
•Private Investors: 78%
–Congolese Partners 26%
–International Partners 52%
–Construction of New International Terminal (6.200m²), Cargo Terminal, Zone Development
–Improving Old Terminal, Contribution to Expropriation
–Operation of the Airport by ADP-N for more than 18 Years
–Contribution for Secondary Airport Development:
•5% of Revenues < 2 Billions FCFA
•7% of Revenues > 2 Billions FCFA
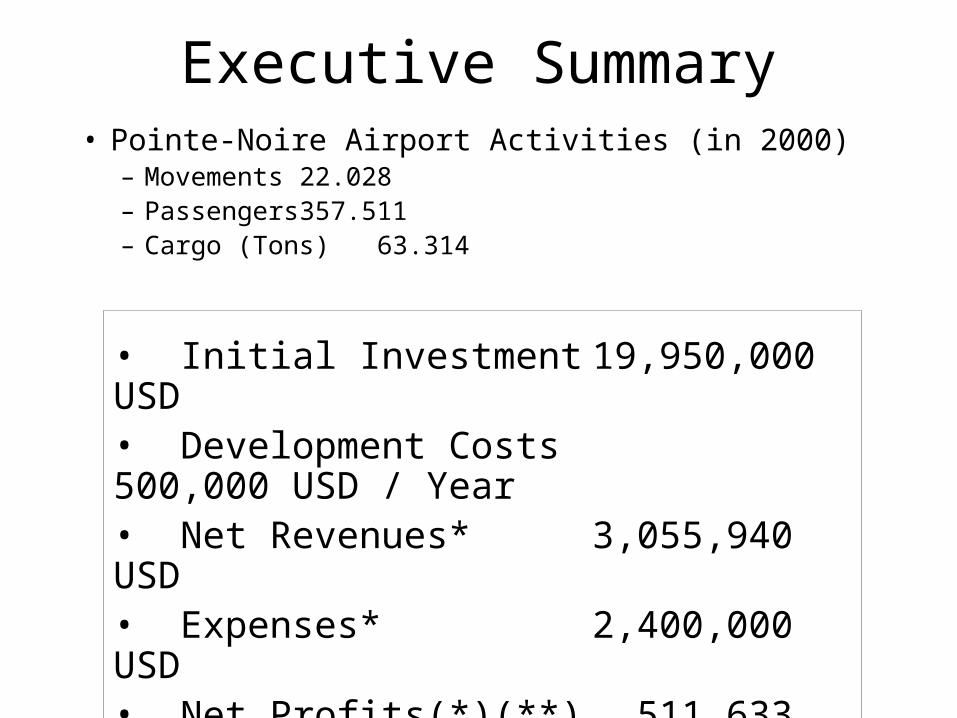
Executive Summary• Pointe-Noire Airport Activities (in 2000)
– Movements 22.028– Passengers 357.511– Cargo (Tons) 63.314
• Initial Investment 19,950,000 USD• Development Costs 500,000 USD / Year• Net Revenues* 3,055,940 USD• Expenses* 2,400,000 USD• Net Profits(*)(**) 511 633 USD* 1st Year** Available for Investors
Executive Summary Cash Flow Assumptions
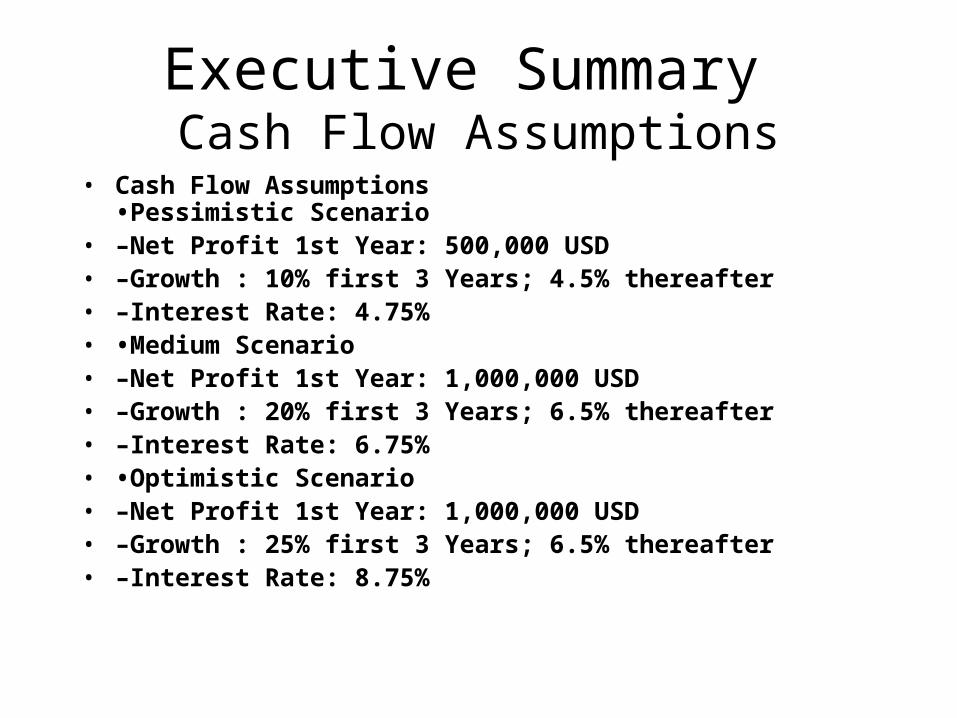
• Cash Flow Assumptions•Pessimistic Scenario
• –Net Profit 1st Year: 500,000 USD• –Growth : 10% first 3 Years; 4.5% thereafter• –Interest Rate: 4.75%• •Medium Scenario• –Net Profit 1st Year: 1,000,000 USD• –Growth : 20% first 3 Years; 6.5% thereafter• –Interest Rate: 6.75%• •Optimistic Scenario• –Net Profit 1st Year: 1,000,000 USD• –Growth : 25% first 3 Years; 6.5% thereafter• –Interest Rate: 8.75%
Executive Summary Return on Investment (ROI)
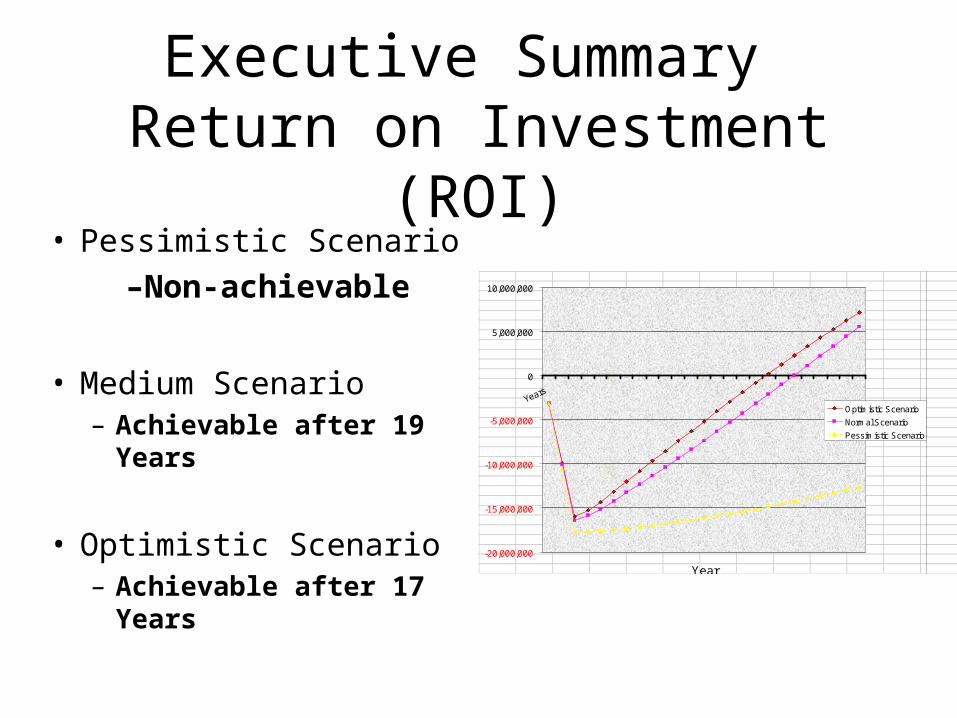
• Pessimistic Scenario
–Non-achievable
• Medium Scenario– Achievable after 19 Years
• Optimistic Scenario– Achievable after 17 Years
Scenario Summary Chart
-20,000,000
-15,000,000
-10,000,000
-5,000,000
0
5,000,000
10,000,000
Years
Year
Pre
sen
t V
alu
e U
S $
Optimistic Scenario
Normal Scenario
Pessimistic Scenario
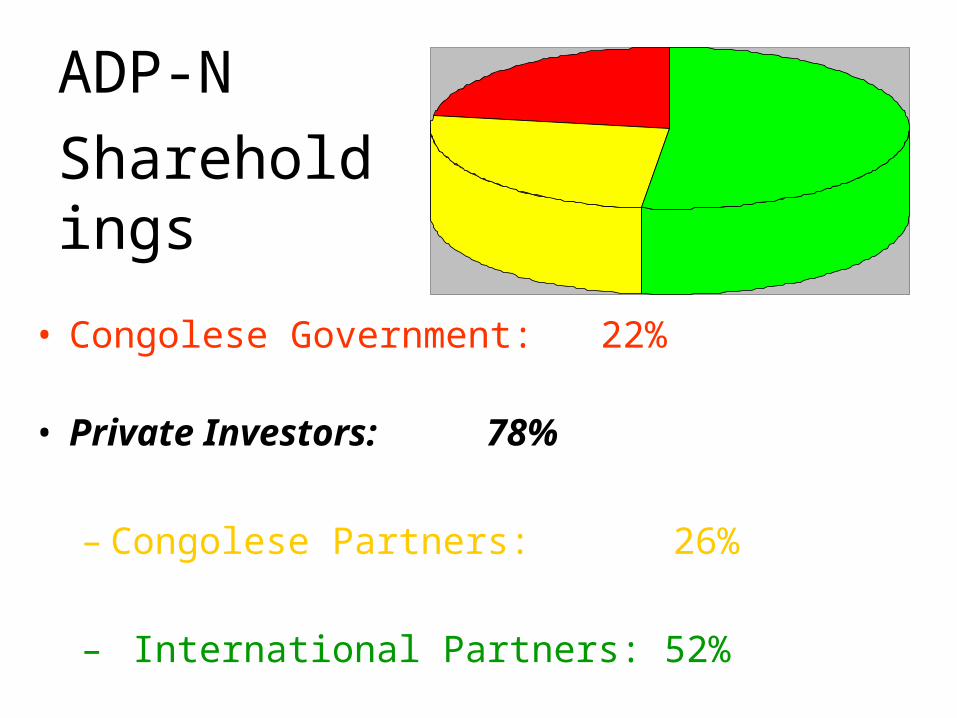
ADP-N
Shareholdings
• Congolese Government: 22%
• Private Investors: 78%
– Congolese Partners: 26%
– International Partners: 52%
Initial Investments
• Following Study by LR Group in cooperation with Congo:– Concept, Researches, Experts, …– Meetings with Government Officials, Investors, Airlines …
• The Initial Scope of the Investment is:– New International Terminal (6200 m2)– Zone Development– Improving Old Terminal– Cargo Terminal– Expropriation
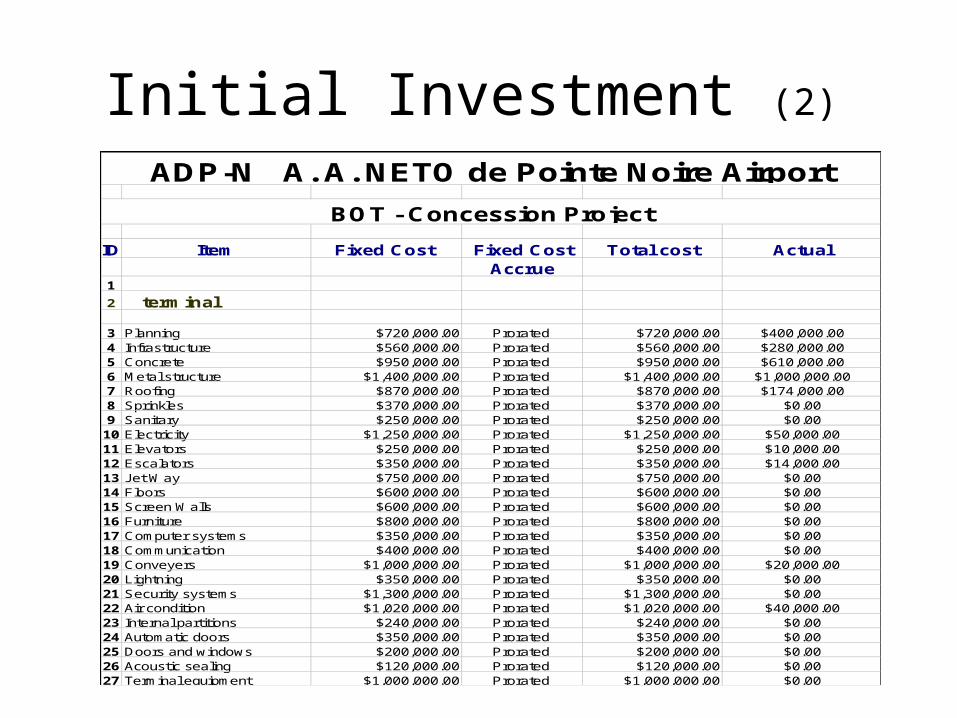
ID Item Fixed Cost Fixed Cost Total cost ActualAccrue
1
2 terminal
3 Planning $720,000.00 Prorated $720,000.00 $400,000.004 Infrastructure $560,000.00 Prorated $560,000.00 $280,000.005 Concrete $950,000.00 Prorated $950,000.00 $610,000.006 Metal structure $1,400,000.00 Prorated $1,400,000.00 $1,000,000.007 Roofing $870,000.00 Prorated $870,000.00 $174,000.008 Sprinkles $370,000.00 Prorated $370,000.00 $0.009 Sanitary $250,000.00 Prorated $250,000.00 $0.00
10 Electricity $1,250,000.00 Prorated $1,250,000.00 $50,000.0011 Elevators $250,000.00 Prorated $250,000.00 $10,000.0012 Escalators $350,000.00 Prorated $350,000.00 $14,000.0013 Jet Way $750,000.00 Prorated $750,000.00 $0.0014 Floors $600,000.00 Prorated $600,000.00 $0.0015 Screen Walls $600,000.00 Prorated $600,000.00 $0.0016 Furniture $800,000.00 Prorated $800,000.00 $0.0017 Computer systems $350,000.00 Prorated $350,000.00 $0.0018 Communication $400,000.00 Prorated $400,000.00 $0.0019 Conveyers $1,000,000.00 Prorated $1,000,000.00 $20,000.0020 Lightning $350,000.00 Prorated $350,000.00 $0.0021 Security systems $1,300,000.00 Prorated $1,300,000.00 $0.0022 Air condition $1,020,000.00 Prorated $1,020,000.00 $40,000.0023 Internal partitions $240,000.00 Prorated $240,000.00 $0.0024 Automatic doors $350,000.00 Prorated $350,000.00 $0.0025 Doors and windows $200,000.00 Prorated $200,000.00 $0.0026 Acoustic sealing $120,000.00 Prorated $120,000.00 $0.0027 Terminal equipment $1,000,000.00 Prorated $1,000,000.00 $0.00
ADP-N A. A. NETO de Pointe Noire Airport
BOT - Concession Project
Initial Investment (2)
ID Item Fixed Cost Fixed Cost Total cost ActualAccrue
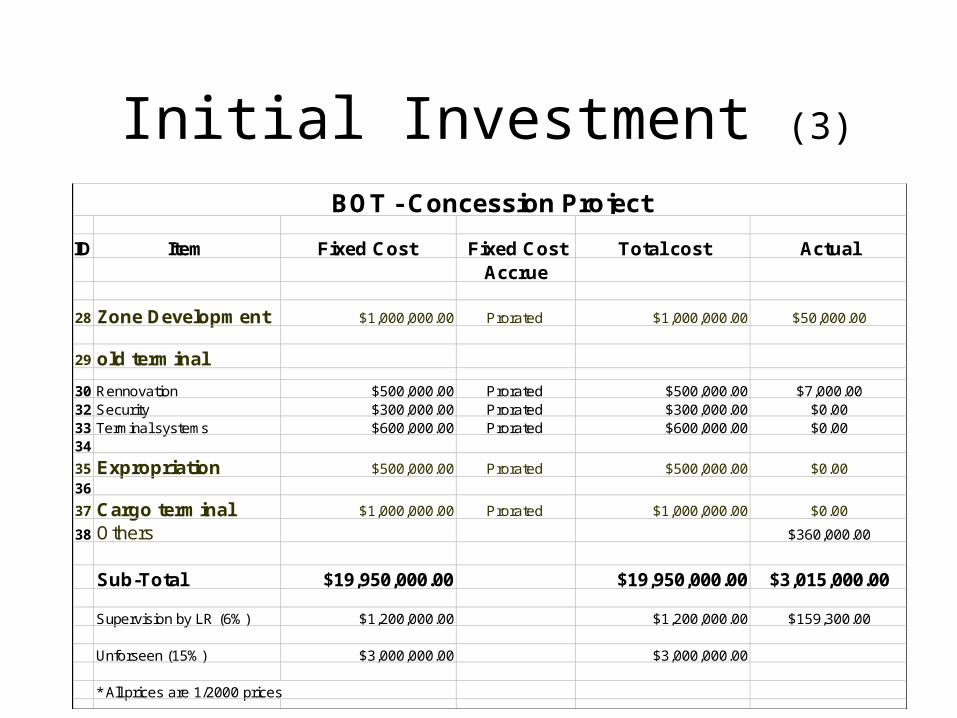
28 Zone Development $1,000,000.00 Prorated $1,000,000.00 $50,000.00
29 old terminal
30 Rennovation $500,000.00 Prorated $500,000.00 $7,000.0032 Security $300,000.00 Prorated $300,000.00 $0.0033 Terminal systems $600,000.00 Prorated $600,000.00 $0.0034
35 Expropriation $500,000.00 Prorated $500,000.00 $0.0036
37 Cargo terminal $1,000,000.00 Prorated $1,000,000.00 $0.00
38 Others $360,000.00
Sub-Total $19,950,000.00 $19,950,000.00 $3,015,000.00
Supervision by LR (6%) $1,200,000.00 $1,200,000.00 $159,300.00
Unforseen (15%) $3,000,000.00 $3,000,000.00
* All prices are 1/2000 prices
BOT - Concession Project
Initial Investment (3)
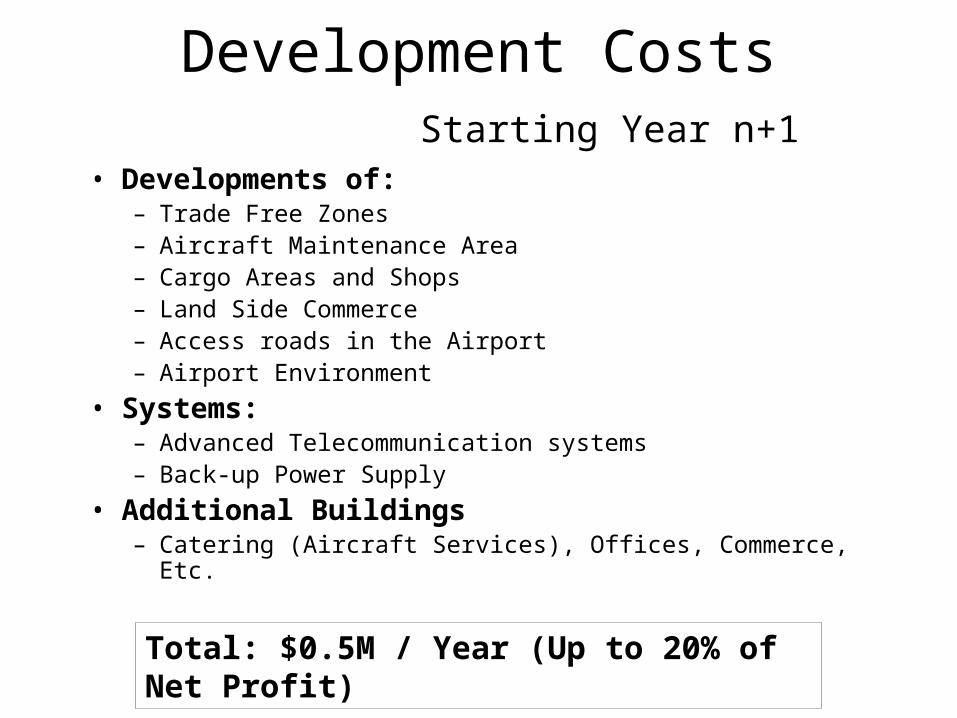
Development Costs Starting Year n+1
• Developments of:– Trade Free Zones– Aircraft Maintenance Area– Cargo Areas and Shops– Land Side Commerce– Access roads in the Airport– Airport Environment
• Systems:– Advanced Telecommunication systems– Back-up Power Supply
• Additional Buildings– Catering (Aircraft Services), Offices, Commerce, Etc.
Total: $0.5M / Year (Up to 20% of Net Profit)
Revenues - Table of Content
• Airlines Operating in Pointe-Noire
• Historical Traffic Statistics– Landings– Passengers (National, Regional, Int’l)– Cargo (National, Regional, Int’l)
• The Revenues Sources
• Annual Income/Revenues
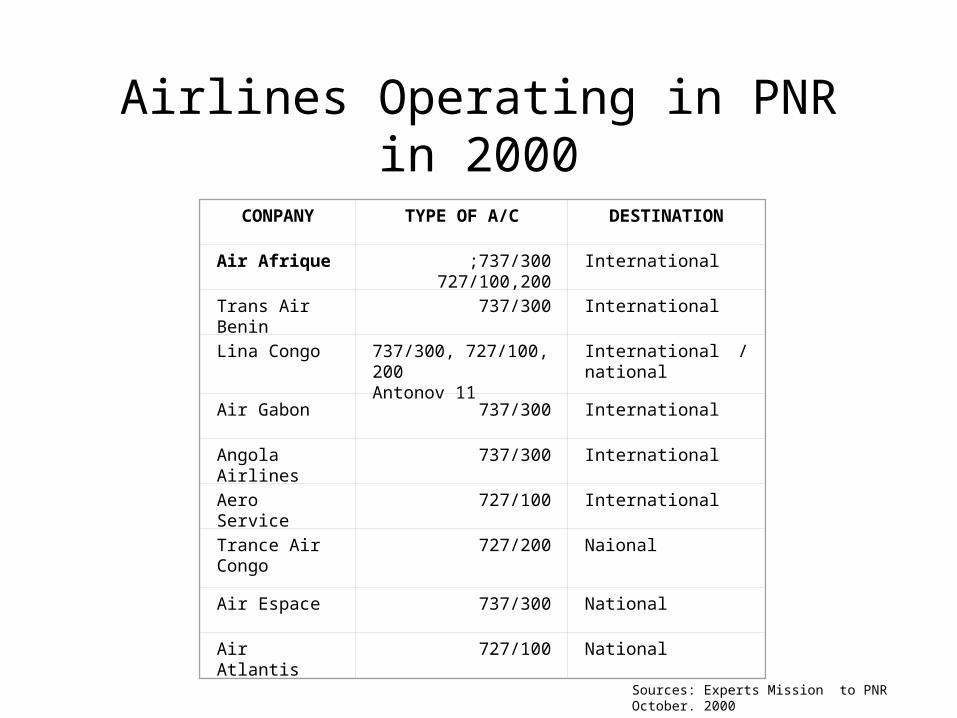
Airlines Operating in PNRin 2000
CONPANY TYPE OF A/C DESTINATION
Air Afrique 737/300 ;727/100,200
International
Trans Air Benin 737/300 International
Lina Congo 737/300, 727/100, 200Antonov 11
International / national
Air Gabon 737/300 International
Angola Airlines 737/300 International
Aero Service 727/100 International
Trance Air Congo
727/200 Naional
Air Espace 737/300 National
Air Atlantis 727/100 National
Sources: Experts Mission to PNR October. 2000
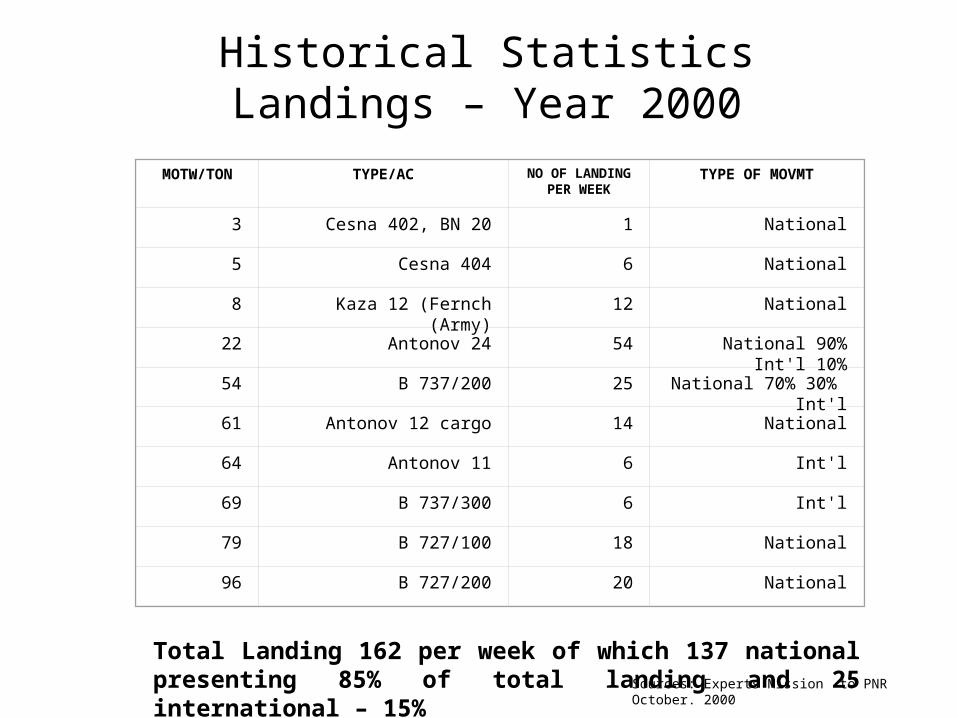
Historical StatisticsLandings – Year 2000
MOTW/TON TYPE/AC NO OF LANDING PER WEEK
TYPE OF MOVMT
3 Cesna 402, BN 20 1 National
5 Cesna 404 6 National
8 Kaza 12 (Fernch Army)) 12 National
22 Antonov 24 54 National 90% Int'l 10%
54 B 737/200 25 30% National 70% Int'l
61 Antonov 12 cargo 14 National
64 Antonov 11 6 Int'l
69 B 737/300 6 Int'l
79 B 727/100 18 National
96 B 727/200 20 National
Total Landing 162 per week of which 137 national presenting 85% of total landing and 25 international – 15% Sources: Experts Mission to PNR October.
2000
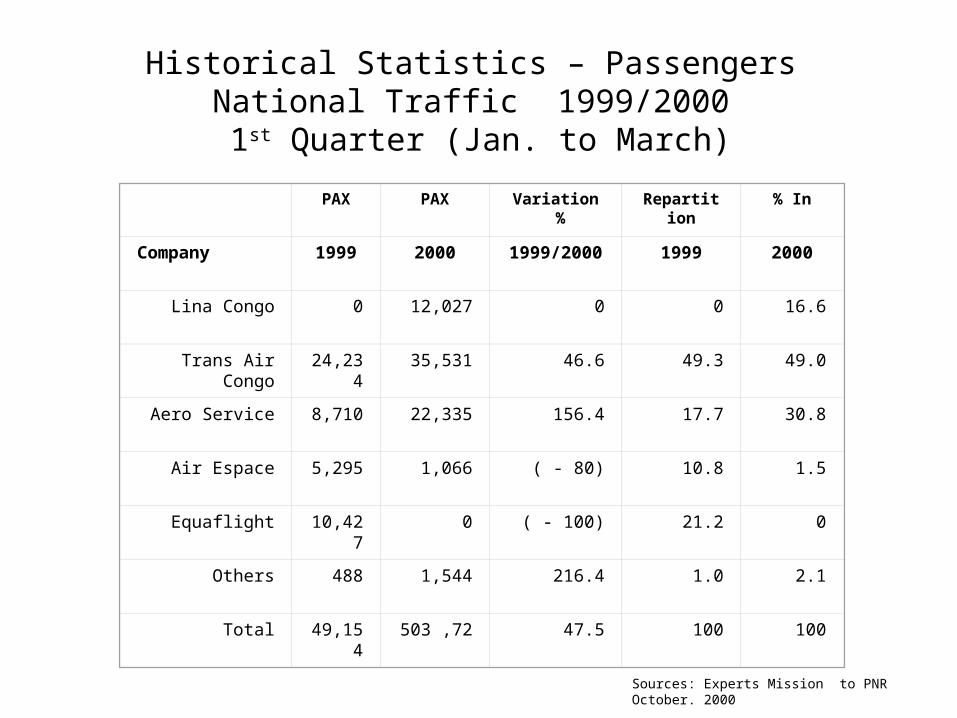
Historical Statistics – PassengersNational Traffic 1999/2000 1st Quarter (Jan. to March)
PAX PAX Variation% Repartition In%
Company 1999 2000 1999/2000
1999 2000
Lina Congo 0 12,027 0 0 16.6
Trans Air Congo 24,234
35,531 46.6 49.3 49.0
Aero Service 8,710 22,335 156.4 17.7 30.8
Air Espace 5,295 1,066 (80) - 10.8 1.5
Equaflight 10,427
0 (100) - 21.2 0
Others 488 1,544 216.4 1.0 2.1
Total 49,154
72 ,503 47.5 100 100
Sources: Experts Mission to PNR October. 2000
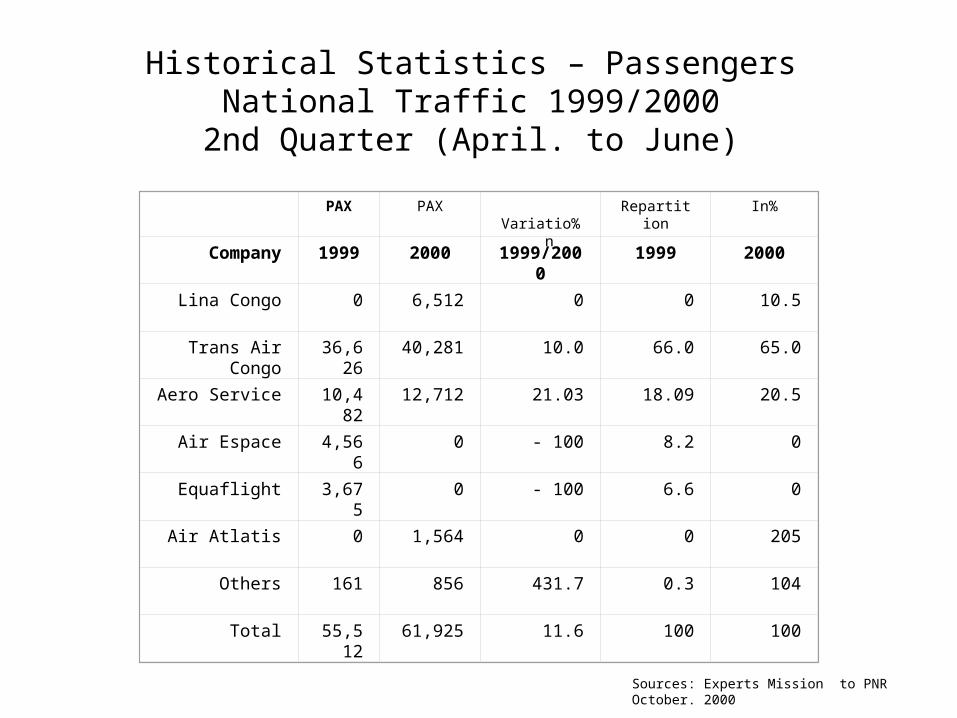
Historical Statistics – Passengers National Traffic 1999/2000 2nd Quarter (April. to June)
PAX PAX % Variation Repartition % In
Company 1999 2000 1999/2000
1999 2000
Lina Congo 0 6,512 0 0 10.5
Trans Air Congo 36,626
40,281 10.0 66.0 65.0
Aero Service 10,482
12,712 21.03 18.09 20.5
Air Espace 4,566
0 100- 8.2 0
Equaflight 3,675
0 100- 6.6 0
Air Atlatis 0 1,564 0 0 205
Others 161 856 431.7 0.3 104
Total 55,512
61,925 11.6 100 100
Sources: Experts Mission to PNR October. 2000
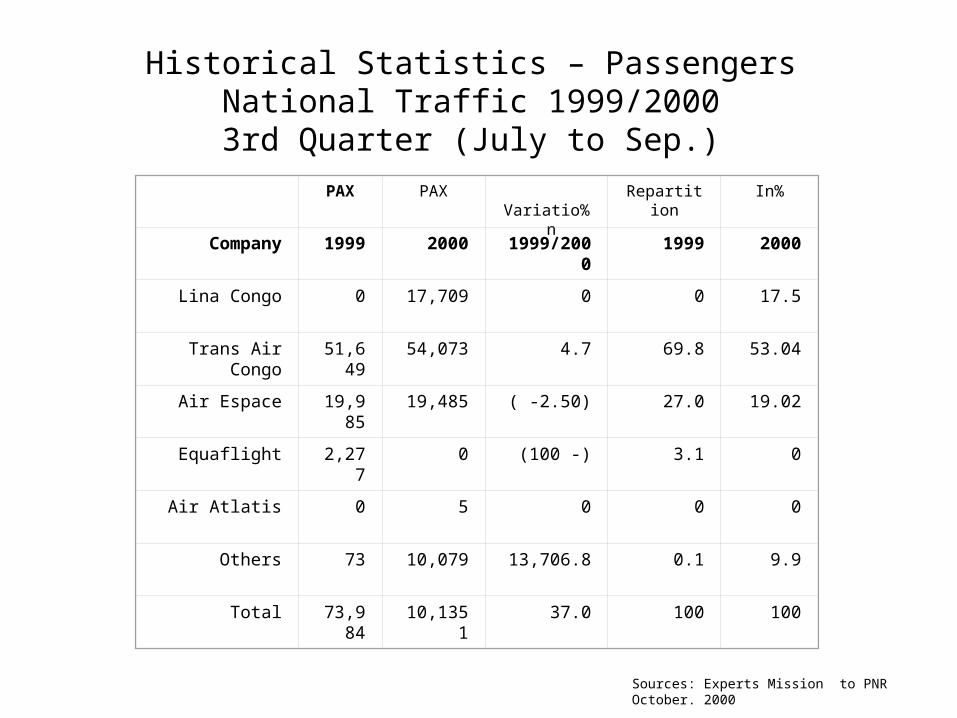
Historical Statistics – Passengers National Traffic 1999/2000
3rd Quarter (July to Sep.) PAX PAX % Variation Repartition % In
Company 1999 2000 1999/2000
1999 2000
Lina Congo 0 17,709 0 0 17.5
Trans Air Congo 51,649
54,073 4.7 69.8 53.04
Air Espace 19,985
19,485 (2.50) - 27.0 19.02
Equaflight 2,277 0 -(100) 3.1 0
Air Atlatis 0 5 0 0 0
Others 73 10,079 13,706.8 0.1 9.9
Total 73,984
10,1351
37.0 100 100
Sources: Experts Mission to PNR October. 2000
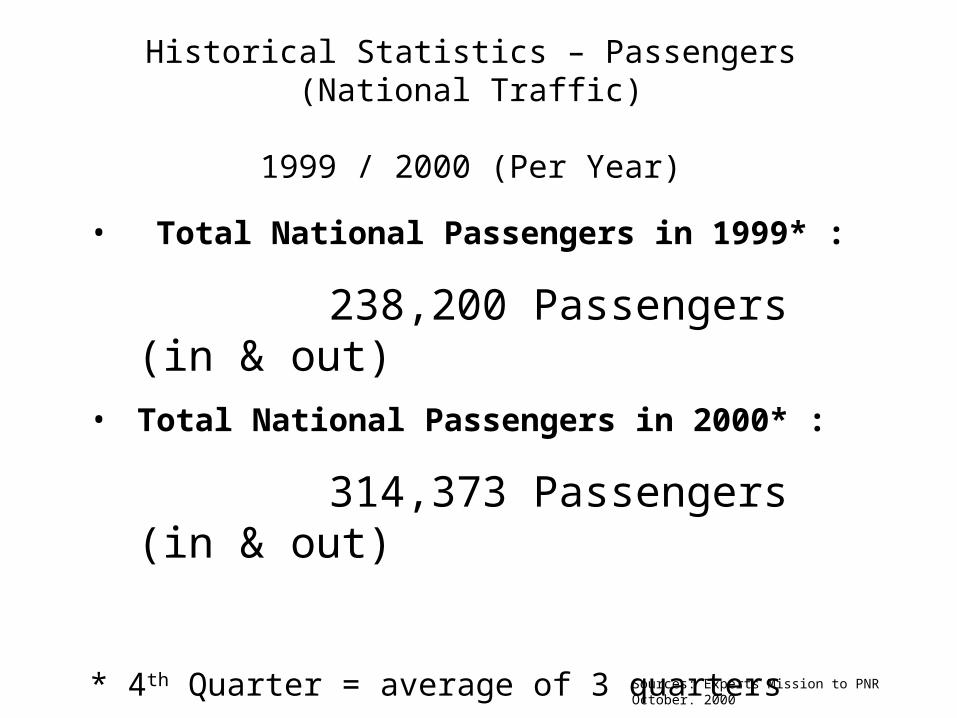
Historical Statistics – Passengers (National Traffic)
1999 / 2000 (Per Year)
• Total National Passengers in 1999* :
238,200 Passengers (in & out)• Total National Passengers in 2000* :
314,373 Passengers (in & out)
* 4th Quarter = average of 3 quarters
Sources: Experts Mission to PNR October. 2000
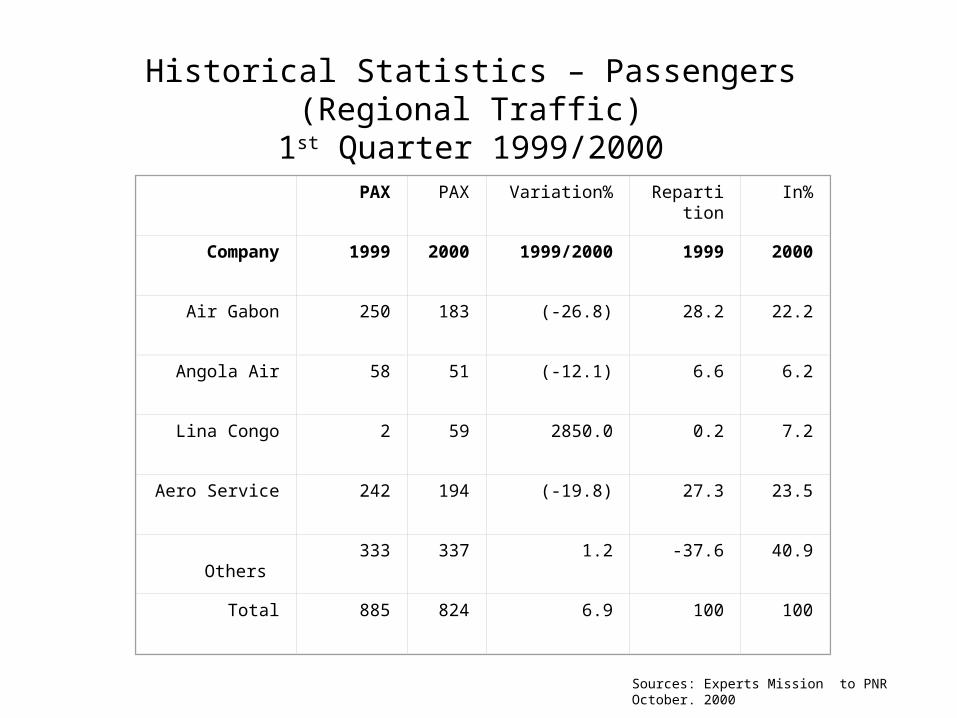
Historical Statistics – Passengers (Regional Traffic)1st Quarter 1999/2000
PAX PAX %Variation Repartition %In
Company 1999 2000
1999/2000 1999 2000
Air Gabon 250 183 (26.8)- 28.2 22.2
Angola Air 58 51 (12.1 )- 6.6 6.2
Lina Congo 2 59 2850.0 0.2 7.2
Aero Service 242 194 (19.8)- 27.3 23.5
Others 333 337 1.2 37.6- 40.9
Total 885 824 6.9 100 100
Sources: Experts Mission to PNR October. 2000
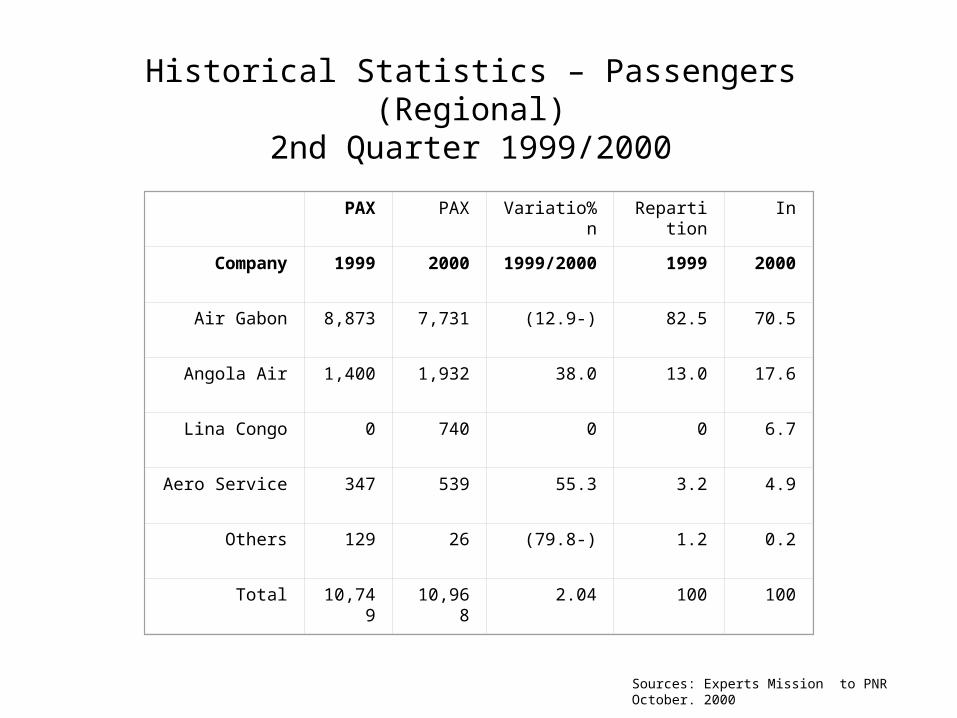
Historical Statistics – Passengers (Regional)2nd Quarter 1999/2000
PAX PAX %Variation Repartition
In
Company 1999 2000 1999/2000
1999 2000
Air Gabon 8,873 7,731 -)12.9( 82.5 70.5
Angola Air 1,400 1,932 38.0 13.0 17.6
Lina Congo 0 740 0 0 6.7
Aero Service 347 539 55.3 3.2 4.9
Others 129 26 -)79.8( 1.2 0.2
Total 10,749 10,968 2.04 100 100
Sources: Experts Mission to PNR October. 2000
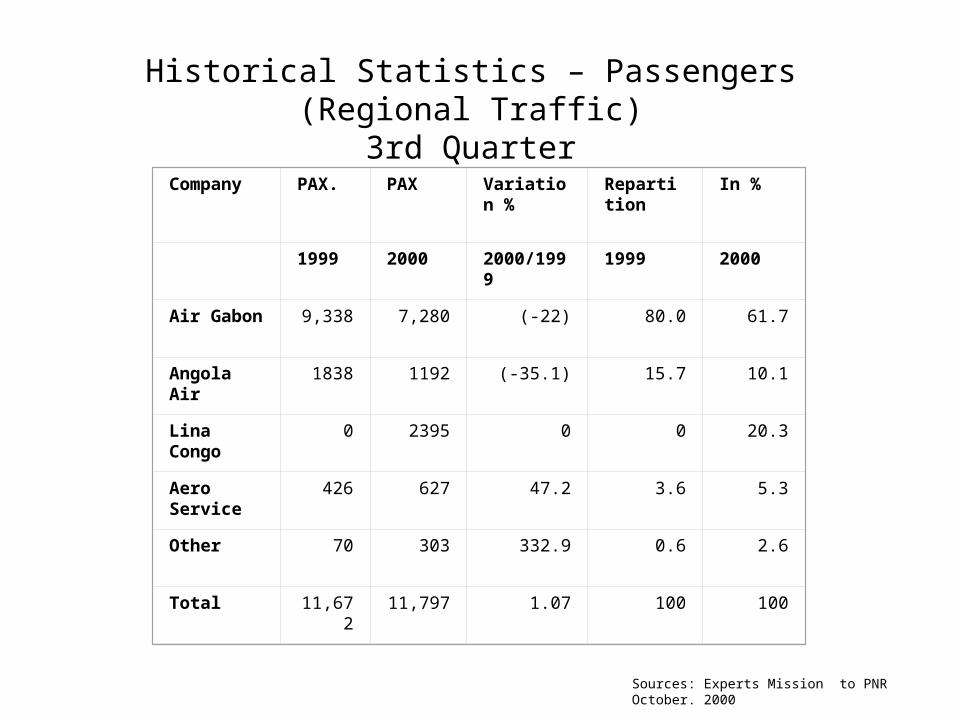
Historical Statistics – Passengers (Regional Traffic)3rd Quarter
Company PAX. PAX Variation %
Repartition
In %
1999 2000 2000/1999 1999 2000
Air Gabon 9,338 7,280 (-22) 80.0 61.7
Angola Air 1838 1192 (-35.1) 15.7 10.1
Lina Congo 0 2395 0 0 20.3
Aero Service 426 627 47.2 3.6 5.3
Other 70 303 332.9 0.6 2.6
Total 11,672 11,797 1.07 100 100
Sources: Experts Mission to PNR October. 2000
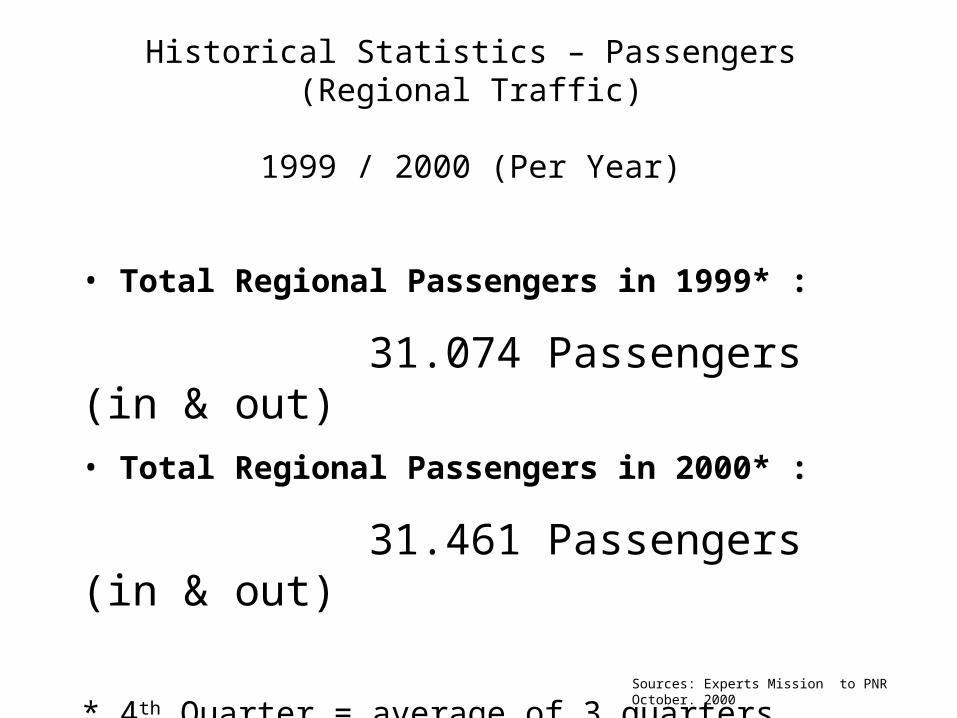
Historical Statistics – Passengers (Regional Traffic)
1999 / 2000 (Per Year)
• Total Regional Passengers in 1999* :
31.074 Passengers (in & out)• Total Regional Passengers in 2000* :
31.461 Passengers (in & out)
* 4th Quarter = average of 3 quarters
Sources: Experts Mission to PNR October. 2000
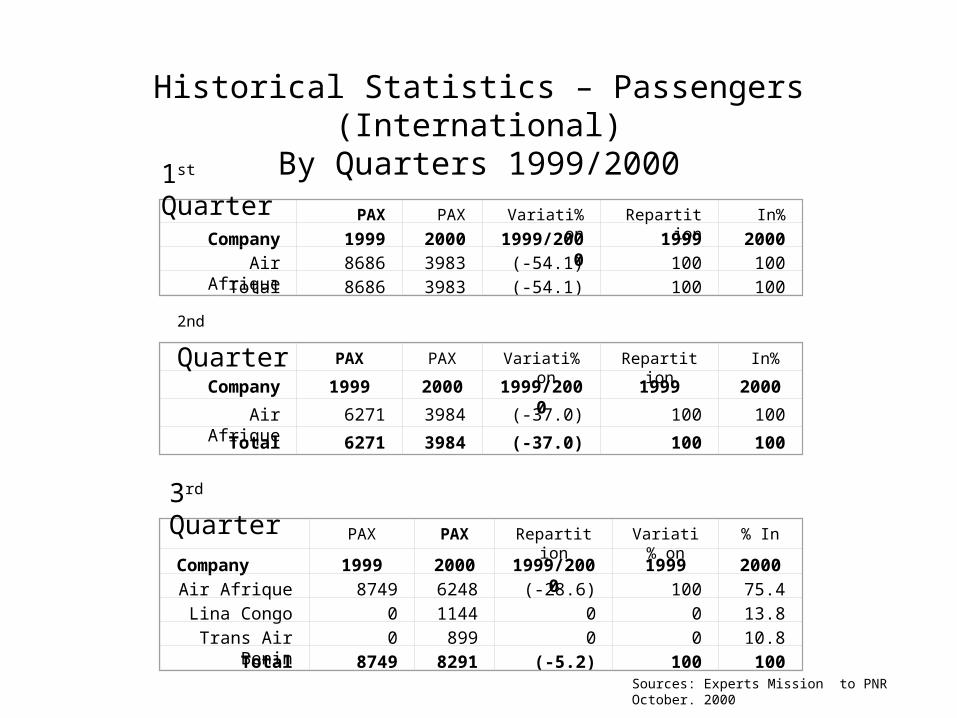
PAX PAX %Variation Repartition %In
Company 1999 2000 1999/2000 1999 2000Air Afrique 8686 3983 (54.1)- 100 100
Total 8686 3983 (54.1)- 100 100
1st Quarter
PAX PAX %Variation Repartition %In
Company 1999 2000 1999/2000 1999 2000Air Afrique 6271 3984 (37.0)- 100 100
Total 6271 3984 (37.0)- 100 100
2nd Quarter
PAX PAX Repartition Variation %
In%
Company 1999 2000
1999/2000
1999 2000Air Afrique 8749 6248 (28.6)- 100 75.4Lina Congo 0 1144 0 0 13.8
Trans Air Benin 0 899 0 0 10.8Total 8749 829
1(5.2)- 100 100
3rd Quarter
Historical Statistics – Passengers (International)By Quarters 1999/2000
Sources: Experts Mission to PNR October. 2000
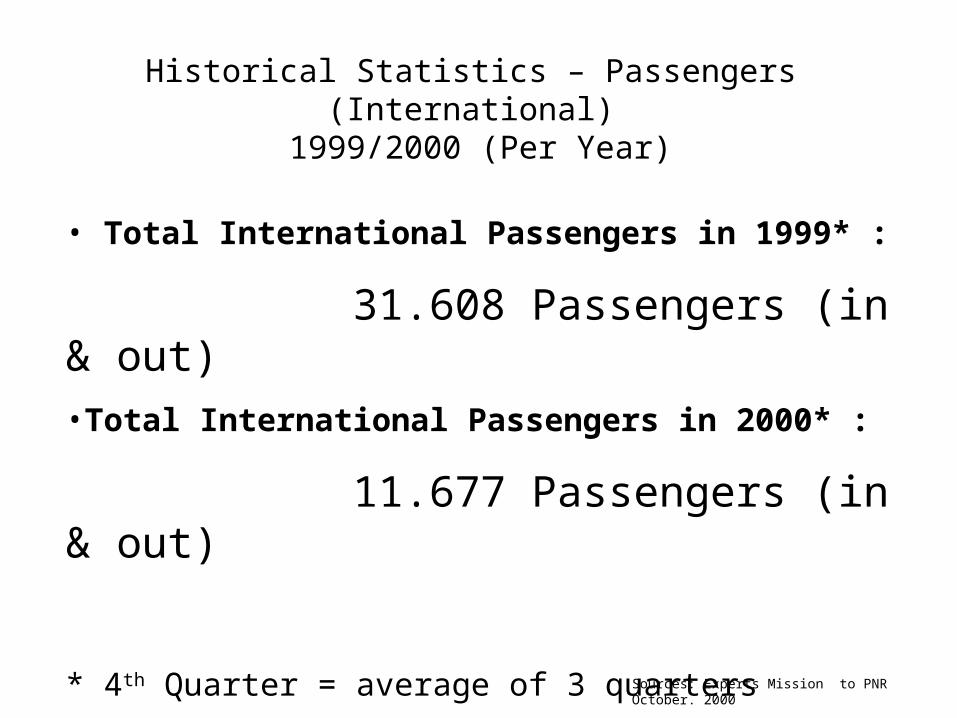
Historical Statistics – Passengers (International) 1999/2000 (Per Year)
• Total International Passengers in 1999* :
31.608 Passengers (in & out)•Total International Passengers in 2000* :
11.677 Passengers (in & out)
* 4th Quarter = average of 3 quarters
Sources: Experts Mission to PNR October. 2000
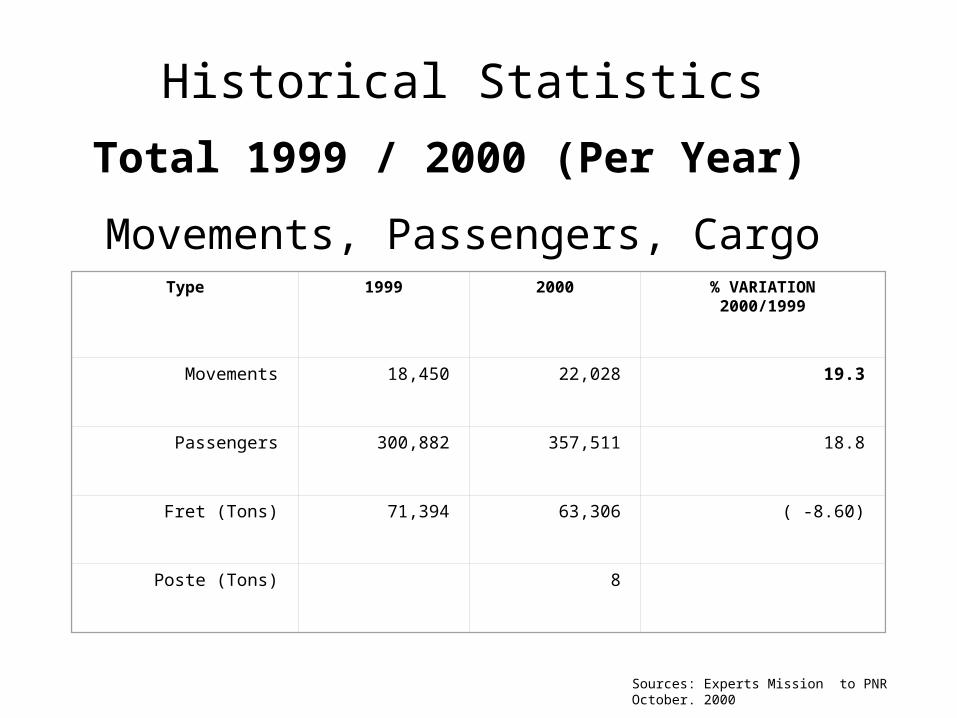
Historical Statistics
Total 1999 / 2000 (Per Year)
Movements, Passengers, CargoType
1999 2000 VARIATION%
2000/1999
Movements 18,450 22,028 19.3
Passengers 300,882 357,511 18.8
Fret (Tons) 71,394 63,306 (8.60) -
Poste (Tons) 8
Sources: Experts Mission to PNR October. 2000
Annual RevenueFirst year of Operation
• The estimated revenue in the first year of operation include:
– The actual level of activity
• combine with
– New commercial development by LR Group
• The estimation is done on the bases of statistical data from year 2000.
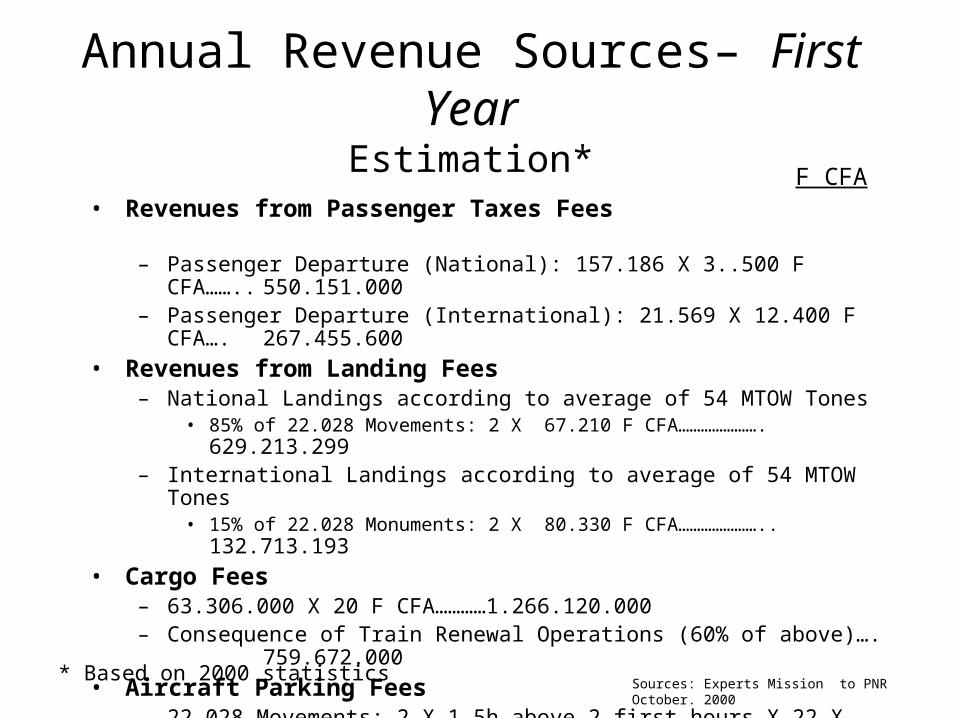
Annual Revenue Sources– First YearEstimation*
* Based on 2000 statistics
F CFA• Revenues from Passenger Taxes Fees
– Passenger Departure (National): 157.186 X 3..500 F CFA…….. 550.151.000– Passenger Departure (International): 21.569 X 12.400 F CFA…. 267.455.600
• Revenues from Landing Fees– National Landings according to average of 54 MTOW Tones
• 85% of 22.028 Movements: 2 X 67.210 F CFA………………….629.213.299
– International Landings according to average of 54 MTOW Tones• 15% of 22.028 Monuments: 2 X 80.330 F CFA…………………..
132.713.193
• Cargo Fees– 63.306.000 X 20 F CFA…………1.266.120.000– Consequence of Train Renewal Operations (60% of above)…. 759.672.000
• Aircraft Parking Fees– 22.028 Movements: 2 X 1.5h above 2 first hours X 22 X 120 F CFA
43.615.440
• Gasoline Passage Fees– 22.028 movements: 2 X 5.000 galloons X 1.36 F CFA………….. 74.895.200Sources: Experts Mission to PNR October.
2000
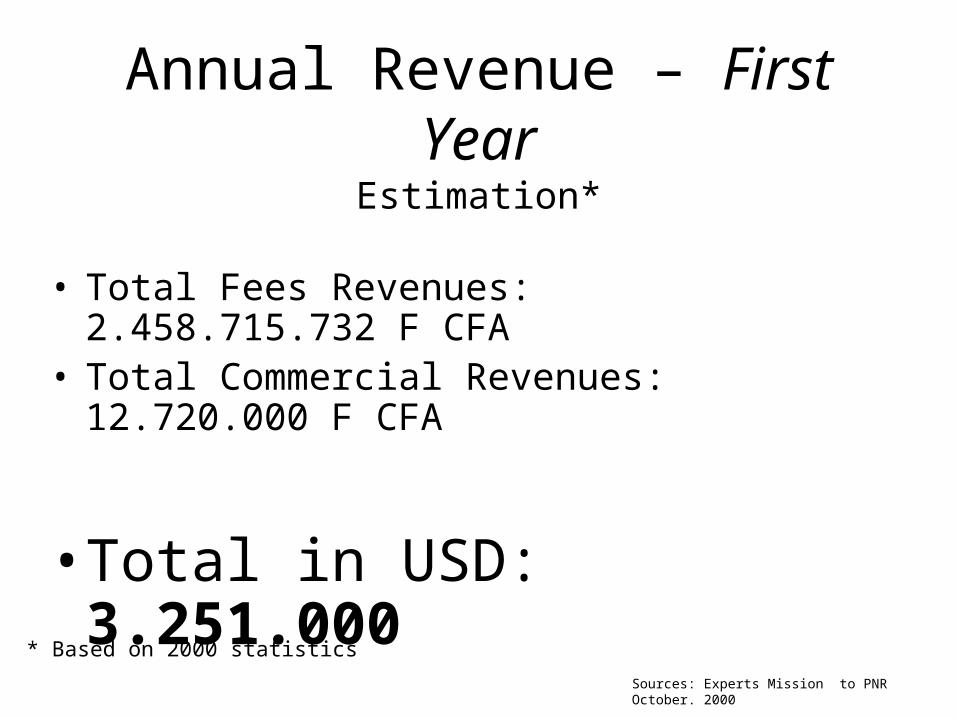
Annual Revenue – First YearEstimation*
* Based on 2000 statistics
• Total Fees Revenues: 2.458.715.732 F CFA
• Total Commercial Revenues: 12.720.000 F CFA
• Total in USD:3.251.000
Sources: Experts Mission to PNR October. 2000
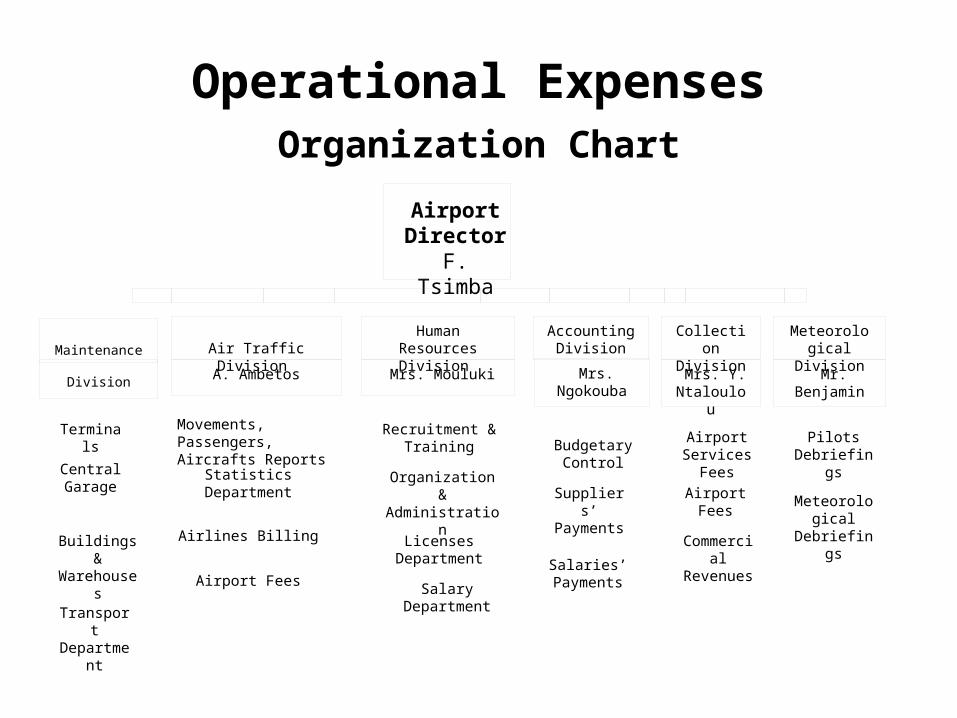
Operational ExpensesOrganization Chart
Terminals Movements, Passengers,
Aircrafts Reports Recruitment &
Training
Budgetary
Control
Airport Services
Fees
Pilots
Debriefings Central Garage
Statistics Department Organization & Administration
Suppliers’ Payments
Airport
Fees
Meteorological Debriefings
Buildings & Warehouses
Airlines Billing Licenses Department
Salaries’ Payments
Commercial Revenues
Transport Department
Airport Fees
Salary Department
Airport DirectorF. Tsimba
Maintenance
Division
Air Traffic Division
Human Resources Division
Accounting Division
Collection Division
Meteorological Division
A. Ambetos Mrs. Mouluki Mrs. Ngokouba
Mrs. Y. Ntaloulou
Mr. Benjamin
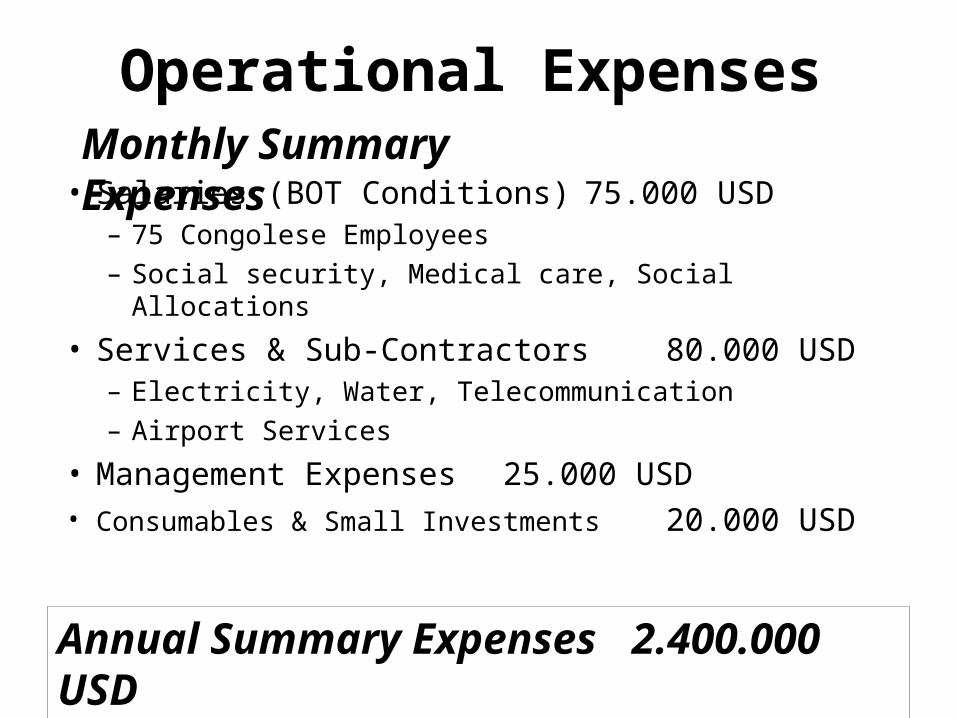
Operational Expenses
• Salaries (BOT Conditions) 75.000 USD– 75 Congolese Employees– Social security, Medical care, Social Allocations
• Services & Sub-Contractors 80.000 USD– Electricity, Water, Telecommunication– Airport Services
• Management Expenses 25.000 USD• Consumables & Small Investments 20.000 USD
Monthly Summary Expenses
Annual Summary Expenses 2.400.000 USD
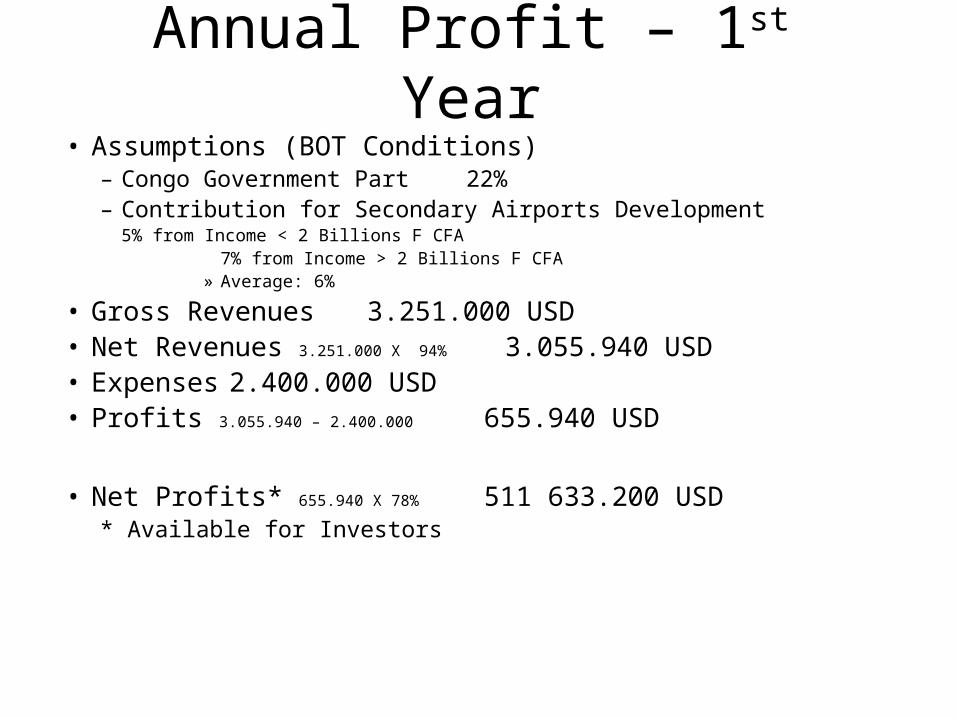
Annual Profit – 1st Year• Assumptions (BOT Conditions)
– Congo Government Part 22%– Contribution for Secondary Airports Development
5% from Income < 2 Billions F CFA7% from Income > 2 Billions F CFA
» Average: 6%
• Gross Revenues 3.251.000 USD• Net Revenues 3.251.000 X 94% 3.055.940 USD• Expenses 2.400.000 USD• Profits 3.055.940 – 2.400.000 655.940 USD
• Net Profits* 655.940 X 78% 511 633.200 USD* Available for Investors
Cash Flow
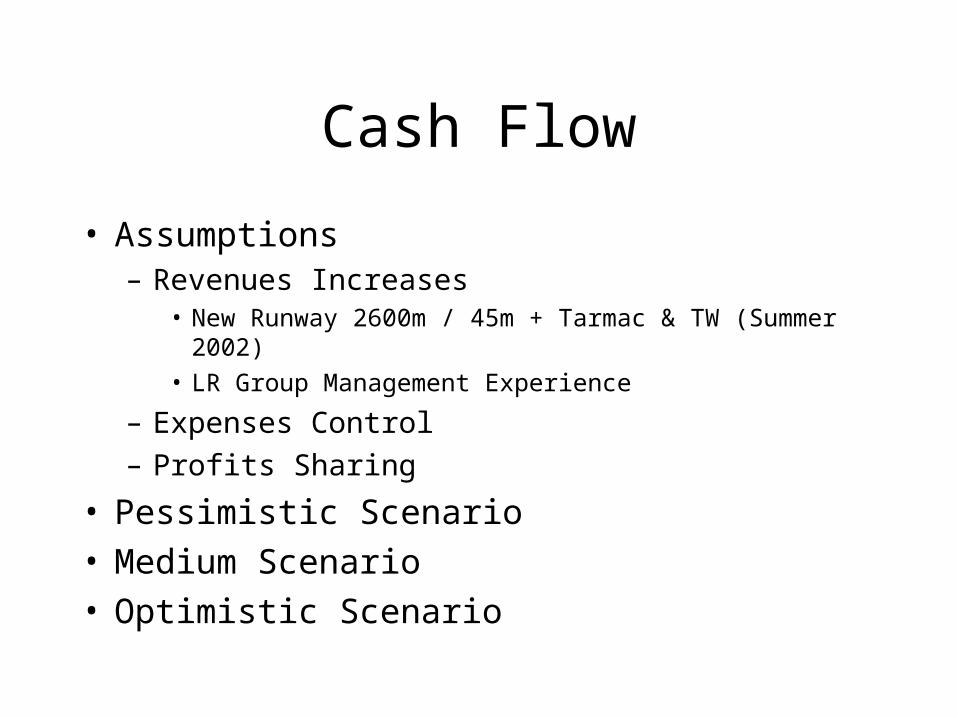
• Assumptions– Revenues Increases
• New Runway 2600m / 45m + Tarmac & TW (Summer 2002)
• LR Group Management Experience
– Expenses Control
– Profits Sharing
• Pessimistic Scenario• Medium Scenario• Optimistic Scenario
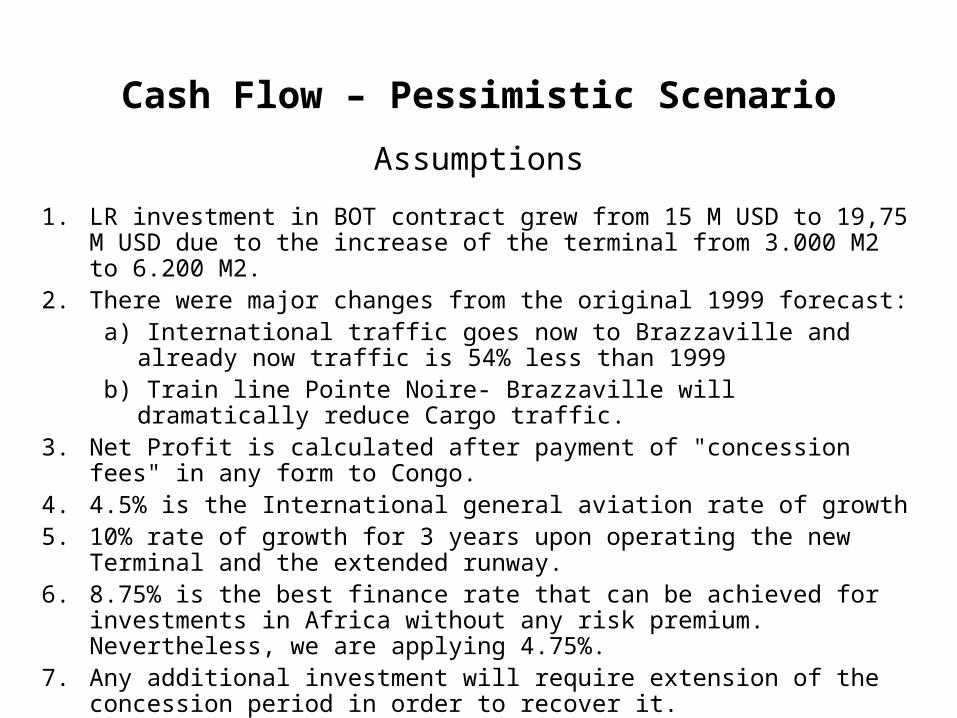
Cash Flow – Pessimistic Scenario
Assumptions
1. LR investment in BOT contract grew from 15 M USD to 19,75 M USD due to the increase of the terminal from 3.000 M2 to 6.200 M2.
2. There were major changes from the original 1999 forecast: a) International traffic goes now to Brazzaville and already now traffic is 54%
less than 1999 b) Train line Pointe Noire- Brazzaville will dramatically reduce Cargo traffic.
3. Net Profit is calculated after payment of "concession fees" in any form to Congo.
4. 4.5% is the International general aviation rate of growth5. 10% rate of growth for 3 years upon operating the new Terminal and the
extended runway.6. 8.75% is the best finance rate that can be achieved for investments in Africa
without any risk premium. Nevertheless, we are applying 4.75%.7. Any additional investment will require extension of the concession period in
order to recover it.
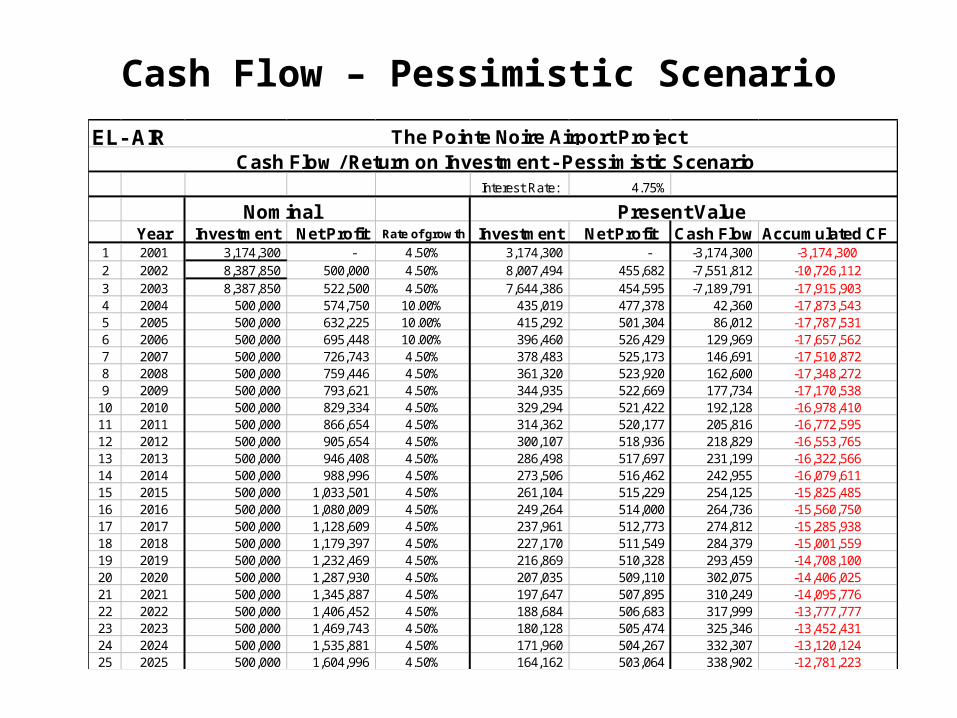
Cash Flow – Pessimistic Scenario
Interest Rate: 4.75%
Year Investment Net Profit Rate of growth Investment Net Profit Cash Flow Accumulated CF1 2001 3,174,300 - 4.50% 3,174,300 - -3,174,300 -3,174,300 2 2002 8,387,850 500,000 4.50% 8,007,494 455,682 -7,551,812 -10,726,112 3 2003 8,387,850 522,500 4.50% 7,644,386 454,595 -7,189,791 -17,915,903 4 2004 500,000 574,750 10.00% 435,019 477,378 42,360 -17,873,543 5 2005 500,000 632,225 10.00% 415,292 501,304 86,012 -17,787,531 6 2006 500,000 695,448 10.00% 396,460 526,429 129,969 -17,657,562 7 2007 500,000 726,743 4.50% 378,483 525,173 146,691 -17,510,872 8 2008 500,000 759,446 4.50% 361,320 523,920 162,600 -17,348,272 9 2009 500,000 793,621 4.50% 344,935 522,669 177,734 -17,170,538
10 2010 500,000 829,334 4.50% 329,294 521,422 192,128 -16,978,410 11 2011 500,000 866,654 4.50% 314,362 520,177 205,816 -16,772,595 12 2012 500,000 905,654 4.50% 300,107 518,936 218,829 -16,553,765 13 2013 500,000 946,408 4.50% 286,498 517,697 231,199 -16,322,566 14 2014 500,000 988,996 4.50% 273,506 516,462 242,955 -16,079,611 15 2015 500,000 1,033,501 4.50% 261,104 515,229 254,125 -15,825,485 16 2016 500,000 1,080,009 4.50% 249,264 514,000 264,736 -15,560,750 17 2017 500,000 1,128,609 4.50% 237,961 512,773 274,812 -15,285,938 18 2018 500,000 1,179,397 4.50% 227,170 511,549 284,379 -15,001,559 19 2019 500,000 1,232,469 4.50% 216,869 510,328 293,459 -14,708,100 20 2020 500,000 1,287,930 4.50% 207,035 509,110 302,075 -14,406,025 21 2021 500,000 1,345,887 4.50% 197,647 507,895 310,249 -14,095,776 22 2022 500,000 1,406,452 4.50% 188,684 506,683 317,999 -13,777,777 23 2023 500,000 1,469,743 4.50% 180,128 505,474 325,346 -13,452,431 24 2024 500,000 1,535,881 4.50% 171,960 504,267 332,307 -13,120,124 25 2025 500,000 1,604,996 4.50% 164,162 503,064 338,902 -12,781,223
EL- AIR The Pointe Noire Airport Project Cash Flow / Return on Investment - Pessimistic Scenario
Nominal Present Value
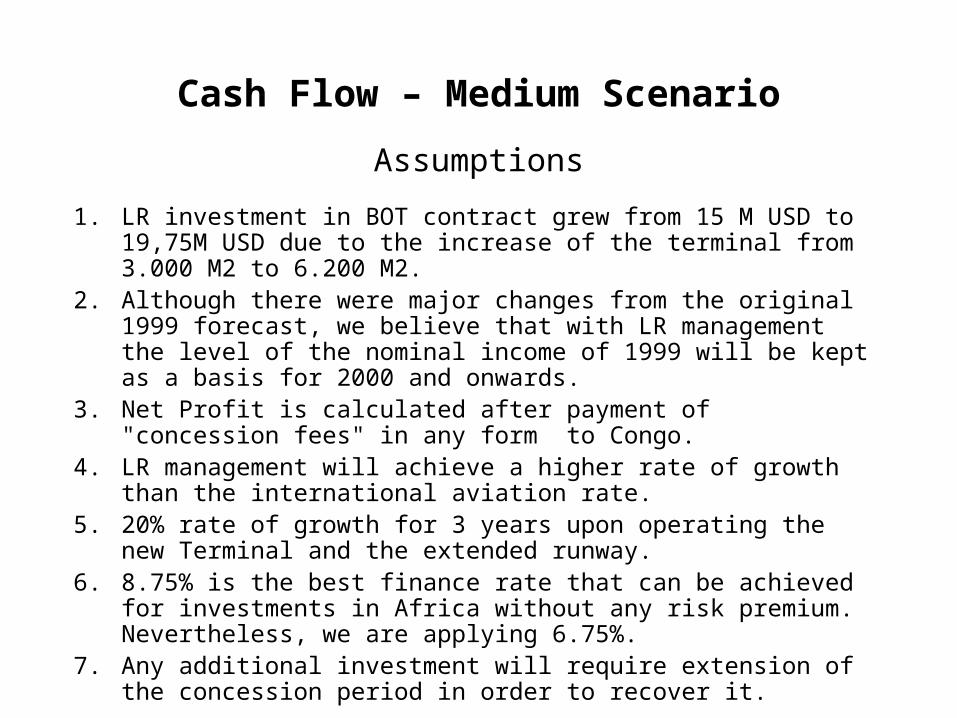
Cash Flow – Medium Scenario
Assumptions
1. LR investment in BOT contract grew from 15 M USD to 19,75M USD due to the increase of the terminal from 3.000 M2 to 6.200 M2.
2. Although there were major changes from the original 1999 forecast, we believe that with LR management the level of the nominal income of 1999 will be kept as a basis for 2000 and onwards.
3. Net Profit is calculated after payment of "concession fees" in any form to Congo.
4. LR management will achieve a higher rate of growth than the international aviation rate.
5. 20% rate of growth for 3 years upon operating the new Terminal and the extended runway.
6. 8.75% is the best finance rate that can be achieved for investments in Africa without any risk premium. Nevertheless, we are applying 6.75%.
7. Any additional investment will require extension of the concession period in order to recover it.
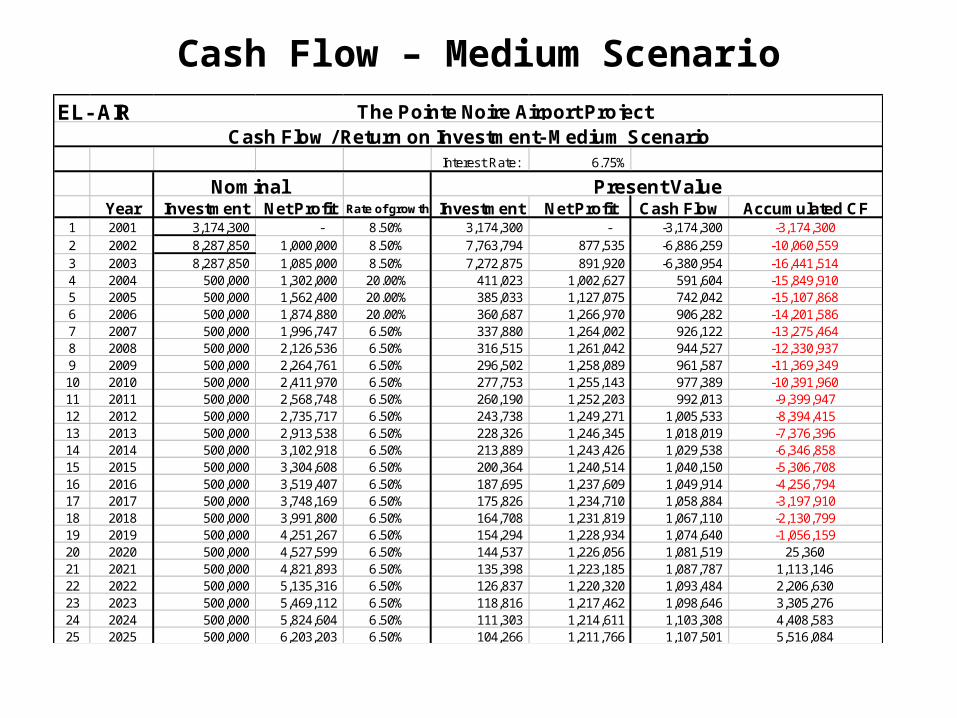
Cash Flow – Medium Scenario
Interest Rate: 6.75%
Year Investment Net Profit Rate of growth Investment Net Profit Cash Flow Accumulated CF1 2001 3,174,300 - 8.50% 3,174,300 - -3,174,300 -3,174,300 2 2002 8,287,850 1,000,000 8.50% 7,763,794 877,535 -6,886,259 -10,060,559 3 2003 8,287,850 1,085,000 8.50% 7,272,875 891,920 -6,380,954 -16,441,514 4 2004 500,000 1,302,000 20.00% 411,023 1,002,627 591,604 -15,849,910 5 2005 500,000 1,562,400 20.00% 385,033 1,127,075 742,042 -15,107,868 6 2006 500,000 1,874,880 20.00% 360,687 1,266,970 906,282 -14,201,586 7 2007 500,000 1,996,747 6.50% 337,880 1,264,002 926,122 -13,275,464 8 2008 500,000 2,126,536 6.50% 316,515 1,261,042 944,527 -12,330,937 9 2009 500,000 2,264,761 6.50% 296,502 1,258,089 961,587 -11,369,349 10 2010 500,000 2,411,970 6.50% 277,753 1,255,143 977,389 -10,391,960 11 2011 500,000 2,568,748 6.50% 260,190 1,252,203 992,013 -9,399,947 12 2012 500,000 2,735,717 6.50% 243,738 1,249,271 1,005,533 -8,394,415 13 2013 500,000 2,913,538 6.50% 228,326 1,246,345 1,018,019 -7,376,396 14 2014 500,000 3,102,918 6.50% 213,889 1,243,426 1,029,538 -6,346,858 15 2015 500,000 3,304,608 6.50% 200,364 1,240,514 1,040,150 -5,306,708 16 2016 500,000 3,519,407 6.50% 187,695 1,237,609 1,049,914 -4,256,794 17 2017 500,000 3,748,169 6.50% 175,826 1,234,710 1,058,884 -3,197,910 18 2018 500,000 3,991,800 6.50% 164,708 1,231,819 1,067,110 -2,130,799 19 2019 500,000 4,251,267 6.50% 154,294 1,228,934 1,074,640 -1,056,159 20 2020 500,000 4,527,599 6.50% 144,537 1,226,056 1,081,519 25,36021 2021 500,000 4,821,893 6.50% 135,398 1,223,185 1,087,787 1,113,14622 2022 500,000 5,135,316 6.50% 126,837 1,220,320 1,093,484 2,206,63023 2023 500,000 5,469,112 6.50% 118,816 1,217,462 1,098,646 3,305,27624 2024 500,000 5,824,604 6.50% 111,303 1,214,611 1,103,308 4,408,58325 2025 500,000 6,203,203 6.50% 104,266 1,211,766 1,107,501 5,516,084
EL- AIR The Pointe Noire Airport ProjectCash Flow / Return on Investment- Medium Scenario
Nominal Present Value
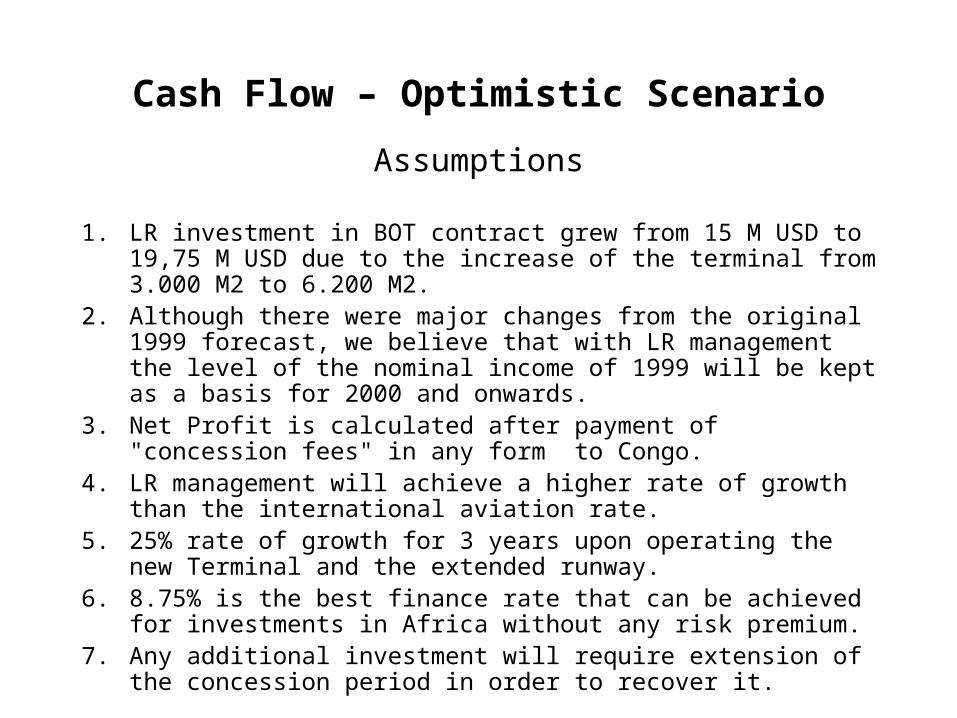
Cash Flow – Optimistic Scenario
Assumptions
1. LR investment in BOT contract grew from 15 M USD to 19,75 M USD due to the increase of the terminal from 3.000 M2 to 6.200 M2.
2. Although there were major changes from the original 1999 forecast, we believe that with LR management the level of the nominal income of 1999 will be kept as a basis for 2000 and onwards.
3. Net Profit is calculated after payment of "concession fees" in any form to Congo.
4. LR management will achieve a higher rate of growth than the international aviation rate.
5. 25% rate of growth for 3 years upon operating the new Terminal and the extended runway.
6. 8.75% is the best finance rate that can be achieved for investments in Africa without any risk premium.
7. Any additional investment will require extension of the concession period in order to recover it.
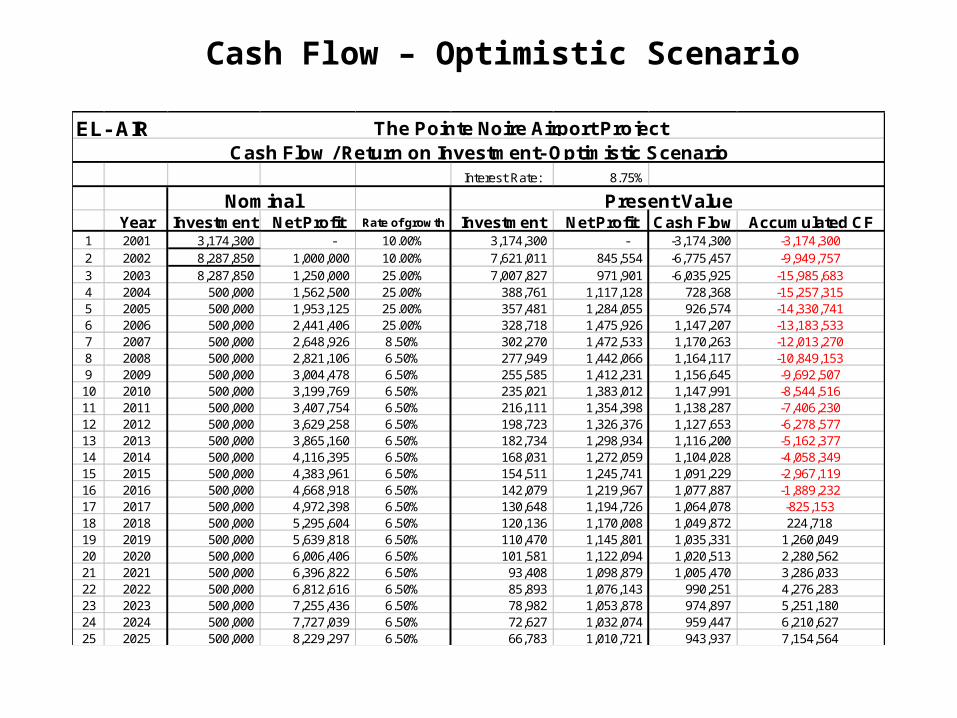
Cash Flow – Optimistic Scenario
Interest Rate: 8.75%
Year Investment Net Profit Rate of growth Investment Net Profit Cash Flow Accumulated CF1 2001 3,174,300 - 10.00% 3,174,300 - -3,174,300 -3,174,300 2 2002 8,287,850 1,000,000 10.00% 7,621,011 845,554 -6,775,457 -9,949,757 3 2003 8,287,850 1,250,000 25.00% 7,007,827 971,901 -6,035,925 -15,985,683 4 2004 500,000 1,562,500 25.00% 388,761 1,117,128 728,368 -15,257,315 5 2005 500,000 1,953,125 25.00% 357,481 1,284,055 926,574 -14,330,741 6 2006 500,000 2,441,406 25.00% 328,718 1,475,926 1,147,207 -13,183,533 7 2007 500,000 2,648,926 8.50% 302,270 1,472,533 1,170,263 -12,013,270 8 2008 500,000 2,821,106 6.50% 277,949 1,442,066 1,164,117 -10,849,153 9 2009 500,000 3,004,478 6.50% 255,585 1,412,231 1,156,645 -9,692,507 10 2010 500,000 3,199,769 6.50% 235,021 1,383,012 1,147,991 -8,544,516 11 2011 500,000 3,407,754 6.50% 216,111 1,354,398 1,138,287 -7,406,230 12 2012 500,000 3,629,258 6.50% 198,723 1,326,376 1,127,653 -6,278,577 13 2013 500,000 3,865,160 6.50% 182,734 1,298,934 1,116,200 -5,162,377 14 2014 500,000 4,116,395 6.50% 168,031 1,272,059 1,104,028 -4,058,349 15 2015 500,000 4,383,961 6.50% 154,511 1,245,741 1,091,229 -2,967,119 16 2016 500,000 4,668,918 6.50% 142,079 1,219,967 1,077,887 -1,889,232 17 2017 500,000 4,972,398 6.50% 130,648 1,194,726 1,064,078 -825,153 18 2018 500,000 5,295,604 6.50% 120,136 1,170,008 1,049,872 224,71819 2019 500,000 5,639,818 6.50% 110,470 1,145,801 1,035,331 1,260,04920 2020 500,000 6,006,406 6.50% 101,581 1,122,094 1,020,513 2,280,56221 2021 500,000 6,396,822 6.50% 93,408 1,098,879 1,005,470 3,286,03322 2022 500,000 6,812,616 6.50% 85,893 1,076,143 990,251 4,276,28323 2023 500,000 7,255,436 6.50% 78,982 1,053,878 974,897 5,251,18024 2024 500,000 7,727,039 6.50% 72,627 1,032,074 959,447 6,210,62725 2025 500,000 8,229,297 6.50% 66,783 1,010,721 943,937 7,154,564
EL- AIR The Pointe Noire Airport ProjectCash Flow / Return on Investment- Optimistic Scenario
Nominal Present Value
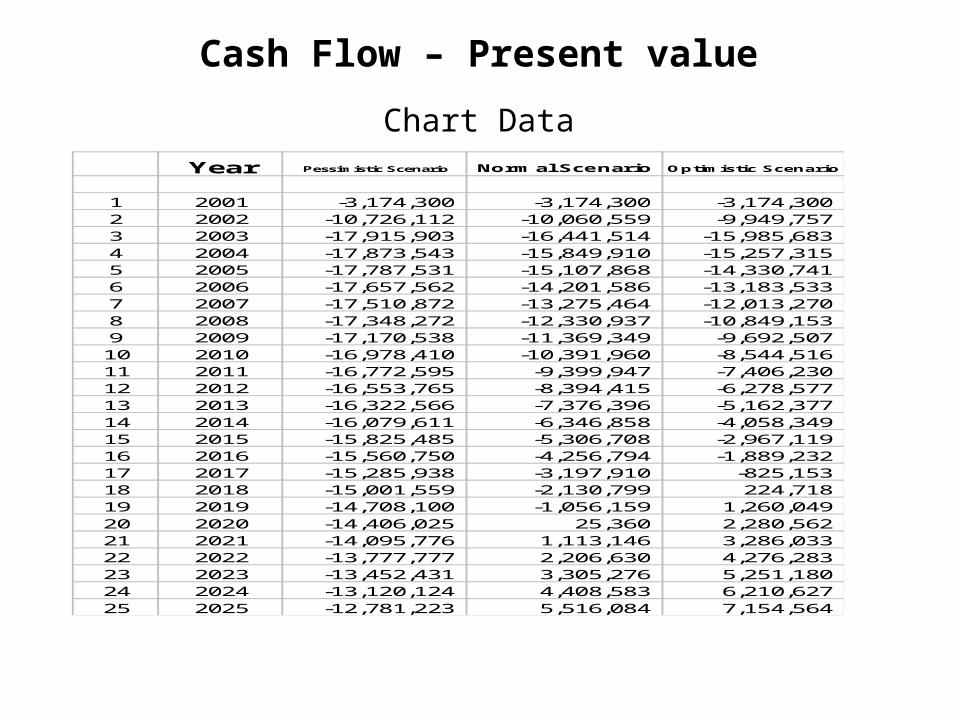
Cash Flow – Present value
Chart DataYear Pessimistic Scenario Normal Scenario Optimistic Scenario
1 2001 -3,174,300 -3,174,300 -3,174,300 2 2002 -10,726,112 -10,060,559 -9,949,757 3 2003 -17,915,903 -16,441,514 -15,985,683 4 2004 -17,873,543 -15,849,910 -15,257,315 5 2005 -17,787,531 -15,107,868 -14,330,741 6 2006 -17,657,562 -14,201,586 -13,183,533 7 2007 -17,510,872 -13,275,464 -12,013,270 8 2008 -17,348,272 -12,330,937 -10,849,153 9 2009 -17,170,538 -11,369,349 -9,692,507 10 2010 -16,978,410 -10,391,960 -8,544,516 11 2011 -16,772,595 -9,399,947 -7,406,230 12 2012 -16,553,765 -8,394,415 -6,278,577 13 2013 -16,322,566 -7,376,396 -5,162,377 14 2014 -16,079,611 -6,346,858 -4,058,349 15 2015 -15,825,485 -5,306,708 -2,967,119 16 2016 -15,560,750 -4,256,794 -1,889,232 17 2017 -15,285,938 -3,197,910 -825,153 18 2018 -15,001,559 -2,130,799 224,718 19 2019 -14,708,100 -1,056,159 1,260,049 20 2020 -14,406,025 25,360 2,280,562 21 2021 -14,095,776 1,113,146 3,286,033 22 2022 -13,777,777 2,206,630 4,276,283 23 2023 -13,452,431 3,305,276 5,251,180 24 2024 -13,120,124 4,408,583 6,210,627 25 2025 -12,781,223 5,516,084 7,154,564
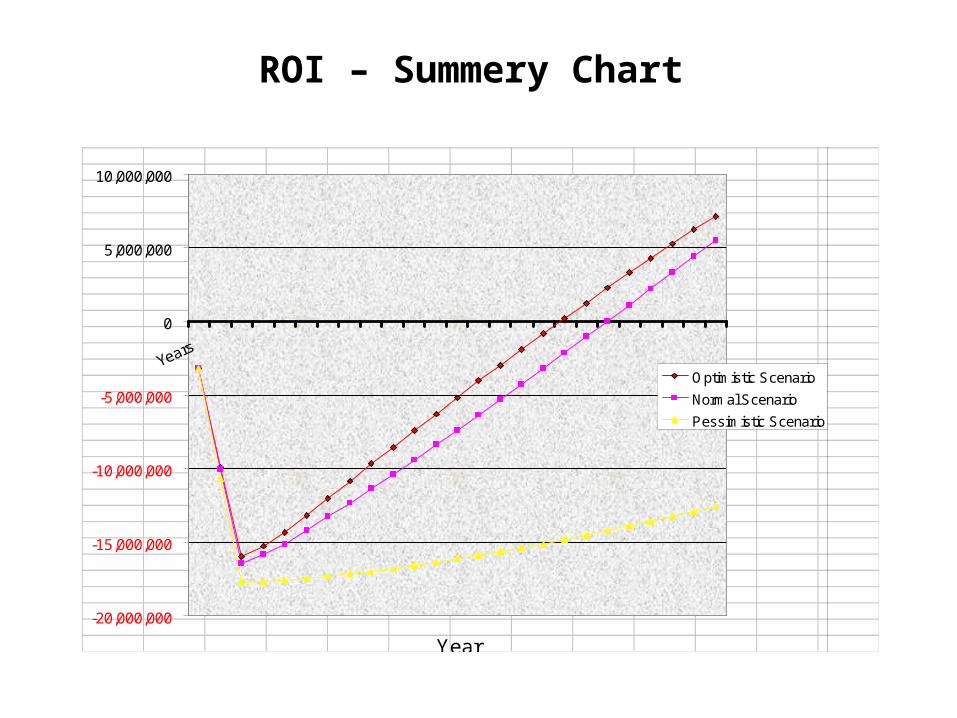
ROI – Summery ChartScenario Summary Chart
-20,000,000
-15,000,000
-10,000,000
-5,000,000
0
5,000,000
10,000,000
Years
Year
Pre
sen
t V
alu
e U
S $
Optimistic Scenario
Normal Scenario
Pessimistic Scenario
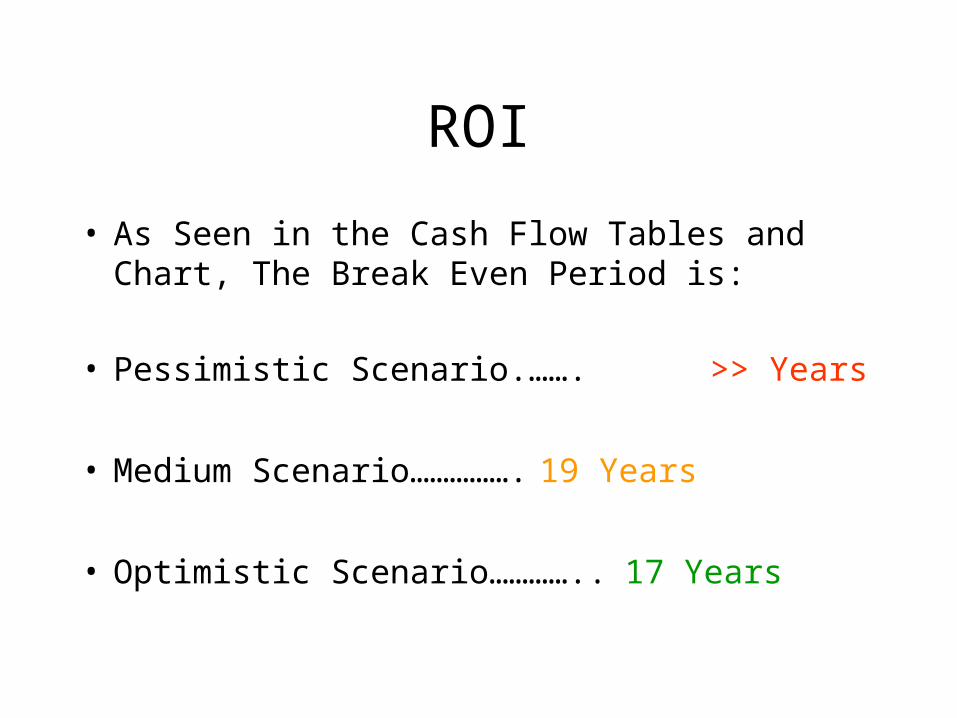
ROI
• As Seen in the Cash Flow Tables and Chart, The Break Even Period is:
• Pessimistic Scenario.……. >> Years
• Medium Scenario……………. 19 Years
• Optimistic Scenario………….. 17 Years
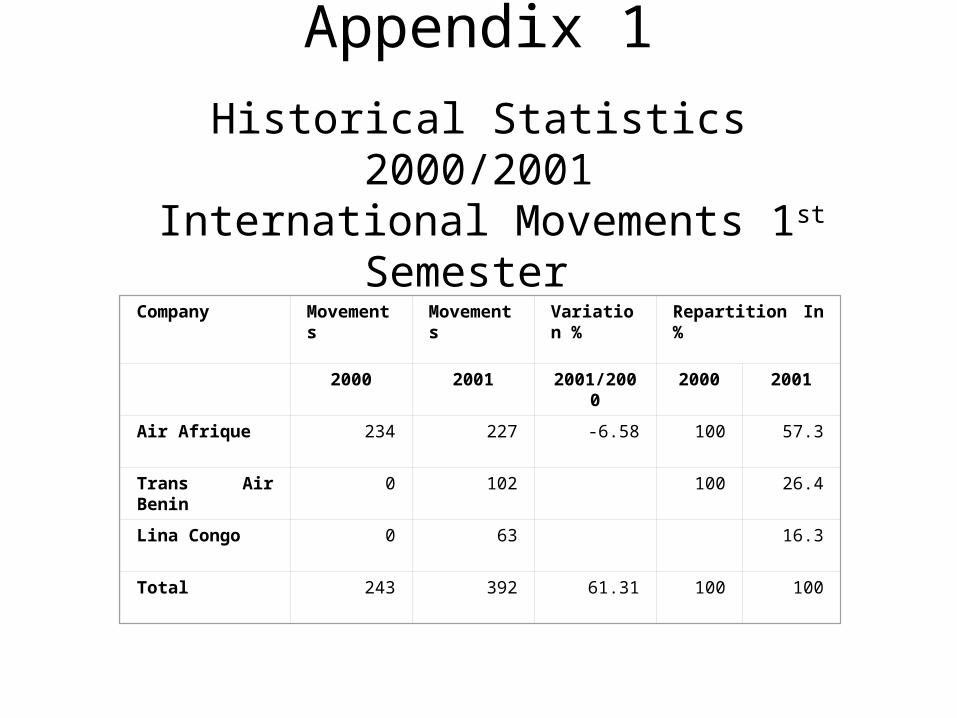
Appendix 1
Historical Statistics2000/2001
International Movements 1st Semester Company Movements Movements Variation
%Repartition In %
2000 2001 2001/2000 2000 2001
Air Afrique 234 227 -6.58 100 57.3
Trans Air Benin 0 102 100 26.4
Lina Congo 0 63 16.3
Total 243 392 61.31 100 100
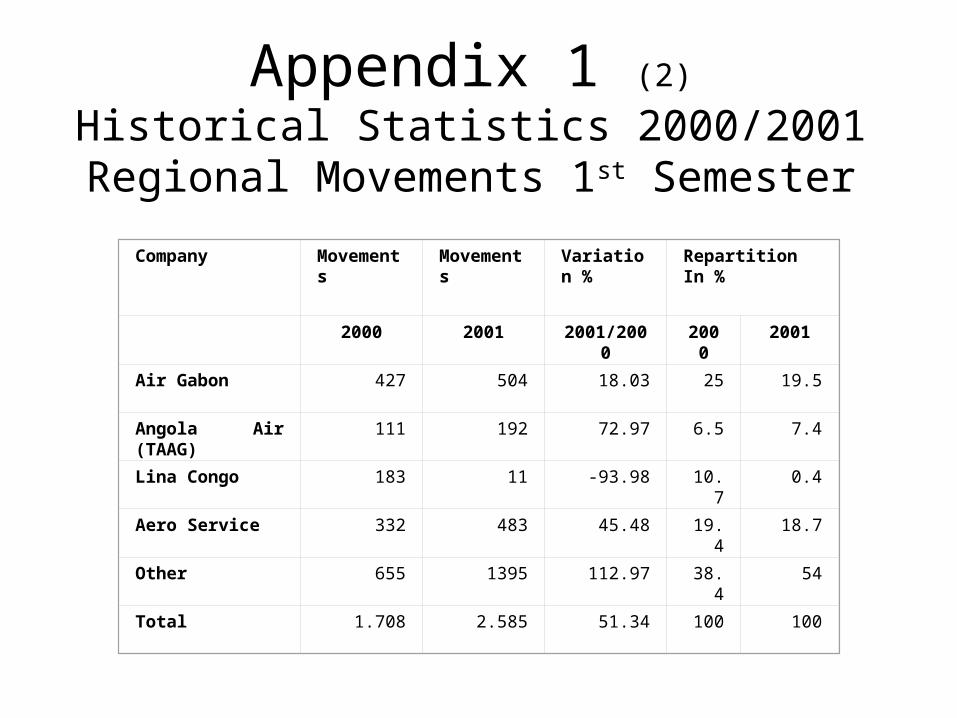
Appendix 1 (2)
Historical Statistics 2000/2001Regional Movements 1st Semester
Company Movements Movements Variation %
Repartition In %
2000 2001 2001/2000 2000 2001
Air Gabon 427 504 18.03 25 19.5
Angola Air (TAAG) 111 192 72.97 6.5 7.4
Lina Congo 183 11 -93.98 10.7 0.4
Aero Service 332 483 45.48 19.4 18.7
Other 655 1395 112.97 38.4 54
Total 1.708 2.585 51.34 100 100
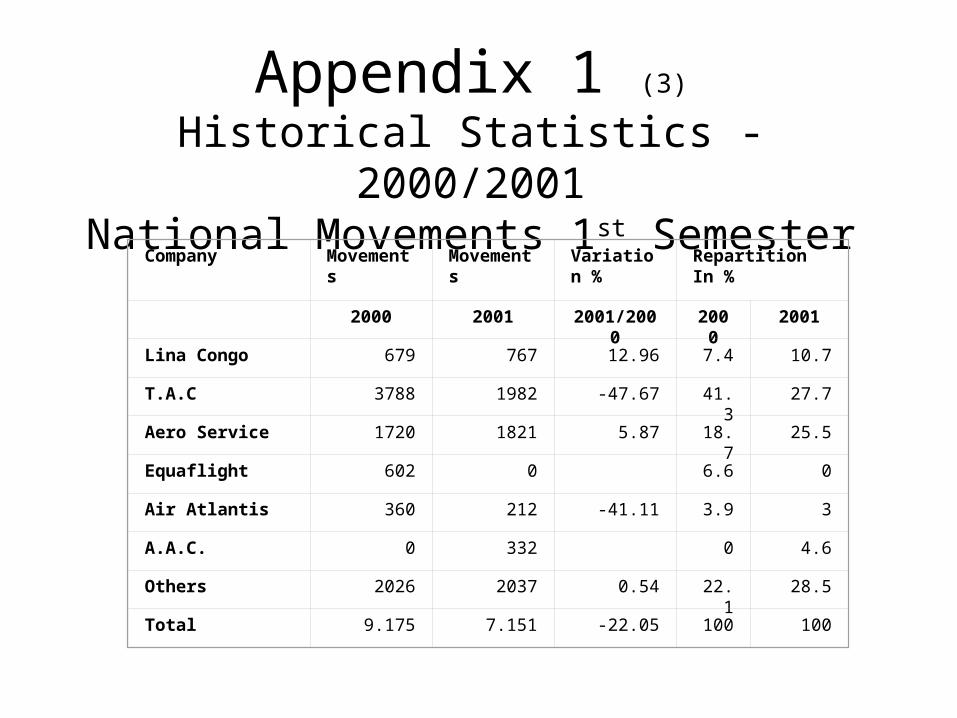
Appendix 1 (3)
Historical Statistics - 2000/2001National Movements 1st Semester
Company Movements Movements Variation %
Repartition In %
2000 2001 2001/2000 2000 2001
Lina Congo 679 767 12.96 7.4 10.7
T.A.C 3788 1982 -47.67 41.3 27.7
Aero Service 1720 1821 5.87 18.7 25.5
Equaflight 602 0 6.6 0
Air Atlantis 360 212 -41.11 3.9 3
A.A.C. 0 332 0 4.6
Others 2026 2037 0.54 22.1 28.5
Total 9.175 7.151 -22.05 100 100
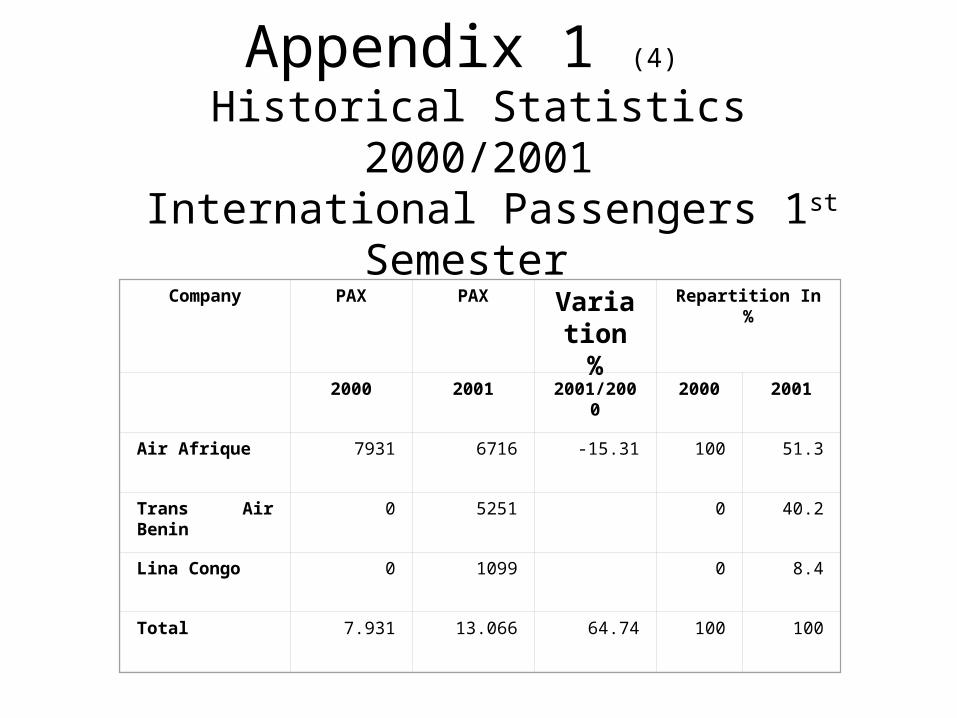
Appendix 1 (4) Historical Statistics
2000/2001 International Passengers 1st Semester
Company PAX PAX Variation %
Repartition In %
2000 2001 2001/2000 2000 2001
Air Afrique 7931 6716 -15.31 100 51.3
Trans Air Benin 0 5251 0 40.2
Lina Congo 0 1099 0 8.4
Total 7.931 13.066 64.74 100 100
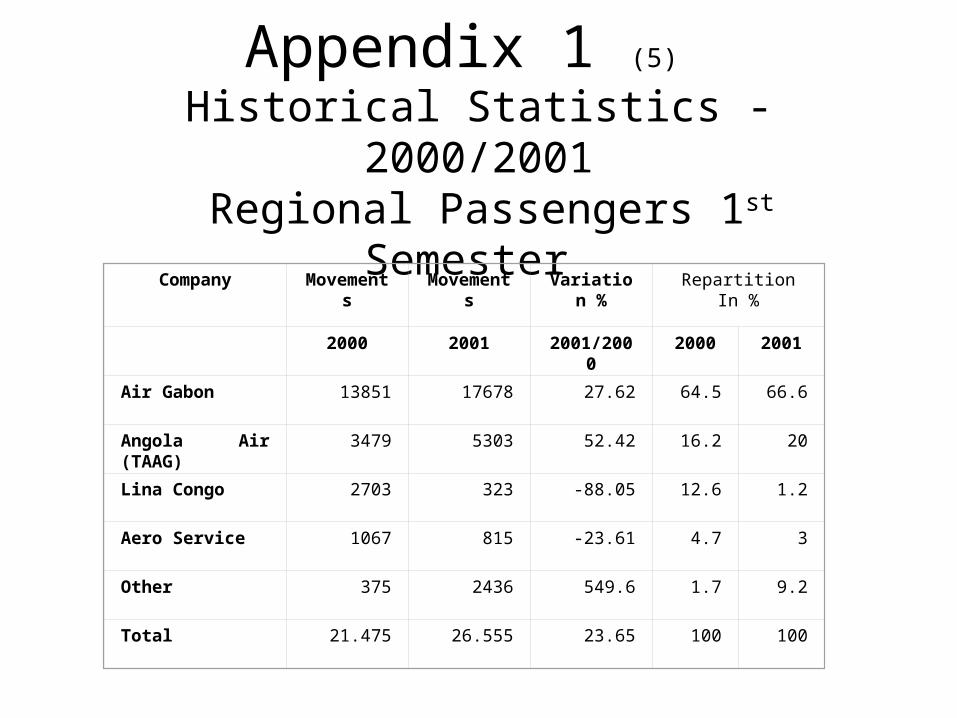
Appendix 1 (5) Historical Statistics - 2000/2001
Regional Passengers 1st Semester
Company Movements Movements Variation %
Repartition In %
2000 2001 2001/2000 2000 2001
Air Gabon 13851 17678 27.62 64.5 66.6
Angola Air (TAAG) 3479 5303 52.42 16.2 20
Lina Congo 2703 323 -88.05 12.6 1.2
Aero Service 1067 815 -23.61 4.7 3
Other 375 2436 549.6 1.7 9.2
Total 21.475 26.555 23.65 100 100
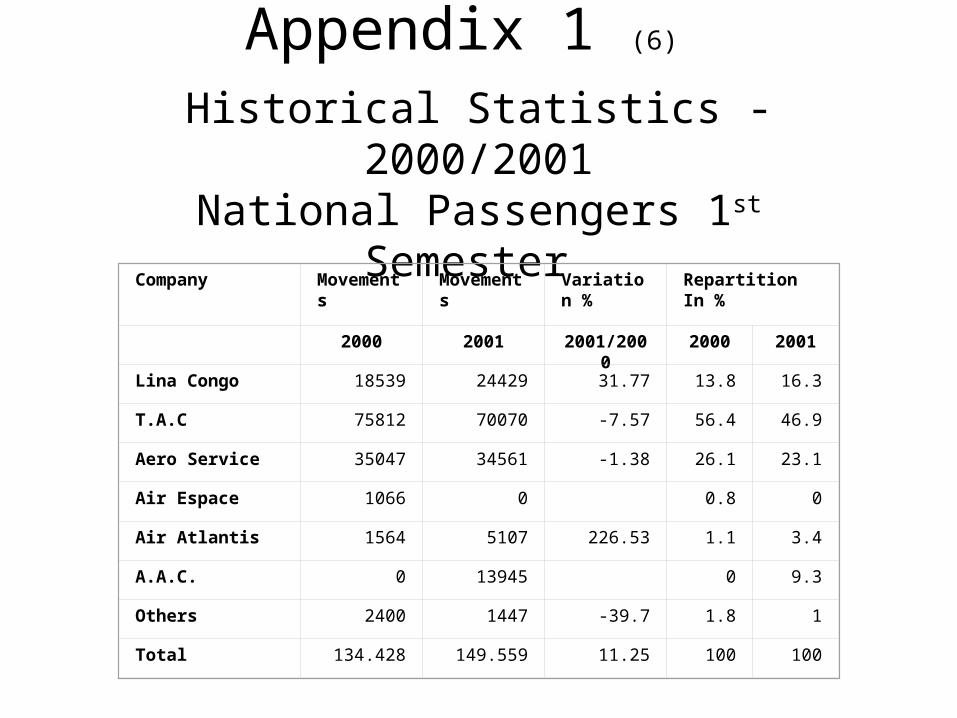
Appendix 1 (6) Historical Statistics - 2000/2001National Passengers 1st Semester
Company Movements Movements Variation %
Repartition In %
2000 2001 2001/2000 2000 2001
Lina Congo 18539 24429 31.77 13.8 16.3
T.A.C 75812 70070 -7.57 56.4 46.9
Aero Service 35047 34561 -1.38 26.1 23.1
Air Espace 1066 0 0.8 0
Air Atlantis 1564 5107 226.53 1.1 3.4
A.A.C. 0 13945 0 9.3
Others 2400 1447 -39.7 1.8 1
Total 134.428 149.559 11.25 100 100
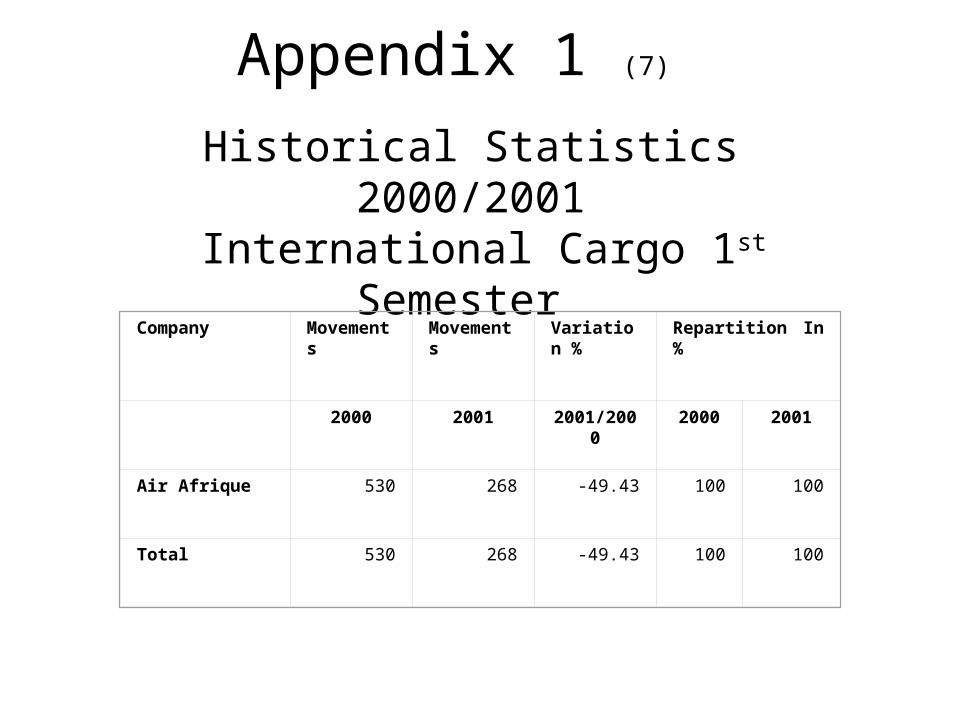
Appendix 1 (7)
Historical Statistics2000/2001
International Cargo 1st Semester Company Movements Movements Variation
%Repartition In %
2000 2001 2001/2000 2000 2001
Air Afrique 530 268 -49.43 100 100
Total 530 268 -49.43 100 100
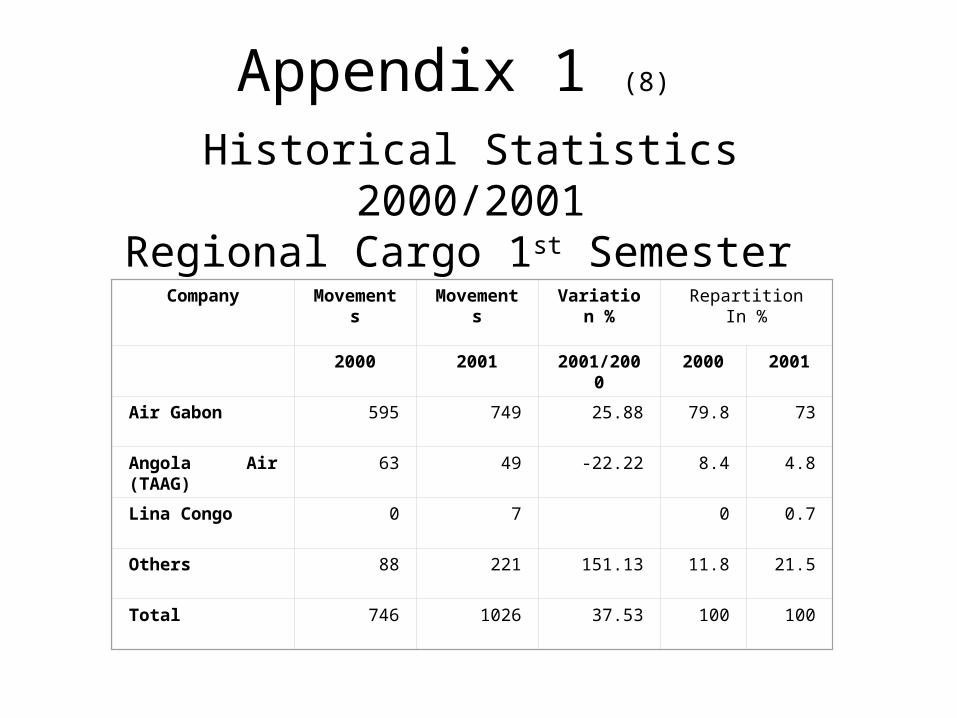
Appendix 1 (8) Historical Statistics
2000/2001Regional Cargo 1st Semester
Company Movements Movements Variation %
Repartition In %
2000 2001 2001/2000 2000 2001
Air Gabon 595 749 25.88 79.8 73
Angola Air (TAAG) 63 49 -22.22 8.4 4.8
Lina Congo 0 7 0 0.7
Others 88 221 151.13 11.8 21.5
Total 746 1026 37.53 100 100
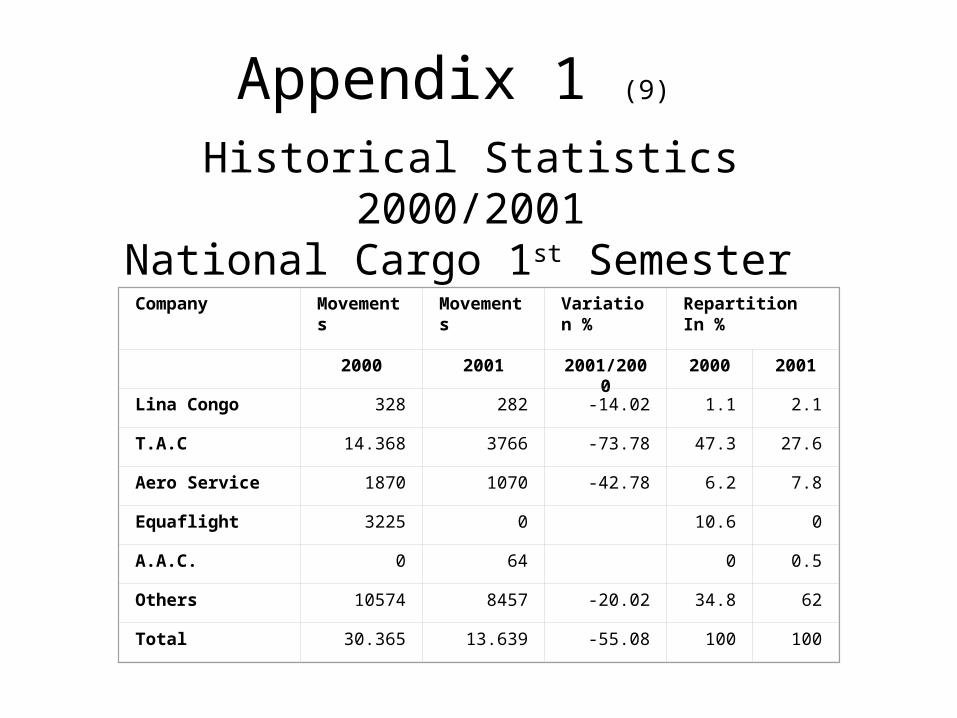
Appendix 1 (9) Historical Statistics
2000/2001National Cargo 1st Semester
Company Movements Movements Variation %
Repartition In %
2000 2001 2001/2000 2000 2001
Lina Congo 328 282 -14.02 1.1 2.1
T.A.C 14.368 3766 -73.78 47.3 27.6
Aero Service 1870 1070 -42.78 6.2 7.8
Equaflight 3225 0 10.6 0
A.A.C. 0 64 0 0.5
Others 10574 8457 -20.02 34.8 62
Total 30.365 13.639 -55.08 100 100
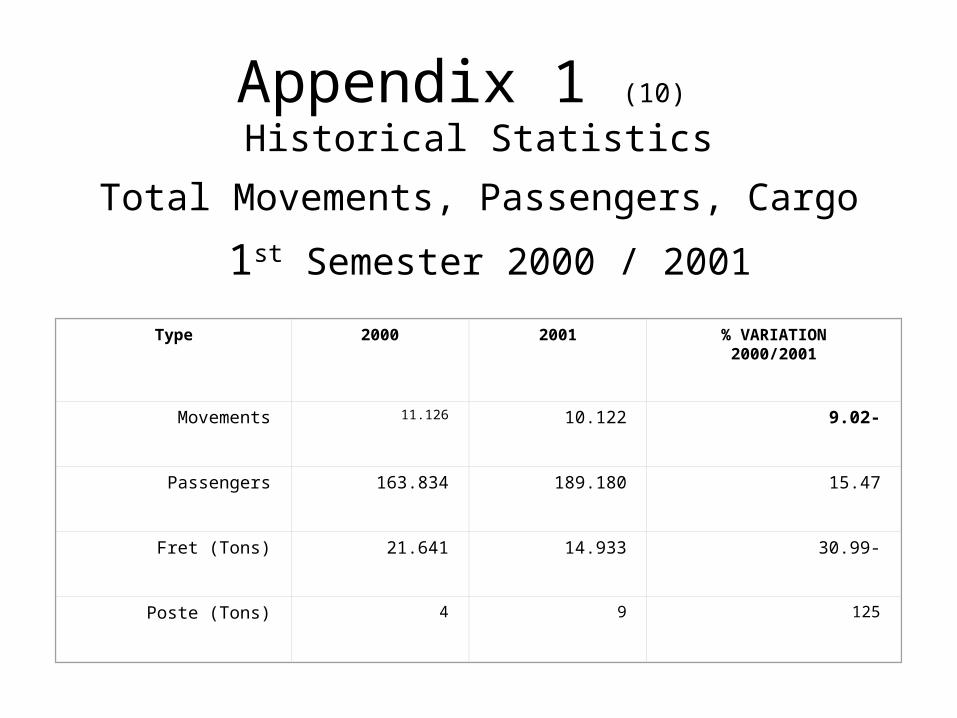
Appendix 1 (10) Historical Statistics
Total Movements, Passengers, Cargo
1st Semester 2000 / 2001
Type
2000 2001 VARIATION% 2000/2001
Movements 11.126 10.122 -9.02
Passengers 163.834 189.180 15.47
Fret (Tons) 21.641 14.933 -30.99
Poste (Tons) 4 9 125