markets in virtual worlds
TRANSCRIPT

Graduate School of Business, Economics,
Law and Social Sciences
Bachelor thesis
Markets in virtual worlds
Author:
Anton Chirkunov06-606-198
Supervisor:
Prof. Dr. Francesco Audrino
May 12, 2009

1 CONTENTS
Contents
1 Introduction 4
2 Data 6
3 Empirical Findings 9
3.1 Price dispersion . . . . . . . . . . . . . . . . . . . . . . . . . . 9
3.2 Arbitrage . . . . . . . . . . . . . . . . . . . . . . . . . . . . . 12
4 Conclusion 18
A Appendix 19
A.1 Data . . . . . . . . . . . . . . . . . . . . . . . . . . . . . . . . 19
A.2 Price dispersion . . . . . . . . . . . . . . . . . . . . . . . . . . 23
A.3 Arbitrage . . . . . . . . . . . . . . . . . . . . . . . . . . . . . 26
References 35

2 LIST OF FIGURES
List of Figures
3.1 Price and volume of Eternal Earth (EE) & 10 x Crystallized
Earth (EE) . . . . . . . . . . . . . . . . . . . . . . . . . . . . 13
3.2 Price and volume of Eternal Shadow (ES) & 10 x Crystallized
Shadow (CS) . . . . . . . . . . . . . . . . . . . . . . . . . . . 14
A.1 Auction house in the player’s perspective . . . . . . . . . . . . 19
A.2 Auctions saved in a textfile . . . . . . . . . . . . . . . . . . . . 19
A.3 Auctions in the SQL database . . . . . . . . . . . . . . . . . . 20
A.4 Absolute price gap over time of Greater Cosmic Essence . . . 25
A.5 Absolute price gap over time of Infinite Dust . . . . . . . . . . 26
A.6 Absolute price gap over time of Netherweave Cloth . . . . . . 26
A.7 Price and volume of Greater Cosmic Essence (GCE) & 3 x
Lesser Cosmic Essence (LCE) . . . . . . . . . . . . . . . . . . 26
A.8 Price and volume of Dream Shard (DS) & 3 x Small Dream
Shard (SDS) . . . . . . . . . . . . . . . . . . . . . . . . . . . . 27
A.9 Arbitrage profits of Dream Shards & Small Dream Shards . . 31
A.10 Arbitrage profits of Eternal Life & Crystallized Life . . . . . . 32
A.11 Arbitrage profits of Greater Eternal Essence & Lesser Eternal
Essence . . . . . . . . . . . . . . . . . . . . . . . . . . . . . . 33
A.12 Arbitrage profits of Greater Magic Essence & Lesser Magic
Essence . . . . . . . . . . . . . . . . . . . . . . . . . . . . . . 34

3 LIST OF TABLES
List of Tables
2.1 Exemplary auction listing sample . . . . . . . . . . . . . . . . 8
A.1 Descriptive statistic for the most popular items . . . . . . . . 20
A.2 Descriptive statistic for the most popular items, clear from
outliers . . . . . . . . . . . . . . . . . . . . . . . . . . . . . . . 21
A.3 p-Values of statistical tests for returns . . . . . . . . . . . . . 22
A.4 Price gaps of the most popular goods . . . . . . . . . . . . . . 23
A.5 Regression results between price gaps and number of sellers . . 24
A.6 Regression results between price gaps and logarithmic number
of sellers . . . . . . . . . . . . . . . . . . . . . . . . . . . . . 25
A.7 Volumes of interconvertible goods over the observation period 28
A.8 Correlations of interconvertible goods . . . . . . . . . . . . . . 29
A.9 Correlations of partially interconvertible goods . . . . . . . . . 29
A.10 Arbitrage profits of interconvertible goods over the observation
period . . . . . . . . . . . . . . . . . . . . . . . . . . . . . . . 30
A.11 Arbitrage profits of partially interconvertible goods over the
observation period . . . . . . . . . . . . . . . . . . . . . . . . 30

4 1 INTRODUCTION
1 Introduction
Virtual reality has been the object of much speculation by the end of the
20th century. Back at that time, science-fiction and self-named ”experts”
predicted that in a few years we could use a brain-computer interface to in-
teract with a simulated reality (take for example the movie Matrix). History
tends to be unpredictable, and respectively they were wrong. Instead, com-
puter games emerged recently where thousands of players interact with each
other in a fictional universe. Players simply use their keyboard, mouse and
microphone to move and talk inside this virtual world. Online games run
endlessly and are persistent (the world continues to exist when you are not
playing). The goal of playing is recreational: developing the player’s char-
acter, achieving objectives in a team, fighting against other players, social
interaction etc..
This paper analyzes the items market of the most popular online game
to date, World of Warcraft (WoW ). Blizzard released an expansion pack in
the middle of November 2008 called Wrath of the Lich King (WotLK ). It
introduced new content for players and naturally new items. I will further
refer to goods released in the expansion as WotLK goods. Goods released
before the expasion will be referred to as pre-Expansion or pre-WotLK goods.
World of Warcraft has about 11.5 millions subscribers as of December 2008
(Blizzard, 2008). The players are distributed on over 700 servers. Each server
is an identical copy of the game world with a population ranging from 10 to
30 thousand characters. The character are tied to their particular server1 and
cannot interact with players on other servers2. You might think of servers as
multiple countries or even multiple identical universes.
World of Warcraft uses levels to measure the character’s progress, ranging
from 1 to 80. At higher levels the character is more powerful and is able to
perform more abilities. The player needs a certain amount of experience
points to progress to the next level. He earns them by slaying monsters or
1The only exception is to transfer to another server of the same geographical boundaryby paying a small fee. It is not possible to transfer from a Chinese server to a Europeanone, but you can transfer between European servers.
2The exception is multi-server ”battlegroups”, but it is irrelevant for this paper.

5 1 INTRODUCTION
completing quests given by non player characters (NPC ). In turn, equipment
- weapons and armor - improves the character’s abilities to perform these
tasks faster. Players acquire items3 by performing activities or trading them
among other players. The key point why items have a certain value is because
the world is persistent. If I gather an item today, it is still present tomorrow,
because the world runs independently of whether I am playing or not. Players
purchase items using a virtual currency called Gold. It has the characteristics
money ought to have as defined by Yamaguchi (2004): medium of exchange,
measure of value and mean of storage. It is used to denominate the value
of items, pay for them and can be stored for future use. You may argue
that World of Warcraft gold is nothing more but worthless Monopoly money,
but it is nevertheless exchangeable to real currencies. Not because Blizzard
wanted this to occur, but because players have the desire to do so. The
reason is that some players have much time to play but a low income, while
others are busy working but earn more than enough to finance this hobby.
An in-depth analysis of this phenomenon is given by Heeks (2008).
There is a wide range of economic literature on virtual worlds, most
notably Castronova (2001) (estimation of a virtual world’s GDP), Yamaguchi
(2004) (virtual currencies) and Lehtiniemi (2008) (macroeconomic modeling).
This paper does not give a recapitulation of the literature, which is most
wonderfully described by Lehdonvirta (2005) and Lehtiniemi (2008).
The reason I analyze the virtual market of World of Warcraft is to gain
insights about the real world. The obvious advantage of virtual worlds here
is that the environment isn’t a laboratory experiment. The players are not
aware that they are observed and act naturally. Virtual worlds have very
desired characteristics (e.g the goods are absolutely homogenous) otherwise
absent in the real world. It allows to verify economic theories which are
untestable in the real world. The approach is only viable if players make
decisions in the same way as in the real world. Don’t confuse this statement
with neoclassical economists thinking that humans (and therefor players) are
rational. These economists say that humans are rational and make optimal
decisions based on rigorous economic theory. Taleb (2007) notes that this
3Objects than can be collected within the game

6 2 DATA
would be as absurd as requiring birds to study engineering in order to fly.
Experiments by Kahneman and Tversky showed that people solve problems
using heuristics, i.e. rules of thumb, instead of rational analysis (Taleb,
2007). The usefulness of virtual worlds for economics cannot be judged by
how humans & players should behave, but on how they actually behave.
There are therefor two significant aspects for research. First, you should
conduct experiments in online games and compare the results to those of
behavioral economics. The second part is about gaining insights. This paper
concentrates on the second aspect of virtual world research.
The thesis is structured as follow: In Section 2, I will give an overview
on how the data has been gathered and what the main problems are when
working with it. Section 3 will present empirical findings on price dispersion
and arbitrage in the virtual world.
2 Data
The auction house is the trading hub for buying and selling goods to other
players in World of Warcraft. Sellers may place goods up for auction, set a
starting price, optionally a buyout price and the auction duration (12, 24 or
48 hours) (Blizzard, 2009). Most goods require a upfront deposit fee, which
is refunded upon the successful sale of the good (Blizzard, 2009). Successful
sales are charged a cut rate of 5% based on the final sale price. The auction
house shares many similarities with eBay, except it uses first-price English
auctions. It means the player pays the amount of his bid, regardless of the bid
of his competitors 4. In addition, auctions can be immediately won by paying
the buyout price set by the seller. This is the way most auctions are won,
since many players are not willing to wait and want the item now, despite the
buyout price being higher than the current bid. For this reason, we ignore
bids in our analysis and concentrate on buyout prices in this paper. The
security of the auction is guaranteed by requiring buyers/sellers to deposit
their bids respectively goods upfront. You might think of it as the equivalent
4On eBay the winner pays the second-highest bid plus a given increment

7 2 DATA
of an escrow account. The alternative to the Auction House is the trade chat.
Players simply tell others what they are willing to buy or sell for which price.
Then they meet in the virtual world to close the trade without paying any
fees. Is it not possible to quantify the significance of the trade chat.
Data collection is a triviality in most economic & financial studies, since
the data is either freely available or can be purchased from an institution.
Data collection is a challenge in virtual worlds, since it resides entirely within
the game. Nash and Scheneyer (2004) faced the same problem when collect-
ing data for the online game Final Fantasy Online. Figure A.1 shows how
the auctions are seen in the game from the player’s perspective.
The only existing database for auction prices in World of Warcraft is
Wowecon5. It has two major drawbacks:
Bias Wowecon collects only data from auctions bought or sold by its users,
and not the observable auctions themselves. There are currently about
600’000 registered users, or less than 5% of the total population. The
number of active users is probably much lower.
Limited number of observations The limited amount of Wowecon users
means that the data sample for each server is very small. In return,
the website merges all observations from every server to come up with
the limited number of observations. For some items, the total observed
volume for all 700 servers is three to ten times lower than the actual
volume on a single server.
These disadvantages led me to collect the data by myself. World of War-
craft allows users to write add-ons using the LUA programming language
that can interact with the game to some extent. One of the most popular
add-ons is Auctioneer. It store statistics of auction prices locally on the
player’s computer. The problem is that the statistics are not related to sep-
arate points in time. For example, instead of calculating the median on a
daily basis, it simply saves the price median over the last few days. This
approach is not suitable for time series analysis. I modified Auctioneer by
5http://www.wowecon.com/
8 2 DATA
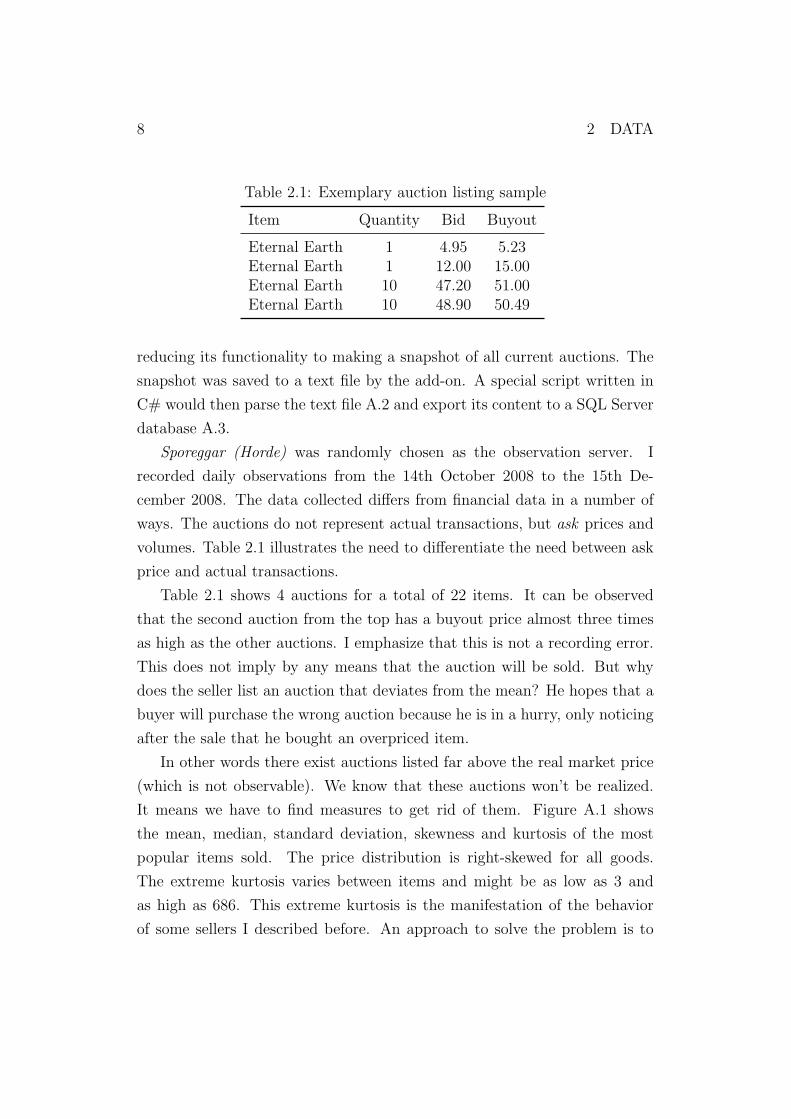
Table 2.1: Exemplary auction listing sample
Item Quantity Bid Buyout
Eternal Earth 1 4.95 5.23Eternal Earth 1 12.00 15.00Eternal Earth 10 47.20 51.00Eternal Earth 10 48.90 50.49
reducing its functionality to making a snapshot of all current auctions. The
snapshot was saved to a text file by the add-on. A special script written in
C# would then parse the text file A.2 and export its content to a SQL Server
database A.3.
Sporeggar (Horde) was randomly chosen as the observation server. I
recorded daily observations from the 14th October 2008 to the 15th De-
cember 2008. The data collected differs from financial data in a number of
ways. The auctions do not represent actual transactions, but ask prices and
volumes. Table 2.1 illustrates the need to differentiate the need between ask
price and actual transactions.
Table 2.1 shows 4 auctions for a total of 22 items. It can be observed
that the second auction from the top has a buyout price almost three times
as high as the other auctions. I emphasize that this is not a recording error.
This does not imply by any means that the auction will be sold. But why
does the seller list an auction that deviates from the mean? He hopes that a
buyer will purchase the wrong auction because he is in a hurry, only noticing
after the sale that he bought an overpriced item.
In other words there exist auctions listed far above the real market price
(which is not observable). We know that these auctions won’t be realized.
It means we have to find measures to get rid of them. Figure A.1 shows
the mean, median, standard deviation, skewness and kurtosis of the most
popular items sold. The price distribution is right-skewed for all goods.
The extreme kurtosis varies between items and might be as low as 3 and
as high as 686. This extreme kurtosis is the manifestation of the behavior
of some sellers I described before. An approach to solve the problem is to

9 3 EMPIRICAL FINDINGS
use the median instead of the mean, since the latter is more outlier prone.
In addition, outliers outside of a 2 standard deviation interval from the the
median are removed. The approach is purely practical and has no theoretical
background. Figure A.2 shows the results of the data cleanup. The data
retains its main characteristics (asymmetry and fat tails), but it is at least
clean from extreme outliers. Note that these outliers can only be detected in
a large sample, this is the reason why I will stick to the most traded goods
in my further analysis.
Asymmetry and fat tails are compatible with the real world. Stock prices
aren’t random or normally distributed either. However, their returns are
often assumed to be independent and identically distributed (iid) under a
normal distribution, even if it isn’t the case empirically. What is most striking
most is that in World of Warcraft, the daily returns of the most popular
goods are random. There are of course exceptions like the item Saronite
Bar. Saronite Bar shows a strong deflationary trend in the first weeks after
the release of WotLK. The residuals are however iid if the trend is removed
using a quadratic approximation. Linen Cloth and Wool Cloth daily returns
aren’t iid either. They show strong empirical evidence of autocorrelation.
The only similarity between Linen Cloth and Wool Cloth is that they are
relatively cheap and aren’t actively gathered by players.
3 Empirical Findings
3.1 Price dispersion
Price dispersion is a violation of the law of one price (which is actually
no law at all). Price dispersion means that prices vary across sellers even
for homogenous goods. The existence of price dispersion is erroneously at-
tributed to subtle differences among the products. Empirical research over
four decades has shown that price dispersion is omnipresent, regardless of
the goods sold and the distribution channel (online or offline) (Baye & Mor-
gan, 2006). Theoretical and empirical evidence suggests that the cause is
information costs - the cost of consumers and firms to acquire respectively

10 3 EMPIRICAL FINDINGS
transmit information (Baye & Morgan, 2006).
The relevance of virtual worlds lies in its idealized characteristics: virtual
goods are absolutely homogenous and search costs are inexistent (or limited
at looking up the auction house). There are several differences to the real
world that may impact price dispersion. First, there is no price stickiness.
The short term auction duration (12 to 48 hours) allows prices to fluctuate
in a matter of hours. Second, the auction house is both a place where players
are able to access a list of prices (so called clearinghouse) and a point of sale.
Similar to price listings in newspapers or websites, it is (most of of the time)
costly for sellers to advertise prices. They pay a deposit fee when listing an
auction. The homogeneity of the goods and the lack of difference between
sellers allowed me to conclude that players cannot consider the reputation of
sellers or exhibit loyalty.
I used the ”gap” to measure price dispersion, which is the difference
between the two lowest prices in the market (Baye & Morgan, 2006). It is
defined as
G(t) = p(t)2 − p
(t)min (3.1)
where p(t)2 is the second lowest price at time t. The sample gap can be
normalized in order to be comparable across different time series:
g(t) =p
(t)2 − p
(t)min
p(t)min
(3.2)
The relative price dispersion g(t) is then the absolute gap divided by the
lowest price (Baye & Morgan, 2006).
Other ways to measure price dispersion are impractical in our case, e.g.:
The range defined as R(t) = p(t)max − p
(t)min. Our data has however a high
kurtosis and may have extreme outliers to the right. p(t)max is often not
meaningful at all.
The sample variance has several problems when comparing price disper-
sion across different goods or over time. It needs to be standardized in
some way, for example by using the coefficient of variation CV = σµ.
11 3 EMPIRICAL FINDINGS
The coefficient of variation is most useful over long periods of time
(Baye & Morgan, 2006). The two month observation period is however
too short for the use of the coefficient of variation.
I calculated the daily price gap for the twenty most popular goods in
terms of volume. The results are displayed in Table A.4. Price dispersion
is unsurprisingly omnipresent and even higher than in the real world. The
following observations can be made:
1. The relative price gap is significantly lower for expensive goods (median
price over ten gold) than for cheap goods (median price under one gold).
This is in line with Stigler’s first hypothesis and empirical results over
four decades - dispersion is lower for goods that account for a large
share of the consumer’s budget than those that account for a small
share (Baye & Morgan, 2006).
2. There is no deposit fee for the items Infinite Dust and Greater Cosmic
Essence. In other words it costs nothing for sellers to advertise their
prices. As we already ruled out the existence of search costs for buyers,
the existence of price dispersion thus seems to be independent of all
information costs.
3. The theory suggests that dispersion depends on the number of sellers.
Depending on the model, price dispersion either increases or decreases
with the number of sellers. Empirical results often depend on the way
the number of sellers is measured - be it logarithm of number of sellers
or the density of sellers in a geographic region (Baye & Morgan, 2006).
In our case, there is no empirical evidence that the number of sellers
or the logarithm of it matters (except for Runecloth). The regression
results are displayed in Table A.5 and A.6.
4. Price dispersion is not constant over time. Figure A.4, A.5 and A.6
suggest that price dispersion is cyclical. It might be a hint that price
dispersion is caused by factors varying over time like the competitive-
ness between sellers.

12 3 EMPIRICAL FINDINGS
To conclude this section, price dispersion is omnipresent in the virtual
world despite goods being absolutely homogenous and information costs in-
existent. The number of sellers has no impact at all, and price dispersion
varies over time cyclically.
3.2 Arbitrage
Theoretical finance defines arbitrage as a non-negative cash flow in any out-
come and a positive cash flow in at least one outcome (Sandmann, 2001).
The problem of this approach is the assumption of a finite number of out-
comes (also called probabilistic states) and the required knowledge of the
returns of securities in any possible state. Both of these assumption do not
hold in the real world, and cannot be observed in our case. This empirical
study narrows down to detect mispriced goods. The approach is to take a
look at interconvertible goods, i.e. goods that can be converted between
each other at no costs. Take for example the item Eternal Earth. Any player
- independently of his character’s skill - can convert one Eternal Earth to ten
Crystallized Earth. It works the other way too, i.e. converting ten Crystal-
lized Earth to one Eternal Earth. You can safely assume that both should
have the same price. Figure 3.1 confirms that both goods (more precisely one
good and the bundle of the lesser good) have about the same median price.
If you would combine both markets, the combined price would go precisely
trough the median of Eternal Earth. The reason behind this logic is that
Eternal Earth has a higher volume in terms of units of Crystallized Earth
and per se a higher impact on the median.

13 3 EMPIRICAL FINDINGS
Figure 3.1: Price and volume of Eternal Earth (EE) & 10 x CrystallizedEarth (EE)
11/16/08 11/23/08 11/30/08 12/07/08 12/14/080
20
40P
rice
,[g
old]
ee
ce x 10
11/16/08 11/23/08 11/30/08 12/07/08 12/14/080
1000
2000
3000
Adj.
vol
The point of the matter is that even if the goods are interconvertible and
their combined price the same, the risks associated with selling Crystallized
Earth is higher than those of Eternal Earth. One market is more liquid than
the other. The higher liquidity of Eternal Earth suggests that the demand for
it is higher - despite the goods being absolutely interconvertible. Players pre-
fer to buy Eternal Earth rather than batches of Crystallized Earth - maybe
purely for convenience. To conclusion, it makes sense to convert Crystallized
Earth to Eternal Earth in order to minimize the sales risk. Both Greater Cos-
mic Essences & Lesser Cosmic Essences and Dream Shards & Small Dream
Shards have the same characteristics, see Figure A.7 respectively Figure A.8
in the Appendix.
Could the price of the bundle of Crystallized Earth be lower than the
lowest price of Eternal Earth? If Crystallized Earth was cheaper, one could
simply buy it, convert it to Eternal Earth and realize a risk free profit by
undercutting the lowest price of Eternal Earth. This observation also implies
that the price of the less liquid good can be higher. The goods Eternal
Shadow and Crystallized Shadow in Figure 3.2 are a perfect example. Eternal
Shadow and Crystallized Shadow can be converted between each other at just
the same ratio as the previous example. However, the bundle consisting of ten

14 3 EMPIRICAL FINDINGS
Crystallized Shadow items is significantly more expensive than one Eternal
Shadow. You might argue that this observation is contradictory, but you need
to consider that the illiquidity of the Crystallized Shadow market refrains you
from realizing a risk free profit. There isn’t a arbitrage opportunity in this
case either.
11/20/08 11/27/08 12/04/080
50
100
Pri
ce,
[gol
d] es
cs x 10
11/20/08 11/27/08 12/04/080
500
1000
1500
Adj.
vol
Figure 3.2: Price and volume of Eternal Shadow (ES) & 10 x CrystallizedShadow (CS)
We’ve noted earlier in this section that Eternal Earth & Crystallized Earth
seem to form a single market. In contrast, Eternal Shadow & Crystallized
Shadow are two distinct markets. The reason why some interconvertible
goods form distinct markets lies in the nature of players’ preferences. Crys-
tallized Shadow could have some use for players on its own. The player
prefers to buy one unit of Crystallized Shadow rather than buying an Eter-
nal Shadow, converting it, using one of the resulting Crystallized Shadow
for his own and reselling the remaining nines items. On the other side, there
might be no popular recipes that require small amounts of Crystallized Earth.
However, the sheer number of available recipes and professions in World of
Warcraft prevents us from giving an empirical account on exactly why some
interconvertible goods form distinct markets and why others do not. We can
however determine which of these goods are affine.
One method to measure the affinity of two goods is the sample correla-

15 3 EMPIRICAL FINDINGS
tion. Highly correlated interconvertible goods form a single market, while
uncorrelated goods form distinct markets. The correlation samples for all in-
terconvertible goods in World of Warcraft are depicted in Table A.8. The p-
Value refers to the null hypothesis that the samples are uncorrelated. About
half of the goods are correlated and thus form a single market. Addition-
ally, I included another class of items: partially interconvertible goods.
These are goods that can be converted one way by all players, and both
ways by players having a specific skill. Their sample correlation is shown
in Figure A.9. Surprisingly most of them are correlated, but it is debatable
whether it can be attributed to partial inter convertibility. Nevertheless, the
sample correlation isn’t a meaningful indicator to undermine the existence
of arbitrage.
Before I design an approach to measure arbitrage, I’d like to generalize
the definition of arbitrage we used in the beginning of this section. Let H be
the very liquid and L the lesser liquid good. They can be converted between
each other at the ratio r so that one unit of H yields r units of L. We assume
that it is possible to sell good H at a price infinitesimally below the lowest
ask price in the market (also called undercutting) without any risk. This
assumption is for simplification, mainly because we cannot observe actual
transaction but merely ask prices. If at any point in time t the ask price of L
is lower than the lowest ask price of H, there isn’t any possibility of arbitrage
because the illiquidity of good L is associated with a risk to sell good L. It
means that the ask price of L must be higher than the lowest ask price of
H, otherwise an arbitrageur could buy good L, convert it to H and realize a
risk free profit. We can write this generalization mathematically:
Proposition 1. Let H and L be two goods interconvertible goods. If:
• Good H is more liquid, i.e. its volume in units of L is higher:
r ∗ V olume(H) > V olume(L) (3.3)
• There is no risk to sell good H by undercutting, i.e. at price P(t)min(H).
This is the risk free sales price.

16 3 EMPIRICAL FINDINGS
Then at any given point in time t the lowest ask price of good H must be
lower than all ask prices of good L:
P(t)min(H) < P
(t)i (L) ∀i (3.4)
in order for the market to be arbitrage free.
Now we can define the arbitrage profit as the profit from buying all goods
L below the risk free sales price, converting them to good H and selling H
over the whole observation. This measure is however absolute, and lacks
cross sectional comparability if the goods have observation periods of dif-
ferent lengths. The results are shown in Table A.10 respectively A.11 in
the Appendix. Most of new interconvertible goods introduced on the 13th
of November are arbitrage free, except for Dream Shards and Eternal Life.
Figure A.9 in the Appendix helps to understand the reason why there where
arbitrage possibilities on the Dream Shard market. It depicts the median
price of Dream Shard in gold, the volume in units and the arbitrage profit.
You may see that only during the short period of time after the good was
introduced, there were possible arbitrage profits. This is nothing new in the
real world, where new securities might not be free of arbitrage after their
immediate introduction. The market for Eternal Life (Figure A.10) might
however suggest that arbitrage doesn’t only arise when a good is first intro-
duced, but more or less over the whole period of observation. The key to
the answer is to look at the volume. Arbitrage possibilities disappeared as
soon as the volume reached a critical value (in this case more than 50 units).
We can apply the same reasoning to the market for Dream Shards discussed
before and conclude that arbitrage disappeared as soon as the market volume
went up. The key point here from our observations is that arbitrage in the
Dream Shards market was not linked to the good being new, but to its very
low volume in the first week.
The huge arbitrage profit derived from pre-Expansion goods (i.e. ”old”
ones) infer that our assumption about the risk free price was wrong (see
exemplary Figure A.11 & A.12 in the Appendix). Demand and supply dipped
just before the release of the new expansion on the 13th of November. This

17 3 EMPIRICAL FINDINGS
effect is similar to a structural break, although the event was not unexpected.
From then on players didn’t need these obsolete goods, and others stopped
farming for them since they couldn’t sell them anymore. Notice in Figure
A.11 how the theoretical arbitrage profit goes up when the volume drops
beyond a critical value. At the same time, the ask price goes trough the roof
and isn’t meaningful at all. The risk free price assumption in Proposition 1
is wrong in the presence of a degenerated market. In this case the measure
of arbitrage defined before fails.
This section can be concluded with following observations:
1. There is no empirical evidence of arbitrage as long as we have a stable
market. A stable market means its volume is above some critical value
and the risk free price assumption we defined holds.
2. If we face degenerated markets like those of pre-Expansion goods after
the first November week, there is no way to measure arbitrage. This is
due to the nature of our data - we merely observe ask prices and not
actual transactions that took place. When the market degenerates, the
spread between ask and bid prices (the lasts aren’t observable) becomes
so large that ask prices do not reflect a measure of real willingness to
buy or sell.

18 4 CONCLUSION
4 Conclusion
The purpose of this bachelor thesis was to investigate commodity markets
in a virtual world called World of Warcraft. Virtual worlds have idealized
traits otherwise not present in the real world. These traits are however
often assumed in economic theory but not present in the real world. Virtual
worlds such as World of Warcraft offer a possibility to test existing economic
theories. In the field of behavioral economics and finance, virtual worlds can
be seen as an alternative to experiments. The obvious advantage besides
lower costs is that the observed subjects are not in a laboratory setting.
Price dispersion - a violation of the ”price” of one law - has been observed
for decades in the real world. Its existence is attributed to information costs
by the current literature (Baye & Morgan, 2006). In World of Warcraft, price
dispersion is omnipresent despite information costs being inexistent and the
goods totally homogeneous. Cheap goods have a significantly higher price
gap than expensive goods. Price dispersion is independent of the number of
sellers contrary to real world empirical results. The price gap shows as well
a cyclical pattern, which suggests that it results from elements varying over
time like the competitiveness between sellers. A topic of further research
would be to model cyclical price dispersion.
The second empirical part questioned the existence of arbitrage in World
of Warcraft. There is no empirical evidence of arbitrage as long as we face
stable markets, i.e. markets in which there are enough buyers and sellers.
It is not possible to establish empirical evidence for goods that are no ac-
tively gathered by players. This is due to unavailability of data for actual
transactions - it is only possible to observe ask prices and volume in World
of Warcraft.
As a conclusion, Blizzard needs to provide actual transactions data to
allow more economic research about their game.

19 A APPENDIX
A Appendix
A.1 Data
Figure A.1: Auction house in the player’s perspective
Figure A.2: Auctions saved in a textfile

20 A APPENDIX
Figure A.3: Auctions in the SQL database
Table A.1: Descriptive statistic for the most popular items
Item Mean Median Std Skewness Kurtosis
Greater Cosmic Essence 29.89 28.00 7.77 1.83 8.15Frozen Orb 174.79 100.02 206.06 4.18 34.01Eternal Fire 49.78 45.00 21.10 5.03 43.93Frost Lotus 23.94 18.50 13.60 2.03 7.49Eternal Life 39.61 40.00 18.54 0.70 3.36Eternal Earth 14.47 12.00 9.23 2.86 14.70Eternal Shadow 19.37 18.00 6.30 0.83 3.09Borean Leather 1.43 1.20 2.26 11.93 150.34Saronite Ore 3.91 2.90 3.43 8.47 107.44Infinite Dust 8.62 8.00 5.27 14.83 253.51Frostweave Cloth 2.03 1.60 3.88 17.24 361.71Adder’s Tongue 2.89 2.15 2.75 4.57 25.56Saronite Bar 4.82 3.75 2.85 7.54 118.52Netherweave Cloth 0.36 0.20 0.81 15.30 302.34Runecloth 0.47 0.36 0.73 23.34 751.46Mageweave Cloth 0.58 0.45 0.76 7.43 61.84Silk Cloth 0.27 0.10 0.82 15.33 686.40Wool Cloth 0.35 0.33 0.38 19.28 494.79Linen Cloth 0.12 0.04 0.37 6.84 60.38

21 A APPENDIX
Table A.2: Descriptive statistic for the most popular items, clear from outliers
Item Mean Median Std Skewness Kurtosis
Greater Cosmic Essence 28.70 27.50 5.52 0.56 2.61Frozen Orb 130.09 100.00 96.99 1.93 7.00Eternal Fire 46.96 45.00 12.14 1.16 4.11Frost Lotus 20.99 17.90 8.18 0.99 2.95Eternal Life 37.99 40.00 16.46 0.34 2.23Eternal Earth 12.75 11.20 5.36 1.50 5.36Eternal Shadow 18.63 18.00 5.48 0.62 2.41Netherweave Bag 7.65 7.50 0.94 0.21 2.72Borean Leather 1.26 1.20 0.51 3.05 20.27Saronite Bar 4.48 3.75 1.58 0.95 3.17Infinite Dust 8.29 8.00 1.63 0.93 4.57Frostweave Cloth 1.77 1.60 0.75 2.08 9.45Adder’s Tongue 2.32 2.10 0.79 2.72 12.21Saronite Ore 3.71 2.85 2.02 1.28 3.63Netherweave Cloth 0.29 0.20 0.30 3.16 12.29Runecloth 0.43 0.36 0.26 2.45 10.22Mageweave Cloth 0.50 0.45 0.24 1.72 6.32Silk Cloth 0.16 0.10 0.20 3.65 18.76Wool Cloth 0.33 0.33 0.11 2.43 15.90Linen Cloth 0.07 0.04 0.09 4.25 27.84

22 A APPENDIX
Table A.3: p-Values of statistical tests for returns
Item QLBa QML
b Tc Sd Pe
Greater Cosmic Essence 0.8270 0.3685 0.3880 0.3657 0.6971Frozen Orb 0.7336 0.7307 0.0649 0.7290 0.7284Eternal Fire 0.1188 0.8207 0.3880 0.7630 0.5814Frost Lotus 0.8331 0.0509 0.0571 0.5403 0.7211Eternal Life 0.6561 0.2680 0.7658 0.7557 0.9006Eternal Earth 0.2055 0.1578 0.7658 0.7557 0.3092Eternal Shadow 0.0905 0.9282 0.2973 0.7557 0.7617Netherweave Bag 0.9447 0.5247 0.2418 0.1724 0.8257Borean Leather 0.4518 0.6076 0.5773 0.3798 0.3353Saronite Bar 0.7357 0.9569 0.6064 0.0339 0.8121Infinite Dust 0.0964 0.1967 0.1953 0.7630 0.2993Frostweave Cloth 0.6856 0.6672 0.7805 0.7697 0.5433Adder’s Tongue 0.5395 0.5711 0.6492 0.2059 0.5483Saronite Ore 0.5451 0.5550 0.7658 0.3507 0.0971Netherweave Cloth 0.0528 0.3830 0.4828 0.8299 0.2812Runecloth 0.1700 0.7710 0.1605 0.5192 0.9630Mageweave Cloth 0.3508 0.7404 0.6162 0.8299 0.7022Silk Cloth 0.1676 0.7100 0.4225 0.8299 0.8438Wool Cloth 0.0072 0.5413 0.6810 0.3789 0.6363Linen Cloth 0.0131 0.9850 0.4225 0.8299 0.8077
a Ljunx-Box-testb McLeod-Li testc Turning point testd Difference-sign teste Rank test

23 A APPENDIX
A.2 Price dispersion
Table A.4: Price gaps of the most popular goods
Item Relative gapa Absolute gapb Median Price
Expensive Items (>10g)Greater Cosmic Essence 0%-20% 0c - 6.67g 27.50gFrozen Orb 0%-36.36% 0c - 40g 100gEternal Fire 0%-43.63% 0c- 24g 40gFrost Lotus 0%-47.62% 1c - 5.12g 17.90gEternal Life 0%-74.19% 0c - 23g 45gEternal Earth 0%-81.81% 1c - 4.50g 11.20gEternal Shadow 0%-97.67% 1c- 14g 18g
Medium Items (1-10g)Netherweave Bag 0%-25.22% 0c - 1.4g 7.5gBorean Leather 0%-30.60% 0c - 0.34g 1.2gSaronite Bar 0%-35% 0c - 1.24g 3.75gInfinite Dust 0%-43.75% 1c - 1.75g 8gFrostweave Cloth 0%-44.44% 0c - 0.44g 1.60gAdder’s Tongue 0%-50% 0c - 1g 2.10gSaronite Ore 0%-61.36% 0c - 3.42g 2.85g
Cheap Items (<1g)Netherweave Cloth 0%-60% 0c - 0.18g 0.20gRunecloth 0.07%-233.33% 1c - 0.54g 0.36gMageweave Cloth 0%-500% 0c - 0.25g 0.45gSilk Cloth 0.20%-376% 1c - 0.08g 0.10gWool Cloth 0%-1804.76% 0c - 0.37g 0.33gLinen Cloth 0%-1233.33% 0c - 0.09g 0.04g
a G(t) = p(t)2 −p
(t)min
p(t)min
b g(t) = p(t)2 − p
(t)min

24 A APPENDIX
Table A.5: Regression results between price gaps and number of sellers
Item R2 R2 F-Stat p-Value
Expensive Items (>10g)Greater Cosmic Essence 0.0007 -0.0315 0.0219 0.8832Frozen Orb 0.0001 -0.0434 0.0017 0.9671Eternal Fire 0.0017 -0.0305 0.0534 0.8187Frost Lotus 0.0297 -0.0027 0.9175 0.3458Eternal Life 0.0685 0.0364 2.1324 0.1550Eternal Earth 0.0537 0.0211 1.6458 0.2097Eternal Shadow 0.0866 0.0551 2.7494 0.1081
Medium Items (1-10g)Netherweave Bag 0.0491 0.0321 2.8910 0.0946Borean Leather 0.0160 -0.0138 0.5380 0.4684Saronite Bar 0.0003 -0.0452 0.0059 0.9397Infinite Dust 0.0153 -0.0164 0.4830 0.4923Frostweave Cloth 0.0104 -0.0196 0.3467 0.5600Adder’s Tongue 0.0757 0.0427 2.2935 0.1411Saronite Ore 0.0103 -0.0238 0.3019 0.5869
Cheap Items (<1g)Netherweave Cloth 0.0000 -0.0159 0.0006 0.9797Runecloth 0.0581 0.0431 3.8852 0.0531Mageweave Cloth 0.0093 -0.0064 0.5905 0.4451Silk Cloth 0.0208 0.0053 1.3397 0.2515Wool Cloth 0.0001 -0.0166 0.0066 0.9354Linen Cloth 0.0202 0.0047 1.3010 0.2584

25 A APPENDIX
Table A.6: Regression results between price gaps and logarithmic number ofsellers
Item R2 R2 F-Stat p-Value
Expensive Items (>10g)Greater Cosmic Essence 0.0046 -0.0275 0.1438 0.7072Frozen Orb 0.0039 -0.0395 0.0889 0.7683Eternal Fire 0.0074 -0.0246 0.2312 0.6340Frost Lotus 0.0520 0.0204 1.6461 0.2093Eternal Life 0.0399 0.0068 1.2067 0.2810Eternal Earth 0.0436 0.0106 1.3212 0.2598Eternal Shadow 0.1431 0.1135 4.8420 0.0359
Medium Items (1-10g)Netherweave Bag 0.0820 0.0656 5.0038 0.0293Borean Leather 0.0039 -0.0263 0.1289 0.7218Saronite Bar 0.0184 -0.0262 0.4121 0.5275Infinite Dust 0.0275 -0.0039 0.8750 0.3568Frostweave Cloth 0.0000 -0.0303 0.00 0.9947Adder’s Tongue 0.0578 0.0241 1.7163 0.2008Saronite Ore 0.0026 -0.0318 0.0747 0.7865
Cheap Items (<1g)Netherweave Cloth 0.0004 -0.0156 0.0140 0.9063Runecloth 0.0867 0.0722 5.9786 0.0173Mageweave Cloth 0.0000 -0.0158 0.0024 0.9608Silk Cloth 0.0064 -0.0094 0.4033 0.5277Wool Cloth 0.0032 -0.0134 0.1905 0.6640Linen Cloth 0.0058 -0.0099 0.3703 0.5450
Figure A.4: Absolute price gap over time of Greater Cosmic Essence
11/14/08 11/30/08 12/16/080
0.05
0.1
0.15
0.2
Gap

26 A APPENDIX
Figure A.5: Absolute price gap over time of Infinite Dust
11/15/08 12/01/08 12/17/08
0.1
0.2
0.3
0.4
Gap
Figure A.6: Absolute price gap over time of Netherweave Cloth
10/14/08 11/13/08 12/13/080
0.2
0.4
0.6
Gap
A.3 Arbitrage
Figure A.7: Price and volume of Greater Cosmic Essence (GCE) & 3 x LesserCosmic Essence (LCE)
11/16/08 11/23/08 11/30/08 12/07/080
20
40
Pri
ce,
[gol
d] gce
lce x 3
11/16/08 11/23/08 11/30/08 12/07/080
200
400
600
Adj.
vol

27 A APPENDIX
Figure A.8: Price and volume of Dream Shard (DS) & 3 x Small DreamShard (SDS)
11/16/08 11/23/08 11/30/08 12/07/080
20
40
Pri
ce,
[gol
d] ds
sds x 3
11/16/08 11/23/08 11/30/08 12/07/080
200
400
Adj.
vol

28 A APPENDIX
Table A.7: Volumes of interconvertible goods over the observation period
Liquid Good Illiquid Good V (H)a V (L)b
Greater Cosmic Essence Lesser Cosmic Essence 7689 1415Dream Shard Small Dream Shard 4794 643Eternal Air Crystallized Air 10760 1485Eternal Earth Crystallized Earth 30260 3589Eternal Fire Crystallized Fire 14800 1115Eternal Shadow Crystallized Shadow 18740 1775Eternal Life Crystallized Life 9980 1259Eternal Water Crystallized Water 14520 3258Greater Astral Essence Lesser Astral Essence 11238 2376Greater Eternal Essence Lesser Eternal Essence 9144 1550Greater Magic Essence Lesser Magic Essence 11259 2942Greater Mystic Essence Lesser Mystic Essence 11787 1546Greater Nether Essence Lesser Nether Essence 4515 337Greater Planar Essence Lesser Planar Essence 12720 1277Primal Air Mote of Air 25050 1552Primal Earth Mote of Earth 42600 4988Primal Life Mote of Life 37460 4938Primal Fire Mote of Fire 22130 3312Primal Mana Mote of Mana 30540 3887Primal Shadow Mote of Shadow 19480 4323Primal Water Mote of Water 20650 2844
a Volume of the liquid goodb Volume of the illiquid good

29 A APPENDIX
Table A.8: Correlations of interconvertible goods
Liquid Good Illiquid Good Correlation p-Value
Greater Cosmic Essence Lesser Cosmic Essence 0.6060 0.0002Dream Shard Small Dream Shard 0.7947 0.0000Eternal Air Crystallized Air -0.1103 0.5477Eternal Earth Crystallized Earth 0.7308 0.0000Eternal Fire Crystallized Fire 0.1845 0.3120Eternal Shadow Crystallized Shadow 0.3893 0.0406Eternal Life Crystallized Life 0.7259 0.0000Eternal Water Crystallized Water 0.4666 0.0071Greater Astral Essence Lesser Astral Essence 0.1658 0.1869Greater Eternal Essence Lesser Eternal Essence -0.0581 0.6459Greater Magic Essence Lesser Magic Essence 0.5001 0.0000Greater Mystic Essence Lesser Mystic Essence -0.0621 0.6229Greater Nether Essence Lesser Nether Essence 0.3944 0.0013Greater Planar Essence Lesser Planar Essence 0.4093 0.0008
Table A.9: Correlations of partially interconvertible goods
Liquid Good Illiquid Good Correlation p-Value
Primal Air Mote of Air 0.4489 0.0002Primal Earth Mote of Earth 0.1195 0.3507Primal Life Mote of Life 0.3340 0.0066Primal Fire Mote of Fire 0.3931 0.0012Primal Mana Mote of Mana 0.8412 0.0000Primal Shadow Mote of Shadow 0.7317 0.0000Primal Water Mote of Water 0.6702 0.0000

30 A APPENDIX
Table A.10: Arbitrage profits of interconvertible goods over the observationperiod
Liquid Good Illiquid Good Total Arbitrage Profits
Greater Cosmic Essence Lesser Cosmic Essence 0Dream Shard Small Dream Shard 222.52Eternal Air Crystallized Air 0Eternal Earth Crystallized Earth 0Eternal Fire Crystallized Fire 0Eternal Shadow Crystallized Shadow 0Eternal Life Crystallized Life 3208.40Eternal Water Crystallized Water 0Greater Astral Essence Lesser Astral Essence 1.71Greater Eternal Essence Lesser Eternal Essence 2759.60Greater Magic Essence Lesser Magic Essence 1587.30Greater Mystic Essence Lesser Mystic Essence 52.45Greater Nether Essence Lesser Nether Essence 66.74Greater Planar Essence Lesser Planar Essence 3869.60
Table A.11: Arbitrage profits of partially interconvertible goods over theobservation period
Liquid Good Illiquid Good Total Arbitrage Profits
Primal Air Mote of Air 1586.50Primal Earth Mote of Earth 1031.10Primal Life Mote of Life 3532.80Primal Fire Mote of Fire 1031.50Primal Mana Mote of Mana 1929.80Primal Shadow Mote of Shadow 3024.40Primal Water Mote of Water 0

31 A APPENDIX
Figure A.9: Arbitrage profits of Dream Shards & Small Dream Shards
11/16/08 12/02/0810
20
30
40M
edia
npri
ce
11/16/08 12/02/08
20406080
100120
Vol
um
e
11/16/08 12/02/080
20
40
Arb
itra
ge

32 A APPENDIX
Figure A.10: Arbitrage profits of Eternal Life & Crystallized Life
11/16/08 12/02/08
20
40
60
80M
edia
npri
ce
11/16/08 12/02/080
50
100
Vol
um
e
11/16/08 12/02/080
200
400
600
800
Arb
itra
ge

33 A APPENDIX
Figure A.11: Arbitrage profits of Greater Eternal Essence & Lesser EternalEssence
10/14/08 11/13/08 12/13/0810
15
20
25
Med
ian
pri
ce
10/14/08 11/13/08 12/13/080
50
100
150
Vol
um
e
10/14/08 11/13/08 12/13/080
100
200
300
Arb
itra
ge

34 A APPENDIX
Figure A.12: Arbitrage profits of Greater Magic Essence & Lesser MagicEssence
10/14/08 11/13/08 12/13/08
0.5
1
1.5
2
Med
ian
pri
ce
10/14/08 11/13/08 12/13/080
100
200
Vol
um
e
10/14/08 11/13/08 12/13/080
50
100
150
Arb
itra
ge

35 References
References
Baye, M. R., & Morgan, J. (2006). Information, Search, and Price Disper-
sion. http://www.nash-equilibrium.com/baye/Handbook.pdf.
Blizzard. (2008). WORLD OF WARCRAFT SUBSCRIBER BASE
REACHES 11.5 MILLION WORLDWIDE. http://eu.blizzard
.com/en/press/081223.html.
Blizzard. (2009). Auction Houses. http://www.worldofwarcraft.com/
info/basics/auctionhouses.html.
Castronova, E. (2001). Virtual Worlds: A First-Hand Account of Market
and Society on the Cyberian Frontier [Working Paper Series]. SSRN
eLibrary . http://ssrn.com/paper=294828.
Heeks, R. (2008). Current Analysis and Future Research Agenda on ”Gold
Farming”: Real-World Production in Developing Countries for the Vir-
tual Economies of Online Games. http://www.sed.manchester.ac
.uk/idpm/research/publications/wp/di/di wp32.htm.
Lehdonvirta, V. (2005). Virtual Economics: Applying economics to the
study of game worlds. In Proceedings of Future Play. http://virtual
-economy.org/files/Lehdonvirta-2005-Virtual-Economics.pdf.
Lehtiniemi, T. (2008). Macroeconomic Indicators in a Virtual Econ-
omy. Unpublished master’s thesis, University of Helsinki. https://
oa.doria.fi/bitstream/handle/10024/37870/macroeco.pdf.
Nash, J., & Scheneyer, E. (2004). Virtual Economies: An In-Depth Look at
the Virtual World of Final Fantasy XI: Online. http://lgst.wharton
.upenn.edu/hunterd/VirtualEconomies.pdf.
Sandmann, K. (2001). Einfuhrung in die Stochastik der Finanzmarkte.
Springer.
Taleb, N. N. (2007). The Black Swan. Random House.
Yamaguchi, H. (2004). An Analysis of Virtual Currencies in Online Games.
SSRN eLibrary . http://ssrn.com/paper=544422.

36 References
Eigenstandigkeitserklarung
Ich erklare hiermit,
- dass ich die vorliegende Arbeit ohne fremde Hilfe und ohne Verwendung
anderer als der angegebenen Hilfsmittel verfasst habe,
- dass ich samtliche verwendeten Quellen erwahnt und gemass gangigen
wissenschaftlichen Zitierregeln nach bestem Wissen und Gewissen kor-
rekt zitiert habe.