market performance, u.s. - morningstar,...
TRANSCRIPT

× Market Performance, U.S.
× Market Performance, International
× Economy
× Interest Rates and Inflation
About the Morningstar Markets Observer
This material is being provided by Morningstar Investment Services LLC. All material in this presentation was created and published by our parent company, Morningstar, Inc. Morningstar Investment Services LLC is a registered investment adviser and subsidiary of Morningstar Investment Management LLC. Portfolio construction and ongoing monitoring and maintenance of the model portfolios is provided on Morningstar Investment Services' behalf by Morningstar Investment Management LLC, a registered investment adviser and subsidiary of Morningstar, Inc.
Morningstar Investment Services offers managed portfolios of mutual funds, stocks, and ETFs. To learn more, go to www.mp.morningstar.com or call 877 626-3224.
Table of Contents
Market Overview, U.S.
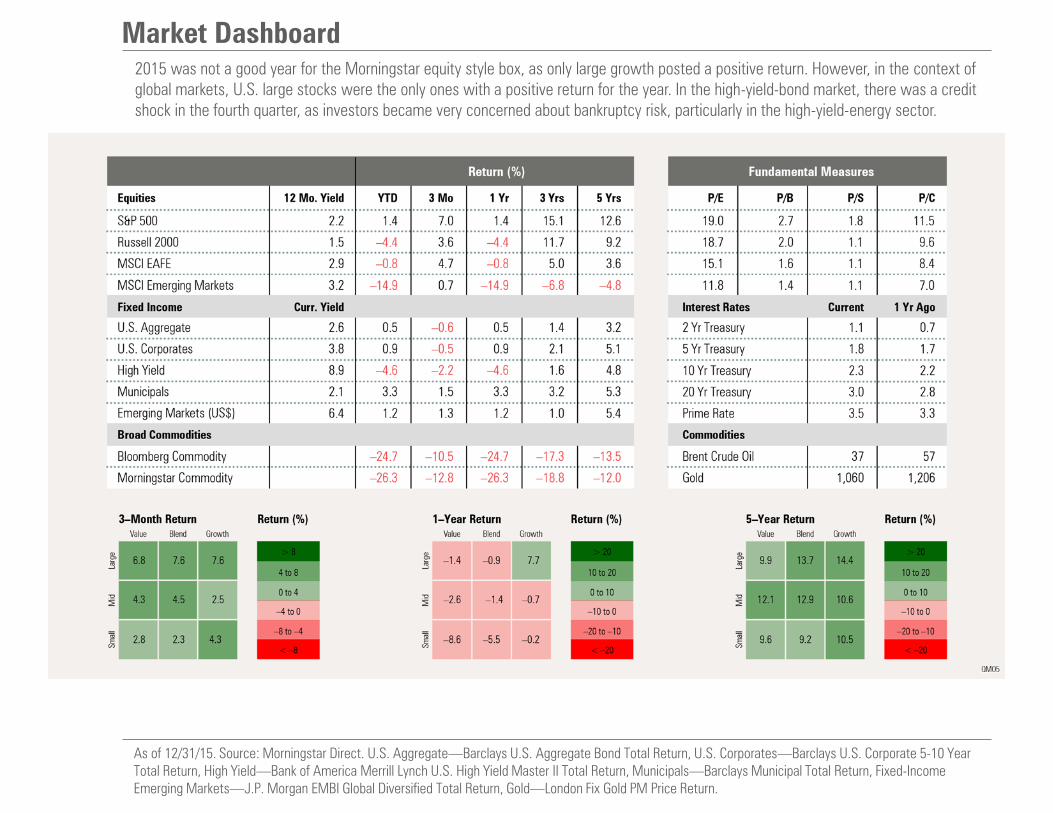
Market Dashboard 2015 was not a good year for the Morningstar equity style box, as only large growth posted a positive return. However, in the context of global markets, U.S. large stocks were the only ones with a positive return for the year. In the high-yield-bond market, there was a credit shock in the fourth quarter, as investors became very concerned about bankruptcy risk, particularly in the high-yield-energy sector.
As of 12/31/15. Source: Morningstar Direct. U.S. Aggregate—Barclays U.S. Aggregate Bond Total Return, U.S. Corporates—Barclays U.S. Corporate 5-10 Year Total Return, High Yield—Bank of America Merrill Lynch U.S. High Yield Master II Total Return, Municipals—Barclays Municipal Total Return, Fixed-Income Emerging Markets—J.P. Morgan EMBI Global Diversified Total Return, Gold—London Fix Gold PM Price Return.
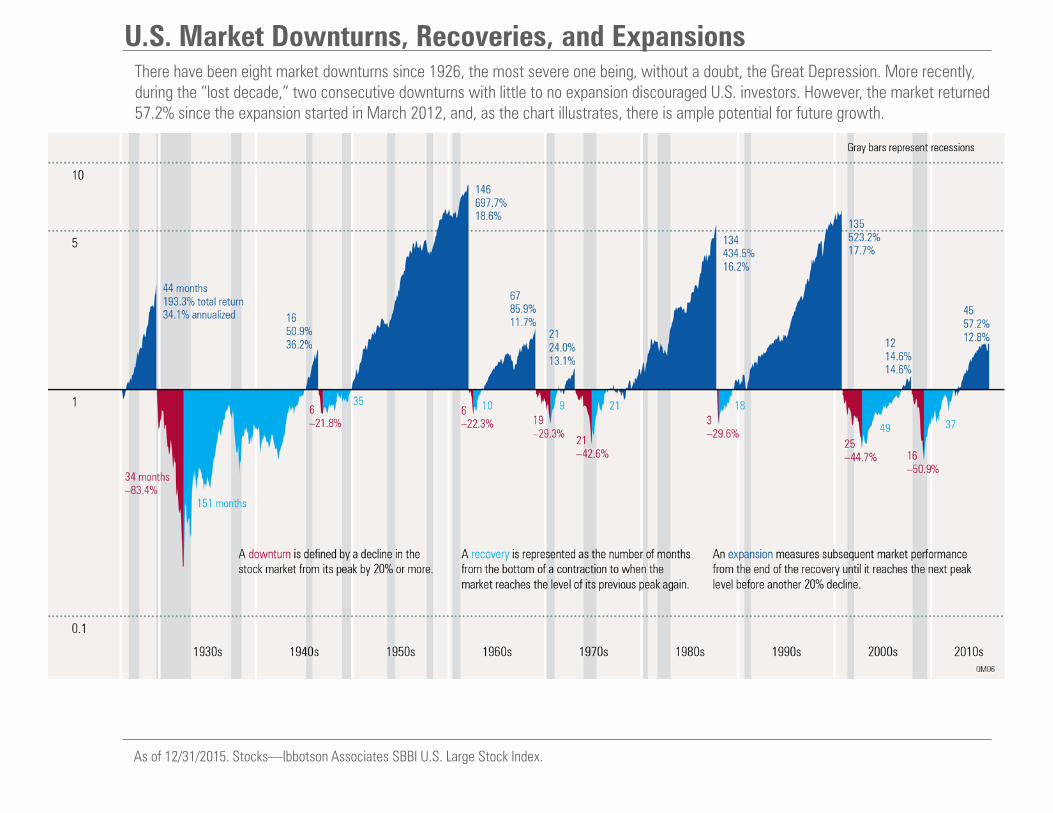
U.S. Market Downturns, Recoveries, and Expansions
There have been eight market downturns since 1926, the most severe one being, without a doubt, the Great Depression. More recently, during the “lost decade,” two consecutive downturns with little to no expansion discouraged U.S. investors. However, the market returned 57.2% since the expansion started in March 2012, and, as the chart illustrates, there is ample potential for future growth.
As of 12/31/2015. Stocks—Ibbotson Associates SBBI U.S. Large Stock Index.
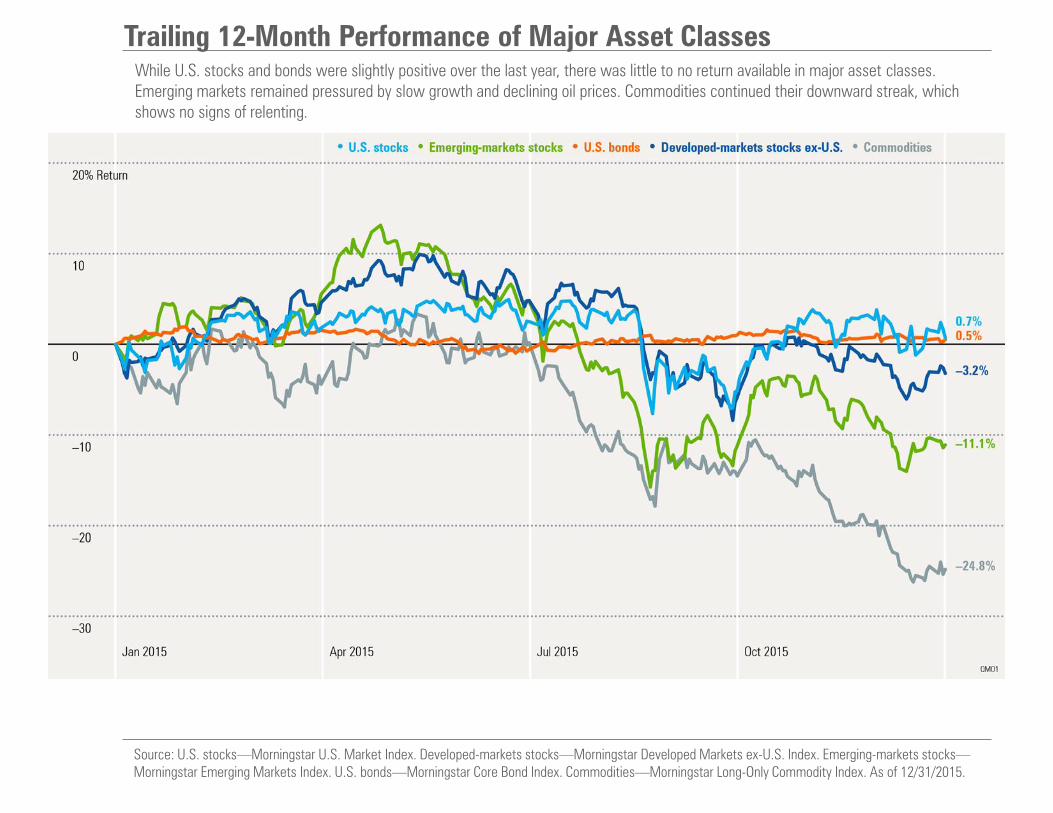
Trailing 12-Month Performance of Major Asset Classes
While U.S. stocks and bonds were slightly positive over the last year, there was little to no return available in major asset classes. Emerging markets remained pressured by slow growth and declining oil prices. Commodities continued their downward streak, which shows no signs of relenting.
Source: U.S. stocks—Morningstar U.S. Market Index. Developed-markets stocks—Morningstar Developed Markets ex-U.S. Index. Emerging-markets stocks—Morningstar Emerging Markets Index. U.S. bonds—Morningstar Core Bond Index. Commodities—Morningstar Long-Only Commodity Index. As of 12/31/2015.
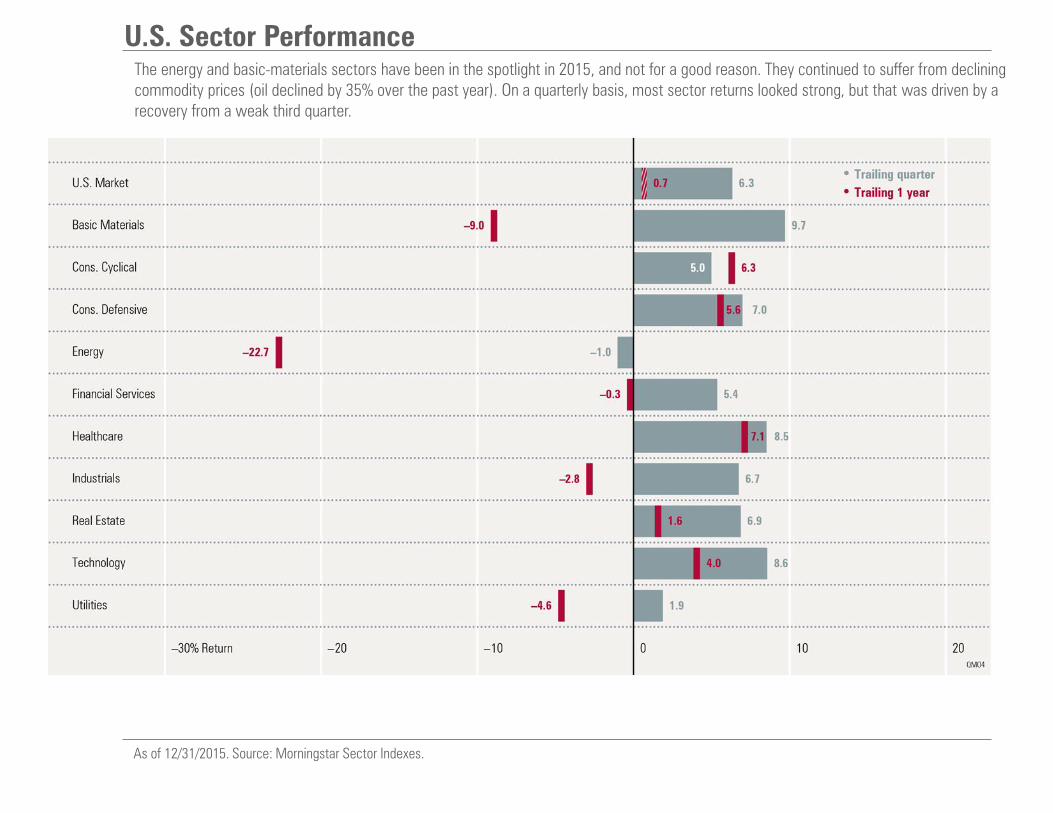
U.S. Sector Performance The energy and basic-materials sectors have been in the spotlight in 2015, and not for a good reason. They continued to suffer from declining commodity prices (oil declined by 35% over the past year). On a quarterly basis, most sector returns looked strong, but that was driven by a recovery from a weak third quarter.
As of 12/31/2015. Source: Morningstar Sector Indexes.
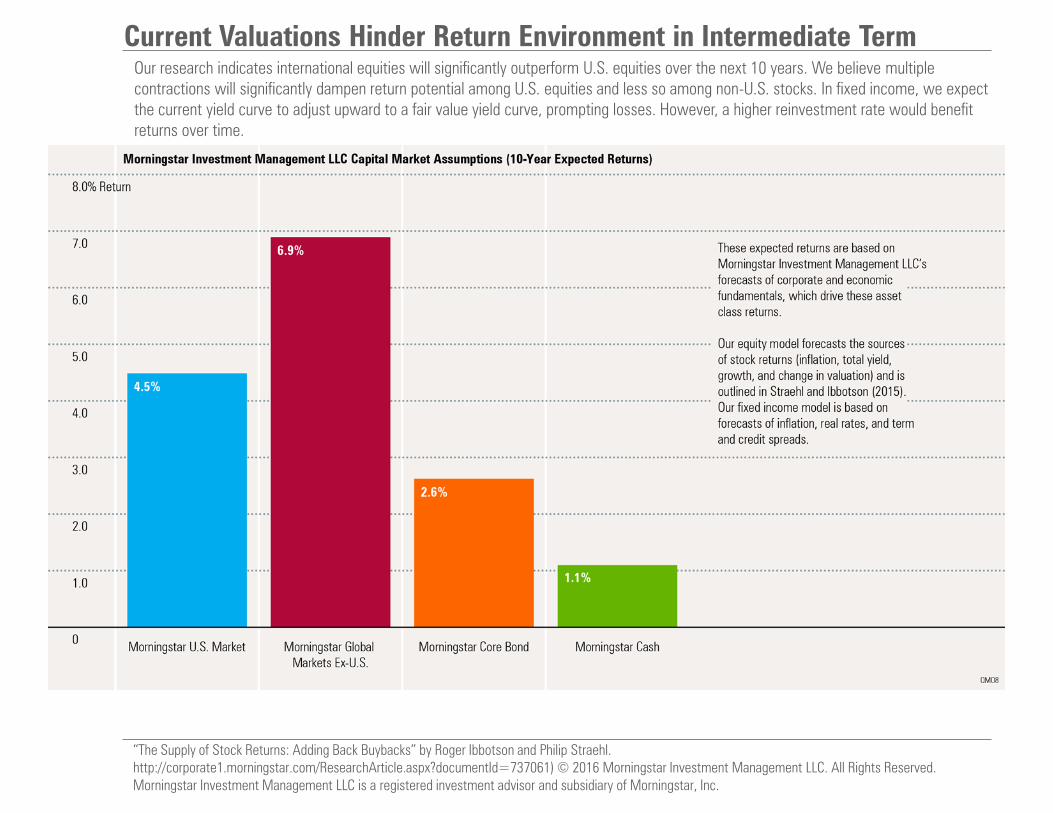
Current Valuations Hinder Return Environment in Intermediate Term Our research indicates international equities will significantly outperform U.S. equities over the next 10 years. We believe multiple contractions will significantly dampen return potential among U.S. equities and less so among non-U.S. stocks. In fixed income, we expect the current yield curve to adjust upward to a fair value yield curve, prompting losses. However, a higher reinvestment rate would benefit returns over time.
“The Supply of Stock Returns: Adding Back Buybacks” by Roger Ibbotson and Philip Straehl.
http://corporate1.morningstar.com/ResearchArticle.aspx?documentId=737061) © 2016 Morningstar Investment Management LLC. All Rights Reserved.
Morningstar Investment Management LLC is a registered investment advisor and subsidiary of Morningstar, Inc.
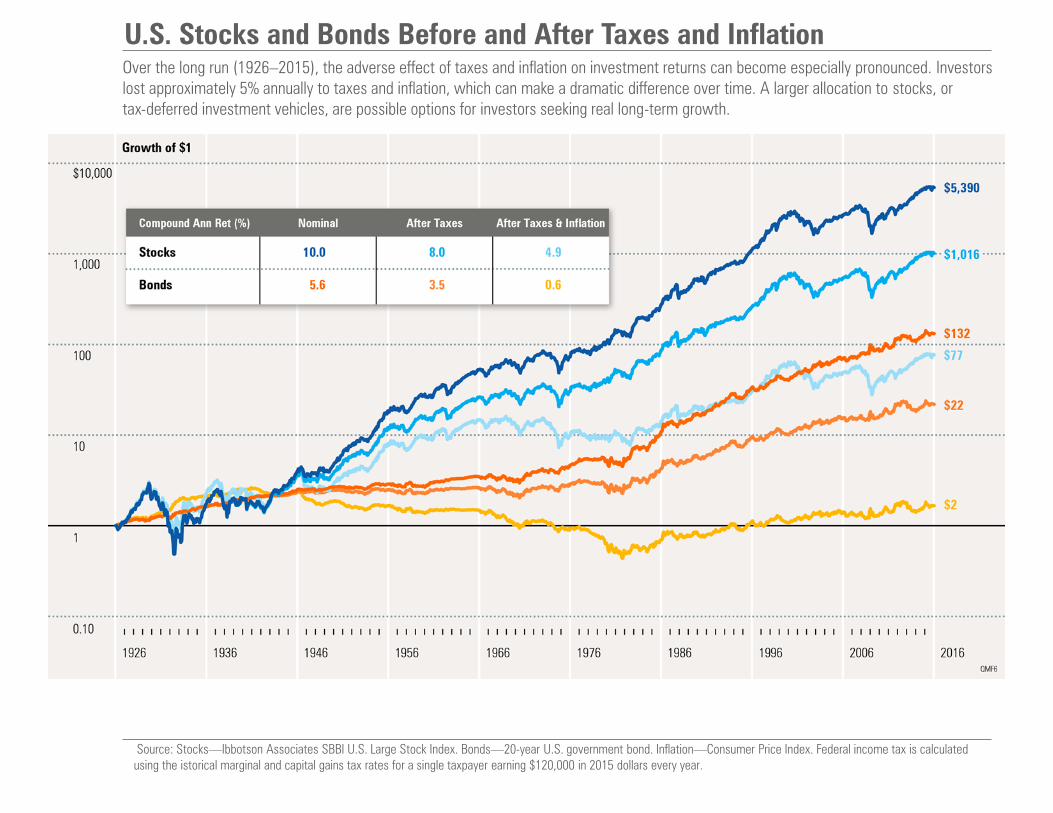
U.S. Stocks and Bonds Before and After Taxes and Inflation
Over the long run (1926–2015), the adverse effect of taxes and inflation on investment returns can become especially pronounced. Investors lost approximately 5% annually to taxes and inflation, which can make a dramatic difference over time. A larger allocation to stocks, or tax-deferred investment vehicles, are possible options for investors seeking real long-term growth.
Source: Stocks—Ibbotson Associates SBBI U.S. Large Stock Index. Bonds—20-year U.S. government bond. Inflation—Consumer Price Index. Federal income tax is calculated using the istorical marginal and capital gains tax rates for a single taxpayer earning $120,000 in 2015 dollars every year.
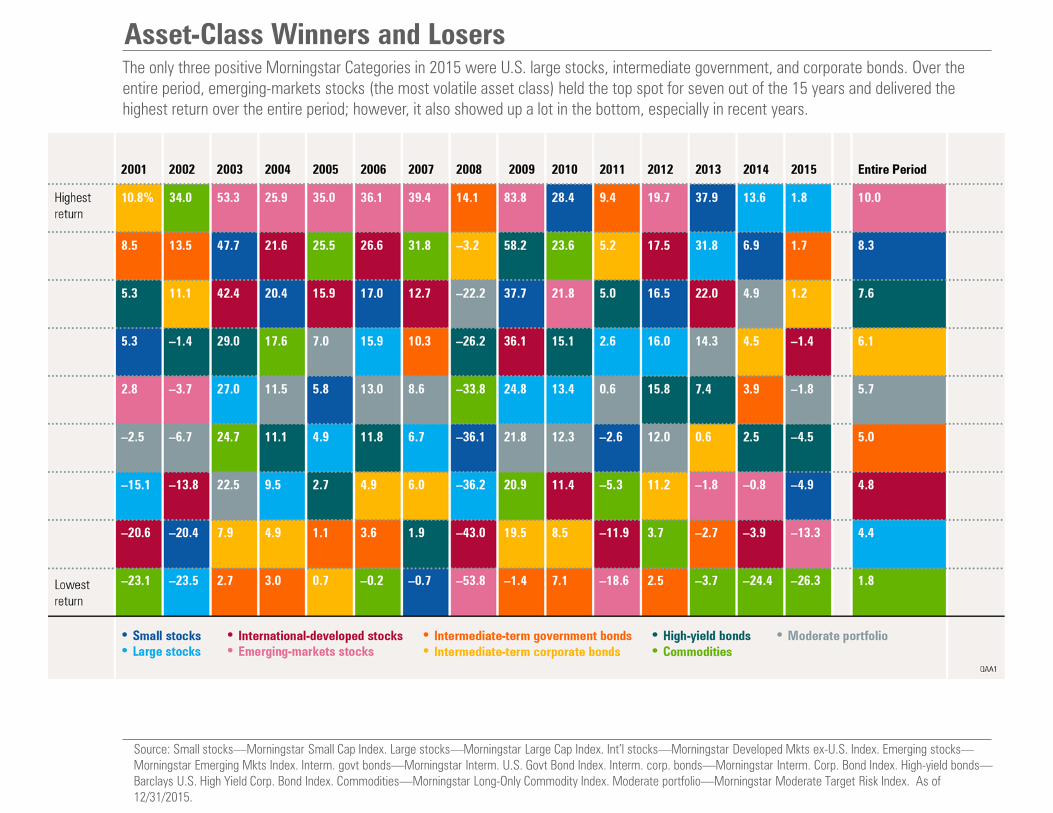
Asset-Class Winners and Losers
The only three positive Morningstar Categories in 2015 were U.S. large stocks, intermediate government, and corporate bonds. Over the entire period, emerging-markets stocks (the most volatile asset class) held the top spot for seven out of the 15 years and delivered the highest return over the entire period; however, it also showed up a lot in the bottom, especially in recent years.
Source: Small stocks—Morningstar Small Cap Index. Large stocks—Morningstar Large Cap Index. Int’l stocks—Morningstar Developed Mkts ex-U.S. Index. Emerging stocks—Morningstar Emerging Mkts Index. Interm. govt bonds—Morningstar Interm. U.S. Govt Bond Index. Interm. corp. bonds—Morningstar Interm. Corp. Bond Index. High-yield bonds—Barclays U.S. High Yield Corp. Bond Index. Commodities—Morningstar Long-Only Commodity Index. Moderate portfolio—Morningstar Moderate Target Risk Index. As of 12/31/2015.
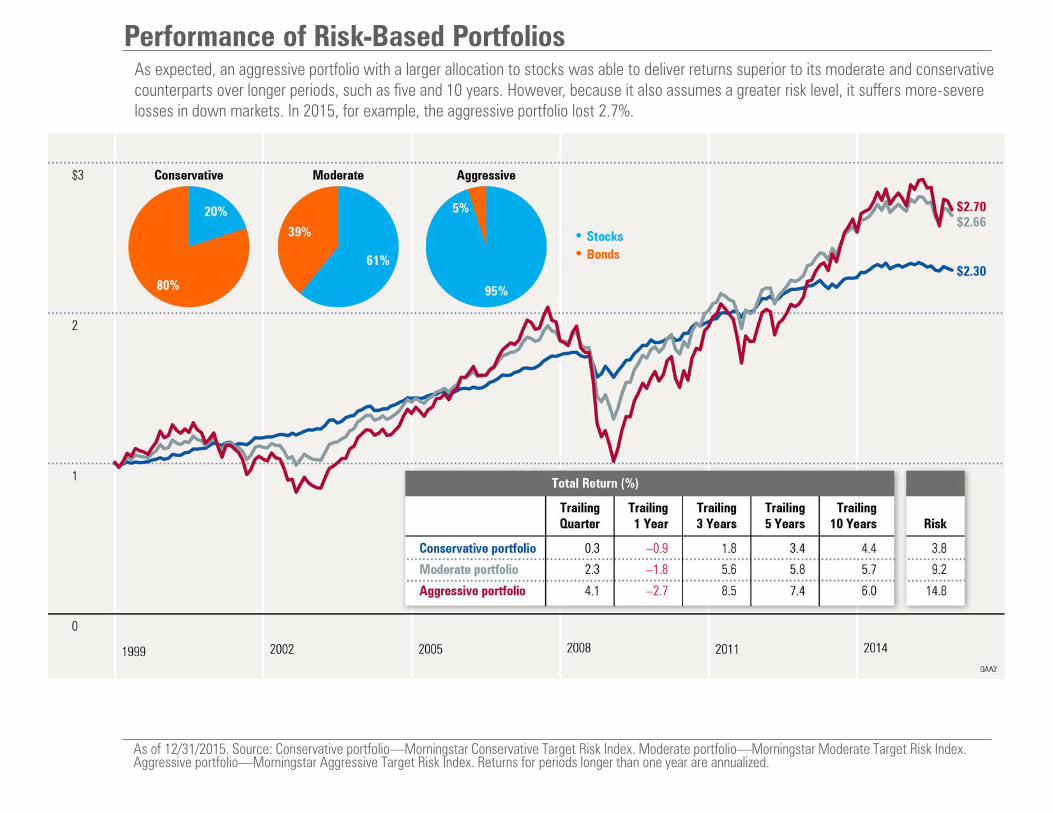
Performance of Risk-Based Portfolios As expected, an aggressive portfolio with a larger allocation to stocks was able to deliver returns superior to its moderate and conservative counterparts over longer periods, such as five and 10 years. However, because it also assumes a greater risk level, it suffers more-severe losses in down markets. In 2015, for example, the aggressive portfolio lost 2.7%.
As of 12/31/2015. Source: Conservative portfolio—Morningstar Conservative Target Risk Index. Moderate portfolio—Morningstar Moderate Target Risk Index. Aggressive portfolio—Morningstar Aggressive Target Risk Index. Returns for periods longer than one year are annualized.
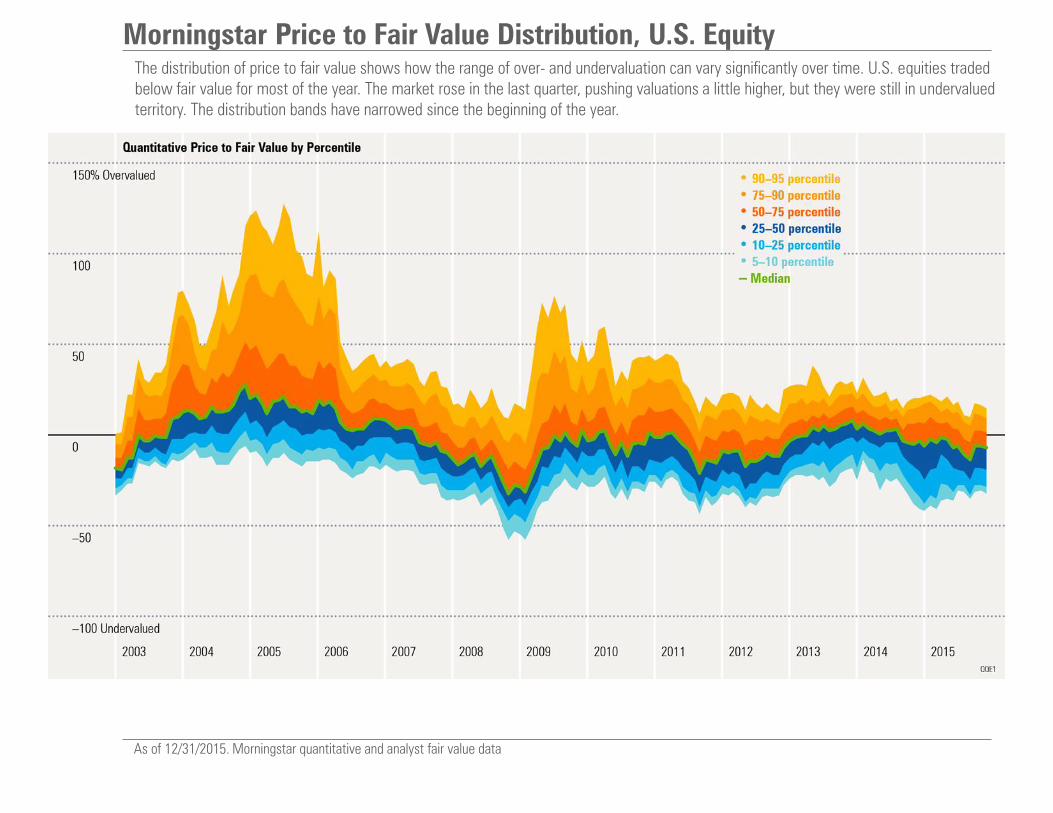
Morningstar Price to Fair Value Distribution, U.S. Equity The distribution of price to fair value shows how the range of over- and undervaluation can vary significantly over time. U.S. equities traded below fair value for most of the year. The market rose in the last quarter, pushing valuations a little higher, but they were still in undervalued territory. The distribution bands have narrowed since the beginning of the year.
As of 12/31/2015. Morningstar quantitative and analyst fair value data
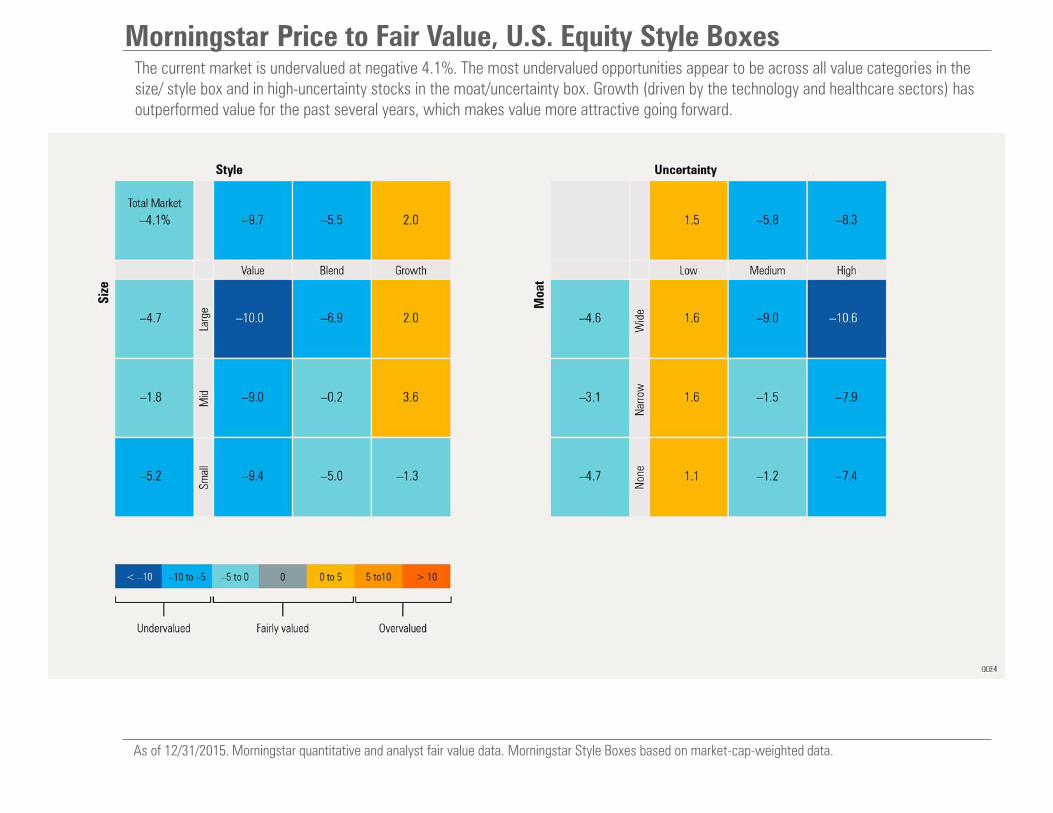
Morningstar Price to Fair Value, U.S. Equity Style Boxes The current market is undervalued at negative 4.1%. The most undervalued opportunities appear to be across all value categories in the size/ style box and in high-uncertainty stocks in the moat/uncertainty box. Growth (driven by the technology and healthcare sectors) has outperformed value for the past several years, which makes value more attractive going forward.
As of 12/31/2015. Morningstar quantitative and analyst fair value data. Morningstar Style Boxes based on market-cap-weighted data.
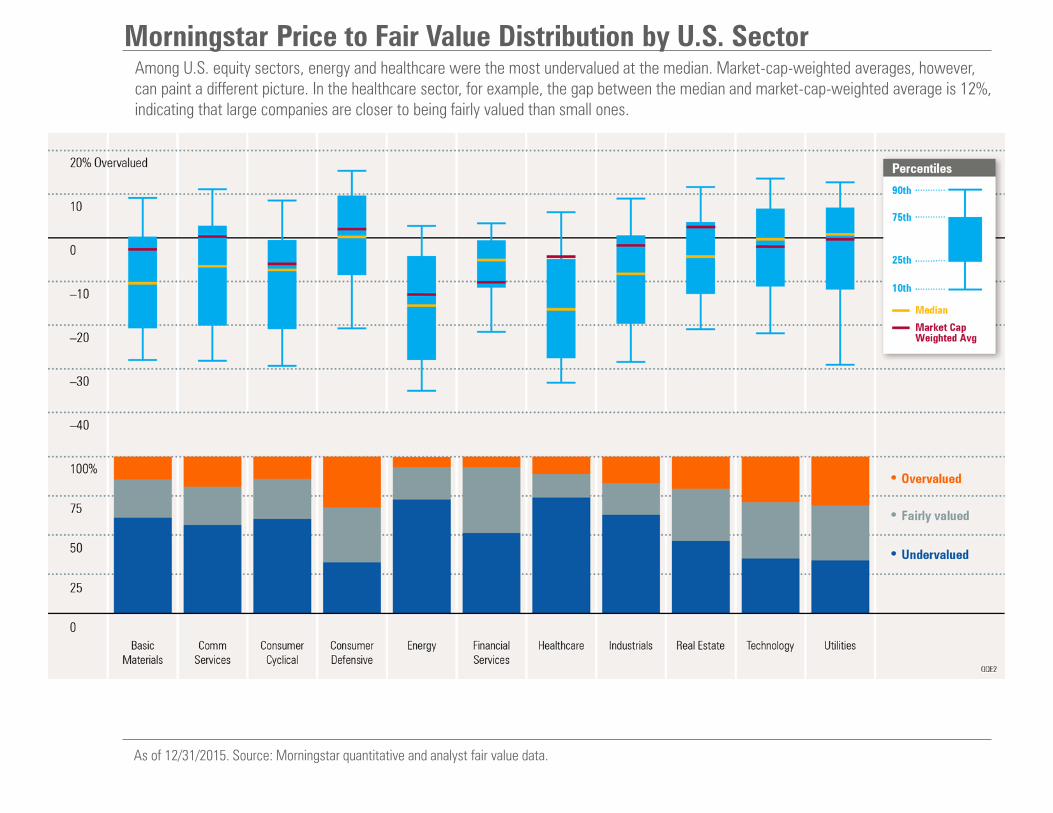
Morningstar Price to Fair Value Distribution by U.S. Sector Among U.S. equity sectors, energy and healthcare were the most undervalued at the median. Market-cap-weighted averages, however, can paint a different picture. In the healthcare sector, for example, the gap between the median and market-cap-weighted average is 12%, indicating that large companies are closer to being fairly valued than small ones.
As of 12/31/2015. Source: Morningstar quantitative and analyst fair value data.
Market Performance, International
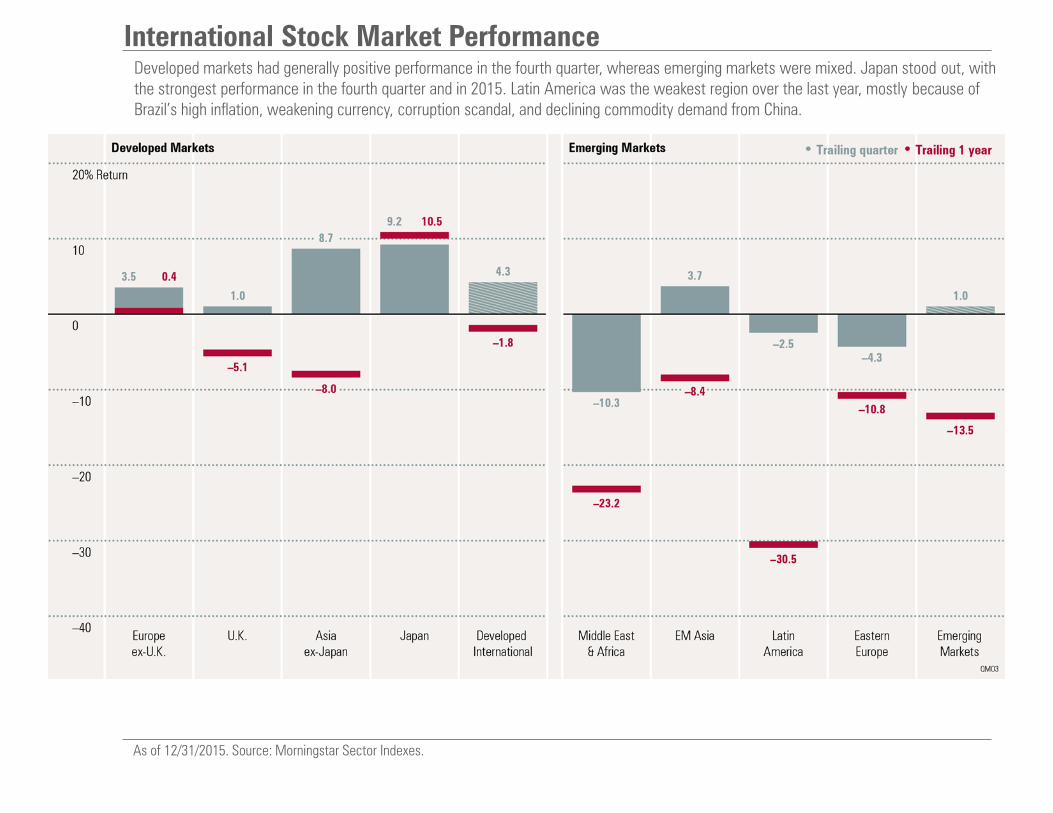
International Stock Market Performance Developed markets had generally positive performance in the fourth quarter, whereas emerging markets were mixed. Japan stood out, with the strongest performance in the fourth quarter and in 2015. Latin America was the weakest region over the last year, mostly because of Brazil’s high inflation, weakening currency, corruption scandal, and declining commodity demand from China.
As of 12/31/2015. Source: Morningstar Sector Indexes.
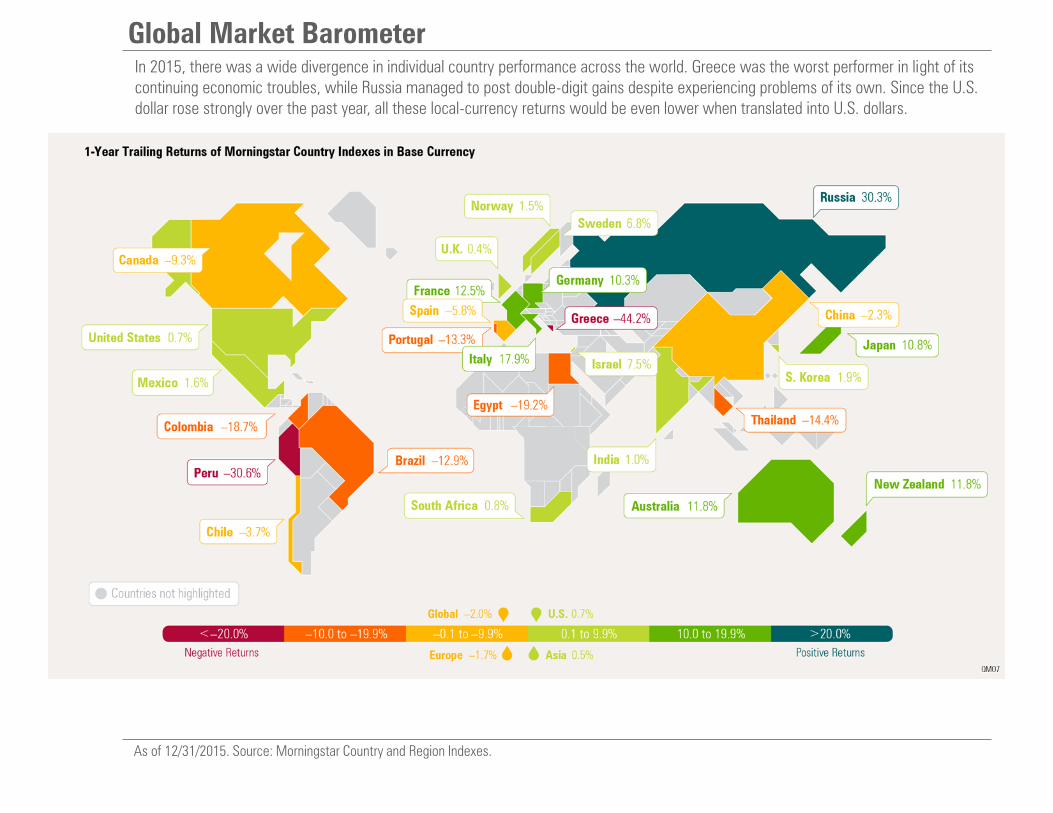
Global Market Barometer In 2015, there was a wide divergence in individual country performance across the world. Greece was the worst performer in light of its continuing economic troubles, while Russia managed to post double-digit gains despite experiencing problems of its own. Since the U.S. dollar rose strongly over the past year, all these local-currency returns would be even lower when translated into U.S. dollars.
As of 12/31/2015. Source: Morningstar Country and Region Indexes.
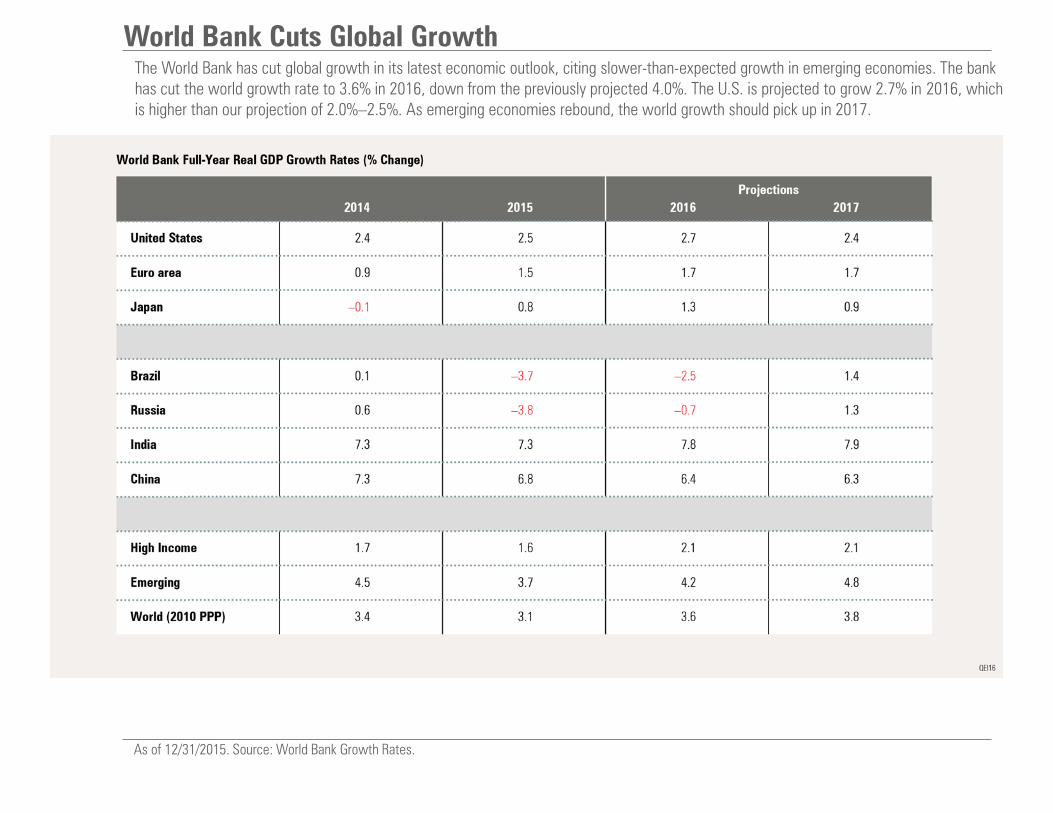
World Bank Cuts Global Growth The World Bank has cut global growth in its latest economic outlook, citing slower-than-expected growth in emerging economies. The bank has cut the world growth rate to 3.6% in 2016, down from the previously projected 4.0%. The U.S. is projected to grow 2.7% in 2016, which is higher than our projection of 2.0%–2.5%. As emerging economies rebound, the world growth should pick up in 2017.
As of 12/31/2015. Source: World Bank Growth Rates.
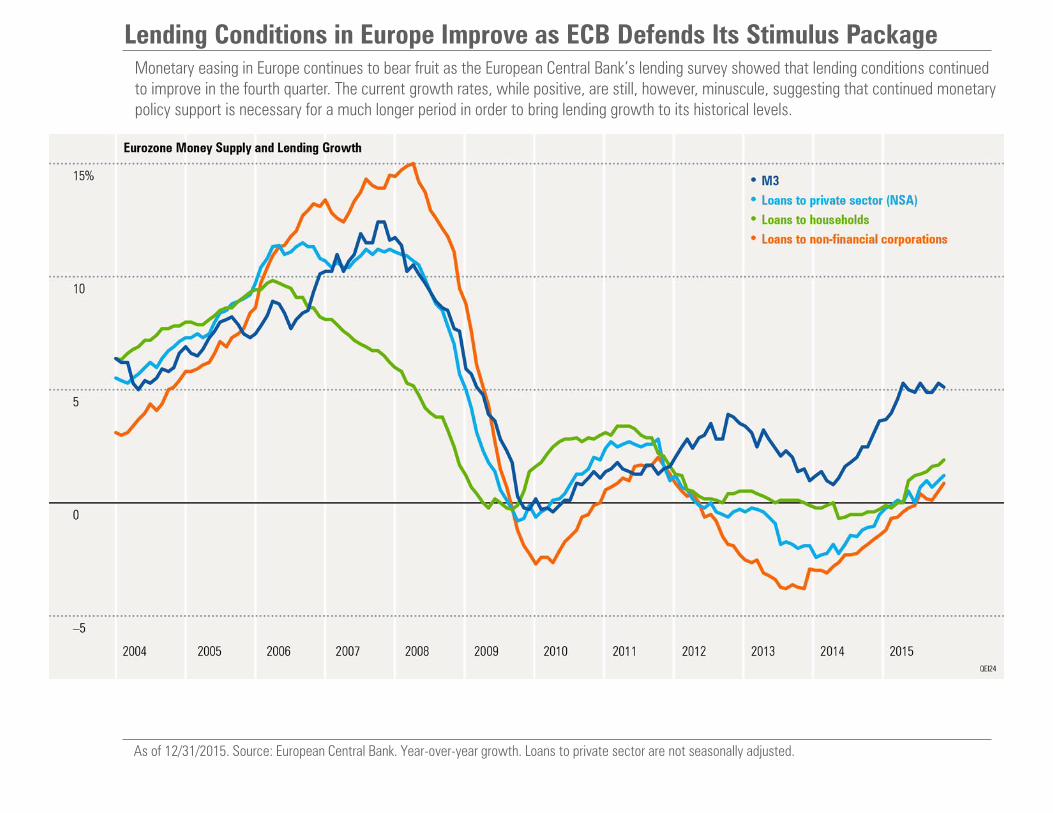
Lending Conditions in Europe Improve as ECB Defends Its Stimulus Package Monetary easing in Europe continues to bear fruit as the European Central Bank’s lending survey showed that lending conditions continued to improve in the fourth quarter. The current growth rates, while positive, are still, however, minuscule, suggesting that continued monetary policy support is necessary for a much longer period in order to bring lending growth to its historical levels.
As of 12/31/2015. Source: European Central Bank. Year-over-year growth. Loans to private sector are not seasonally adjusted.
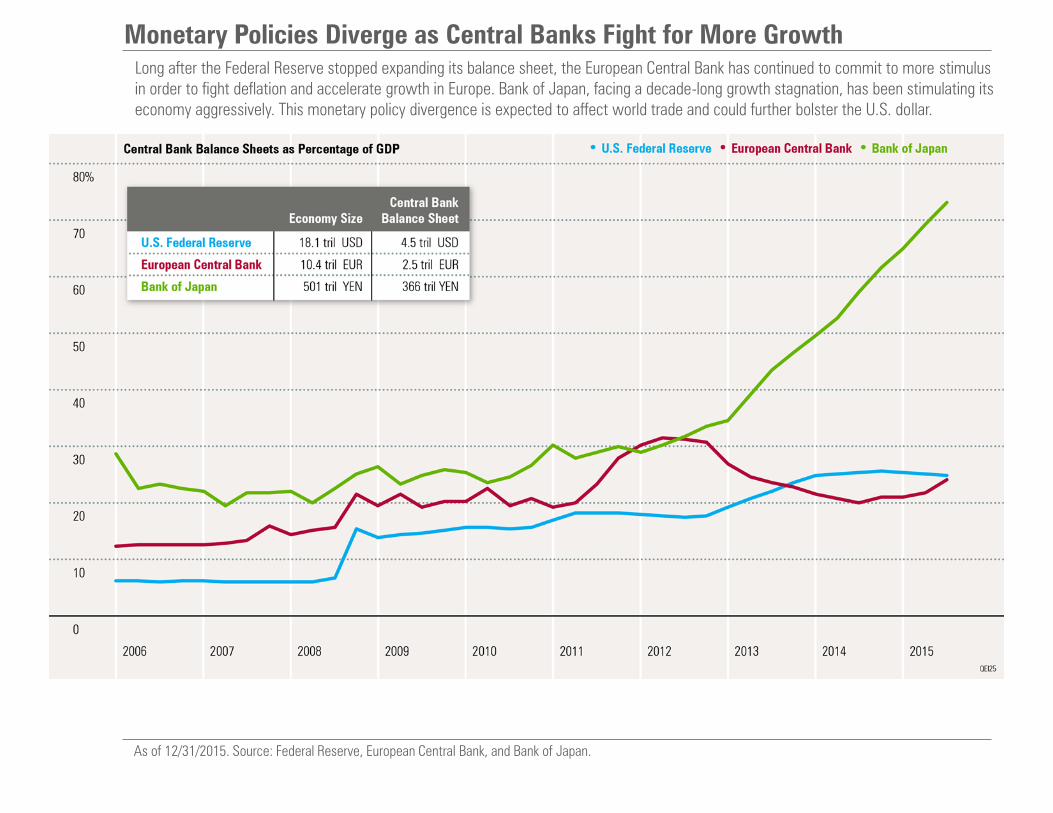
Monetary Policies Diverge as Central Banks Fight for More Growth Long after the Federal Reserve stopped expanding its balance sheet, the European Central Bank has continued to commit to more stimulus in order to fight deflation and accelerate growth in Europe. Bank of Japan, facing a decade-long growth stagnation, has been stimulating its economy aggressively. This monetary policy divergence is expected to affect world trade and could further bolster the U.S. dollar.
As of 12/31/2015. Source: Federal Reserve, European Central Bank, and Bank of Japan.
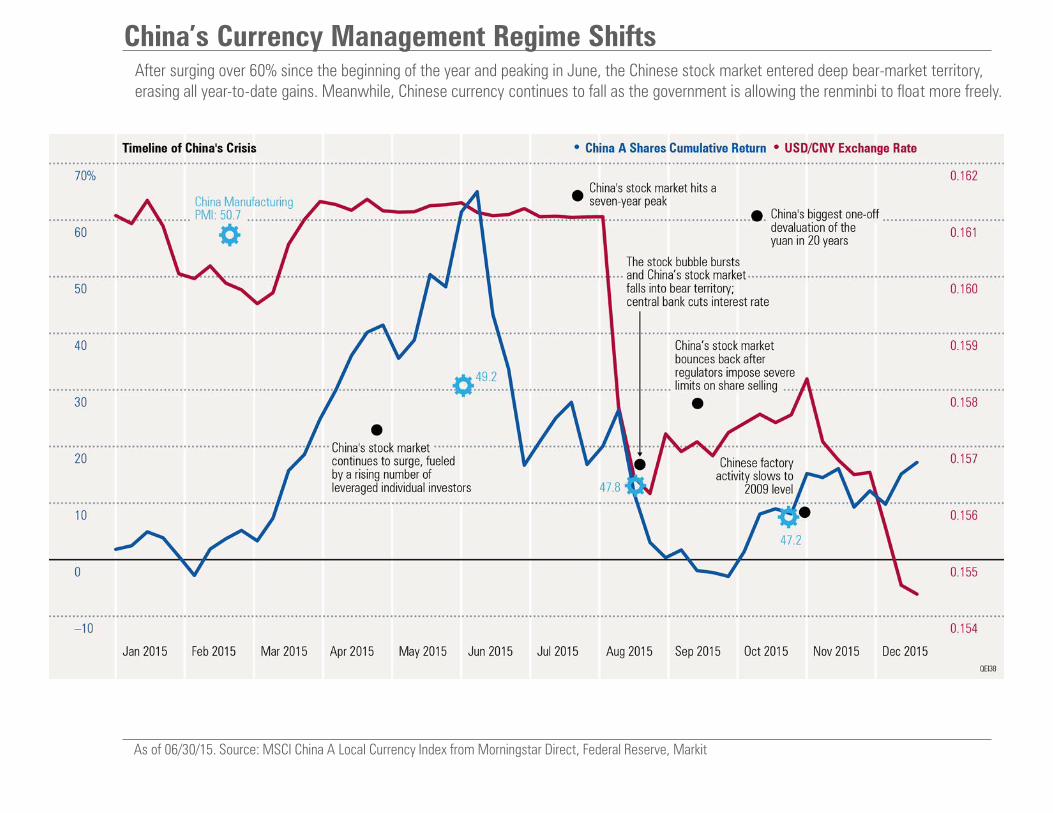
China’s Currency Management Regime Shifts After surging over 60% since the beginning of the year and peaking in June, the Chinese stock market entered deep bear-market territory, erasing all year-to-date gains. Meanwhile, Chinese currency continues to fall as the government is allowing the renminbi to float more freely.
As of 06/30/15. Source: MSCI China A Local Currency Index from Morningstar Direct, Federal Reserve, Markit
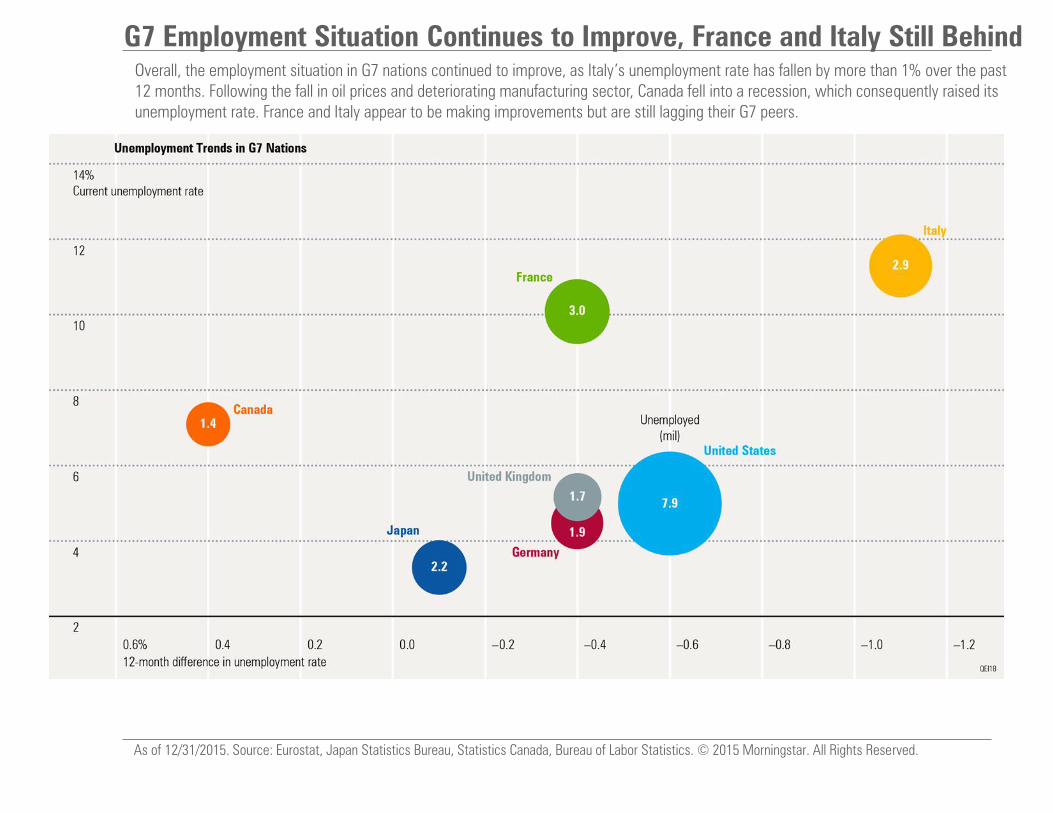
G7 Employment Situation Continues to Improve, France and Italy Still Behind Overall, the employment situation in G7 nations continued to improve, as Italy’s unemployment rate has fallen by more than 1% over the past 12 months. Following the fall in oil prices and deteriorating manufacturing sector, Canada fell into a recession, which consequently raised its unemployment rate. France and Italy appear to be making improvements but are still lagging their G7 peers.
As of 12/31/2015. Source: Eurostat, Japan Statistics Bureau, Statistics Canada, Bureau of Labor Statistics. © 2015 Morningstar. All Rights Reserved.
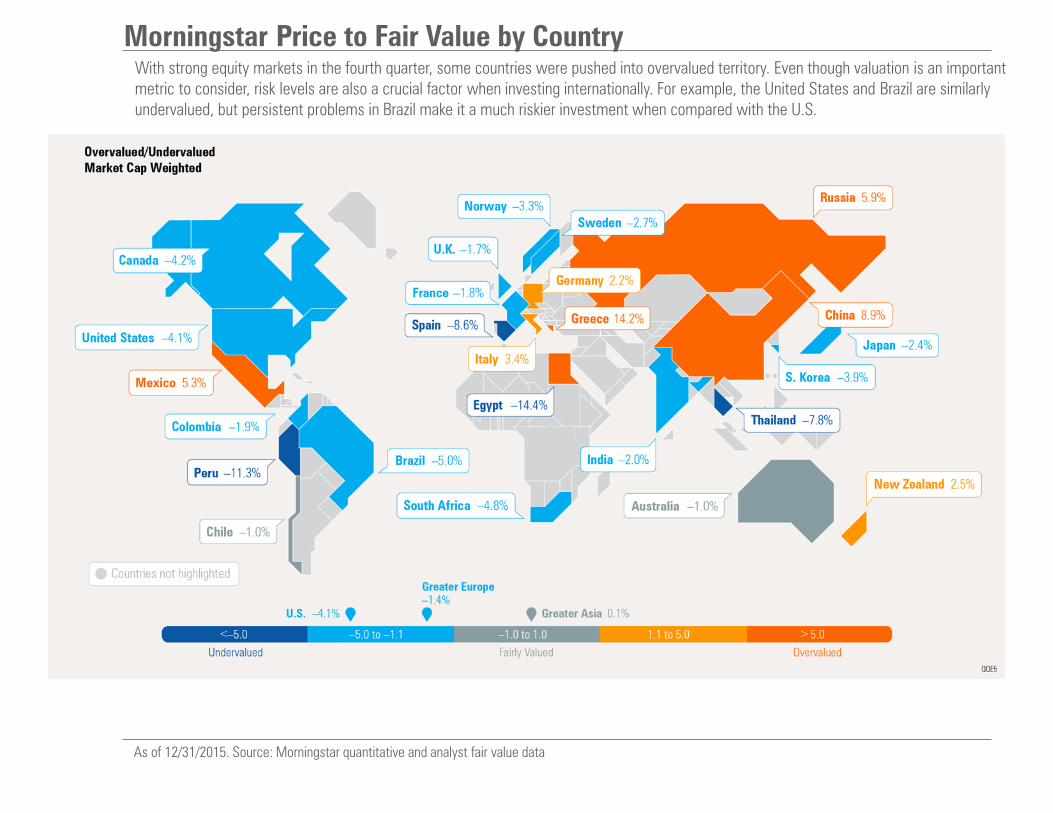
Morningstar Price to Fair Value by Country With strong equity markets in the fourth quarter, some countries were pushed into overvalued territory. Even though valuation is an important metric to consider, risk levels are also a crucial factor when investing internationally. For example, the United States and Brazil are similarly undervalued, but persistent problems in Brazil make it a much riskier investment when compared with the U.S.
As of 12/31/2015. Source: Morningstar quantitative and analyst fair value data

Economy
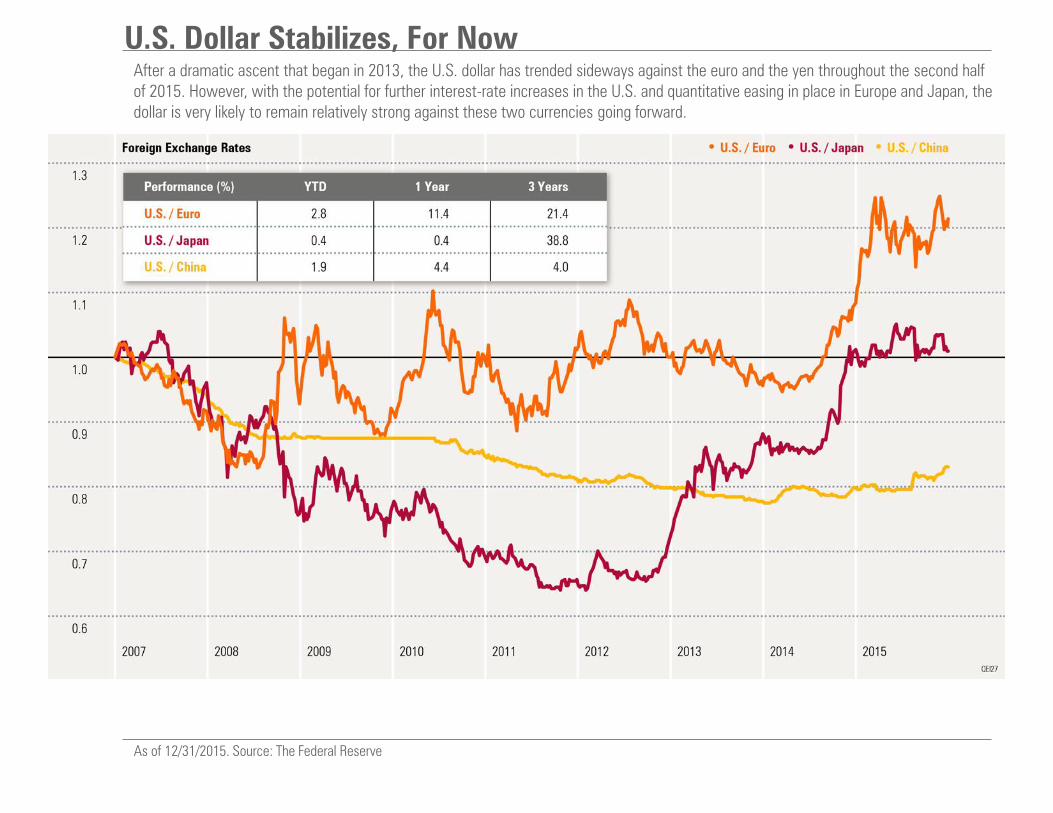
U.S. Dollar Stabilizes, For Now After a dramatic ascent that began in 2013, the U.S. dollar has trended sideways against the euro and the yen throughout the second half of 2015. However, with the potential for further interest-rate increases in the U.S. and quantitative easing in place in Europe and Japan, the dollar is very likely to remain relatively strong against these two currencies going forward.
As of 12/31/2015. Source: The Federal Reserve
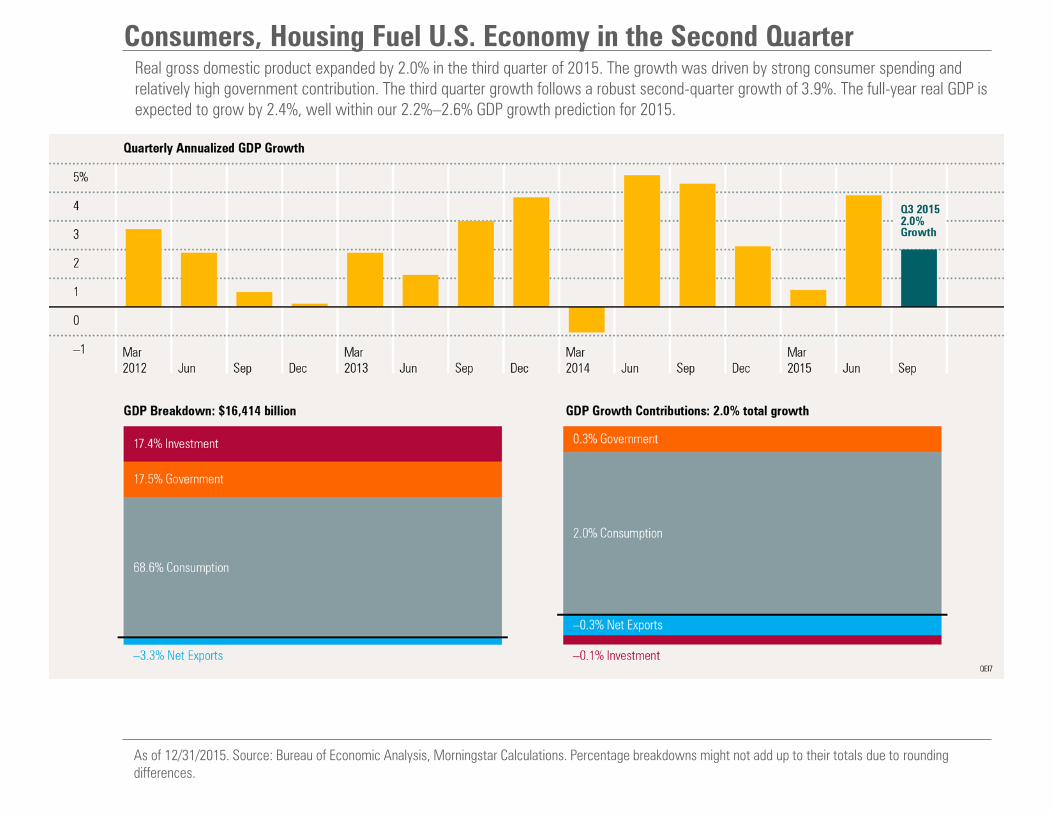
Consumers, Housing Fuel U.S. Economy in the Second Quarter Real gross domestic product expanded by 2.0% in the third quarter of 2015. The growth was driven by strong consumer spending and relatively high government contribution. The third quarter growth follows a robust second-quarter growth of 3.9%. The full-year real GDP is expected to grow by 2.4%, well within our 2.2%–2.6% GDP growth prediction for 2015.
As of 12/31/2015. Source: Bureau of Economic Analysis, Morningstar Calculations. Percentage breakdowns might not add up to their totals due to rounding differences.
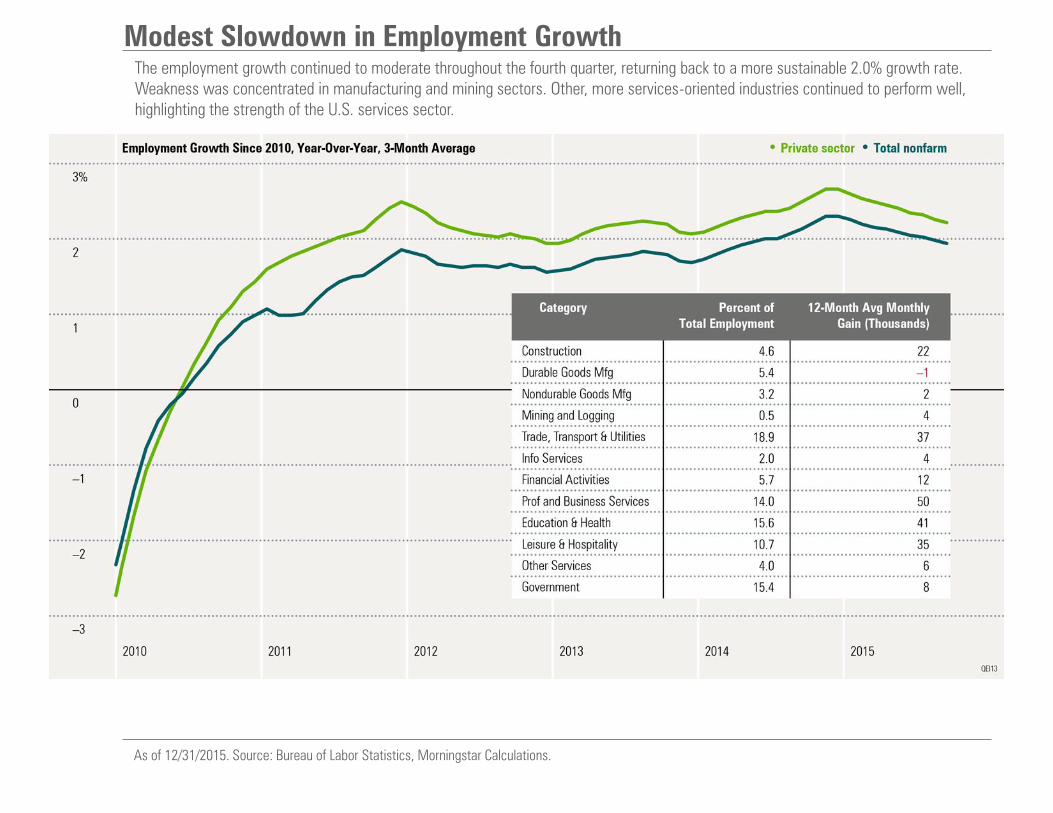
Modest Slowdown in Employment Growth The employment growth continued to moderate throughout the fourth quarter, returning back to a more sustainable 2.0% growth rate. Weakness was concentrated in manufacturing and mining sectors. Other, more services-oriented industries continued to perform well, highlighting the strength of the U.S. services sector.
As of 12/31/2015. Source: Bureau of Labor Statistics, Morningstar Calculations.
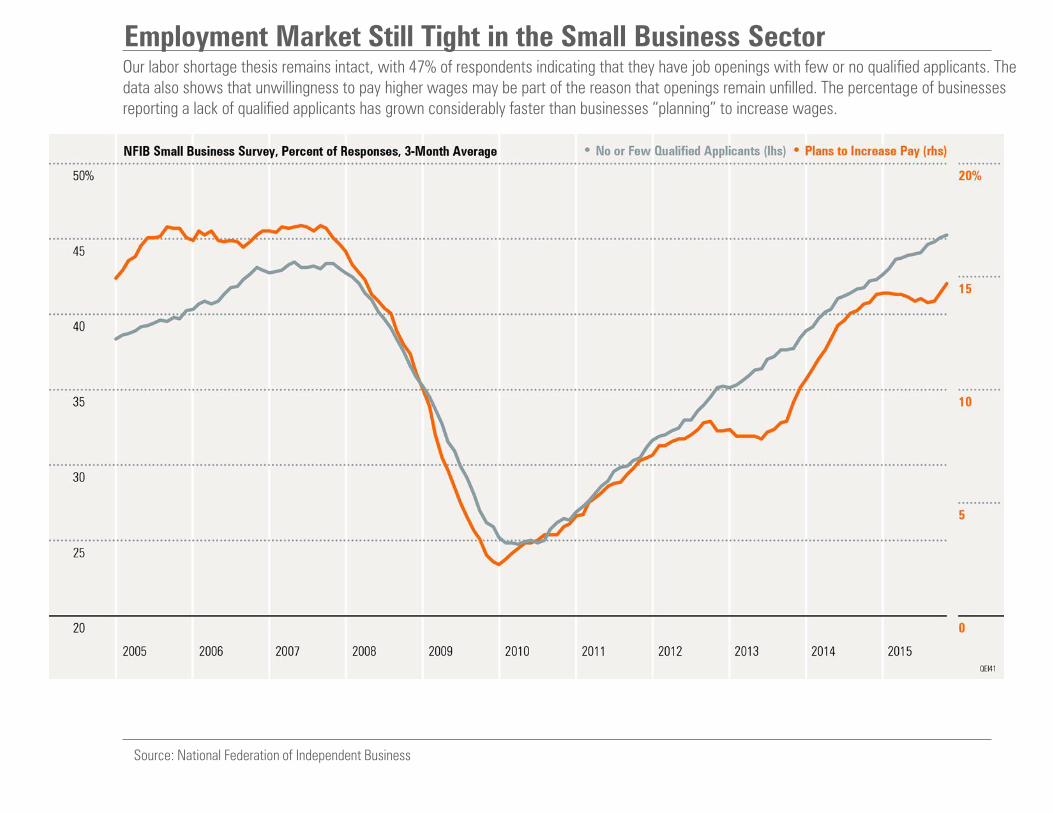
Employment Market Still Tight in the Small Business Sector
Source: National Federation of Independent Business
Our labor shortage thesis remains intact, with 47% of respondents indicating that they have job openings with few or no qualified applicants. The data also shows that unwillingness to pay higher wages may be part of the reason that openings remain unfilled. The percentage of businesses reporting a lack of qualified applicants has grown considerably faster than businesses “planning” to increase wages.
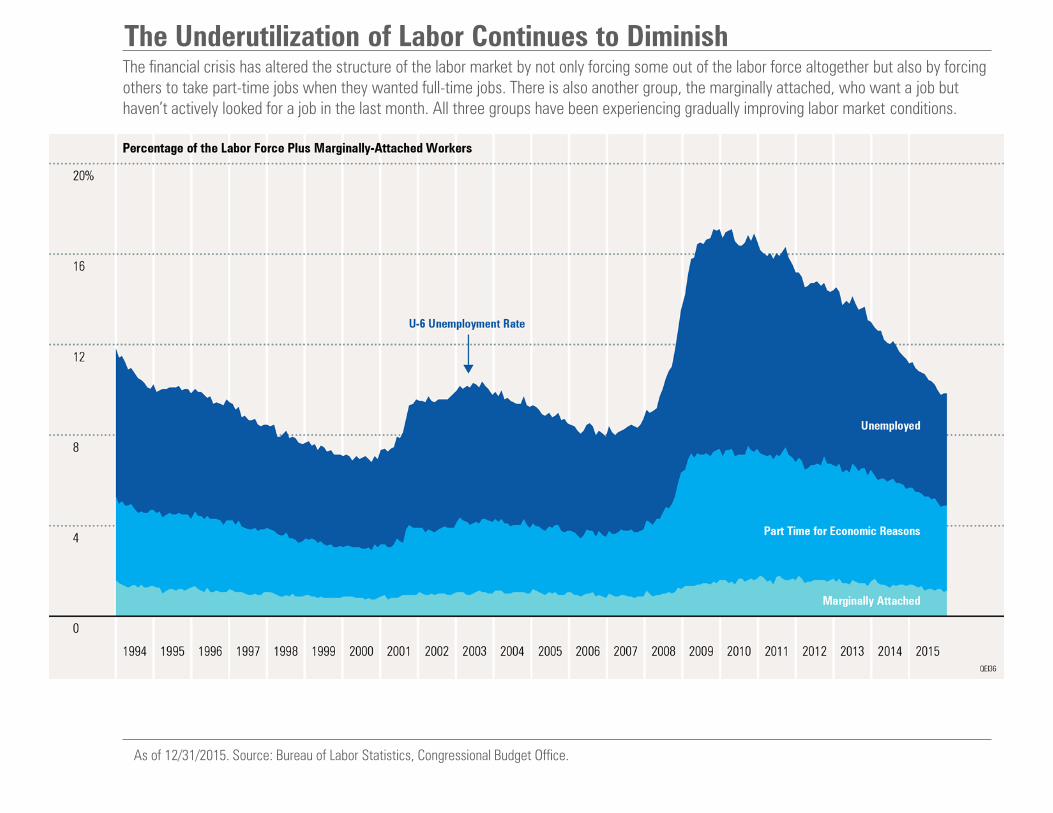
The Underutilization of Labor Continues to Diminish The financial crisis has altered the structure of the labor market by not only forcing some out of the labor force altogether but also by forcing others to take part-time jobs when they wanted full-time jobs. There is also another group, the marginally attached, who want a job but haven’t actively looked for a job in the last month. All three groups have been experiencing gradually improving labor market conditions.
As of 12/31/2015. Source: Bureau of Labor Statistics, Congressional Budget Office.
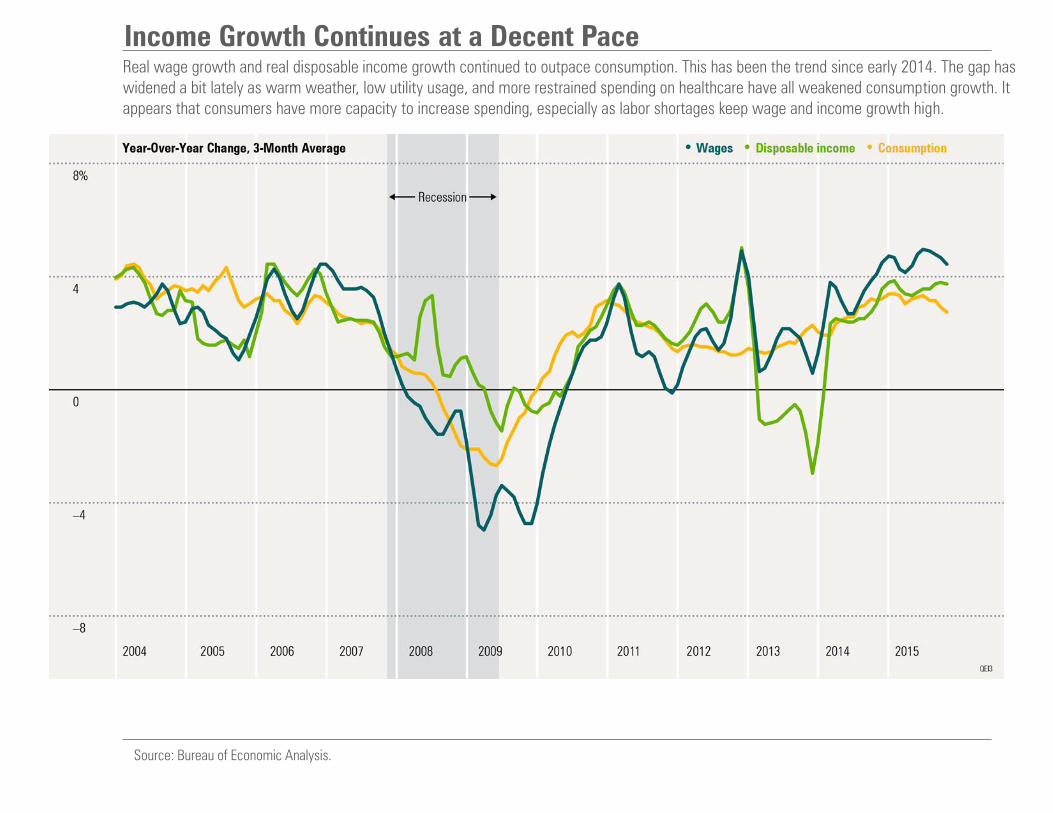
Income Growth Continues at a Decent Pace Real wage growth and real disposable income growth continued to outpace consumption. This has been the trend since early 2014. The gap has widened a bit lately as warm weather, low utility usage, and more restrained spending on healthcare have all weakened consumption growth. It appears that consumers have more capacity to increase spending, especially as labor shortages keep wage and income growth high.
Source: Bureau of Economic Analysis.
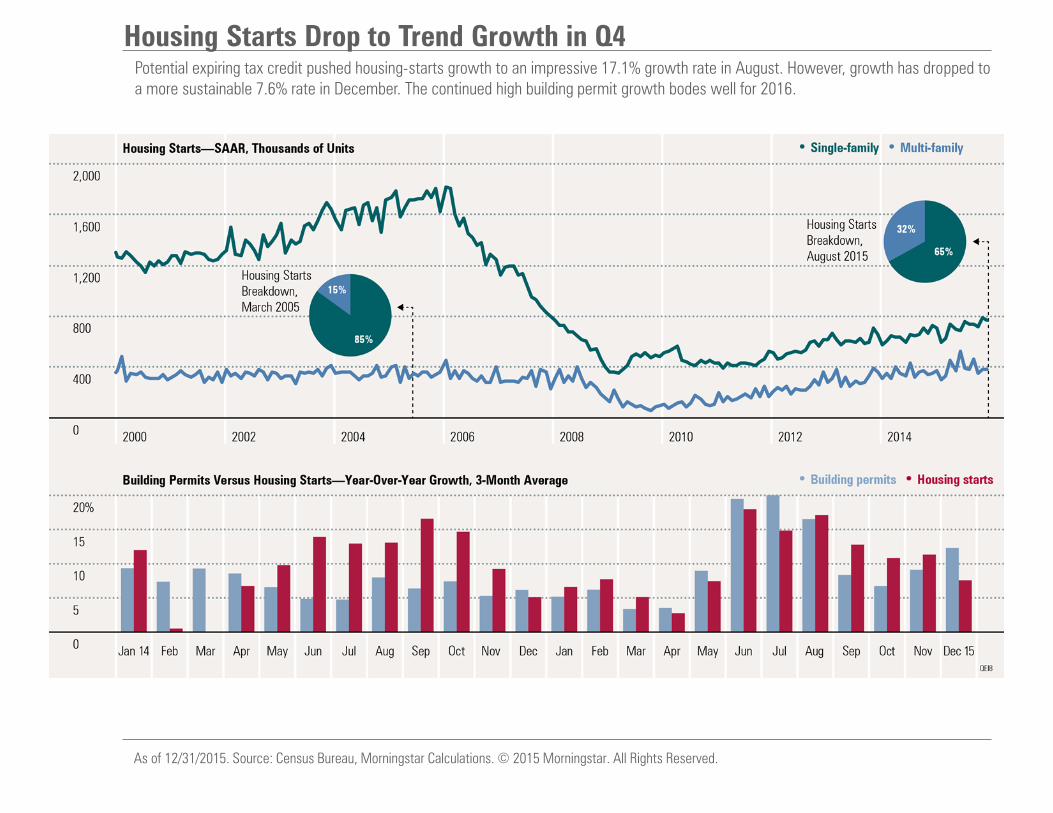
Housing Starts Drop to Trend Growth in Q4 Potential expiring tax credit pushed housing-starts growth to an impressive 17.1% growth rate in August. However, growth has dropped to a more sustainable 7.6% rate in December. The continued high building permit growth bodes well for 2016.
As of 12/31/2015. Source: Census Bureau, Morningstar Calculations. © 2015 Morningstar. All Rights Reserved.
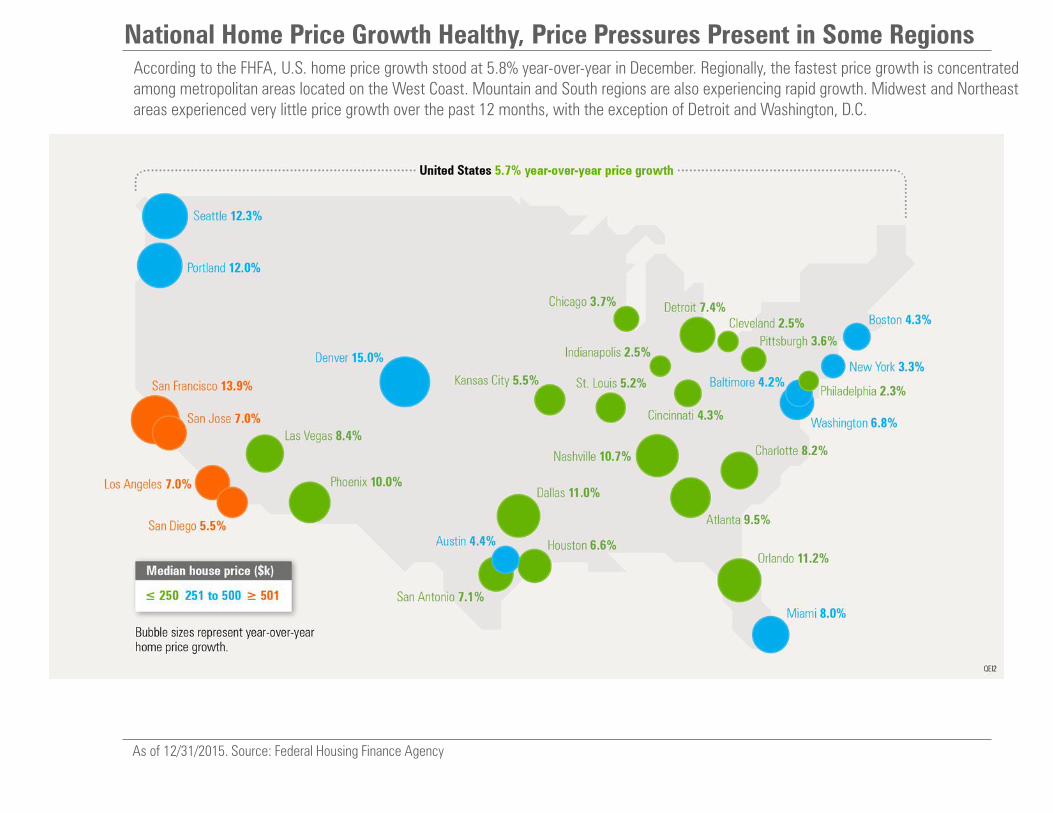
National Home Price Growth Healthy, Price Pressures Present in Some Regions According to the FHFA, U.S. home price growth stood at 5.8% year-over-year in December. Regionally, the fastest price growth is concentrated among metropolitan areas located on the West Coast. Mountain and South regions are also experiencing rapid growth. Midwest and Northeast areas experienced very little price growth over the past 12 months, with the exception of Detroit and Washington, D.C.
As of 12/31/2015. Source: Federal Housing Finance Agency
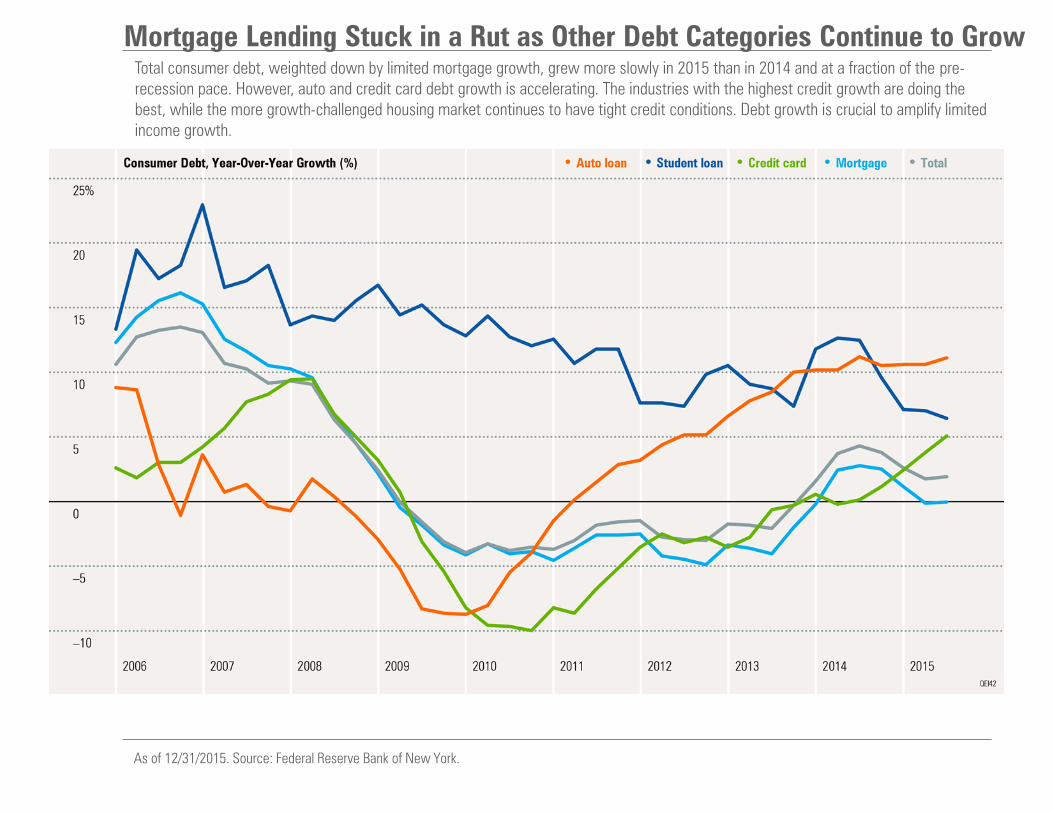
Mortgage Lending Stuck in a Rut as Other Debt Categories Continue to Grow Total consumer debt, weighted down by limited mortgage growth, grew more slowly in 2015 than in 2014 and at a fraction of the pre-recession pace. However, auto and credit card debt growth is accelerating. The industries with the highest credit growth are doing the best, while the more growth-challenged housing market continues to have tight credit conditions. Debt growth is crucial to amplify limited income growth.
As of 12/31/2015. Source: Federal Reserve Bank of New York.
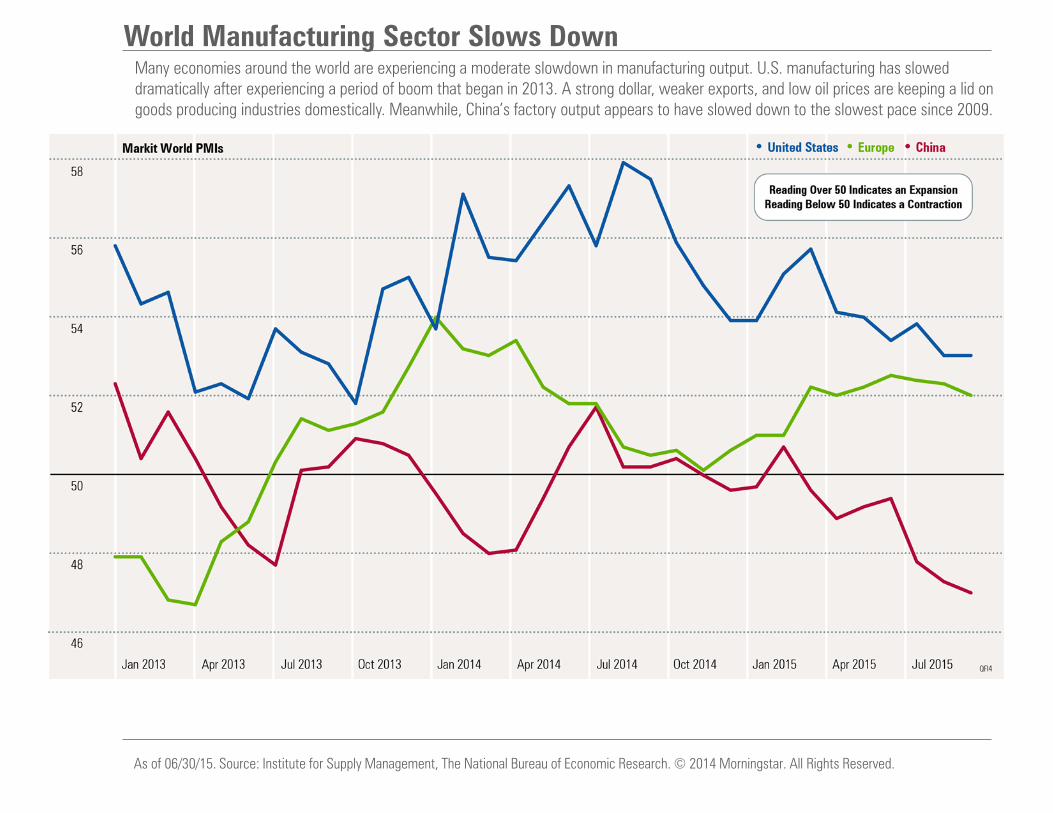
World Manufacturing Sector Slows Down Many economies around the world are experiencing a moderate slowdown in manufacturing output. U.S. manufacturing has slowed dramatically after experiencing a period of boom that began in 2013. A strong dollar, weaker exports, and low oil prices are keeping a lid on goods producing industries domestically. Meanwhile, China’s factory output appears to have slowed down to the slowest pace since 2009.
As of 06/30/15. Source: Institute for Supply Management, The National Bureau of Economic Research. © 2014 Morningstar. All Rights Reserved.
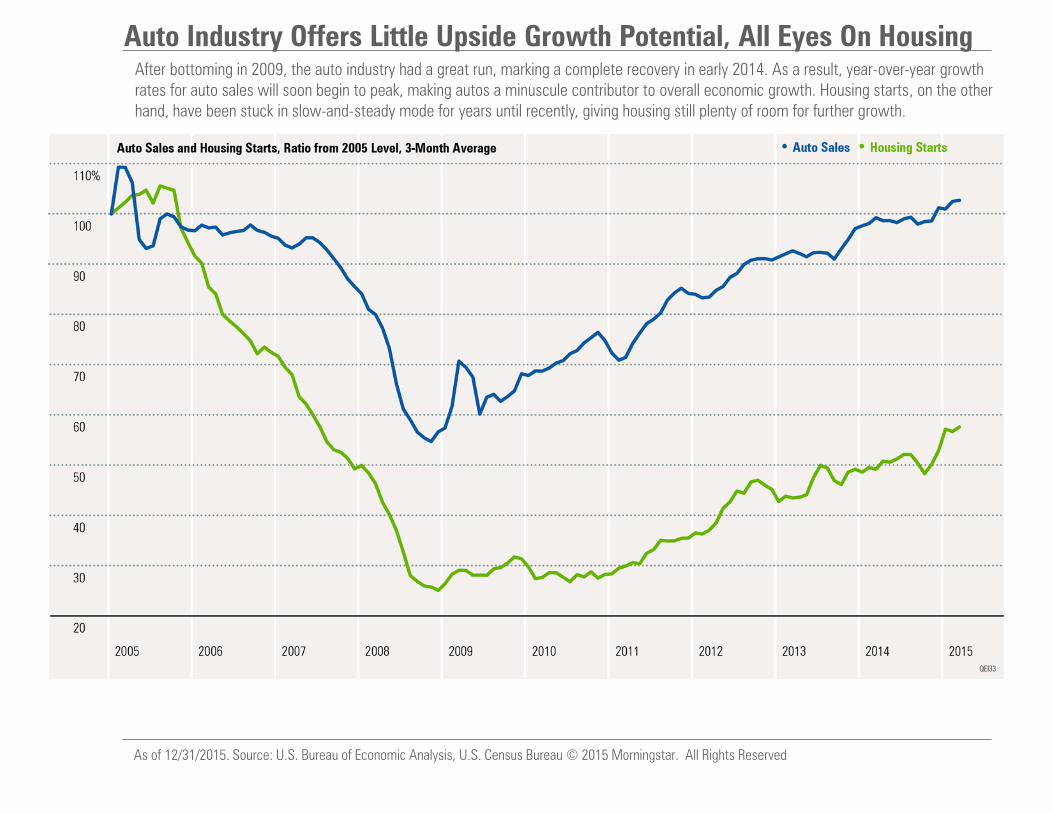
Auto Industry Offers Little Upside Growth Potential, All Eyes On Housing After bottoming in 2009, the auto industry had a great run, marking a complete recovery in early 2014. As a result, year-over-year growth rates for auto sales will soon begin to peak, making autos a minuscule contributor to overall economic growth. Housing starts, on the other hand, have been stuck in slow-and-steady mode for years until recently, giving housing still plenty of room for further growth.
As of 12/31/2015. Source: U.S. Bureau of Economic Analysis, U.S. Census Bureau © 2015 Morningstar. All Rights Reserved
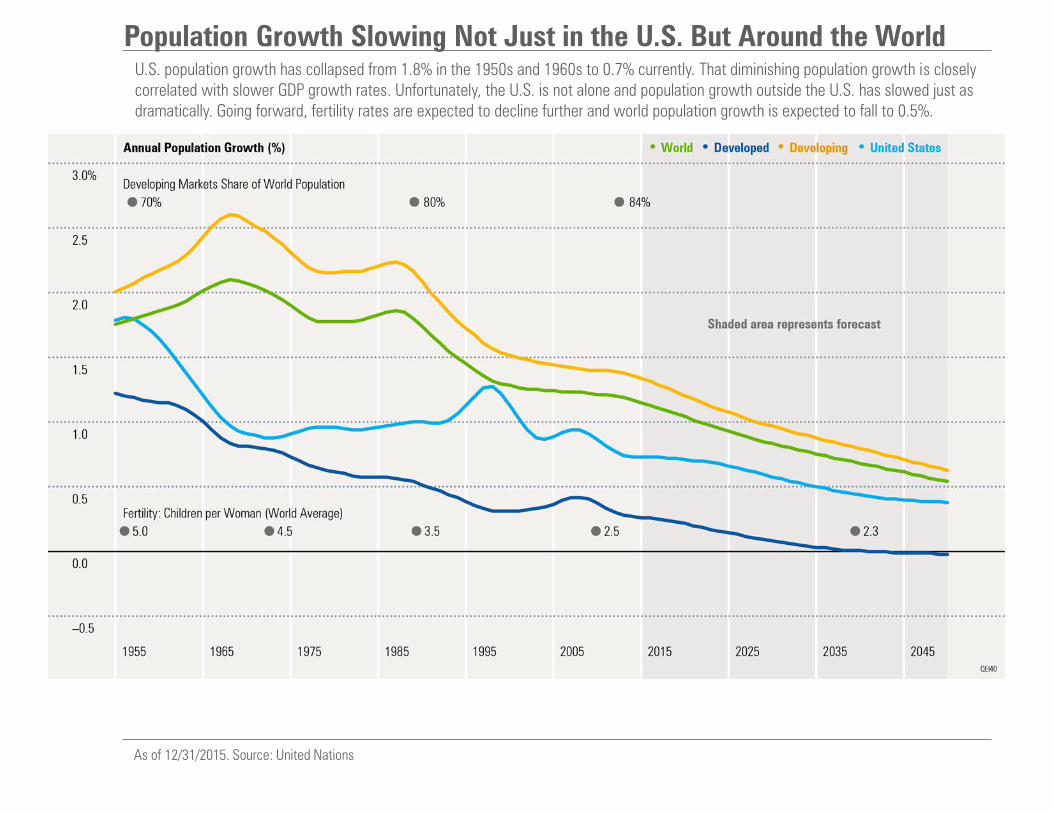
Population Growth Slowing Not Just in the U.S. But Around the World U.S. population growth has collapsed from 1.8% in the 1950s and 1960s to 0.7% currently. That diminishing population growth is closely correlated with slower GDP growth rates. Unfortunately, the U.S. is not alone and population growth outside the U.S. has slowed just as dramatically. Going forward, fertility rates are expected to decline further and world population growth is expected to fall to 0.5%.
As of 12/31/2015. Source: United Nations
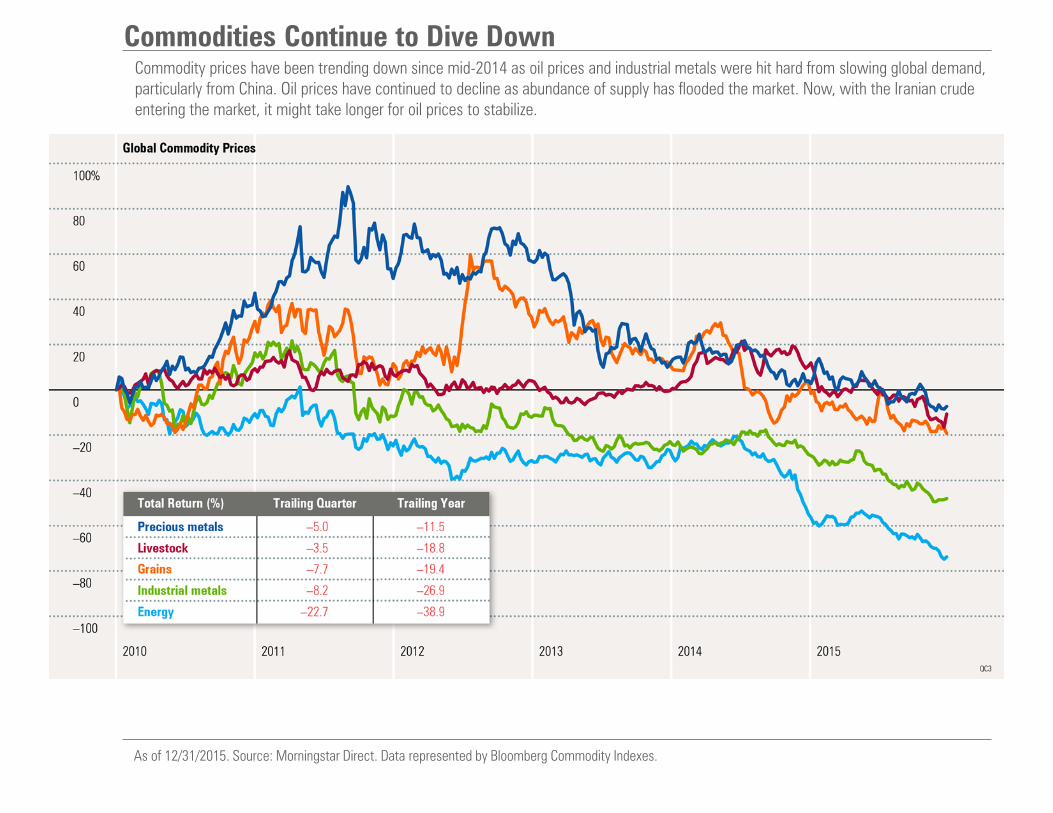
Commodities Continue to Dive Down Commodity prices have been trending down since mid-2014 as oil prices and industrial metals were hit hard from slowing global demand, particularly from China. Oil prices have continued to decline as abundance of supply has flooded the market. Now, with the Iranian crude entering the market, it might take longer for oil prices to stabilize.
As of 12/31/2015. Source: Morningstar Direct. Data represented by Bloomberg Commodity Indexes.
Interest Rates And Inflation
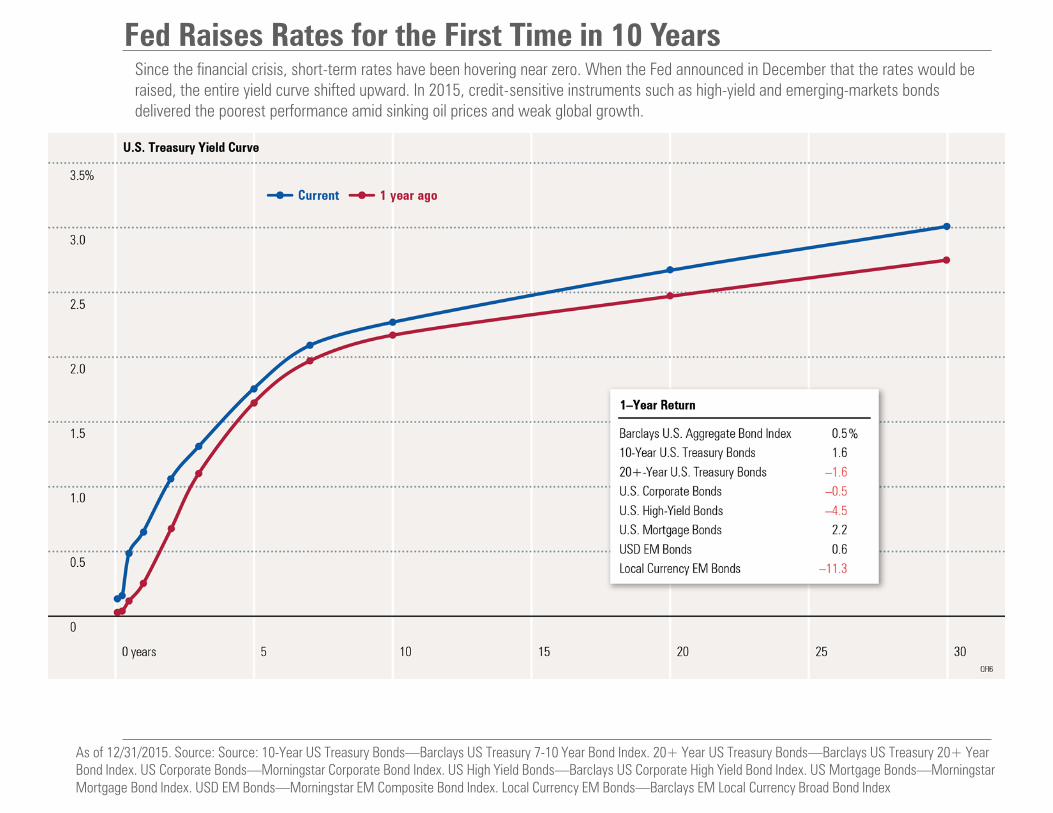
Fed Raises Rates for the First Time in 10 Years
Since the financial crisis, short-term rates have been hovering near zero. When the Fed announced in December that the rates would be raised, the entire yield curve shifted upward. In 2015, credit-sensitive instruments such as high-yield and emerging-markets bonds delivered the poorest performance amid sinking oil prices and weak global growth.
As of 12/31/2015. Source: Source: 10-Year US Treasury Bonds—Barclays US Treasury 7-10 Year Bond Index. 20+ Year US Treasury Bonds—Barclays US Treasury 20+ Year
Bond Index. US Corporate Bonds—Morningstar Corporate Bond Index. US High Yield Bonds—Barclays US Corporate High Yield Bond Index. US Mortgage Bonds—Morningstar
Mortgage Bond Index. USD EM Bonds—Morningstar EM Composite Bond Index. Local Currency EM Bonds—Barclays EM Local Currency Broad Bond Index
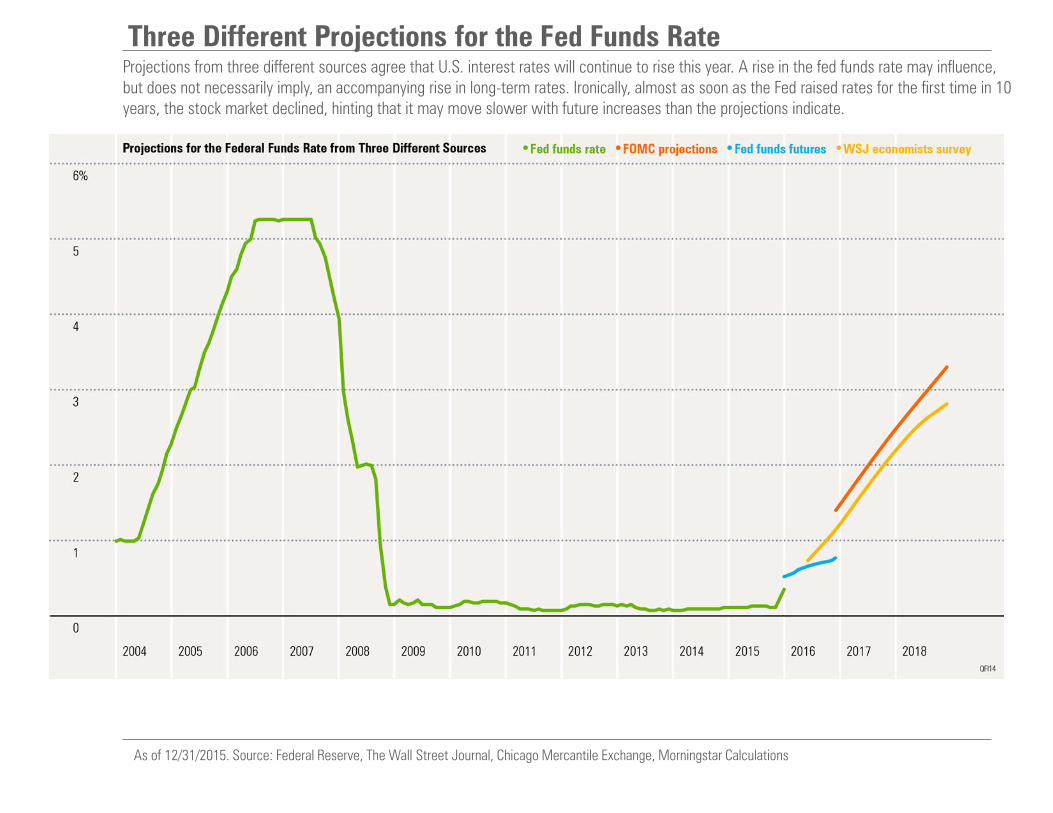
Three Different Projections for the Fed Funds Rate Projections from three different sources agree that U.S. interest rates will continue to rise this year. A rise in the fed funds rate may influence, but does not necessarily imply, an accompanying rise in long-term rates. Ironically, almost as soon as the Fed raised rates for the first time in 10 years, the stock market declined, hinting that it may move slower with future increases than the projections indicate.
As of 12/31/2015. Source: Federal Reserve, The Wall Street Journal, Chicago Mercantile Exchange, Morningstar Calculations
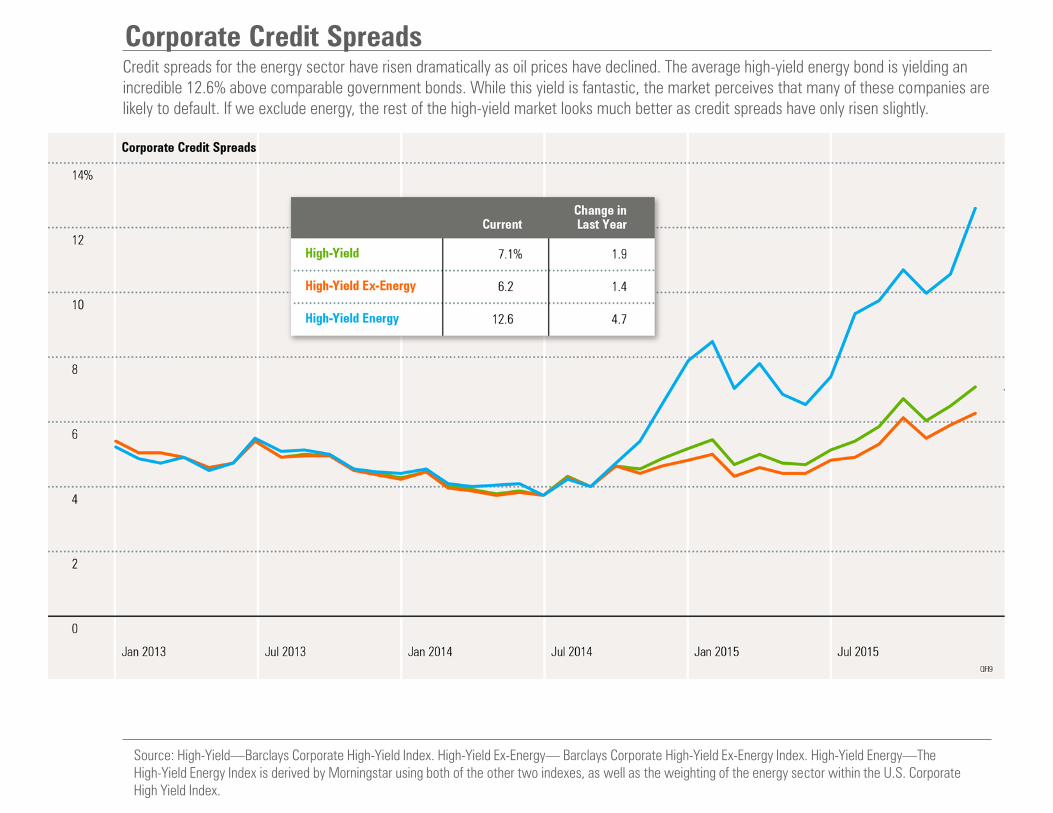
Corporate Credit Spreads Credit spreads for the energy sector have risen dramatically as oil prices have declined. The average high-yield energy bond is yielding an incredible 12.6% above comparable government bonds. While this yield is fantastic, the market perceives that many of these companies are likely to default. If we exclude energy, the rest of the high-yield market looks much better as credit spreads have only risen slightly.
Source: High-Yield—Barclays Corporate High-Yield Index. High-Yield Ex-Energy— Barclays Corporate High-Yield Ex-Energy Index. High-Yield Energy—The High-Yield Energy Index is derived by Morningstar using both of the other two indexes, as well as the weighting of the energy sector within the U.S. Corporate High Yield Index.
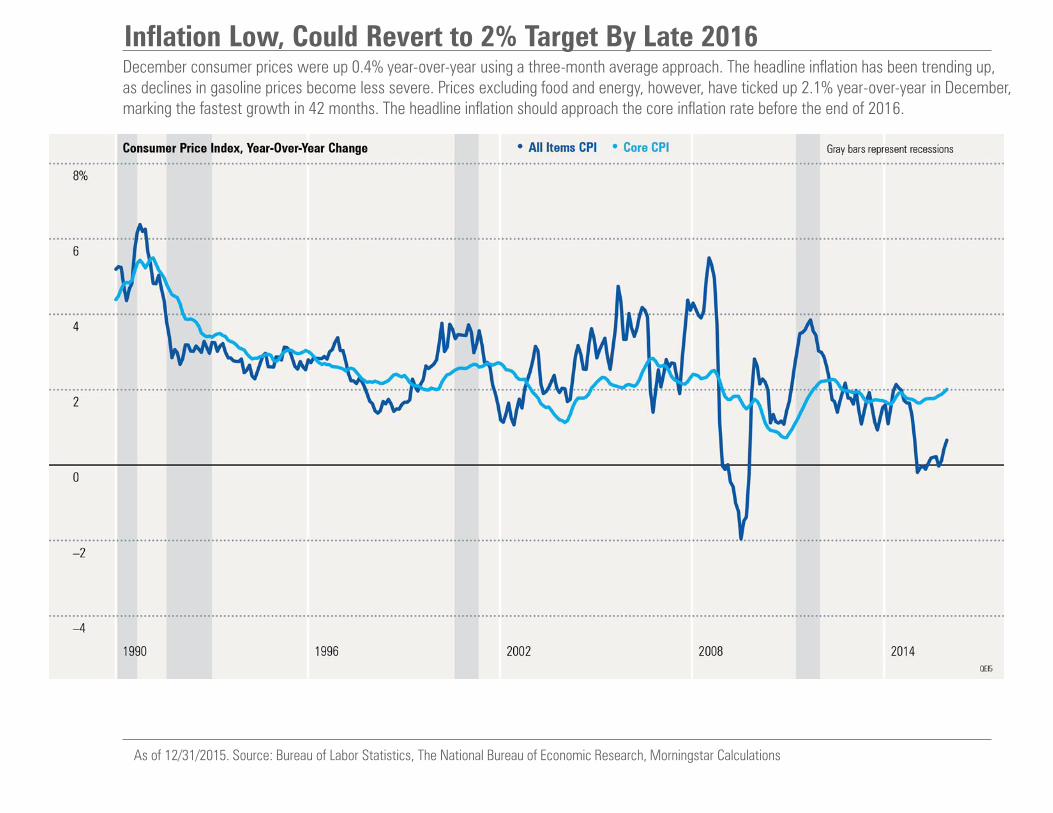
Inflation Low, Could Revert to 2% Target By Late 2016 December consumer prices were up 0.4% year-over-year using a three-month average approach. The headline inflation has been trending up, as declines in gasoline prices become less severe. Prices excluding food and energy, however, have ticked up 2.1% year-over-year in December, marking the fastest growth in 42 months. The headline inflation should approach the core inflation rate before the end of 2016.
As of 12/31/2015. Source: Bureau of Labor Statistics, The National Bureau of Economic Research, Morningstar Calculations
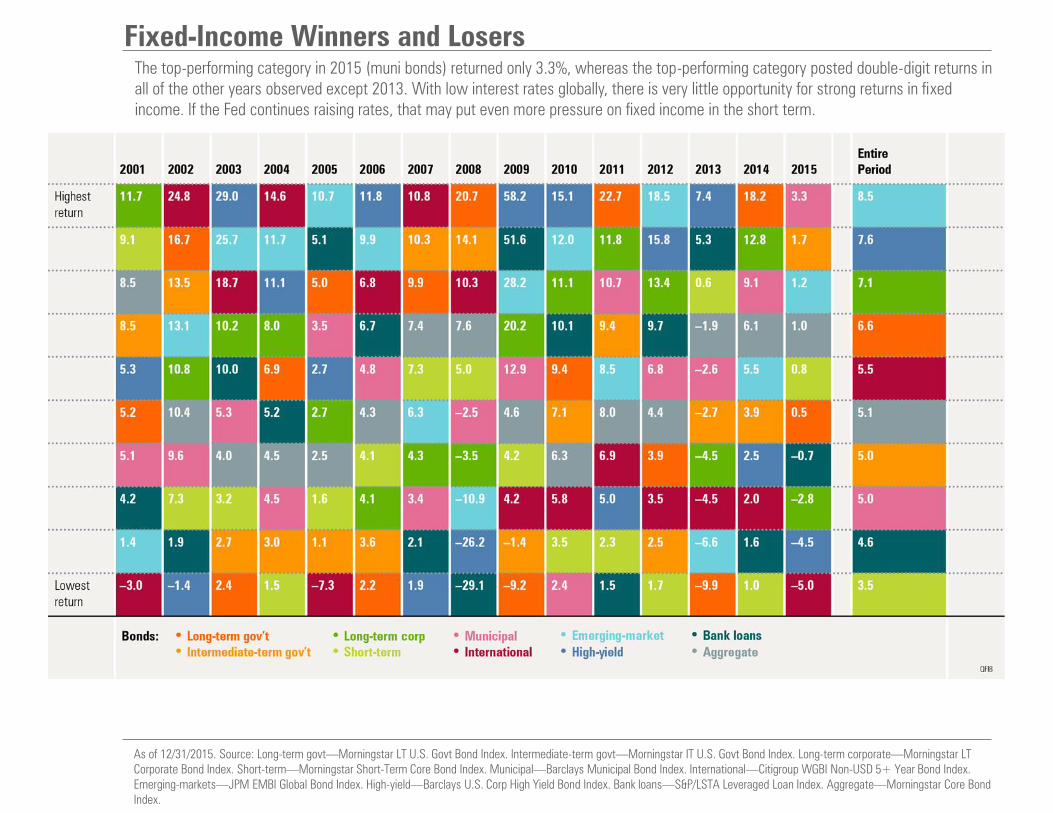
Fixed-Income Winners and Losers The top-performing category in 2015 (muni bonds) returned only 3.3%, whereas the top-performing category posted double-digit returns in all of the other years observed except 2013. With low interest rates globally, there is very little opportunity for strong returns in fixed income. If the Fed continues raising rates, that may put even more pressure on fixed income in the short term.
As of 12/31/2015. Source: Long-term govt—Morningstar LT U.S. Govt Bond Index. Intermediate-term govt—Morningstar IT U.S. Govt Bond Index. Long-term corporate—Morningstar LT Corporate Bond Index. Short-term—Morningstar Short-Term Core Bond Index. Municipal—Barclays Municipal Bond Index. International—Citigroup WGBI Non-USD 5+ Year Bond Index. Emerging-markets—JPM EMBI Global Bond Index. High-yield—Barclays U.S. Corp High Yield Bond Index. Bank loans—S&P/LSTA Leveraged Loan Index. Aggregate—Morningstar Core Bond Index.