market insights - j.p. morgan · global market insights strategy team ... returns and valuations by...
TRANSCRIPT

MARKET INSIGHTS
Guide to the Markets®
U.S. | |4Q 2016 As of September 30, 2016

|GTM – U.S.
2
Global Market Insights Strategy Team
Americas Europe Asia
Dr. David P. Kelly, CFANew York
Stephanie H. FlandersLondon
Tai HuiHong Kong
Andrew D. GoldbergNew York
Manuel Arroyo Ozores, CFAMadrid
Kerry Craig, CFAMelbourne
Anastasia V. Amoroso, CFANew York
Tilmann Galler, CFAFrankfurt
Yoshinori ShigemiTokyo
Julio C. CallegariSão Paulo
Lucia Gutierrez-MelladoMadrid
Marcella ChowHong Kong
Samantha M. AzzarelloNew York
Vincent JuvynsLuxembourg
Akira KunikyoTokyo
David M. LebovitzNew York
Dr. David StubbsLondon
Dr. Jasslyn Yeo, CFASingapore
Gabriela D. SantosNew York
Maria Paola ToschiMilan
Ian HuiHong Kong
Abigail B. Dwyer, CFANew York
Michael J. Bell, CFALondon
Ben LukHong Kong
John C. ManleyNew York
Alexander W. Dryden, CFALondon
Ainsley E. WoolridgeNew York
Nandini L. RamakrishnanLondon
Hannah J. AndersonNew York
2

|GTM – U.S.
3
37. Developed market fixed income dynamics38. Fixed income yields and returns39. Global fixed income40. Municipal finance41. Investment grade bonds42. High yield bonds43. Emerging market debt44. Fixed income sector returns
International45. Global equity markets46. International equity earnings and valuations47. Manufacturing momentum48. European recovery49. Japan: Economy and markets50. China: Economic and policy snapshot51. Emerging market headwinds52. Emerging market equities53. Global currencies
Other asset classes54. Correlations and volatility55. Understanding alternatives56. Hedge funds57. Private debt and equity58. Yield alternatives: Domestic and global59. Global commodities60. Global commercial real estate
Investing principles61. Asset class returns62. Fund flows63. Life expectancy and pension shortfall64. Time, diversification and the volatility of returns65. Diversification and the average investor66. Cash accounts67. Institutional investor behavior68. Local investing and global opportunities
Equities4. S&P 500 Index at inflection points5. S&P 500 valuation measures6. P/E ratios and equity returns7. Corporate profits8. Profit margins and wages9. Returns and valuations by style10. Returns and valuations by sector11. Sector weights and factor performance12. Cyclical and defensive sectors13. Annual returns and intra-year declines14. Market volatility15. Corporate financials16. Bear markets and subsequent bull runs17. Interest rates and equities18. Stock market since 1900
Economy19. The length and strength of expansions20. Economic growth and the composition of GDP21. Consumer finances22. Cyclical sectors23. Residential real estate24. Long-term drivers of economic growth25. Federal finances26. U.S. political perspectives27. Unemployment and wages28. Labor market perspectives29. Employment and income by educational attainment30. Inflation31. Trade and the U.S. dollar32. Oil markets33. Consumer confidence and the stock market
Fixed income34. Interest rates and inflation35. The Fed and interest rates36. Shape of the yield curve
Page reference 3
|GTM – U.S.
4
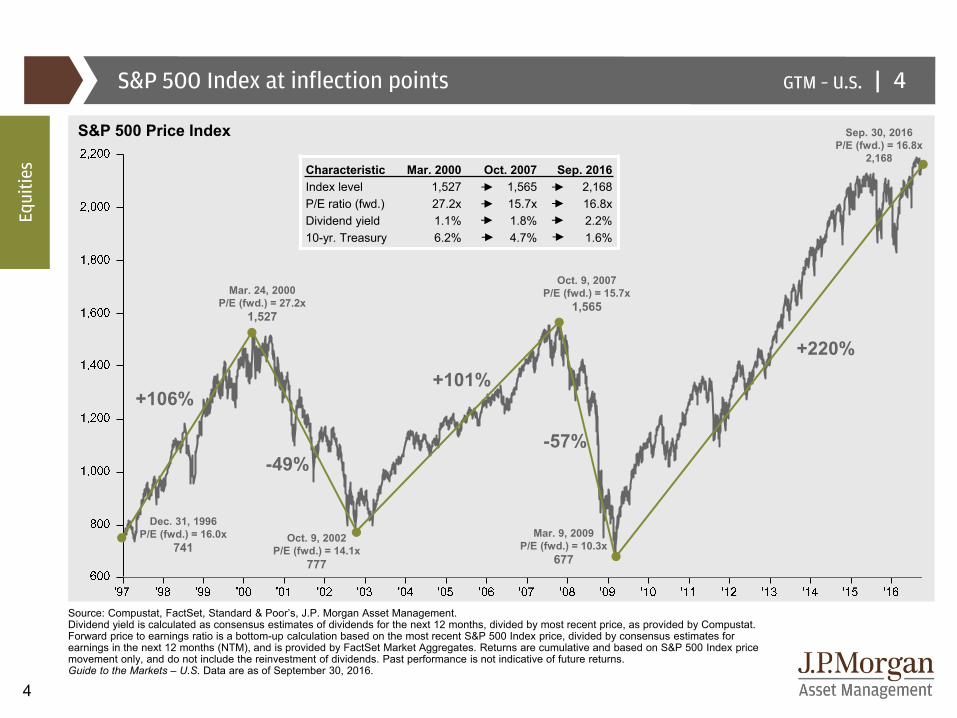
Characteristic Mar. 2000 Oct. 2007 Sep. 2016Index level 1,527 1,565 2,168P/E ratio (fwd.) 27.2x 15.7x 16.8xDividend yield 1.1% 1.8% 2.2%10-yr. Treasury 6.2% 4.7% 1.6%
S&P 500 Index at inflection points
Source: Compustat, FactSet, Standard & Poor’s, J.P. Morgan Asset Management.Dividend yield is calculated as consensus estimates of dividends for the next 12 months, divided by most recent price, as provided by Compustat. Forward price to earnings ratio is a bottom-up calculation based on the most recent S&P 500 Index price, divided by consensus estimates for earnings in the next 12 months (NTM), and is provided by FactSet Market Aggregates. Returns are cumulative and based on S&P 500 Index price movement only, and do not include the reinvestment of dividends. Past performance is not indicative of future returns.Guide to the Markets – U.S. Data are as of September 30, 2016.
4
-49%
Oct. 9, 2002 P/E (fwd.) = 14.1x
777
Mar. 24, 2000 P/E (fwd.) = 27.2x
1,527
Dec. 31, 1996 P/E (fwd.) = 16.0x
741
Sep. 30, 2016 P/E (fwd.) = 16.8x
2,168
+101%
Oct. 9, 2007 P/E (fwd.) = 15.7x
1,565
-57%
Mar. 9, 2009 P/E (fwd.) = 10.3x
677
+220%
+106%
S&P 500 Price Index
Equi
ties
|GTM – U.S.
5
8x
10x
12x
14x
16x
18x
20x
22x
24x
26x
'90 '92 '94 '96 '98 '00 '02 '04 '06 '08 '10 '12 '14 '16
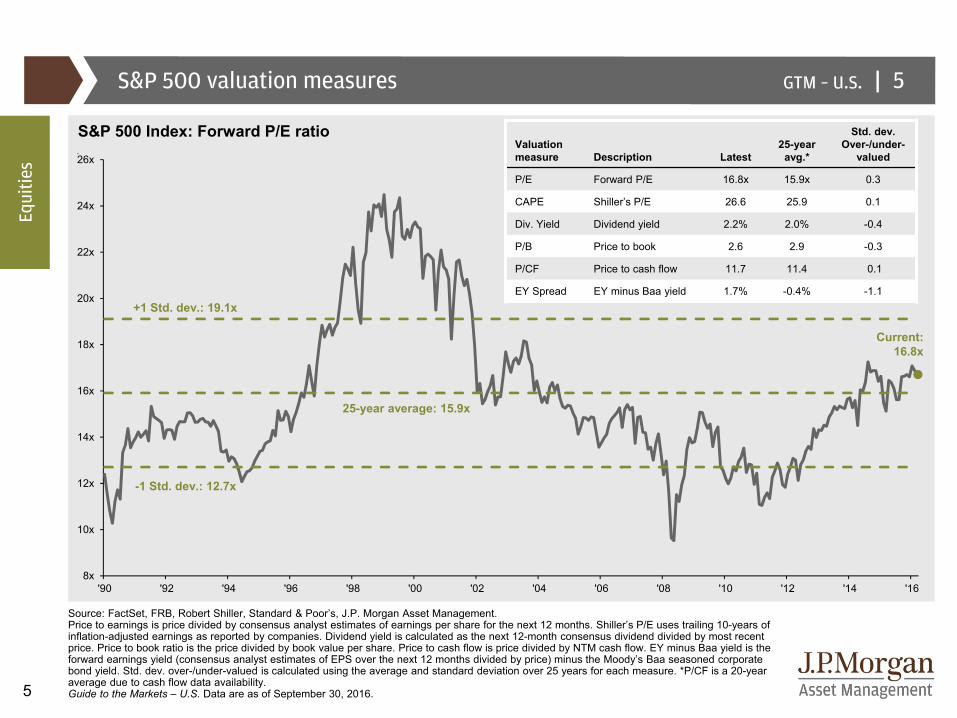
S&P 500 valuation measures
Source: FactSet, FRB, Robert Shiller, Standard & Poor’s, J.P. Morgan Asset Management. Price to earnings is price divided by consensus analyst estimates of earnings per share for the next 12 months. Shiller’s P/E uses trailing 10-years of inflation-adjusted earnings as reported by companies. Dividend yield is calculated as the next 12-month consensus dividend divided by most recent price. Price to book ratio is the price divided by book value per share. Price to cash flow is price divided by NTM cash flow. EY minus Baa yield is the forward earnings yield (consensus analyst estimates of EPS over the next 12 months divided by price) minus the Moody’s Baa seasoned corporate bond yield. Std. dev. over-/under-valued is calculated using the average and standard deviation over 25 years for each measure. *P/CF is a 20-year average due to cash flow data availability.Guide to the Markets – U.S. Data are as of September 30, 2016.
S&P 500 Index: Forward P/E ratio
5
Equi
ties
Current: 16.8x
Valuation measure Description Latest
25-year avg.*
Std. dev. Over-/under-
valued
P/E Forward P/E 16.8x 15.9x 0.3
CAPE Shiller’s P/E 26.6 25.9 0.1
Div. Yield Dividend yield 2.2% 2.0% -0.4
P/B Price to book 2.6 2.9 -0.3
P/CF Price to cash flow 11.7 11.4 0.1
EY Spread EY minus Baa yield 1.7% -0.4% -1.1
25-year average: 15.9x
+1 Std. dev.: 19.1x
-1 Std. dev.: 12.7x
|GTM – U.S.
6
-60%
-40%
-20%
0%
20%
40%
60%
8.0x 11.0x 14.0x 17.0x 20.0x 23.0x-60%
-40%
-20%
0%
20%
40%
60%
8.0x 11.0x 14.0x 17.0x 20.0x 23.0x
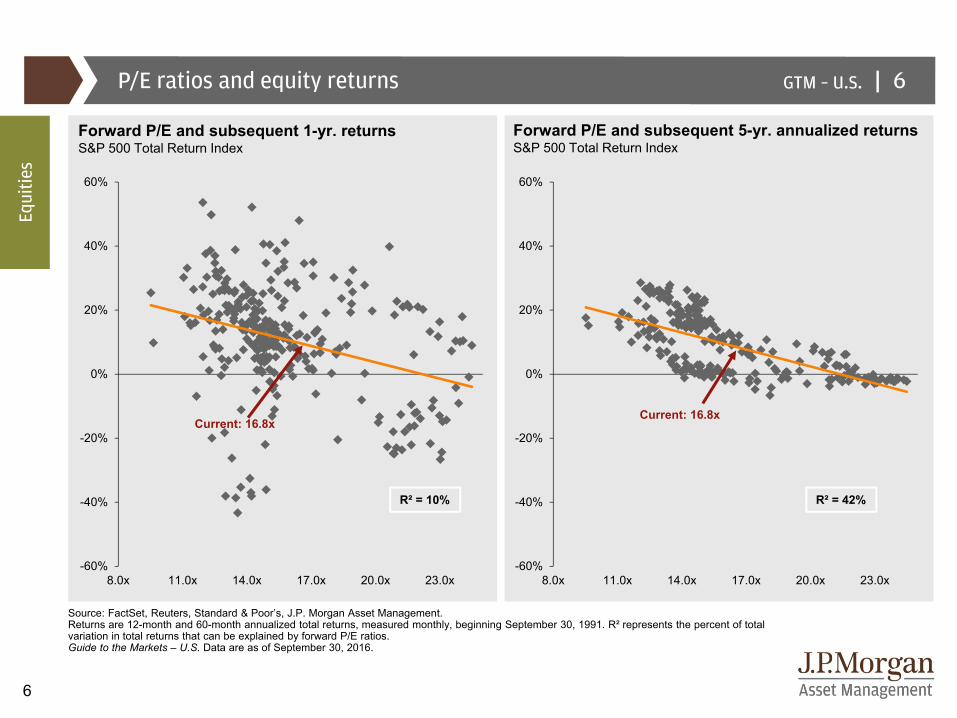
R² = 10%
Source: FactSet, Reuters, Standard & Poor’s, J.P. Morgan Asset Management. Returns are 12-month and 60-month annualized total returns, measured monthly, beginning September 30, 1991. R² represents the percent of total variation in total returns that can be explained by forward P/E ratios.Guide to the Markets – U.S. Data are as of September 30, 2016.
P/E ratios and equity returns
Forward P/E and subsequent 1-yr. returnsS&P 500 Total Return Index
Forward P/E and subsequent 5-yr. annualized returnsS&P 500 Total Return Index
6
Equi
ties
Current: 16.8x
R² = 42%
Current: 16.8x
|GTM – U.S.
7
-5%
-1%
3%
7%
11%
15%
19%
23%
'12 '13 '14 '15 '16 '17
-$1
$3
$7
$11
$15
$19
$23
$27
$31
$35
'01 '04 '07 '10 '13 '16
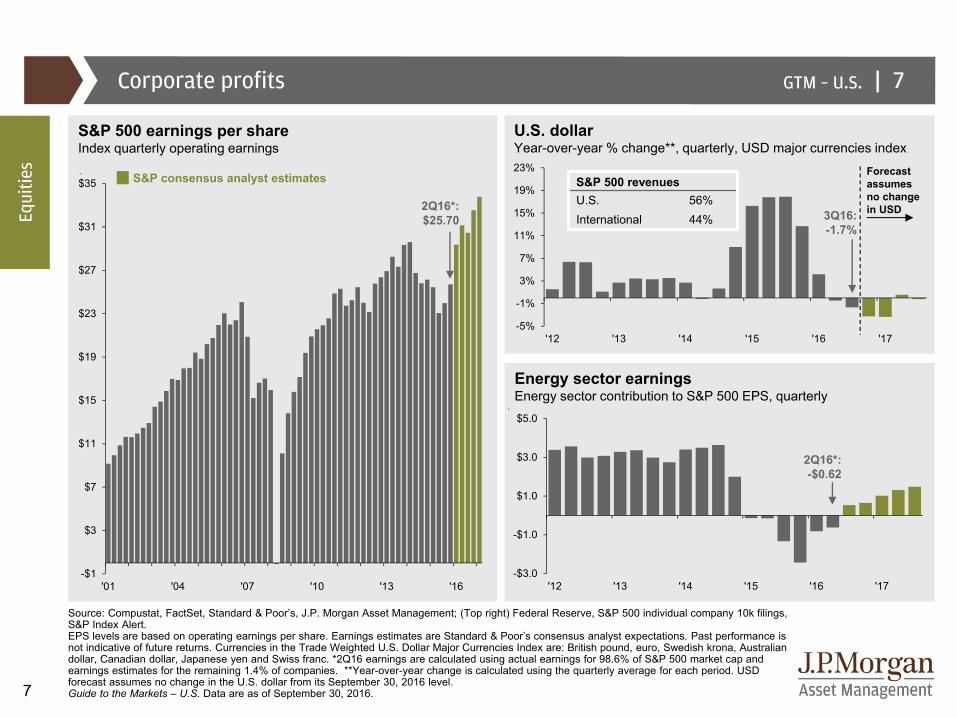
Source: Compustat, FactSet, Standard & Poor’s, J.P. Morgan Asset Management; (Top right) Federal Reserve, S&P 500 individual company 10k filings,S&P Index Alert.EPS levels are based on operating earnings per share. Earnings estimates are Standard & Poor’s consensus analyst expectations. Past performance is not indicative of future returns. Currencies in the Trade Weighted U.S. Dollar Major Currencies Index are: British pound, euro, Swedish krona, Australian dollar, Canadian dollar, Japanese yen and Swiss franc. *2Q16 earnings are calculated using actual earnings for 98.6% of S&P 500 market cap and earnings estimates for the remaining 1.4% of companies. **Year-over-year change is calculated using the quarterly average for each period. USD forecast assumes no change in the U.S. dollar from its September 30, 2016 level. Guide to the Markets – U.S. Data are as of September 30, 2016.
Corporate profits 7
S&P 500 earnings per shareIndex quarterly operating earnings
Energy sector earningsEnergy sector contribution to S&P 500 EPS, quarterly
U.S. dollarYear-over-year % change**, quarterly, USD major currencies index
3Q16: -1.7%
S&P 500 revenues U.S. 56%International 44%Eq
uitie
s Forecast assumes no change in USD2Q16*:
$25.70
S&P consensus analyst estimates
-$3.0
-$1.0
$1.0
$3.0
$5.0
'12 '13 '14 '15 '16 '17
2Q16*:-$0.62
|GTM – U.S.
8
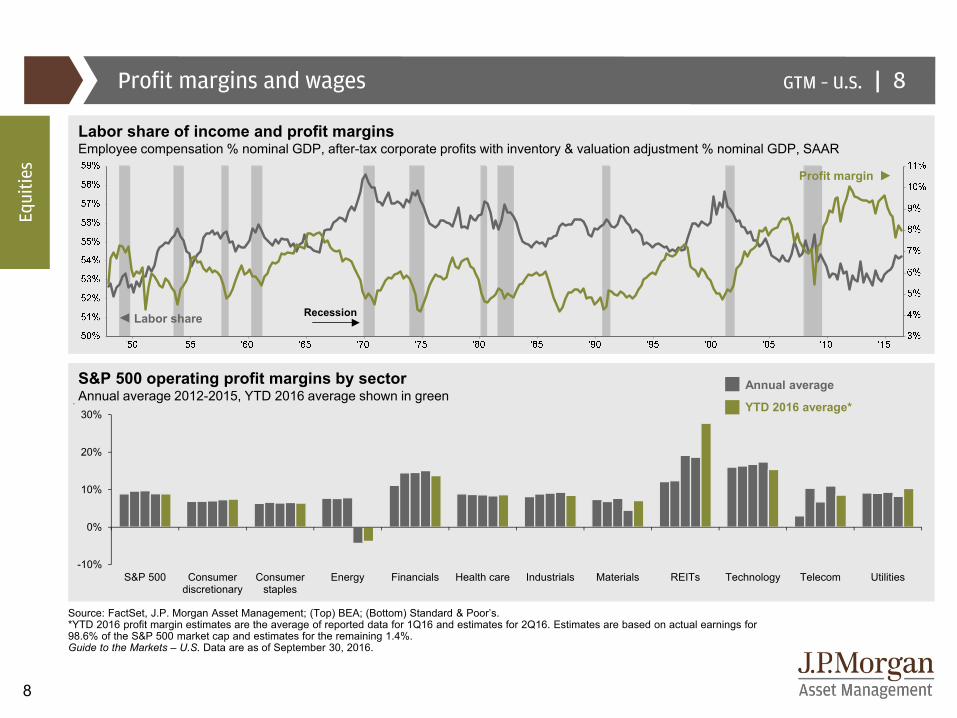
Profit margins and wages
Source: FactSet, J.P. Morgan Asset Management; (Top) BEA; (Bottom) Standard & Poor’s.*YTD 2016 profit margin estimates are the average of reported data for 1Q16 and estimates for 2Q16. Estimates are based on actual earnings for98.6% of the S&P 500 market cap and estimates for the remaining 1.4%. Guide to the Markets – U.S. Data are as of September 30, 2016.
8
S&P 500 operating profit margins by sectorAnnual average 2012-2015, YTD 2016 average shown in green
Annual average
YTD 2016 average*
Labor share of income and profit marginsEmployee compensation % nominal GDP, after-tax corporate profits with inventory & valuation adjustment % nominal GDP, SAAR
Labor share
Profit margin
Recession
Equi
ties
-10%
0%
10%
20%
30%
S&P 500 Consumerdiscretionary
Consumerstaples
Energy Financials Health care Industrials Materials REITs Technology Telecom Utilities
|GTM – U.S.
9
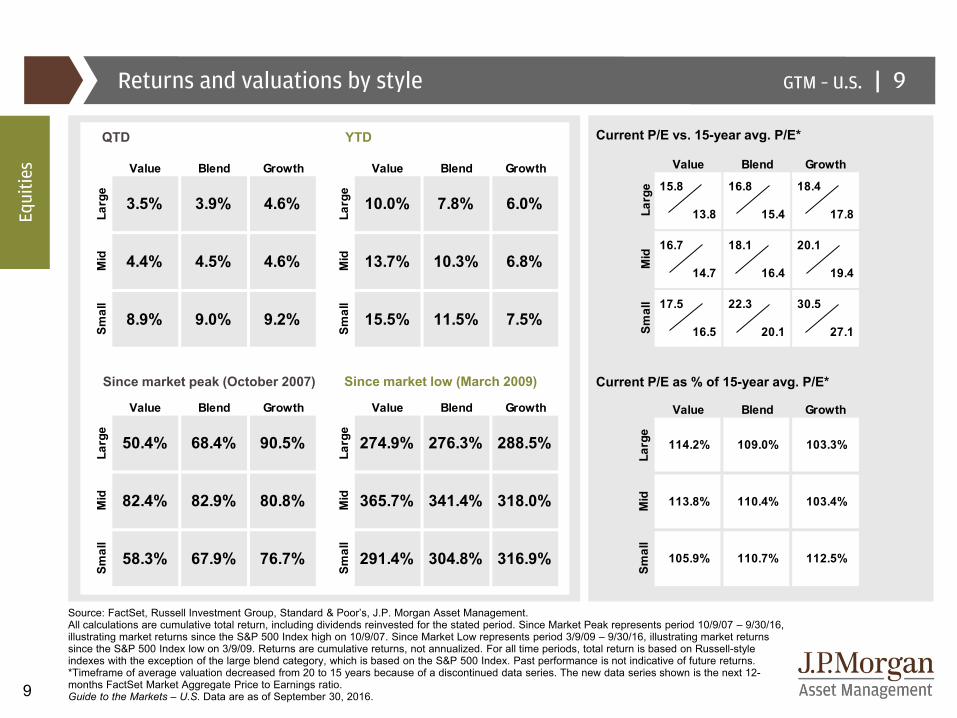
Source: FactSet, Russell Investment Group, Standard & Poor’s, J.P. Morgan Asset Management.All calculations are cumulative total return, including dividends reinvested for the stated period. Since Market Peak represents period 10/9/07 – 9/30/16, illustrating market returns since the S&P 500 Index high on 10/9/07. Since Market Low represents period 3/9/09 – 9/30/16, illustrating market returns since the S&P 500 Index low on 3/9/09. Returns are cumulative returns, not annualized. For all time periods, total return is based on Russell-style indexes with the exception of the large blend category, which is based on the S&P 500 Index. Past performance is not indicative of future returns. *Timeframe of average valuation decreased from 20 to 15 years because of a discontinued data series. The new data series shown is the next 12-months FactSet Market Aggregate Price to Earnings ratio. Guide to the Markets – U.S. Data are as of September 30, 2016.
Returns and valuations by style 9
QTD
Since market low (March 2009)
YTD
Since market peak (October 2007) Current P/E as % of 15-year avg. P/E*
Current P/E vs. 15-year avg. P/E*
Equi
ties Value Blend Growth Value Blend Growth
Larg
e
3.5% 3.9% 4.6%
Larg
e
10.0% 7.8% 6.0%
Mid 4.4% 4.5% 4.6% Mid 13.7% 10.3% 6.8%
Smal
l
8.9% 9.0% 9.2%Sm
all
15.5% 11.5% 7.5%
Value Blend Growth Value Blend Growth
Larg
e
50.4% 68.4% 90.5%
Larg
e
274.9% 276.3% 288.5%
Mid 82.4% 82.9% 80.8% Mid 365.7% 341.4% 318.0%
Smal
l
58.3% 67.9% 76.7%
Smal
l
291.4% 304.8% 316.9%
15.8 16.8 18.4
13.8 15.4 17.8
16.7 18.1 20.1
14.7 16.4 19.4
17.5 22.3 30.5
16.5 20.1 27.1Smal
l
Value Blend Growth
Larg
eM
id
Value Blend Growth
Larg
e
114.2% 109.0% 103.3%
Mid 113.8% 110.4% 103.4%
Smal
l
105.9% 110.7% 112.5%
|GTM – U.S.
10
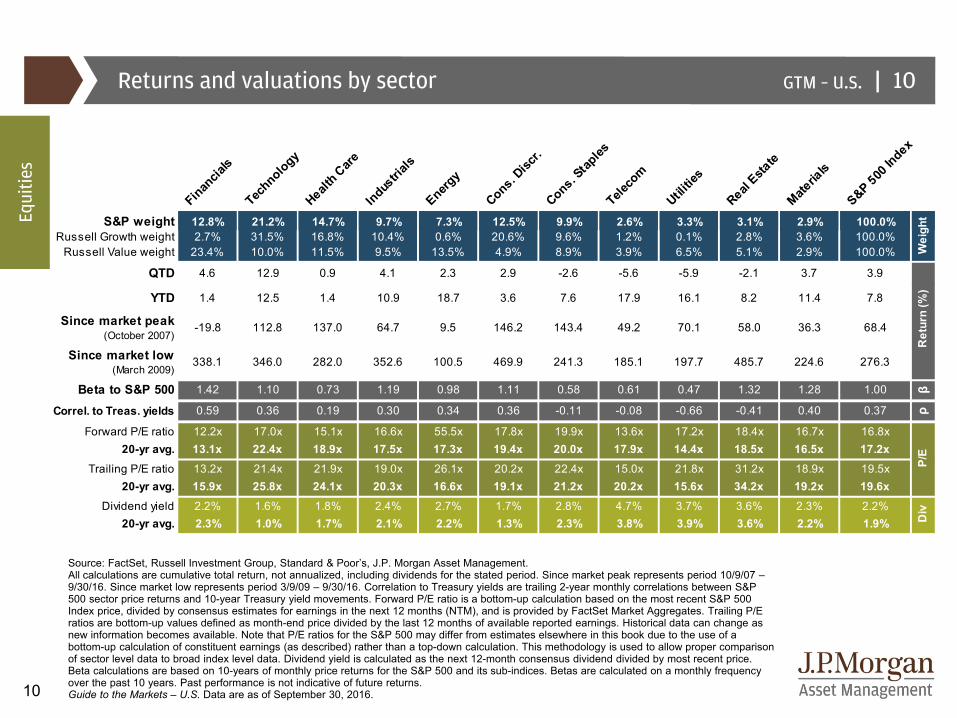
Returns and valuations by sector
Source: FactSet, Russell Investment Group, Standard & Poor’s, J.P. Morgan Asset Management.All calculations are cumulative total return, not annualized, including dividends for the stated period. Since market peak represents period 10/9/07 –9/30/16. Since market low represents period 3/9/09 – 9/30/16. Correlation to Treasury yields are trailing 2-year monthly correlations between S&P 500 sector price returns and 10-year Treasury yield movements. Forward P/E ratio is a bottom-up calculation based on the most recent S&P 500 Index price, divided by consensus estimates for earnings in the next 12 months (NTM), and is provided by FactSet Market Aggregates. Trailing P/E ratios are bottom-up values defined as month-end price divided by the last 12 months of available reported earnings. Historical data can change as new information becomes available. Note that P/E ratios for the S&P 500 may differ from estimates elsewhere in this book due to the use of a bottom-up calculation of constituent earnings (as described) rather than a top-down calculation. This methodology is used to allow proper comparison of sector level data to broad index level data. Dividend yield is calculated as the next 12-month consensus dividend divided by most recent price. Beta calculations are based on 10-years of monthly price returns for the S&P 500 and its sub-indices. Betas are calculated on a monthly frequency over the past 10 years. Past performance is not indicative of future returns.Guide to the Markets – U.S. Data are as of September 30, 2016.
10
Equi
ties
Financia
ls
Technology
Health C
areIndus
trials
Energy
Cons. Disc
r.Cons. S
taples
Teleco
m
Utilitie
s
Real Esta
teMate
rials
S&P 500 In
dex
S&P weight 12.8% 21.2% 14.7% 9.7% 7.3% 12.5% 9.9% 2.6% 3.3% 3.1% 2.9% 100.0%Russell Growth weight 2.7% 31.5% 16.8% 10.4% 0.6% 20.6% 9.6% 1.2% 0.1% 2.8% 3.6% 100.0%
Russell Value weight 23.4% 10.0% 11.5% 9.5% 13.5% 4.9% 8.9% 3.9% 6.5% 5.1% 2.9% 100.0%
QTD 4.6 12.9 0.9 4.1 2.3 2.9 -2.6 -5.6 -5.9 -2.1 3.7 3.9
YTD 1.4 12.5 1.4 10.9 18.7 3.6 7.6 17.9 16.1 8.2 11.4 7.8
Since market peak (October 2007)
-19.8 112.8 137.0 64.7 9.5 146.2 143.4 49.2 70.1 58.0 36.3 68.4
Since market low (March 2009)
338.1 346.0 282.0 352.6 100.5 469.9 241.3 185.1 197.7 485.7 224.6 276.3
Beta to S&P 500 1.42 1.10 0.73 1.19 0.98 1.11 0.58 0.61 0.47 1.32 1.28 1.00 β
Correl. to Treas. yields 0.59 0.36 0.19 0.30 0.34 0.36 -0.11 -0.08 -0.66 -0.41 0.40 0.37 ρ
Forward P/E ratio 12.2x 17.0x 15.1x 16.6x 55.5x 17.8x 19.9x 13.6x 17.2x 18.4x 16.7x 16.8x20-yr avg. 13.1x 22.4x 18.9x 17.5x 17.3x 19.4x 20.0x 17.9x 14.4x 18.5x 16.5x 17.2x
Trailing P/E ratio 13.2x 21.4x 21.9x 19.0x 26.1x 20.2x 22.4x 15.0x 21.8x 31.2x 18.9x 19.5x20-yr avg. 15.9x 25.8x 24.1x 20.3x 16.6x 19.1x 21.2x 20.2x 15.6x 34.2x 19.2x 19.6x
Dividend yield 2.2% 1.6% 1.8% 2.4% 2.7% 1.7% 2.8% 4.7% 3.7% 3.6% 2.3% 2.2%20-yr avg. 2.3% 1.0% 1.7% 2.1% 2.2% 1.3% 2.3% 3.8% 3.9% 3.6% 2.2% 1.9%
P/E
Wei
ght
Div
Ret
urn
(%)
|GTM – U.S.
11
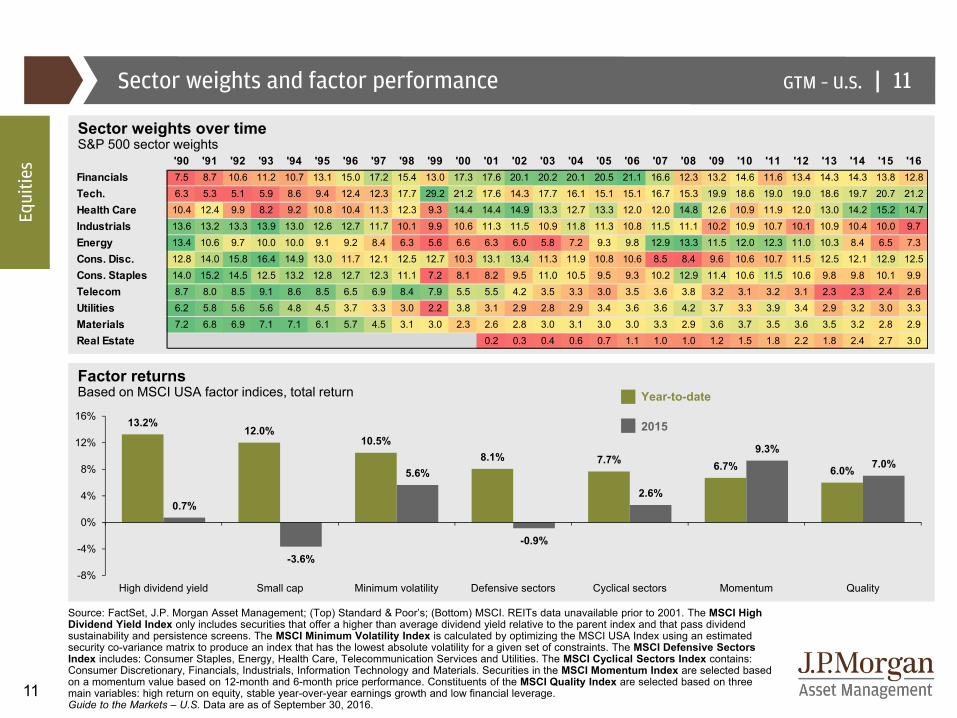
Sector weights and factor performance
Source: FactSet, J.P. Morgan Asset Management; (Top) Standard & Poor’s; (Bottom) MSCI. REITs data unavailable prior to 2001. The MSCI High Dividend Yield Index only includes securities that offer a higher than average dividend yield relative to the parent index and that pass dividend sustainability and persistence screens. The MSCI Minimum Volatility Index is calculated by optimizing the MSCI USA Index using an estimated security co-variance matrix to produce an index that has the lowest absolute volatility for a given set of constraints. The MSCI Defensive Sectors Index includes: Consumer Staples, Energy, Health Care, Telecommunication Services and Utilities. The MSCI Cyclical Sectors Index contains: Consumer Discretionary, Financials, Industrials, Information Technology and Materials. Securities in the MSCI Momentum Index are selected based on a momentum value based on 12-month and 6-month price performance. Constituents of the MSCI Quality Index are selected based on three main variables: high return on equity, stable year-over-year earnings growth and low financial leverage. Guide to the Markets – U.S. Data are as of September 30, 2016.
Factor returnsBased on MSCI USA factor indices, total return
Sector weights over timeS&P 500 sector weights
11
Year-to-date
2015
Equi
ties
13.2%12.0%
10.5%8.1% 7.7% 6.7% 6.0%
0.7%
-3.6%
5.6%
-0.9%
2.6%
9.3%7.0%
-8%
-4%
0%
4%
8%
12%
16%
High dividend yield Small cap Minimum volatility Defensive sectors Cyclical sectors Momentum Quality
'90 '91 '92 '93 '94 '95 '96 '97 '98 '99 '00 '01 '02 '03 '04 '05 '06 '07 '08 '09 '10 '11 '12 '13 '14 '15 '16Financials 7.5 8.7 10.6 11.2 10.7 13.1 15.0 17.2 15.4 13.0 17.3 17.6 20.1 20.2 20.1 20.5 21.1 16.6 12.3 13.2 14.6 11.6 13.4 14.3 14.3 13.8 12.8Tech. 6.3 5.3 5.1 5.9 8.6 9.4 12.4 12.3 17.7 29.2 21.2 17.6 14.3 17.7 16.1 15.1 15.1 16.7 15.3 19.9 18.6 19.0 19.0 18.6 19.7 20.7 21.2Health Care 10.4 12.4 9.9 8.2 9.2 10.8 10.4 11.3 12.3 9.3 14.4 14.4 14.9 13.3 12.7 13.3 12.0 12.0 14.8 12.6 10.9 11.9 12.0 13.0 14.2 15.2 14.7
Industrials 13.6 13.2 13.3 13.9 13.0 12.6 12.7 11.7 10.1 9.9 10.6 11.3 11.5 10.9 11.8 11.3 10.8 11.5 11.1 10.2 10.9 10.7 10.1 10.9 10.4 10.0 9.7
Energy 13.4 10.6 9.7 10.0 10.0 9.1 9.2 8.4 6.3 5.6 6.6 6.3 6.0 5.8 7.2 9.3 9.8 12.9 13.3 11.5 12.0 12.3 11.0 10.3 8.4 6.5 7.3
Cons. Disc. 12.8 14.0 15.8 16.4 14.9 13.0 11.7 12.1 12.5 12.7 10.3 13.1 13.4 11.3 11.9 10.8 10.6 8.5 8.4 9.6 10.6 10.7 11.5 12.5 12.1 12.9 12.5Cons. Staples 14.0 15.2 14.5 12.5 13.2 12.8 12.7 12.3 11.1 7.2 8.1 8.2 9.5 11.0 10.5 9.5 9.3 10.2 12.9 11.4 10.6 11.5 10.6 9.8 9.8 10.1 9.9Telecom 8.7 8.0 8.5 9.1 8.6 8.5 6.5 6.9 8.4 7.9 5.5 5.5 4.2 3.5 3.3 3.0 3.5 3.6 3.8 3.2 3.1 3.2 3.1 2.3 2.3 2.4 2.6Utilities 6.2 5.8 5.6 5.6 4.8 4.5 3.7 3.3 3.0 2.2 3.8 3.1 2.9 2.8 2.9 3.4 3.6 3.6 4.2 3.7 3.3 3.9 3.4 2.9 3.2 3.0 3.3
Materials 7.2 6.8 6.9 7.1 7.1 6.1 5.7 4.5 3.1 3.0 2.3 2.6 2.8 3.0 3.1 3.0 3.0 3.3 2.9 3.6 3.7 3.5 3.6 3.5 3.2 2.8 2.9
Real Estate 0.2 0.3 0.4 0.6 0.7 1.1 1.0 1.0 1.2 1.5 1.8 2.2 1.8 2.4 2.7 3.0
|GTM – U.S.
12
-3
-2
-1
0
1
2
3
4
'98 '00 '02 '04 '06 '08 '10 '12 '14 '16
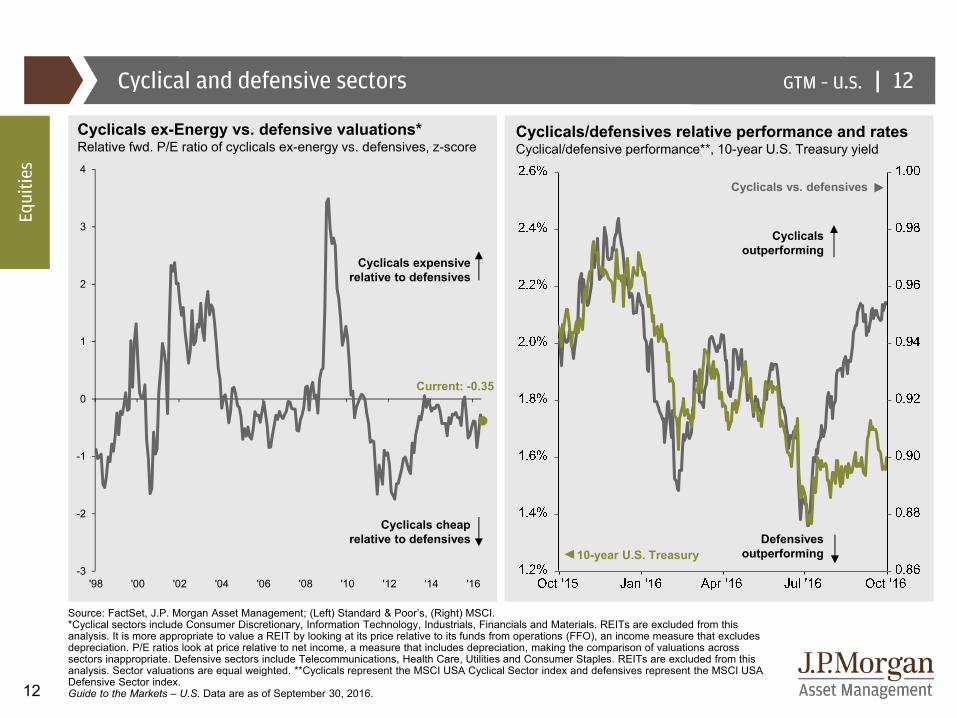
Cyclical and defensive sectors 12
Source: FactSet, J.P. Morgan Asset Management; (Left) Standard & Poor’s, (Right) MSCI.*Cyclical sectors include Consumer Discretionary, Information Technology, Industrials, Financials and Materials. REITs are excluded from this analysis. It is more appropriate to value a REIT by looking at its price relative to its funds from operations (FFO), an income measure that excludes depreciation. P/E ratios look at price relative to net income, a measure that includes depreciation, making the comparison of valuations across sectors inappropriate. Defensive sectors include Telecommunications, Health Care, Utilities and Consumer Staples. REITs are excluded from this analysis. Sector valuations are equal weighted. **Cyclicals represent the MSCI USA Cyclical Sector index and defensives represent the MSCI USA Defensive Sector index.Guide to the Markets – U.S. Data are as of September 30, 2016.
Cyclicals ex-Energy vs. defensive valuations*Relative fwd. P/E ratio of cyclicals ex-energy vs. defensives, z-score
Cyclicals/defensives relative performance and ratesCyclical/defensive performance**, 10-year U.S. Treasury yield
10-year U.S. Treasury
Cyclicals vs. defensives
Defensives outperforming
Cyclicals outperforming
Cyclicals expensive relative to defensives
Cyclicals cheap relative to defensives
Current: -0.35
Equi
ties
|GTM – U.S.
13
26
-10
1517
1
26
15
2
12
27
-7
26
47
-2
34
20
3127
20
-10-13
-23
26
9
3
14
4
-38
23
13
0
13
30
11
-1
6
-17 -18-17
-7
-13
-8 -9
-34
-8 -8
-20
-6 -6 -5-9
-3
-8-11
-19
-12
-17
-30-34
-14
-8 -7 -8-10
-49
-28
-16-19
-10-6 -7
-12-11
-60%
-50%
-40%
-30%
-20%
-10%
%
10%
20%
30%
40%
'80 '85 '90 '95 '00 '05 '10 '15
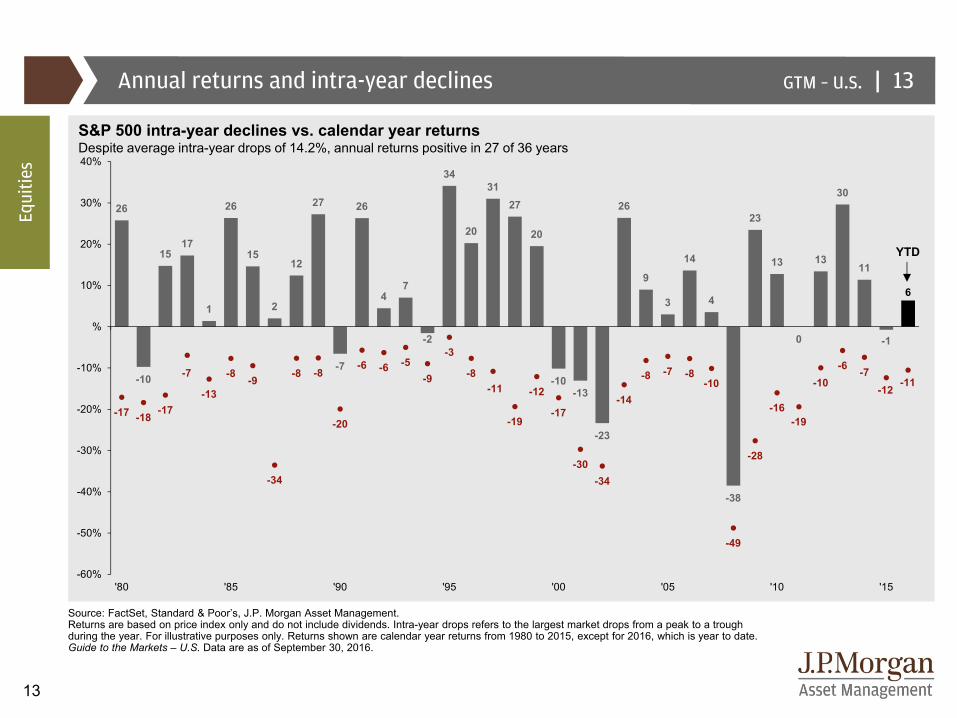
Annual returns and intra-year declines
Source: FactSet, Standard & Poor’s, J.P. Morgan Asset Management.Returns are based on price index only and do not include dividends. Intra-year drops refers to the largest market drops from a peak to a trough during the year. For illustrative purposes only. Returns shown are calendar year returns from 1980 to 2015, except for 2016, which is year to date.Guide to the Markets – U.S. Data are as of September 30, 2016.
13
S&P 500 intra-year declines vs. calendar year returnsDespite average intra-year drops of 14.2%, annual returns positive in 27 of 36 years
YTD
Equi
ties
|GTM – U.S.
14
1,000
1,200
1,400
1,600
1,800
2,000
2,200
'10 '11 '12 '13 '14 '15 '16
10
20
30
40
50
'10 '11 '12 '13 '14 '15 '16
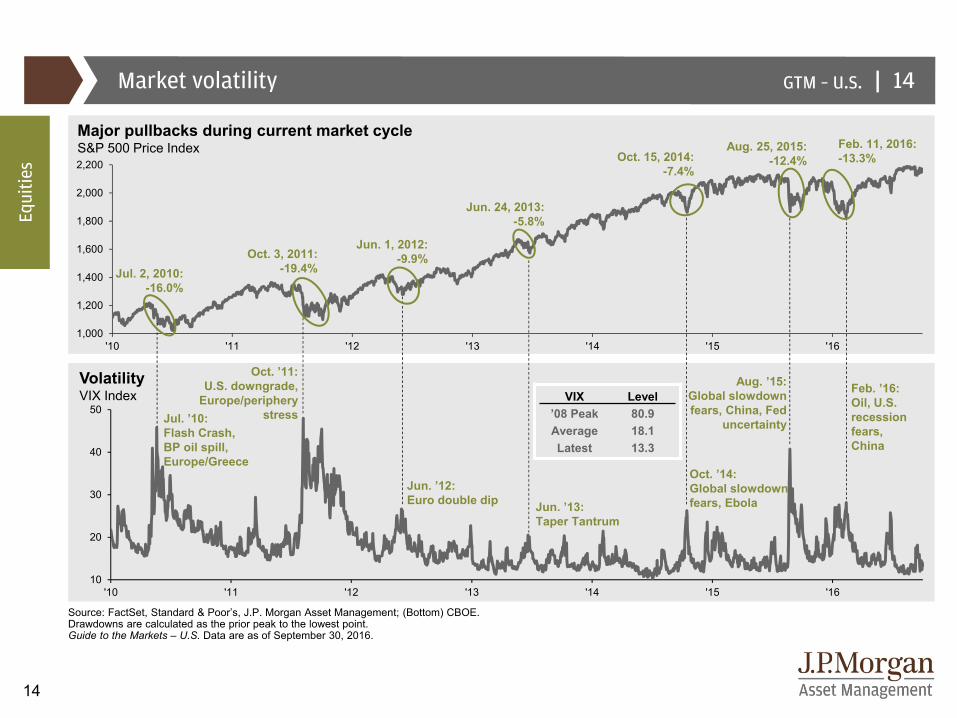
Market volatility
Source: FactSet, Standard & Poor’s, J.P. Morgan Asset Management; (Bottom) CBOE.Drawdowns are calculated as the prior peak to the lowest point. Guide to the Markets – U.S. Data are as of September 30, 2016.
14
Major pullbacks during current market cycleS&P 500 Price Index
Equi
ties
VolatilityVIX Index
Aug. 25, 2015: -12.4%
Jul. 2, 2010: -16.0%
Oct. 3, 2011: -19.4%
Jun. 1, 2012: -9.9%
Jun. 24, 2013: -5.8%
Oct. 15, 2014: -7.4%
VIX Level’08 Peak 80.9Average 18.1Latest 13.3
Jul. ’10:Flash Crash,BP oil spill, Europe/Greece
Oct. ’11:U.S. downgrade,
Europe/periphery stress
Jun. ’12:Euro double dip Jun. ’13:
Taper Tantrum
Oct. ’14:Global slowdown fears, Ebola
Aug. ’15:Global slowdown fears, China, Fed
uncertainty
Feb. 11, 2016:-13.3%
Feb. ’16:Oil, U.S. recession fears, China
|GTM – U.S.
15
$0.0
$0.2
$0.4
$0.6
$0.8
$1.0
$1.2
$1.4
$1.6
$1.8
$1.3$1.4$1.5$1.6$1.7$1.8$1.9$2.0$2.1$2.2$2.3$2.4
'00 '01 '02 '03 '04 '05 '06 '07 '08 '09 '10 '11 '12 '13 '14 '15 '1636%
38%
40%
42%
44%
46%
'00 '01 '02 '03 '04 '05 '06 '07 '08 '09 '10 '11 '12 '13 '14 '15 '16
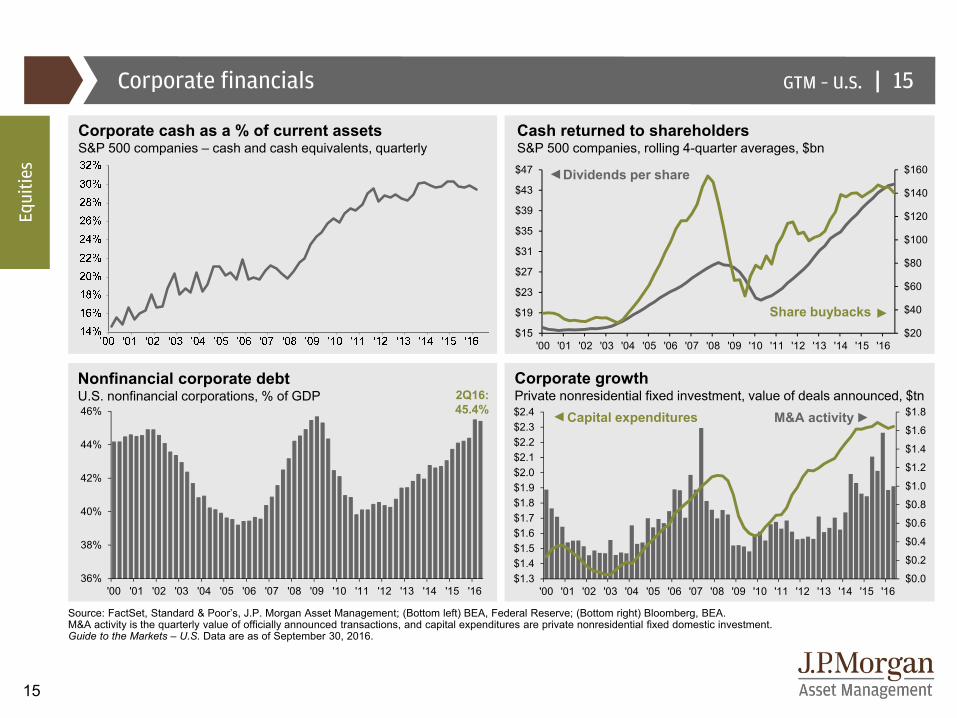
Source: FactSet, Standard & Poor’s, J.P. Morgan Asset Management; (Bottom left) BEA, Federal Reserve; (Bottom right) Bloomberg, BEA.M&A activity is the quarterly value of officially announced transactions, and capital expenditures are private nonresidential fixed domestic investment.Guide to the Markets – U.S. Data are as of September 30, 2016.
Corporate financials 15
Corporate cash as a % of current assetsS&P 500 companies – cash and cash equivalents, quarterly
Nonfinancial corporate debtU.S. nonfinancial corporations, % of GDP
Corporate growthPrivate nonresidential fixed investment, value of deals announced, $tn
Capital expenditures M&A activity
Equi
ties
Cash returned to shareholdersS&P 500 companies, rolling 4-quarter averages, $bn
2Q16:45.4%
Dividends per share
Share buybacks$20
$40
$60
$80
$100
$120
$140
$160
$15
$19
$23
$27
$31
$35
$39
$43
$47
'00 '01 '02 '03 '04 '05 '06 '07 '08 '09 '10 '11 '12 '13 '14 '15 '16
|GTM – U.S.
16
-100%
-80%
-60%
-40%
-20%
0%
1926 1931 1936 1941 1946 1951 1956 1961 1966 1971 1976 1981 1986 1991 1996 2001 2006 2011 2016
7
9
8
6
5
4
3
2
1
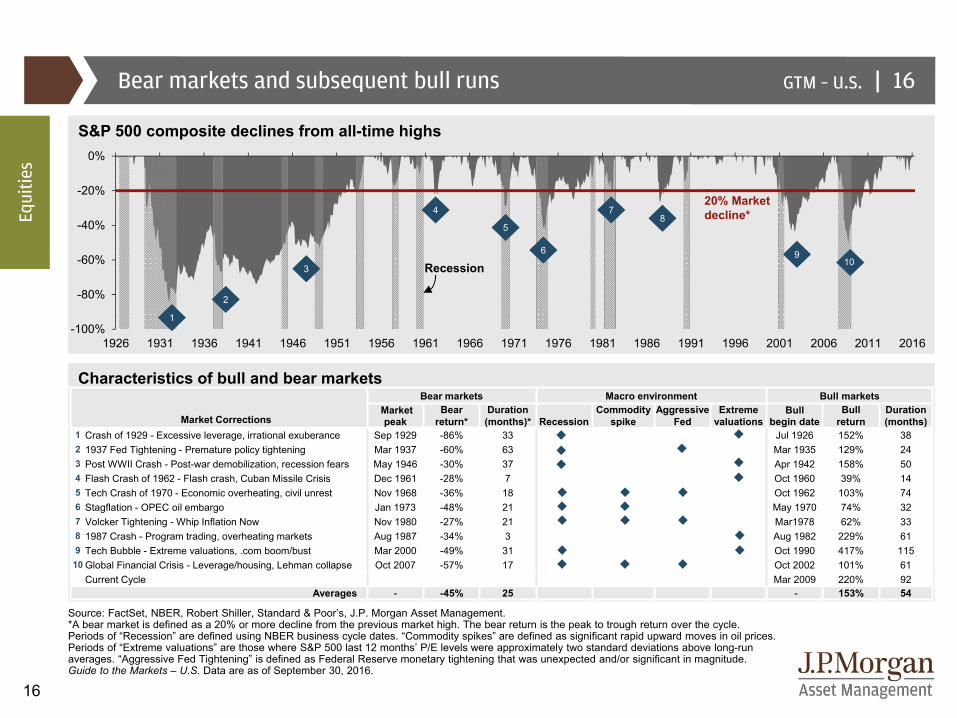
Bear markets and subsequent bull runs
Source: FactSet, NBER, Robert Shiller, Standard & Poor’s, J.P. Morgan Asset Management.*A bear market is defined as a 20% or more decline from the previous market high. The bear return is the peak to trough return over the cycle. Periods of “Recession” are defined using NBER business cycle dates. “Commodity spikes” are defined as significant rapid upward moves in oil prices. Periods of “Extreme valuations” are those where S&P 500 last 12 months’ P/E levels were approximately two standard deviations above long-run averages. “Aggressive Fed Tightening” is defined as Federal Reserve monetary tightening that was unexpected and/or significant in magnitude.Guide to the Markets – U.S. Data are as of September 30, 2016.
16
Characteristics of bull and bear markets
S&P 500 composite declines from all-time highs
Recession
20% Market decline*
Market Corrections
Bear markets Macro environment Bull marketsMarket Bear Duration
RecessionCommodity Aggressive Extreme Bull Bull Duration
peak return* (months)* spike Fed valuations begin date return (months)1 Crash of 1929 - Excessive leverage, irrational exuberance Sep 1929 -86% 33 Jul 1926 152% 382 1937 Fed Tightening - Premature policy tightening Mar 1937 -60% 63 Mar 1935 129% 243 Post WWII Crash - Post-war demobilization, recession fears May 1946 -30% 37 Apr 1942 158% 504 Flash Crash of 1962 - Flash crash, Cuban Missile Crisis Dec 1961 -28% 7 Oct 1960 39% 145 Tech Crash of 1970 - Economic overheating, civil unrest Nov 1968 -36% 18 Oct 1962 103% 746 Stagflation - OPEC oil embargo Jan 1973 -48% 21 May 1970 74% 327 Volcker Tightening - Whip Inflation Now Nov 1980 -27% 21 Mar1978 62% 338 1987 Crash - Program trading, overheating markets Aug 1987 -34% 3 Aug 1982 229% 619 Tech Bubble - Extreme valuations, .com boom/bust Mar 2000 -49% 31 Oct 1990 417% 115
10 Global Financial Crisis - Leverage/housing, Lehman collapse Oct 2007 -57% 17 Oct 2002 101% 61Current Cycle Mar 2009 220% 92
Averages - -45% 25 - 153% 54
Equi
ties
10
|GTM – U.S.
17
-0.8
-0.6
-0.4
-0.2
0.0
0.2
0.4
0.6
0.8
0% 2% 4% 6% 8% 10% 12% 14% 16%
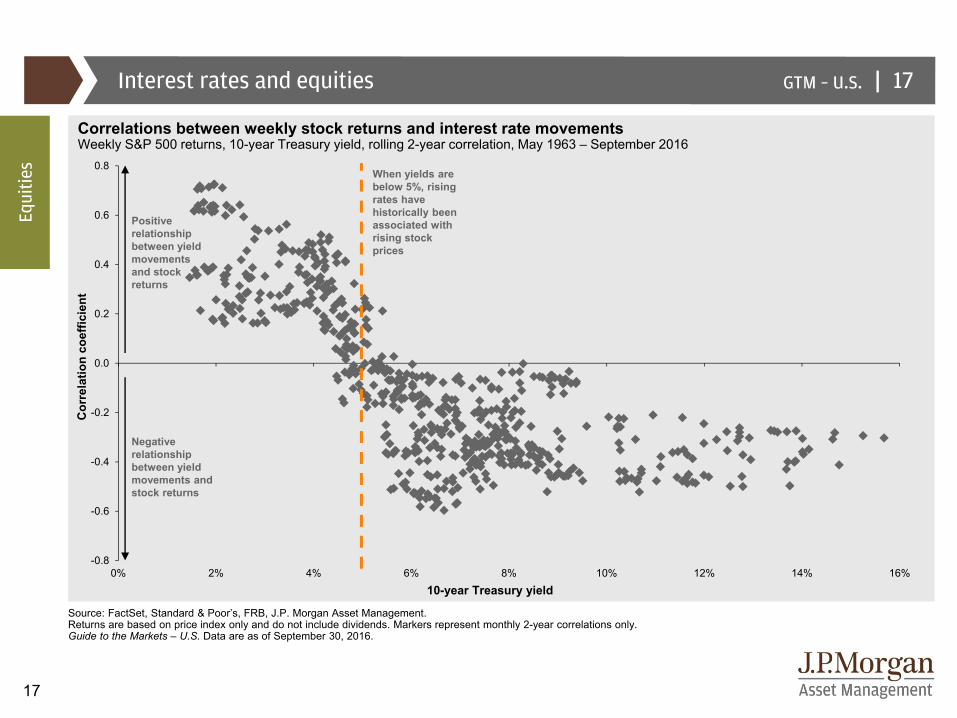
Interest rates and equities
Source: FactSet, Standard & Poor’s, FRB, J.P. Morgan Asset Management.Returns are based on price index only and do not include dividends. Markers represent monthly 2-year correlations only.Guide to the Markets – U.S. Data are as of September 30, 2016.
Correlations between weekly stock returns and interest rate movements Weekly S&P 500 returns, 10-year Treasury yield, rolling 2-year correlation, May 1963 – September 2016
17
Positive relationship between yield movements and stock returns
Negative relationship between yield movements and stock returns
10-year Treasury yield
Cor
rela
tion
coef
ficie
nt
Equi
ties
When yields are below 5%, rising rates have historically been associated with rising stock prices
|GTM – U.S.
18
1900 1910 1920 1930 1940 1950 1960 1970 1980 1990 2000 2010
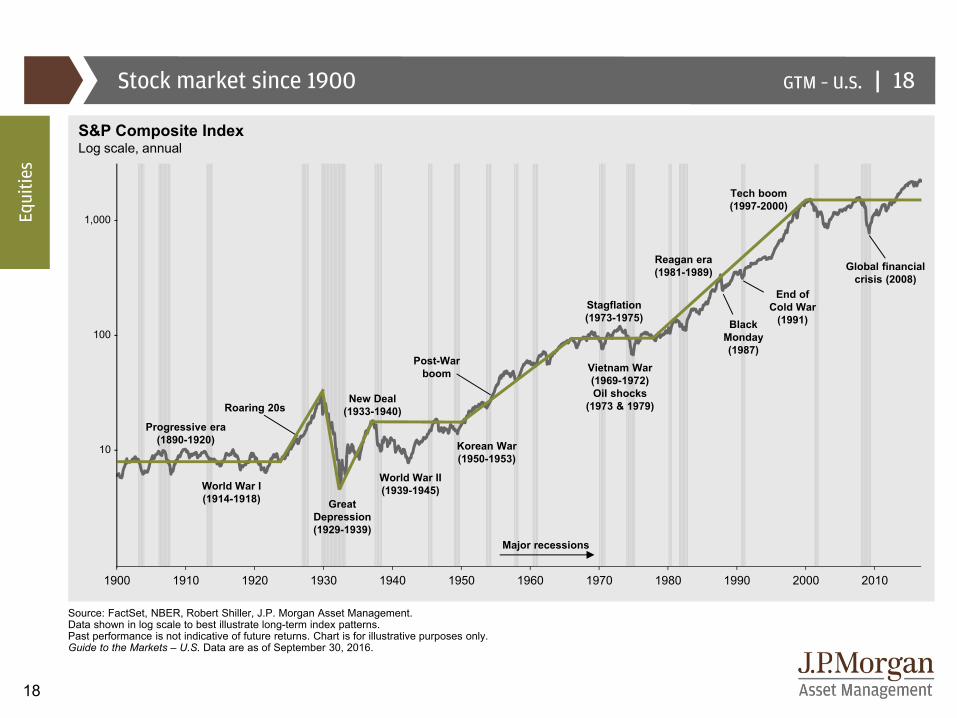
Stock market since 1900
Source: FactSet, NBER, Robert Shiller, J.P. Morgan Asset Management. Data shown in log scale to best illustrate long-term index patterns. Past performance is not indicative of future returns. Chart is for illustrative purposes only. Guide to the Markets – U.S. Data are as of September 30, 2016.
18
1,000 -
100 -
10 -
Equi
ties
S&P Composite IndexLog scale, annual
Major recessions
Tech boom(1997-2000)
End of Cold War
(1991)
Reagan era(1981-1989)
Post-Warboom
New Deal(1933-1940)Roaring 20s
Progressive era (1890-1920)
World War I(1914-1918) Great
Depression(1929-1939)
World War II(1939-1945)
Korean War(1950-1953)
Vietnam War(1969-1972)Oil shocks
(1973 & 1979)
Stagflation (1973-1975)
Global financial crisis (2008)
BlackMonday(1987)
|GTM – U.S.
19
0
25
50
75
100
125
1900 1912 1921 1933 1949 1961 1980 2001
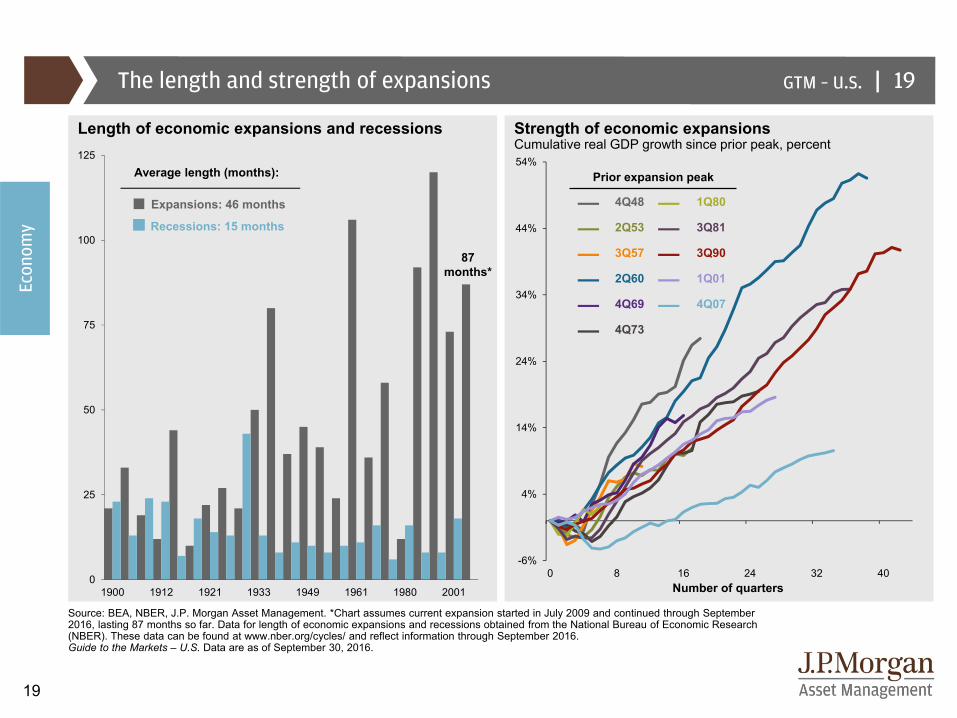
Source: BEA, NBER, J.P. Morgan Asset Management. *Chart assumes current expansion started in July 2009 and continued through September 2016, lasting 87 months so far. Data for length of economic expansions and recessions obtained from the National Bureau of Economic Research (NBER). These data can be found at www.nber.org/cycles/ and reflect information through September 2016.Guide to the Markets – U.S. Data are as of September 30, 2016.
The length and strength of expansions
Length of economic expansions and recessions Strength of economic expansionsCumulative real GDP growth since prior peak, percent
Prior expansion peak
— 4Q48 — 1Q80
— 2Q53 — 3Q81
— 3Q57 — 3Q90
— 2Q60 — 1Q01
— 4Q69 — 4Q07
— 4Q73
Expansions: 46 months
Recessions: 15 months
Average length (months):
87 months*
Econ
omy
Number of quarters
19
-6%
4%
14%
24%
34%
44%
54%
0 8 16 24 32 40
|GTM – U.S.
20
-$1
$1
$3
$5
$7
$9
$11
$13
$15
$17
$19Real GDP
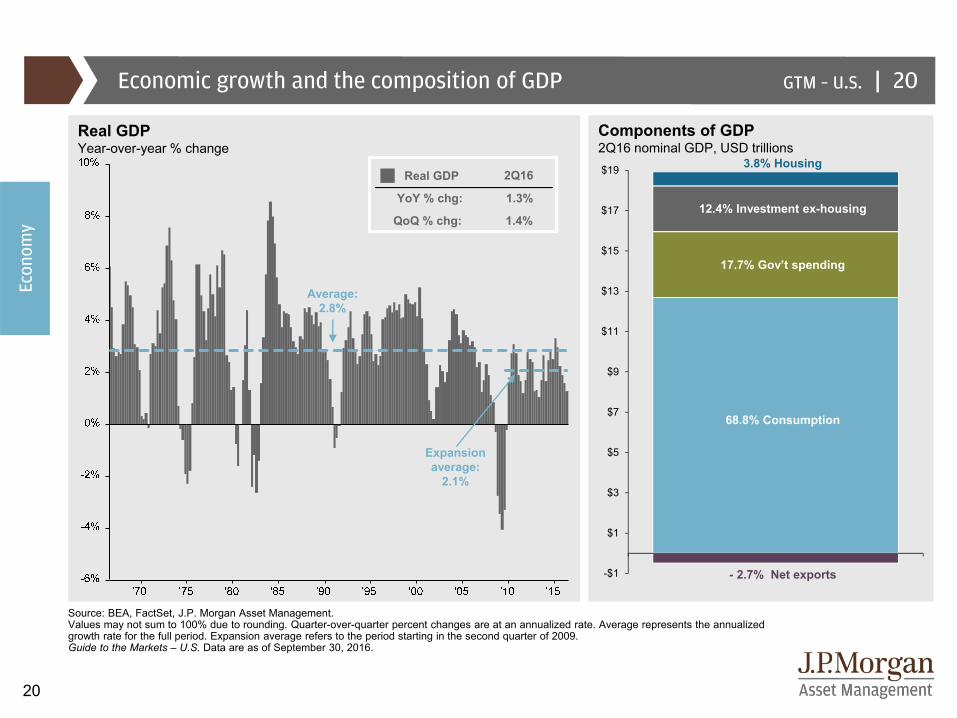
Source: BEA, FactSet, J.P. Morgan Asset Management.Values may not sum to 100% due to rounding. Quarter-over-quarter percent changes are at an annualized rate. Average represents the annualized growth rate for the full period. Expansion average refers to the period starting in the second quarter of 2009.Guide to the Markets – U.S. Data are as of September 30, 2016.
Economic growth and the composition of GDP 20
Real GDPYear-over-year % change
2Q16
YoY % chg: 1.3%
Components of GDP2Q16 nominal GDP, USD trillions
12.4% Investment ex-housing
68.8% Consumption
17.7% Gov’t spending
3.8% Housing
- 2.7% Net exports
Average: 2.8%
QoQ % chg: 1.4%
Expansion average:
2.1%
Econ
omy
|GTM – U.S.
21
$0
$10
$20
$30
$40
$50
$60
$70
$80
$90
$100
$1104Q07:13.2%
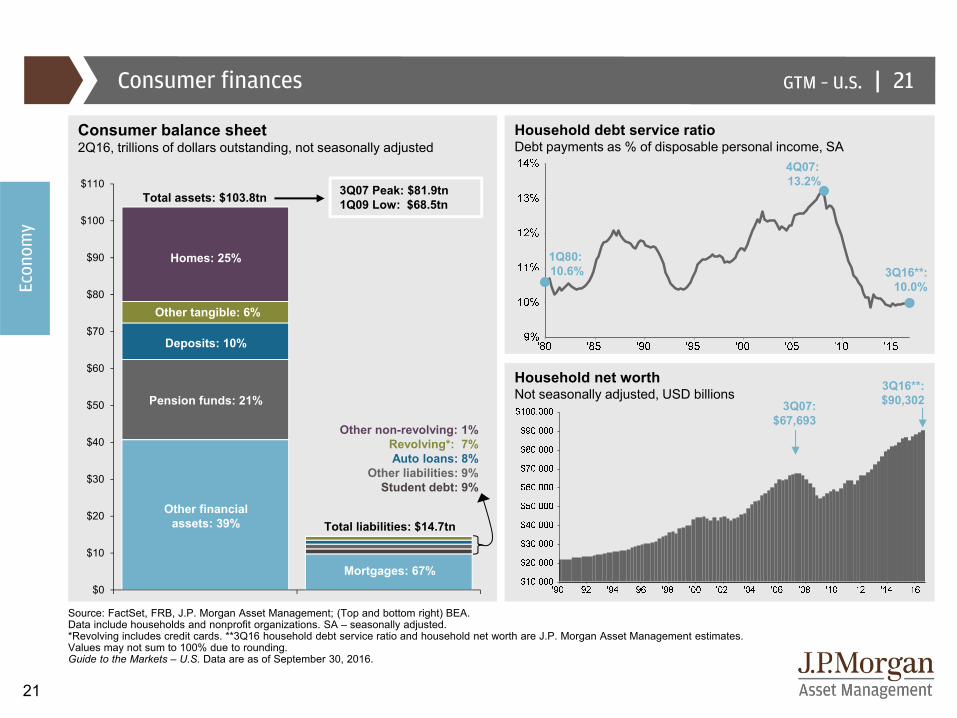
Source: FactSet, FRB, J.P. Morgan Asset Management; (Top and bottom right) BEA. Data include households and nonprofit organizations. SA – seasonally adjusted. *Revolving includes credit cards. **3Q16 household debt service ratio and household net worth are J.P. Morgan Asset Management estimates. Values may not sum to 100% due to rounding.Guide to the Markets – U.S. Data are as of September 30, 2016.
Consumer finances 21
Household debt service ratioDebt payments as % of disposable personal income, SA
1Q80: 10.6% 3Q16**:
10.0%
Household net worthNot seasonally adjusted, USD billions
3Q07:$67,693
Consumer balance sheet2Q16, trillions of dollars outstanding, not seasonally adjusted
Total assets: $103.8tn
Total liabilities: $14.7tn
Homes: 25%
Deposits: 10%
Pension funds: 21%
Other financial assets: 39%
Other tangible: 6%
Mortgages: 67%
Other non-revolving: 1%Revolving*: 7%Auto loans: 8%
Other liabilities: 9%Student debt: 9%
3Q07 Peak: $81.9tn1Q09 Low: $68.5tn
3Q16**:$90,302
Econ
omy
|GTM – U.S.
22
8
10
12
14
16
18
20
22
24
'96 '98 '00 '02 '04 '06 '08 '10 '12 '14
$45
$50
$55
$60
$65
$70
$75
$80
'96 '98 '00 '02 '04 '06 '08 '10 '12 '14
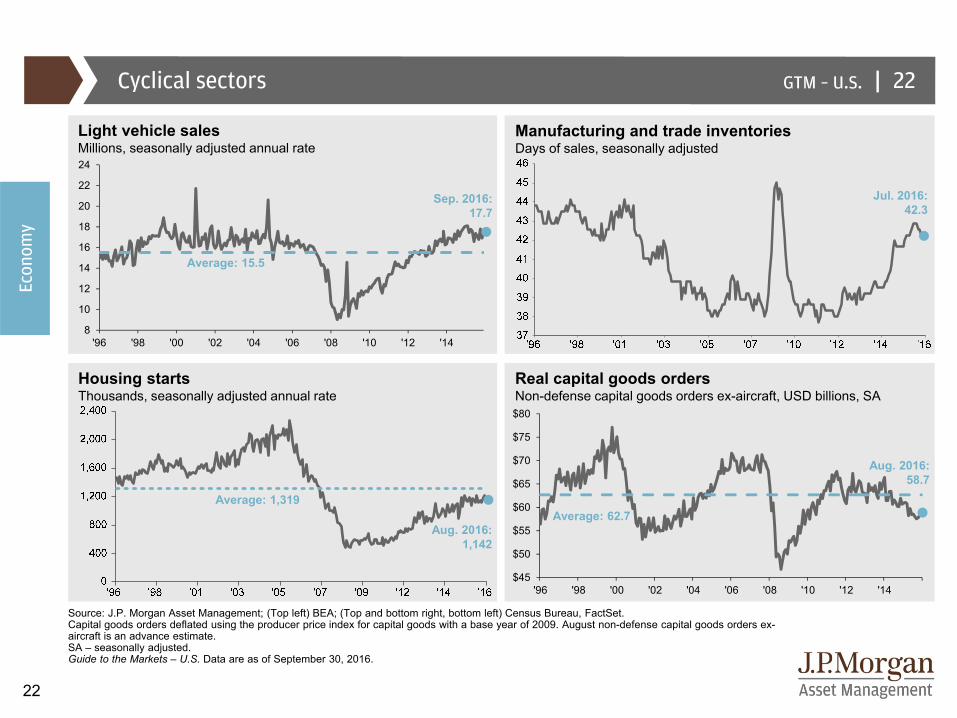
Source: J.P. Morgan Asset Management; (Top left) BEA; (Top and bottom right, bottom left) Census Bureau, FactSet.Capital goods orders deflated using the producer price index for capital goods with a base year of 2009. August non-defense capital goods orders ex-aircraft is an advance estimate. SA – seasonally adjusted. Guide to the Markets – U.S. Data are as of September 30, 2016.
Cyclical sectors 22
Light vehicle salesMillions, seasonally adjusted annual rate
Average: 15.5
Sep. 2016:17.7
Aug. 2016:1,142
Housing startsThousands, seasonally adjusted annual rate
Average: 1,319
Real capital goods ordersNon-defense capital goods orders ex-aircraft, USD billions, SA
Average: 62.7
Aug. 2016:58.7
Manufacturing and trade inventoriesDays of sales, seasonally adjusted
Jul. 2016: 42.3
Econ
omy
|GTM – U.S.
23
10%
15%
20%
25%
30%
35%
40%
'76 '79 '82 '85 '88 '91 '94 '97 '00 '03 '06 '09 '12 '15
680
700
720
740
760
'04 '05 '06 '07 '08 '09 '10 '11 '12 '13 '14 '15
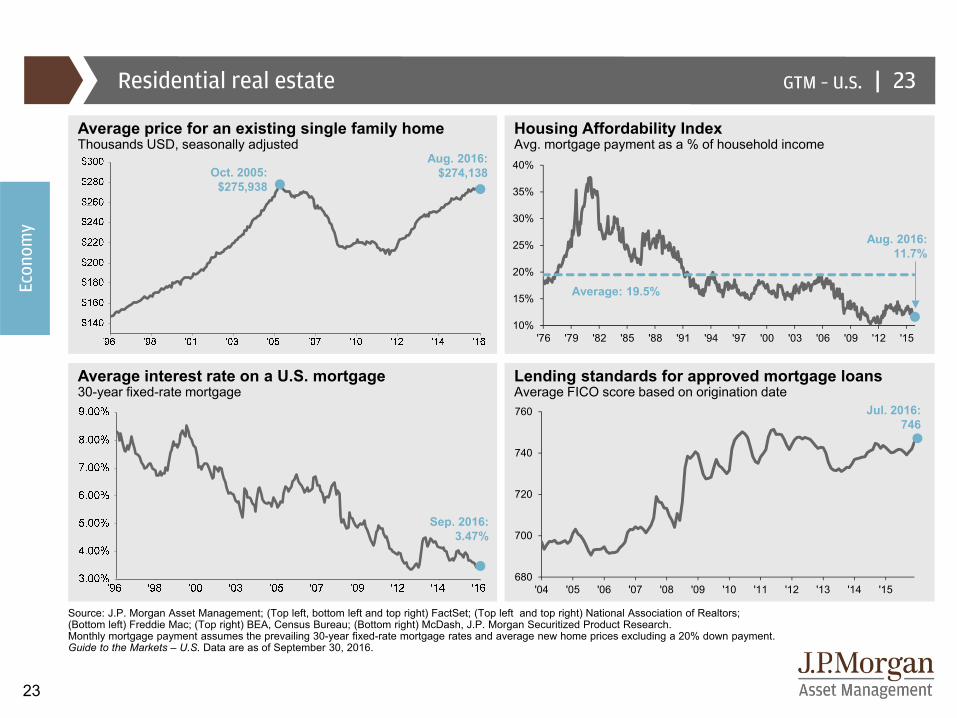
Source: J.P. Morgan Asset Management; (Top left, bottom left and top right) FactSet; (Top left and top right) National Association of Realtors; (Bottom left) Freddie Mac; (Top right) BEA, Census Bureau; (Bottom right) McDash, J.P. Morgan Securitized Product Research.Monthly mortgage payment assumes the prevailing 30-year fixed-rate mortgage rates and average new home prices excluding a 20% down payment.Guide to the Markets – U.S. Data are as of September 30, 2016.
Residential real estate
Housing Affordability IndexAvg. mortgage payment as a % of household income
Average price for an existing single family homeThousands USD, seasonally adjusted
Average interest rate on a U.S. mortgage30-year fixed-rate mortgage
Lending standards for approved mortgage loansAverage FICO score based on origination date
23
Aug. 2016: 11.7%
Average: 19.5%
Jul. 2016: 746
Econ
omy
Aug. 2016:$274,138
Sep. 2016:3.47%
Oct. 2005:$275,938
|GTM – U.S.
24
|
0%
1%
2%
3%
4%
5%
6%
'55 '60 '65 '70 '75 '80 '85 '90 '95 '00 '05 '10 '150.0%
0.5%
1.0%
1.5%
2.0%
2.5%
3.0%
3.5%
4.0%
4.5%
'56-'65 '66-'75 '76-'85 '86-'95 '96-'05 '06-'15
0.0%
0.4%
0.8%
1.2%
1.6%
2.0%
'55-'64 '65-'74 '75-'84 '85-94 '95-'04 '05-'14 '15-'24
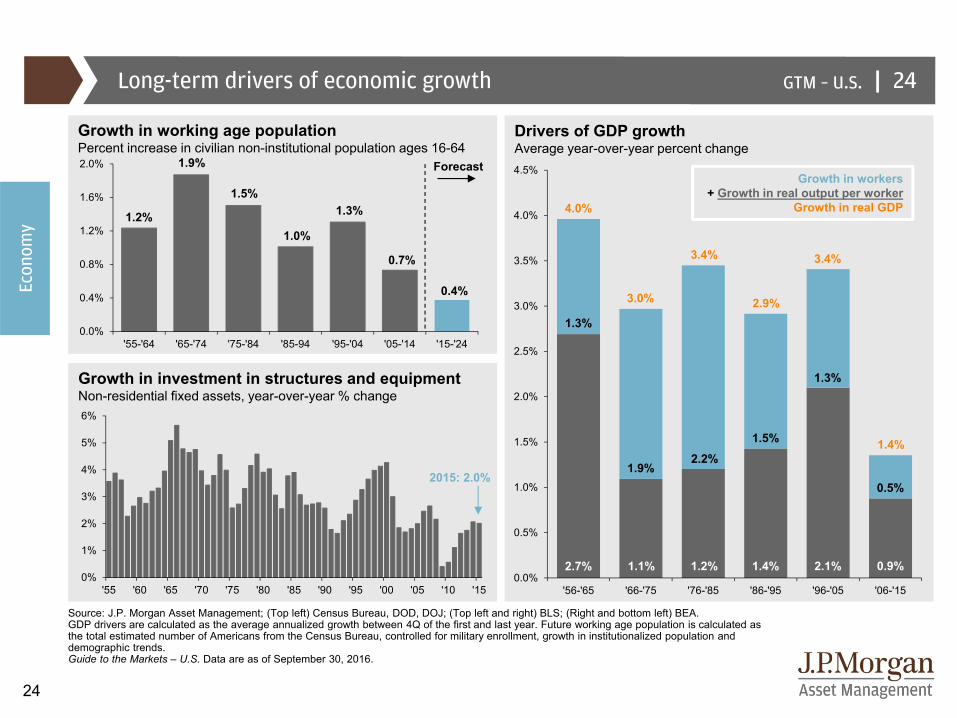
Source: J.P. Morgan Asset Management; (Top left) Census Bureau, DOD, DOJ; (Top left and right) BLS; (Right and bottom left) BEA.GDP drivers are calculated as the average annualized growth between 4Q of the first and last year. Future working age population is calculated as the total estimated number of Americans from the Census Bureau, controlled for military enrollment, growth in institutionalized population and demographic trends.Guide to the Markets – U.S. Data are as of September 30, 2016.
Long-term drivers of economic growth 24
Growth in workers + Growth in real output per worker
Growth in real GDP
Forecast
2015: 2.0%
1.3%
1.9%2.2%
1.5%
1.3%
0.5%
2.7% 1.1% 1.2% 1.4% 2.1% 0.9%
4.0%
3.0%
3.4%
2.9%
3.4%
1.4%
1.2%
1.9%
1.5%
1.0%
1.3%
0.7%
0.4%
Growth in working age populationPercent increase in civilian non-institutional population ages 16-64
Drivers of GDP growthAverage year-over-year percent change
Growth in investment in structures and equipmentNon-residential fixed assets, year-over-year % change
Econ
omy
|GTM – U.S.
25
20%
40%
60%
80%
100%
120%
'40 '48 '56 '64 '72 '80 '88 '96 '04 '12 '20
-12%
-10%
-8%
-6%
-4%
-2%
0%
2%
4%'90 '95 '00 '05 '10 '15 '20 '25
$0.0
$0.5
$1.0
$1.5
$2.0
$2.5
$3.0
$3.5
$4.0
Total government spending Sources of financing
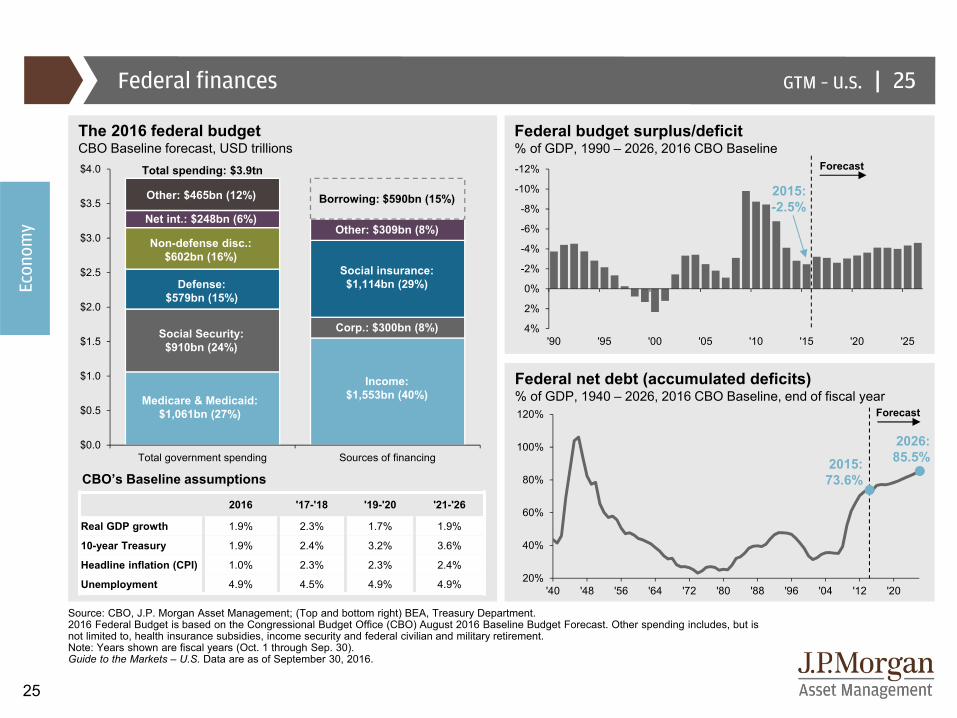
Source: CBO, J.P. Morgan Asset Management; (Top and bottom right) BEA, Treasury Department.2016 Federal Budget is based on the Congressional Budget Office (CBO) August 2016 Baseline Budget Forecast. Other spending includes, but is not limited to, health insurance subsidies, income security and federal civilian and military retirement. Note: Years shown are fiscal years (Oct. 1 through Sep. 30). Guide to the Markets – U.S. Data are as of September 30, 2016.
Federal finances 25
The 2016 federal budgetCBO Baseline forecast, USD trillions
Total spending: $3.9tn
Medicare & Medicaid:$1,061bn (27%)
Defense:$579bn (15%)
Social Security:$910bn (24%)
Other: $465bn (12%)
Non-defense disc.:$602bn (16%)
Net int.: $248bn (6%)
Borrowing: $590bn (15%)
Income:$1,553bn (40%)
Corp.: $300bn (8%)
Social insurance:$1,114bn (29%)
Other: $309bn (8%)
Federal budget surplus/deficit% of GDP, 1990 – 2026, 2016 CBO Baseline
Forecast
2015: -2.5%
Federal net debt (accumulated deficits)% of GDP, 1940 – 2026, 2016 CBO Baseline, end of fiscal year
2026: 85.5%2015:
73.6%
Forecast
CBO’s Baseline assumptions
2016 '17-'18 '19-'20 '21-'26
Real GDP growth 1.9% 2.3% 1.7% 1.9%
10-year Treasury 1.9% 2.4% 3.2% 3.6%
Headline inflation (CPI) 1.0% 2.3% 2.3% 2.4%
Unemployment 4.9% 4.5% 4.9% 4.9%
Econ
omy
|GTM – U.S.
26
0%
1%
2%
3%
4%
5%
6%
7%
8%
White House** Senate** House of Representatives**40%
50%
60%
70%
80%
1949 1961 1973 1985 1997 2009
70%
75%
80%
85%
90%
95%
100%
1901 1919 1937 1955 1973 1991 2009
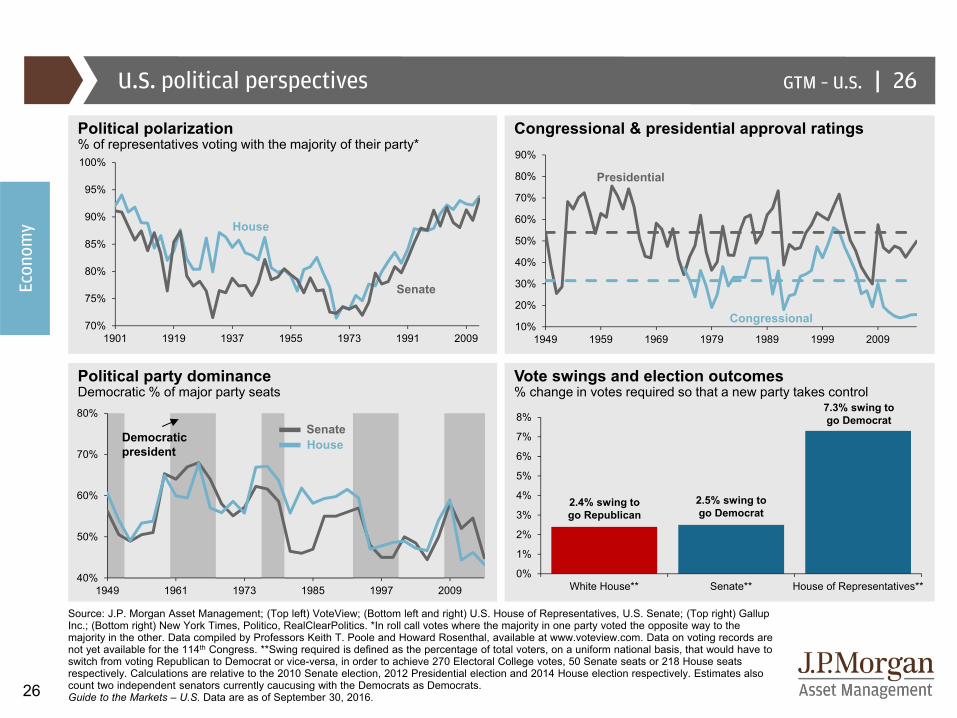
Source: J.P. Morgan Asset Management; (Top left) VoteView; (Bottom left and right) U.S. House of Representatives, U.S. Senate; (Top right) Gallup Inc.; (Bottom right) New York Times, Politico, RealClearPolitics. *In roll call votes where the majority in one party voted the opposite way to the majority in the other. Data compiled by Professors Keith T. Poole and Howard Rosenthal, available at www.voteview.com. Data on voting records are not yet available for the 114th Congress. **Swing required is defined as the percentage of total voters, on a uniform national basis, that would have to switch from voting Republican to Democrat or vice-versa, in order to achieve 270 Electoral College votes, 50 Senate seats or 218 House seats respectively. Calculations are relative to the 2010 Senate election, 2012 Presidential election and 2014 House election respectively. Estimates also count two independent senators currently caucusing with the Democrats as Democrats.Guide to the Markets – U.S. Data are as of September 30, 2016.
U.S. political perspectives
Congressional & presidential approval ratingsPolitical polarization% of representatives voting with the majority of their party*
Political party dominanceDemocratic % of major party seats
Vote swings and election outcomes% change in votes required so that a new party takes control
26
Democratic president
Senate
House
SenateHouse
Presidential
Congressional
Econ
omy
10%
20%
30%
40%
50%
60%
70%
80%
90%
1949 1959 1969 1979 1989 1999 2009
7.3% swing to go Democrat
2.5% swing to go Democrat
2.4% swing to go Republican
|GTM – U.S.
27
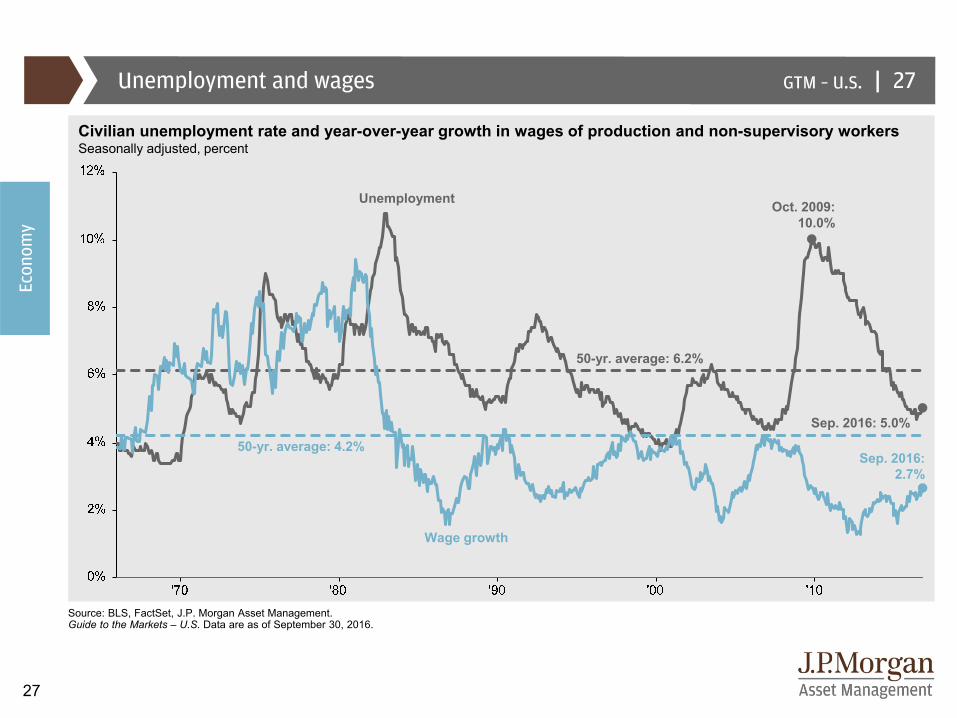
Unemployment and wages
Source: BLS, FactSet, J.P. Morgan Asset Management.Guide to the Markets – U.S. Data are as of September 30, 2016.
27
Civilian unemployment rate and year-over-year growth in wages of production and non-supervisory workersSeasonally adjusted, percent
50-yr. average: 4.2%
Sep. 2016: 5.0%
Oct. 2009: 10.0%
Sep. 2016: 2.7%
50-yr. average: 6.2%
Wage growth
Unemployment
Econ
omy
|GTM – U.S.
28
62%
63%
64%
65%
66%
67%
'06 '07 '08 '09 '10 '11 '12 '13 '14 '15 '16
'07 '08 '09 '10 '11 '12 '13 '14 '15 '16-1,000
-800
-600
-400
-200
0
200
400
600
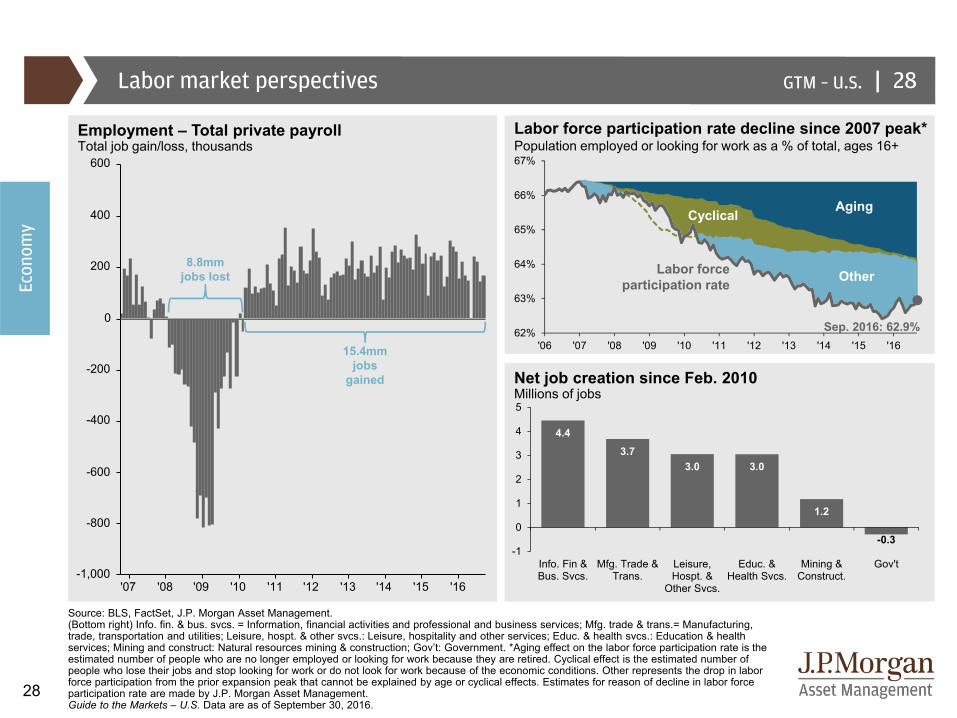
Source: BLS, FactSet, J.P. Morgan Asset Management. (Bottom right) Info. fin. & bus. svcs. = Information, financial activities and professional and business services; Mfg. trade & trans.= Manufacturing, trade, transportation and utilities; Leisure, hospt. & other svcs.: Leisure, hospitality and other services; Educ. & health svcs.: Education & health services; Mining and construct: Natural resources mining & construction; Gov’t: Government. *Aging effect on the labor force participation rate is the estimated number of people who are no longer employed or looking for work because they are retired. Cyclical effect is the estimated number of people who lose their jobs and stop looking for work or do not look for work because of the economic conditions. Other represents the drop in labor force participation from the prior expansion peak that cannot be explained by age or cyclical effects. Estimates for reason of decline in labor force participation rate are made by J.P. Morgan Asset Management.Guide to the Markets – U.S. Data are as of September 30, 2016.
Labor market perspectives
Employment – Total private payrollTotal job gain/loss, thousands
Labor force participation rate decline since 2007 peak*Population employed or looking for work as a % of total, ages 16+
Net job creation since Feb. 2010 Millions of jobs
28
8.8mmjobs lost
15.4mm jobs
gained
Sep. 2016: 62.9%
Econ
omy
AgingCyclical
OtherLabor force participation rate
4.43.7
3.0 3.0
1.2
-0.3-1
0
1
2
3
4
5
Info. Fin &Bus. Svcs.
Mfg. Trade &Trans.
Leisure,Hospt. &
Other Svcs.
Educ. &Health Svcs.
Mining &Construct.
Gov't
|GTM – U.S.
29
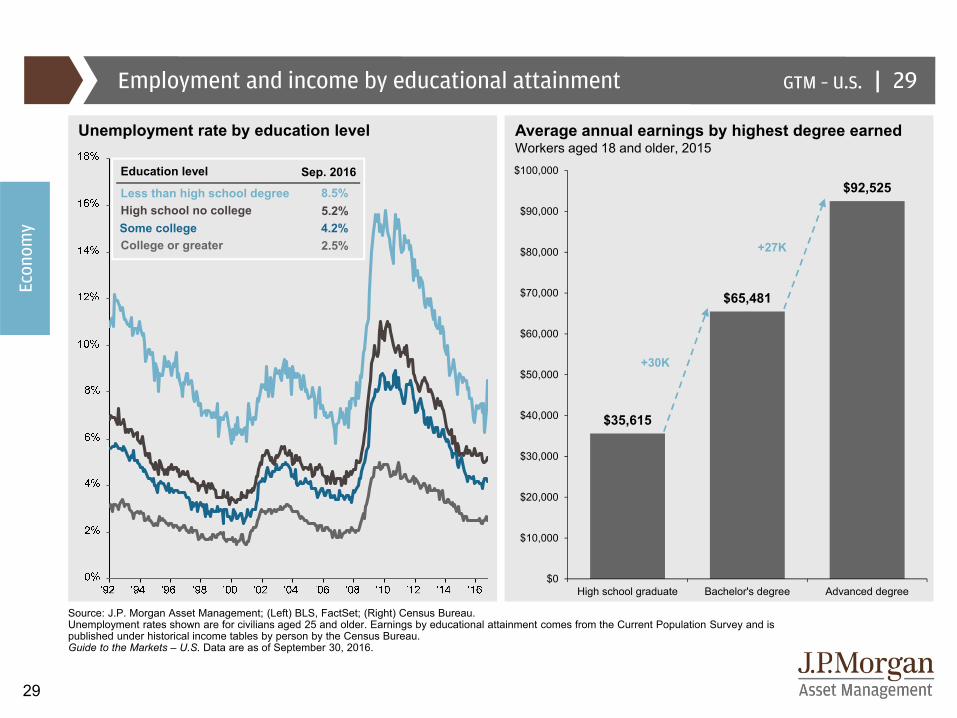
$35,615
$65,481
$92,525
$0
$10,000
$20,000
$30,000
$40,000
$50,000
$60,000
$70,000
$80,000
$90,000
$100,000
High school graduate Bachelor's degree Advanced degree
Source: J.P. Morgan Asset Management; (Left) BLS, FactSet; (Right) Census Bureau.Unemployment rates shown are for civilians aged 25 and older. Earnings by educational attainment comes from the Current Population Survey and is published under historical income tables by person by the Census Bureau. Guide to the Markets – U.S. Data are as of September 30, 2016.
Employment and income by educational attainment 29
Unemployment rate by education level Average annual earnings by highest degree earnedWorkers aged 18 and older, 2015
+30K
+27K2.5%4.2%5.2%8.5%Less than high school degree
High school no collegeSome collegeCollege or greater
Education level Sep. 2016
Econ
omy
|GTM – U.S.
30
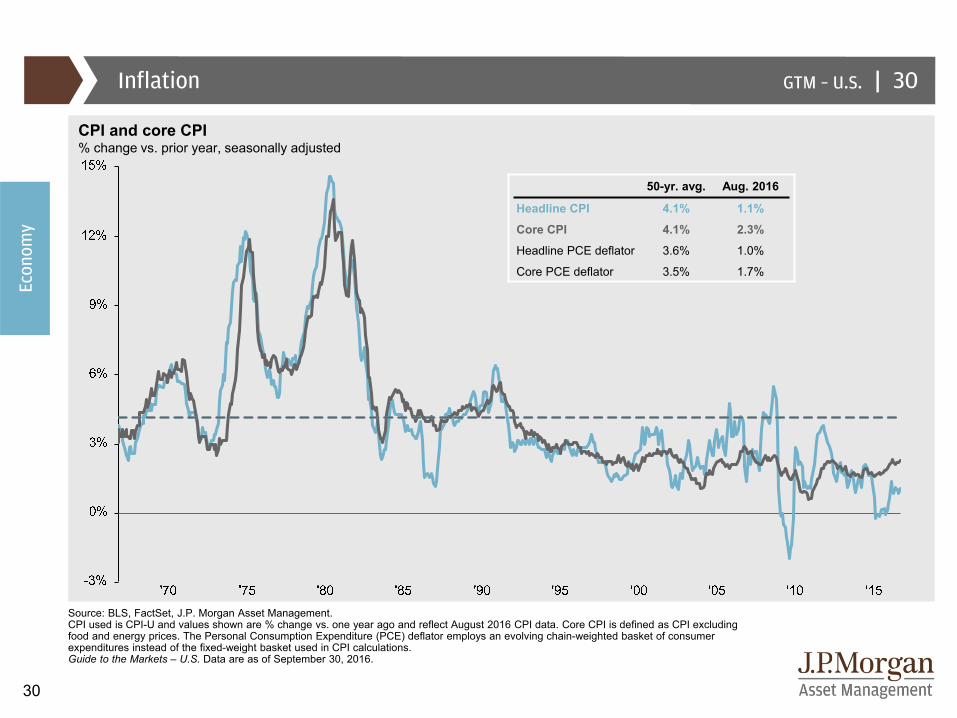
Inflation
Source: BLS, FactSet, J.P. Morgan Asset Management.CPI used is CPI-U and values shown are % change vs. one year ago and reflect August 2016 CPI data. Core CPI is defined as CPI excluding food and energy prices. The Personal Consumption Expenditure (PCE) deflator employs an evolving chain-weighted basket of consumer expenditures instead of the fixed-weight basket used in CPI calculations.Guide to the Markets – U.S. Data are as of September 30, 2016.
CPI and core CPI% change vs. prior year, seasonally adjusted
Econ
omy
50-yr. avg. Aug. 2016
Headline CPI 4.1% 1.1%
Core CPI 4.1% 2.3%
Headline PCE deflator 3.6% 1.0%
Core PCE deflator 3.5% 1.7%
30
|GTM – U.S.
31
-7%
-6%
-5%
-4%
-3%
-2%
-1%
0%'95 '97 '99 '01 '03 '05 '07 '09 '11 '13 '15
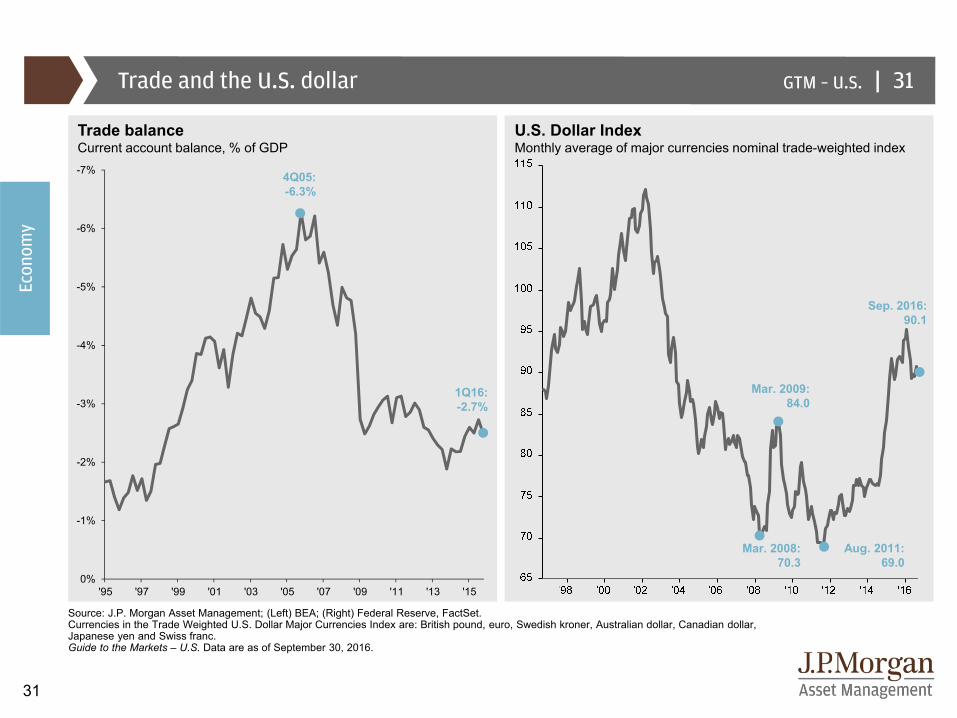
Source: J.P. Morgan Asset Management; (Left) BEA; (Right) Federal Reserve, FactSet. Currencies in the Trade Weighted U.S. Dollar Major Currencies Index are: British pound, euro, Swedish kroner, Australian dollar, Canadian dollar, Japanese yen and Swiss franc.Guide to the Markets – U.S. Data are as of September 30, 2016.
Trade and the U.S. dollar 31
U.S. Dollar IndexMonthly average of major currencies nominal trade-weighted index
1Q16:-2.7%
4Q05:-6.3%
Mar. 2009: 84.0
Mar. 2008: 70.3
Sep. 2016: 90.1
Trade balanceCurrent account balance, % of GDP
Aug. 2011: 69.0
Econ
omy
|GTM – U.S.
32
|
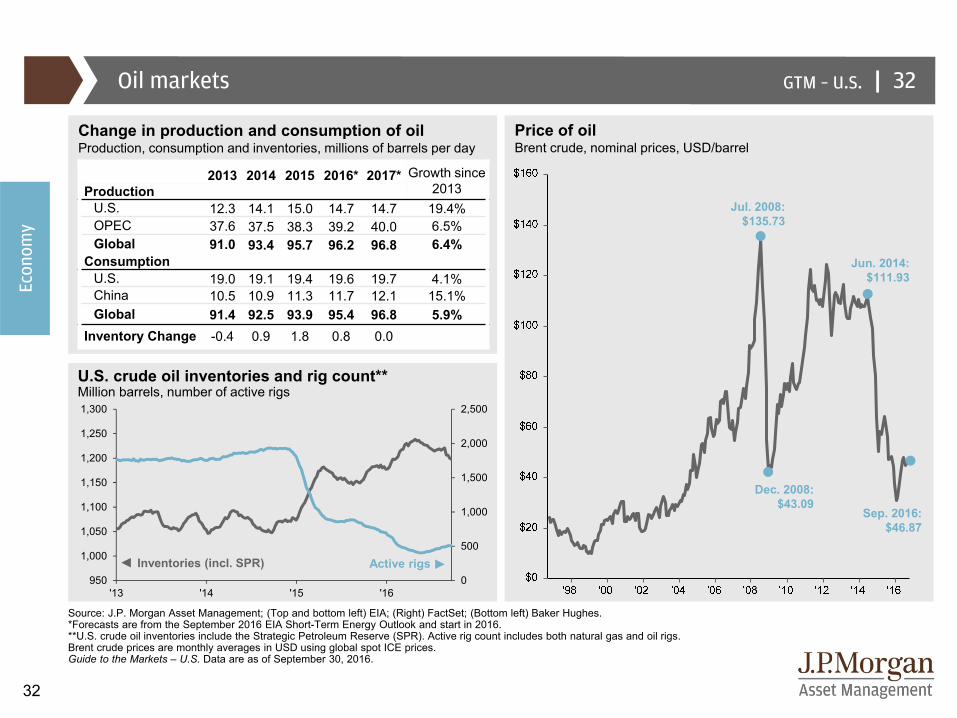
2013 2014 2015 2016* 2017* Growth since 2013Production
U.S. 12.3 14.1 15.0 14.7 14.7 19.4%OPEC 37.6 37.5 38.3 39.2 40.0 6.5%Global 91.0 93.4 95.7 96.2 96.8 6.4%
ConsumptionU.S. 19.0 19.1 19.4 19.6 19.7 4.1%China 10.5 10.9 11.3 11.7 12.1 15.1%Global 91.4 92.5 93.9 95.4 96.8 5.9%
Inventory Change -0.4 0.9 1.8 0.8 0.0
Source: J.P. Morgan Asset Management; (Top and bottom left) EIA; (Right) FactSet; (Bottom left) Baker Hughes. *Forecasts are from the September 2016 EIA Short-Term Energy Outlook and start in 2016. **U.S. crude oil inventories include the Strategic Petroleum Reserve (SPR). Active rig count includes both natural gas and oil rigs. Brent crude prices are monthly averages in USD using global spot ICE prices. Guide to the Markets – U.S. Data are as of September 30, 2016.
Oil markets
U.S. crude oil inventories and rig count**Million barrels, number of active rigs
32
Change in production and consumption of oilProduction, consumption and inventories, millions of barrels per day
Sep. 2016: $46.87
Jul. 2008: $135.73
Dec. 2008: $43.09
Jun. 2014: $111.93
Price of oilBrent crude, nominal prices, USD/barrel
Inventories (incl. SPR) Active rigs
Econ
omy
0
500
1,000
1,500
2,000
2,500
950
1,000
1,050
1,100
1,150
1,200
1,250
1,300
'13 '14 '15 '16
|GTM – U.S.
33
'72 '74 '76 '78 '80 '82 '84 '86 '88 '90 '92 '94 '96 '98 '00 '02 '04 '06 '08 '10 '12 '14 '1640
50
60
70
80
90
100
110
120
130
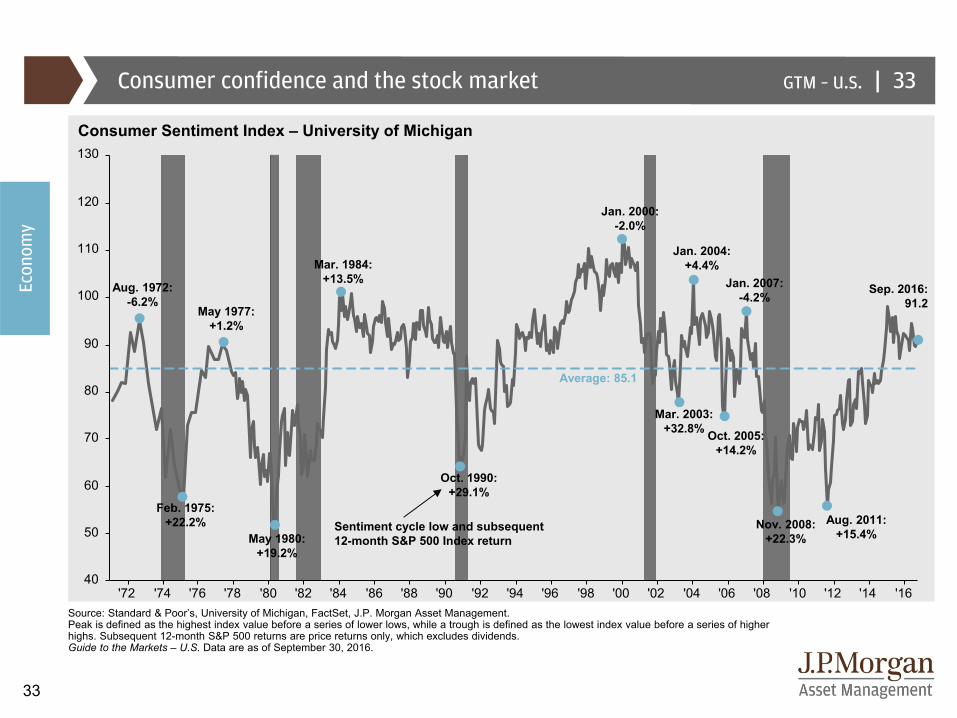
Consumer confidence and the stock market
Source: Standard & Poor’s, University of Michigan, FactSet, J.P. Morgan Asset Management.Peak is defined as the highest index value before a series of lower lows, while a trough is defined as the lowest index value before a series of higher highs. Subsequent 12-month S&P 500 returns are price returns only, which excludes dividends.Guide to the Markets – U.S. Data are as of September 30, 2016.
33
Feb. 1975:+22.2%
Consumer Sentiment Index – University of Michigan
Average: 85.1
May 1980:+19.2%
Oct. 1990:+29.1%
Mar. 2003:+32.8%
Nov. 2008:+22.3%
Aug. 2011:+15.4%
Mar. 1984:+13.5%
Jan. 2000:-2.0%
Jan. 2004:+4.4%
May 1977:+1.2%
Aug. 1972:-6.2%
Oct. 2005:+14.2%
Jan. 2007:-4.2%
Sentiment cycle low and subsequent 12-month S&P 500 Index return
Sep. 2016: 91.2
Econ
omy
|GTM – U.S.
34
-5%
0%
5%
10%
15%
20%
'58 '63 '68 '73 '78 '83 '88 '93 '98 '03 '08 '13
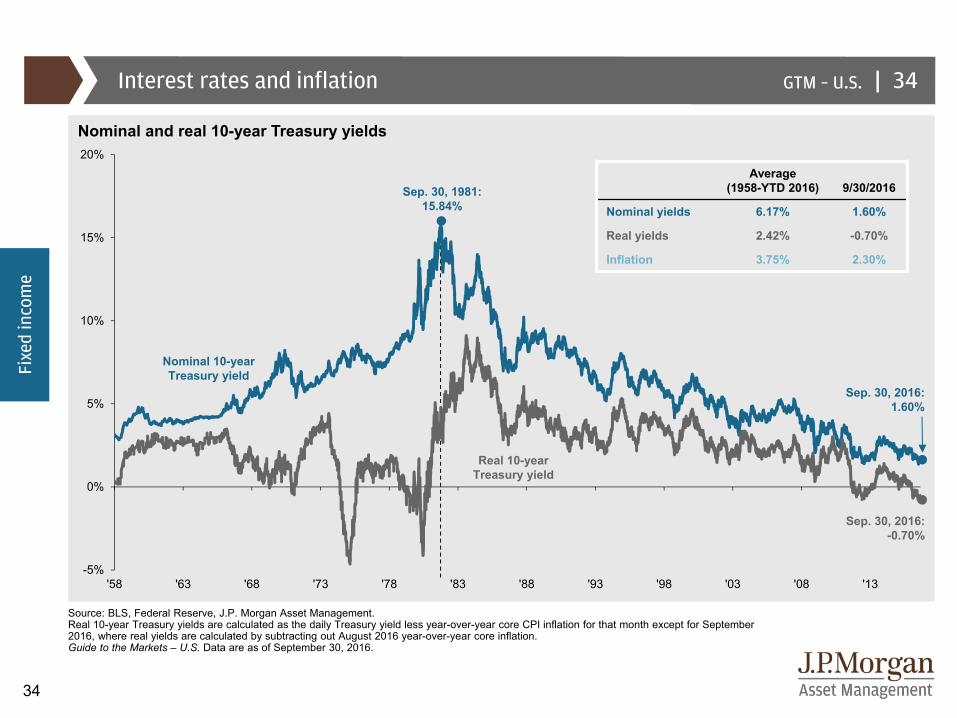
Sep. 30, 1981: 15.84%
Interest rates and inflation
Source: BLS, Federal Reserve, J.P. Morgan Asset Management.Real 10-year Treasury yields are calculated as the daily Treasury yield less year-over-year core CPI inflation for that month except for September 2016, where real yields are calculated by subtracting out August 2016 year-over-year core inflation. Guide to the Markets – U.S. Data are as of September 30, 2016.
34
Nominal and real 10-year Treasury yields
Sep. 30, 2016: -0.70%
Sep. 30, 2016: 1.60%
Nominal 10-year Treasury yield
Real 10-year Treasury yield
Fixe
d in
com
e
Average(1958-YTD 2016) 9/30/2016
Nominal yields 6.17% 1.60%
Real yields 2.42% -0.70%
Inflation 3.75% 2.30%
|GTM – U.S.
35
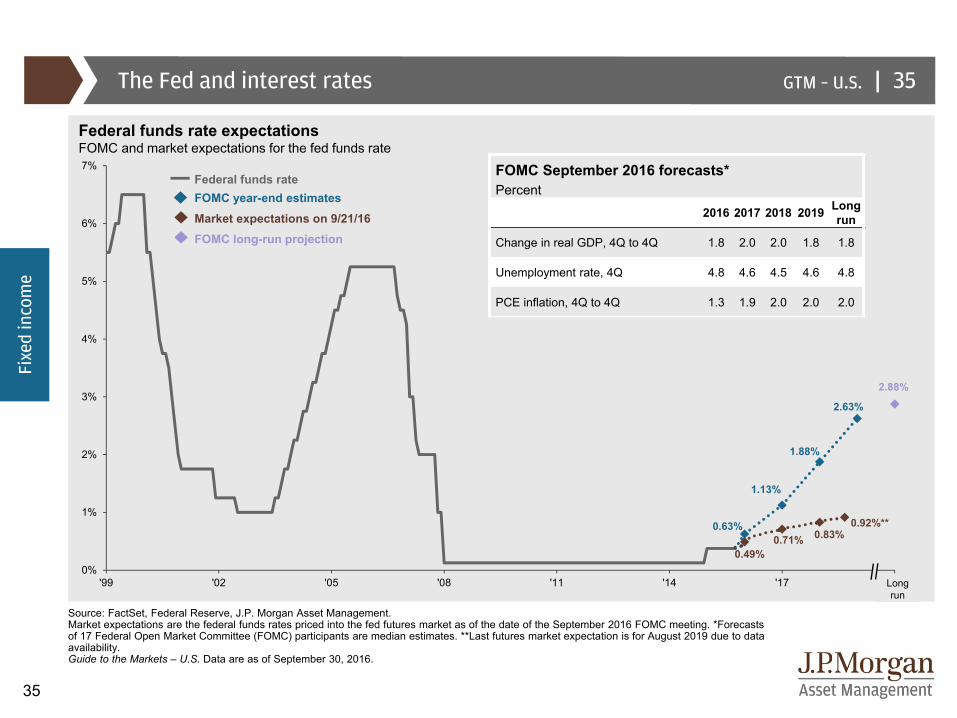
0.63%
1.13%
1.88%
2.63%
2.88%
0.49%0.71% 0.83%
0.92%**
0%
1%
2%
3%
4%
5%
6%
7%
'99 '02 '05 '08 '11 '14 '17 '20
FOMC September 2016 forecasts* Percent
2016 2017 2018 2019 Long run
Change in real GDP, 4Q to 4Q 1.8 2.0 2.0 1.8 1.8
Unemployment rate, 4Q 4.8 4.6 4.5 4.6 4.8
PCE inflation, 4Q to 4Q 1.3 1.9 2.0 2.0 2.0
The Fed and interest rates
Source: FactSet, Federal Reserve, J.P. Morgan Asset Management.Market expectations are the federal funds rates priced into the fed futures market as of the date of the September 2016 FOMC meeting. *Forecasts of 17 Federal Open Market Committee (FOMC) participants are median estimates. **Last futures market expectation is for August 2019 due to data availability. Guide to the Markets – U.S. Data are as of September 30, 2016.
35
Federal funds rate expectationsFOMC and market expectations for the fed funds rate
Federal funds rate
FOMC long-run projection
FOMC year-end estimatesMarket expectations on 9/21/16
Longrun
Fixe
d in
com
e
|GTM – U.S.
36
|
0.0%
0.5%
1.0%
1.5%
2.0%
2.5%
3.0%
3.5%
4.0%
4.5%
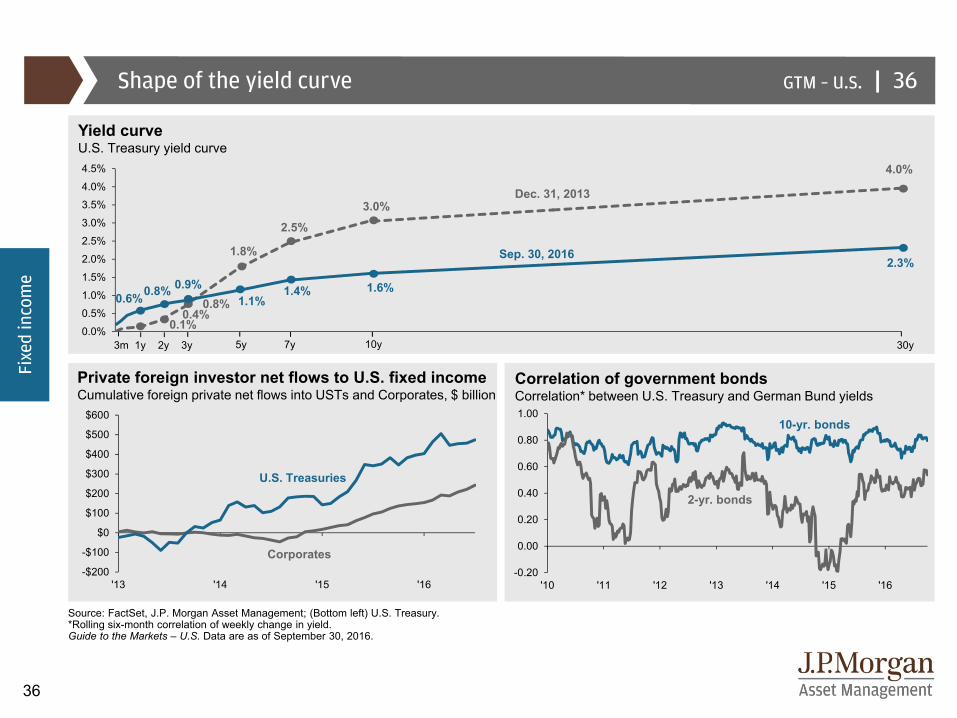
Private foreign investor net flows to U.S. fixed incomeCumulative foreign private net flows into USTs and Corporates, $ billion
Corporates
U.S. Treasuries
Source: FactSet, J.P. Morgan Asset Management; (Bottom left) U.S. Treasury.*Rolling six-month correlation of weekly change in yield. Guide to the Markets – U.S. Data are as of September 30, 2016.
Shape of the yield curve 36
Yield curveU.S. Treasury yield curve
Dec. 31, 2013
Sep. 30, 2016
3m 1y 2y 3y 7y 10y 30y5y
0.6%0.8% 0.9%1.1%
2.5%
3.0%
4.0%
2.3%
1.6%1.4%
1.8%
0.8%0.4%
0.1%
Fixe
d in
com
e
2-yr. bonds
10-yr. bonds
Correlation of government bondsCorrelation* between U.S. Treasury and German Bund yields
-0.20
0.00
0.20
0.40
0.60
0.80
1.00
'10 '11 '12 '13 '14 '15 '16-$200
-$100
$0
$100
$200
$300
$400
$500
$600
'13 '14 '15 '16
|GTM – U.S.
37
0%
10%
20%
30%
40%
50%
60%
70%
80%
Jan '14 Jun '14 Dec '14 May '15 Nov '15 Apr '16
0.34%0.26%
0.30%
0.49%0.69%
0.81%
-0.30%-0.37% -0.37%
-0.03%
-0.14% -0.15%
-0.5%
0.0%
0.5%
1.0%
Dec '16 Dec '17 Dec '18
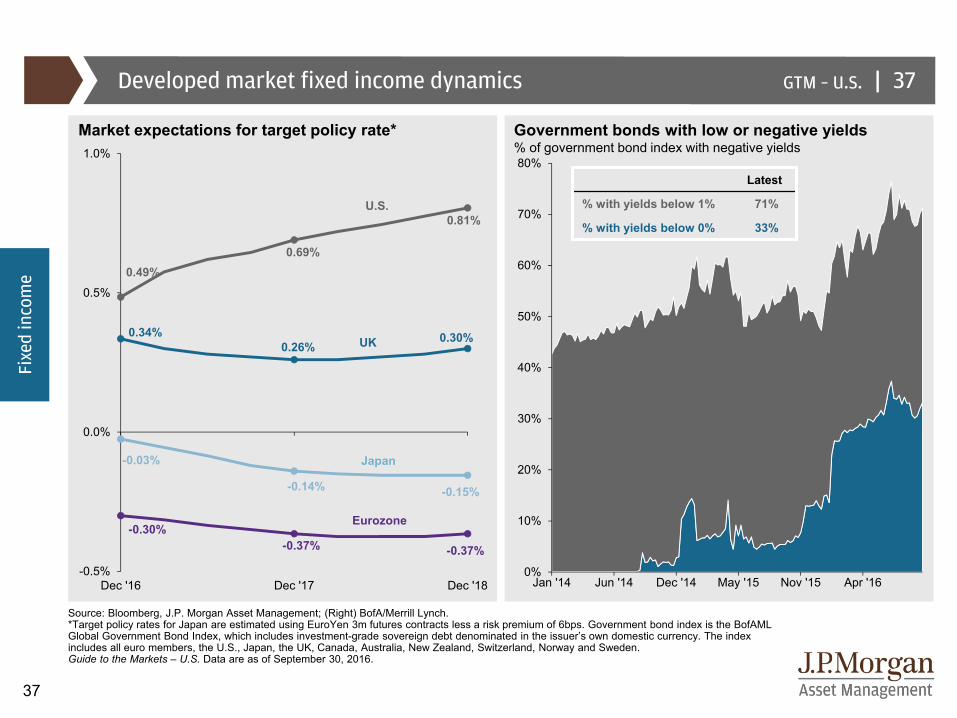
Source: Bloomberg, J.P. Morgan Asset Management; (Right) BofA/Merrill Lynch. *Target policy rates for Japan are estimated using EuroYen 3m futures contracts less a risk premium of 6bps. Government bond index is the BofAMLGlobal Government Bond Index, which includes investment-grade sovereign debt denominated in the issuer’s own domestic currency. The index includes all euro members, the U.S., Japan, the UK, Canada, Australia, New Zealand, Switzerland, Norway and Sweden.Guide to the Markets – U.S. Data are as of September 30, 2016.
Developed market fixed income dynamics 37
Market expectations for target policy rate*
UK
Eurozone
U.S.
Japan
Fixe
d in
com
e
Government bonds with low or negative yields% of government bond index with negative yields
Latest
% with yields below 1% 71%
% with yields below 0% 33%
|GTM – U.S.
38
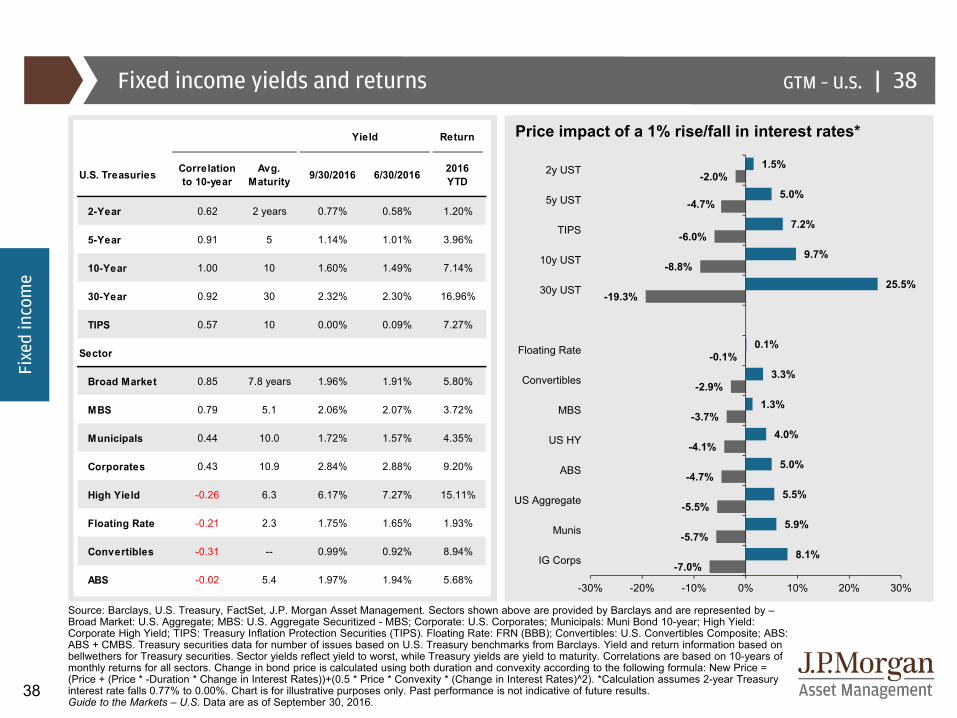
Source: Barclays, U.S. Treasury, FactSet, J.P. Morgan Asset Management. Sectors shown above are provided by Barclays and are represented by –Broad Market: U.S. Aggregate; MBS: U.S. Aggregate Securitized - MBS; Corporate: U.S. Corporates; Municipals: Muni Bond 10-year; High Yield: Corporate High Yield; TIPS: Treasury Inflation Protection Securities (TIPS). Floating Rate: FRN (BBB); Convertibles: U.S. Convertibles Composite; ABS: ABS + CMBS. Treasury securities data for number of issues based on U.S. Treasury benchmarks from Barclays. Yield and return information based on bellwethers for Treasury securities. Sector yields reflect yield to worst, while Treasury yields are yield to maturity. Correlations are based on 10-years of monthly returns for all sectors. Change in bond price is calculated using both duration and convexity according to the following formula: New Price = (Price + (Price * -Duration * Change in Interest Rates))+(0.5 * Price * Convexity * (Change in Interest Rates)^2). *Calculation assumes 2-year Treasury interest rate falls 0.77% to 0.00%. Chart is for illustrative purposes only. Past performance is not indicative of future results. Guide to the Markets – U.S. Data are as of September 30, 2016.
Fixed income yields and returns 38
Price impact of a 1% rise/fall in interest rates*
Fixe
d in
com
e
U.S. Treasuries Correlation to 10-year
Avg.Maturity 9/30/2016 6/30/2016 2016
YTD
2-Year 0.62 2 years 0.77% 0.58% 1.20%
5-Year 0.91 5 1.14% 1.01% 3.96%
10-Year 1.00 10 1.60% 1.49% 7.14%
30-Year 0.92 30 2.32% 2.30% 16.96%
TIPS 0.57 10 0.00% 0.09% 7.27%
Sector
Broad Market 0.85 7.8 years 1.96% 1.91% 5.80%
MBS 0.79 5.1 2.06% 2.07% 3.72%
Municipals 0.44 10.0 1.72% 1.57% 4.35%
Corporates 0.43 10.9 2.84% 2.88% 9.20%
High Yield -0.26 6.3 6.17% 7.27% 15.11%
Floating Rate -0.21 2.3 1.75% 1.65% 1.93%
Convertibles -0.31 -- 0.99% 0.92% 8.94%
ABS -0.02 5.4 1.97% 1.94% 5.68%
Yield Return
-7.0%
-5.7%
-5.5%
-4.7%
-4.1%
-3.7%
-2.9%
-0.1%
-19.3%
-8.8%
-6.0%
-4.7%
-2.0%
8.1%
5.9%
5.5%
5.0%
4.0%
1.3%
3.3%
0.1%
25.5%
9.7%
7.2%
5.0%
1.5%
-30% -20% -10% 0% 10% 20% 30%
IG Corps
Munis
US Aggregate
ABS
US HY
MBS
Convertibles
Floating Rate
30y UST
10y UST
TIPS
5y UST
2y UST
|GTM – U.S.
39
$0
$10
$20
$30
$40
$50
$60
$70
$80
$90
$100
'90 '92 '94 '96 '98 '00 '02 '04 '06 '08 '10 '12 '14 '16
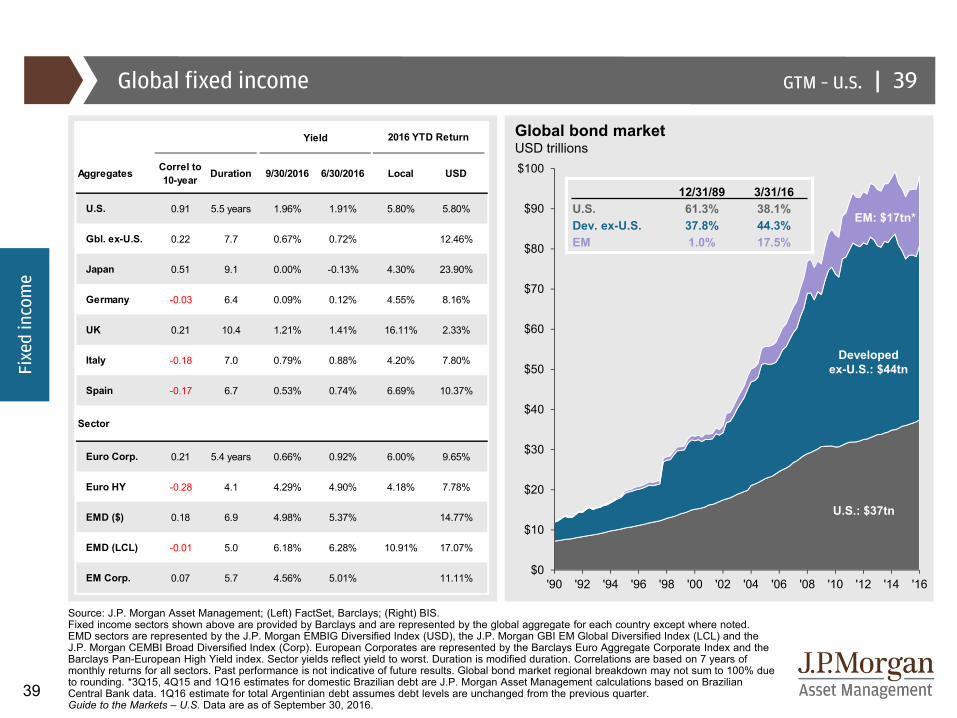
Source: J.P. Morgan Asset Management; (Left) FactSet, Barclays; (Right) BIS.Fixed income sectors shown above are provided by Barclays and are represented by the global aggregate for each country except where noted. EMD sectors are represented by the J.P. Morgan EMBIG Diversified Index (USD), the J.P. Morgan GBI EM Global Diversified Index (LCL) and the J.P. Morgan CEMBI Broad Diversified Index (Corp). European Corporates are represented by the Barclays Euro Aggregate Corporate Index and the Barclays Pan-European High Yield index. Sector yields reflect yield to worst. Duration is modified duration. Correlations are based on 7 years of monthly returns for all sectors. Past performance is not indicative of future results. Global bond market regional breakdown may not sum to 100% due to rounding. *3Q15, 4Q15 and 1Q16 estimates for domestic Brazilian debt are J.P. Morgan Asset Management calculations based on Brazilian Central Bank data. 1Q16 estimate for total Argentinian debt assumes debt levels are unchanged from the previous quarter.Guide to the Markets – U.S. Data are as of September 30, 2016.
Global fixed income 39
Global bond marketUSD trillions
U.S.: $37tn
Developed ex-U.S.: $44tn
EM: $17tn*
12/31/89 3/31/16U.S. 61.3% 38.1%Dev. ex-U.S. 37.8% 44.3%EM 1.0% 17.5%
Fixe
d in
com
e
Yield
Aggregates Correl to 10-year Duration 9/30/2016 6/30/2016 Local USD
U.S. 0.91 5.5 years 1.96% 1.91% 5.80% 5.80%
Gbl. ex-U.S. 0.22 7.7 0.67% 0.72% 12.46%
Japan 0.51 9.1 0.00% -0.13% 4.30% 23.90%
Germany -0.03 6.4 0.09% 0.12% 4.55% 8.16%
UK 0.21 10.4 1.21% 1.41% 16.11% 2.33%
Italy -0.18 7.0 0.79% 0.88% 4.20% 7.80%
Spain -0.17 6.7 0.53% 0.74% 6.69% 10.37%
Sector
Euro Corp. 0.21 5.4 years 0.66% 0.92% 6.00% 9.65%
Euro HY -0.28 4.1 4.29% 4.90% 4.18% 7.78%
EMD ($) 0.18 6.9 4.98% 5.37% 14.77%
EMD (LCL) -0.01 5.0 6.18% 6.28% 10.91% 17.07%
EM Corp. 0.07 5.7 4.56% 5.01% 11.11%
2016 YTD Return
|GTM – U.S.
40
0%
20%
40%
60%
80%
100%
0.75
1.00
1.25
1.50
1.75
2.00
'90 '92 '94 '96 '98 '00 '02 '04 '06 '08 '10 '12 '14 '163%
4%
5%
6%
7%
8%
9%
10%
11%
'90 '92 '94 '96 '98 '00 '02 '04 '06 '08 '10 '12 '14 '16
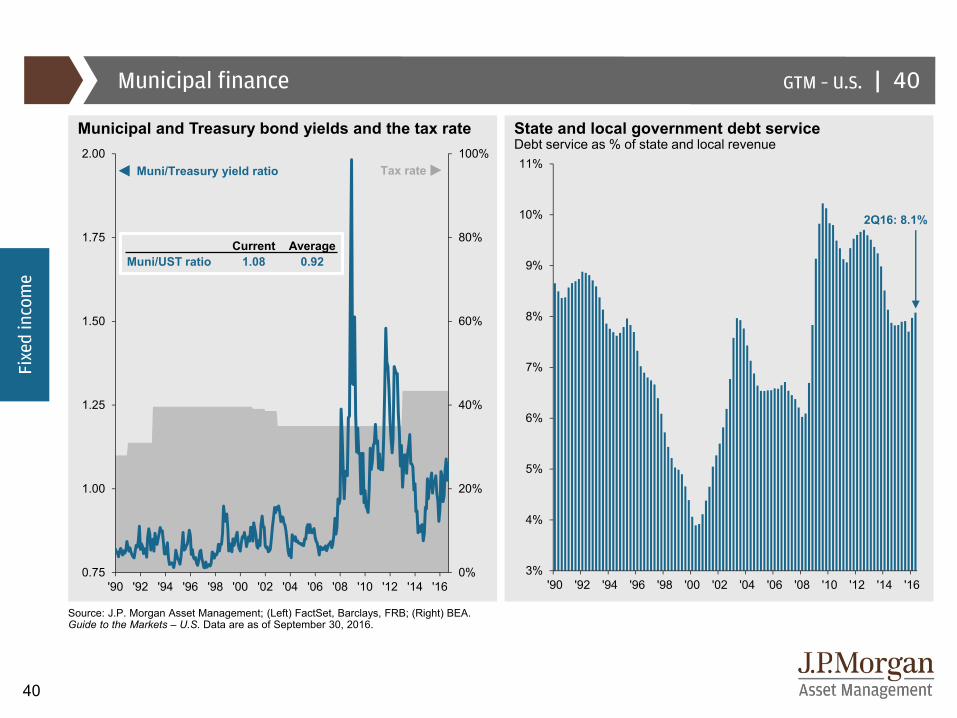
Municipal and Treasury bond yields and the tax rate
Tax rate
Source: J.P. Morgan Asset Management; (Left) FactSet, Barclays, FRB; (Right) BEA.Guide to the Markets – U.S. Data are as of September 30, 2016.
Municipal finance
State and local government debt serviceDebt service as % of state and local revenue
40
Fixe
d in
com
e
Current AverageMuni/UST ratio 1.08 0.92
2Q16: 8.1%
Muni/Treasury yield ratio
|GTM – U.S.
41
-0.8
-0.6
-0.4
-0.2
0.0
0.2
0.4
0.6
0.8
1.0
'05 '06 '07 '08 '09 '10 '11 '12 '13 '14 '15 '16
0%
1%
2%
3%
4%
5%
6%
'00 '02 '04 '06 '08 '10 '12 '14 '16
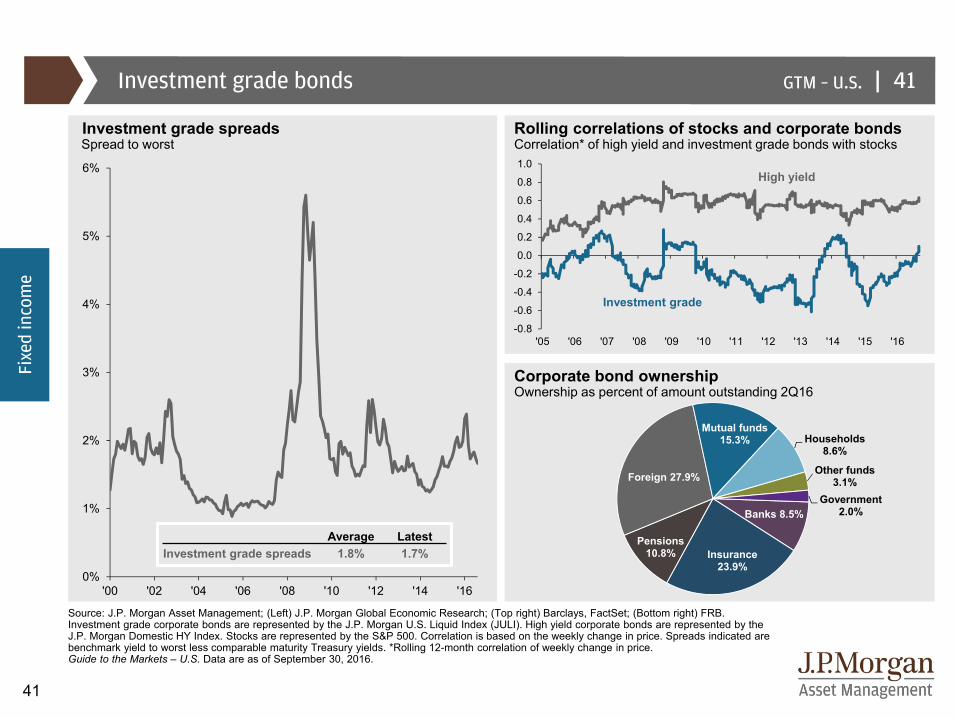
Rolling correlations of stocks and corporate bondsCorrelation* of high yield and investment grade bonds with stocks
Source: J.P. Morgan Asset Management; (Left) J.P. Morgan Global Economic Research; (Top right) Barclays, FactSet; (Bottom right) FRB.Investment grade corporate bonds are represented by the J.P. Morgan U.S. Liquid Index (JULI). High yield corporate bonds are represented by the J.P. Morgan Domestic HY Index. Stocks are represented by the S&P 500. Correlation is based on the weekly change in price. Spreads indicated are benchmark yield to worst less comparable maturity Treasury yields. *Rolling 12-month correlation of weekly change in price. Guide to the Markets – U.S. Data are as of September 30, 2016.
Investment grade bonds
Investment grade spreadsSpread to worst
Corporate bond ownershipOwnership as percent of amount outstanding 2Q16
41
Fixe
d in
com
e
High yield
Investment grade
Average LatestInvestment grade spreads 1.8% 1.7%
Banks 8.5%
Insurance 23.9%
Pensions 10.8%
Foreign 27.9%
Mutual funds 15.3% Households
8.6%
Other funds 3.1%
Government 2.0%
|GTM – U.S.
42
0¢
10¢
20¢
30¢
40¢
50¢
60¢
70¢
'88 '90 '92 '94 '96 '98 '00 '02 '04 '06 '08 '10 '12 '14 '16*
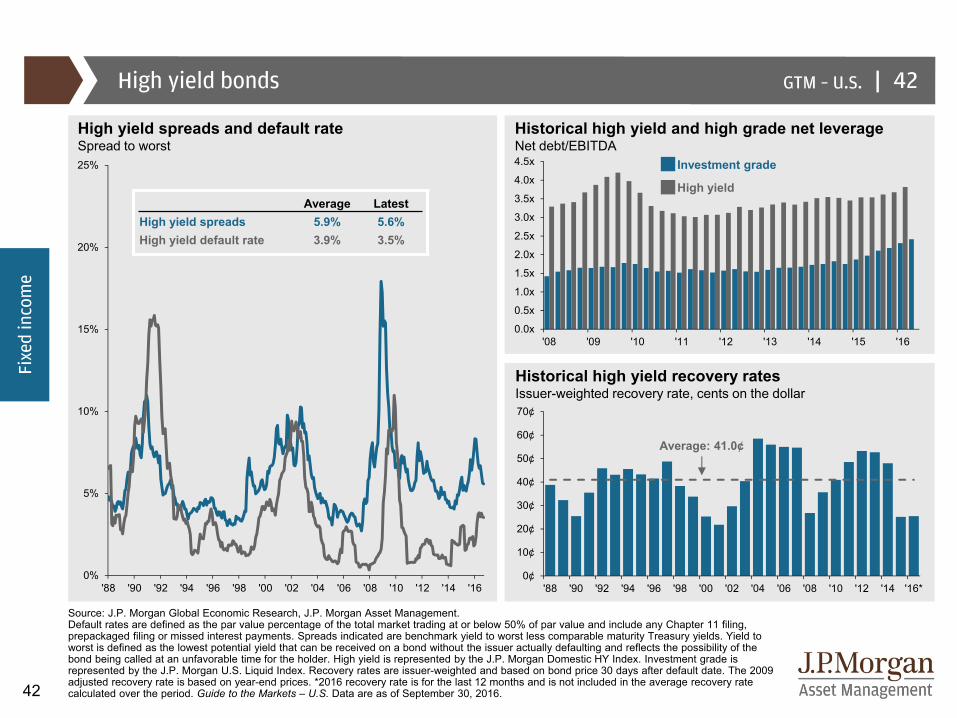
Source: J.P. Morgan Global Economic Research, J.P. Morgan Asset Management.Default rates are defined as the par value percentage of the total market trading at or below 50% of par value and include any Chapter 11 filing, prepackaged filing or missed interest payments. Spreads indicated are benchmark yield to worst less comparable maturity Treasury yields. Yield to worst is defined as the lowest potential yield that can be received on a bond without the issuer actually defaulting and reflects the possibility of the bond being called at an unfavorable time for the holder. High yield is represented by the J.P. Morgan Domestic HY Index. Investment grade is represented by the J.P. Morgan U.S. Liquid Index. Recovery rates are issuer-weighted and based on bond price 30 days after default date. The 2009 adjusted recovery rate is based on year-end prices. *2016 recovery rate is for the last 12 months and is not included in the average recovery rate calculated over the period. Guide to the Markets – U.S. Data are as of September 30, 2016.
High yield bonds
High yield spreads and default rateSpread to worst
42
Average LatestHigh yield spreads 5.9% 5.6%High yield default rate 3.9% 3.5%
Fixe
d in
com
e
Historical high yield recovery ratesIssuer-weighted recovery rate, cents on the dollar
Average: 41.0¢
Historical high yield and high grade net leverageNet debt/EBITDA
0.0x
0.5x
1.0x
1.5x
2.0x
2.5x
3.0x
3.5x
4.0x
4.5x
'08 '09 '10 '11 '12 '13 '14 '15 '16
High yield
Investment grade
0%
5%
10%
15%
20%
25%
'88 '90 '92 '94 '96 '98 '00 '02 '04 '06 '08 '10 '12 '14 '16
|GTM – U.S.
43
0%
2%
4%
6%
8%
10%
12%
'06 '07 '08 '09 '10 '11 '12 '13 '14 '15
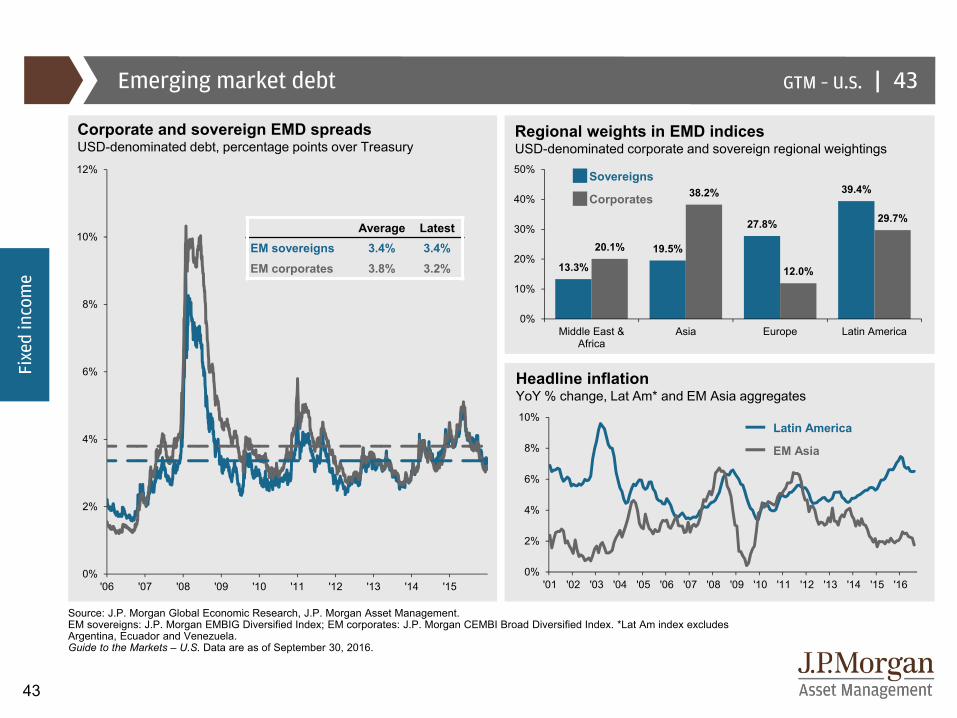
Source: J.P. Morgan Global Economic Research, J.P. Morgan Asset Management.EM sovereigns: J.P. Morgan EMBIG Diversified Index; EM corporates: J.P. Morgan CEMBI Broad Diversified Index. *Lat Am index excludes Argentina, Ecuador and Venezuela.Guide to the Markets – U.S. Data are as of September 30, 2016.
Emerging market debt 43
Corporate and sovereign EMD spreads USD-denominated debt, percentage points over Treasury
Average LatestEM sovereigns 3.4% 3.4%EM corporates 3.8% 3.2%
Fixe
d in
com
e
Regional weights in EMD indicesUSD-denominated corporate and sovereign regional weightings
Headline inflationYoY % change, Lat Am* and EM Asia aggregates
Corporates
Sovereigns
EM Asia
Latin America
0%
2%
4%
6%
8%
10%
'01 '02 '03 '04 '05 '06 '07 '08 '09 '10 '11 '12 '13 '14 '15 '16
13.3%
19.5%
27.8%
39.4%
20.1%
38.2%
12.0%
29.7%
0%
10%
20%
30%
40%
50%
Middle East &Africa
Asia Europe Latin America
|GTM – U.S.
44
2006 2007 2008 2009 2010 2011 2012 2013 2014 2015 YTD Cum. Ann.
EMD LCL. EMD LCL. Treas. High Yield EMD LCL. TIPS EMD USD High Yield Muni Muni EMD LCL. EMD USD EMD USD
15.2% 18.1% 13.7% 58.2% 15.7% 13.6% 17.4% 7.4% 8.7% 3.8% 17.1% 114.0% 7.9%
High Yield TIPS MBS EMD USD High Yield Muni EMD LCL. MBS Corp. MBS High Yield High Yield High Yield
11.8% 11.6% 8.3% 29.8% 15.1% 12.3% 16.8% -1.4% 7.5% 1.5% 15.1% 95.9% 7.0%
EMD USD Treas. Barclays Agg EMD LCL. EMD USD Treas. High Yield Corp. EMD USD EMD USD EMD USD Corp. Corp.
9.9% 9.0% 5.2% 22.0% 12.2% 9.8% 15.8% -1.5% 7.4% 1.2% 14.8% 67.4% 5.3%Asset Alloc.
Barclays Agg Muni Corp. Corp. Corp. Corp. Asset
Alloc. MBS Treas. Corp. Muni Muni
5.7% 7.0% 1.5% 18.7% 9.0% 8.1% 9.8% -1.9% 6.1% 0.8% 9.2% 66.0% 5.2%
MBS MBS Asset Alloc.
Asset Alloc.
Asset Alloc.
Asset Alloc.
Asset Alloc.
Barclays Agg
Barclays Agg
Barclays Agg
Asset Alloc.
Asset Alloc.
Asset Alloc.
5.2% 6.9% 0.1% 14.7% 7.9% 8.1% 7.4% -2.0% 6.0% 0.5% 7.7% 65.7% 5.2%
Muni Asset Alloc. TIPS TIPS Barclays
AggBarclays
Agg TIPS Muni Asset Alloc.
Asset Alloc. TIPS EMD LCL. EMD LCL.
4.7% 6.7% -2.4% 11.4% 6.5% 7.8% 7.0% -2.2% 5.5% -0.3% 7.3% 62.0% 4.9%Barclays
Agg EMD USD Corp. Muni TIPS EMD USD Muni Treas. Treas. Corp. Barclays Agg MBS MBS
4.3% 6.2% -4.9% 9.9% 6.3% 7.3% 5.7% -2.7% 5.1% -0.7% 5.8% 57.3% 4.6%
Corp. Corp. EMD LCL. Barclays Agg Treas. MBS Barclays
Agg EMD USD TIPS TIPS Treas. Barclays Agg
Barclays Agg
4.3% 4.6% -5.2% 5.9% 5.9% 6.2% 4.2% -5.3% 3.6% -1.4% 5.1% 55.5% 4.5%
Treas. Muni EMD USD MBS MBS High Yield MBS TIPS High Yield High Yield Muni Treas. Treas.
3.1% 4.3% -12.0% 5.9% 5.4% 5.0% 2.6% -8.6% 2.5% -4.5% 4.4% 50.6% 4.2%
TIPS High Yield High Yield Treas. Muni EMD LCL. Treas. EMD LCL. EMD LCL. EMD LCL. MBS TIPS TIPS
0.4% 1.9% -26.2% -3.6% 4.0% -1.8% 2.0% -9.0% -5.7% -14.9% 3.7% 47.0% 3.9%
2006 - 2015
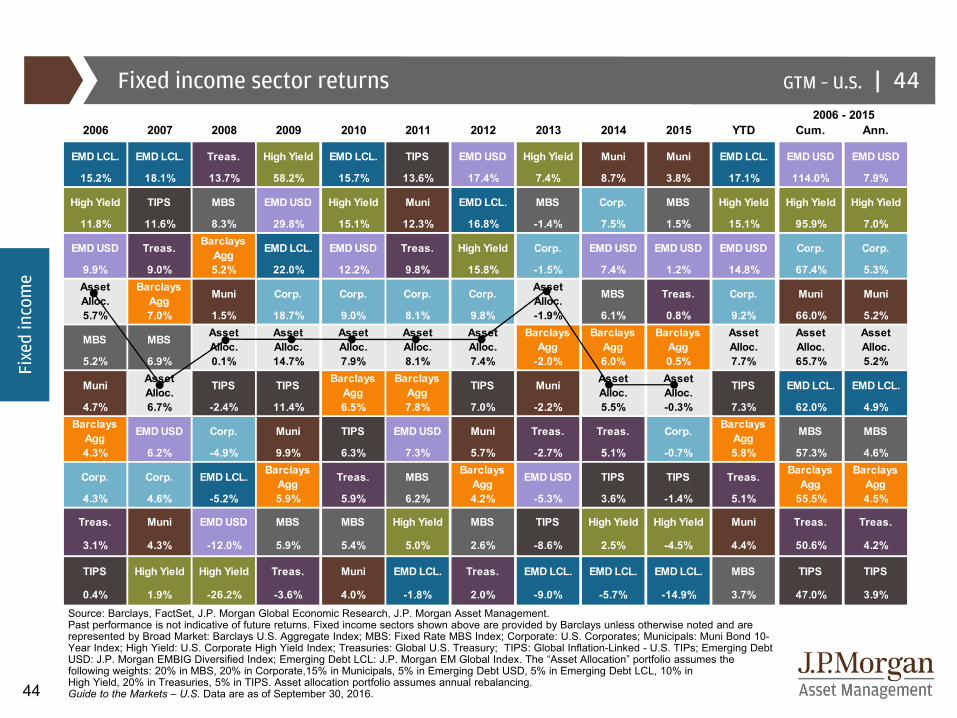
Fixed income sector returns
Source: Barclays, FactSet, J.P. Morgan Global Economic Research, J.P. Morgan Asset Management. Past performance is not indicative of future returns. Fixed income sectors shown above are provided by Barclays unless otherwise noted and are represented by Broad Market: Barclays U.S. Aggregate Index; MBS: Fixed Rate MBS Index; Corporate: U.S. Corporates; Municipals: Muni Bond 10-Year Index; High Yield: U.S. Corporate High Yield Index; Treasuries: Global U.S. Treasury; TIPS: Global Inflation-Linked - U.S. TIPs; Emerging Debt USD: J.P. Morgan EMBIG Diversified Index; Emerging Debt LCL: J.P. Morgan EM Global Index. The “Asset Allocation” portfolio assumes the following weights: 20% in MBS, 20% in Corporate,15% in Municipals, 5% in Emerging Debt USD, 5% in Emerging Debt LCL, 10% in High Yield, 20% in Treasuries, 5% in TIPS. Asset allocation portfolio assumes annual rebalancing.Guide to the Markets – U.S. Data are as of September 30, 2016.
44
Fixe
d in
com
e
|GTM – U.S.
45
0.0
0.1
0.2
0.3
0.4
0.5
0.6
0.7
0.8
0.9
'96 '98 '00 '02 '04 '06 '08 '10 '12 '14
Pacific 4%
Source: FactSet, MSCI, Standard & Poor’s, J.P. Morgan Asset Management.All return values are MSCI Gross Index (official) data. Chart is for illustrative purposes only. Past performance is not indicative of future results. Please see disclosure page for index definitions. Countries included in global correlations include Argentina, South Africa, Japan, UK, Canada, France, Germany, Italy, Australia, Austria, Brazil, China, Colombia, Denmark, Finland, Hong Kong, India, Malaysia, Mexico, Netherlands, New Zealand, Peru, Philippines, Portugal, Korea, Spain, Taiwan, Thailand, Turkey, United States. Guide to the Markets – U.S. Data are as of September 30, 2016.
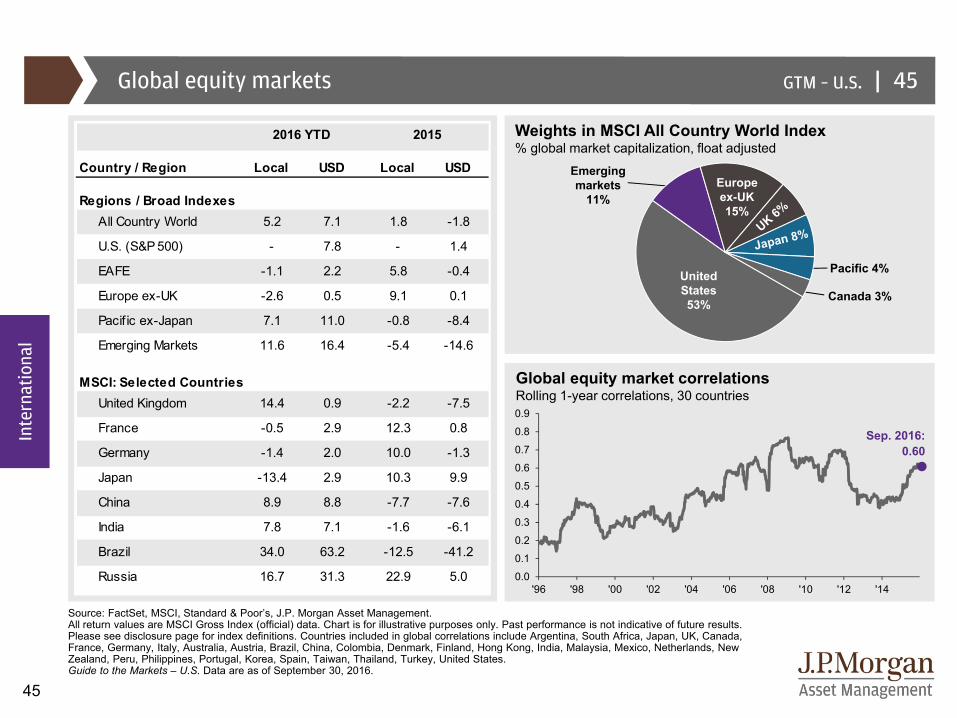
Global equity markets 45
Weights in MSCI All Country World Index% global market capitalization, float adjusted
United States53%
Europe ex-UK15%
Emergingmarkets
11%
Canada 3%
Global equity market correlationsRolling 1-year correlations, 30 countries
Sep. 2016:0.60
Inte
rnat
iona
l
Country / Region
Regions / Broad IndexesAll Country World 5.2 7.1 1.8 -1.8
U.S. (S&P 500) - 7.8 - 1.4
EAFE -1.1 2.2 5.8 -0.4
Europe ex-UK -2.6 0.5 9.1 0.1
Pacif ic ex-Japan 7.1 11.0 -0.8 -8.4
Emerging Markets 11.6 16.4 -5.4 -14.6
MSCI: Selected CountriesUnited Kingdom 14.4 0.9 -2.2 -7.5
France -0.5 2.9 12.3 0.8
Germany -1.4 2.0 10.0 -1.3
Japan -13.4 2.9 10.3 9.9
China 8.9 8.8 -7.7 -7.6
India 7.8 7.1 -1.6 -6.1
Brazil 34.0 63.2 -12.5 -41.2
Russia 16.7 31.3 22.9 5.0
2016 YTD 2015
Local USD Local USD
|GTM – U.S.
46
0.0x
0.4x
0.8x
1.2x
1.6x
2.0x
2.4x
2.8x
3.2x
3.6x
4.0x
4.4x
4.8x
5.2x
0x
5x
10x
15x
20x
25x
30x
35x
40x
U.S. DM Europe Japan EM
Pric
e-to
-boo
k
Pric
e-to
-ear
ning
s
40
60
80
100
120
140
160
180
200
220
'09 '10 '11 '12 '13 '14 '15 '16
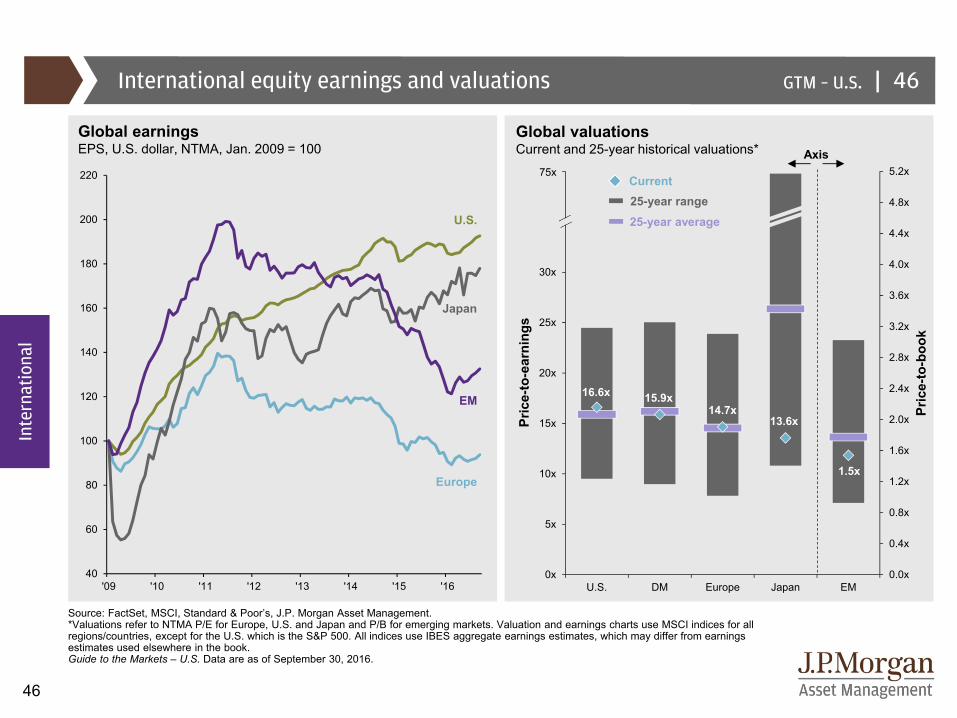
Source: FactSet, MSCI, Standard & Poor’s, J.P. Morgan Asset Management. *Valuations refer to NTMA P/E for Europe, U.S. and Japan and P/B for emerging markets. Valuation and earnings charts use MSCI indices for all regions/countries, except for the U.S. which is the S&P 500. All indices use IBES aggregate earnings estimates, which may differ from earnings estimates used elsewhere in the book.Guide to the Markets – U.S. Data are as of September 30, 2016.
International equity earnings and valuations
Global valuations Current and 25-year historical valuations*
Global earningsEPS, U.S. dollar, NTMA, Jan. 2009 = 100
Inte
rnat
iona
l
Japan
Europe
U.S.
EM
Axis75x
16.6x
25-year range25-year average
15.9x14.7x
13.6x
1.5x
46
Current
|GTM – U.S.
47
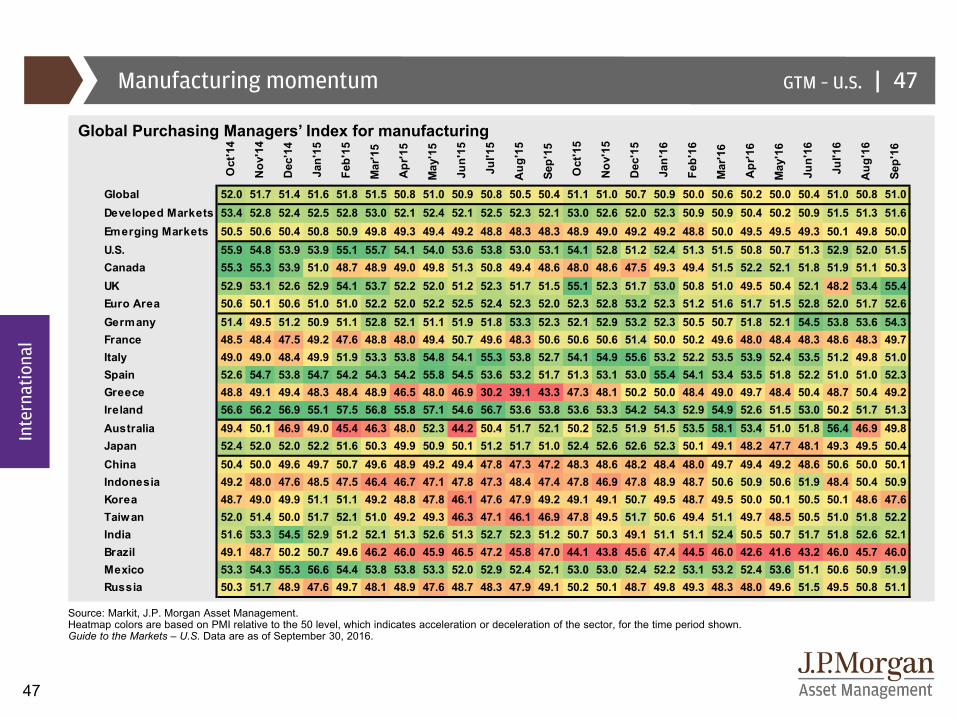
Manufacturing momentum
Source: Markit, J.P. Morgan Asset Management.Heatmap colors are based on PMI relative to the 50 level, which indicates acceleration or deceleration of the sector, for the time period shown. Guide to the Markets – U.S. Data are as of September 30, 2016.
47
Global Purchasing Managers’ Index for manufacturing
Inte
rnat
iona
l
Oct
'14
Nov
'14
Dec
'14
Jan'
15
Feb'
15
Mar
'15
Apr
'15
May
'15
Jun'
15
Jul'1
5
Aug
'15
Sep'
15
Oct
'15
Nov
'15
Dec
'15
Jan'
16
Feb'
16
Mar
'16
Apr
'16
May
'16
Jun'
16
Jul'1
6
Aug
'16
Sep'
16
Global 52.0 51.7 51.4 51.6 51.8 51.5 50.8 51.0 50.9 50.8 50.5 50.4 51.1 51.0 50.7 50.9 50.0 50.6 50.2 50.0 50.4 51.0 50.8 51.0Developed Markets 53.4 52.8 52.4 52.5 52.8 53.0 52.1 52.4 52.1 52.5 52.3 52.1 53.0 52.6 52.0 52.3 50.9 50.9 50.4 50.2 50.9 51.5 51.3 51.6Emerging Markets 50.5 50.6 50.4 50.8 50.9 49.8 49.3 49.4 49.2 48.8 48.3 48.3 48.9 49.0 49.2 49.2 48.8 50.0 49.5 49.5 49.3 50.1 49.8 50.0U.S. 55.9 54.8 53.9 53.9 55.1 55.7 54.1 54.0 53.6 53.8 53.0 53.1 54.1 52.8 51.2 52.4 51.3 51.5 50.8 50.7 51.3 52.9 52.0 51.5Canada 55.3 55.3 53.9 51.0 48.7 48.9 49.0 49.8 51.3 50.8 49.4 48.6 48.0 48.6 47.5 49.3 49.4 51.5 52.2 52.1 51.8 51.9 51.1 50.3UK 52.9 53.1 52.6 52.9 54.1 53.7 52.2 52.0 51.2 52.3 51.7 51.5 55.1 52.3 51.7 53.0 50.8 51.0 49.5 50.4 52.1 48.2 53.4 55.4Euro Area 50.6 50.1 50.6 51.0 51.0 52.2 52.0 52.2 52.5 52.4 52.3 52.0 52.3 52.8 53.2 52.3 51.2 51.6 51.7 51.5 52.8 52.0 51.7 52.6Germany 51.4 49.5 51.2 50.9 51.1 52.8 52.1 51.1 51.9 51.8 53.3 52.3 52.1 52.9 53.2 52.3 50.5 50.7 51.8 52.1 54.5 53.8 53.6 54.3France 48.5 48.4 47.5 49.2 47.6 48.8 48.0 49.4 50.7 49.6 48.3 50.6 50.6 50.6 51.4 50.0 50.2 49.6 48.0 48.4 48.3 48.6 48.3 49.7Italy 49.0 49.0 48.4 49.9 51.9 53.3 53.8 54.8 54.1 55.3 53.8 52.7 54.1 54.9 55.6 53.2 52.2 53.5 53.9 52.4 53.5 51.2 49.8 51.0Spain 52.6 54.7 53.8 54.7 54.2 54.3 54.2 55.8 54.5 53.6 53.2 51.7 51.3 53.1 53.0 55.4 54.1 53.4 53.5 51.8 52.2 51.0 51.0 52.3Greece 48.8 49.1 49.4 48.3 48.4 48.9 46.5 48.0 46.9 30.2 39.1 43.3 47.3 48.1 50.2 50.0 48.4 49.0 49.7 48.4 50.4 48.7 50.4 49.2Ireland 56.6 56.2 56.9 55.1 57.5 56.8 55.8 57.1 54.6 56.7 53.6 53.8 53.6 53.3 54.2 54.3 52.9 54.9 52.6 51.5 53.0 50.2 51.7 51.3Australia 49.4 50.1 46.9 49.0 45.4 46.3 48.0 52.3 44.2 50.4 51.7 52.1 50.2 52.5 51.9 51.5 53.5 58.1 53.4 51.0 51.8 56.4 46.9 49.8Japan 52.4 52.0 52.0 52.2 51.6 50.3 49.9 50.9 50.1 51.2 51.7 51.0 52.4 52.6 52.6 52.3 50.1 49.1 48.2 47.7 48.1 49.3 49.5 50.4China 50.4 50.0 49.6 49.7 50.7 49.6 48.9 49.2 49.4 47.8 47.3 47.2 48.3 48.6 48.2 48.4 48.0 49.7 49.4 49.2 48.6 50.6 50.0 50.1Indonesia 49.2 48.0 47.6 48.5 47.5 46.4 46.7 47.1 47.8 47.3 48.4 47.4 47.8 46.9 47.8 48.9 48.7 50.6 50.9 50.6 51.9 48.4 50.4 50.9Korea 48.7 49.0 49.9 51.1 51.1 49.2 48.8 47.8 46.1 47.6 47.9 49.2 49.1 49.1 50.7 49.5 48.7 49.5 50.0 50.1 50.5 50.1 48.6 47.6Taiwan 52.0 51.4 50.0 51.7 52.1 51.0 49.2 49.3 46.3 47.1 46.1 46.9 47.8 49.5 51.7 50.6 49.4 51.1 49.7 48.5 50.5 51.0 51.8 52.2India 51.6 53.3 54.5 52.9 51.2 52.1 51.3 52.6 51.3 52.7 52.3 51.2 50.7 50.3 49.1 51.1 51.1 52.4 50.5 50.7 51.7 51.8 52.6 52.1Brazil 49.1 48.7 50.2 50.7 49.6 46.2 46.0 45.9 46.5 47.2 45.8 47.0 44.1 43.8 45.6 47.4 44.5 46.0 42.6 41.6 43.2 46.0 45.7 46.0Mexico 53.3 54.3 55.3 56.6 54.4 53.8 53.8 53.3 52.0 52.9 52.4 52.1 53.0 53.0 52.4 52.2 53.1 53.2 52.4 53.6 51.1 50.6 50.9 51.9Russia 50.3 51.7 48.9 47.6 49.7 48.1 48.9 47.6 48.7 48.3 47.9 49.1 50.2 50.1 48.7 49.8 49.3 48.3 48.0 49.6 51.5 49.5 50.8 51.1
|GTM – U.S.
48
|
20
25
30
35
40
45
50
55
60
65
-12%
-10%
-8%
-6%
-4%
-2%
0%
2%
4%
6%
'06 '07 '08 '09 '10 '11 '12 '13 '14 '15 '16
6%
7%
8%
9%
10%
11%
12%
13%
'06 '07 '08 '09 '10 '11 '12 '13 '14 '15 '16
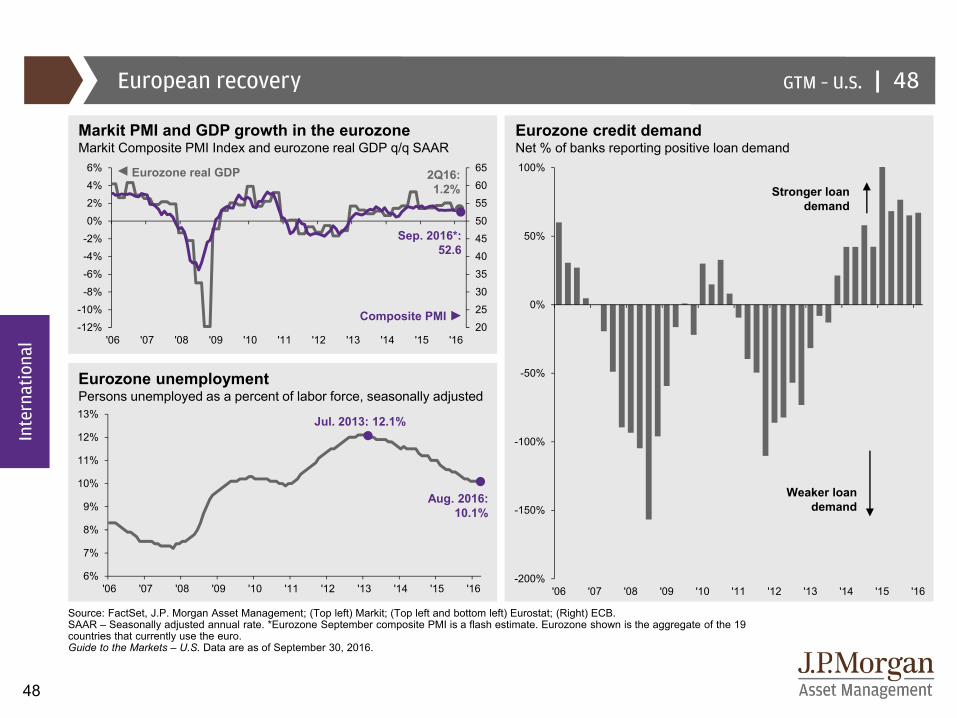
Source: FactSet, J.P. Morgan Asset Management; (Top left) Markit; (Top left and bottom left) Eurostat; (Right) ECB.SAAR – Seasonally adjusted annual rate. *Eurozone September composite PMI is a flash estimate. Eurozone shown is the aggregate of the 19 countries that currently use the euro. Guide to the Markets – U.S. Data are as of September 30, 2016.
European recovery 48
Markit PMI and GDP growth in the eurozoneMarkit Composite PMI Index and eurozone real GDP q/q SAAR
Eurozone credit demandNet % of banks reporting positive loan demand
Stronger loan demand
Weaker loan demand
2Q16: 1.2%
Sep. 2016*: 52.6
Eurozone real GDP
Composite PMI
Eurozone unemploymentPersons unemployed as a percent of labor force, seasonally adjusted
Aug. 2016: 10.1%
Jul. 2013: 12.1%
Inte
rnat
iona
l
-200%
-150%
-100%
-50%
0%
50%
100%
'06 '07 '08 '09 '10 '11 '12 '13 '14 '15 '16
|GTM – U.S.
49
Jul. 2016: 0.3%
'96 '98 '00 '02 '04 '06 '08 '10 '12 '14 '16-10%
-8%
-6%
-4%
-2%
0%
2%
4%
6%
8%
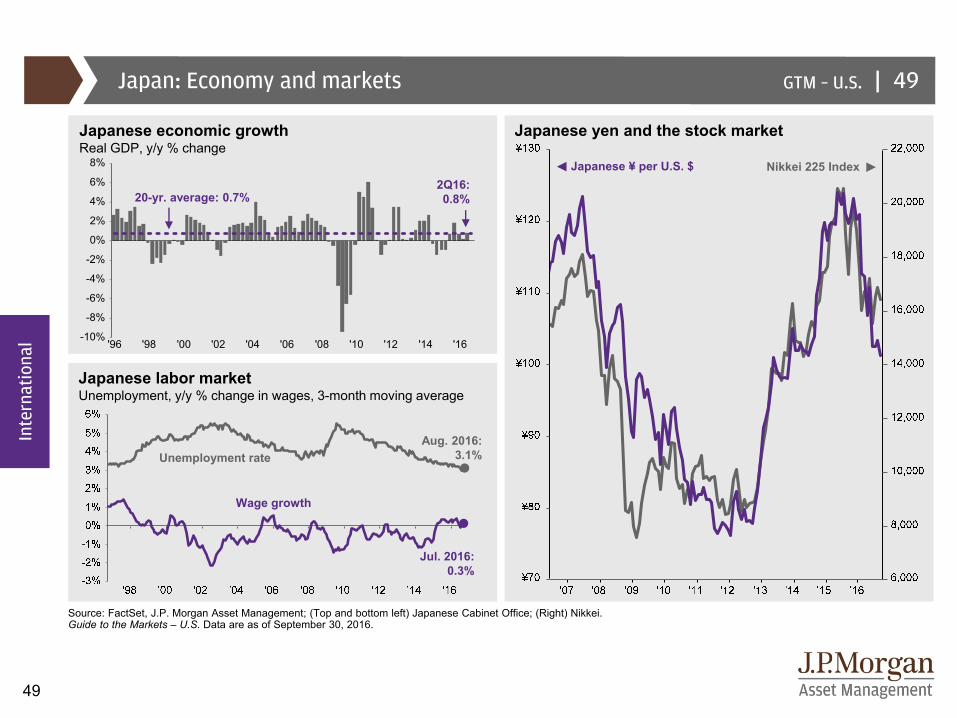
Source: FactSet, J.P. Morgan Asset Management; (Top and bottom left) Japanese Cabinet Office; (Right) Nikkei.Guide to the Markets – U.S. Data are as of September 30, 2016.
Japan: Economy and markets 49
Japanese ¥ per U.S. $ Nikkei 225 Index
Japanese yen and the stock marketJapanese economic growthReal GDP, y/y % change
Wage growth
Unemployment rate
Japanese labor marketUnemployment, y/y % change in wages, 3-month moving average
Aug. 2016: 3.1%
2Q16: 0.8%
Inte
rnat
iona
l
20-yr. average: 0.7%
|GTM – U.S.
50
$0.00
$0.50
$1.00
$1.50
$2.00
$2.50
$3.00
$3.50
$4.00
'00 '02 '04 '06 '08 '10 '12 '14 '16
0.3%
-3.9%
-1.2%-0.8%
0.1%
-0.2%
0.2%
-0.2% -0.7%
4.3% 5.2% 4.9%6.0%
4.3%3.7% 3.7% 4.2%
4.9%
5.0%
7.9%6.9% 4.2%
3.2% 4.2% 3.4% 2.9%2.5%
-4%
0%
4%
8%
12%
16%
2008 2009 2010 2011 2012 2013 2014 2015 2016
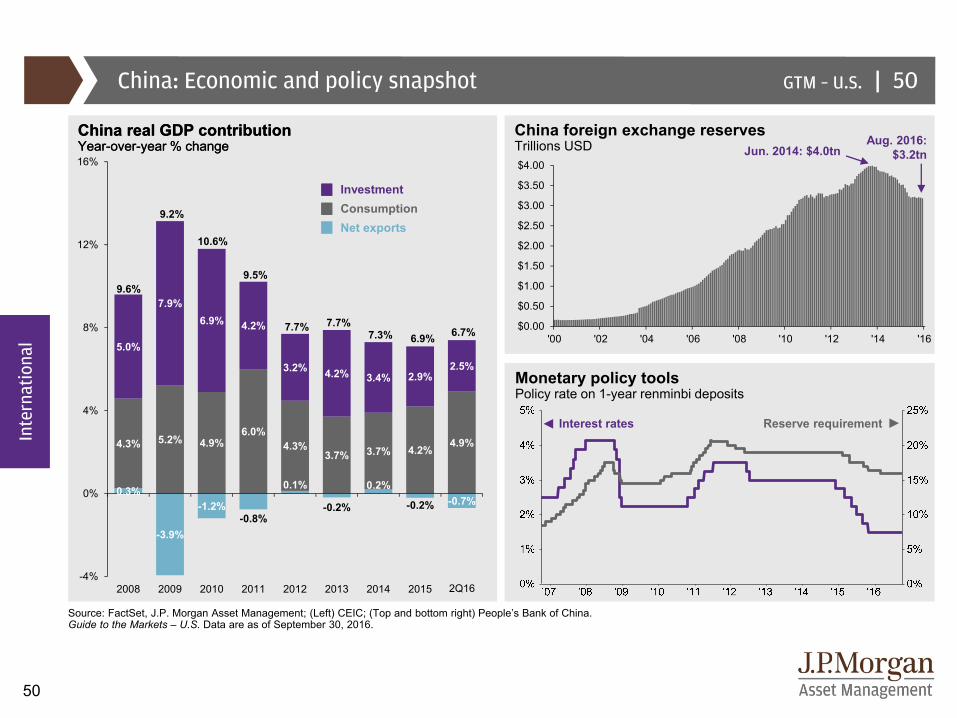
Source: FactSet, J.P. Morgan Asset Management; (Left) CEIC; (Top and bottom right) People’s Bank of China. Guide to the Markets – U.S. Data are as of September 30, 2016.
China: Economic and policy snapshot
China real GDP contributionYear-over-year % change
Monetary policy toolsPolicy rate on 1-year renminbi deposits
China foreign exchange reservesTrillions USD
50
InvestmentConsumptionNet exports
Reserve requirementInterest rates
9.6%
9.2%
10.6%
9.5%
7.7% 7.7%7.3% 6.9%
Inte
rnat
iona
l
Aug. 2016:$3.2tnJun. 2014: $4.0tn
1Q16
6.7%
China real GDP contributionYear-over-year % change
Inte
rnat
iona
l
2Q16
|GTM – U.S.
51
50%
80%
110%
140%
170%
200%
230%
'00 '02 '04 '06 '08 '10 '12 '14 '16
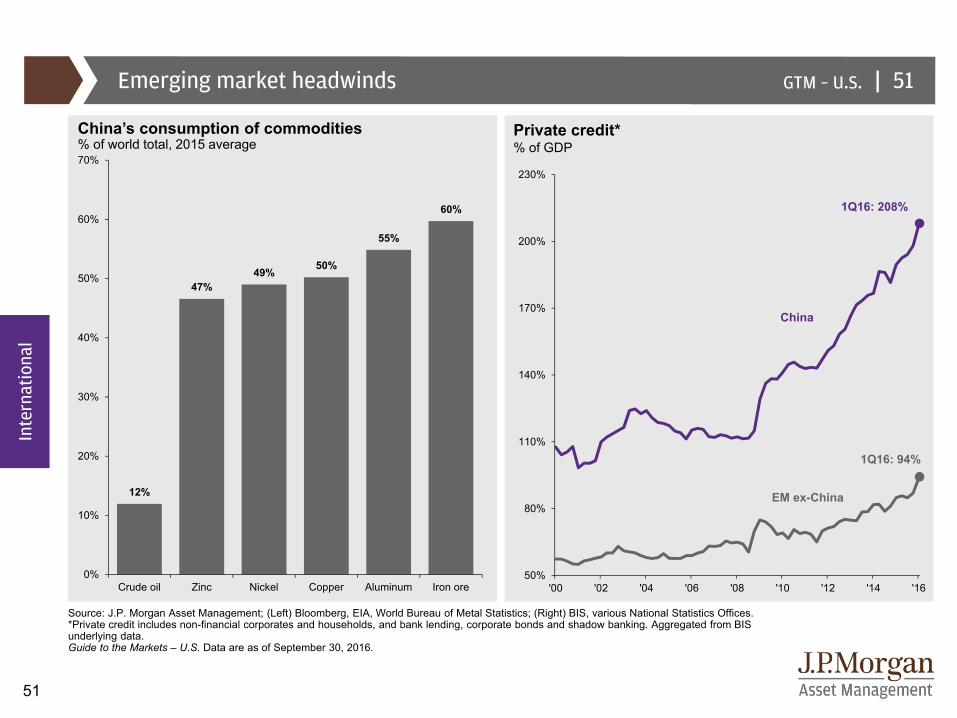
Source: J.P. Morgan Asset Management; (Left) Bloomberg, EIA, World Bureau of Metal Statistics; (Right) BIS, various National Statistics Offices.*Private credit includes non-financial corporates and households, and bank lending, corporate bonds and shadow banking. Aggregated from BIS underlying data. Guide to the Markets – U.S. Data are as of September 30, 2016.
Emerging market headwinds
China’s consumption of commodities% of world total, 2015 average
51
Private credit*% of GDP
EM ex-China
China
1Q16: 208%
1Q16: 94%
Inte
rnat
iona
l
12%
47%49% 50%
55%
60%
0%
10%
20%
30%
40%
50%
60%
70%
Crude oil Zinc Nickel Copper Aluminum Iron ore
|GTM – U.S.
52
-3%
-2%
-1%
0%
1%
2%
3%
4%
5%
6%
7%
'96 '98 '00 '02 '04 '06 '08 '10 '12 '14
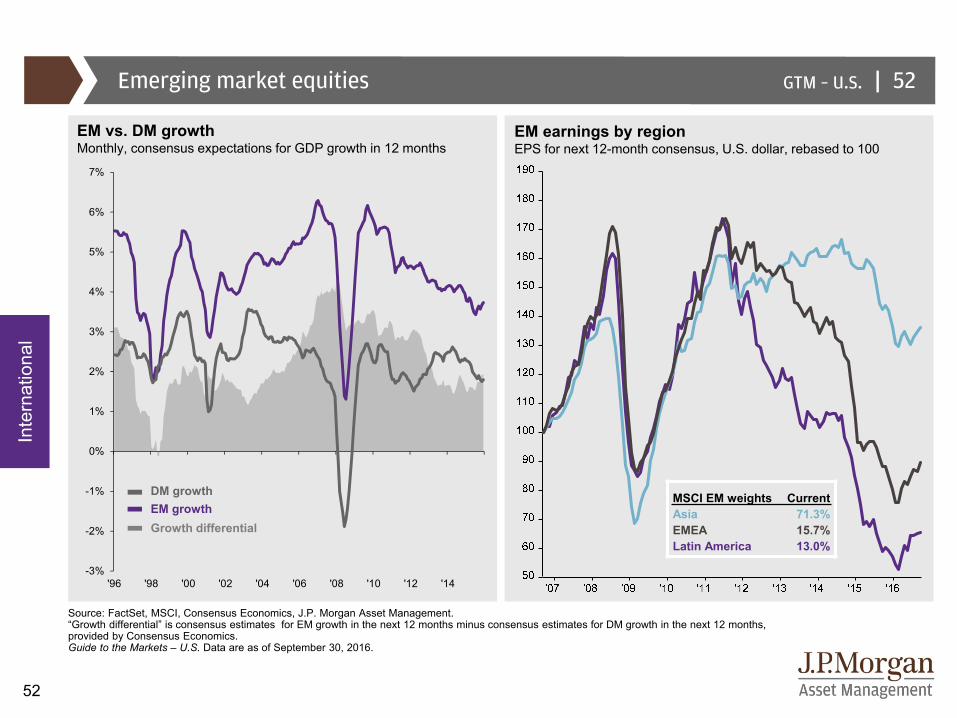
Source: FactSet, MSCI, Consensus Economics, J.P. Morgan Asset Management. “Growth differential” is consensus estimates for EM growth in the next 12 months minus consensus estimates for DM growth in the next 12 months, provided by Consensus Economics. Guide to the Markets – U.S. Data are as of September 30, 2016.
Emerging market equities 52
EM vs. DM growthMonthly, consensus expectations for GDP growth in 12 months
EM earnings by regionEPS for next 12-month consensus, U.S. dollar, rebased to 100
Inte
rnat
iona
l
DM growthEM growthGrowth differential
MSCI EM weights CurrentAsia 71.3%EMEA 15.7%Latin America 13.0%
|GTM – U.S.
53
Graph Key
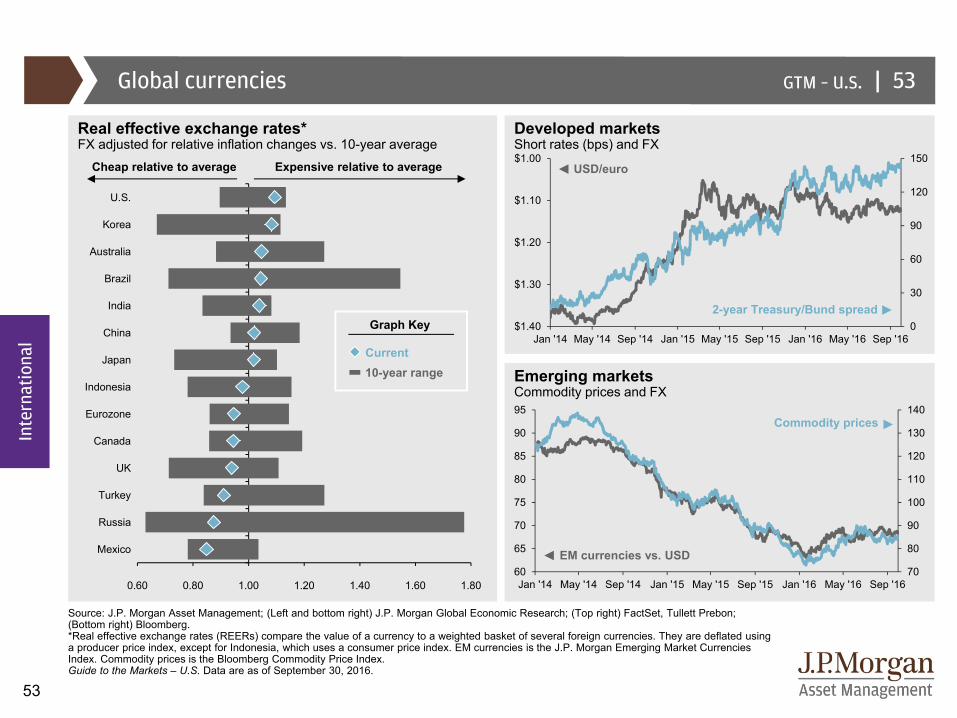
Source: J.P. Morgan Asset Management; (Left and bottom right) J.P. Morgan Global Economic Research; (Top right) FactSet, Tullett Prebon; (Bottom right) Bloomberg.*Real effective exchange rates (REERs) compare the value of a currency to a weighted basket of several foreign currencies. They are deflated using a producer price index, except for Indonesia, which uses a consumer price index. EM currencies is the J.P. Morgan Emerging Market Currencies Index. Commodity prices is the Bloomberg Commodity Price Index. Guide to the Markets – U.S. Data are as of September 30, 2016.
Global currencies
Real effective exchange rates*FX adjusted for relative inflation changes vs. 10-year average
Emerging marketsCommodity prices and FX
Commodity prices
EM currencies vs. USD
2-year Treasury/Bund spread
Current10-year range
Expensive relative to averageCheap relative to average
Inte
rnat
iona
l
0
30
60
90
120
150$1.00
$1.10
$1.20
$1.30
$1.40Jan '14 May '14 Sep '14 Jan '15 May '15 Sep '15 Jan '16 May '16 Sep '16
Developed marketsShort rates (bps) and FX
53
USD/euro
70
80
90
100
110
120
130
140
60
65
70
75
80
85
90
95
Jan '14 May '14 Sep '14 Jan '15 May '15 Sep '15 Jan '16 May '16 Sep '16 0.60 0.80 1.00 1.20 1.40 1.60 1.80
Mexico
Russia
Turkey
UK
Canada
Eurozone
Indonesia
Japan
China
India
Brazil
Australia
Korea
U.S.
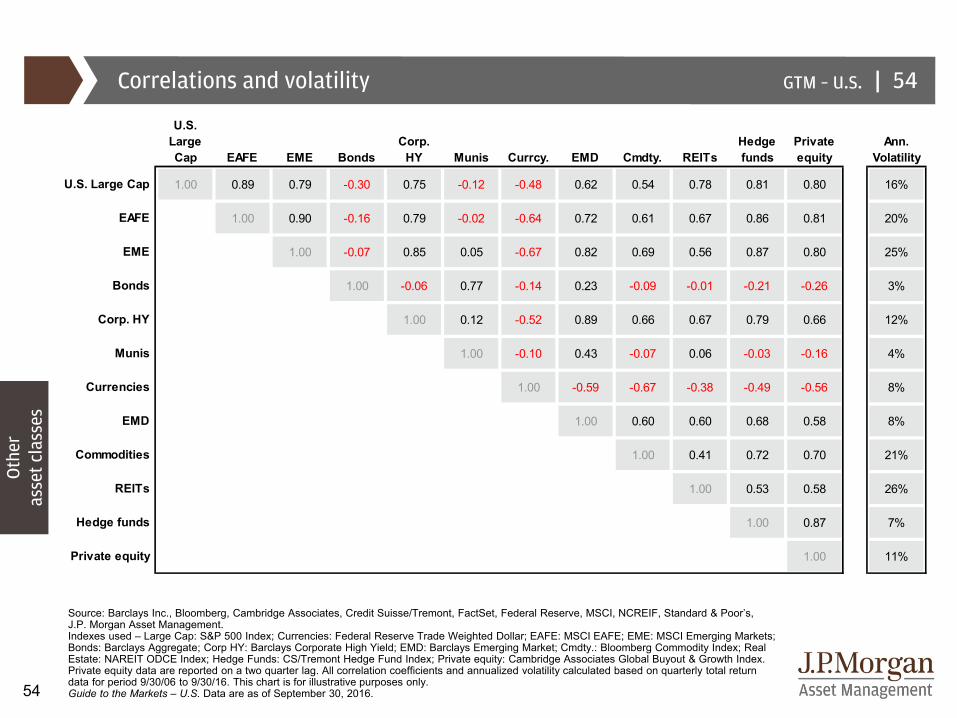
|GTM – U.S.
54
Correlations and volatility
Source: Barclays Inc., Bloomberg, Cambridge Associates, Credit Suisse/Tremont, FactSet, Federal Reserve, MSCI, NCREIF, Standard & Poor’s, J.P. Morgan Asset Management. Indexes used – Large Cap: S&P 500 Index; Currencies: Federal Reserve Trade Weighted Dollar; EAFE: MSCI EAFE; EME: MSCI Emerging Markets; Bonds: Barclays Aggregate; Corp HY: Barclays Corporate High Yield; EMD: Barclays Emerging Market; Cmdty.: Bloomberg Commodity Index; Real Estate: NAREIT ODCE Index; Hedge Funds: CS/Tremont Hedge Fund Index; Private equity: Cambridge Associates Global Buyout & Growth Index. Private equity data are reported on a two quarter lag. All correlation coefficients and annualized volatility calculated based on quarterly total return data for period 9/30/06 to 9/30/16. This chart is for illustrative purposes only.Guide to the Markets – U.S. Data are as of September 30, 2016.
54
Oth
eras
set c
lass
es
zU.S.
Large Cap EAFE EME Bonds
Corp. HY Munis Currcy. EMD Cmdty. REITs
Hedge funds
Private equity
Ann. Volatility
U.S. Large Cap 1.00 0.89 0.79 -0.30 0.75 -0.12 -0.48 0.62 0.54 0.78 0.81 0.80 16%
EAFE 1.00 0.90 -0.16 0.79 -0.02 -0.64 0.72 0.61 0.67 0.86 0.81 20%
EME 1.00 -0.07 0.85 0.05 -0.67 0.82 0.69 0.56 0.87 0.80 25%
Bonds 1.00 -0.06 0.77 -0.14 0.23 -0.09 -0.01 -0.21 -0.26 3%
Corp. HY 1.00 0.12 -0.52 0.89 0.66 0.67 0.79 0.66 12%
Munis 1.00 -0.10 0.43 -0.07 0.06 -0.03 -0.16 4%
Currencies 1.00 -0.59 -0.67 -0.38 -0.49 -0.56 8%
EMD 1.00 0.60 0.60 0.68 0.58 8%
Commodities 1.00 0.41 0.72 0.70 21%
REITs 1.00 0.53 0.58 26%
Hedge funds 1.00 0.87 7%
Private equity 1.00 11%
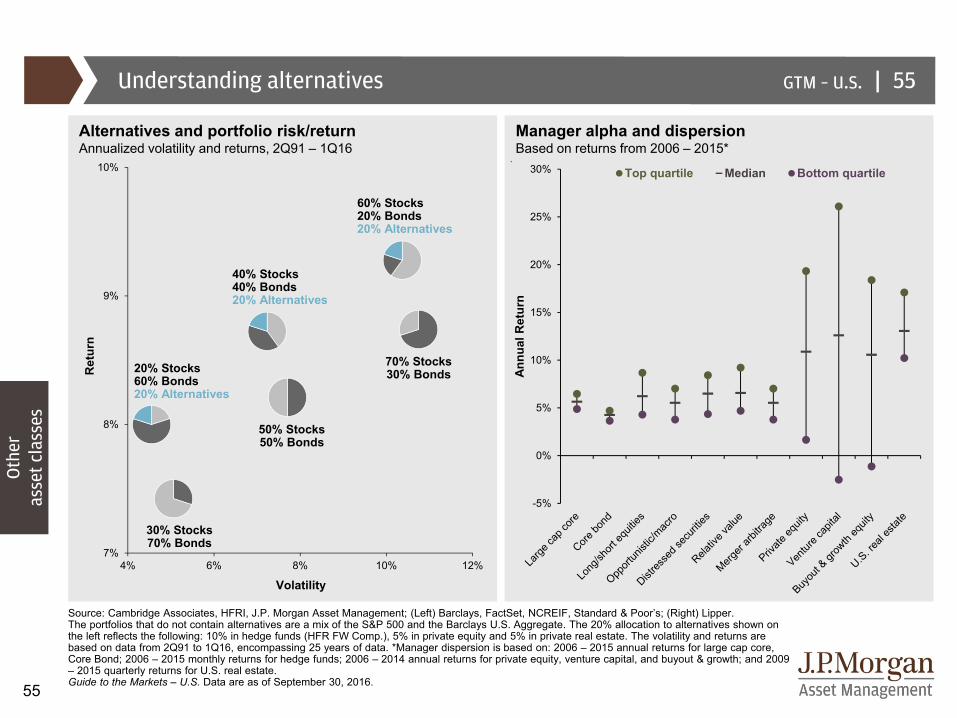
|GTM – U.S.
55
7%
8%
9%
10%
4% 6% 8% 10% 12%
Source: Cambridge Associates, HFRI, J.P. Morgan Asset Management; (Left) Barclays, FactSet, NCREIF, Standard & Poor’s; (Right) Lipper.The portfolios that do not contain alternatives are a mix of the S&P 500 and the Barclays U.S. Aggregate. The 20% allocation to alternatives shown on the left reflects the following: 10% in hedge funds (HFR FW Comp.), 5% in private equity and 5% in private real estate. The volatility and returns are based on data from 2Q91 to 1Q16, encompassing 25 years of data. *Manager dispersion is based on: 2006 – 2015 annual returns for large cap core, Core Bond; 2006 – 2015 monthly returns for hedge funds; 2006 – 2014 annual returns for private equity, venture capital, and buyout & growth; and 2009 – 2015 quarterly returns for U.S. real estate.Guide to the Markets – U.S. Data are as of September 30, 2016.
Understanding alternatives 55
20% Stocks60% Bonds20% Alternatives
30% Stocks70% Bonds
40% Stocks40% Bonds20% Alternatives
50% Stocks50% Bonds
70% Stocks30% Bonds
Volatility
Ret
urn
Alternatives and portfolio risk/returnAnnualized volatility and returns, 2Q91 – 1Q16
60% Stocks20% Bonds20% Alternatives
Manager alpha and dispersionBased on returns from 2006 – 2015*
Oth
eras
set c
lass
es
-5%
0%
5%
10%
15%
20%
25%
30%
Annu
al R
etur
n
Top quartile Median Bottom quartile
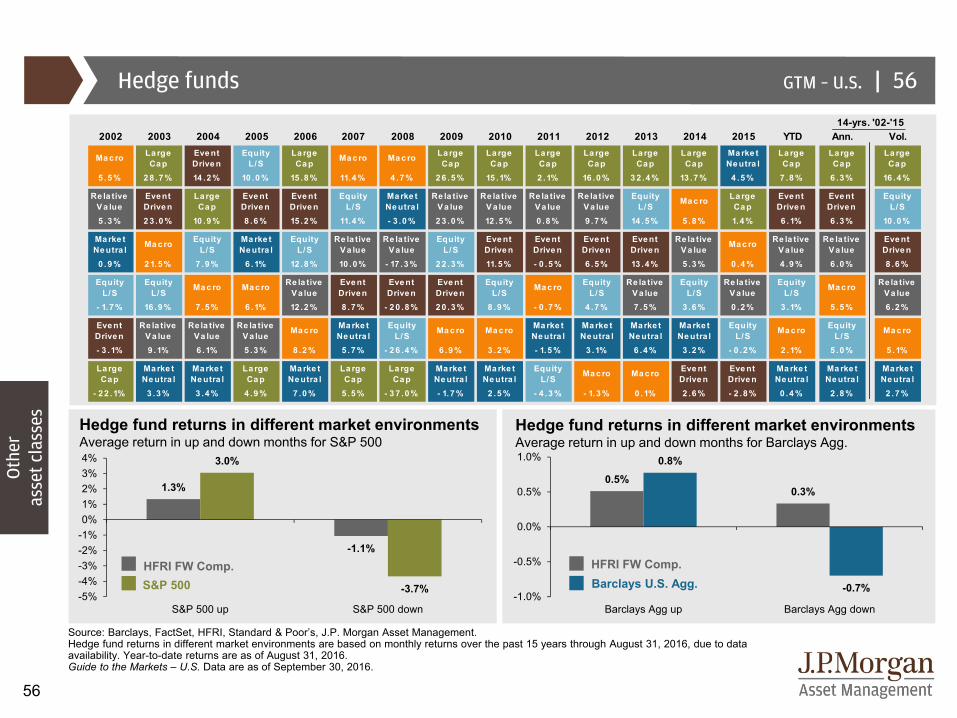
|GTM – U.S.
56
2002 2003 2004 2005 2006 2007 2008 2009 2010 2011 2012 2013 2014 2015 YTD Ann. Vol.
Ma cro Large Cap
Eve nt Drive n
Equity L/S
La rge Ca p
Ma cro Ma cro Large Ca p
La rge Ca p
La rge Ca p
La rge Cap
Large Cap
La rge Ca p
Ma rke t Ne utra l
La rge Ca p
La rge Cap
La rge Ca p
5 .5% 2 8 .7 % 14 .2 % 10 .0 % 15 .8 % 11.4 % 4 .7% 2 6 .5% 15 .1% 2 .1% 16 .0% 3 2 .4 % 13 .7 % 4 .5 % 7 .8 % 6 .3% 16 .4 %
Re la tive Va lue
Event Driven
Large Ca p
Eve nt Drive n
Eve nt Drive n
Equity L/S
Marke t Ne utra l
Re la tive Va lue
Re la tive V a lue
Re la tive Va lue
Re la tive Va lue
Equity L/S
Ma c ro La rge Ca p
Eve nt Drive n
Event Driven
Equity L/S
5 .3% 2 3 .0 % 10 .9 % 8 .6 % 15 .2 % 11.4 % - 3 .0 % 2 3 .0% 12 .5 % 0 .8 % 9 .7% 14 .5% 5 .8 % 1.4% 6 .1% 6 .3% 10 .0 %
Ma rke t Neutra l Ma cro Equity
L/SMa rke t Ne utra l
Equity L/S
Re la tive Va lue
Re la tive Va lue
Equity L/S
Eve nt Drive n
Eve nt Drive n
Event Driven
Event Drive n
Re la tive Va lue Mac ro Re la tive
Va lueRe la tive
Va lueEve nt Drive n
0 .9% 2 1.5% 7 .9 % 6 .1% 12 .8 % 10 .0% - 17 .3 % 2 2 .3% 11.5% - 0 .5 % 6 .5% 13 .4% 5 .3 % 0 .4 % 4 .9 % 6 .0% 8 .6 %
Equity L/S
Equity L/S
Ma c ro Mac ro Re la tive Va lue
Event Driven
Event Driven
Eve nt Drive n
Equity L/S
Mac ro Equity L/S
Re la tive Va lue
Equity L/S
Re la tive V a lue
Equity L/S
Ma cro Re la tive Va lue
- 1.7% 16 .9% 7 .5 % 6 .1% 12 .2 % 8 .7% - 2 0 .8% 2 0 .3% 8 .9 % - 0 .7 % 4 .7% 7 .5% 3 .6 % 0 .2 % 3 .1% 5 .5% 6 .2 %
Event Driven
Re la tive Va lue
Re la tive Va lue
Re la tive V a lue
Mac ro Ma rke t Ne utra l
Equity L/S
Ma c ro Mac ro Ma rke t Neutra l
Ma rke t Ne utra l
Marke t Ne utra l
Marke t Ne utra l
Equity L/S
Mac ro Equity L/S
Ma c ro
- 3 .1% 9 .1% 6 .1% 5 .3 % 8 .2 % 5 .7% - 2 6 .4% 6 .9 % 3 .2 % - 1.5 % 3 .1% 6 .4% 3 .2 % - 0 .2% 2 .1% 5 .0% 5 .1%
La rge Cap
Marke t Ne utra l
Marke t Ne utra l
La rge Ca p
Ma rke t Neutra l
La rge Cap
Large Cap
Marke t Ne utra l
Ma rke t Ne utra l
Equity L/S
Ma cro Ma cro Eve nt Drive n
Eve nt Drive n
Ma rke t Neutra l
Ma rke t Ne utra l
Marke t Ne utra l
- 22 .1% 3 .3% 3 .4 % 4 .9 % 7 .0 % 5 .5% - 3 7 .0% - 1.7 % 2 .5 % - 4 .3 % - 1.3% 0 .1% 2 .6 % - 2 .8% 0 .4 % 2 .8% 2 .7 %
14-yrs. '02-'15
Hedge funds
Source: Barclays, FactSet, HFRI, Standard & Poor’s, J.P. Morgan Asset Management.Hedge fund returns in different market environments are based on monthly returns over the past 15 years through August 31, 2016, due to data availability. Year-to-date returns are as of August 31, 2016. Guide to the Markets – U.S. Data are as of September 30, 2016.
56
Hedge fund returns in different market environmentsAverage return in up and down months for S&P 500
Hedge fund returns in different market environmentsAverage return in up and down months for Barclays Agg.
HFRI FW Comp.Barclays U.S. Agg.
HFRI FW Comp.S&P 500
Oth
eras
set c
lass
es
1.3%
-1.1%
3.0%
-3.7%-5%-4%-3%-2%-1%0%1%2%3%4%
S&P 500 up S&P 500 down
0.5%0.3%
0.8%
-0.7%-1.0%
-0.5%
0.0%
0.5%
1.0%
Barclays Agg up Barclays Agg down
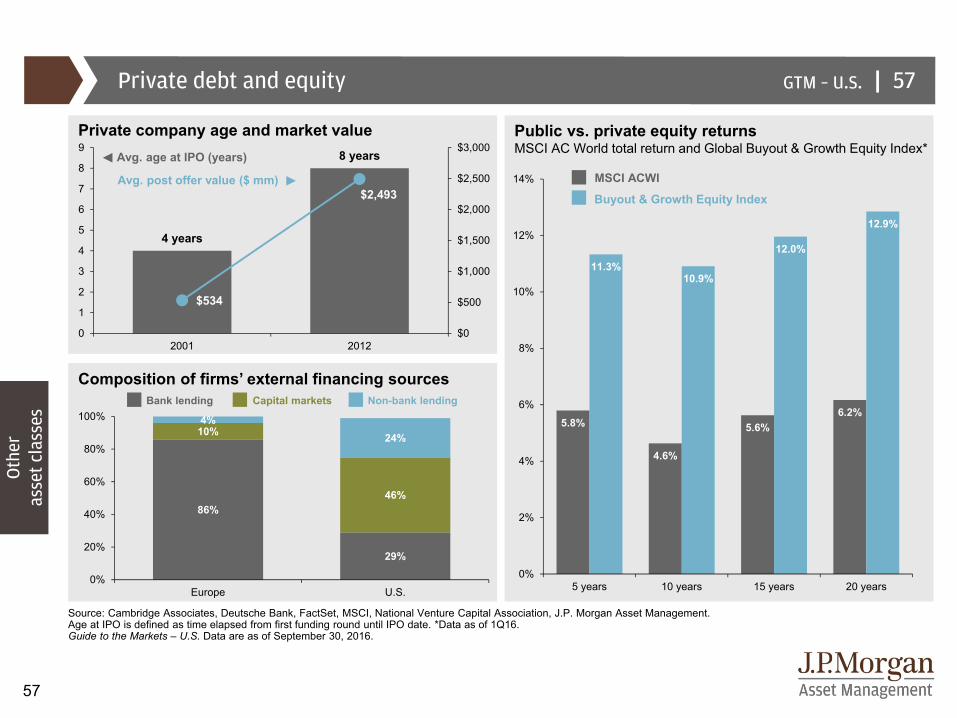
|GTM – U.S.
57
|
Source: Cambridge Associates, Deutsche Bank, FactSet, MSCI, National Venture Capital Association, J.P. Morgan Asset Management.Age at IPO is defined as time elapsed from first funding round until IPO date. *Data as of 1Q16. Guide to the Markets – U.S. Data are as of September 30, 2016.
Private debt and equity 57
Composition of firms’ external financing sources
Public vs. private equity returnsMSCI AC World total return and Global Buyout & Growth Equity Index*
Buyout & Growth Equity Index
MSCI ACWI
Private company age and market value
Oth
eras
set c
lass
es
86%
29%
10%
46%
4%24%
0%
20%
40%
60%
80%
100%
Europe U.S.
4 years
8 years
$534
$2,493
$0
$500
$1,000
$1,500
$2,000
$2,500
$3,000
0
1
2
3
4
5
6
7
8
9
2001 2012
Bank lending Non-bank lendingCapital markets
Avg. age at IPO (years)
Avg. post offer value ($ mm)
5.8%
4.6%
5.6%6.2%
11.3%10.9%
12.0%
12.9%
0%
2%
4%
6%
8%
10%
12%
14%
5 years 10 years 15 years 20 years
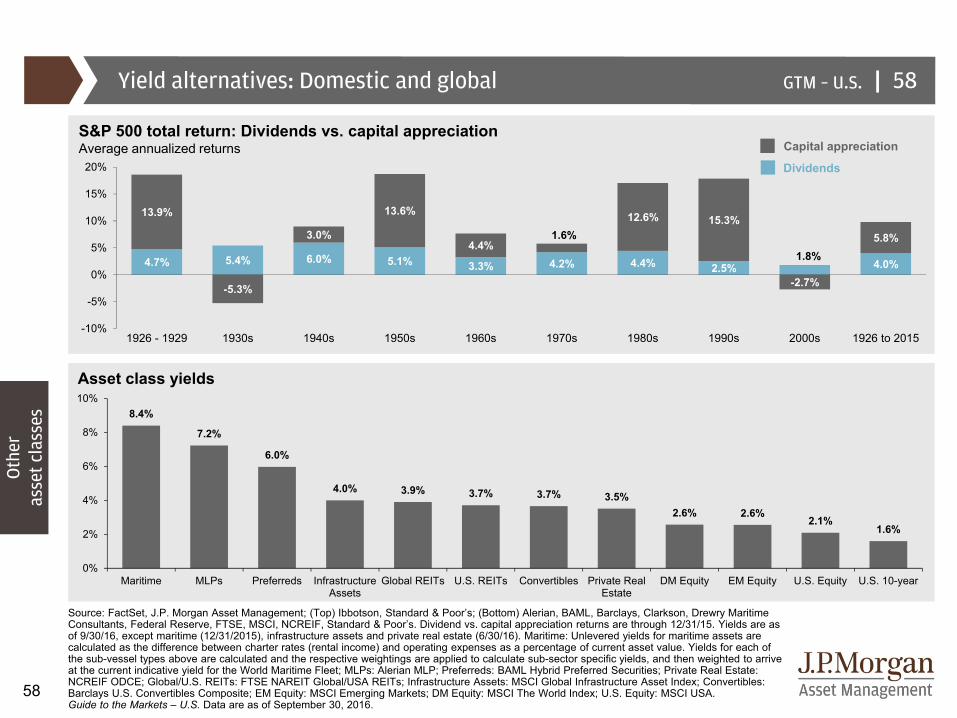
|GTM – U.S. |
58
Yield alternatives: Domestic and global
Source: FactSet, J.P. Morgan Asset Management; (Top) Ibbotson, Standard & Poor’s; (Bottom) Alerian, BAML, Barclays, Clarkson, Drewry Maritime Consultants, Federal Reserve, FTSE, MSCI, NCREIF, Standard & Poor’s. Dividend vs. capital appreciation returns are through 12/31/15. Yields are as of 9/30/16, except maritime (12/31/2015), infrastructure assets and private real estate (6/30/16). Maritime: Unlevered yields for maritime assets are calculated as the difference between charter rates (rental income) and operating expenses as a percentage of current asset value. Yields for each of the sub-vessel types above are calculated and the respective weightings are applied to calculate sub-sector specific yields, and then weighted to arrive at the current indicative yield for the World Maritime Fleet; MLPs: Alerian MLP; Preferreds: BAML Hybrid Preferred Securities; Private Real Estate: NCREIF ODCE; Global/U.S. REITs: FTSE NAREIT Global/USA REITs; Infrastructure Assets: MSCI Global Infrastructure Asset Index; Convertibles: Barclays U.S. Convertibles Composite; EM Equity: MSCI Emerging Markets; DM Equity: MSCI The World Index; U.S. Equity: MSCI USA.Guide to the Markets – U.S. Data are as of September 30, 2016.
58
Asset class yields
S&P 500 total return: Dividends vs. capital appreciationAverage annualized returns Capital appreciation
Dividends
Oth
eras
set c
lass
es 8.4%
7.2%
6.0%
4.0% 3.9% 3.7% 3.7% 3.5%2.6% 2.6%
2.1%1.6%
0%
2%
4%
6%
8%
10%
Maritime MLPs Preferreds InfrastructureAssets
Global REITs U.S. REITs Convertibles Private RealEstate
DM Equity EM Equity U.S. Equity U.S. 10-year
4.7% 5.4% 6.0% 5.1% 3.3% 4.2% 4.4% 2.5%1.8%
4.0%
13.9%
-5.3%
3.0%
13.6%
4.4%1.6%
12.6% 15.3%
-2.7%
5.8%
-10%
-5%
0%
5%
10%
15%
20%
1926 - 1929 1930s 1940s 1950s 1960s 1970s 1980s 1990s 2000s 1926 to 2015
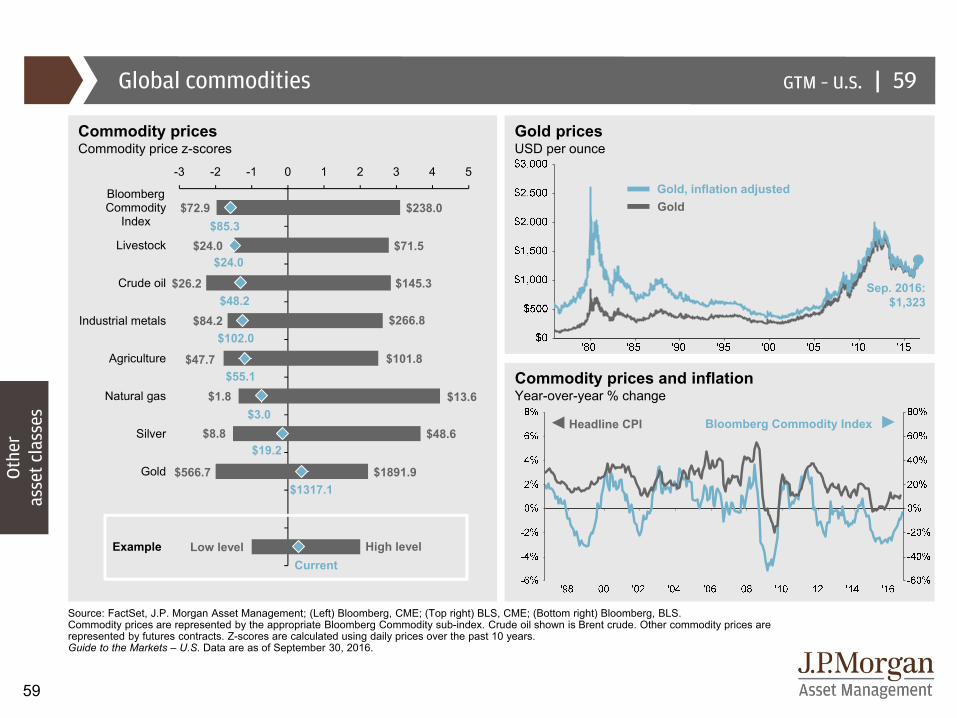
|GTM – U.S.
59
-3 -2 -1 0 1 2 3 4 5
BloombergCommodity
Index
Livestock
Crude oil
Industrial metals
Agriculture
Natural gas
Silver
Gold
Source: FactSet, J.P. Morgan Asset Management; (Left) Bloomberg, CME; (Top right) BLS, CME; (Bottom right) Bloomberg, BLS.Commodity prices are represented by the appropriate Bloomberg Commodity sub-index. Crude oil shown is Brent crude. Other commodity prices are represented by futures contracts. Z-scores are calculated using daily prices over the past 10 years.Guide to the Markets – U.S. Data are as of September 30, 2016.
Global commodities 59
Commodity prices Commodity price z-scores
Commodity prices and inflationYear-over-year % change
Headline CPI Bloomberg Commodity Index
Gold pricesUSD per ounce
Gold, inflation adjustedGold
Sep. 2016:$1,323
Example High levelCurrent
Low level
$48.2
$24.0
$19.2
$1317.1
$26.2 $145.3
$71.5
$48.6
$1891.9$566.7
$8.8
$24.0
$266.8$84.2$102.0
$101.8$47.7$55.1
$13.6$1.8$3.0
$238.0$72.9$85.3
Oth
eras
set c
lass
es
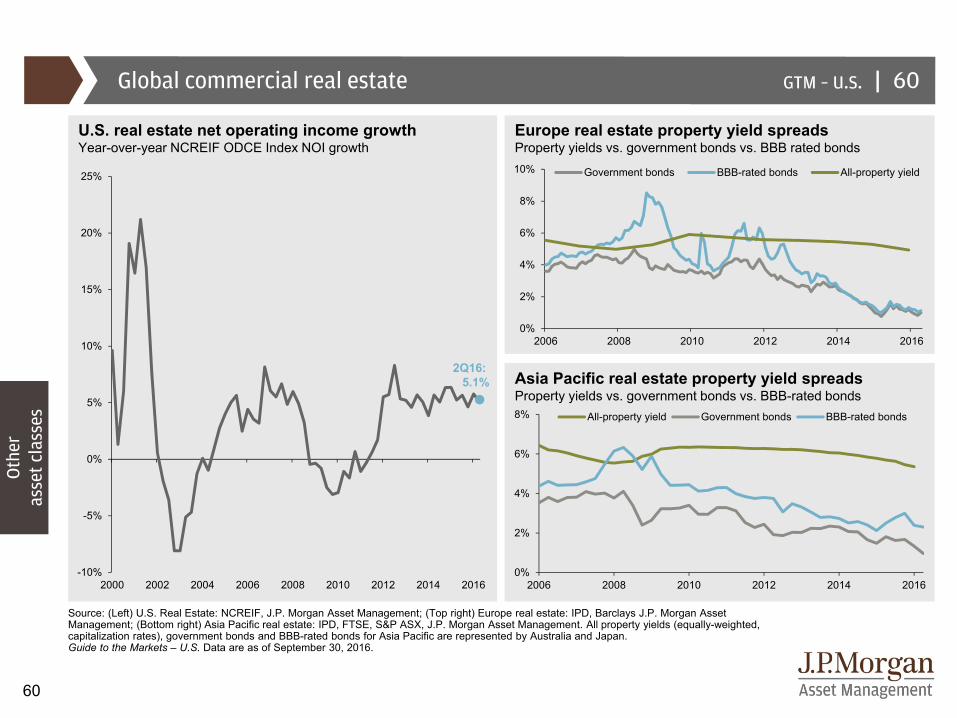
|GTM – U.S.
60
Source: (Left) U.S. Real Estate: NCREIF, J.P. Morgan Asset Management; (Top right) Europe real estate: IPD, Barclays J.P. Morgan Asset Management; (Bottom right) Asia Pacific real estate: IPD, FTSE, S&P ASX, J.P. Morgan Asset Management. All property yields (equally-weighted, capitalization rates), government bonds and BBB-rated bonds for Asia Pacific are represented by Australia and Japan. Guide to the Markets – U.S. Data are as of September 30, 2016.
Global commercial real estate 60
U.S. real estate net operating income growthYear-over-year NCREIF ODCE Index NOI growth
Europe real estate property yield spreadsProperty yields vs. government bonds vs. BBB rated bonds
Asia Pacific real estate property yield spreadsProperty yields vs. government bonds vs. BBB-rated bonds
-10%
-5%
0%
5%
10%
15%
20%
25%
2000 2002 2004 2006 2008 2010 2012 2014 2016
2Q16: 5.1%
Oth
eras
set c
lass
es
0%
2%
4%
6%
8%
10%
2006 2008 2010 2012 2014 2016
Government bonds BBB-rated bonds All-property yield
0%
2%
4%
6%
8%
2006 2008 2010 2012 2014 2016
All-property yield Government bonds BBB-rated bonds
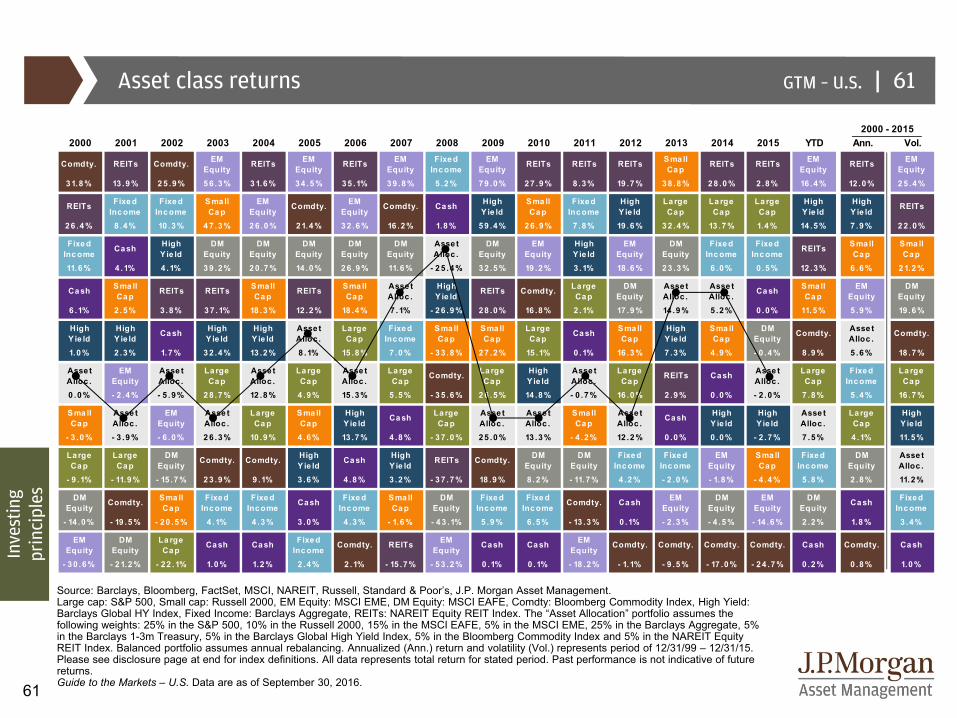
|GTM – U.S.
61
2000 2001 2002 2003 2004 2005 2006 2007 2008 2009 2010 2011 2012 2013 2014 2015 YTD Ann. Vol.
Comdty. REITs Comdty. EM Equity REITs EM
Equity REITs EM Equity
Fixe d Inc ome
EM Equity REITs REITs REITs Sma ll
Ca p REITs REITs EM Equity REITs EM
Equity3 1.8 % 13 .9 % 2 5 .9 % 5 6 .3 % 3 1.6 % 3 4 .5 % 3 5 .1% 3 9 .8 % 5 .2 % 7 9 .0 % 2 7 .9 % 8 .3 % 19 .7 % 3 8 .8 % 2 8 .0 % 2 .8 % 16 .4 % 12 .0 % 2 5 .4 %
REITs Fixe d Inc ome
Fixe d Inc ome
Small Ca p
EM Equity
Comdty. EM Equity
Comdty. Ca sh High Y ie ld
Sma ll Ca p
Fixe d Inc ome
High Y ie ld
La rge Ca p
La rge Ca p
La rge Ca p
High Y ie ld
High Y ie ld
REITs
2 6 .4 % 8 .4 % 10 .3 % 4 7 .3 % 2 6 .0 % 2 1.4 % 3 2 .6 % 16 .2 % 1.8 % 5 9 .4 % 2 6 .9 % 7 .8 % 19 .6 % 3 2 .4 % 13 .7 % 1.4 % 14 .5 % 7 .9 % 2 2 .0 %
Fixe d Inc ome Ca sh High
Y ie ldDM
EquityDM
EquityDM
EquityDM
EquityDM
EquityAsse t Alloc .
DM Equity
EM Equity
High Y ie ld
EM Equity
DM Equity
Fixe d Inc ome
Fixe d Inc ome REITs Small
Ca pSma ll Ca p
11.6 % 4 .1% 4 .1% 3 9 .2 % 2 0 .7 % 14 .0 % 2 6 .9 % 11.6 % - 2 5 .4 % 3 2 .5 % 19 .2 % 3 .1% 18 .6 % 2 3 .3 % 6 .0 % 0 .5 % 12 .3 % 6 .6 % 2 1.2 %
Ca sh Sma ll Ca p REITs REITs Small
Ca pREITs Sma ll
Ca pAsse t Alloc .
High Y ie ld REITs Comdty. La rge
Ca pDM
EquityAsse t Alloc .
Asse t Alloc . Ca sh Small
Ca pEM
EquityDM
Equity6 .1% 2 .5 % 3 .8 % 3 7 .1% 18 .3 % 12 .2 % 18 .4 % 7 .1% - 2 6 .9 % 2 8 .0 % 16 .8 % 2 .1% 17 .9 % 14 .9 % 5 .2 % 0 .0 % 11.5 % 5 .9 % 19 .6 %
High Y ie ld
High Y ie ld Ca sh High
Y ie ldHigh Y ie ld
Asse t Alloc .
La rge Ca p
Fixe d Inc ome
Small Ca p
Sma ll Ca p
La rge Ca p Ca sh Small
Ca pHigh Y ie ld
Sma ll Ca p
DM Equity Comdty. Asse t
Alloc . Comdty.
1.0 % 2 .3 % 1.7 % 3 2 .4 % 13 .2 % 8 .1% 15 .8 % 7 .0 % - 3 3 .8 % 2 7 .2 % 15 .1% 0 .1% 16 .3 % 7 .3 % 4 .9 % - 0 .4 % 8 .9 % 5 .6 % 18 .7 %
Asse t Alloc .
EM Equity
Asse t Alloc .
La rge Ca p
Asse t Alloc .
La rge Ca p
Asse t Alloc .
La rge Ca p
Comdty. La rge Ca p
High Y ie ld
Asse t Alloc .
La rge Ca p
REITs Ca sh Asse t Alloc .
La rge Ca p
Fixe d Inc ome
La rge Ca p
0 .0 % - 2 .4 % - 5 .9 % 2 8 .7 % 12 .8 % 4 .9 % 15 .3 % 5 .5 % - 3 5 .6 % 2 6 .5 % 14 .8 % - 0 .7 % 16 .0 % 2 .9 % 0 .0 % - 2 .0 % 7 .8 % 5 .4 % 16 .7 %
Sma ll Ca p
Asse t Alloc .
EM Equity
Asse t Alloc .
La rge Ca p
Sma ll Ca p
High Y ie ld
Ca sh La rge Ca p
Asse t Alloc .
Asse t Alloc .
Sma ll Ca p
Asse t Alloc .
Ca sh High Y ie ld
High Y ie ld
Asse t Alloc .
La rge Ca p
High Y ie ld
- 3 .0 % - 3 .9 % - 6 .0 % 2 6 .3 % 10 .9 % 4 .6 % 13 .7 % 4 .8 % - 3 7 .0 % 2 5 .0 % 13 .3 % - 4 .2 % 12 .2 % 0 .0 % 0 .0 % - 2 .7 % 7 .5 % 4 .1% 11.5 %
La rge Ca p
La rge Ca p
DM Equity Comdty. Comdty. High
Y ie ld Ca sh High Y ie ld REITs Comdty. DM
EquityDM
EquityFixe d
Inc omeFixe d
Inc omeEM
EquitySma ll Ca p
Fixe d Inc ome
DM Equity
Asse t Alloc .
- 9 .1% - 11.9 % - 15 .7 % 2 3 .9 % 9 .1% 3 .6 % 4 .8 % 3 .2 % - 3 7 .7 % 18 .9 % 8 .2 % - 11.7 % 4 .2 % - 2 .0 % - 1.8 % - 4 .4 % 5 .8 % 2 .8 % 11.2 %
DM Equity Comdty. Sma ll
Ca pFixe d
Inc omeFixe d
Inc ome Ca sh Fixe d Inc ome
Small Ca p
DM Equity
Fixe d Inc ome
Fixe d Inc ome Comdty. Ca sh EM
EquityDM
EquityEM
EquityDM
Equity Ca sh Fixe d Inc ome
- 14 .0 % - 19 .5 % - 2 0 .5 % 4 .1% 4 .3 % 3 .0 % 4 .3 % - 1.6 % - 4 3 .1% 5 .9 % 6 .5 % - 13 .3 % 0 .1% - 2 .3 % - 4 .5 % - 14 .6 % 2 .2 % 1.8 % 3 .4 %
EM Equity
DM Equity
La rge Ca p Ca sh Ca sh Fixe d
Inc ome Comdty. REITs EM Equity Ca sh Ca sh EM
Equity Comdty. Comdty. Comdty. Comdty. Ca sh Comdty. Ca sh
- 3 0 .6 % - 2 1.2 % - 2 2 .1% 1.0 % 1.2 % 2 .4 % 2 .1% - 15 .7 % - 5 3 .2 % 0 .1% 0 .1% - 18 .2 % - 1.1% - 9 .5 % - 17 .0 % - 2 4 .7 % 0 .2 % 0 .8 % 1.0 %
2000 - 2015
Asset class returns
Source: Barclays, Bloomberg, FactSet, MSCI, NAREIT, Russell, Standard & Poor’s, J.P. Morgan Asset Management. Large cap: S&P 500, Small cap: Russell 2000, EM Equity: MSCI EME, DM Equity: MSCI EAFE, Comdty: Bloomberg Commodity Index, High Yield: Barclays Global HY Index, Fixed Income: Barclays Aggregate, REITs: NAREIT Equity REIT Index. The “Asset Allocation” portfolio assumes the following weights: 25% in the S&P 500, 10% in the Russell 2000, 15% in the MSCI EAFE, 5% in the MSCI EME, 25% in the Barclays Aggregate, 5% in the Barclays 1-3m Treasury, 5% in the Barclays Global High Yield Index, 5% in the Bloomberg Commodity Index and 5% in the NAREIT Equity REIT Index. Balanced portfolio assumes annual rebalancing. Annualized (Ann.) return and volatility (Vol.) represents period of 12/31/99 – 12/31/15. Please see disclosure page at end for index definitions. All data represents total return for stated period. Past performance is not indicative of future returns. Guide to the Markets – U.S. Data are as of September 30, 2016.
61
Inve
stin
gpr
inci
ples
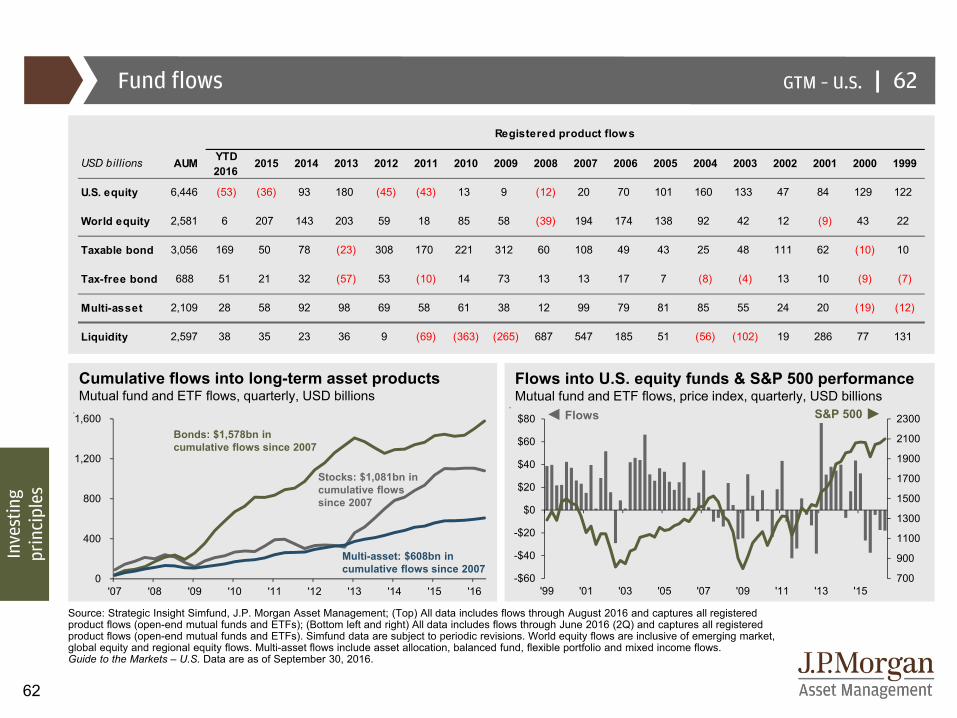
|GTM – U.S.
62
|
Source: Strategic Insight Simfund, J.P. Morgan Asset Management; (Top) All data includes flows through August 2016 and captures all registered product flows (open-end mutual funds and ETFs); (Bottom left and right) All data includes flows through June 2016 (2Q) and captures all registered product flows (open-end mutual funds and ETFs). Simfund data are subject to periodic revisions. World equity flows are inclusive of emerging market, global equity and regional equity flows. Multi-asset flows include asset allocation, balanced fund, flexible portfolio and mixed income flows.Guide to the Markets – U.S. Data are as of September 30, 2016.
Fund flows 62
Flows into U.S. equity funds & S&P 500 performanceMutual fund and ETF flows, price index, quarterly, USD billions
S&P 500Flows
Inve
stin
gpr
inci
ples
Cumulative flows into long-term asset productsMutual fund and ETF flows, quarterly, USD billions
0
400
800
1,200
1,600
'07 '08 '09 '10 '11 '12 '13 '14 '15 '16
Stocks: $1,081bn in cumulative flows since 2007
Bonds: $1,578bn in cumulative flows since 2007
Multi-asset: $608bn in cumulative flows since 2007
700
900
1100
1300
1500
1700
1900
2100
2300
-$60
-$40
-$20
$0
$20
$40
$60
$80
'99 '01 '03 '05 '07 '09 '11 '13 '15
USD billions AUM YTD 2016
2015 2014 2013 2012 2011 2010 2009 2008 2007 2006 2005 2004 2003 2002 2001 2000 1999
U.S. equity 6,446 (53) (36) 93 180 (45) (43) 13 9 (12) 20 70 101 160 133 47 84 129 122
World equity 2,581 6 207 143 203 59 18 85 58 (39) 194 174 138 92 42 12 (9) 43 22
Taxable bond 3,056 169 50 78 (23) 308 170 221 312 60 108 49 43 25 48 111 62 (10) 10
Tax-free bond 688 51 21 32 (57) 53 (10) 14 73 13 13 17 7 (8) (4) 13 10 (9) (7)
Multi-asset 2,109 28 58 92 98 69 58 61 38 12 99 79 81 85 55 24 20 (19) (12)
Liquidity 2,597 38 35 23 36 9 (69) (363) (265) 687 547 185 51 (56) (102) 19 286 77 131
Registered product flows
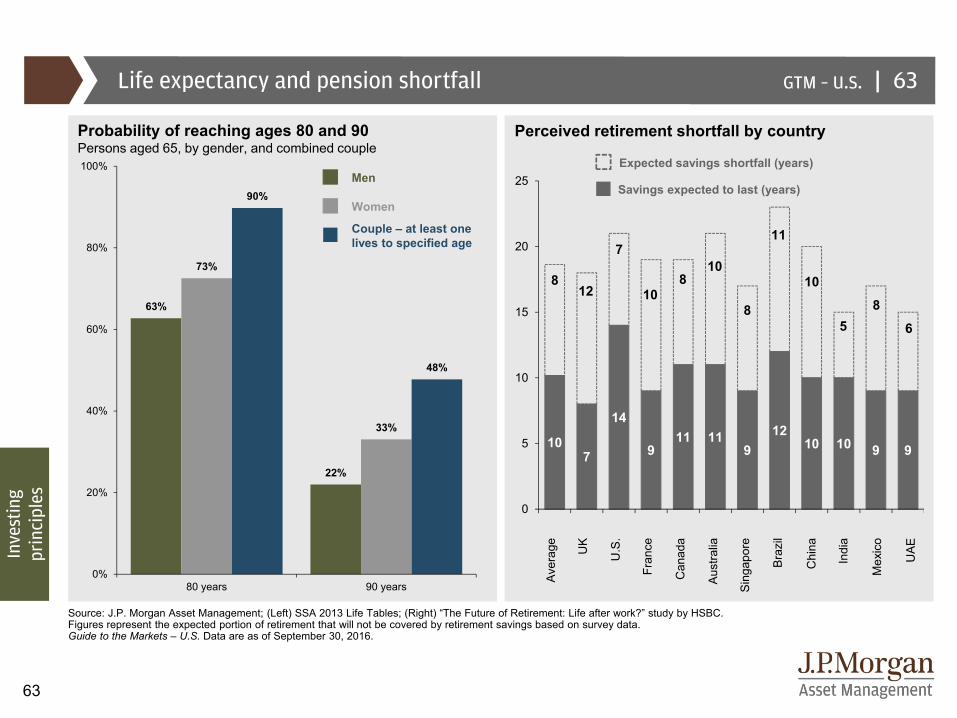
|GTM – U.S.
63
107
14
911 11
912
10 10 9 9
0
5
10
15
20
25
Source: J.P. Morgan Asset Management; (Left) SSA 2013 Life Tables; (Right) “The Future of Retirement: Life after work?” study by HSBC.Figures represent the expected portion of retirement that will not be covered by retirement savings based on survey data. Guide to the Markets – U.S. Data are as of September 30, 2016.
Life expectancy and pension shortfall 63
Probability of reaching ages 80 and 90Persons aged 65, by gender, and combined couple
Perceived retirement shortfall by country
Men
Women
Couple – at least onelives to specified age
Expected savings shortfall (years)
Savings expected to last (years)
812
7
108
10
8
11
10
58
6
Aver
age
U.S
.
Fran
ce
Chi
na
Can
ada
Aus
traliaUK
Bra
zil
Sing
apor
e
Indi
a
UA
E
Mex
ico
Inve
stin
gpr
inci
ples
63%
22%
73%
33%
90%
48%
0%
20%
40%
60%
80%
100%
80 years 90 years
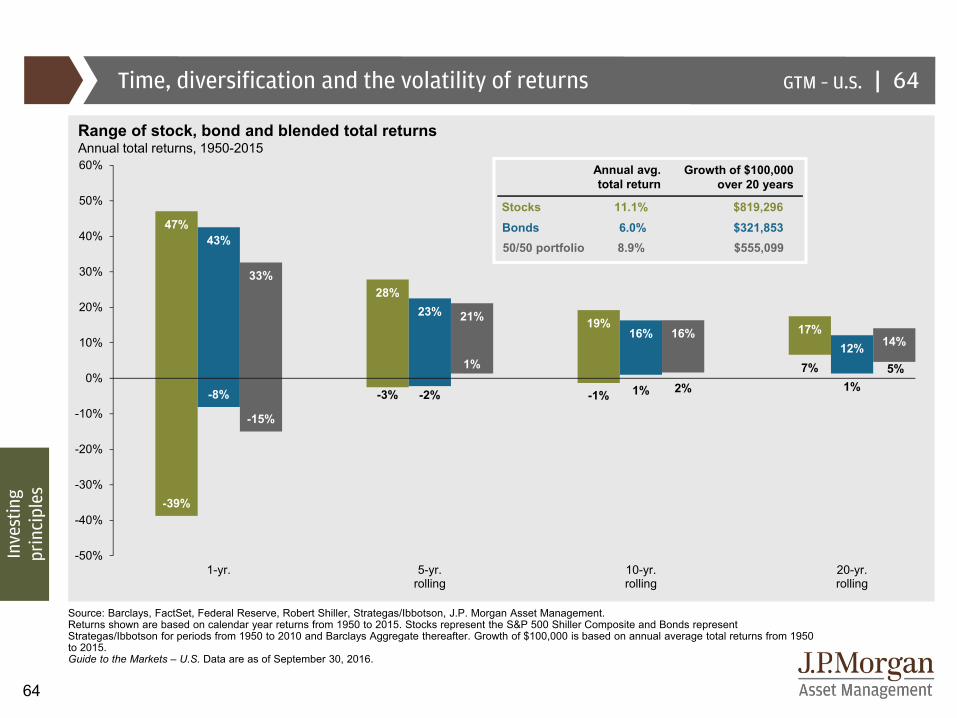
|GTM – U.S.
64
-39%
-8%
-15%
-3% -2%
1%
-1% 1% 2%7%
1%5%
47%43%
33%28%
23% 21% 19%16% 16% 17%
12% 14%
-50%
-40%
-30%
-20%
-10%
0%
10%
20%
30%
40%
50%
60%
1-yr. 5-yr.rolling
10-yr.rolling
20-yr.rolling
Time, diversification and the volatility of returns
Source: Barclays, FactSet, Federal Reserve, Robert Shiller, Strategas/Ibbotson, J.P. Morgan Asset Management.Returns shown are based on calendar year returns from 1950 to 2015. Stocks represent the S&P 500 Shiller Composite and Bonds represent Strategas/Ibbotson for periods from 1950 to 2010 and Barclays Aggregate thereafter. Growth of $100,000 is based on annual average total returns from 1950 to 2015.Guide to the Markets – U.S. Data are as of September 30, 2016.
64
Range of stock, bond and blended total returnsAnnual total returns, 1950-2015
50/50 portfolio 8.9% $555,099Bonds 6.0% $321,853Stocks 11.1% $819,296
Annual avg. total return
Growth of $100,000 over 20 years
Inve
stin
gpr
inci
ples
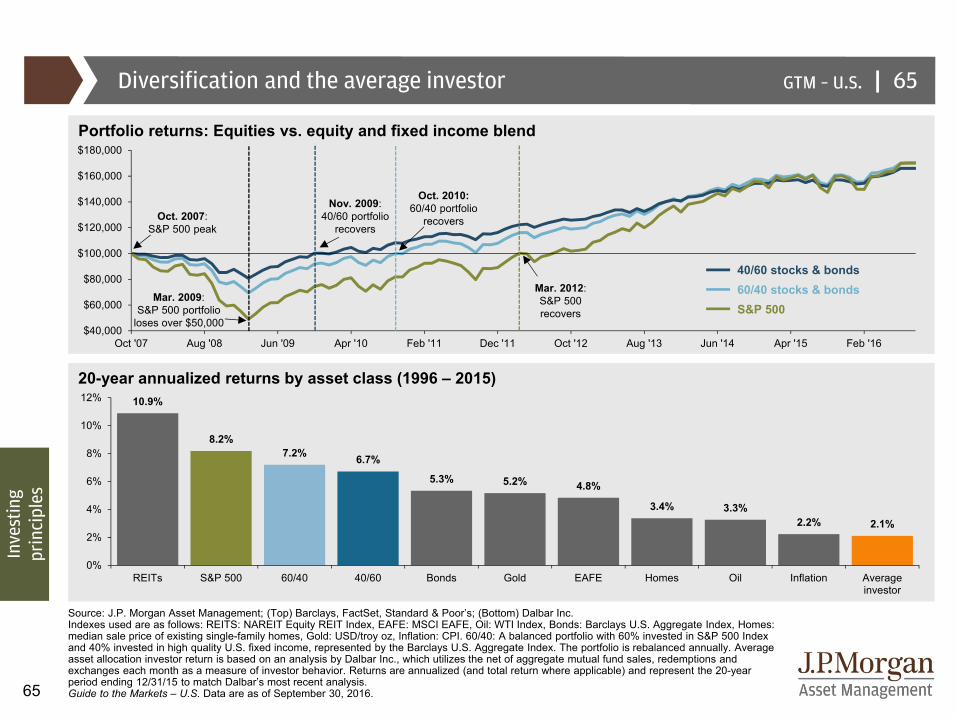
|GTM – U.S. |
65
$40,000
$60,000
$80,000
$100,000
$120,000
$140,000
$160,000
$180,000
Oct '07 Aug '08 Jun '09 Apr '10 Feb '11 Dec '11 Oct '12 Aug '13 Jun '14 Apr '15 Feb '16
Diversification and the average investor
Source: J.P. Morgan Asset Management; (Top) Barclays, FactSet, Standard & Poor’s; (Bottom) Dalbar Inc.Indexes used are as follows: REITS: NAREIT Equity REIT Index, EAFE: MSCI EAFE, Oil: WTI Index, Bonds: Barclays U.S. Aggregate Index, Homes: median sale price of existing single-family homes, Gold: USD/troy oz, Inflation: CPI. 60/40: A balanced portfolio with 60% invested in S&P 500 Index and 40% invested in high quality U.S. fixed income, represented by the Barclays U.S. Aggregate Index. The portfolio is rebalanced annually. Average asset allocation investor return is based on an analysis by Dalbar Inc., which utilizes the net of aggregate mutual fund sales, redemptions and exchanges each month as a measure of investor behavior. Returns are annualized (and total return where applicable) and represent the 20-year period ending 12/31/15 to match Dalbar’s most recent analysis. Guide to the Markets – U.S. Data are as of September 30, 2016.
65
20-year annualized returns by asset class (1996 – 2015)
Portfolio returns: Equities vs. equity and fixed income blend
40/60 stocks & bonds60/40 stocks & bondsS&P 500
Mar. 2009:S&P 500 portfolio
loses over $50,000
Nov. 2009:40/60 portfolio
recovers
Oct. 2010:60/40 portfolio
recovers
Mar. 2012:S&P 500 recovers
Oct. 2007: S&P 500 peak
Inve
stin
gpr
inci
ples
10.9%
8.2%7.2% 6.7%
5.3% 5.2% 4.8%
3.4% 3.3%2.2% 2.1%
0%
2%
4%
6%
8%
10%
12%
REITs S&P 500 60/40 40/60 Bonds Gold EAFE Homes Oil Inflation Averageinvestor
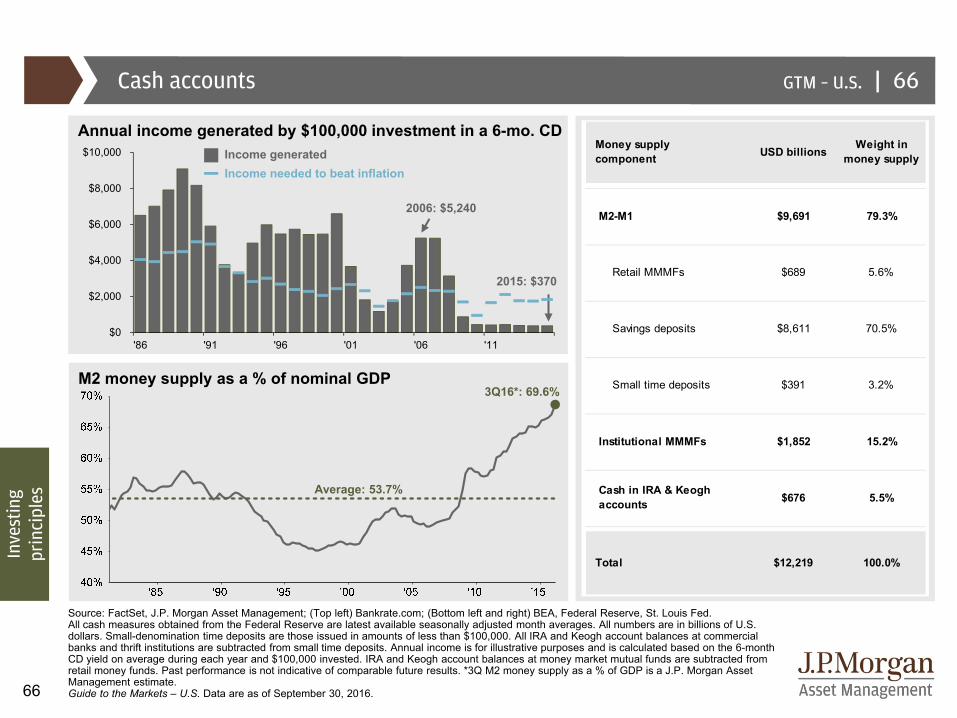
|GTM – U.S.
66
$0
$2,000
$4,000
$6,000
$8,000
$10,000
'86 '91 '96 '01 '06 '11
Cash accounts
Source: FactSet, J.P. Morgan Asset Management; (Top left) Bankrate.com; (Bottom left and right) BEA, Federal Reserve, St. Louis Fed. All cash measures obtained from the Federal Reserve are latest available seasonally adjusted month averages. All numbers are in billions of U.S. dollars. Small-denomination time deposits are those issued in amounts of less than $100,000. All IRA and Keogh account balances at commercial banks and thrift institutions are subtracted from small time deposits. Annual income is for illustrative purposes and is calculated based on the 6-month CD yield on average during each year and $100,000 invested. IRA and Keogh account balances at money market mutual funds are subtracted from retail money funds. Past performance is not indicative of comparable future results. *3Q M2 money supply as a % of GDP is a J.P. Morgan Asset Management estimate. Guide to the Markets – U.S. Data are as of September 30, 2016.
66
Annual income generated by $100,000 investment in a 6-mo. CD
M2 money supply as a % of nominal GDP
2015: $370
2006: $5,240
3Q16*: 69.6%
Average: 53.7%
Inve
stin
gpr
inci
ples
Income generatedIncome needed to beat inflation
USD billions Weight in money supply
M2-M1 $9,691 79.3%
Retail MMMFs $689 5.6%
Savings deposits $8,611 70.5%
Small time deposits $391 3.2%
Institutional MMMFs $1,852 15.2%
$676 5.5%
Total $12,219 100.0%
Money supplycomponent
Cash in IRA & Keogh accounts
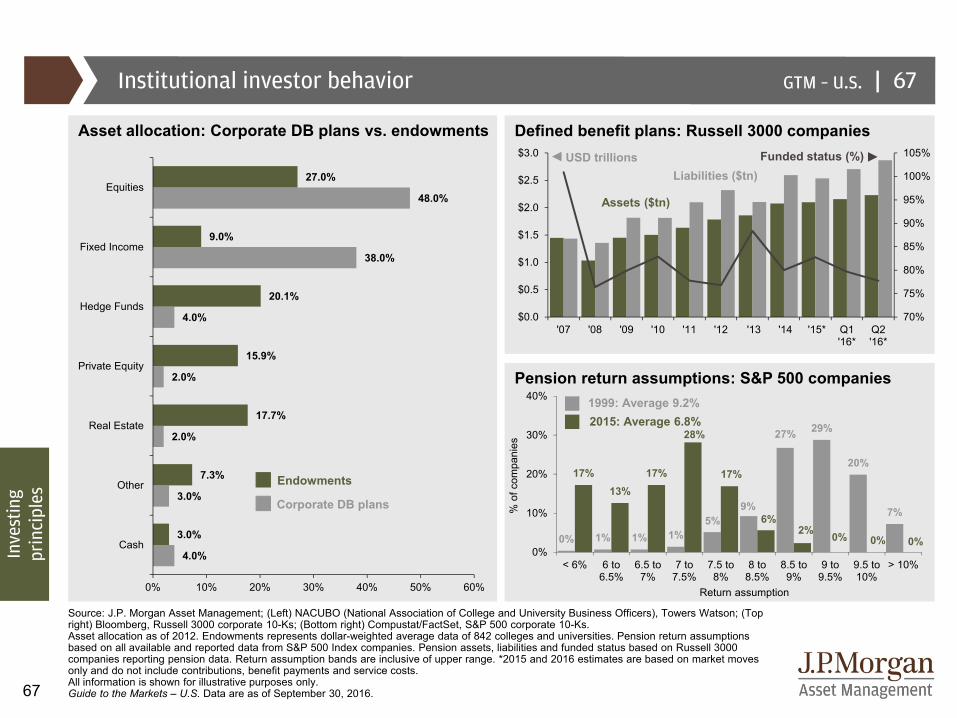
|GTM – U.S.
67
70%
75%
80%
85%
90%
95%
100%
105%
$0.0
$0.5
$1.0
$1.5
$2.0
$2.5
$3.0
'07 '08 '09 '10 '11 '12 '13 '14 '15* Q1'16*
Q2'16*
0% 1% 1% 1%5%
9%
27% 29%
20%
7%
17%13%
17%
28%
17%
6%2% 0% 0% 0%
0%
10%
20%
30%
40%
< 6% 6 to6.5%
6.5 to7%
7 to7.5%
7.5 to8%
8 to8.5%
8.5 to9%
9 to9.5%
9.5 to10%
> 10%4.0%
3.0%
2.0%
2.0%
4.0%
38.0%
48.0%
3.0%
7.3%
17.7%
15.9%
20.1%
9.0%
27.0%
0% 10% 20% 30% 40% 50% 60%
Cash
Other
Real Estate
Private Equity
Hedge Funds
Fixed Income
Equities
Source: J.P. Morgan Asset Management; (Left) NACUBO (National Association of College and University Business Officers), Towers Watson; (Top right) Bloomberg, Russell 3000 corporate 10-Ks; (Bottom right) Compustat/FactSet, S&P 500 corporate 10-Ks.Asset allocation as of 2012. Endowments represents dollar-weighted average data of 842 colleges and universities. Pension return assumptions based on all available and reported data from S&P 500 Index companies. Pension assets, liabilities and funded status based on Russell 3000 companies reporting pension data. Return assumption bands are inclusive of upper range. *2015 and 2016 estimates are based on market moves only and do not include contributions, benefit payments and service costs.All information is shown for illustrative purposes only. Guide to the Markets – U.S. Data are as of September 30, 2016.
Institutional investor behavior 67
Asset allocation: Corporate DB plans vs. endowments
Endowments
Corporate DB plans
Funded status (%)
Assets ($tn)
Liabilities ($tn)
Defined benefit plans: Russell 3000 companies
Pension return assumptions: S&P 500 companies
Return assumption
% o
f com
pani
es
2015: Average 6.8%1999: Average 9.2%
USD trillions
Inve
stin
gpr
inci
ples
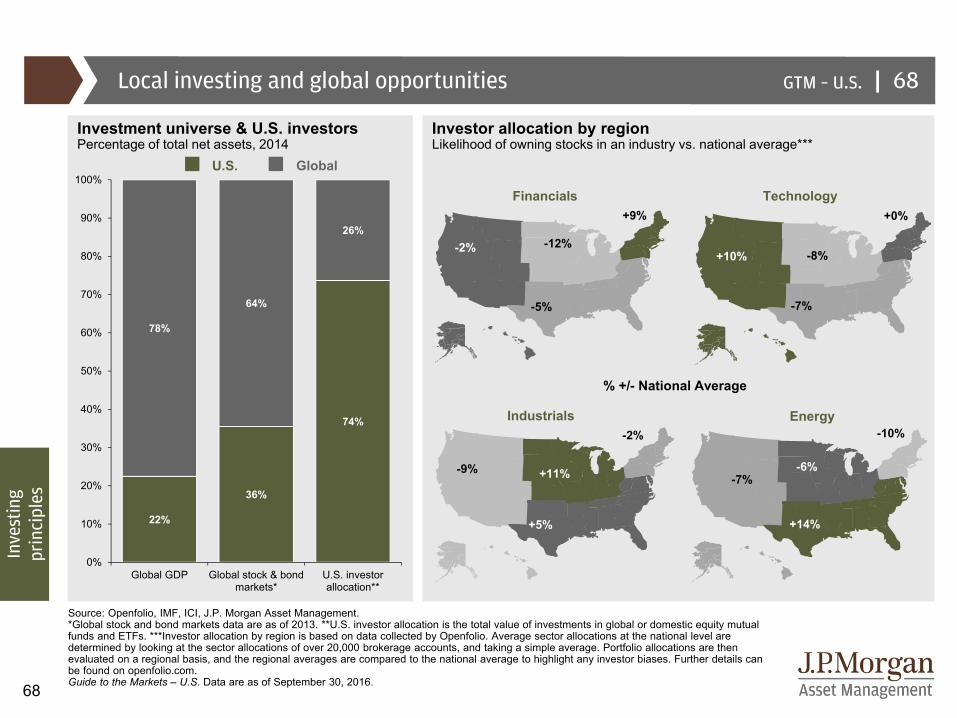
|GTM – U.S.
68
|
Source: Openfolio, IMF, ICI, J.P. Morgan Asset Management.*Global stock and bond markets data are as of 2013. **U.S. investor allocation is the total value of investments in global or domestic equity mutual funds and ETFs. ***Investor allocation by region is based on data collected by Openfolio. Average sector allocations at the national level are determined by looking at the sector allocations of over 20,000 brokerage accounts, and taking a simple average. Portfolio allocations are then evaluated on a regional basis, and the regional averages are compared to the national average to highlight any investor biases. Further details can be found on openfolio.com. Guide to the Markets – U.S. Data are as of September 30, 2016.
Local investing and global opportunities
Investor allocation by regionLikelihood of owning stocks in an industry vs. national average***
Investment universe & U.S. investorsPercentage of total net assets, 2014
68
Inve
stin
gpr
inci
ples
Financials Technology
Industrials Energy
+10%
-7%
-8%
+0%
-10%
+14%
-6%-7%
+9%
-5%
-12%-2%
+11%
-2%
+5%
-9%
U.S. Global
% +/- National Average
22%
36%
74%
78%
64%
26%
0%
10%
20%
30%
40%
50%
60%
70%
80%
90%
100%
Global GDP Global stock & bondmarkets*
U.S. investorallocation**
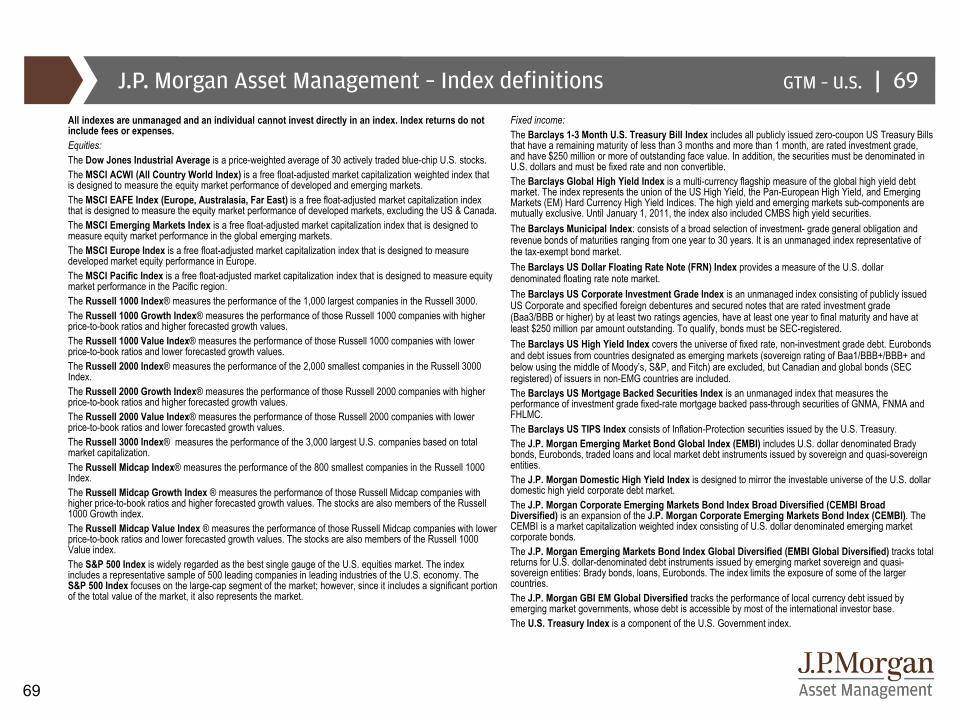
|GTM – U.S.
69
J.P. Morgan Asset Management – Index definitionsAll indexes are unmanaged and an individual cannot invest directly in an index. Index returns do not include fees or expenses.Equities:The Dow Jones Industrial Average is a price-weighted average of 30 actively traded blue-chip U.S. stocks.The MSCI ACWI (All Country World Index) is a free float-adjusted market capitalization weighted index that is designed to measure the equity market performance of developed and emerging markets. The MSCI EAFE Index (Europe, Australasia, Far East) is a free float-adjusted market capitalization index that is designed to measure the equity market performance of developed markets, excluding the US & Canada.The MSCI Emerging Markets Index is a free float-adjusted market capitalization index that is designed to measure equity market performance in the global emerging markets.The MSCI Europe Index is a free float-adjusted market capitalization index that is designed to measure developed market equity performance in Europe.The MSCI Pacific Index is a free float-adjusted market capitalization index that is designed to measure equity market performance in the Pacific region.The Russell 1000 Index® measures the performance of the 1,000 largest companies in the Russell 3000. The Russell 1000 Growth Index® measures the performance of those Russell 1000 companies with higher price-to-book ratios and higher forecasted growth values. The Russell 1000 Value Index® measures the performance of those Russell 1000 companies with lower price-to-book ratios and lower forecasted growth values.The Russell 2000 Index® measures the performance of the 2,000 smallest companies in the Russell 3000 Index.The Russell 2000 Growth Index® measures the performance of those Russell 2000 companies with higher price-to-book ratios and higher forecasted growth values. The Russell 2000 Value Index® measures the performance of those Russell 2000 companies with lower price-to-book ratios and lower forecasted growth values. The Russell 3000 Index® measures the performance of the 3,000 largest U.S. companies based on total market capitalization. The Russell Midcap Index® measures the performance of the 800 smallest companies in the Russell 1000 Index.The Russell Midcap Growth Index ® measures the performance of those Russell Midcap companies with higher price-to-book ratios and higher forecasted growth values. The stocks are also members of the Russell 1000 Growth index. The Russell Midcap Value Index ® measures the performance of those Russell Midcap companies with lower price-to-book ratios and lower forecasted growth values. The stocks are also members of the Russell 1000 Value index.The S&P 500 Index is widely regarded as the best single gauge of the U.S. equities market. The index includes a representative sample of 500 leading companies in leading industries of the U.S. economy. The S&P 500 Index focuses on the large-cap segment of the market; however, since it includes a significant portion of the total value of the market, it also represents the market.
Fixed income:The Barclays 1-3 Month U.S. Treasury Bill Index includes all publicly issued zero-coupon US Treasury Bills that have a remaining maturity of less than 3 months and more than 1 month, are rated investment grade, and have $250 million or more of outstanding face value. In addition, the securities must be denominated in U.S. dollars and must be fixed rate and non convertible.The Barclays Global High Yield Index is a multi-currency flagship measure of the global high yield debt market. The index represents the union of the US High Yield, the Pan-European High Yield, and Emerging Markets (EM) Hard Currency High Yield Indices. The high yield and emerging markets sub-components are mutually exclusive. Until January 1, 2011, the index also included CMBS high yield securities. The Barclays Municipal Index: consists of a broad selection of investment- grade general obligation and revenue bonds of maturities ranging from one year to 30 years. It is an unmanaged index representative of the tax-exempt bond market.The Barclays US Dollar Floating Rate Note (FRN) Index provides a measure of the U.S. dollar denominated floating rate note market.The Barclays US Corporate Investment Grade Index is an unmanaged index consisting of publicly issued US Corporate and specified foreign debentures and secured notes that are rated investment grade (Baa3/BBB or higher) by at least two ratings agencies, have at least one year to final maturity and have at least $250 million par amount outstanding. To qualify, bonds must be SEC-registered.The Barclays US High Yield Index covers the universe of fixed rate, non-investment grade debt. Eurobonds and debt issues from countries designated as emerging markets (sovereign rating of Baa1/BBB+/BBB+ and below using the middle of Moody’s, S&P, and Fitch) are excluded, but Canadian and global bonds (SEC registered) of issuers in non-EMG countries are included.The Barclays US Mortgage Backed Securities Index is an unmanaged index that measures the performance of investment grade fixed-rate mortgage backed pass-through securities of GNMA, FNMA and FHLMC.The Barclays US TIPS Index consists of Inflation-Protection securities issued by the U.S. Treasury.The J.P. Morgan Emerging Market Bond Global Index (EMBI) includes U.S. dollar denominated Brady bonds, Eurobonds, traded loans and local market debt instruments issued by sovereign and quasi-sovereign entities.The J.P. Morgan Domestic High Yield Index is designed to mirror the investable universe of the U.S. dollar domestic high yield corporate debt market. The J.P. Morgan Corporate Emerging Markets Bond Index Broad Diversified (CEMBI Broad Diversified) is an expansion of the J.P. Morgan Corporate Emerging Markets Bond Index (CEMBI). The CEMBI is a market capitalization weighted index consisting of U.S. dollar denominated emerging market corporate bonds. The J.P. Morgan Emerging Markets Bond Index Global Diversified (EMBI Global Diversified) tracks total returns for U.S. dollar-denominated debt instruments issued by emerging market sovereign and quasi-sovereign entities: Brady bonds, loans, Eurobonds. The index limits the exposure of some of the larger countries.The J.P. Morgan GBI EM Global Diversified tracks the performance of local currency debt issued by emerging market governments, whose debt is accessible by most of the international investor base.The U.S. Treasury Index is a component of the U.S. Government index.
69

|GTM – U.S.
70
J.P. Morgan Asset Management – Index definitions & disclosuresOther asset classes:The Alerian MLP Index is a composite of the 50 most prominent energy Master Limited Partnerships (MLPs) that provides investors with an unbiased, comprehensive benchmark for the asset class.The Bloomberg Commodity Index and related sub-indices are composed of futures contracts on physical commodities and represents twenty two separate commodities traded on U.S. exchanges, with the exception of aluminum, nickel, and zincThe Cambridge Associates U.S. Global Buyout and Growth Index® is based on data compiled from 1,768 global (U.S. & ex – U.S.) buyout and growth equity funds, including fully liquidated partnerships, formed between 1986 and 2013.The CS/Tremont Hedge Fund Index is compiled by Credit Suisse Tremont Index, LLC. It is an asset-weighted hedge fund index and includes only funds, as opposed to separate accounts. The Index uses the Credit Suisse/Tremont database, which tracks over 4500 funds, and consists only of funds with a minimum of US$50 million under management, a 12-month track record, and audited financial statements. It is calculated and rebalanced on a monthly basis, and shown net of all performance fees and expenses. It is the exclusive property of Credit Suisse Tremont Index, LLC.The HFRI Monthly Indices (HFRI) are equally weighted performance indexes, utilized by numerous hedge fund managers as a benchmark for their own hedge funds. The HFRI are broken down into 4 main strategies, each with multiple sub strategies. All single-manager HFRI Index constituents are included in the HFRI Fund Weighted Composite, which accounts for over 2200 funds listed on the internal HFR Database.The NAREIT EQUITY REIT Index is designed to provide the most comprehensive assessment of overall industry performance, and includes all tax-qualified real estate investment trusts (REITs) that are listed on the NYSE, the American Stock Exchange or the NASDAQ National Market List.The NFI-ODCE, short for NCREIF Fund Index - Open End Diversified Core Equity, is an index of investment returns reporting on both a historical and current basis the results of 33 open-end commingled funds pursuing a core investment strategy, some of which have performance histories dating back to the 1970s. The NFI-ODCE Index is capitalization-weighted and is reported gross of fees. Measurement is time-weighted.Definitions:Investing in alternative assets involves higher risks than traditional investments and is suitable only for sophisticated investors. Alternative investments involve greater risks than traditional investments and should not be deemed a complete investment program. They are not tax efficient and an investor should consult with his/her tax advisor prior to investing. Alternative investments have higher fees than traditional investments and they may also be highly leveraged and engage in speculative investment techniques, which can magnify the potential for investment loss or gain. The value of the investment may fall as well as rise and investors may get back less than they invested.Bonds are subject to interest rate risks. Bond prices generally fall when interest rates rise.Investments in commodities may have greater volatility than investments in traditional securities, particularly if the instruments involve leverage. The value of commodity-linked derivative instruments may be affected by changes in overall market movements, commodity index volatility, changes in interest rates, or factors affecting a particular industry or commodity, such as drought, floods, weather, livestock disease, embargoes, tariffs and international economic, political and regulatory developments. Use of leveraged commodity-linked derivatives creates an opportunity for increased return but, at the same time, creates the possibility for greater loss.Derivatives may be riskier than other types of investments because they may be more sensitive to changes in economic or market conditions than other types of investments and could result in losses that significantly exceed the original investment. The use of derivatives may not be successful, resulting in investment losses, and the cost of such strategies may reduce investment returns. Distressed Restructuring Strategies employ an investment process focused on corporate fixed income instruments, primarily on corporate credit instruments of companies trading at significant discounts to their value at issuance or obliged (par value) at maturity as a result of either formal bankruptcy proceeding or financial market perception of near term proceedings.
70Investments in emerging markets can be more volatile. The normal risks of investing in foreign countries are heightened when investing in emerging markets. In addition, the small size of securities markets and the low trading volume may lead to a lack of liquidity, which leads to increased volatility. Also, emerging markets may not provide adequate legal protection for private or foreign investment or private property.The price of equity securities may rise, or fall because of changes in the broad market or changes in a company’s financial condition, sometimes rapidly or unpredictably. These price movements may result from factors affecting individual companies, sectors or industries, or the securities market as a whole, such as changes in economic or political conditions. Equity securities are subject to “stock market risk” meaning that stock prices in general may decline over short or extended periods of time.Equity market neutral strategies employ sophisticated quantitative techniques of analyzing price data to ascertain information about future price movement and relationships between securities, select securities for purchase and sale. Equity Market Neutral Strategies typically maintain characteristic net equity market exposure no greater than 10% long or short.Global macro strategies trade a broad range of strategies in which the investment process is predicated on movements in underlying economic variables and the impact these have on equity, fixed income, hard currency and commodity markets.International investing involves a greater degree of risk and increased volatility. Changes in currency exchange rates and differences in accounting and taxation policies outside the U.S. can raise or lower returns. Some overseas markets may not be as politically and economically stable as the United States and other nations.There is no guarantee that the use of long and short positions will succeed in limiting an investor's exposure to domestic stock market movements, capitalization, sector swings or other risk factors. Using long and short selling strategies may have higher portfolio turnover rates. Short selling involves certain risks, including additional costs associated with covering short positions and a possibility of unlimited loss on certain short sale positions.Merger arbitrage strategies which employ an investment process primarily focused on opportunities in equity and equity related instruments of companies which are currently engaged in a corporate transaction.Mid-capitalization investing typically carries more risk than investing in well-established "blue-chip" companies. Historically, mid-cap companies' stock has experienced a greater degree of market volatility than the average stock.Price to forward earnings is a measure of the price-to-earnings ratio (P/E) using forecasted earnings. Price to book value compares a stock's market value to its book value. Price to cash flow is a measure of the market's expectations of a firm's future financial health. Price to dividends is the ratio of the price of a share on a stock exchange to the dividends per share paid in the previous year, used as a measure of a company's potential as an investment.Real estate investments may be subject to a higher degree of market risk because of concentration in a specific industry, sector or geographical sector. Real estate investments may be subject to risks including, but not limited to, declines in the value of real estate, risks related to general and economic conditions, changes in the value of the underlying property owned by the trust and defaults by borrower.Relative Value Strategies maintain positions in which the investment thesis is predicated on realization of a valuation discrepancy in the relationship between multiple securities. Small-capitalization investing typically carries more risk than investing in well-established "blue-chip" companies since smaller companies generally have a higher risk of failure. Historically, smaller companies' stock has experienced a greater degree of market volatility than the average stock.

|GTM – U.S.
71
J.P. Morgan Asset Management – Risks & disclosures
The Market Insights program provides comprehensive data and commentary on global markets without reference to products. Designed as a tool to help clients understand the markets and support investment decision-making, the program explores the implications of current economic data and changing market conditions. The views contained herein are not to be taken as an advice or a recommendation to buy or sell any investment in any jurisdiction, nor is it a commitment from J.P. Morgan Asset Management or any of its subsidiaries to participate in any of the transactions mentioned herein. Any forecasts, figures, opinions or investment techniques and strategies set out are for information purposes only, based on certain assumptions and current market conditions and are subject to change without prior notice. All information presented herein is considered to be accurate at the time of production, but no warranty of accuracy is given and no liability in respect of any error or omission is accepted. This material does not contain sufficient information to support an investment decision and it should not be relied upon by you in evaluating the merits of investing in any securities or products. In addition, users should make an independent assessment of the legal, regulatory, tax, credit, and accounting implications and determine, together with their own professional advisers, if any investment mentioned herein is believed to be suitable to their personal goals. Investors should ensure that they obtain all available relevant information before making any investment. It should be noted that investment involves risks, the value of investments and the income from them may fluctuate in accordance with market conditions and taxation agreements and investors may not get back the full amount invested. Both past performance and yield may not be a reliable guide to future performance.J.P. Morgan Asset Management is the brand for the asset management business of JPMorgan Chase & Co. and its affiliates worldwide. This communication is issued by the following entities: in the United Kingdom by JPMorgan Asset Management (UK) Limited, which is authorized and regulated by the Financial Conduct Authority; in other EU jurisdictions by JPMorgan Asset Management (Europe) S.à r.l.; in Hong Kong by JF Asset Management Limited, or JPMorgan Funds (Asia) Limited, or JPMorgan Asset Management Real Assets (Asia) Limited; in India by JPMorgan Asset Management India Private Limited; in Singapore by JPMorgan Asset Management (Singapore) Limited, or JPMorgan Asset Management Real Assets (Singapore) Pte Ltd; in Taiwan by JPMorgan Asset Management (Taiwan) Limited; in Japan by JPMorgan Asset Management (Japan) Limited which is a member of the Investment Trusts Association, Japan, the Japan Investment Advisers Association, Type II Financial Instruments Firms Association and the Japan Securities Dealers Association and is regulated by the Financial Services Agency (registration number “Kanto Local Finance Bureau (Financial Instruments Firm) No. 330”); in Korea by JPMorgan Asset Management (Korea) Company Limited; in Australia to wholesale clients only as defined in section 761A and 761G of the Corporations Act 2001 (Cth) by JPMorgan Asset Management (Australia) Limited (ABN 55143832080) (AFSL 376919); in Brazil by Banco J.P. Morgan S.A.; in Canada for institutional clients’ use only by JPMorgan Asset Management (Canada) Inc., and in the United States by JPMorgan Distribution Services Inc. and J.P. Morgan Institutional Investments, Inc., both members of FINRA/SIPC.; and J.P. Morgan Investment Management Inc.
In APAC, distribution is for Hong Kong, Taiwan, Japan and Singapore. For all other countries in APAC, to intended recipients only.
Prepared by: Andrew D. Goldberg, Anastasia V. Amoroso, Samantha M. Azzarello, Gabriela D. Santos, David M. Lebovitz, Hannah J. Anderson, Abigail B. Dwyer, Ainsley E. Woolridge, John C. Manley and David P. Kelly.
Unless otherwise stated, all data are as of September 30, 2016 or most recently available.
Guide to the Markets – U.S.
JP-LITTLEBOOK | 0903c02a815e57da
Copyright 2016 JPMorgan Chase & Co. All rights reserved
71