market benefits of heywood upgrade benefits of heywood... · ii frontier economics | june 2013...
TRANSCRIPT

© Frontier Economics Pty. Ltd., Australia.
Market benefits of Heywood upgrade A REPORT PREPARED FOR MACQUARIE GENERATION
May 2013

i Frontier Economics | April 2013 FINAL REPORT
Contents 13-04-19 Market benefits of Heywood upgrade - Final Report - STC
Market benefits of Heywood upgrade
1 Introduction 1
1.1 Background 1
1.2 Structure of report 2
2 Analysis of ElectraNet and AEMO’s findings 3
2.1 Gross market benefits 3
2.2 Impact on plant investment and retirement 4
2.3 Impact on plant dispatch 7
2.4 Impact on VIC-SA flows 9
3 Assumptions key to Frontier’s analysis 11
3.1 Demand growth 11
3.2 Carbon price and LRET target 12
3.3 Fuel prices 13
3.4 Transmission network capability 14
3.5 Existing and committed plant capacity and operating parameters 14
3.6 Entrant plant capital costs and operating parameters 15
4 Frontier’s assessment of market benefits 16
4.1 Overview of WHIRLYGIG 16
4.2 Frontier’s estimate of gross market benefits of Option 1b 17
4.3 Source of differences between AEMO and Frontier’s results 20
5 Conclusions and next steps 27
5.1 Summary of Frontier’s findings 27
5.2 Questions in relation to AEMO’s work 28
ii Frontier Economics | June 2013 FINAL REPORT
Tables and figures Final
Market benefits of Heywood upgrade
Boxes
No table of figures entries found.
Figures
Figure 1: Gross market benefits – Option 1b, Revised Central scenario 3
Figure 2: Breakdown of gross market benefits – Option 1b, Revised Central
scenario 4
Figure 3: Change in annual investment (MW) – Option 1b, Revised Central
scenario 5
Figure 4: Change in investment (MW) and capital cost savings ($m) 6
Figure 5: Change in annual dispatch (GWh) – Option 1b, Revised Central
scenario 7
Figure 6: Change in dispatch (GWh) and operating cost savings ($m) for key
plant 8
Figure 7: Implied VIC-SA flows (GWh) – Option 1b, Revised Central scenario
9
Figure 8: Assumed energy demand growth (GWh) 12
Figure 9: Assumed fuel prices of key plant 13
Figure 10: Model inputs and outputs 16
Figure 11: Frontier’s gross market benefits – Option 1b, Revised Central
scenario 17
Figure 12: Change in dispatch (GWh) 18
Figure 13: Change in investment (GWh) 18
Figure 14: Frontier’s gross market benefits - breakdown 19
Figure 15: Change in VIC-SA flows (GWh) 20
Figure 16: Inferred operating cost benefits using ElectraNet/AEMO pattern of
dispatch 23
Figure 17: “Order-of-magnitude” impact of congestion below notional limits 25
Tables
No table of figures entries found.
FINAL REPORT June 2013 | Frontier Economics 1
Final Introduction
1 Introduction
Frontier Economics (Frontier) has been engaged by Macquarie Generation to
independently assess the forecast gross market benefits of an upgrade to the
Heywood Interconnector between Victoria and South Australia proposed by
ElectraNet and AEMO. This report presents the findings of our analysis and
highlights a number of areas where further information is required before it is
possible to come to a robust conclusion on the merits of the proposed upgrade.
1.1 Background
In January 2013, ElectraNet and AEMO jointly published a Regulatory
Investment Test for Transmission (RIT-T) Project Assessment Conclusions
Report (PACR) that examined a number of options for augmenting the
Heywood Interconnector.1 The PACR found that the „preferred option‟, which
yielded the highest net market benefits under the RIT-T was Option 1b. This
option involves three key elements:
● Installation of a third 500/275 kV transformer at Heywood in South
Australia and a 500 kV bus tie in Victoria
● Reconfiguration of the 132 kV network in south-east South Australia
● Series compensation of the Tailem Bend to south east South Australia 275
kV double-circuit lines at Black Range.2
According to the PACR, development of this option would enable an increase in
the nominal capacity of the Heywood interconnector of 190 MW in both
directions, from 460 MW to 650 MW and relax existing constraints that often
limit interconnector flows below the current nominal capacity.3
Frontier has reviewed the analysis Option 1b in the PACR and undertaken high-
level modelling of the option using assumptions similar to those in ElectraNet
and AEMO‟s “Revised Central” scenario. This scenario incorporates the most
up-to-date and realistic assumptions for electricity demand and carbon pricing of
all the scenarios considered in the PACR.
1 ElectraNet-AEMO, South Australia – Victoria (Heywood) Interconnector Upgrade, RIT-T: Project Assessment
Conclusions Report, January 2013.
2 PACR, p.29.
3 PACR, p.24.
2 Frontier Economics | June 2013 FINAL REPORT
Introduction Final
This report describes our preliminary findings from:
Analysing the source and drivers of the purported gross market benefits of
Option 1b as reported by ElectraNet and AEMO based on information
released with the PACR
Based on the same input assumptions used by ElectraNet and AEMO in the
PACR, independently quantifying the gross market benefits of Option 1b
using WHIRLYGIG, Frontier‟s least-cost investment and dispatch electricity
market model.
1.2 Structure of report
The remainder of this report is structured as follows:
● Section 2 provides our analysis of ElectraNet and AEMO‟s PACR findings
● Section 3 outlines the assumptions we employed in our modelling
● Section 4 discusses our assessment of market benefits of the proposed
upgrade
● Section 5 summarises our findings and suggests some questions to put to
ElectraNet and AEMO.
FINAL REPORT June 2013 | Frontier Economics 3
Final Analysis of ElectraNet and AEMO’s findings
2 Analysis of ElectraNet and AEMO’s findings
This section recounts and analyses AEMO‟s quantification of gross market
benefits of Option 1b under the Revised Central scenario. The source of the data
used in this analysis is that outlined in the data appendix4 to the PACR.
2.1 Gross market benefits
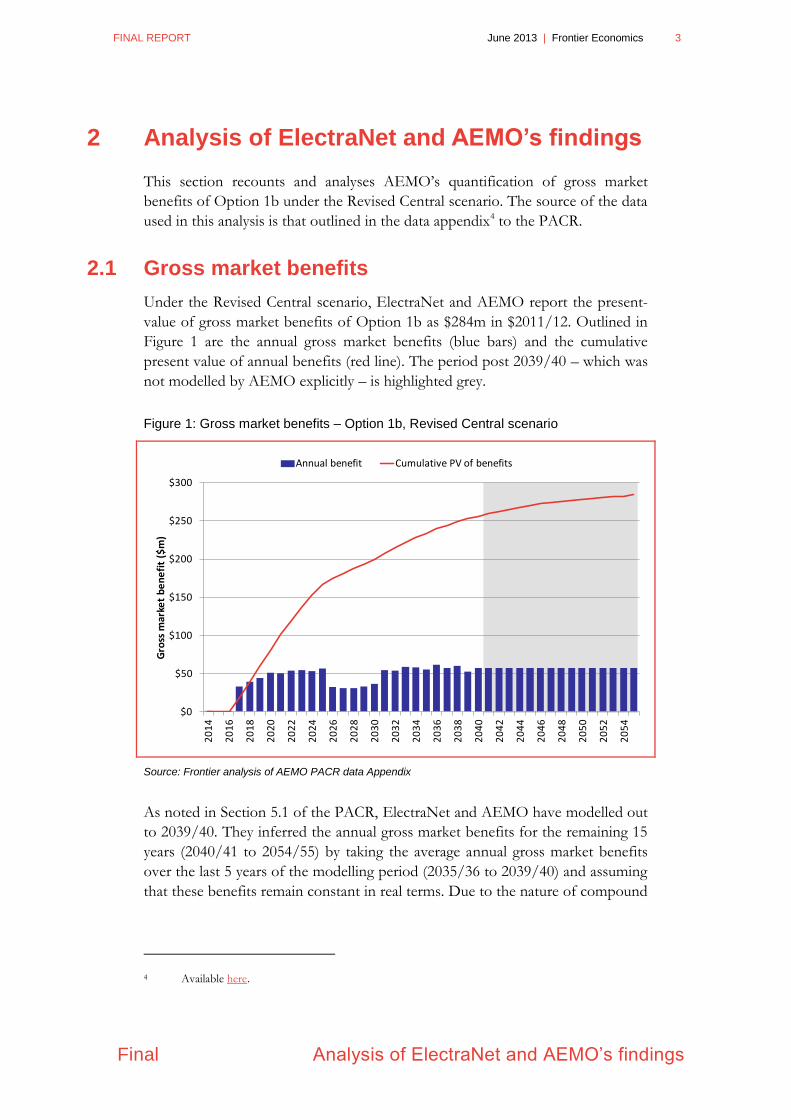
Under the Revised Central scenario, ElectraNet and AEMO report the present-
value of gross market benefits of Option 1b as $284m in $2011/12. Outlined in
Figure 1 are the annual gross market benefits (blue bars) and the cumulative
present value of annual benefits (red line). The period post 2039/40 – which was
not modelled by AEMO explicitly – is highlighted grey.
Figure 1: Gross market benefits – Option 1b, Revised Central scenario
Source: Frontier analysis of AEMO PACR data Appendix
As noted in Section 5.1 of the PACR, ElectraNet and AEMO have modelled out
to 2039/40. They inferred the annual gross market benefits for the remaining 15
years (2040/41 to 2054/55) by taking the average annual gross market benefits
over the last 5 years of the modelling period (2035/36 to 2039/40) and assuming
that these benefits remain constant in real terms. Due to the nature of compound
4 Available here.
$0
$50
$100
$150
$200
$250
$300
20
14
20
16
20
18
20
20
20
22
20
24
20
26
20
28
20
30
20
32
20
34
20
36
20
38
20
40
20
42
20
44
20
46
20
48
20
50
20
52
20
54
Gro
ss m
arke
t b
en
efi
t ($
m)
Annual benefit Cumulative PV of benefits
4 Frontier Economics | June 2013 FINAL REPORT
Analysis of ElectraNet and AEMO’s findings
Final
discounting, roughly 90% of present value of gross market benefits accrue before
2040.
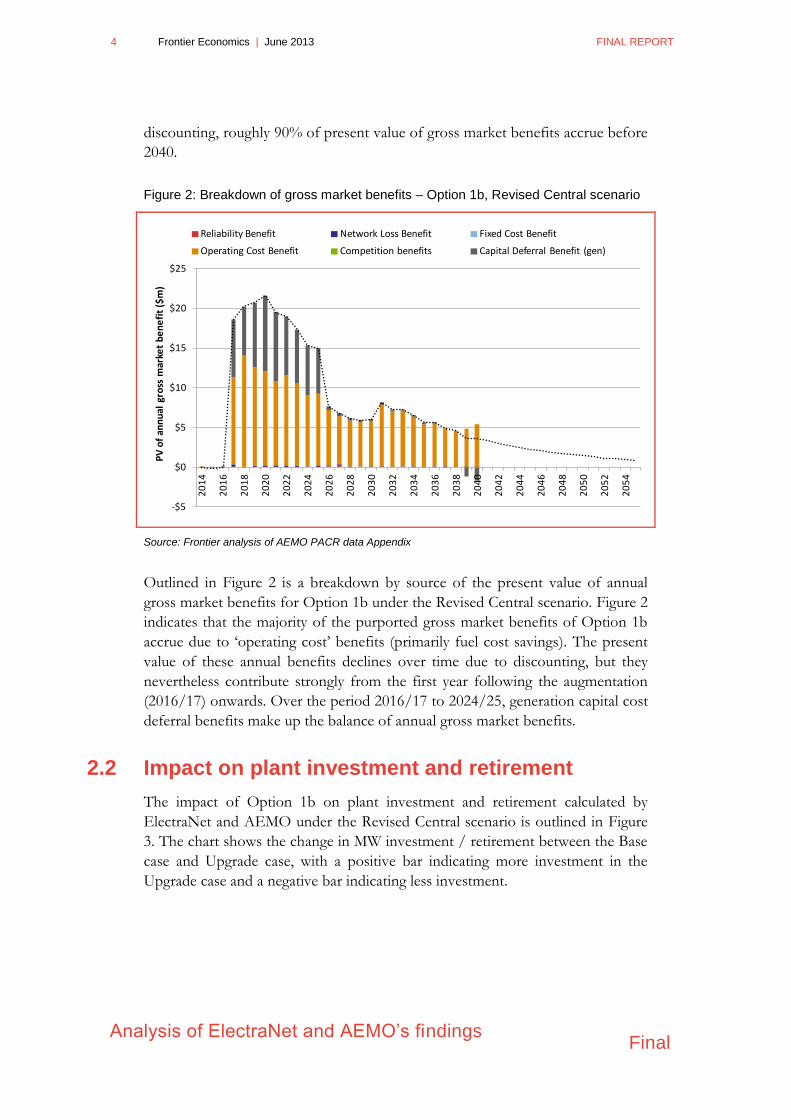
Figure 2: Breakdown of gross market benefits – Option 1b, Revised Central scenario
Source: Frontier analysis of AEMO PACR data Appendix
Outlined in Figure 2 is a breakdown by source of the present value of annual
gross market benefits for Option 1b under the Revised Central scenario. Figure 2
indicates that the majority of the purported gross market benefits of Option 1b
accrue due to „operating cost‟ benefits (primarily fuel cost savings). The present
value of these annual benefits declines over time due to discounting, but they
nevertheless contribute strongly from the first year following the augmentation
(2016/17) onwards. Over the period 2016/17 to 2024/25, generation capital cost
deferral benefits make up the balance of annual gross market benefits.
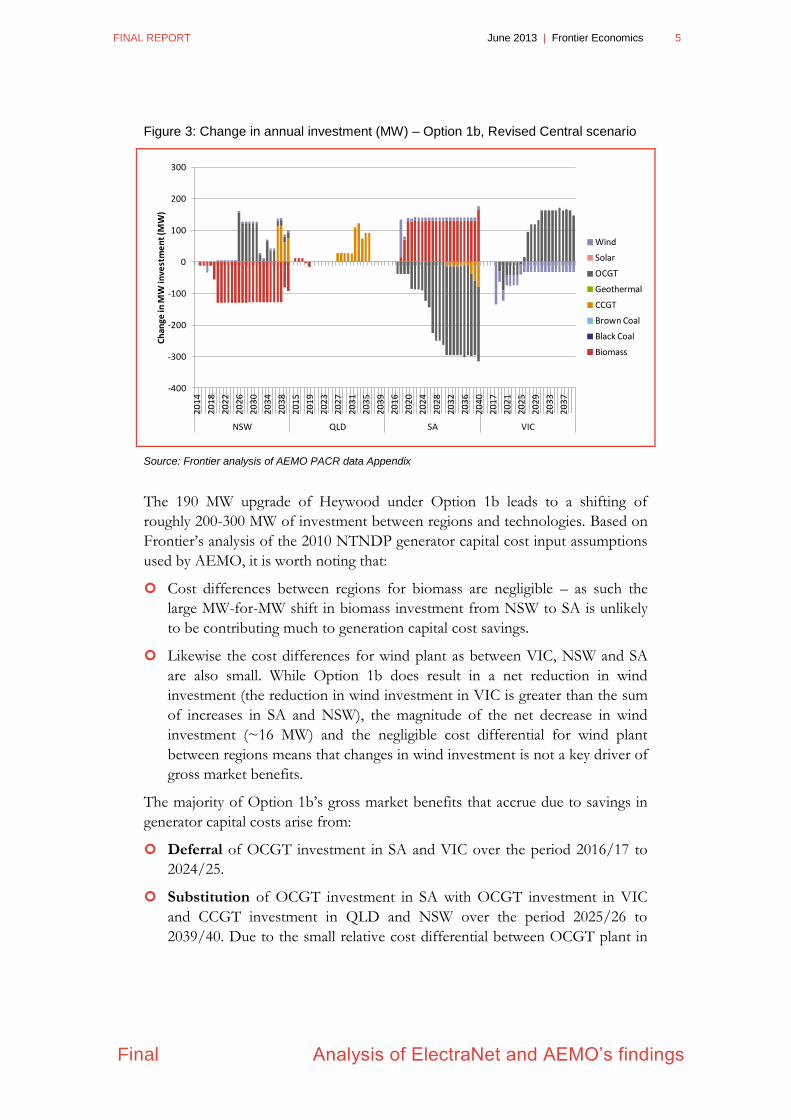
2.2 Impact on plant investment and retirement
The impact of Option 1b on plant investment and retirement calculated by
ElectraNet and AEMO under the Revised Central scenario is outlined in Figure
3. The chart shows the change in MW investment / retirement between the Base
case and Upgrade case, with a positive bar indicating more investment in the
Upgrade case and a negative bar indicating less investment.
-$5
$0
$5
$10
$15
$20
$25
20
14
20
16
20
18
20
20
20
22
20
24
20
26
20
28
20
30
20
32
20
34
20
36
20
38
20
40
20
42
20
44
20
46
20
48
20
50
20
52
20
54
PV
of
ann
ual
gro
ss m
arke
t b
en
efi
t ($
m)
Reliability Benefit Network Loss Benefit Fixed Cost Benefit
Operating Cost Benefit Competition benefits Capital Deferral Benefit (gen)
FINAL REPORT June 2013 | Frontier Economics 5
Final Analysis of ElectraNet and AEMO’s findings
Figure 3: Change in annual investment (MW) – Option 1b, Revised Central scenario
Source: Frontier analysis of AEMO PACR data Appendix
The 190 MW upgrade of Heywood under Option 1b leads to a shifting of
roughly 200-300 MW of investment between regions and technologies. Based on
Frontier‟s analysis of the 2010 NTNDP generator capital cost input assumptions
used by AEMO, it is worth noting that:
Cost differences between regions for biomass are negligible – as such the
large MW-for-MW shift in biomass investment from NSW to SA is unlikely
to be contributing much to generation capital cost savings.
Likewise the cost differences for wind plant as between VIC, NSW and SA
are also small. While Option 1b does result in a net reduction in wind
investment (the reduction in wind investment in VIC is greater than the sum
of increases in SA and NSW), the magnitude of the net decrease in wind
investment (~16 MW) and the negligible cost differential for wind plant
between regions means that changes in wind investment is not a key driver of
gross market benefits.
The majority of Option 1b‟s gross market benefits that accrue due to savings in
generator capital costs arise from:
Deferral of OCGT investment in SA and VIC over the period 2016/17 to
2024/25.
Substitution of OCGT investment in SA with OCGT investment in VIC
and CCGT investment in QLD and NSW over the period 2025/26 to
2039/40. Due to the small relative cost differential between OCGT plant in
-400
-300
-200
-100
0
100
200
300
20
14
20
18
20
22
20
26
20
30
20
34
20
38
20
15
20
19
20
23
20
27
20
31
20
35
20
39
20
16
20
20
20
24
20
28
20
32
20
36
20
40
20
17
20
21
20
25
20
29
20
33
20
37
NSW QLD SA VIC
Ch
ange
in M
W in
vest
me
nt
(MW
)
Wind
Solar
OCGT
Geothermal
CCGT
Brown Coal
Black Coal
Biomass
6 Frontier Economics | June 2013 FINAL REPORT
Analysis of ElectraNet and AEMO’s findings
Final
different regions and the bigger, but still relatively modest, capital cost
differential between OCGT and CCGT5, the benefits from capital
substitutions over this period are markedly less than the benefits of outright
capital deferral that accrue over the period 2016/17 to 2024/25.
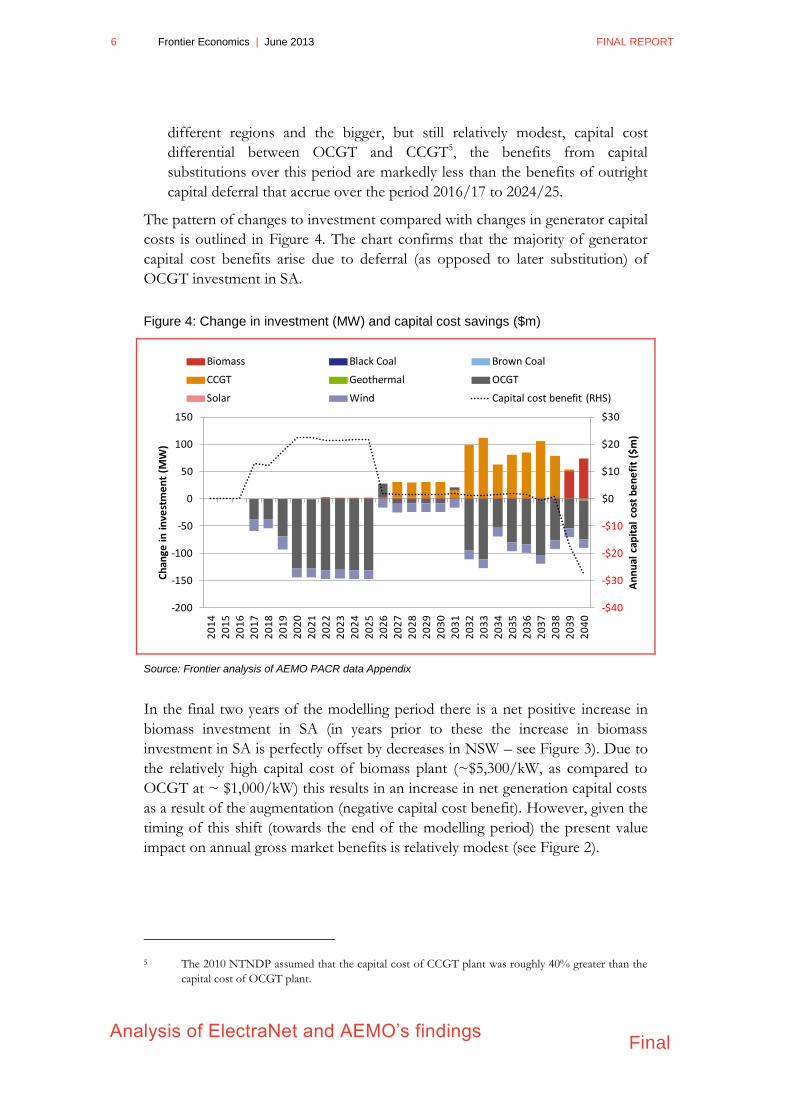
The pattern of changes to investment compared with changes in generator capital
costs is outlined in Figure 4. The chart confirms that the majority of generator
capital cost benefits arise due to deferral (as opposed to later substitution) of
OCGT investment in SA.
Figure 4: Change in investment (MW) and capital cost savings ($m)
Source: Frontier analysis of AEMO PACR data Appendix
In the final two years of the modelling period there is a net positive increase in
biomass investment in SA (in years prior to these the increase in biomass
investment in SA is perfectly offset by decreases in NSW – see Figure 3). Due to
the relatively high capital cost of biomass plant (~$5,300/kW, as compared to
OCGT at ~ $1,000/kW) this results in an increase in net generation capital costs
as a result of the augmentation (negative capital cost benefit). However, given the
timing of this shift (towards the end of the modelling period) the present value
impact on annual gross market benefits is relatively modest (see Figure 2).
5 The 2010 NTNDP assumed that the capital cost of CCGT plant was roughly 40% greater than the
capital cost of OCGT plant.
-$40
-$30
-$20
-$10
$0
$10
$20
$30
-200
-150
-100
-50
0
50
100
150
20
14
20
15
20
16
20
17
20
18
20
19
20
20
20
21
20
22
20
23
20
24
20
25
20
26
20
27
20
28
20
29
20
30
20
31
20
32
20
33
20
34
20
35
20
36
20
37
20
38
20
39
20
40
An
nu
al c
apit
al c
ost
be
ne
fit
($m
)
Ch
ange
in i
nve
stm
en
t (M
W)
Biomass Black Coal Brown Coal
CCGT Geothermal OCGT
Solar Wind Capital cost benefit (RHS)
FINAL REPORT June 2013 | Frontier Economics 7
Final Analysis of ElectraNet and AEMO’s findings
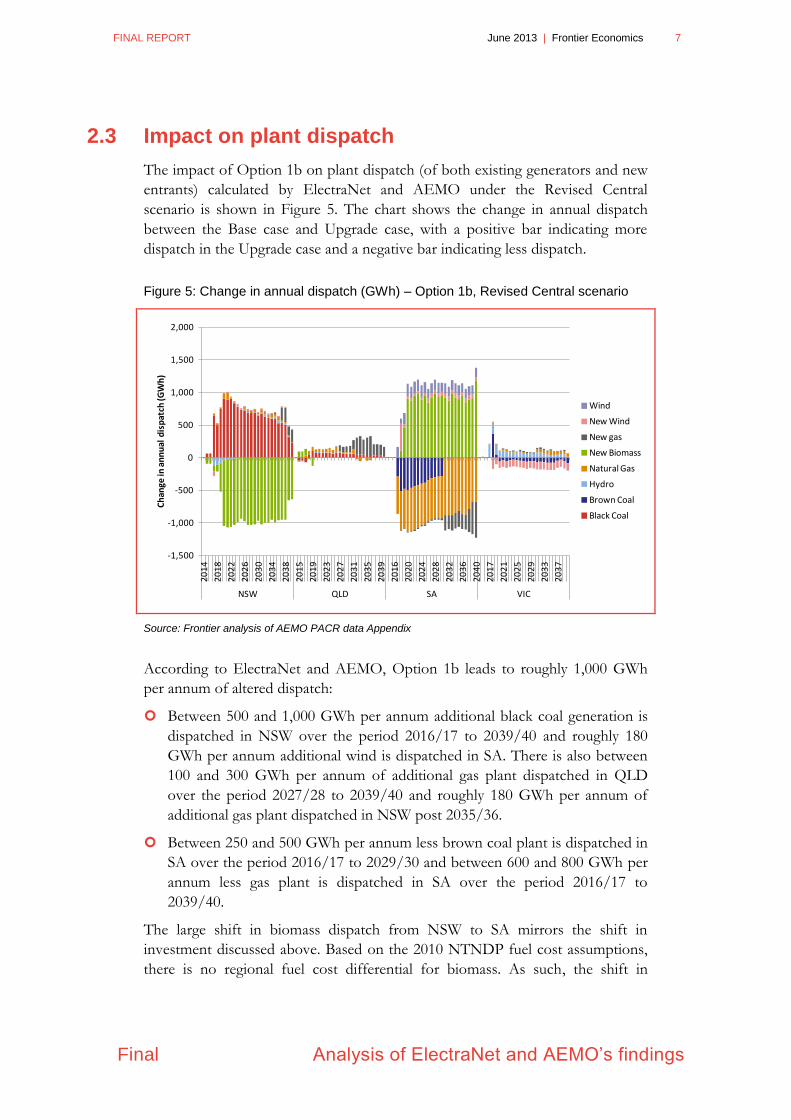
2.3 Impact on plant dispatch
The impact of Option 1b on plant dispatch (of both existing generators and new
entrants) calculated by ElectraNet and AEMO under the Revised Central
scenario is shown in Figure 5. The chart shows the change in annual dispatch
between the Base case and Upgrade case, with a positive bar indicating more
dispatch in the Upgrade case and a negative bar indicating less dispatch.
Figure 5: Change in annual dispatch (GWh) – Option 1b, Revised Central scenario
Source: Frontier analysis of AEMO PACR data Appendix
According to ElectraNet and AEMO, Option 1b leads to roughly 1,000 GWh
per annum of altered dispatch:
Between 500 and 1,000 GWh per annum additional black coal generation is
dispatched in NSW over the period 2016/17 to 2039/40 and roughly 180
GWh per annum additional wind is dispatched in SA. There is also between
100 and 300 GWh per annum of additional gas plant dispatched in QLD
over the period 2027/28 to 2039/40 and roughly 180 GWh per annum of
additional gas plant dispatched in NSW post 2035/36.
Between 250 and 500 GWh per annum less brown coal plant is dispatched in
SA over the period 2016/17 to 2029/30 and between 600 and 800 GWh per
annum less gas plant is dispatched in SA over the period 2016/17 to
2039/40.
The large shift in biomass dispatch from NSW to SA mirrors the shift in
investment discussed above. Based on the 2010 NTNDP fuel cost assumptions,
there is no regional fuel cost differential for biomass. As such, the shift in
-1,500
-1,000
-500
0
500
1,000
1,500
2,000
20
14
20
18
20
22
20
26
20
30
20
34
20
38
20
15
20
19
20
23
20
27
20
31
20
35
20
39
20
16
20
20
20
24
20
28
20
32
20
36
20
40
20
17
20
21
20
25
20
29
20
33
20
37
NSW QLD SA VIC
Ch
ange
in a
nn
ual
dis
pat
ch (G
Wh
)
Wind
New Wind
New gas
New Biomass
Natural Gas
Hydro
Brown Coal
Black Coal
8 Frontier Economics | June 2013 FINAL REPORT
Analysis of ElectraNet and AEMO’s findings
Final
biomass investment (and resulting dispatch) from NSW to SA does not appear to
be a driver of gross market benefits for the proposed upgrade.
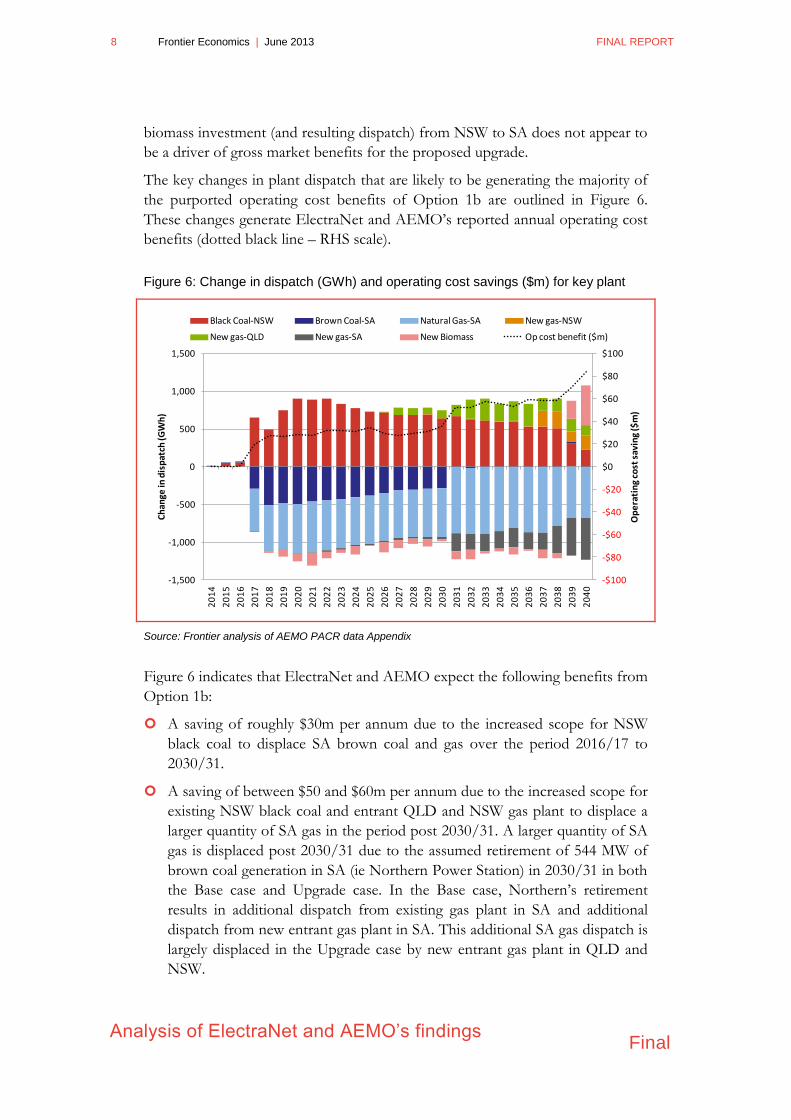
The key changes in plant dispatch that are likely to be generating the majority of
the purported operating cost benefits of Option 1b are outlined in Figure 6.
These changes generate ElectraNet and AEMO‟s reported annual operating cost
benefits (dotted black line – RHS scale).
Figure 6: Change in dispatch (GWh) and operating cost savings ($m) for key plant
Source: Frontier analysis of AEMO PACR data Appendix
Figure 6 indicates that ElectraNet and AEMO expect the following benefits from
Option 1b:
A saving of roughly $30m per annum due to the increased scope for NSW
black coal to displace SA brown coal and gas over the period 2016/17 to
2030/31.
A saving of between $50 and $60m per annum due to the increased scope for
existing NSW black coal and entrant QLD and NSW gas plant to displace a
larger quantity of SA gas in the period post 2030/31. A larger quantity of SA
gas is displaced post 2030/31 due to the assumed retirement of 544 MW of
brown coal generation in SA (ie Northern Power Station) in 2030/31 in both
the Base case and Upgrade case. In the Base case, Northern‟s retirement
results in additional dispatch from existing gas plant in SA and additional
dispatch from new entrant gas plant in SA. This additional SA gas dispatch is
largely displaced in the Upgrade case by new entrant gas plant in QLD and
NSW.
-$100
-$80
-$60
-$40
-$20
$0
$20
$40
$60
$80
$100
-1,500
-1,000
-500
0
500
1,000
1,500
20
14
20
15
20
16
20
17
20
18
20
19
20
20
20
21
20
22
20
23
20
24
20
25
20
26
20
27
20
28
20
29
20
30
20
31
20
32
20
33
20
34
20
35
20
36
20
37
20
38
20
39
20
40
Op
era
tin
g co
st s
avin
g ($
m)
Ch
ange
in d
isp
atch
(GW
h)
Black Coal-NSW Brown Coal-SA Natural Gas-SA New gas-NSW
New gas-QLD New gas-SA New Biomass Op cost benefit ($m)
FINAL REPORT June 2013 | Frontier Economics 9
Final Analysis of ElectraNet and AEMO’s findings
A saving of roughly $80m in the final year of the modelling due to the
increase in investment (and hence dispatch) of new biomass in SA. While
biomass has a high capital cost (which results in a negative capital cost benefit
in the final year – see Figure 4) it has very low operating costs, which result in
large operating cost savings relative to dispatching SA gas.
2.4 Impact on VIC-SA flows
As noted in Section 2.3, a key driver of ElectraNet and AEMO‟s purported gross
market benefits of Option 1b is the increased scope of NSW black coal to
initially displace SA brown coal and gas. In the longer term, once Northern is
assumed to retire, SA gas (existing and new entrant) continues to be displaced by
NSW black coal and entrant QLD and NSW gas plant.
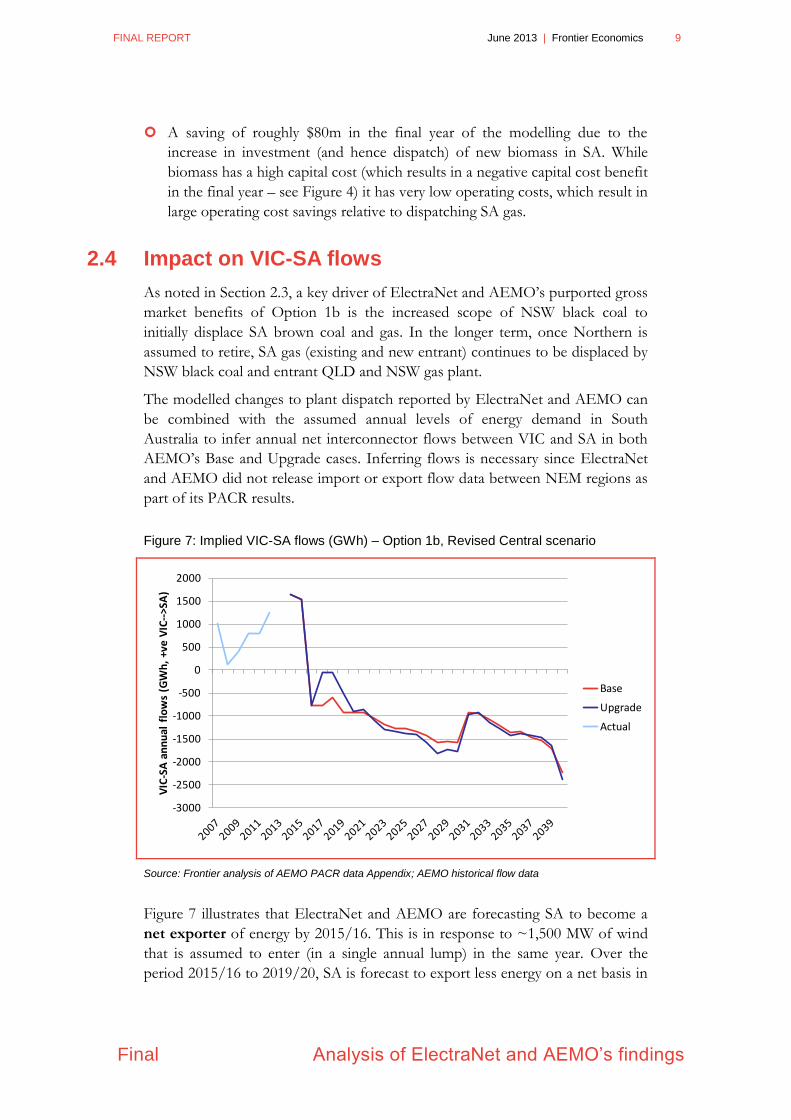
The modelled changes to plant dispatch reported by ElectraNet and AEMO can
be combined with the assumed annual levels of energy demand in South
Australia to infer annual net interconnector flows between VIC and SA in both
AEMO‟s Base and Upgrade cases. Inferring flows is necessary since ElectraNet
and AEMO did not release import or export flow data between NEM regions as
part of its PACR results.
Figure 7: Implied VIC-SA flows (GWh) – Option 1b, Revised Central scenario
Source: Frontier analysis of AEMO PACR data Appendix; AEMO historical flow data
Figure 7 illustrates that ElectraNet and AEMO are forecasting SA to become a
net exporter of energy by 2015/16. This is in response to ~1,500 MW of wind
that is assumed to enter (in a single annual lump) in the same year. Over the
period 2015/16 to 2019/20, SA is forecast to export less energy on a net basis in
-3000
-2500
-2000
-1500
-1000
-500
0
500
1000
1500
2000
VIC
-SA
an
nu
al f
low
s (G
Wh
, +v
e V
IC--
>SA
)
Base
Upgrade
Actual
10 Frontier Economics | June 2013 FINAL REPORT
Analysis of ElectraNet and AEMO’s findings
Final
the Upgrade case as compared to the Base case. Over the period 2020/21 to
2029/30, this is expected to shift such that SA is forecast to export more energy
on a net basis due to the Heywood upgrade. Beyond this point, net flows
between the Base case and Upgrade case are broadly similar.
In order for net flows to SA to remain broadly balanced while approximately
1,000 GWh of black coal generation in NSW displaces brown coal and gas
generation in SA, a similar quantity of South Australian generation must displace
generation elsewhere in the NEM. Figure 5 shows that the upgrade leads to a
shift in biomass output from NSW to SA. Based on the 2010 NTNDP‟s assumed
maximum biomass capacity factor of 90%, the shift of 130 MW of biomass
capacity from NSW to SA allows SA to import ~1,000 GWh per annum of
additional conventional energy without significantly altering its net export
position.
Given the very low operating cost and high operating capacity factor of biomass
assumed in ElectraNet and AEMO‟s modelling, the pattern of investment,
dispatch and net flows suggests that SA:
Is a net importer of energy in peak demand times – the Heywood upgrade
facilitates increased imports of NSW black coal energy at these times, causing
a reduction in SA brown coal and gas.
Is a net exporter of energy during off-peak demand times – this energy being
produced by the increased biomass plant in SA.
In sum, Option 1b facilitates increased imports at peak demand times as well as
increased exports at off-peak demand times. The overall effect on SA net exports
is relatively small. Both with and without the upgrade, SA increasingly becomes a
net exporter across the year, as wind investment continues to expand.
FINAL REPORT June 2013 | Frontier Economics 11
Final Assumptions key to Frontier’s analysis
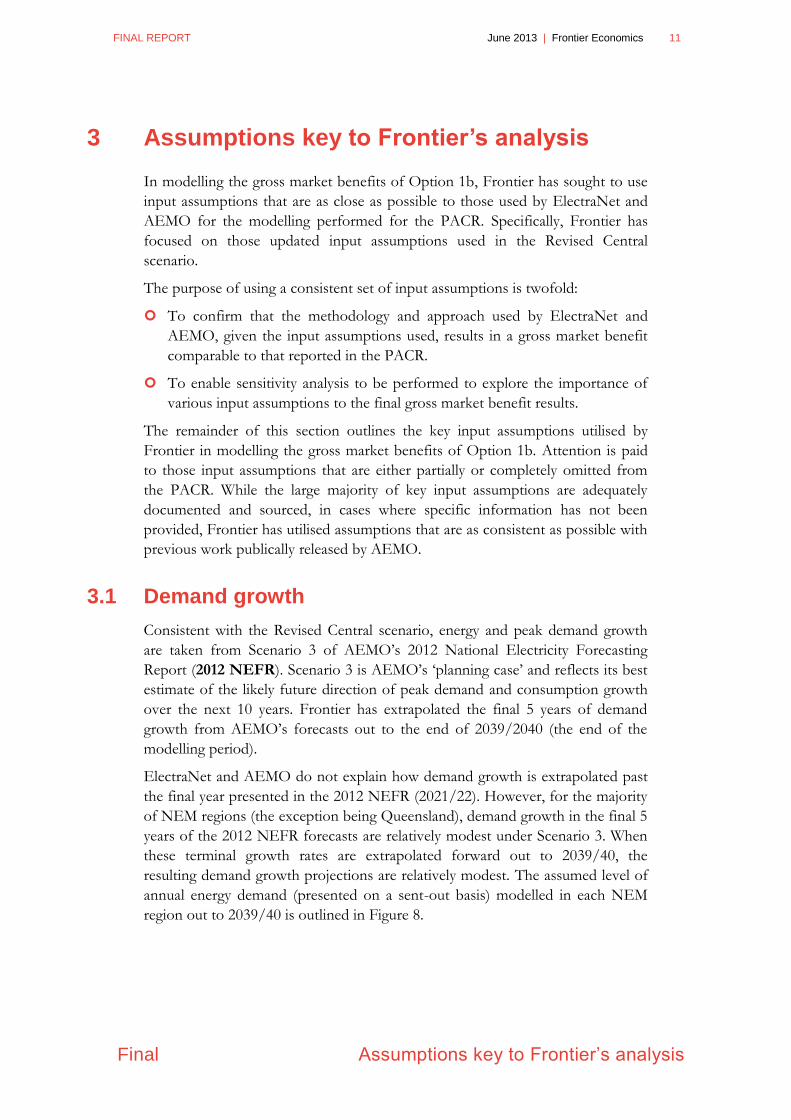
3 Assumptions key to Frontier’s analysis
In modelling the gross market benefits of Option 1b, Frontier has sought to use
input assumptions that are as close as possible to those used by ElectraNet and
AEMO for the modelling performed for the PACR. Specifically, Frontier has
focused on those updated input assumptions used in the Revised Central
scenario.
The purpose of using a consistent set of input assumptions is twofold:
To confirm that the methodology and approach used by ElectraNet and
AEMO, given the input assumptions used, results in a gross market benefit
comparable to that reported in the PACR.
To enable sensitivity analysis to be performed to explore the importance of
various input assumptions to the final gross market benefit results.
The remainder of this section outlines the key input assumptions utilised by
Frontier in modelling the gross market benefits of Option 1b. Attention is paid
to those input assumptions that are either partially or completely omitted from
the PACR. While the large majority of key input assumptions are adequately
documented and sourced, in cases where specific information has not been
provided, Frontier has utilised assumptions that are as consistent as possible with
previous work publically released by AEMO.
3.1 Demand growth
Consistent with the Revised Central scenario, energy and peak demand growth
are taken from Scenario 3 of AEMO‟s 2012 National Electricity Forecasting
Report (2012 NEFR). Scenario 3 is AEMO‟s „planning case‟ and reflects its best
estimate of the likely future direction of peak demand and consumption growth
over the next 10 years. Frontier has extrapolated the final 5 years of demand
growth from AEMO‟s forecasts out to the end of 2039/2040 (the end of the
modelling period).
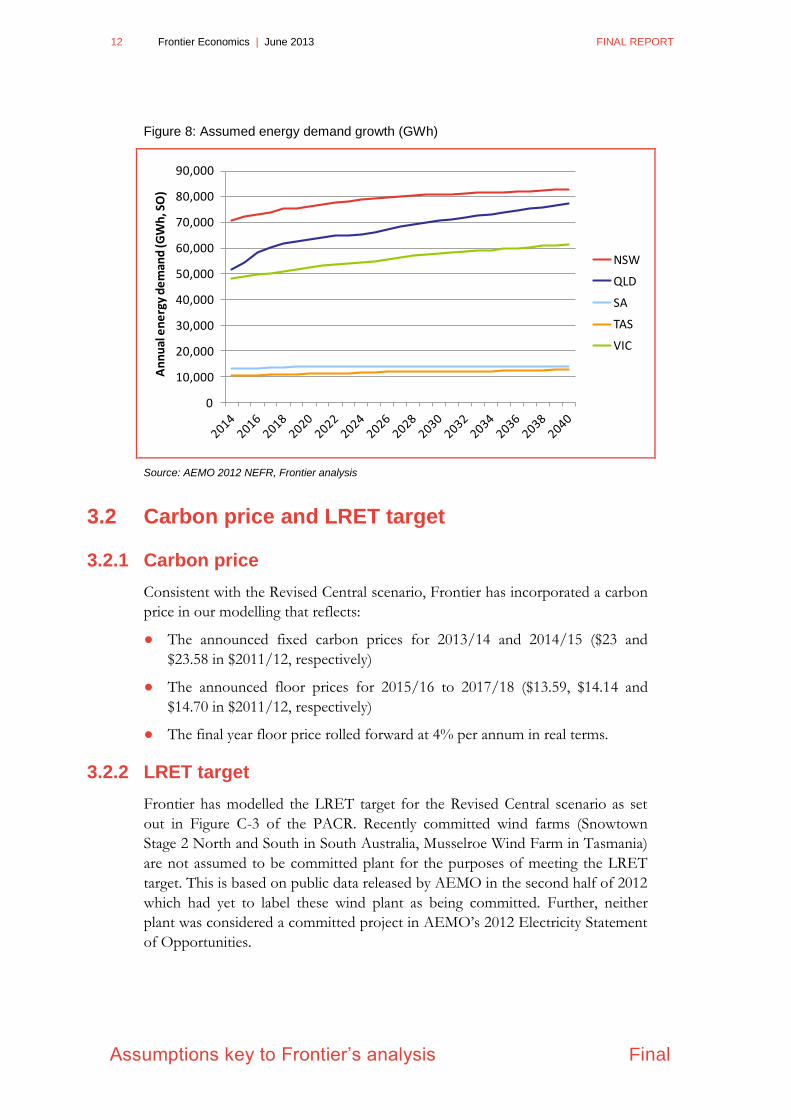
ElectraNet and AEMO do not explain how demand growth is extrapolated past
the final year presented in the 2012 NEFR (2021/22). However, for the majority
of NEM regions (the exception being Queensland), demand growth in the final 5
years of the 2012 NEFR forecasts are relatively modest under Scenario 3. When
these terminal growth rates are extrapolated forward out to 2039/40, the
resulting demand growth projections are relatively modest. The assumed level of
annual energy demand (presented on a sent-out basis) modelled in each NEM
region out to 2039/40 is outlined in Figure 8.
12 Frontier Economics | June 2013 FINAL REPORT
Assumptions key to Frontier’s analysis Final
Figure 8: Assumed energy demand growth (GWh)
Source: AEMO 2012 NEFR, Frontier analysis
3.2 Carbon price and LRET target
3.2.1 Carbon price
Consistent with the Revised Central scenario, Frontier has incorporated a carbon
price in our modelling that reflects:
● The announced fixed carbon prices for 2013/14 and 2014/15 ($23 and
$23.58 in $2011/12, respectively)
● The announced floor prices for 2015/16 to 2017/18 ($13.59, $14.14 and
$14.70 in $2011/12, respectively)
● The final year floor price rolled forward at 4% per annum in real terms.
3.2.2 LRET target
Frontier has modelled the LRET target for the Revised Central scenario as set
out in Figure C-3 of the PACR. Recently committed wind farms (Snowtown
Stage 2 North and South in South Australia, Musselroe Wind Farm in Tasmania)
are not assumed to be committed plant for the purposes of meeting the LRET
target. This is based on public data released by AEMO in the second half of 2012
which had yet to label these wind plant as being committed. Further, neither
plant was considered a committed project in AEMO‟s 2012 Electricity Statement
of Opportunities.
0
10,000
20,000
30,000
40,000
50,000
60,000
70,000
80,000
90,000A
nn
ual
en
erg
y d
em
and
(GW
h, S
O)
NSW
QLD
SA
TAS
VIC
FINAL REPORT June 2013 | Frontier Economics 13
Final Assumptions key to Frontier’s analysis
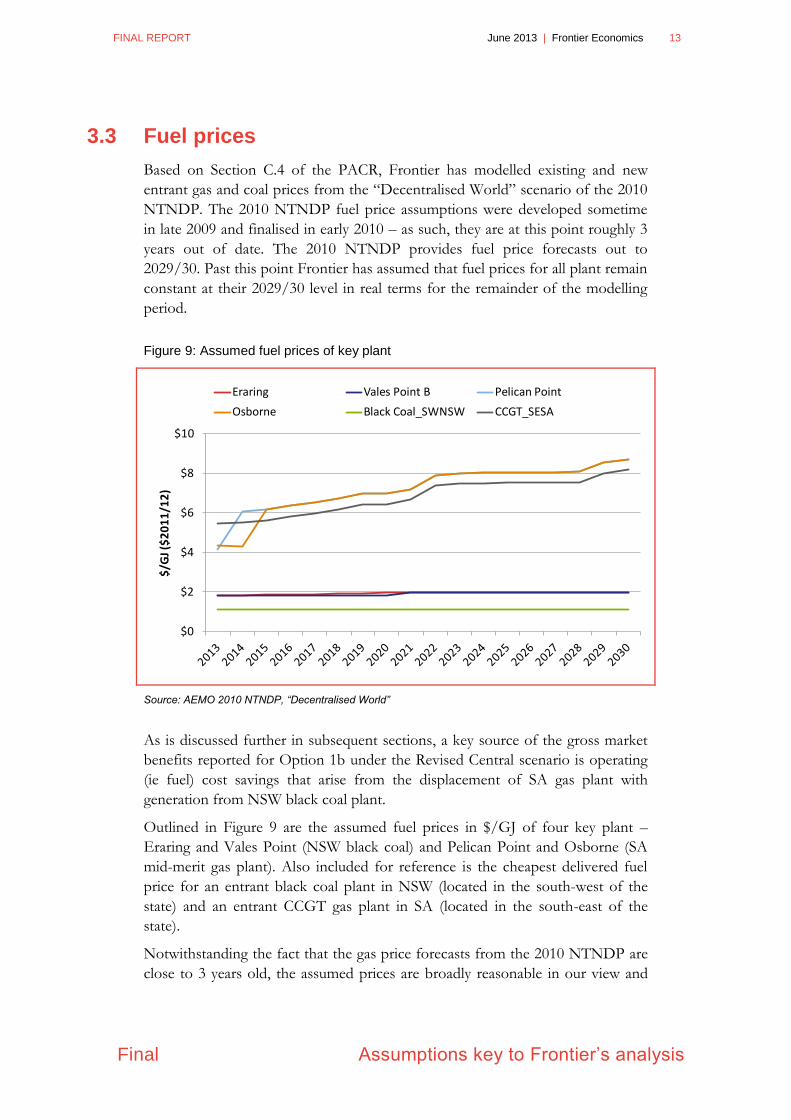
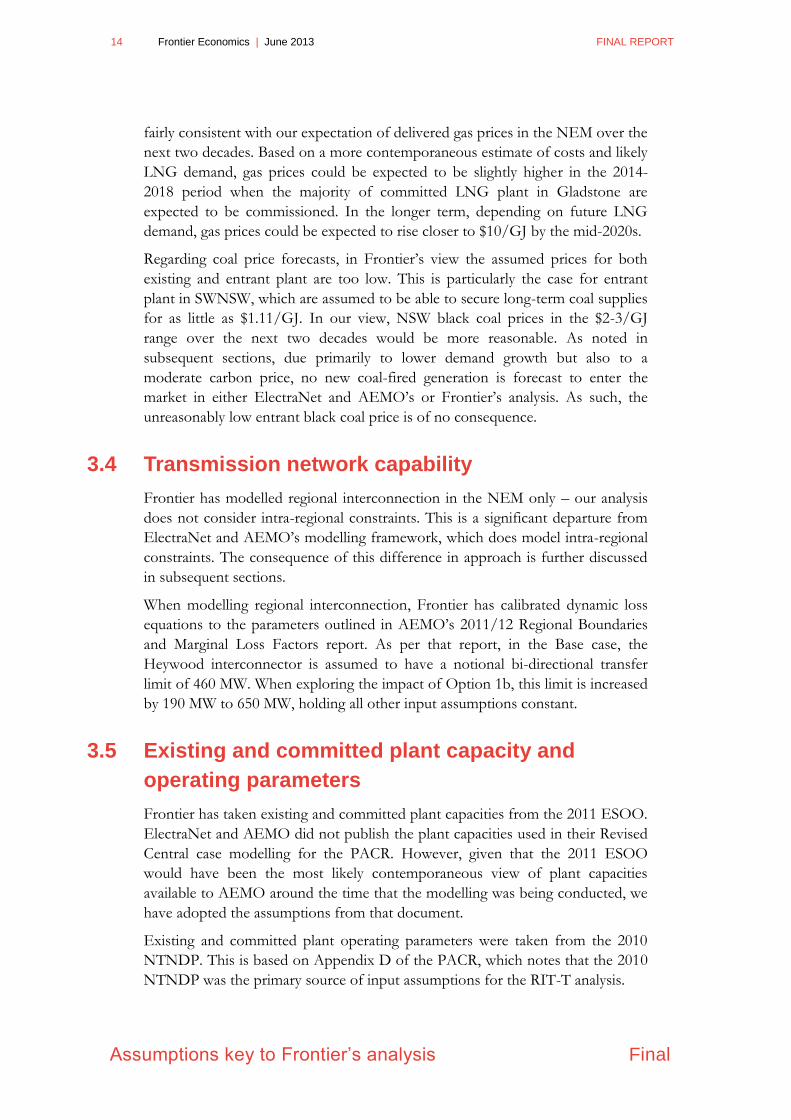
3.3 Fuel prices
Based on Section C.4 of the PACR, Frontier has modelled existing and new
entrant gas and coal prices from the “Decentralised World” scenario of the 2010
NTNDP. The 2010 NTNDP fuel price assumptions were developed sometime
in late 2009 and finalised in early 2010 – as such, they are at this point roughly 3
years out of date. The 2010 NTNDP provides fuel price forecasts out to
2029/30. Past this point Frontier has assumed that fuel prices for all plant remain
constant at their 2029/30 level in real terms for the remainder of the modelling
period.
Figure 9: Assumed fuel prices of key plant
Source: AEMO 2010 NTNDP, “Decentralised World”
As is discussed further in subsequent sections, a key source of the gross market
benefits reported for Option 1b under the Revised Central scenario is operating
(ie fuel) cost savings that arise from the displacement of SA gas plant with
generation from NSW black coal plant.
Outlined in Figure 9 are the assumed fuel prices in $/GJ of four key plant –
Eraring and Vales Point (NSW black coal) and Pelican Point and Osborne (SA
mid-merit gas plant). Also included for reference is the cheapest delivered fuel
price for an entrant black coal plant in NSW (located in the south-west of the
state) and an entrant CCGT gas plant in SA (located in the south-east of the
state).
Notwithstanding the fact that the gas price forecasts from the 2010 NTNDP are
close to 3 years old, the assumed prices are broadly reasonable in our view and
$0
$2
$4
$6
$8
$10
$/G
J ($
20
11
/12
)
Eraring Vales Point B Pelican Point
Osborne Black Coal_SWNSW CCGT_SESA
14 Frontier Economics | June 2013 FINAL REPORT
Assumptions key to Frontier’s analysis Final
fairly consistent with our expectation of delivered gas prices in the NEM over the
next two decades. Based on a more contemporaneous estimate of costs and likely
LNG demand, gas prices could be expected to be slightly higher in the 2014-
2018 period when the majority of committed LNG plant in Gladstone are
expected to be commissioned. In the longer term, depending on future LNG
demand, gas prices could be expected to rise closer to $10/GJ by the mid-2020s.
Regarding coal price forecasts, in Frontier‟s view the assumed prices for both
existing and entrant plant are too low. This is particularly the case for entrant
plant in SWNSW, which are assumed to be able to secure long-term coal supplies
for as little as $1.11/GJ. In our view, NSW black coal prices in the $2-3/GJ
range over the next two decades would be more reasonable. As noted in
subsequent sections, due primarily to lower demand growth but also to a
moderate carbon price, no new coal-fired generation is forecast to enter the
market in either ElectraNet and AEMO‟s or Frontier‟s analysis. As such, the
unreasonably low entrant black coal price is of no consequence.
3.4 Transmission network capability
Frontier has modelled regional interconnection in the NEM only – our analysis
does not consider intra-regional constraints. This is a significant departure from
ElectraNet and AEMO‟s modelling framework, which does model intra-regional
constraints. The consequence of this difference in approach is further discussed
in subsequent sections.
When modelling regional interconnection, Frontier has calibrated dynamic loss
equations to the parameters outlined in AEMO‟s 2011/12 Regional Boundaries
and Marginal Loss Factors report. As per that report, in the Base case, the
Heywood interconnector is assumed to have a notional bi-directional transfer
limit of 460 MW. When exploring the impact of Option 1b, this limit is increased
by 190 MW to 650 MW, holding all other input assumptions constant.
3.5 Existing and committed plant capacity and
operating parameters
Frontier has taken existing and committed plant capacities from the 2011 ESOO.
ElectraNet and AEMO did not publish the plant capacities used in their Revised
Central case modelling for the PACR. However, given that the 2011 ESOO
would have been the most likely contemporaneous view of plant capacities
available to AEMO around the time that the modelling was being conducted, we
have adopted the assumptions from that document.
Existing and committed plant operating parameters were taken from the 2010
NTNDP. This is based on Appendix D of the PACR, which notes that the 2010
NTNDP was the primary source of input assumptions for the RIT-T analysis.
FINAL REPORT June 2013 | Frontier Economics 15
Final Assumptions key to Frontier’s analysis
3.6 Entrant plant capital costs and operating
parameters
As was the case with existing and committed plant operating parameters, new
entrant plant operating parameters and capital costs have been taken from the
2010 NTNDP. The 2010 NTNDP provides entrant plant capital costs on a
$/kW basis. Frontier has amortised these capital costs assuming a 10% WACC,
consistent with the discount rate assumed by ElectraNet and AEMO in their
modelling.
16 Frontier Economics | June 2013 FINAL REPORT
Frontier’s assessment of market benefits
Final
4 Frontier’s assessment of market benefits
This section outlines the results of Frontier‟s assessment of the gross market
benefits of Option 1b under the Revised Central scenario. As discussed in
Section 3, Frontier has used an input assumptions set that is as consistent as
possible with those assumptions used (or expected to have been used) by
ElectraNet and AEMO in their analysis.
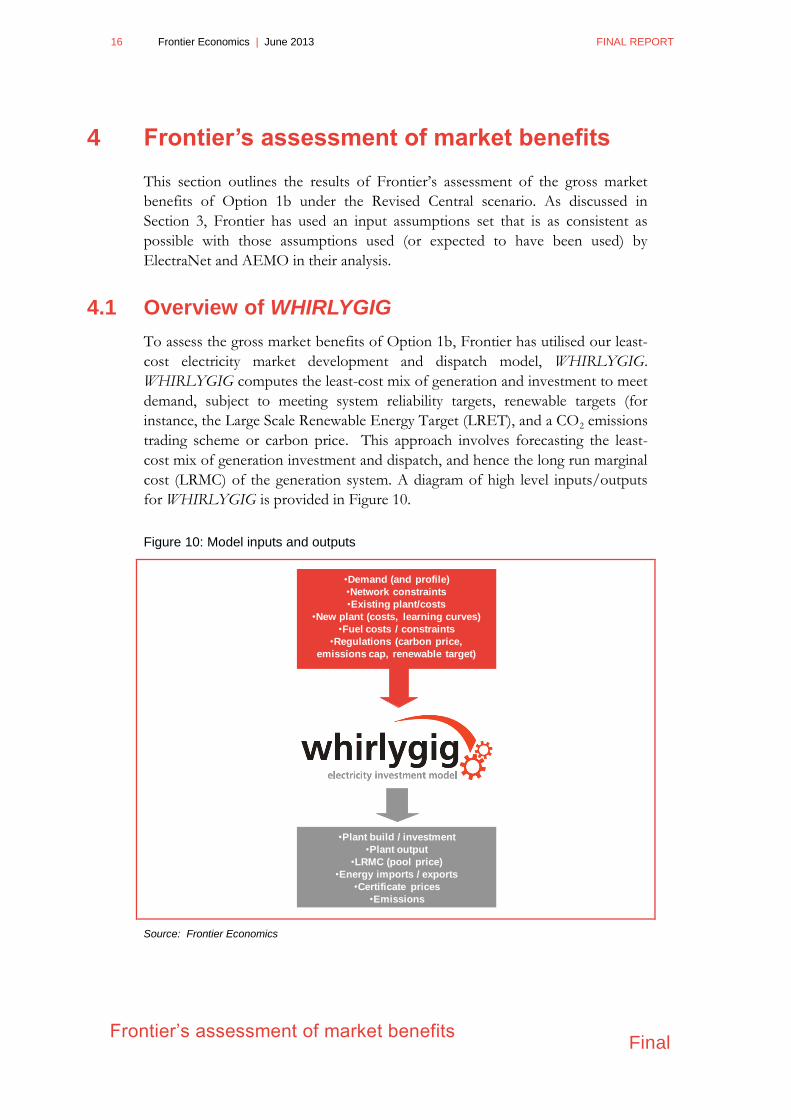
4.1 Overview of WHIRLYGIG
To assess the gross market benefits of Option 1b, Frontier has utilised our least-
cost electricity market development and dispatch model, WHIRLYGIG.
WHIRLYGIG computes the least-cost mix of generation and investment to meet
demand, subject to meeting system reliability targets, renewable targets (for
instance, the Large Scale Renewable Energy Target (LRET), and a CO2 emissions
trading scheme or carbon price. This approach involves forecasting the least-
cost mix of generation investment and dispatch, and hence the long run marginal
cost (LRMC) of the generation system. A diagram of high level inputs/outputs
for WHIRLYGIG is provided in Figure 10.
Figure 10: Model inputs and outputs
Source: Frontier Economics
•Plant build / investment
•Plant output
•LRMC (pool price)
•Energy imports / exports
•Certificate prices
•Emissions
•Demand (and profile)
•Network constraints
•Existing plant/costs
•New plant (costs, learning curves)
•Fuel costs / constraints
•Regulations (carbon price,
emissions cap, renewable target)
FINAL REPORT June 2013 | Frontier Economics 17
Final Frontier’s assessment of market benefits
As a cost-minimisation model, WHIRLYGIG dispatches generation according to
estimated SRMCs in order to minimise the total cost of serving load. This implies
that all generation plant bid their capacity into the market on a highly competitive
basis, which is consistent with the framework adopted by ElectraNet and AEMO
(Section 5.3.2 of the PACR).
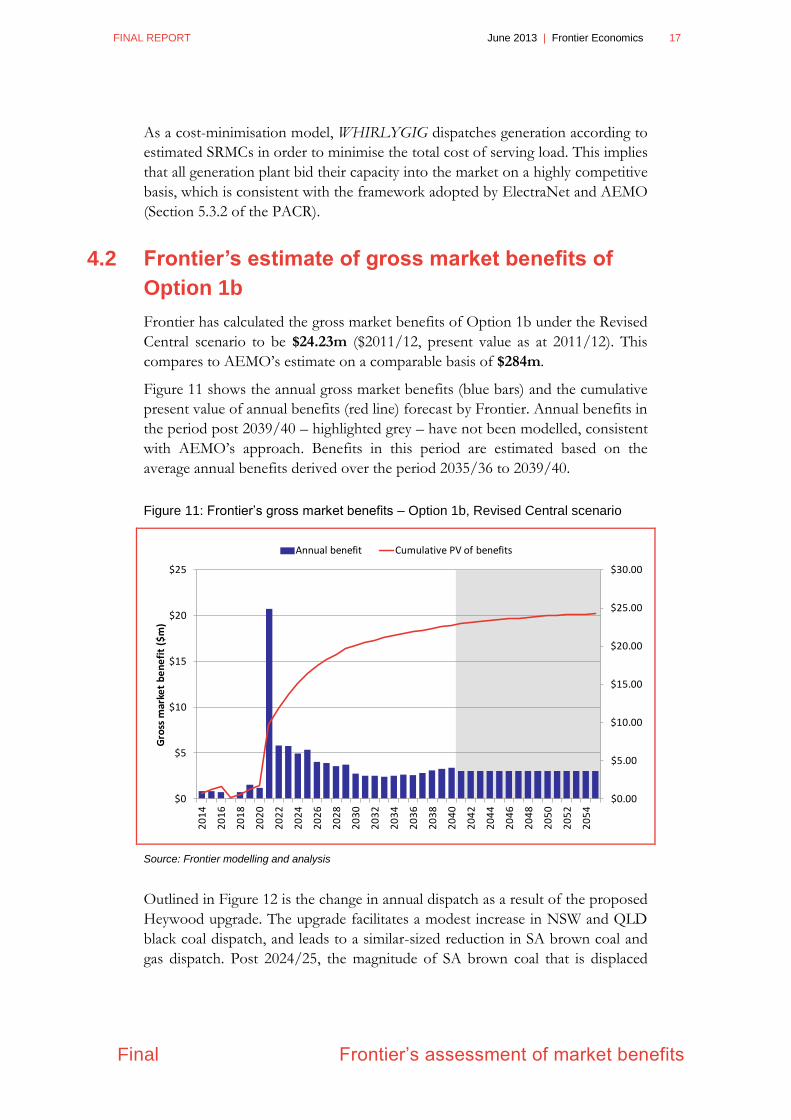
4.2 Frontier’s estimate of gross market benefits of
Option 1b
Frontier has calculated the gross market benefits of Option 1b under the Revised
Central scenario to be $24.23m ($2011/12, present value as at 2011/12). This
compares to AEMO‟s estimate on a comparable basis of $284m.
Figure 11 shows the annual gross market benefits (blue bars) and the cumulative
present value of annual benefits (red line) forecast by Frontier. Annual benefits in
the period post 2039/40 – highlighted grey – have not been modelled, consistent
with AEMO‟s approach. Benefits in this period are estimated based on the
average annual benefits derived over the period 2035/36 to 2039/40.
Figure 11: Frontier’s gross market benefits – Option 1b, Revised Central scenario
Source: Frontier modelling and analysis
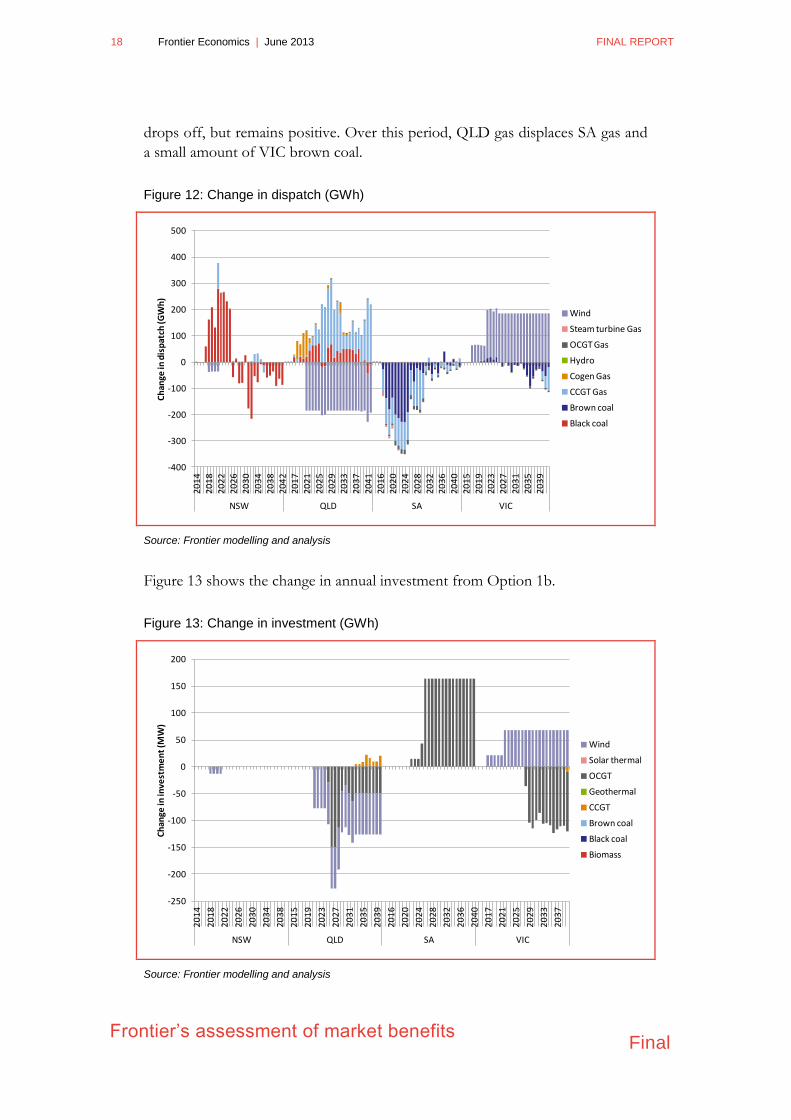
Outlined in Figure 12 is the change in annual dispatch as a result of the proposed
Heywood upgrade. The upgrade facilitates a modest increase in NSW and QLD
black coal dispatch, and leads to a similar-sized reduction in SA brown coal and
gas dispatch. Post 2024/25, the magnitude of SA brown coal that is displaced
$0.00
$5.00
$10.00
$15.00
$20.00
$25.00
$30.00
$0
$5
$10
$15
$20
$25
20
14
20
16
20
18
20
20
20
22
20
24
20
26
20
28
20
30
20
32
20
34
20
36
20
38
20
40
20
42
20
44
20
46
20
48
20
50
20
52
20
54
Gro
ss m
arke
t b
en
efi
t ($
m)
Annual benefit Cumulative PV of benefits
18 Frontier Economics | June 2013 FINAL REPORT
Frontier’s assessment of market benefits
Final
drops off, but remains positive. Over this period, QLD gas displaces SA gas and
a small amount of VIC brown coal.
Figure 12: Change in dispatch (GWh)
Source: Frontier modelling and analysis
Figure 13 shows the change in annual investment from Option 1b.
Figure 13: Change in investment (GWh)
Source: Frontier modelling and analysis
-400
-300
-200
-100
0
100
200
300
400
500
20
14
20
18
20
22
20
26
20
30
20
34
20
38
20
42
20
17
20
21
20
25
20
29
20
33
20
37
20
41
20
16
20
20
20
24
20
28
20
32
20
36
20
40
20
15
20
19
20
23
20
27
20
31
20
35
20
39
NSW QLD SA VIC
Ch
ange
in d
isp
atch
(GW
h)
Wind
Steam turbine Gas
OCGT Gas
Hydro
Cogen Gas
CCGT Gas
Brown coal
Black coal
-250
-200
-150
-100
-50
0
50
100
150
200
20
14
20
18
20
22
20
26
20
30
20
34
20
38
20
15
20
19
20
23
20
27
20
31
20
35
20
39
20
16
20
20
20
24
20
28
20
32
20
36
20
40
20
17
20
21
20
25
20
29
20
33
20
37
NSW QLD SA VIC
Ch
ange
in in
vest
me
nt
(MW
)
Wind
Solar thermal
OCGT
Geothermal
CCGT
Brown coal
Black coal
Biomass
FINAL REPORT June 2013 | Frontier Economics 19
Final Frontier’s assessment of market benefits
The upgrade results in a reduction in wind investment in QLD and an increase in
VIC. Due to higher wind capacity factors in VIC, the overall amount of wind
investment falls, leading to a minor capital cost saving. The upgrade also shifts
OCGT investment from QLD and VIC into SA. Due to marginally lower
connection costs in SA, this also results in a small capital cost saving.
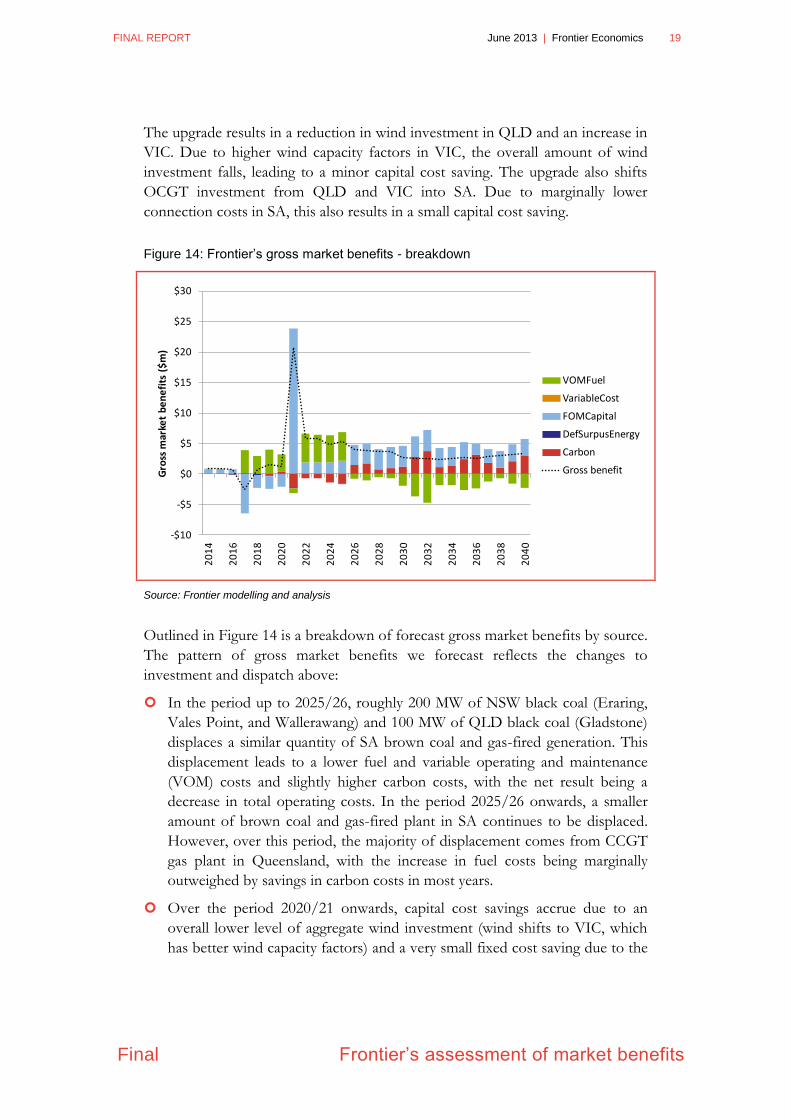
Figure 14: Frontier’s gross market benefits - breakdown
Source: Frontier modelling and analysis
Outlined in Figure 14 is a breakdown of forecast gross market benefits by source.
The pattern of gross market benefits we forecast reflects the changes to
investment and dispatch above:
In the period up to 2025/26, roughly 200 MW of NSW black coal (Eraring,
Vales Point, and Wallerawang) and 100 MW of QLD black coal (Gladstone)
displaces a similar quantity of SA brown coal and gas-fired generation. This
displacement leads to a lower fuel and variable operating and maintenance
(VOM) costs and slightly higher carbon costs, with the net result being a
decrease in total operating costs. In the period 2025/26 onwards, a smaller
amount of brown coal and gas-fired plant in SA continues to be displaced.
However, over this period, the majority of displacement comes from CCGT
gas plant in Queensland, with the increase in fuel costs being marginally
outweighed by savings in carbon costs in most years.
Over the period 2020/21 onwards, capital cost savings accrue due to an
overall lower level of aggregate wind investment (wind shifts to VIC, which
has better wind capacity factors) and a very small fixed cost saving due to the
-$10
-$5
$0
$5
$10
$15
$20
$25
$30
20
14
20
16
20
18
20
20
20
22
20
24
20
26
20
28
20
30
20
32
20
34
20
36
20
38
20
40
Gro
ss m
arke
t b
en
efi
ts (
$m
)
VOMFuel
VariableCost
FOMCapital
DefSurpusEnergy
Carbon
Gross benefit
20 Frontier Economics | June 2013 FINAL REPORT
Frontier’s assessment of market benefits
Final
shift in OCGT investment (assumed connection costs are marginally lower in
SA as compared to QLD and VIC).
As is evidenced by Figure 14 and the lower present value of gross benefits
($24.23m), the modelling and analysis performed using WHIRLYGIG suggests
there are only moderate gross market benefits from Option 1b under the Revised
Central scenario.
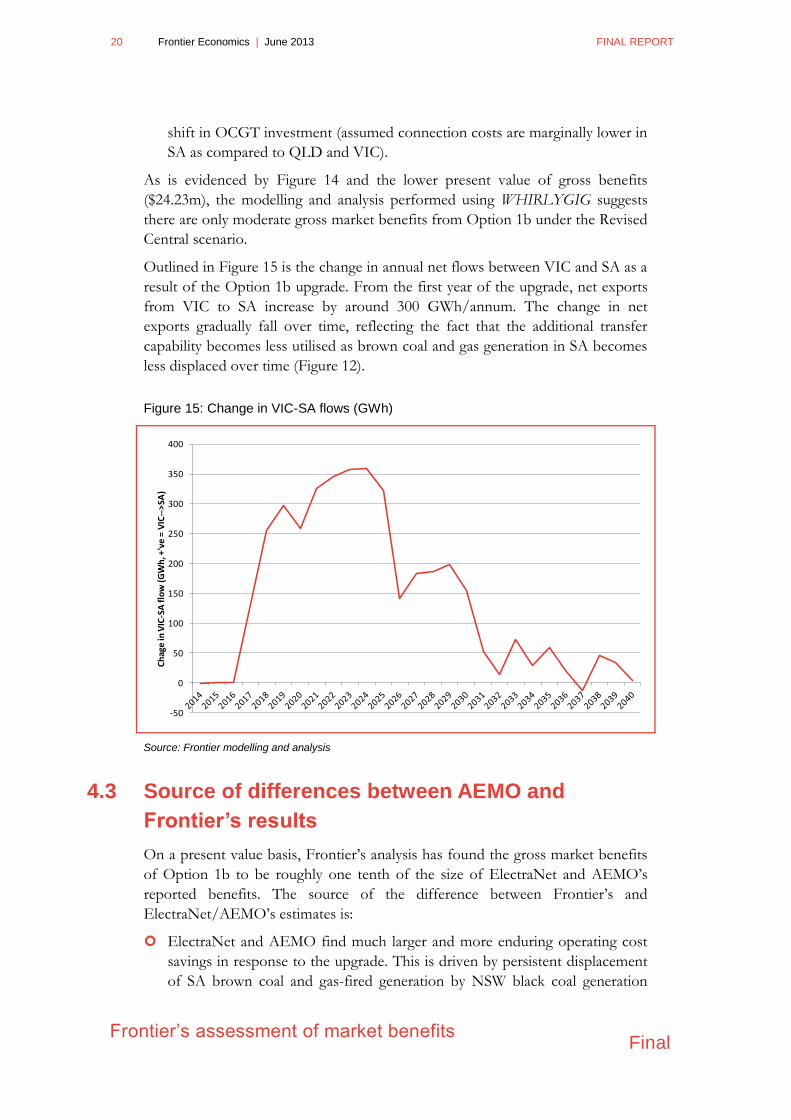
Outlined in Figure 15 is the change in annual net flows between VIC and SA as a
result of the Option 1b upgrade. From the first year of the upgrade, net exports
from VIC to SA increase by around 300 GWh/annum. The change in net
exports gradually fall over time, reflecting the fact that the additional transfer
capability becomes less utilised as brown coal and gas generation in SA becomes
less displaced over time (Figure 12).
Figure 15: Change in VIC-SA flows (GWh)
Source: Frontier modelling and analysis
4.3 Source of differences between AEMO and
Frontier’s results
On a present value basis, Frontier‟s analysis has found the gross market benefits
of Option 1b to be roughly one tenth of the size of ElectraNet and AEMO‟s
reported benefits. The source of the difference between Frontier‟s and
ElectraNet/AEMO‟s estimates is:
ElectraNet and AEMO find much larger and more enduring operating cost
savings in response to the upgrade. This is driven by persistent displacement
of SA brown coal and gas-fired generation by NSW black coal generation
-50
0
50
100
150
200
250
300
350
400
Ch
age
in V
IC-S
A fl
ow
(G
Wh
, +'v
e =
VIC
-->
SA)
FINAL REPORT June 2013 | Frontier Economics 21
Final Frontier’s assessment of market benefits
over the period of the modelling. Frontier finds a similar pattern of
displacement. However, the result is on a far lower scale and does not persist
to any significant degree past 2025/26.
ElectraNet and AEMO find larger generation capital cost savings over the
period 2016/17 to 2024/25 due to OCGT investment deferral in SA.
Frontier‟s analysis does not find the same pattern of investment deferral, but
does find capital cost savings due to shifting investment between QLD, VIC
and SA. The level of capital cost savings found by WHIRLYGIG in response
to the upgrade is also far lower than those reported by ElectraNet and
AEMO.
4.3.1 Reasons for different level of displacement of SA
generation
Based on size of the benefits reported by ElectraNet and AEMO, it is the first
discrepancy – the pattern of SA brown coal and gas displacement by NSW black
coal – that appears to be driving the majority of the differences between our and
their results.
There are several possible reasons as to why the two modelling approaches are
finding different results regarding the ability of NSW black coal to displace
expensive SA generation. The most likely is due to the treatment of inter-regional
flows. WHIRLYGIG has not been configured with a full set of intra-regional
constraint equations. Power flows between regions are modelled using discrete
inter-regional flow equations, which capture dynamic losses but effectively limit
flows to notional import and export limits.
In the case of the Heywood interconnector, WHIRLYGIG has assumed that the
interconnector is available bi-directionally at all times up to its full notional
transfer limit of 460 MW. In the Upgrade case, this limit is increased by 190 MW
to 650 MW. This approach to modelling inter-regional flows is different to that
adopted by ElectraNet and AEMO, who modelled a subset of the 2010 NTNDP
intra-regional constraints set. Rather than modelling inter-regional flows as being
limited by notional import or export limits, the intra-regional constraints
(depending on how they have been oriented) can result in inter-regional transfer
limits at levels below the notional transfer capability of each interconnector,
particular at times of peak demand. In the Upgrade case, ElectraNet and AEMO
modified the subset of intra-regional constraints considered in their analysis.
These modifications reflect the increased notional transfer capability from 460
MW to 650 MW, but also appear to reflect the relief of other constraints that
often limit flows below the current notional interconnector limits.6
6 PACR, p.21.
22 Frontier Economics | June 2013 FINAL REPORT
Frontier’s assessment of market benefits
Final
One consequence of modelling intra-regional constraints is that depending on
the level of congestion that these constraints induce in the Base case, and how
this level of congestion is alleviated once the constraints are re-oriented to reflect
the Option 1b upgrade, the implied benefit of the upgrade can be very high. This
is likely when inter-regional flows in the Base case are constraining frequently,
leading to higher cost generation running in place of lower cost generation on the
far side of the constraints. In the context of ElectraNet and AEMO‟s PACR
modelling, Frontier‟s modelling and analysis suggests that in the Base case, the
Heywood inter-connector is likely to be frequently import-binding during peak
demand periods due to intra-regional constraints. This prevents lower cost NSW
black coal generation from displacing higher cost SA brown coal and gas
generation to the extent suggested by the nominal interconnector limit. In the
Upgrade case – depending on how the intra-regional constraints are modified to
reflect the augmentation – the incidence of peak period import constraints may
reduce considerably. This will result in a large decrease in the operating costs in
the Upgrade case relative to the Base case and thus yield a large gross market
benefit.
When modelling inter-regional flows using notional import and export limits as
opposed to intra-regional constraints, this outcome is less likely. This is because
in both the Base and Upgrade cases, the level of inter-regional congestion is low.
If the Heywood interconnector is already (close to) optimally utilised in the Base
case, then the additional benefits of augmenting peak transfer capability only
reduces operating costs at the absolute peak demand period, which is generally a
small proportion of the year.
ElectraNet and AEMO did not release sufficient data with either the PADR or
PACR to enable the above conjecture to be verified. In order to identify whether
and to what degree the relief of existing intra-regional constraints contribute to
the purported gross market benefits of Option 1b reported by ElectraNet
AEMO, it would be necessary to scrutinise the pattern of inter-regional flows
and congestion between VIC and SA prevailing in their modelling. The only
comment that ElectraNet and AEMO make in regard to congestion in the
Upgrade case relative to the Base case is in Section 4.16 of the PACR, where they
note:
ElectraNet and AEMO’s modelling indicates that current constraints will be
significantly reduced as a result of the augmentation.7
4.3.2 Ruling out differences in SRMC estimates
In order to narrow down the likely reasons for the large discrepancy between
Frontier‟s and ElectraNet/AEMO‟s calculated gross market benefit of Option
7 PACR, p.68.
FINAL REPORT June 2013 | Frontier Economics 23
Final Frontier’s assessment of market benefits
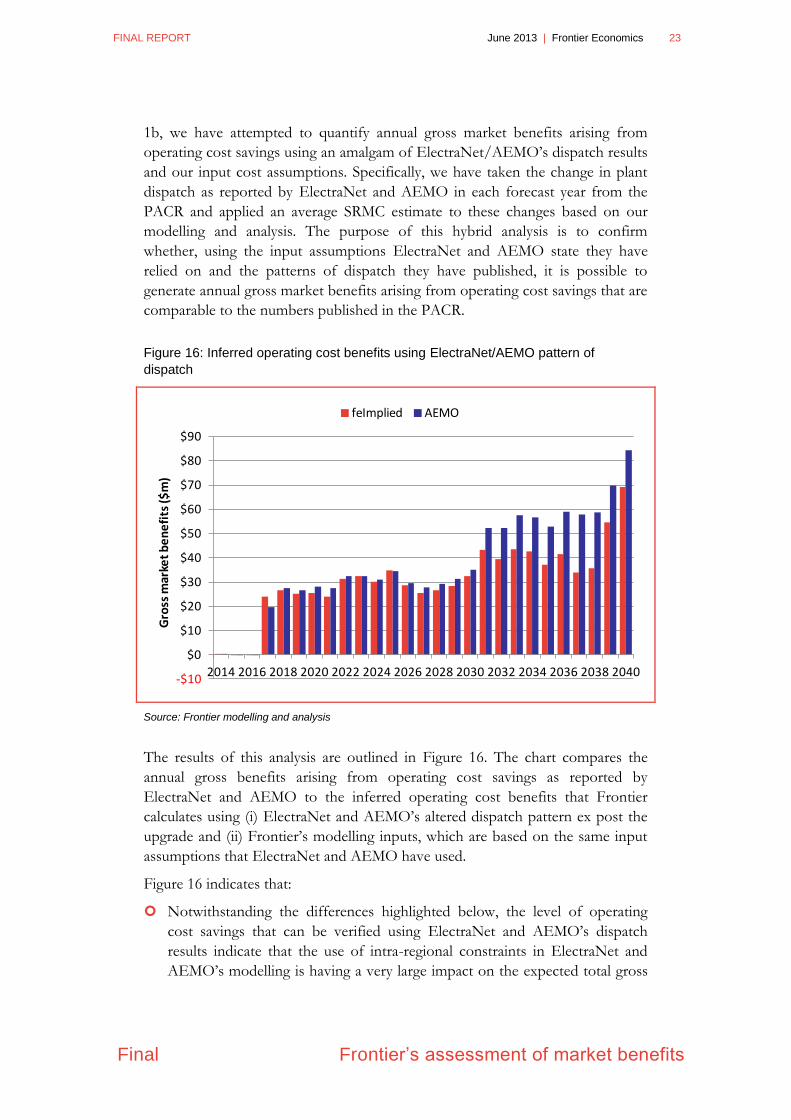
1b, we have attempted to quantify annual gross market benefits arising from
operating cost savings using an amalgam of ElectraNet/AEMO‟s dispatch results
and our input cost assumptions. Specifically, we have taken the change in plant
dispatch as reported by ElectraNet and AEMO in each forecast year from the
PACR and applied an average SRMC estimate to these changes based on our
modelling and analysis. The purpose of this hybrid analysis is to confirm
whether, using the input assumptions ElectraNet and AEMO state they have
relied on and the patterns of dispatch they have published, it is possible to
generate annual gross market benefits arising from operating cost savings that are
comparable to the numbers published in the PACR.
Figure 16: Inferred operating cost benefits using ElectraNet/AEMO pattern of
dispatch
Source: Frontier modelling and analysis
The results of this analysis are outlined in Figure 16. The chart compares the
annual gross benefits arising from operating cost savings as reported by
ElectraNet and AEMO to the inferred operating cost benefits that Frontier
calculates using (i) ElectraNet and AEMO‟s altered dispatch pattern ex post the
upgrade and (ii) Frontier‟s modelling inputs, which are based on the same input
assumptions that ElectraNet and AEMO have used.
Figure 16 indicates that:
Notwithstanding the differences highlighted below, the level of operating
cost savings that can be verified using ElectraNet and AEMO‟s dispatch
results indicate that the use of intra-regional constraints in ElectraNet and
AEMO‟s modelling is having a very large impact on the expected total gross
-$10
$0
$10
$20
$30
$40
$50
$60
$70
$80
$90
2014 2016 2018 2020 2022 2024 2026 2028 2030 2032 2034 2036 2038 2040
Gro
ss m
arke
t b
en
efi
ts ($
m)
feImplied AEMO
24 Frontier Economics | June 2013 FINAL REPORT
Frontier’s assessment of market benefits
Final
market benefits of Option 1b. Since the pattern of operating cost savings
over the period 2013/14 to 2029/30 is very consistent, it would seem highly
improbable that the various input assumptions which form each generator‟s
SRMC (fuel prices, VOM estimates, carbon price, technical plant parameters,
etc) used in ElectraNet and AEMO‟s modelling are somehow at odds with
the original source of these assumptions which we have independently relied
upon. It would appear that broadly the same SRMC assumptions for each
generator in the NEM are being used by both ElectraNet/AEMO and
Frontier. As such, it seems likely that the significantly different patterns of
dispatch forecast by ourselves and ElectraNet/AEMO is being driven to a
large degree by the treatment of intra-regional constraints.
Post 2029/30, the pattern of operating cost savings begins to systematically
diverge – ElectraNet and AEMO‟s estimates begin to gradually increase while
Frontier‟s inferred benefits stay broadly stable. It is not clear why this occurs.
However, as noted in earlier sections, the 2010 NTNDP provides fuel price
forecasts out to 2029/30. In Frontier‟s analysis we have assumed that fuel
prices for the period post 2029/30 remain constant in real terms at this final
year‟s level. Depending on how these future fuel price assumptions have been
extrapolated forward, it is possible that ElectraNet and AEMO are assuming
some growth in the price of gas past this point, particularly in SA. Since the
magnitude of the operating cost benefit of Option 1b is a function of the
SRMC differential between NSW black coal and SA gas, a rising gas price
over this period would lead to a pattern of increasing annual operating cost
benefits.
4.3.3 Simple investigation of impact of intra-regional
constraints
In order to get a broad „order-of-magnitude‟ feel for how much of an impact
intra-regional constraints might be influencing the estimated gross market benefit
of Option 1b, Frontier has modelled a second case. In this second case, we have
implemented a crude approximation of the potential extent of export limits from
VIC to SA at different levels of demand by constraining flows between these
regions to the actual export limits experienced in 2009/10. The year 2009/10 was
chosen to be consistent with ElectraNet and AEMO‟s modelled base year for
demand and wind traces (see Section D.1 of the PACR). This approach is a very
crude approximation of the impact that intra-regional constraints can have on
flows between regions. Since the constraint is „static‟ (it is based on actual
outcomes from 2009/10), the interpretation of these results should be taken as
only indicative of the sensitivity of the calculated market benefit of Option 1b to
different assumptions about inter-regional congestion occurring at levels below
Heywood‟s notional import/export limit of 460 MW (650 MW after the
upgrade).
FINAL REPORT June 2013 | Frontier Economics 25
Final Frontier’s assessment of market benefits
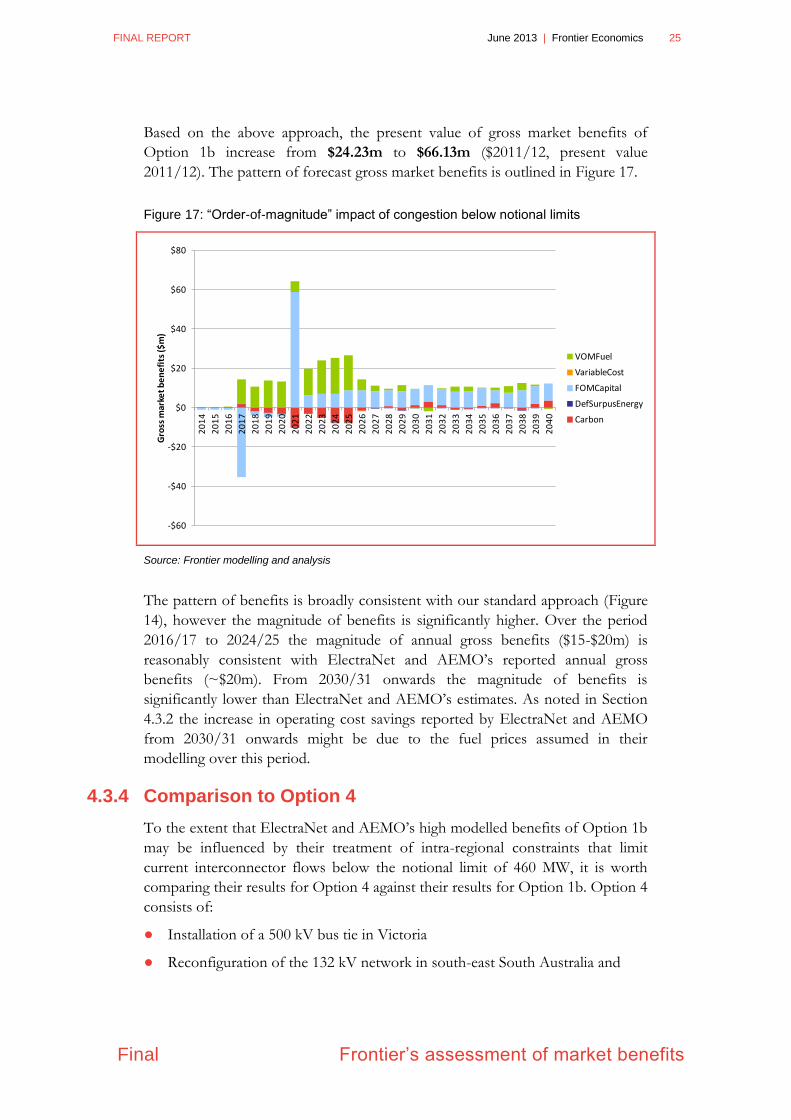
Based on the above approach, the present value of gross market benefits of
Option 1b increase from $24.23m to $66.13m ($2011/12, present value
2011/12). The pattern of forecast gross market benefits is outlined in Figure 17.
Figure 17: “Order-of-magnitude” impact of congestion below notional limits
Source: Frontier modelling and analysis
The pattern of benefits is broadly consistent with our standard approach (Figure
14), however the magnitude of benefits is significantly higher. Over the period
2016/17 to 2024/25 the magnitude of annual gross benefits ($15-$20m) is
reasonably consistent with ElectraNet and AEMO‟s reported annual gross
benefits (~$20m). From 2030/31 onwards the magnitude of benefits is
significantly lower than ElectraNet and AEMO‟s estimates. As noted in Section
4.3.2 the increase in operating cost savings reported by ElectraNet and AEMO
from 2030/31 onwards might be due to the fuel prices assumed in their
modelling over this period.
4.3.4 Comparison to Option 4
To the extent that ElectraNet and AEMO‟s high modelled benefits of Option 1b
may be influenced by their treatment of intra-regional constraints that limit
current interconnector flows below the notional limit of 460 MW, it is worth
comparing their results for Option 4 against their results for Option 1b. Option 4
consists of:
● Installation of a 500 kV bus tie in Victoria
● Reconfiguration of the 132 kV network in south-east South Australia and
-$60
-$40
-$20
$0
$20
$40
$60
$80
20
14
20
15
20
16
20
17
20
18
20
19
20
20
20
21
20
22
20
23
20
24
20
25
20
26
20
27
20
28
20
29
20
30
20
31
20
32
20
33
20
34
20
35
20
36
20
37
20
38
20
39
20
40
Gro
ss m
arke
t b
en
efi
ts ($
m)
VOMFuel
VariableCost
FOMCapital
DefSurpusEnergy
Carbon
26 Frontier Economics | June 2013 FINAL REPORT
Frontier’s assessment of market benefits
Final
● Installation of a 100 MVAr capacitor in South Australia.8
The objective of Option 4 is to „firm up‟ the existing 460 MW notional transfer
capacity on the Heywood Interconnector.9
If Option 4 helps firm the 460 MW notional capacity of Heywood, then the
incremental gross market benefits of Option 1b over Option 4 from the
ElectraNet and AEMO modelling should yield a similar figure to the gross
market benefits we found for Option 1b. However, ElectraNet and AEMO
found the present value of gross market benefits from Option 4 to be
approximately $191 million ($2011/12). This is about $93 million less than the
present value of gross market benefits for Option 1b, far in excess of our
estimate of $24.23 million.
8 PACR, pp.33-34.
9 PACR, pp.33-34.
FINAL REPORT June 2013 | Frontier Economics 27
Final Conclusions and next steps
5 Conclusions and next steps
Outlined below is a brief summary of our findings and a list of questions relating
to ElectraNet and AEMO‟s work. We consider that further detail and
information from ElectraNet and AEMO regarding some of these issues would
add transparency and rigour to the modelling and analysis they have performed
to date in estimating the gross market benefits of Option 1b.
5.1 Summary of Frontier’s findings
Frontier has sought to independently assess the gross market benefits of Option
1b under the Revised Central scenario modelled by ElectraNet and AEMO. We
have attempted to use as consistent a modelling framework and input
assumptions to that used by ElectraNet and AEMO as has been feasible within
the scope of our engagement. In brief:
We have quantified the gross market benefits using WHIRLYGIG, which
dispatches generation plant on a least-cost basis in a manner consistent with a
perfectly competitive electricity market or „SRMC‟ bidding. This is consistent
with the approach used by ElectraNet and AEMO.
We have relied where possible on the same primary source for input
assumptions as ElectraNet and AEMO has used. These assumptions include
fuel prices, plant technical and operating parameters, plant capacities, demand
growth, carbon prices and the LRET target.
One major point of departure between our analysis and ElectraNet and
AEMO‟s is the consideration of intra-regional transmission constraints.
Frontier‟s approach models inter-regional flow using discrete constraints that
limit power transfers between regions to notional import and export regions.
ElectraNet and AEMO‟s approach considers the impact that intra-regional
constraints can have on constraining flow between regions to levels below
notional transfer limits.
Based on the above approach, we have quantified the gross market benefit of
Option 1b as $24.23m ($2011/12, present value as at 2011/12). This compares
to ElectraNet and AEMO‟s estimate (on a comparable basis) of $284m. We have
attempted to ascertain what is driving the large discrepancy between our and
ElectraNet/AEMO‟s estimate of gross market benefits. Based on the
information available, it would appear that the treatment of intra-regional
constraints under ElectraNet/AEMO‟s approach is a large driver of this overall
difference. This is because a large degree of congestion in the Base case – which
prevents low-cost NSW black coal from displacing high-cost SA brown coal and
gas – that is subsequently alleviated as a result of the Option 1b upgrade leads to
large operating cost savings being attributed to the augmentation.
28 Frontier Economics | June 2013 FINAL REPORT
Conclusions and next steps Final
5.2 Questions in relation to AEMO’s work
Below is a list of questions that have arisen over the course of our analysis
regarding the modelling and analysis performed by ElectraNet and AEMO in
estimating the gross market benefits of Option 1b:
(1) The impact of intra-regional constraints
● How sensitive are AEMO‟s gross market benefit estimates to the assumed
configuration of intra-regional constraints – and resulting patterns of
congestion that limit flows from VIC to SA at peak demand times – in the
Base case?
● How sensitive are AEMO‟s gross market benefit estimates to the assumed
configuration of intra-regional constraints – and resulting patterns of
congestion that limit flows from VIC to SA at peak demand times – in the
Upgrade case?
● Public release of the following data would assist stakeholders in
understanding and interpreting the impact that assumed intra-regional
constraints is having on the estimated gross market benefits:
Half-hourly inter-regional flow data between VIC and SA across both
Heywood and Murraylink, for both the Base and Upgrade cases.
Half-hourly import and export limits on the flows between VIC and SA
across both Heywood and Murraylink and which are a consequence of
the intra-regional constraints modelled by AEMO, for both the Base and
Upgrade case.
(2) Confirmation of assumed fuel prices post FY2030
● Our analysis of AEMO‟s derived gross market benefits indicate that from
2030/31 onwards the magnitude of operating cost benefits attributable to
Option 1b appear to rise over time.
● The 2010 NTNDP supply input spreadsheets available on AEMO‟s website
only provide fuel price forecasts out to 2029/30.
● It would be helpful if ElectraNet and AEMO could confirm what fuel price
assumptions have been used for all generation plant in the NEM over the
period 2030/31 to the end of the modelling horizon.

Frontier Economics Pty Ltd in Australia is a member of the Frontier Economics network, which
consists of separate companies based in Australia (Melbourne & Sydney) and Europe (Brussels,
Cologne, Dublin, London & Madrid). The companies are independently owned, and legal
commitments entered into by any one company do not impose any obligations on other companies
in the network. All views expressed in this document are the views of Frontier Economics Pty Ltd.
Disclaimer
None of Frontier Economics Pty Ltd (including the directors and employees) make any representation or warranty as to the accuracy or completeness of this report. Nor shall they have any liability (whether arising from negligence or otherwise) for any representations (express or implied) or information contained in, or for any omissions from, the report or any written or oral communications transmitted in the course of the project.

FRONTIER ECONOMICS | MELBOURNE | SYDNEY
Frontier Economics Pty Ltd 395 Collins Street Melbourne Victoria 3000
Tel: +61 (0)3 9620 4488 Fax: +61 (0)3 9620 4499 www.frontier-economics.com
ACN: 087 553 124 ABN: 13 087 553 124