market alternatives, third party intervention, and third party informedness in negotiation
TRANSCRIPT
81ALTERNATIVES AND INTERVENTION IN NEGOTIATIONGroup Decision and Negotiation 7: 81–107, 1998
© 1998 Kluwer Academic Publishers. Printed in the Netherlands
Market Alternatives, Third Party Intervention, andThird Party Informedness in Negotiation
VAIRAM ARUNACHALAMSchool of Accountancy, University of Missouri, Columbia, Missouri 65211, USA
WILLIAM DILLAUniversity of Missouri, St. Louis, USA
MARJORIE SHELLEYUniversity of Illinois, Urbana Champaign, USA
CHRIS CHANMacquarie University, Australia
Abstract
Negotiation is one possible mechanism for setting transfer prices when no unique transfer price is obviouslycorrect, allowing divisional managers to run their divisions with some degree of autonomy. This study examinesthe effects of market alternatives, third party intervention and third party informedness in transfer pricingnegotiation.
Experiment 1 examined the effects of market alternatives in a fully crossed design of buyer and seller’s BestAlternatives To a Negotiated Agreement (BATNA) at four levels (no, low, medium, or high). Experiment 2examined the effects of third party intervention with reference to role (binding vs. nonbinding) and informedness(informed vs. uninformed).
Results of Experiment 1 indicated that both the existence and level of market alternatives affected reservationprices, expected profits, aspiration levels, and individual profits. Dyads with unequal BATNAs did not obtainhigher joint profits than those with equal BATNAs, while dyads with unequal BATNAs distributed profits moreunevenly between negotiators than dyads with equal BATNAs. Results of Experiment 2 indicated that onlymaking the third party’s role binding had an effect on joint profits. However, the presence of a third party andboth the role and informedness manipulations affected resource distribution.
Key words: market alternatives, BATNA, third party intervention, mediation, information exchange
Transfer pricing has recently attracted attention in the popular press as a means of avoidingtaxes for multinational firms (Martz and Thomas 1991). However, the most common usesof transfer pricing still pertain to its divisional decision-facilitation and incentive capabilities.When a division of a decentralized firm sells a product or service to another divisionwithin the firm, it becomes necessary to set an internal selling price, or transfer price, forthe items or services involved in the exchange. The difference between the productioncost and the transfer price represents profit to the selling division and the difference betweenthe transfer price and market selling price represents profit to the buying division. Thus,the prices that are set for internal transfers are one way of allocating profit among divisions.
82 ARUNACHALAM ET AL.
When divisions or their managers are evaluated based on profit, transfer prices can affectperformance measures. Because transfer prices influence the performance evaluationprocess, conflicts can arise between divisions over transfer pricing terms (Kaplan andAtkinson 1989).
In a few cases, the appropriate transfer price is clear: (1) market price when a singlecompetitive market exists, or (2) variable (out-of-pocket) cost plus markup when there isno outside market or there is idle production capacity (Kaplan and Atkinson 1989). Theunifying concept is opportunity cost. However, in intermediate cases, opportunity costdoes not provide a unique transfer price. For example, suppose a division is able to producean item with variable costs of $29 per unit and has an accepted outside bid to sell anyamount of product produced at $35 per unit. At the same time, if this producing divisionsold the product internally, it would save $5 per unit in packaging costs. Now, supposethere is a second division within the same company that can also use the product. Thisbuying division has an outside source that will sell to it for $34 per unit. What, then, is theappropriate transfer price? It is probably somewhere between $30 (the net revenue theselling division will forego if it sells internally) and $34 (the amount the buying divisionwould forego if it purchased externally). The exact amount of the transfer price will dependon the mechanism used by the buying and selling divisions to set the transfer price.
Negotiation is one possible mechanism for setting transfer prices when no unique transferprice is obviously correct (Watson and Baumler 1975; Spicer 1988). It allows divisionalmanagers to run their divisions with some autonomy, because the transfer price is notdictated by top management or corporate policy. Negotiation also serves as a facilitationmechanism for divisional decision making and as an incentive tool for divisional managers(Kaplan and Atkinson 1989). Surveys by Umapathy (1978), Tang (1979), and Vancil (1979)have shown that approximately 20% of surveyed firms use negotiation to arrive at transferprices. Given this prevalence of negotiated transfer prices in the business world and thebalance that they can strike between divisional autonomy and goal congruency, negotiationhas been suggested as a promising and acceptable means of arriving at transfer prices.
Transfer pricing outcomes are meaningful at both the individual (i.e., division manager)and group (i.e., corporate) levels. The existence of transfer pricing conflicts, however,confirms that in entities where managers are evaluated on divisional profits, incongruitiescan occur between divisional goals and central management’s goal of maximizing overallcompany profits. It must be noted, however, that there is no guarantee that negotiatedtransfer prices will facilitate decision-making at the divisional level in a manner that isconsistent with corporate objectives. Negotiated transfer prices may lead to divisionalopportunism and interdivisional conflict when differential levels of market alternativesare available, creating unequal bargaining power between divisions. Interdivisional conflictderiving from unequal bargaining power may eclipse the welfare of the organization as awhole.
A question underlying this issue is: how are interdivisional transfer pricing negotiationsaffected by the presence and quality of market alternatives? On the one hand, the availabilityof a market alternative gives its owner leverage with his negotiation counterpart; on theother, the market alternative may provide an alternative that is attractive to its owner, butnot in the best interest of the company as a whole. The first part of this study (Experiment 1)
83ALTERNATIVES AND INTERVENTION IN NEGOTIATION
provides answers to these questions by examining the effects of outside market alternativeson multiple sessions of transfer pricing negotiation. The study is conducted in a laboratorysetting, extending recently published work by Chalos and Haka (1990) and Pinkley et al.(1994).
While an advantage of negotiated transfer prices is the maintenance of divisionalautonomy, corporate management may at times find it necessary to intervene in the transferpricing negotiation process in certain problematic situations. First, intervention may occurwhen it appears unlikely that managers will reach agreement on their own (i.e., the likelihoodof impasse is high). Second, management may also wish to intervene in cases when divisionmanagers have unequal bargaining power. In such cases, managers negotiating in theabsence of a third party may settle on agreements that are incentive compatible for onemanager, but are suboptimal for the other manager and for the firm as a whole.
Two important issues with respect to third-party intervention in transfer pricingnegotiations are the type of intervention to be used and the amount of negotiators’ privateinformation to be provided to the third party. Making the third party’s recommendationsbinding, instead of non-binding, usurps divisional autonomy. Similarly, providing privatedivisional information on negotiation outcomes and outside market opportunities to thethird party may be seen as a type of interference with divisional autonomy. At the sametime, research evidence suggests that both the presence of a third party (Kochan and Jick1978) and the type of intervention carried out by the third party (Conlon et al. 1994) mayaffect negotiation outcomes. The effect of third-party informedness on negotiation outcomeshas not been directly studied, but research does suggest that facilitation of informationexchange may improve negotiation outcomes (Arunachalam and Dilla 1992, 1995;Thompson 1992; Valley et al. 1992b). Consequently, the decisions of whether to: (1) use athird-party intervenor, (2) have the third party’s recommendations be binding ornon-binding, and (3) provide the third party with certain types of private divisionalinformation, all represent tradeoffs between interference with divisional autonomy andpotential improvements in negotiation outcomes (and firm profits). In the second part ofthis study (Experiment 2), we examine the effects of third party intervention and thirdparty informedness on transfer pricing negotiation outcomes.
1. Experiment 1
1.1. Background: Market alternatives
Negotiated transfer price systems offer managers a mechanism for utilizing the specializedinformation that they possess about local opportunities and for responding in a more timelyfashion (Kaplan and Atkinson 1989). However, a negotiation approach to determiningtransfer prices may consume excessive time and increase the likelihood of impasses betweennegotiating parties (Kaplan and Atkinson 1989; Horngren and Foster 1991). The potentialfor conflict between divisions is also one of the limitations of negotiation (Kaplan andAtkinson, 1989). Due to various factors such as differences in managerial negotiationskill, uncontrollable aspects of managerial performance, and the possibility and scope of
84 ARUNACHALAM ET AL.
future interaction, unequal power can also exacerbate conflict and alter (or create)perceived inequities between divisional managers.
The ability to achieve integrative outcomes in transfer pricing negotiations may befurther complicated by situations in which differential levels of outside market opportunitiesare available. For example, consider a situation in which Division A of a corporation sellsa highly profitable item to an outside purchaser. Division B needs a similar item for aproduct it plans to manufacture, but outside sources are expensive relative to what it coststo produce the product internally. A has relatively more bargaining power than B becauseof its more favorable outside market opportunities. At the same time, B may feel that A istaking unfair advantage of its position in negotiations, thus increasing conflict betweenthe two divisions, and eclipsing the welfare of the organization as a whole.
1.2. Theory and hypotheses: Market alternatives
The market alternatives available to participants in transfer pricing negotiations can becharacterized as Best Alternatives To a Negotiated Agreement (BATNAs). While BATNAsand their relationship to negotiator power have been discussed extensively at a theoreticallevel in the bargaining literature (Fisher and Ury 1981; Raiffa 1982), it is only recentlythat researchers have empirically examined their effects on aspiration levels and negotiatedoutcomes (McAlister et al. 1986; Chalos and Haka 1990; Pinkley et al. 1994; also seeWhite and Neale 1994; White et al. 1994).
In the first published study to systematically examine the impact of alternatives onjoint benefit, McAlister et al. (1986) manipulated bargaining power by varying thenumber of available alternatives. They found that more integrative agreements wereobtained under conditions of equal power than unequal power between negotiators (cf.McClintock et al. 1973). McAlister et al.’s results contrast with those of Roloff andDailey (1987), who found that dyads (bargaining pairs) with unequal power obtainedmore integrative agreements than dyads with equal power. This provides some supportto the notion that unequal power can induce the lower power negotiator or bothnegotiators to expend additional effort to locate better solutions (cf. Komorita et al.1968).
Chalos and Haka (1990) manipulated the riskiness of the available alternative in theirtransfer pricing study. They examined conditions with no, “certain”, “uncertain” externalmarkets. In “certain” markets, the market opportunity alternated between buyer and sellerfrom one period to the next, while in “uncertain” markets there was only a 50% chancethat either party would have a market opportunity in the next period. They also manipulatedthe incentive pay scheme, compensating participants either on divisional profit only or onthe profit of the overall firm. The market alternative manipulation alone did not affectoverall firm profit (the sum of buyer and seller profits). Market alternatives affected profitdifferences (the profit split between buyer and seller) only when negotiators had divisionalincentives. The greatest differences occurred with uncertain markets and the smallest withno outside markets. However, market alternatives did not affect profit differences whenmanagers’ pay was based on overall firm profit.

85ALTERNATIVES AND INTERVENTION IN NEGOTIATION
Pinkley et al. (1994) investigated the effects of BATNAs on negotiator behavior in jobcontract negotiations, manipulating recruiters’ and candidates’ BATNAs at three levels(high, low, and none) in a fully crossed design. They found that negotiators with highBATNAs outperformed those with low or no BATNA. Agreements in conditions whereone negotiator had a low BATNA and the other had no BATNA provided greater jointbenefit than when both negotiators had the same (low or no) BATNA, providing somesupport to Roloff and Dailey (1987). This effect on joint benefit did not carry through,however, for the comparison between low and high BATNAs. Also, unequal BATNAsinfluenced resource distribution within dyads, in that negotiators with higher BATNAstended to achieve greater outcomes.
There are important substantive differences among these studies in the way BATNAswere manipulated. The high BATNA value in Pinkley et al. (1994) was less than theintegrative solution outcome, while the BATNA in Chalos and Haka (1990) was 10%greater than the integrative solution outcome. In contrast, McAlister et al.’s (1986) “BATNAmanipulation” was in terms of the number of available transactions rather than the valueof an alternative transaction, while the BATNA value in Roloff and Dailey was lower thanthe minimally acceptable agreement. The design in Experiment 1 of the current studyreconciles some of the differences among these papers. First, it includes BATNAs that areboth greater and less than the integrative solution outcome. The use of a finer gradation ofBATNAs (no, low, medium, and high, as contrasted with no, low, and high) facilitates ananalysis of whether the role of BATNA in influencing expectations and outcomes is alteredby different definitions of the level of BATNA. Second, the use of more than one periodenables an examination of whether some of the behaviors observed in Pinkley et al. (1994)may have been due to their single period context. “Phantom” BATNAs and apparentoverconfidence about reservation prices, expected performance, and aspiration levels maydecrease with experience. Third, the use of a “high” BATNA that really is high enables aninvestigation of whether the “bias towards settlement” observed in Pinkley et al. (1994)still occurs, even when one of the negotiators’ BATNAs is greater than the payoffs availablefrom an integrative solution (as contrasted with a high BATNA that is lower than theintegrative solution). In addition, the study extends the institutional features of the transferpricing scenario beyond that modeled in Chalos and Haka (1990) by including experimentalmanipulations in which both parties have BATNAs, instead of just one.
From a conceptual standpoint, BATNAs are an important link in understanding theantecedents to integrative agreement. First, they are associated with the determination of athreshold or reservation price, i.e., a bottom line for the negotiator. Barring high transactioncosts for taking an alternative or special utility for reaching a negotiated agreement, anegotiator’s BATNA influences this bottom line (Pinkley et al. 1994). Specifically, theBATNA can be expected to be valued at less than the reservation price.
Second, the value of the BATNA can affect a negotiators’ expected profits and aspirationlevel. That is, the higher the BATNA, the greater a negotiator will expect and aspire toearn. However, what a negotiator aspires for may frequently be a more ambitious targetthan what he/she hopes to accomplish (or may settle for) in reality. This suggests thataspiration levels will be greater than expected profits, which will in turn be greater thanreservation prices.
86 ARUNACHALAM ET AL.
The above discussion suggests the following hypotheses:
H1A: Stated reservation prices are significantly greater than BATNAs,H1B: Expected profits are significantly greater than BATNAs,H2A: Stated reservation prices increase as BATNAs increase,H2B: Expected profits increase as BATNAs increase,H2C: Aspiration levels increase as BATNAs increase,H3A: Expected profits are greater than stated reservation prices,H3B: Aspiration levels are greater than stated reservation prices and expected profits.
Pinkley et al.’s (1994) results also suggest that negotiators are overconfidentregarding their desired outcome. Specifically, negotiator expectations as manifestedin measures of reservation price, expected profits, and aspiration levels are guidedby their BATNAs: they may tend to use their BATNAs when the BATNAs are nonzero,and phantom BATNAs when the BATNAs are zero. This leads to an interesting questionof whether overconfidence observed on the part of negotiators with zero BATNAsmay be affected by the passage of time. Pinkley et al. (1994) do not address thisissue, but the current study does by virtue of its repeated measures design. We expectthat negotiator overconfidence in the no BATNA condition will decrease with thepassage of time, due to considerations of reality (i.e., non-existence of a meaningfulalternative). This is expected to be manifested in significant differences in reservationprices, etc., between sessions in the no BATNA condition. This suggests the followingset of hypotheses.
H4A: Stated reservation prices will decrease between sessions for negotiators with noBATNAs,
H4B: Expected profits will decrease between sessions for negotiators with no BATNAs,H4C: Aspiration levels will decrease between sessions for negotiators with no BATNAs.
When operationalized as the profit obtained when a negotiated agreement is not reached,BATNAs surrogate for negotiator bargaining power (Lewicki and Litterer 1985). Thissuggests that individual negotiators with higher BATNAs should be able to earn higherprofits., Depending on their magnitude and distribution across disputants, BATNAs canbe an effective means of creating equal or unequal power within a dyad.
Equal power can foster cooperation and equity, but it can also diminish the incentiveto expend cognitive effort in developing an integrative agreement. This can be trueparticularly when both negotiators have (or perceive each other as having) attractive marketalternatives. At one extreme, if both negotiators have very high alternatives, they arelikely to just go ahead and take their outside market alternatives; at another extreme, ifboth negotiators have very low alternatives, they are likely to engage in satisficing. Onthe other hand, unequal power can induce negotiators (particularly the one with less power)to work harder toward developing creative/innovative solutions, expanding the pie, andfashioning integrative agreements, therefore improving joint benefit (Roloff and Dailey1987; cf. Komorita et al. 1968).
87ALTERNATIVES AND INTERVENTION IN NEGOTIATION
However, barring high transaction costs in taking the market alternative and/or specialutility in reaching a negotiated agreement (i.e., not taking the market alternative), unequalpower can also result in the negotiator with the greater power calling the shots and obtaininga bigger share of the outcome pie. It can also decrease the likelihood of internal settlementand increase the likelihood of impasse or external transaction. These factors could work toreduce joint benefit for unequal power dyads, as well as increase resource distributioninequality for such dyads.
Based on the above discussion and the preceding hypotheses, the following hypothesesare suggested:
H5: Individual performance increases as the BATNA level increases.H6A: Individual performance is positively correlated with reservation prices.H6B: Individual performance is positively correlated with expected profits.H6C: Individual performance is positively correlated with aspiration levels.H7: The highest rate of impasse will occur in dyads where both parties have high
BATNAs.H8A: For dyads with negotiated agreements, equal power dyads will obtain higher joint
benefit that unequal power dyads.H8B: For dyads with negotiated agreements, equal power dyads will obtain more equal
resource distribution that unequal power dyads.
1.3. Method
1.3.1. Participants and design overview. Three hundred and thirty-eight undergraduatestudents enrolled in managerial accounting classes at a large midwestern universityparticipated in the study. Students received course credit for participation. They hadcovered transfer pricing in class, but had not previously participated in negotiationexercises with respect to transfer pricing or any other accounting issues. Participantswere randomly assigned to one of two role conditions: buyer or seller (labeled in theexperimental materials as “Pocono Division” and “Delaware Division” respectively).They were also assigned to one of four BATNA conditions: none, low, medium, or high.All possible combinations of BATNA levels negotiated with each other, resulting in afully crossed 4 × 4 design.
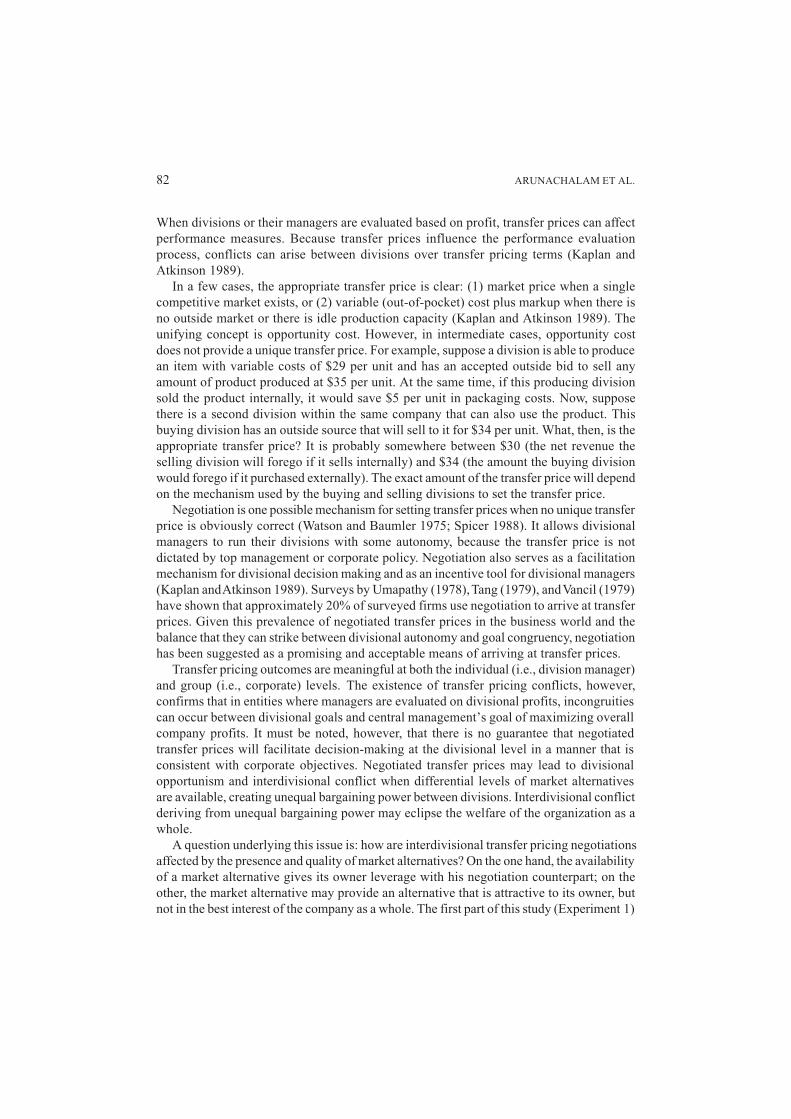
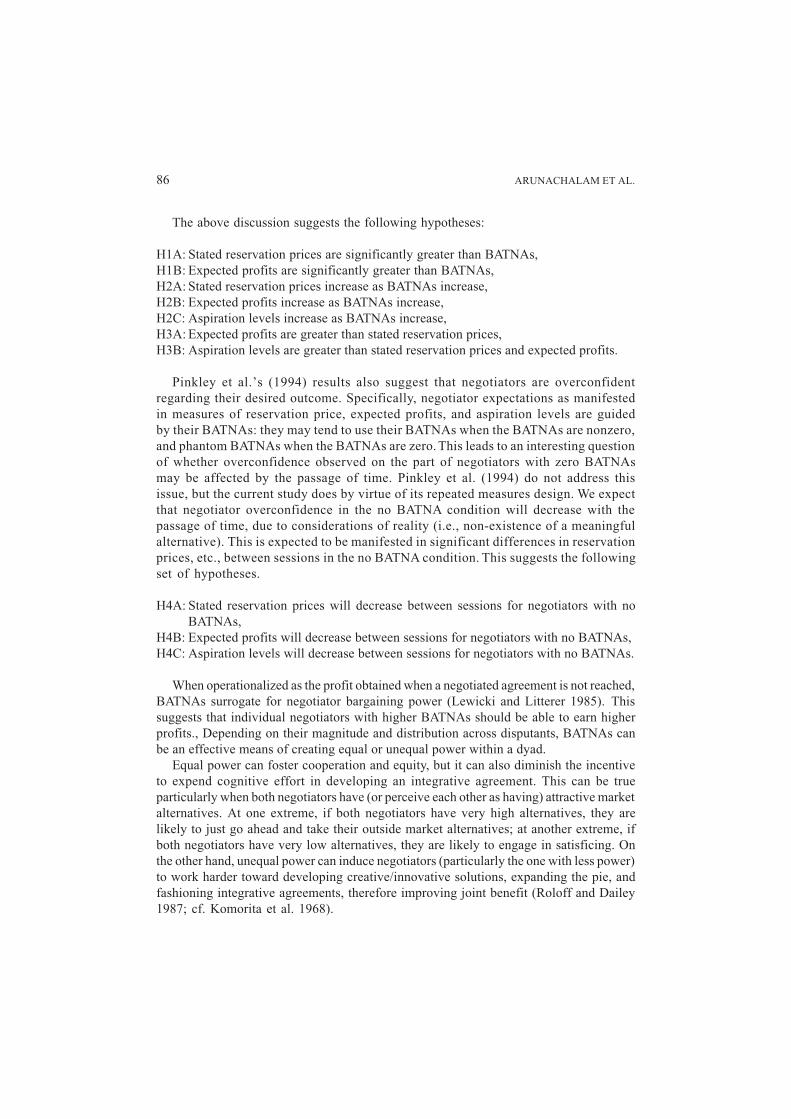
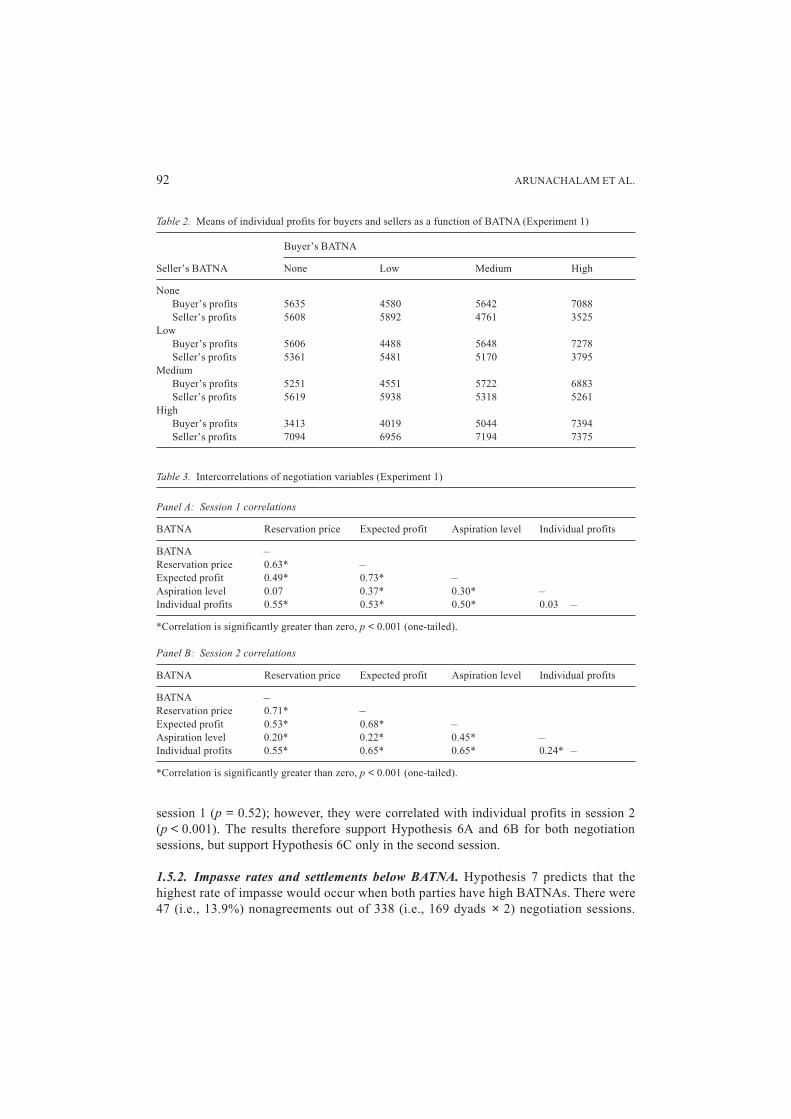
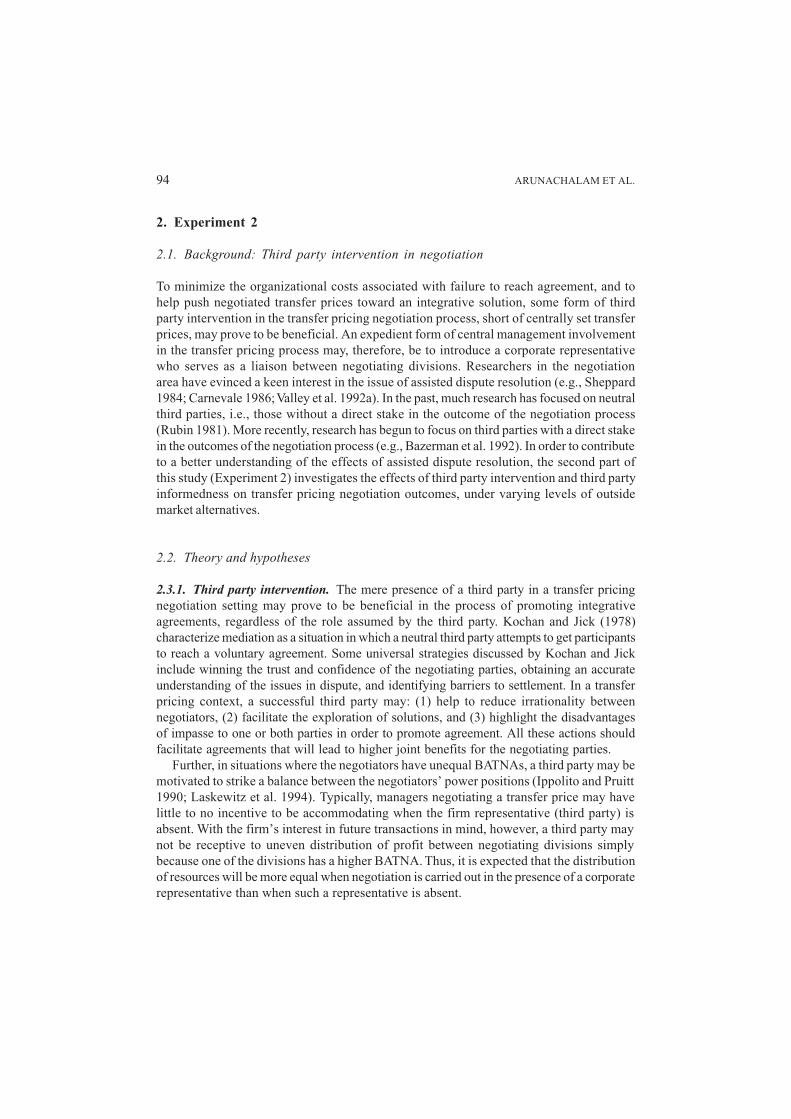
1.3.2. Task. The task involved negotiation between buying division (Pocono) and sellingdivision (Delaware) managers over internal product transfer pricing terms including price,quality, and timeliness of delivery. There were three different product components in thenegotiation, each of which had five alternative levels of consideration (see Figure 1). Withineach of the three components, the alternatives represented different combinations of price,quality, and timeliness of delivery, reflecting the non-zero sum nature of transfer pricingnegotiation and the integrative potential inherent in it.
The task has an integrative solution, that is, tradeoffs on issues (such as quality) canincrease the sum total of participants’ utilities, relative to compromise at the midpoint on
88 ARUNACHALAM ET AL.
each issue. For each of the three components, two were of differing priorities to the twonegotiators and one was of equal priority. This presented logrolling potential and providedan opportunity for distributive compromise as well as integrative agreements.
4.3.3. Procedure. All participants received general instructions about a transferpricing negotiation and their role description before the exercise began. Participantswere told that the selling division could supply three specialized components neededby the buying division to produce and market a new product. Under certaincircumstances, the selling division could sell the components outside the firm andthe buying division could purchase the components outside the firm. Because of thelimited market for the components, participants were to negotiate transfer pricingterms, rather than trading at a given market price. Participants were informed that
Delaware division (selling division)Profit schedule – Period 1
Component X Component Y Component Z
Price Profit ($) Price Profit ($) Price Profit ($)
A 500 A 500 A 500B 625 B 750 B 1000C 750 C 1000 C 1500D 875 D 1250 D 2000E 1000 E 1500 E 2500F 1125 F 1750 F 3000G 1250 G 2000 G 3500H 1375 H 2250 H 4000I 1500 I 2500 I 4500
Pocono division (buying division)Profit schedule – Period 1
Component X Component Y Component Z
Price Profit ($) Price Profit ($) Price Profit ($)
A 4500 A 2500 A 1500B 4000 B 2250 B 1375C 3500 C 2000 C 1250AD 3000 D 1750 D 1125E 2500 E 1500 E 1000F 2000 F 1250 F 875G 1500 G 1000 G 750H 1000 H 750 H 625I 500 I 500 I 500
Figure 1. Sample payoff tables – Experiment 1.
89ALTERNATIVES AND INTERVENTION IN NEGOTIATION
either division manager may take advantage of an outside opportunity if it is available,but also that corporate management has encouraged them to consider the overallwelfare of the corporation in making their decisions. Other than this brief statementabout corporate welfare, participants were not given any explicit instructions as tonegotiation behavior (i.e., whether they were to behave competitively, cooperatively,or individualistically).
Each pair of participants negotiated for two periods. If a negotiator, especiallyone with a higher BATNA than their partner, knows a given negotiation session is thelast one, they might be tempted to behave non-cooperatively (cf. Friedman 1990;Rapoport and Chammah 1965). Therefore, to avoid “end-of-game” behavior,participants were not told how many periods they would be negotiating, only that theexercise would last more than one period. At the beginning of each negotiation period,participants received their own payoff schedules and information on their outsidemarket opportunities. They were not allowed to show each other their payoff schedules.Before each period’s negotiation commenced, participants filled out a questionnairein which they indicated: (1) the minimum point value they would accept for each ofthe components in the negotiation (i.e., a reservation price), (2) an expectedperformance level, and (3) an aspiration level. Once negotiation commenced,participants had twenty minutes within which to come to agreement. Participants wereinformed that if they failed to reach agreement in a given round, they would receivetheir BATNA value.
The payoff tables in the second session were a linear transformation of those in thefirst. The second set of payoff tables was created by multiplying all values in the first setby 1.2. The order of presentation of payoff tables was randomized (i.e., one-half of allnegotiating pairs received the tables with the larger payoffs first) and balanced acrossexperimental conditions.
Both negotiators received 6500 points (7800 points with the transformed tables) ifthey reached an integrative solution. Point equivalents for the BATNA levels were asfollows (equivalents for transformed tables in parentheses): low – 2500 (3000) points,medium – 5000 (6000) points, and high – 7500 (9000) points. Participants in the lowand medium BATNA conditions therefore had outside market alternatives that yieldedlower profits than a fully integrative settlement; participants in the high BATNAconditions had an outside market alternative that yielded greater profits than a fullyintegrative settlement.
1.3.4. Dependent variables and method of analysis. Dependent variables at theindividual level of analysis were reservation price, expected performance, aspiration level,and profits. These variables were analyzed using MANOVA with BATNA level and role asindependent variables. Dependent variables at the dyad level of analysis were joint profitsand the absolute value of the buyer’s minus the seller’s outcome (buyer–seller profitdifferences). Observations at the dyad level were organized into three groups for analysisdepending on the relative level of the negotiators’ BATNAs, i.e., dyads where: (1) bothnegotiators had equal BATNAs, (2) the seller’s BATNA was higher than the buyer’s, or (3)the buyer’s BATNA was higher than the seller’s.
90 ARUNACHALAM ET AL.
1.4. Results – reservation prices, aspiration levels, and expected performance
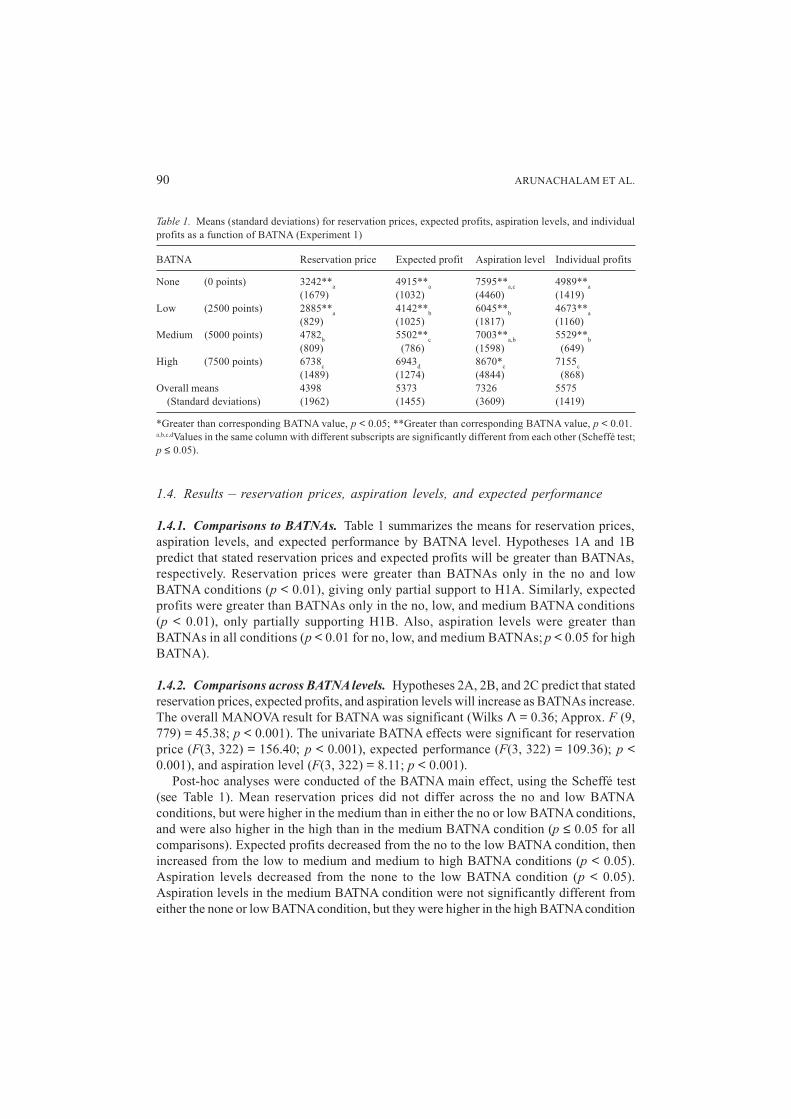
1.4.1. Comparisons to BATNAs. Table 1 summarizes the means for reservation prices,aspiration levels, and expected performance by BATNA level. Hypotheses 1A and 1Bpredict that stated reservation prices and expected profits will be greater than BATNAs,respectively. Reservation prices were greater than BATNAs only in the no and lowBATNA conditions (p < 0.01), giving only partial support to H1A. Similarly, expectedprofits were greater than BATNAs only in the no, low, and medium BATNA conditions(p < 0.01), only partially supporting H1B. Also, aspiration levels were greater thanBATNAs in all conditions (p < 0.01 for no, low, and medium BATNAs; p < 0.05 for highBATNA).
1.4.2. Comparisons across BATNA levels. Hypotheses 2A, 2B, and 2C predict that statedreservation prices, expected profits, and aspiration levels will increase as BATNAs increase.The overall MANOVA result for BATNA was significant (Wilks Λ = 0.36; Approx. F (9,779) = 45.38; p < 0.001). The univariate BATNA effects were significant for reservationprice (F(3, 322) = 156.40; p < 0.001), expected performance (F(3, 322) = 109.36); p <0.001), and aspiration level (F(3, 322) = 8.11; p < 0.001).
Post-hoc analyses were conducted of the BATNA main effect, using the Scheffé test(see Table 1). Mean reservation prices did not differ across the no and low BATNAconditions, but were higher in the medium than in either the no or low BATNA conditions,and were also higher in the high than in the medium BATNA condition (p ≤ 0.05 for allcomparisons). Expected profits decreased from the no to the low BATNA condition, thenincreased from the low to medium and medium to high BATNA conditions (p < 0.05).Aspiration levels decreased from the none to the low BATNA condition (p < 0.05).Aspiration levels in the medium BATNA condition were not significantly different fromeither the none or low BATNA condition, but they were higher in the high BATNA condition
Table 1. Means (standard deviations) for reservation prices, expected profits, aspiration levels, and individualprofits as a function of BATNA (Experiment 1)
BATNA Reservation price Expected profit Aspiration level Individual profits
None (0 points) 3242**a 4915**a 7595**a,c 4989**a
(1679) (1032) (4460) (1419)Low (2500 points) 2885**a 4142**b 6045**b 4673**a
(829) (1025) (1817) (1160)Medium (5000 points) 4782b 5502**c 7003**a,b 5529**b
(809) (786) (1598) (649)High (7500 points) 6738c 6943d 8670*c 7155c
(1489) (1274) (4844) (868)Overall means 4398 5373 7326 5575
(Standard deviations) (1962) (1455) (3609) (1419)
*Greater than corresponding BATNA value, p < 0.05; **Greater than corresponding BATNA value, p < 0.01.a,b,c,dValues in the same column with different subscripts are significantly different from each other (Scheffé test;p ≤ 0.05).
91ALTERNATIVES AND INTERVENTION IN NEGOTIATION
than in the low and medium BATNA conditions (p < 0.05). These results are only partiallyconsistent with Hypotheses 2A, 2B, and 2C. All three dependent measures followed anonlinear pattern across BATNA levels, either remaining the same (i.e., reservation prices)or decreasing (i.e., expected profit and aspiration levels) from the no to the low BATNAlevel, then tending to increase as BATNA increased.
1.4.3. Comparisons among reservation prices, aspiration levels, and expectedperformance. Hypothesis 3A predicts that expected profits will be greater than statedreservation prices; Hypothesis 3B predicts that aspiration levels will be greater than bothstated reservation prices and expected profits. As predicted, expected profits were greaterthan reservation prices at all BATNA levels (p < 0.05 for the high BATNA condition; p <0.001 in all other BATNA conditions). Similarly, aspiration levels were greater than bothaverage reservation prices and expected profits (p < 0.001 in all BATNA conditions).
1.4.4. Comparisons across negotiation sessions for participants with zeroBATNAs. Hypotheses 4A, 4B, and 4C predict that, for participants with zero BATNAs,stated reservation prices, expected profits, and aspiration levels will decrease from thefirst to the second negotiation session. Marginally significant decreases occurred forreservation prices (F(1, 322) = 3.15; p < 0.08) and expected profits (F(1, 322) = 3.05; p <0.08). Reservation prices averaged 3376 points in the first and 3108 points in the secondnegotiation session, while expected profits averaged 5043 points in the first and 4790points in the second session. Aspiration levels decreased significantly (F(1, 322) = 5.69;p < 0.02) from the first (8266) to the second (6852) negotiation session.
1.5. Results – negotiation outcomes
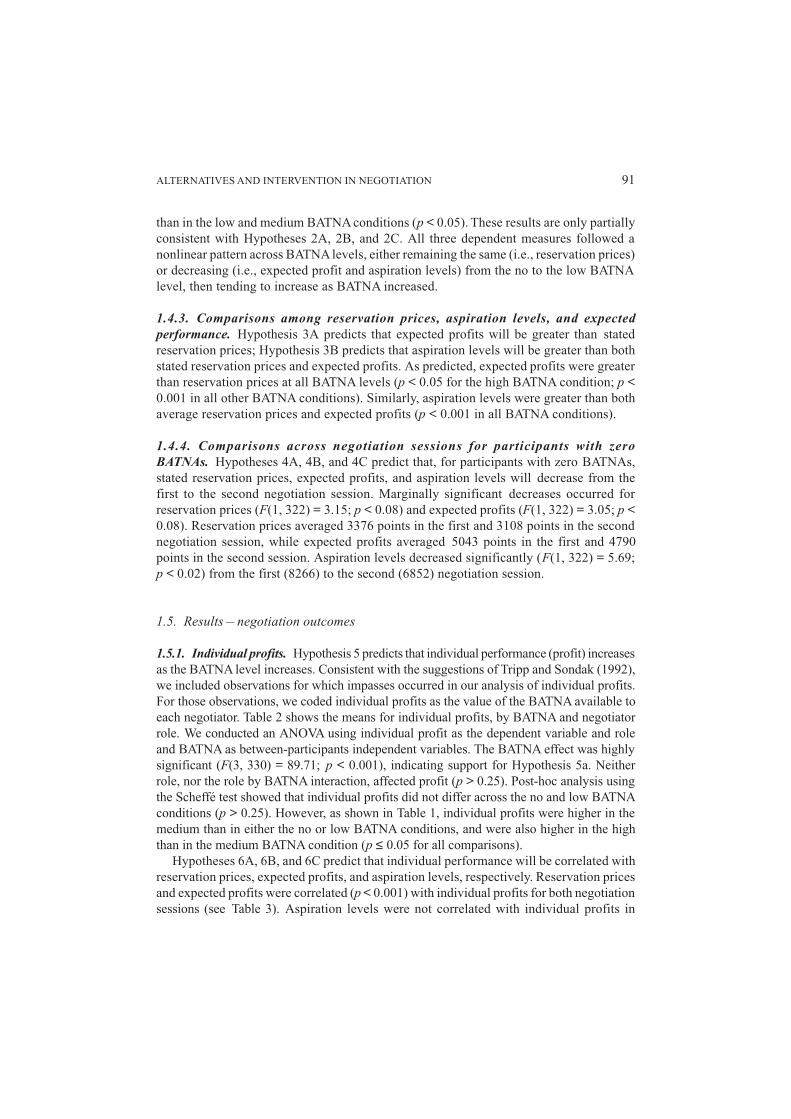
1.5.1. Individual profits. Hypothesis 5 predicts that individual performance (profit) increasesas the BATNA level increases. Consistent with the suggestions of Tripp and Sondak (1992),we included observations for which impasses occurred in our analysis of individual profits.For those observations, we coded individual profits as the value of the BATNA available toeach negotiator. Table 2 shows the means for individual profits, by BATNA and negotiatorrole. We conducted an ANOVA using individual profit as the dependent variable and roleand BATNA as between-participants independent variables. The BATNA effect was highlysignificant (F(3, 330) = 89.71; p < 0.001), indicating support for Hypothesis 5a. Neitherrole, nor the role by BATNA interaction, affected profit (p > 0.25). Post-hoc analysis usingthe Scheffé test showed that individual profits did not differ across the no and low BATNAconditions (p > 0.25). However, as shown in Table 1, individual profits were higher in themedium than in either the no or low BATNA conditions, and were also higher in the highthan in the medium BATNA condition (p ≤ 0.05 for all comparisons).
Hypotheses 6A, 6B, and 6C predict that individual performance will be correlated withreservation prices, expected profits, and aspiration levels, respectively. Reservation pricesand expected profits were correlated (p < 0.001) with individual profits for both negotiationsessions (see Table 3). Aspiration levels were not correlated with individual profits in
92 ARUNACHALAM ET AL.
session 1 (p = 0.52); however, they were correlated with individual profits in session 2(p < 0.001). The results therefore support Hypothesis 6A and 6B for both negotiationsessions, but support Hypothesis 6C only in the second session.
1.5.2. Impasse rates and settlements below BATNA. Hypothesis 7 predicts that thehighest rate of impasse would occur when both parties have high BATNAs. There were47 (i.e., 13.9%) nonagreements out of 338 (i.e., 169 dyads × 2) negotiation sessions.
Table 2. Means of individual profits for buyers and sellers as a function of BATNA (Experiment 1)
Buyer’s BATNA
Seller’s BATNA None Low Medium High
NoneBuyer’s profits 5635 4580 5642 7088Seller’s profits 5608 5892 4761 3525
LowBuyer’s profits 5606 4488 5648 7278Seller’s profits 5361 5481 5170 3795
MediumBuyer’s profits 5251 4551 5722 6883Seller’s profits 5619 5938 5318 5261
HighBuyer’s profits 3413 4019 5044 7394Seller’s profits 7094 6956 7194 7375
Table 3. Intercorrelations of negotiation variables (Experiment 1)
Panel A: Session 1 correlations
BATNA Reservation price Expected profit Aspiration level Individual profits
BATNA –Reservation price 0.63* –Expected profit 0.49* 0.73* –Aspiration level 0.07 0.37* 0.30* –Individual profits 0.55* 0.53* 0.50* 0.03 –
*Correlation is significantly greater than zero, p < 0.001 (one-tailed).
Panel B: Session 2 correlations
BATNA Reservation price Expected profit Aspiration level Individual profits
BATNA –Reservation price 0.71* –Expected profit 0.53* 0.68* –Aspiration level 0.20* 0.22* 0.45* –Individual profits 0.55* 0.65* 0.65* 0.24* –
*Correlation is significantly greater than zero, p < 0.001 (one-tailed).
93ALTERNATIVES AND INTERVENTION IN NEGOTIATION
The impasse rate in Session 1 (14.8%) was not significantly greater than the rate inSession 2 (13.0%) (p = 0.64). Forty-one of the nonagreements occurred when bothbuyer and seller had high BATNAs, or when one party had a high BATNA and the other,a medium BATNA. Consistent with Hypothesis 7, the highest impasse rate (19 of 20sessions, or 95.0%) occurred when both negotiators had high BATNAs. Interestingly,the impasse rate for dyads where the buyer had a medium BATNA and the seller a highBATNA (14 of 20 sessions, or 70.0%) was higher than the impasse rate for dyads wherethe buyer had a high BATNA and the seller a medium BATNA (8 of 22 sessions, or36.4%) (p < 0.03). The impasse rate was 10% or less in all other experimentalconditions.
Consistent with Pinkley et al. (1994), we also examined the rate of settlement belowBATNA. Settlement below BATNA occurred in 2 of 170 possible cases (1.2%) forparticipants with low BATNAs and in 15 of 174 cases (8.6%) with medium BATNAs- Inthe high BATNA condition, settlement below BATNA occurred in 40 of 164 cases (24.4%).The high BATNA negotiators were paired with no or low BATNA negotiators in 27 ofthese cases (67.5%).
1.5.3. Joint benefits and resource distribution. Hypothesis 8A predicts that equalpower dyads will obtain higher joint benefit than unequal power dyads, while Hypothesis8B predicts that equal power dyads will obtain more equal resource distribution thanunequal power dyads. A problem with including dyads which took their outsidealternatives in the analysis of these hypotheses is that in the majority of such dyads,both negotiators had high BATNAs. Including these dyads in the analysis would tend tooverstate joint benefit for equal power dyads, because the joint outcomes available todyads where both negotiators had high BATNAs were higher than those attainable throughnegotiation. At the same time, including dyads where both negotiators had high BATNAswould also affect the resource distribution results, since these dyads had equal resourcedistribution. We therefore eliminated dyads which took their outside opportunities (i.e.,those that could not reach a negotiated transfer price) from the analysis of joint benefitand resource distribution.
To test Hypotheses 8A and 8B, we compared joint benefit (the sum of buyer and sellerprofit) and the absolute value of the buyer’s minus the seller’s profit across dyads where:(1) both negotiators had equal BATNAs, (2) the seller’s BATNA was higher than the buyer’s,and (3) the buyer’s BATNA was higher than the seller’s. Joint profits were equal acrossthe three groups (F(2, 139) = 0.07; p < 0.93), not supporting Hypothesis 8A. Consistentwith Pinkley et al. (1994), we also compared joint benefit across dyads with equal andunequal BATNAs for dyads where: (1) participants had either no or low BATNAs and (2)participants had either low or medium BATNAs. Results were not significant in eithercase (p > 0.75). The absolute value of outcome differences was affected by whether thenegotiators had equal BATNAs or not (F(2, 139) = 5.06; p = 0.01). Post-hoc analysesusing Scheffé tests showed that, consistent with Hypothesis 8B, the absolute value ofoutcome differences was lower when both negotiators had the same BATNA (924) thanwhen either the seller or buyer had the higher BATNA (1834 for seller higher; 1991 forbuyer higher; p < 0.05 for both comparisons).
94 ARUNACHALAM ET AL.
2. Experiment 2
2.1. Background: Third party intervention in negotiation
To minimize the organizational costs associated with failure to reach agreement, and tohelp push negotiated transfer prices toward an integrative solution, some form of thirdparty intervention in the transfer pricing negotiation process, short of centrally set transferprices, may prove to be beneficial. An expedient form of central management involvementin the transfer pricing process may, therefore, be to introduce a corporate representativewho serves as a liaison between negotiating divisions. Researchers in the negotiationarea have evinced a keen interest in the issue of assisted dispute resolution (e.g., Sheppard1984; Carnevale 1986; Valley et al. 1992a). In the past, much research has focused on neutralthird parties, i.e., those without a direct stake in the outcome of the negotiation process(Rubin 1981). More recently, research has begun to focus on third parties with a direct stakein the outcomes of the negotiation process (e.g., Bazerman et al. 1992). In order to contributeto a better understanding of the effects of assisted dispute resolution, the second part ofthis study (Experiment 2) investigates the effects of third party intervention and third partyinformedness on transfer pricing negotiation outcomes, under varying levels of outsidemarket alternatives.
2.2. Theory and hypotheses
2.3.1. Third party intervention. The mere presence of a third party in a transfer pricingnegotiation setting may prove to be beneficial in the process of promoting integrativeagreements, regardless of the role assumed by the third party. Kochan and Jick (1978)characterize mediation as a situation in which a neutral third party attempts to get participantsto reach a voluntary agreement. Some universal strategies discussed by Kochan and Jickinclude winning the trust and confidence of the negotiating parties, obtaining an accurateunderstanding of the issues in dispute, and identifying barriers to settlement. In a transferpricing context, a successful third party may: (1) help to reduce irrationality betweennegotiators, (2) facilitate the exploration of solutions, and (3) highlight the disadvantagesof impasse to one or both parties in order to promote agreement. All these actions shouldfacilitate agreements that will lead to higher joint benefits for the negotiating parties.
Further, in situations where the negotiators have unequal BATNAs, a third party may bemotivated to strike a balance between the negotiators’ power positions (Ippolito and Pruitt1990; Laskewitz et al. 1994). Typically, managers negotiating a transfer price may havelittle to no incentive to be accommodating when the firm representative (third party) isabsent. With the firm’s interest in future transactions in mind, however, a third party maynot be receptive to uneven distribution of profit between negotiating divisions simplybecause one of the divisions has a higher BATNA. Thus, it is expected that the distributionof resources will be more equal when negotiation is carried out in the presence of a corporaterepresentative than when such a representative is absent.
95ALTERNATIVES AND INTERVENTION IN NEGOTIATION
H9A:Negotiators will achieve higher joint benefit when negotiations are carried out witha third party present than without such a party present.
H9B: Negotiators will achieve more equal profit distribution when negotiations are carriedout with a third party present than without such a party present.
2.2.2. Intervenor’s role. The literature on third-party intervention in negotiation (seeCarnevale and Pruitt 1992, for a review) has characterized intervenors in one of twoclassic roles, depending on whether they have decision control over the actions of thenegotiators (Pruitt 1981). Mediators lack decision control. They can suggest solutions,but cannot impose an agreement. Arbitrators have decision control. They must provide asettlement which typically is binding on both sides. More recently, Murnighan (1986)has defined another type of third party, known as an intravenor, who has the power toimpose a settlement, but also has the freedom not to. Unlike the classic mediator orarbitrator, the intravenor typically is a member of the same organization as the disputants,and often has personal interests at stake in the dispute.
The third party in transfer pricing negotiation is likely to be independent of the negotiatingdivisions, but employed by the same parent corporation as the division negotiators. Becausethe welfare (i.e., total profits) of the entire organization may depend on transfer pricing termssuch as quantities produced and delivery time, the third party’s welfare also depends on theoutcome of the transfer pricing negotiation. Third parties in transfer pricing negotiationsmay elect to impose varying degrees of control over the actions of the negotiators.
At one extreme, the third party may elect to act as an arbitrator and impose transfer pricingterms on the negotiating divisions. Arbitration, however, does not allow managers to retainsome degree of divisional autonomy. For this reason, third parties in transfer pricingnegotiations are more likely to act as mediators, giving advice to the negotiating parties,without imposing an agreement. Finally, third parties may have some power over negotiatingparties, in that third-party approval of the negotiated transfer pricing package may be requiredby company policy. This is similar to the intravenor role defined by Murnighan (1986).
In this study, we focus on mediating and intravening roles of third parties in transferpricing negotiations. We use the term “non-binding advice” to refer to a third party whodoes not have the power to impose agreements upon negotiators (i.e., a mediator). We usethe term “binding advice” to refer to a third party who must approve agreements, and mayimpose agreements when necessary (i.e., an intravenor).
Cordon et al. (1994) used Carnevale’s (1986) concern-likelihood model (also known asthe strategic choice model) and Murnighan’s (1986) model of intravention to develophypotheses regarding mediator and intravenor behavior. The concern-likelihood model(Carnevale 1986) classifies third party behavior into four basic strategies: (1) problemsolving (attempts to foster integrative agreements); (2) compensation (efforts to entice theparties into agreements via the promise of rewards); (3) pressure (efforts to force theparties into agreements via the threat of penalties); and (4) inaction (a conscious effort tolet the parties handle the conflict on their own). The model postulates that third party behaviorwill depend on their: (1) perceptions of common ground between the parties (i.e., thelikelihood estimate of a win-win agreement), and (2) level of concern that the parties achieve
96 ARUNACHALAM ET AL.
their aspirations. Additionally, Murnighan (1986) postulates that third party behavior will dependon: (1) their power over the disputants to dictate the outcome (i.e., mediation vs. intravention)and (2) the degree to which their interests are congruent with those of the negotiators.
Conlon et al. (1994) examined the effects of third party role (i.e., mediator vs.intravenor), and levels of concern, self-interest, and perceived common ground betweennegotiating parties on third party negotiation strategies. Participants’ strategies were codedinto one of five categories: the four specified by the concern-likelihood model (i.e.,problem solving, compensation, pressure, and inaction), plus imposing (i.e., dictating anagreement, instead of using a mediation strategy). Cordon et al. (1994) manipulated thefour independent variables in their study in a fully-crossed design. In the context of transferpricing, however, we are concerned only about certain combinations of these factors.
First, the mediator’s concern that negotiating parties achieve their aspirations is assumedto be high. This is likely to be the case in virtually all transfer pricing negotiations, since athird party in this context will usually desire that the negotiating parties reach an agreementthat maximizes overall firm profits, and therefore, the third party’s welfare. Second,self-interest is assumed to be low. Conlon et al. (1994) operationalize low self-interest asa situation in which the negotiators’ outcomes are congruent with that of the divisionmanagers. This is a maintained assumption of the present study. However, it should benoted that transfer pricing situations where the third party has high self-interest (i.e., hasobjectives in negotiations that are not congruent with those of the negotiators) dooccasionally occur in transfer pricing negotiation (Kaplan and Atkinson 1989). With theassumption of high concern and low self-interest, we are principally concerned aboutvarying third party roles and levels of perceived common ground.
Conlon et al.’s (1994) study and other empirical work using the concern-likelihoodmodel and its extensions does not directly examine the effects of negotiation strategieson outcomes. It appears, however, that since problem solving tends to foster integrativeagreements, it should lead to both the highest levels of joint benefit and most equaldistribution of resources. In contrast, inaction, or allowing negotiators to choose theirown agreements, should lead to the lowest levels of joint benefit and the least equaldistribution of resources. Pressing and imposing should lead to higher levels of jointbenefit than inaction. In the specific context of transfer pricing, third parties with highconcern and low self-interest should be motivated to press for or impose agreements thatwill yield high levels of joint benefit. Also, given the assumption that third parties aremotivated to strike a balance between the negotiators’ power positions, pressing orimposing should lead to more equal distribution of resources than inaction.
Conlon et al. (1994) observed that problem solving occurred frequently in all conditionswith high concern and low self-interest, regardless of perceived common ground. But,the major difference between mediators and intravenors in these conditions was thatmediators also tended to use inaction, while intravenors tended to use pressing and imposingin addition to problem solving. This suggests that in the transfer pricing negotiation contextexamined here, groups negotiating with a third party whose advice is binding will achieveboth higher joint benefit and more even profit distribution than those negotiating with athird party whose advice is non-binding.

97ALTERNATIVES AND INTERVENTION IN NEGOTIATION
H9A: Negotiators will achieve higher joint benefit when third party directives are bindingto negotiators than when such directives are non-binding.
H9B: Negotiators will achieve more even profit distribution when third party directivesare binding to negotiators than when such directives are non-binding.
6.2.3. Intervenor’s level of informedness. Research in negotiation provides evidence thatnegotiators’ inaccurate perceptions of the other party often lead to cognitive biases and,subsequently, suboptimal negotiation outcomes (Bazerman and Carroll 1987). Specifically,Thompson and Hastie (1990) suggest that negotiator misperceptions, of other parties’interests are a major cause of such suboptimal outcomes. They point out that the achievementof mutually beneficial outcomes is often plagued by the fixed-pie and incompatibilityperceptions adopted by negotiators. In reality, these are judgment errors on the part of thenegotiators because negotiators’ interests are seldom completely opposed to each other’s(Thompson 1992). The facilitation of information exchange between negotiatorssignificantly reduces these judgment errors and enhances the accuracy of negotiators’judgments about the other party, resulting in more integrative negotiation outcomes(Thompson 1992; Valley et al. 1992a; Arunachalam and Dilla 1995).
In this study, we extend the potential benefit of information exchange to the interactionbetween a third party and negotiators. The provision of information on joint benefits andoutside market opportunities to the third party enhances their understanding of the negotiationsituation and their ability to communicate to the other parties about the possibilities forachieving integrative solutions. Therefore, joint benefits will be higher and distribution ofprofits more equal when the third party has access to information on joint benefits andnegotiator BATNAs than when the third party has no access to such information.
H11A: Negotiators will achieve higher joint benefit when the third party has access toinformation on joint benefits and negotiator BATNAs than when the third partydoes not have such information.
H11B: Negotiators will achieve more even distribution of profit when the third party hasaccess to information on joint benefits and negotiator BATNAs than when the thirdparty does not have such information.
2.3. Method
2.3.1. Participants and design overview. A total of 168 undergraduate students enrolledin management accounting or management information systems courses at two largemidwestern universities participated in this study. Students received both course creditand cash compensation for participating. As in Experiment 1, the students had coveredtransfer pricing in class, but had not participated in negotiation exercises with respect totransfer pricing or any other accounting issues.
There were 60 negotiating groups in the study. Twelve of these had two individuals,who assumed buyer and seller roles. The remaining 48 groups each had three individuals
98 ARUNACHALAM ET AL.
– a buyer, a seller, and a corporate representative. There were five experimental conditions:the control condition (two-person groups), and four conditions with three-person groups.These four conditions were obtained by crossing (1) the amount of information availableto the corporate representative and (2) the corporate representative’s ability to force anagreement. In addition to these between-groups manipulations, the market opportunitiesavailable to each negotiator (BATNAs) were manipulated within groups at four levels.The order of BATNA presentation was randomized.
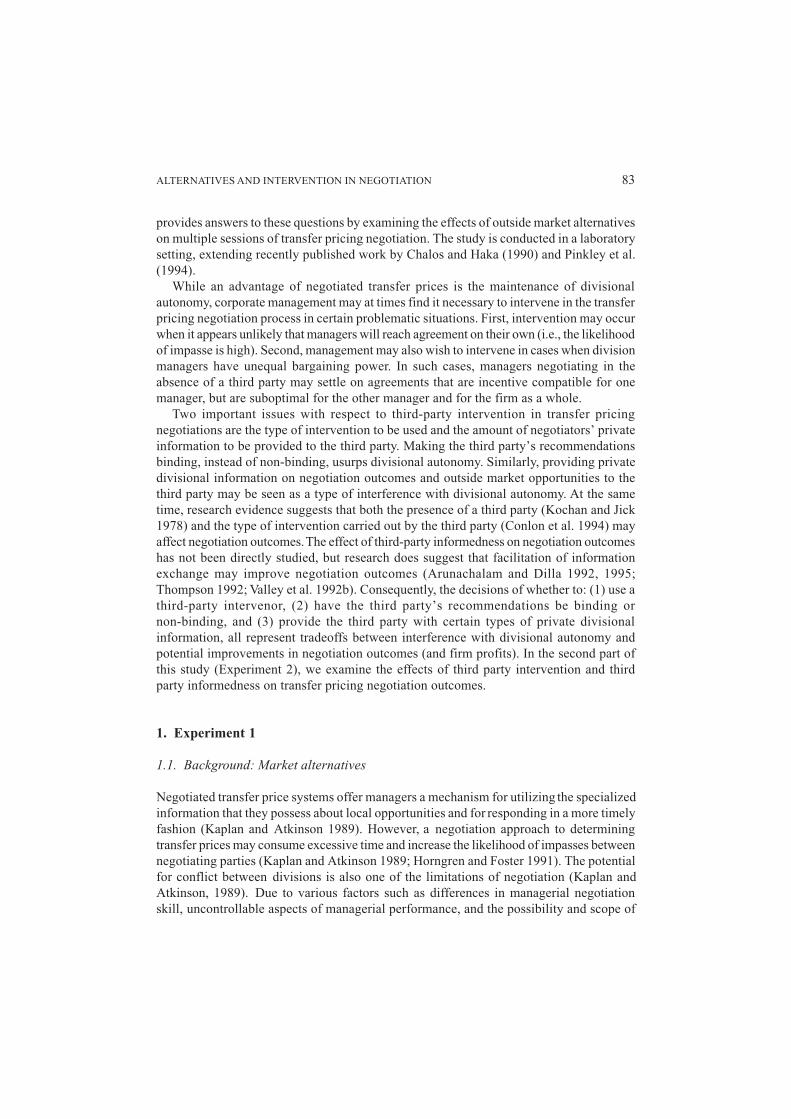
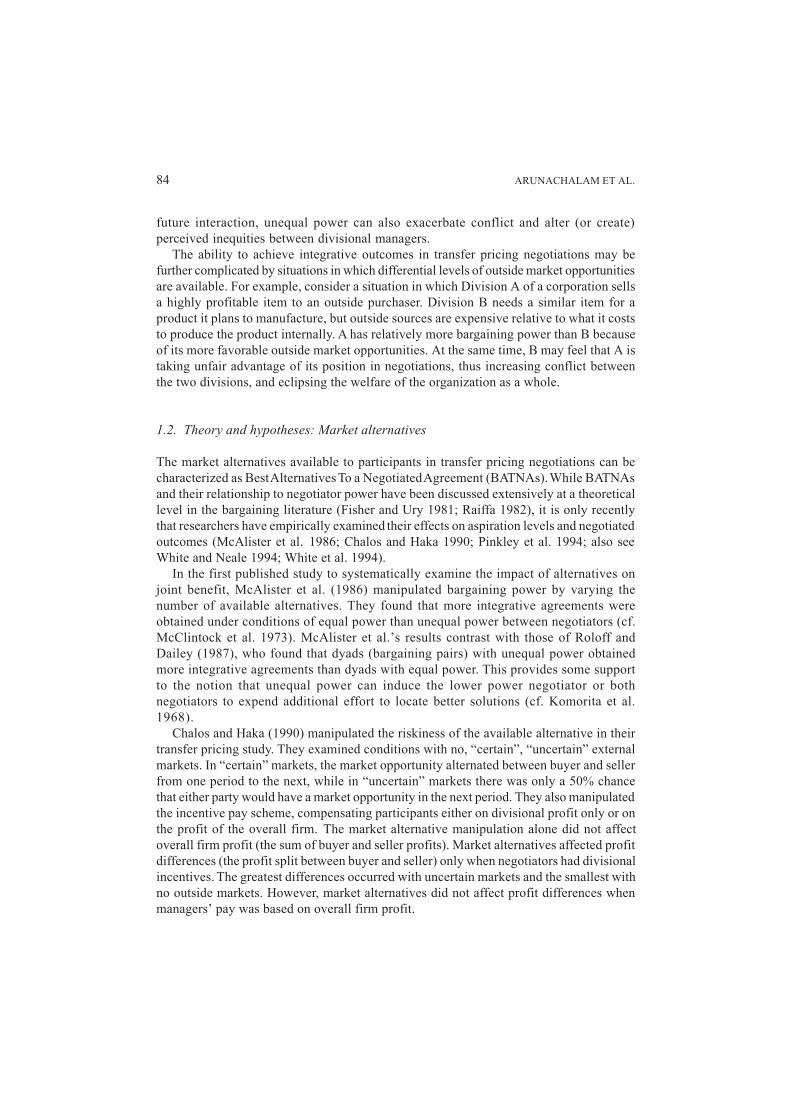
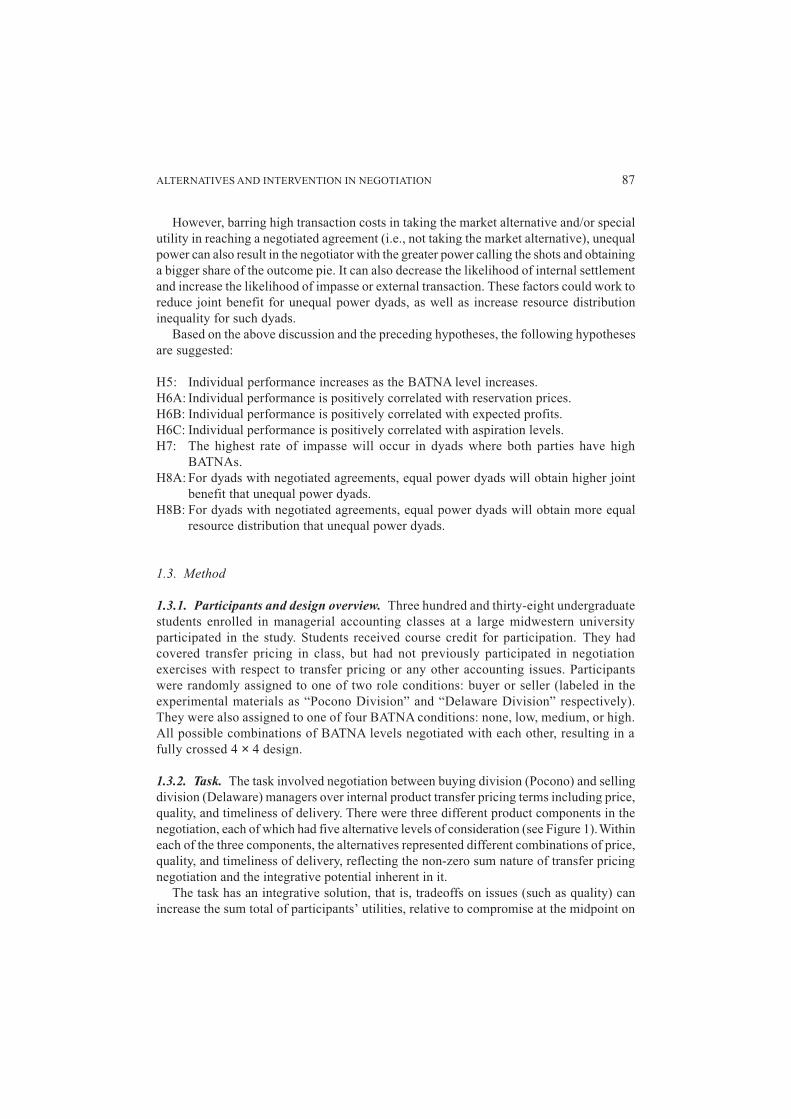
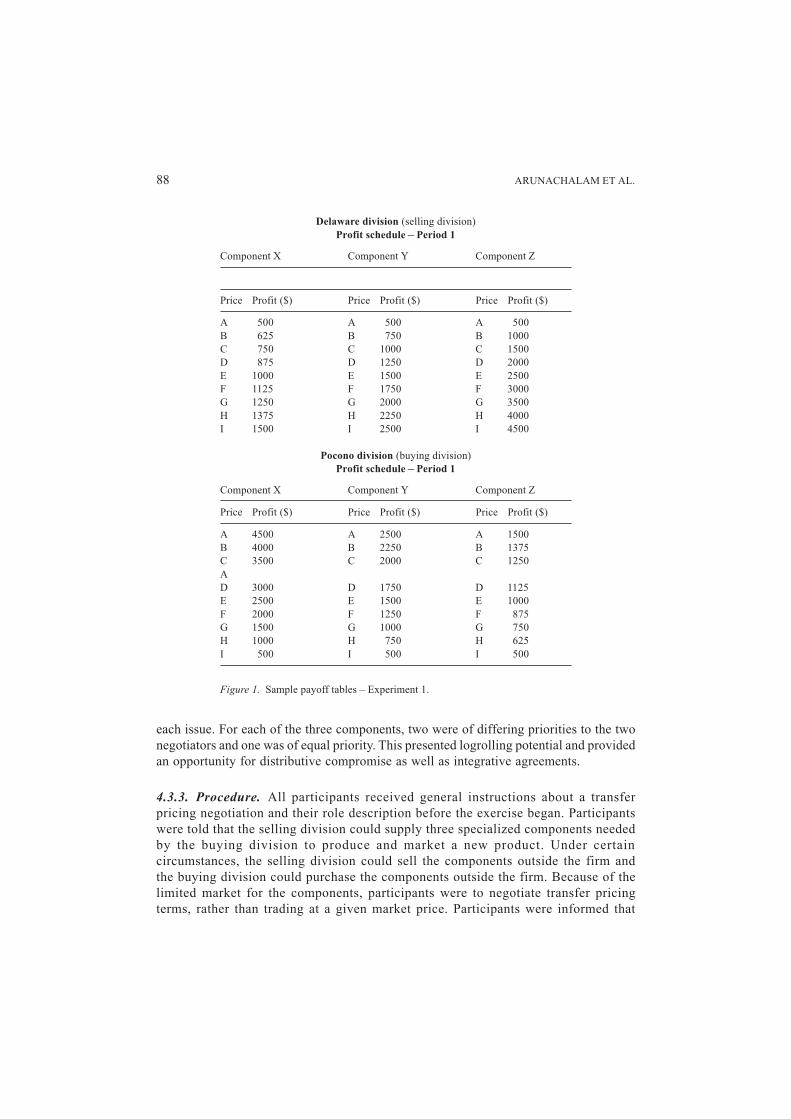
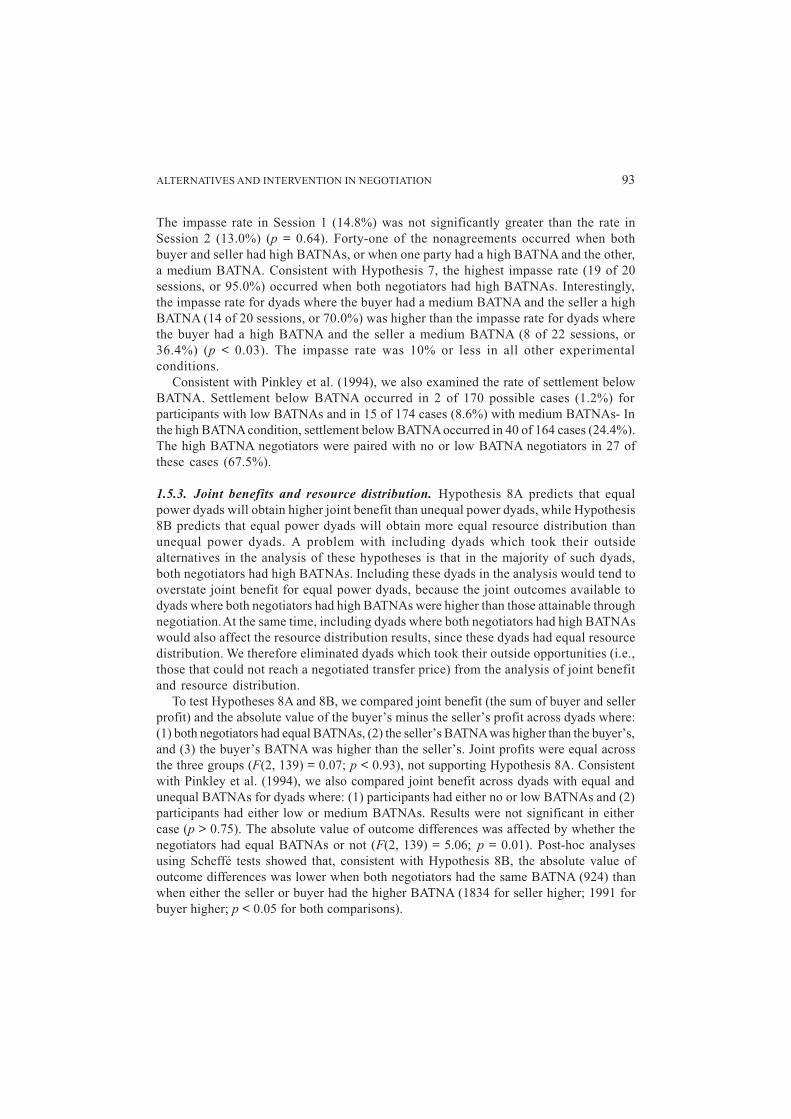
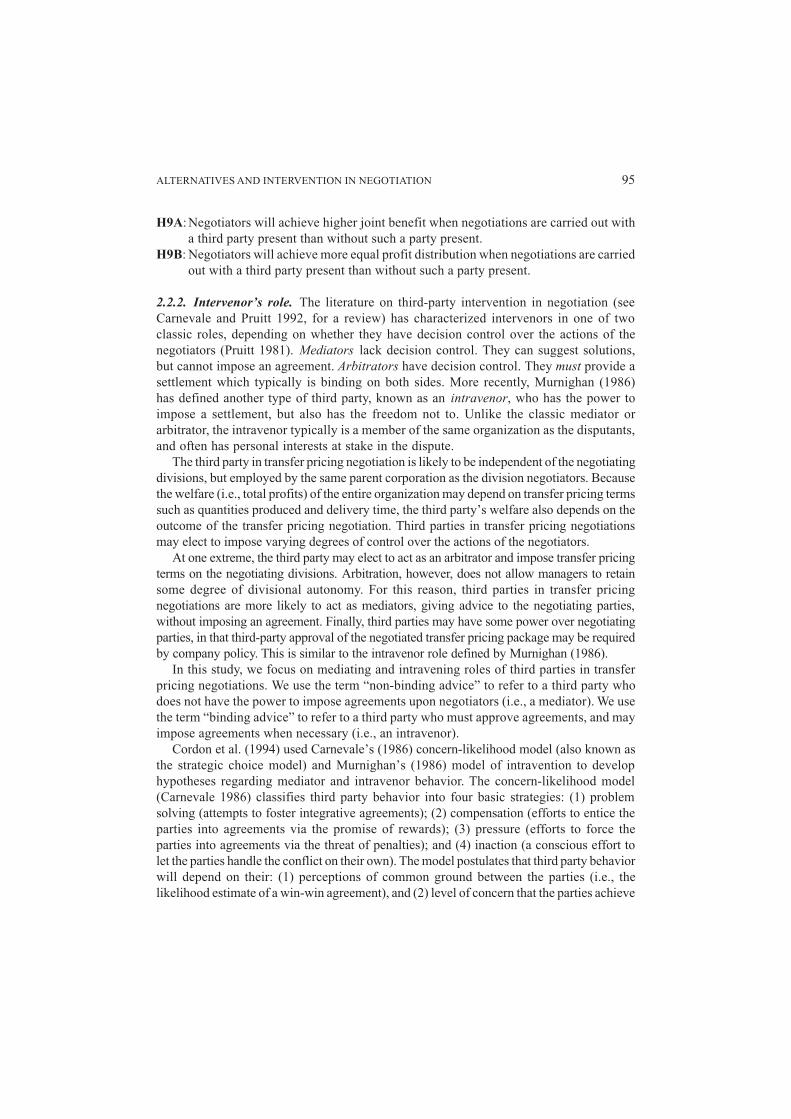
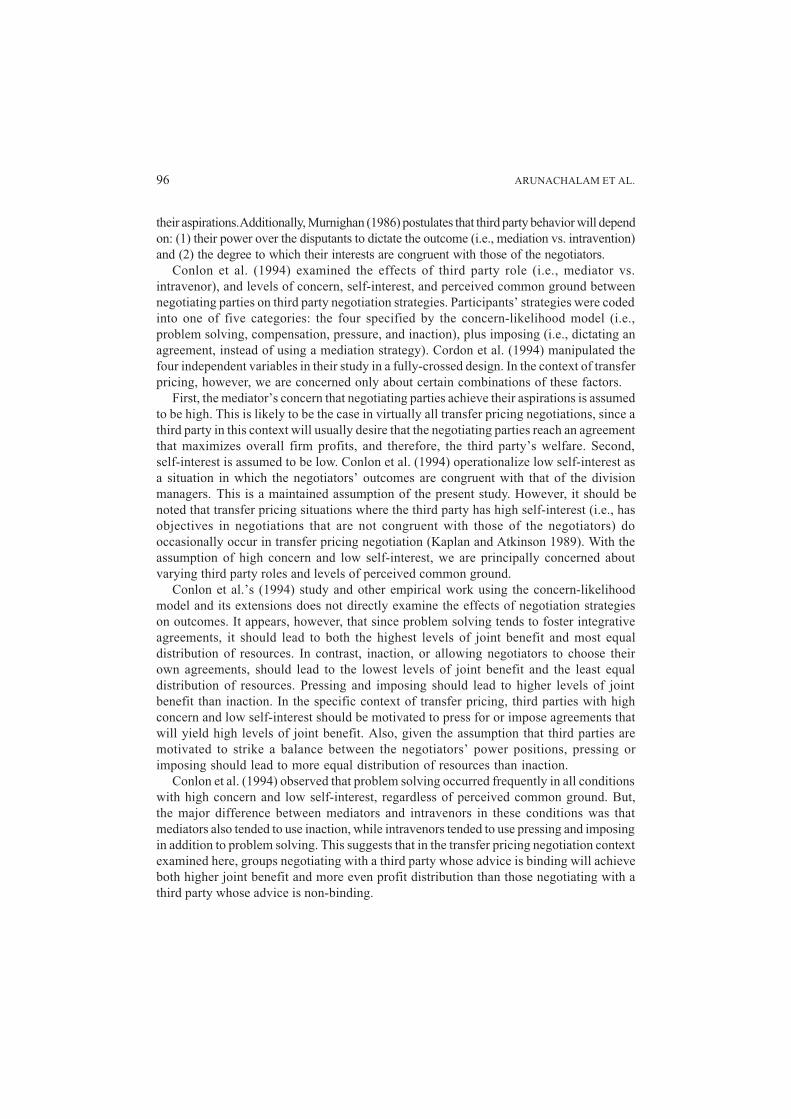
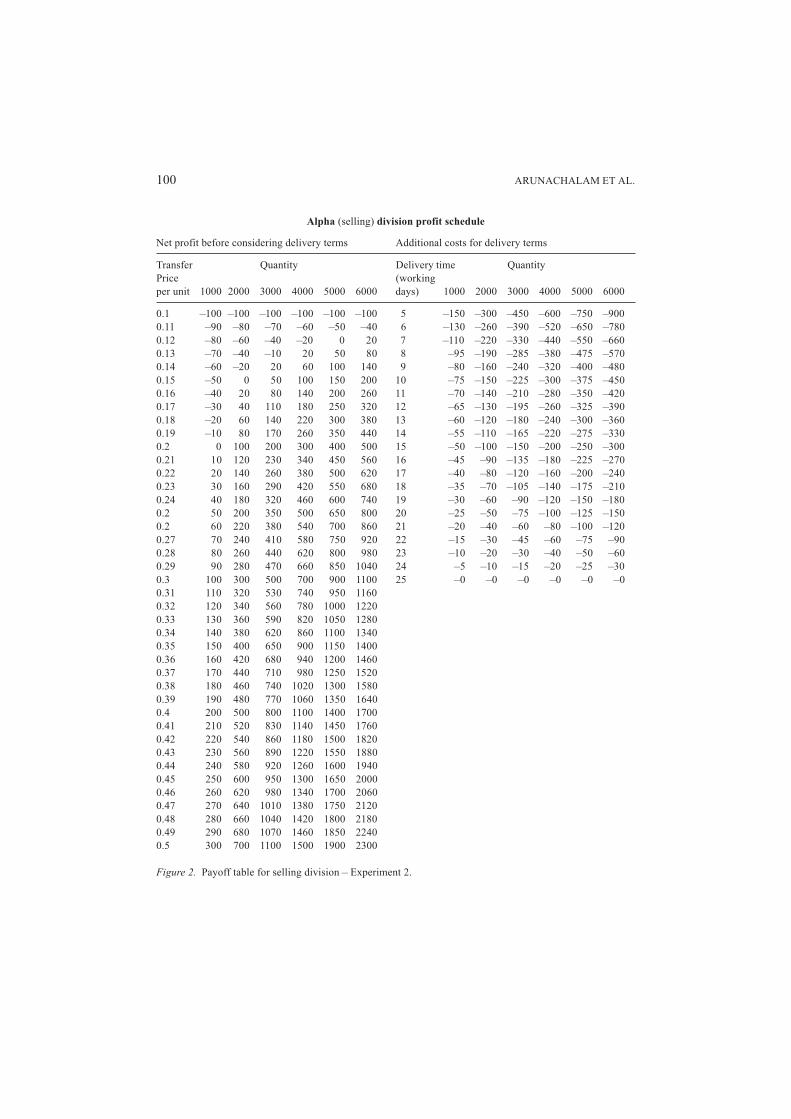
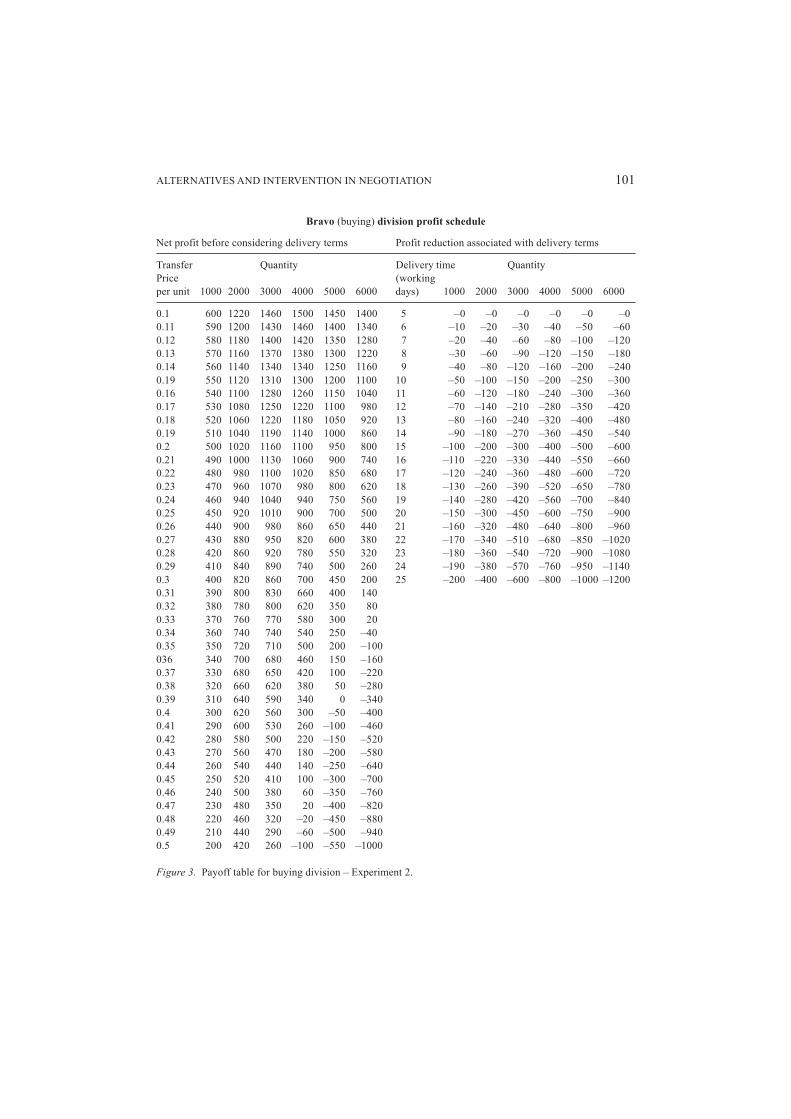
2.3.2. Task. The task involved negotiation between a buying division (Bravo) managerand a selling division (Alpha) manager over internal transfer pricing terms for a singleproduct. These terms included the transfer price, quantity transferred, and timeliness ofdelivery. The quantity transferred and timeliness of delivery affected both individual profitsand overall firm profits, reflecting the nonzero sum nature of transfer pricing negotiation.The transfer price, however, affected only the relative distribution of profits between thebuyer and seller; it did not affect total firm profits (see Figures 2 and 3).
2.3.3. Procedure. All participants received general instructions about a transfer pricingnegotiation and their role description before the exercise began. Each group of participantsnegotiated in four periods. As in Experiment 1, participants were not told how many periodsthey would be negotiating, only that the exercise would last more than one period. Divisionalpayoff schedules did not change from period to period.
At the beginning of each negotiation period, buyer and seller participants receivedinformation about their BATNAs- BATNAs; were worth either zero, 250, 500, or 750points. Each buyer and seller had each level of BATNA once during the course of theexperiment. The sum of the buyer’s and seller’s BATNAs was equal to 750 on everysession. Once negotiation commenced, participants had twenty minutes within which tocome to agreement. Participants were informed that if they failed to reach agreement in agiven round, they would receive their BATNA value. As in Experiment 1, participantswere informed that either division manager could take advantage of an outside opportunityif it is available, but also that corporate management has encouraged them to consider theoverall welfare of the corporation in making their decisions. Other than this brief statementabout corporate welfare, participants were not given any explicit instructions as tonegotiation behavior (i.e., whether they were to behave competitively, cooperatively, orindividualistically).
Each period, division managers had an amount equal to one-half of their divisionalprofits credited to their compensation account. Corporate representatives earned an amountequal to one-fourth of the sum of the profits of the two divisions. Compensation account“dollars” were converted into cash at the rate of one cash dollar for each 100 compensationaccount dollars. Participants were paid in cash at the end of the experimental session.
The compensation scheme was designed so that corporate representatives would haveboth high concern and low self-interest (cf. Conlon et al. 1994). The maximum totalcorporate profit obtainable in a negotiation session was 1,000 points, which occurredwhen the divisions traded 3,000 units with a delivery time of nine working days (seeFigures 2 and 3). This yielded 250 points (1,000/4) to the corporate representative, as
99ALTERNATIVES AND INTERVENTION IN NEGOTIATION
opposed to 187.5 points (750/4) when the division managers took their outsideopportunities. This provided a high level of concern for the corporate representative tohave the managers negotiate, instead of settling for an outside opportunity. The fact thatthe corporate representative’s compensation scheme was positively correlated with thedivision managers’ compensation provided low self-interest on the representative’s part.
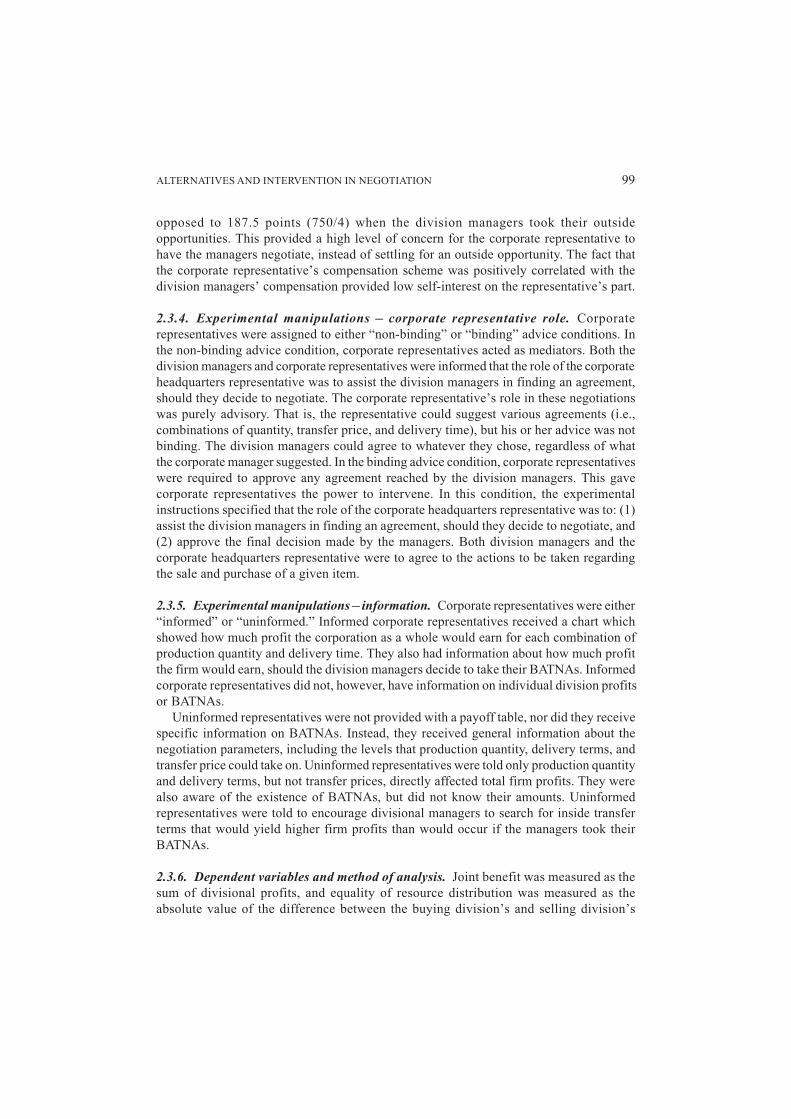
2.3.4. Experimental manipulations – corporate representative role. Corporaterepresentatives were assigned to either “non-binding” or “binding” advice conditions. Inthe non-binding advice condition, corporate representatives acted as mediators. Both thedivision managers and corporate representatives were informed that the role of the corporateheadquarters representative was to assist the division managers in finding an agreement,should they decide to negotiate. The corporate representative’s role in these negotiationswas purely advisory. That is, the representative could suggest various agreements (i.e.,combinations of quantity, transfer price, and delivery time), but his or her advice was notbinding. The division managers could agree to whatever they chose, regardless of whatthe corporate manager suggested. In the binding advice condition, corporate representativeswere required to approve any agreement reached by the division managers. This gavecorporate representatives the power to intervene. In this condition, the experimentalinstructions specified that the role of the corporate headquarters representative was to: (1)assist the division managers in finding an agreement, should they decide to negotiate, and(2) approve the final decision made by the managers. Both division managers and thecorporate headquarters representative were to agree to the actions to be taken regardingthe sale and purchase of a given item.
2.3.5. Experimental manipulations – information. Corporate representatives were either“informed” or “uninformed.” Informed corporate representatives received a chart whichshowed how much profit the corporation as a whole would earn for each combination ofproduction quantity and delivery time. They also had information about how much profitthe firm would earn, should the division managers decide to take their BATNAs. Informedcorporate representatives did not, however, have information on individual division profitsor BATNAs.
Uninformed representatives were not provided with a payoff table, nor did they receivespecific information on BATNAs. Instead, they received general information about thenegotiation parameters, including the levels that production quantity, delivery terms, andtransfer price could take on. Uninformed representatives were told only production quantityand delivery terms, but not transfer prices, directly affected total firm profits. They werealso aware of the existence of BATNAs, but did not know their amounts. Uninformedrepresentatives were told to encourage divisional managers to search for inside transferterms that would yield higher firm profits than would occur if the managers took theirBATNAs.
2.3.6. Dependent variables and method of analysis. Joint benefit was measured as thesum of divisional profits, and equality of resource distribution was measured as theabsolute value of the difference between the buying division’s and selling division’s
100 ARUNACHALAM ET AL.
Alpha (selling) division profit schedule
Net profit before considering delivery terms Additional costs for delivery terms
Transfer Quantity Delivery time QuantityPrice (workingper unit 1000 2000 3000 4000 5000 6000 days) 1000 2000 3000 4000 5000 6000
0.1 –100 –100 –100 –100 –100 –100 5 –150 –300 –450 –600 –750 –9000.11 –90 –80 –70 –60 –50 –40 6 –130 –260 –390 –520 –650 –7800.12 –80 –60 –40 –20 0 20 7 –110 –220 –330 –440 –550 –6600.13 –70 –40 –10 20 50 80 8 –95 –190 –285 –380 –475 –5700.14 –60 –20 20 60 100 140 9 –80 –160 –240 –320 –400 –4800.15 –50 0 50 100 150 200 10 –75 –150 –225 –300 –375 –4500.16 –40 20 80 140 200 260 11 –70 –140 –210 –280 –350 –4200.17 –30 40 110 180 250 320 12 –65 –130 –195 –260 –325 –3900.18 –20 60 140 220 300 380 13 –60 –120 –180 –240 –300 –3600.19 –10 80 170 260 350 440 14 –55 –110 –165 –220 –275 –3300.2 0 100 200 300 400 500 15 –50 –100 –150 –200 –250 –3000.21 10 120 230 340 450 560 16 –45 –90 –135 –180 –225 –2700.22 20 140 260 380 500 620 17 –40 –80 –120 –160 –200 –2400.23 30 160 290 420 550 680 18 –35 –70 –105 –140 –175 –2100.24 40 180 320 460 600 740 19 –30 –60 –90 –120 –150 –1800.2 50 200 350 500 650 800 20 –25 –50 –75 –100 –125 –1500.2 60 220 380 540 700 860 21 –20 –40 –60 –80 –100 –1200.27 70 240 410 580 750 920 22 –15 –30 –45 –60 –75 –900.28 80 260 440 620 800 980 23 –10 –20 –30 –40 –50 –600.29 90 280 470 660 850 1040 24 –5 –10 –15 –20 –25 –300.3 100 300 500 700 900 1100 25 –0 –0 –0 –0 –0 –00.31 110 320 530 740 950 11600.32 120 340 560 780 1000 12200.33 130 360 590 820 1050 12800.34 140 380 620 860 1100 13400.35 150 400 650 900 1150 14000.36 160 420 680 940 1200 14600.37 170 440 710 980 1250 15200.38 180 460 740 1020 1300 15800.39 190 480 770 1060 1350 16400.4 200 500 800 1100 1400 17000.41 210 520 830 1140 1450 17600.42 220 540 860 1180 1500 18200.43 230 560 890 1220 1550 18800.44 240 580 920 1260 1600 19400.45 250 600 950 1300 1650 20000.46 260 620 980 1340 1700 20600.47 270 640 1010 1380 1750 21200.48 280 660 1040 1420 1800 21800.49 290 680 1070 1460 1850 22400.5 300 700 1100 1500 1900 2300
Figure 2. Payoff table for selling division – Experiment 2.
101ALTERNATIVES AND INTERVENTION IN NEGOTIATION
Bravo (buying) division profit schedule
Net profit before considering delivery terms Profit reduction associated with delivery terms
Transfer Quantity Delivery time QuantityPrice (workingper unit 1000 2000 3000 4000 5000 6000 days) 1000 2000 3000 4000 5000 6000
0.1 600 1220 1460 1500 1450 1400 5 –0 –0 –0 –0 –0 –00.11 590 1200 1430 1460 1400 1340 6 –10 –20 –30 –40 –50 –600.12 580 1180 1400 1420 1350 1280 7 –20 –40 –60 –80 –100 –1200.13 570 1160 1370 1380 1300 1220 8 –30 –60 –90 –120 –150 –1800.14 560 1140 1340 1340 1250 1160 9 –40 –80 –120 –160 –200 –2400.19 550 1120 1310 1300 1200 1100 10 –50 –100 –150 –200 –250 –3000.16 540 1100 1280 1260 1150 1040 11 –60 –120 –180 –240 –300 –3600.17 530 1080 1250 1220 1100 980 12 –70 –140 –210 –280 –350 –4200.18 520 1060 1220 1180 1050 920 13 –80 –160 –240 –320 –400 –4800.19 510 1040 1190 1140 1000 860 14 –90 –180 –270 –360 –450 –5400.2 500 1020 1160 1100 950 800 15 –100 –200 –300 –400 –500 –6000.21 490 1000 1130 1060 900 740 16 –110 –220 –330 –440 –550 –6600.22 480 980 1100 1020 850 680 17 –120 –240 –360 –480 –600 –7200.23 470 960 1070 980 800 620 18 –130 –260 –390 –520 –650 –7800.24 460 940 1040 940 750 560 19 –140 –280 –420 –560 –700 –8400.25 450 920 1010 900 700 500 20 –150 –300 –450 –600 –750 –9000.26 440 900 980 860 650 440 21 –160 –320 –480 –640 –800 –9600.27 430 880 950 820 600 380 22 –170 –340 –510 –680 –850 –10200.28 420 860 920 780 550 320 23 –180 –360 –540 –720 –900 –10800.29 410 840 890 740 500 260 24 –190 –380 –570 –760 –950 –11400.3 400 820 860 700 450 200 25 –200 –400 –600 –800 –1000 –12000.31 390 800 830 660 400 1400.32 380 780 800 620 350 800.33 370 760 770 580 300 200.34 360 740 740 540 250 –400.35 350 720 710 500 200 –100036 340 700 680 460 150 –1600.37 330 680 650 420 100 –2200.38 320 660 620 380 50 –2800.39 310 640 590 340 0 –3400.4 300 620 560 300 –50 –4000.41 290 600 530 260 –100 –4600.42 280 580 500 220 –150 –5200.43 270 560 470 180 –200 –5800.44 260 540 440 140 –250 –6400.45 250 520 410 100 –300 –7000.46 240 500 380 60 –350 –7600.47 230 480 350 20 –400 –8200.48 220 460 320 –20 –450 –8800.49 210 440 290 –60 –500 –9400.5 200 420 260 –100 –550 –1000
Figure 3. Payoff table for buying division – Experiment 2.
102 ARUNACHALAM ET AL.
profits. Consistent with the suggestions of Tripp and Sondak (1992) we included in ouranalyses observations where impasses occurred. For these observations, we coded jointbenefits as the sum of the BATNAs available to each negotiator and equality of resourcedistribution as the absolute value of the difference between the BATNAs available toeach negotiator. A set of between-groups planned comparisons (Buckless and Ravenscroft1990; Keppel 1982) was used to test the experimental hypotheses, and multivariaterepeated measures analysis of variance (Bock 1975) was used to test the effects of theBATNA manipulation.
2.4. Results – between-groups analyses
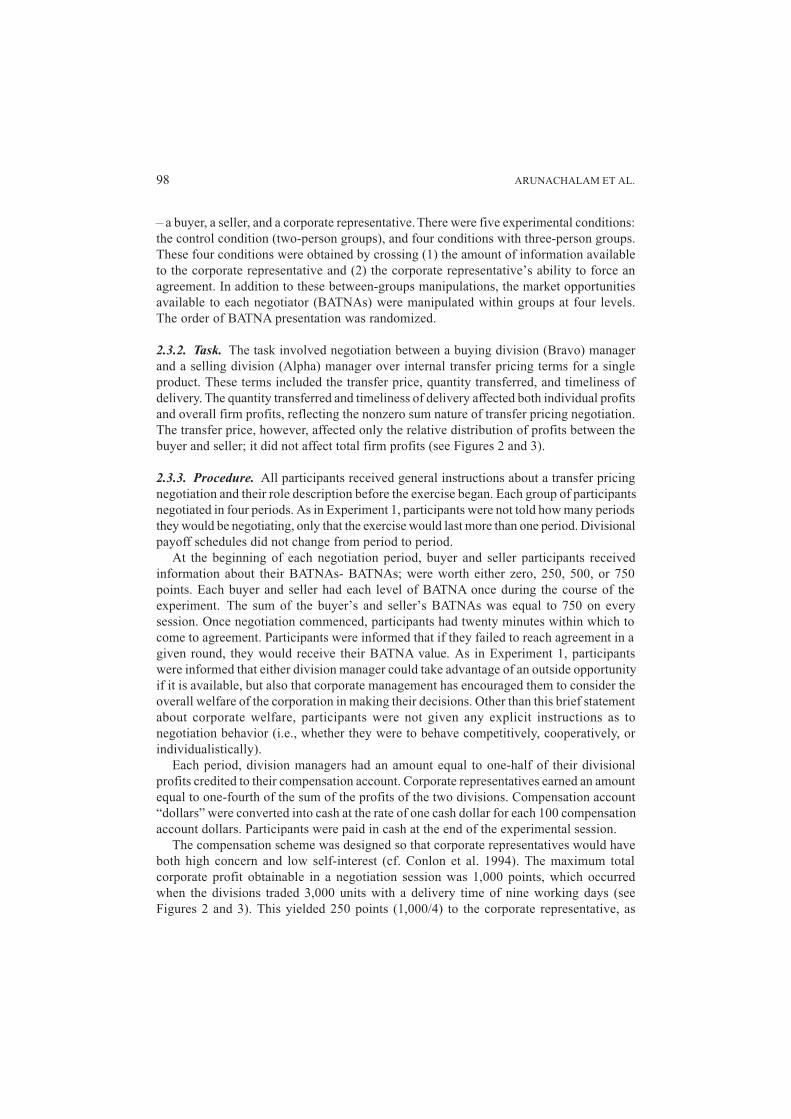
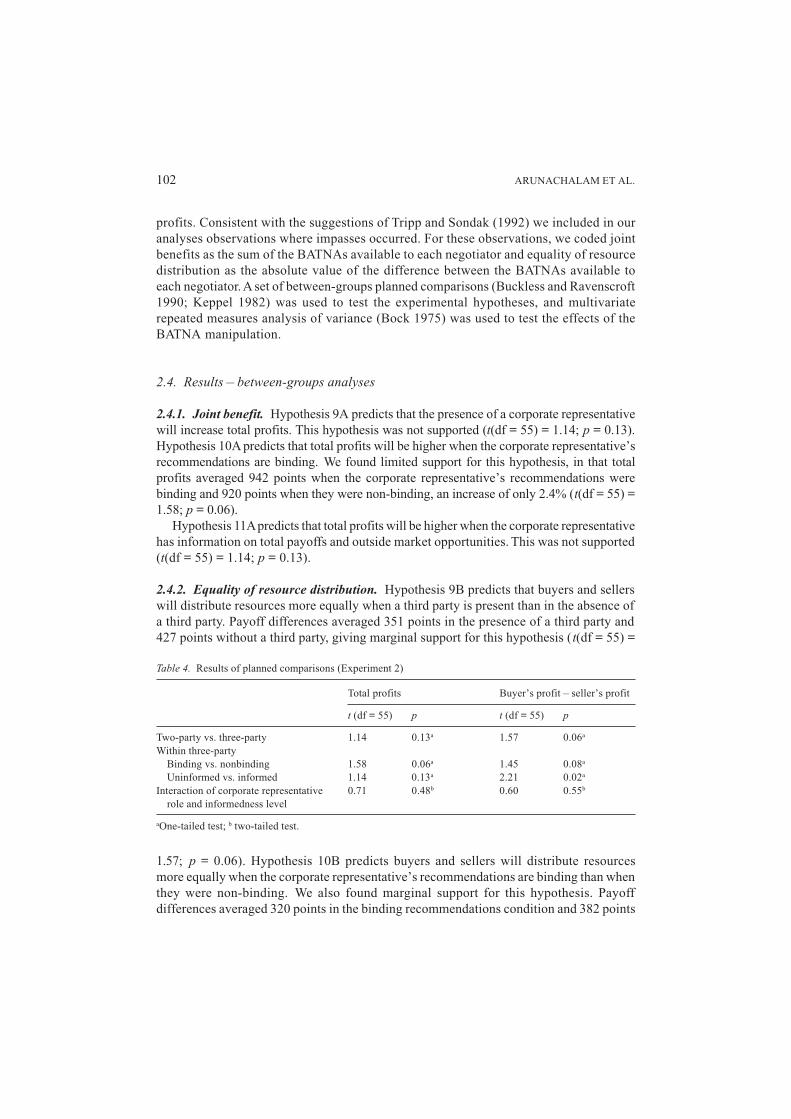
2.4.1. Joint benefit. Hypothesis 9A predicts that the presence of a corporate representativewill increase total profits. This hypothesis was not supported (t(df = 55) = 1.14; p = 0.13).Hypothesis 10A predicts that total profits will be higher when the corporate representative’srecommendations are binding. We found limited support for this hypothesis, in that totalprofits averaged 942 points when the corporate representative’s recommendations werebinding and 920 points when they were non-binding, an increase of only 2.4% (t(df = 55) =1.58; p = 0.06).
Hypothesis 11A predicts that total profits will be higher when the corporate representativehas information on total payoffs and outside market opportunities. This was not supported(t(df = 55) = 1.14; p = 0.13).
2.4.2. Equality of resource distribution. Hypothesis 9B predicts that buyers and sellerswill distribute resources more equally when a third party is present than in the absence ofa third party. Payoff differences averaged 351 points in the presence of a third party and427 points without a third party, giving marginal support for this hypothesis (t(df = 55) =
1.57; p = 0.06). Hypothesis 10B predicts buyers and sellers will distribute resourcesmore equally when the corporate representative’s recommendations are binding than whenthey were non-binding. We also found marginal support for this hypothesis. Payoffdifferences averaged 320 points in the binding recommendations condition and 382 points
Table 4. Results of planned comparisons (Experiment 2)
Total profits Buyer’s profit – seller’s profit
t (df = 55) p t (df = 55) p
Two-party vs. three-party 1.14 0.13a 1.57 0.06a
Within three-partyBinding vs. nonbinding 1.58 0.06a 1.45 0.08a
Uninformed vs. informed 1.14 0.13a 2.21 0.02a
Interaction of corporate representative 0.71 0.48b 0.60 0.55b
role and informedness level
aOne-tailed test; b two-tailed test.
103ALTERNATIVES AND INTERVENTION IN NEGOTIATION
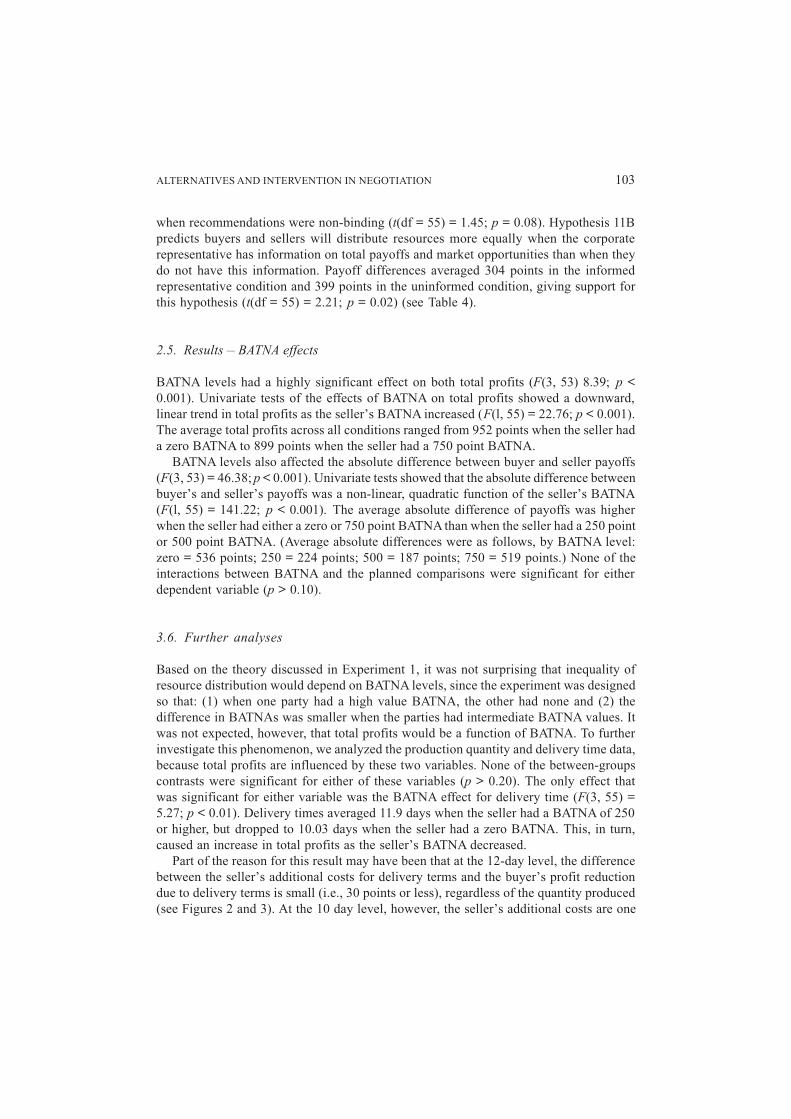
when recommendations were non-binding (t(df = 55) = 1.45; p = 0.08). Hypothesis 11Bpredicts buyers and sellers will distribute resources more equally when the corporaterepresentative has information on total payoffs and market opportunities than when theydo not have this information. Payoff differences averaged 304 points in the informedrepresentative condition and 399 points in the uninformed condition, giving support forthis hypothesis (t(df = 55) = 2.21; p = 0.02) (see Table 4).
2.5. Results – BATNA effects
BATNA levels had a highly significant effect on both total profits (F(3, 53) 8.39; p <0.001). Univariate tests of the effects of BATNA on total profits showed a downward,linear trend in total profits as the seller’s BATNA increased (F(l, 55) = 22.76; p < 0.001).The average total profits across all conditions ranged from 952 points when the seller hada zero BATNA to 899 points when the seller had a 750 point BATNA.
BATNA levels also affected the absolute difference between buyer and seller payoffs(F(3, 53) = 46.38; p < 0.001). Univariate tests showed that the absolute difference betweenbuyer’s and seller’s payoffs was a non-linear, quadratic function of the seller’s BATNA(F(l, 55) = 141.22; p < 0.001). The average absolute difference of payoffs was higherwhen the seller had either a zero or 750 point BATNA than when the seller had a 250 pointor 500 point BATNA. (Average absolute differences were as follows, by BATNA level:zero = 536 points; 250 = 224 points; 500 = 187 points; 750 = 519 points.) None of theinteractions between BATNA and the planned comparisons were significant for eitherdependent variable (p > 0.10).
3.6. Further analyses
Based on the theory discussed in Experiment 1, it was not surprising that inequality ofresource distribution would depend on BATNA levels, since the experiment was designedso that: (1) when one party had a high value BATNA, the other had none and (2) thedifference in BATNAs was smaller when the parties had intermediate BATNA values. Itwas not expected, however, that total profits would be a function of BATNA. To furtherinvestigate this phenomenon, we analyzed the production quantity and delivery time data,because total profits are influenced by these two variables. None of the between-groupscontrasts were significant for either of these variables (p > 0.20). The only effect thatwas significant for either variable was the BATNA effect for delivery time (F(3, 55) =5.27; p < 0.01). Delivery times averaged 11.9 days when the seller had a BATNA of 250or higher, but dropped to 10.03 days when the seller had a zero BATNA. This, in turn,caused an increase in total profits as the seller’s BATNA decreased.
Part of the reason for this result may have been that at the 12-day level, the differencebetween the seller’s additional costs for delivery terms and the buyer’s profit reductiondue to delivery terms is small (i.e., 30 points or less), regardless of the quantity produced(see Figures 2 and 3). At the 10 day level, however, the seller’s additional costs are one
104 ARUNACHALAM ET AL.
and one-half times the buyer’s profit reduction, regardless of the quantity produced.Apparently, when the buyer and seller had intermediate BATNAs, or when the seller had ahigh BATNA, the buyer and seller tended to choose delivery terms that equalized theseller’s costs and the buyer’s profit reduction, instead of choosing terms that maximizedoverall firm profits. However, when the seller had no BATNA, delivery terms that camecloser to maximizing overall firm profits were chosen. It is also interesting to note thatnone of the experimental manipulations effectively mitigated this phenomenon.
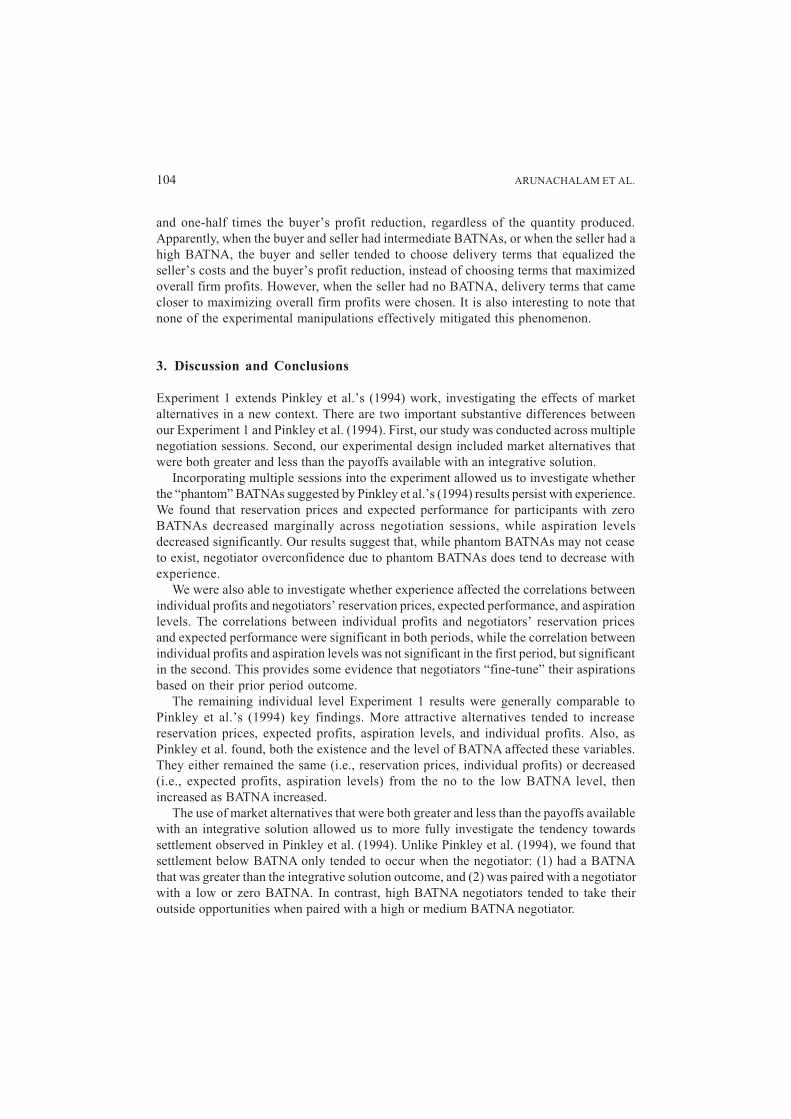
3. Discussion and Conclusions
Experiment 1 extends Pinkley et al.’s (1994) work, investigating the effects of marketalternatives in a new context. There are two important substantive differences betweenour Experiment 1 and Pinkley et al. (1994). First, our study was conducted across multiplenegotiation sessions. Second, our experimental design included market alternatives thatwere both greater and less than the payoffs available with an integrative solution.
Incorporating multiple sessions into the experiment allowed us to investigate whetherthe “phantom” BATNAs suggested by Pinkley et al.’s (1994) results persist with experience.We found that reservation prices and expected performance for participants with zeroBATNAs decreased marginally across negotiation sessions, while aspiration levelsdecreased significantly. Our results suggest that, while phantom BATNAs may not ceaseto exist, negotiator overconfidence due to phantom BATNAs does tend to decrease withexperience.
We were also able to investigate whether experience affected the correlations betweenindividual profits and negotiators’ reservation prices, expected performance, and aspirationlevels. The correlations between individual profits and negotiators’ reservation pricesand expected performance were significant in both periods, while the correlation betweenindividual profits and aspiration levels was not significant in the first period, but significantin the second. This provides some evidence that negotiators “fine-tune” their aspirationsbased on their prior period outcome.
The remaining individual level Experiment 1 results were generally comparable toPinkley et al.’s (1994) key findings. More attractive alternatives tended to increasereservation prices, expected profits, aspiration levels, and individual profits. Also, asPinkley et al. found, both the existence and the level of BATNA affected these variables.They either remained the same (i.e., reservation prices, individual profits) or decreased(i.e., expected profits, aspiration levels) from the no to the low BATNA level, thenincreased as BATNA increased.
The use of market alternatives that were both greater and less than the payoffs availablewith an integrative solution allowed us to more fully investigate the tendency towardssettlement observed in Pinkley et al. (1994). Unlike Pinkley et al. (1994), we found thatsettlement below BATNA only tended to occur when the negotiator: (1) had a BATNAthat was greater than the integrative solution outcome, and (2) was paired with a negotiatorwith a low or zero BATNA. In contrast, high BATNA negotiators tended to take theiroutside opportunities when paired with a high or medium BATNA negotiator.
105ALTERNATIVES AND INTERVENTION IN NEGOTIATION
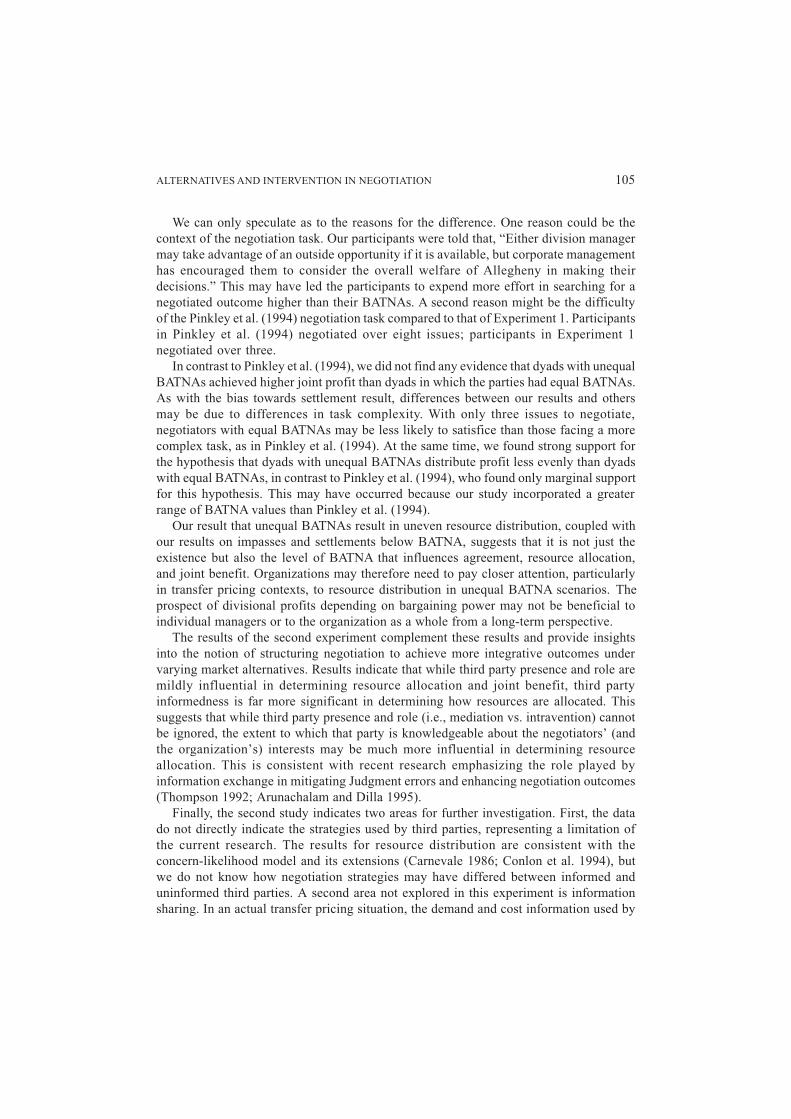
We can only speculate as to the reasons for the difference. One reason could be thecontext of the negotiation task. Our participants were told that, “Either division managermay take advantage of an outside opportunity if it is available, but corporate managementhas encouraged them to consider the overall welfare of Allegheny in making theirdecisions.” This may have led the participants to expend more effort in searching for anegotiated outcome higher than their BATNAs. A second reason might be the difficultyof the Pinkley et al. (1994) negotiation task compared to that of Experiment 1. Participantsin Pinkley et al. (1994) negotiated over eight issues; participants in Experiment 1negotiated over three.
In contrast to Pinkley et al. (1994), we did not find any evidence that dyads with unequalBATNAs achieved higher joint profit than dyads in which the parties had equal BATNAs.As with the bias towards settlement result, differences between our results and othersmay be due to differences in task complexity. With only three issues to negotiate,negotiators with equal BATNAs may be less likely to satisfice than those facing a morecomplex task, as in Pinkley et al. (1994). At the same time, we found strong support forthe hypothesis that dyads with unequal BATNAs distribute profit less evenly than dyadswith equal BATNAs, in contrast to Pinkley et al. (1994), who found only marginal supportfor this hypothesis. This may have occurred because our study incorporated a greaterrange of BATNA values than Pinkley et al. (1994).
Our result that unequal BATNAs result in uneven resource distribution, coupled withour results on impasses and settlements below BATNA, suggests that it is not just theexistence but also the level of BATNA that influences agreement, resource allocation,and joint benefit. Organizations may therefore need to pay closer attention, particularlyin transfer pricing contexts, to resource distribution in unequal BATNA scenarios. Theprospect of divisional profits depending on bargaining power may not be beneficial toindividual managers or to the organization as a whole from a long-term perspective.
The results of the second experiment complement these results and provide insightsinto the notion of structuring negotiation to achieve more integrative outcomes undervarying market alternatives. Results indicate that while third party presence and role aremildly influential in determining resource allocation and joint benefit, third partyinformedness is far more significant in determining how resources are allocated. Thissuggests that while third party presence and role (i.e., mediation vs. intravention) cannotbe ignored, the extent to which that party is knowledgeable about the negotiators’ (andthe organization’s) interests may be much more influential in determining resourceallocation. This is consistent with recent research emphasizing the role played byinformation exchange in mitigating Judgment errors and enhancing negotiation outcomes(Thompson 1992; Arunachalam and Dilla 1995).
Finally, the second study indicates two areas for further investigation. First, the datado not directly indicate the strategies used by third parties, representing a limitation ofthe current research. The results for resource distribution are consistent with theconcern-likelihood model and its extensions (Carnevale 1986; Conlon et al. 1994), butwe do not know how negotiation strategies may have differed between informed anduninformed third parties. A second area not explored in this experiment is informationsharing. In an actual transfer pricing situation, the demand and cost information used by
106 ARUNACHALAM ET AL.
the third party may often be available only from the two original negotiators, and theymay have no incentive to share it truthfully. In fact, the issue of truthful informationsharing is a central theme in much transfer pricing research (e.g., Dejong et al. 1989). Asthe transfer pricing literature (cf. Kaplan and Atkinson 1989) suggests, facilitating truthfulinformation exchange can present substantial challenges. Further research on: (1) exactlyhow information sharing affects third parties’ negotiation strategies, and (2) the effectsof information exchange in transfer pricing negotiations is therefore necessary.
References
Arunachalam, V., and W. Dilla. (1992). “Computer-mediated Communication and Structured Interaction in TransferPricing Negotiation,” Journal of Information Systems 6, 149–170.
Arunachalam, V., and W. Dilla. (1995). “Judgment Accuracy and Outcomes in Negotiation: A Causal ModelingAnalysis of Decision-aiding Effects,” Organizational Behavior and Human Decision Processes 61, 289–304.
Bazerman, M.H., and J.S. Carroll. (1987). “Negotiator Cognition,” in B. Staw, and L.L. Cummings (eds.), Researchin Organizational Behavior 9. Greenwich, CT: JAI Press.
Bazerman, M.H., M.A. Neale, K.L. Valley, E. Zajac, and Y.M. Kim. (1992). “The Effect of Agents and Mediators onNegotiation Outcomes,” Organizational Behavior and Human Decision Processes 53, 55–73.
Bock, R.E. (1975). Multivariate Statistical Methods in Behavioral Research. New York: McGraw-Hill.Buckless, F.A., and S.P. Ravenscroft. (1990). “Contrast Coding: A Refinement of ANOVA in Behavioral Analysis,”
The Accounting Review 65, 933–945.Carnevale, P. (1986). “Strategic Choice in Mediation,” Negotiation Journal 2, 41–56.Carnevale, P., and D. Pruitt. (1992). “Negotiation and Mediation,” Annual Review of Psychology 43, 531–582.Chalos, P., and S. Haka. (1990). “Transfer Pricing Under Bilateral Bargaining,” The Accounting Review 65, 624–
641.Conlon, D.E., P.J. Carnevale, and J.K. Murnighan. (1994). “Intravention: Third-party Intervention With Clout,”
Organizational Behavior and Human Decision Processes 57, 387–410.DeJong, D.V., R. Forsythe, J.O. Kim, and W.C. Uecker. (1989). “A Laboratory Investigation of Alternative Transfer
Pricing Mechanisms,’’ Accounting, Organizations and Society 14, 41–64.Fisher, R. and W. Ury. (1981). Getting to Yes: Negotiating Agreement Without Giving In. Boston: Houghton-
Mifflin.Friedman, J.W. (1990). Game Theory with Applications to Economics (2nd ed.). New York: Oxford University
Press.Horngren, C.T., and G. Foster. (1991). Cost Accounting: A Managerial Emphasis (7th ed.). Englewood Cliffs, NJ:
Prentice-Hall.Ippolito, C.A., and D.G. Pruitt. (1990). “Power Balancing in Mediation: Outcomes and Implications of Mediator
Intervention,” International Journal of Conflict Management 1, 341–355.Kaplan, R., and A. Atkinson. (1989). Advanced Management Accounting. Englewood Cliffs, NJ: Prentice-
Hall.Keppel, G. (1982). Design and Analysis: A Researcher’s Handbook (2nd ed.)., Englewood Cliffs, NJ: Prentice-
Hall.Kochan, T.A. and T. Jick. (1978). “The Public Sector Mediation Process: A Theory and Empirical Examination,”
Journal of Conflict Resolution 22, 209–240.Komorita, S.S., J.P. Sheposh, and S.L. Braver. (1968). “Power, The Use of Power, and Cooperative Choices in a
Two Person Game,” Journal of Personality and Social Psychology 8, 134–142.Laskewitz, P., E. van de Vliert, and C.K.W. de Dreu. (1994). “Organizational Mediators: Siding With or Against the
Powerful Party?,” Journal of Applied Social Psychology 24, 2, 176–188.Lewicki, R.J., and J. Litterer. (1985). Negotiation. Homewood, IL: Irwin.Martz, L., and R. Thomas. (1991). “The Corporate Shell Game,” Newsweek, April 15, 48–49.
107ALTERNATIVES AND INTERVENTION IN NEGOTIATION
McAlister, L., M.H. Bazerman, and P. Fader. (1986). “Power and Goal Setting in Channel Negotiations,” Journalof Marketing Research 23, 228–236.
McClintock, C.G., D.M. Messick, D.M. Kuhlman, and F.T. Campos. (1973). “Motivational Basis of Choice in ThreeChoice Decomposed Games.” Journal of Experimental Social Psychology 9, 572–590.
Murnighan, J.K. (1986). “The Structure of Mediation and Intravention: Comments on Carnevale’s StrategicChoice Model,” Negotiation Journal 2, 351–356.
Pinkley, R.L., M.A. Neale, and R.J. Bennett. (1994). “The Impact of Alternatives to Settlement in Dyadic Negotiation,”Organizational Behavior and Human Decision Processes 57, 97–116.
Pruitt, D.G. (1981). Negotiation Behavior. New York: Academic Press.Raiffa, H. (1982). The Art and Science of Negotiation. Cambridge, MA: Harvard University Press.Rapoport, A., and A.M. Chammah. (1965). Prisoner’s Dilemma. Ann Arbor: University of Michigan Press.Roloff, M.E., and W.O. Dailey. (1987). “The Effects of Alternatives to Reaching Agreement on the Development
of Integrative Solutions to Problems: The Debilitating Side Effects of Shared BATNA.” Paper presented at theTemple University Discourse Conference “Conflict Intervention: Perspectives on Process,” Philadelphia, PA.
Rubin, J.Z. (1981). Dynamics of Third-Party Intervention: Kissinger in the Middle East. New York: Praeger.Sheppard, B.H. (1984). “Third-party Conflict Intervention: A Procedural Framework,” Research in Organizational
Behavior 6, 141–190.Spicer, B. (1988). “Towards an Organizational Theory of the Transfer Pricing Process,” Accounting, Organizations
and Society 13(3), 303–322.Tang, R. (1979). Transfer Pricing Practices in the United States and Japan. New York: Praeger.Thompson, L.L. (1992). “Information Exchange in Negotiation,” Journal of Experimental Social Psychology, 1–
32.Thompson, L.L., and R. Hastie. (1990). “Social Perception in Negotiation,” Organizational Behavior and Human
Decision Processes 47, 98–123.Tripp, T.M., and H. Sondak. (1992). “An Evaluation of Dependent Variables in Experimental Negotiation Studies:
Impasse Rates and Pareto Efficiency,” Organizational Behavior and Human Decision Processes 51, 273–295.Umapathy, S. (1978). “Transfers Between Profit Centers,” in R. F. Vancil (ed.), Decentralization: Management
Ambiguity by Design. Homewood, IL: Dow Jones-Irwin.Valley, K., S. White, and D. Iacobucci. (1992a). “The Process of Assisted Negotiations: A Network Analysis,”
Group Decision and Negotiation 2, 117–135.Valley, K., S. White, M.A. Neale, and M.H. Bazerman. (1992b). “Agents as Information Brokers: The Effects of
Information Disclosure on Negotiated Outcomes,” Organizational Behavior and Human Decision Processes51, 220–236.
Vancil, R. (1979). Decentralization: Management Ambiguity by Design. Homewood, IL: Dow Jones-Irwin.Watson, D.J.H., and J.V. Baumler. “Transfer Pricing: A Behavioral Context,” The Accounting Review 50, 466–474.White, S.B., and M.A. Neale. (1994). “The Role of Negotiator Aspirations and Settlement Expectancies in
Bargaining Outcomes,” Organizational Behavior and Human Decision Processes 57, 303–317.White, S.B., K.L. Valley, M.H. Bazerman, M.A. Neale, and S.R. Peck. (1994). “Alternative Models of Price Behavior
in Dyadic Negotiations: Market Prices, Reservation Prices, and Negotiator Aspirations,” OrganizationalBehavior and Human Decision Processes 57, 430–447.