maritime and port authority of singapore shipping circular ... · pdf filemaritime and port...
TRANSCRIPT
MARITIME AND PORT AUTHORITY OF
SINGAPORE
SHIPPING CIRCULAR TO SHIP OWNERS NO. 3 OF 2011
MPA Shipping Division 460 Alexandra Road
21st Storey PSA Building Singapore 119963
Fax: 6375-6231 http://www.mpa.gov.sg
19 JANUARY 2011 Applicable to: This circular is for the attention of ship owners, managers, operators, agents, masters, crew members and surveyors This circular supplements Circular No. 29 of 2006.
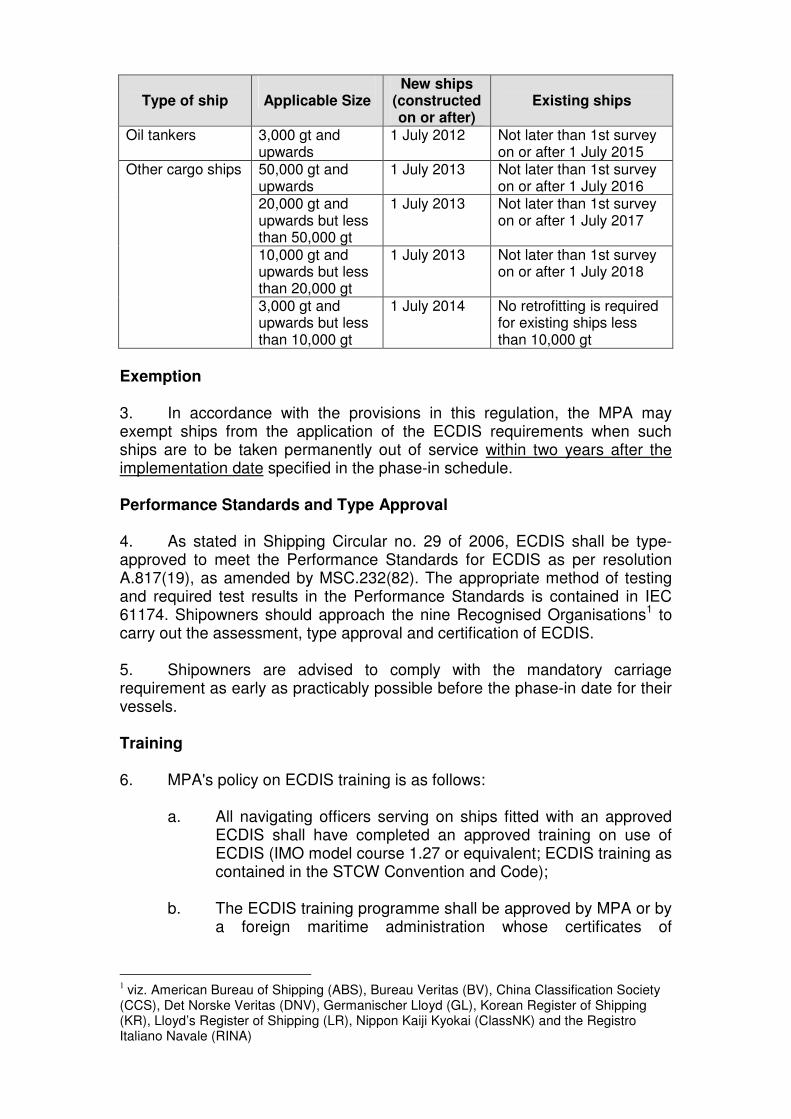
ELECTRONIC CHART DISPLAY AND INFORMATION SYSTEM (ECDIS) FOR SHIPS AND HIGH SPEED CRAFT Background 1. The Maritime Safety Committee of IMO, at its 86th session adopted resolution MSC.282(86) on amendments to SOLAS (see Annex A), which included the mandatory carriage of ECDIS for passenger ships, tankers and other cargo ships. These amendments entered into force on 1 January 2011, but the implementation dates for mandatory carriage of ECDIS would be phased in, commencing 1 July 2012 (see phase-in schedule below). Mandatory carriage of ECDIS: Phase-in schedule 2. The mandatory ECDIS carriage requirements are detailed in the new paragraph 2.10 of SOLAS regulation V/19, and the phased-in schedule for implementation is as follows:
Type of ship
Applicable Size
New ships (constructed on or after)
Existing ships
DSC all – Recommended from 1 July 2010
HSC (1994 and 2000)
all 1 July 2008 1 July 2010
Passenger ships 500 gt and upwards
1 July 2012 Not later than 1st renewal survey on or after 1 July 2014
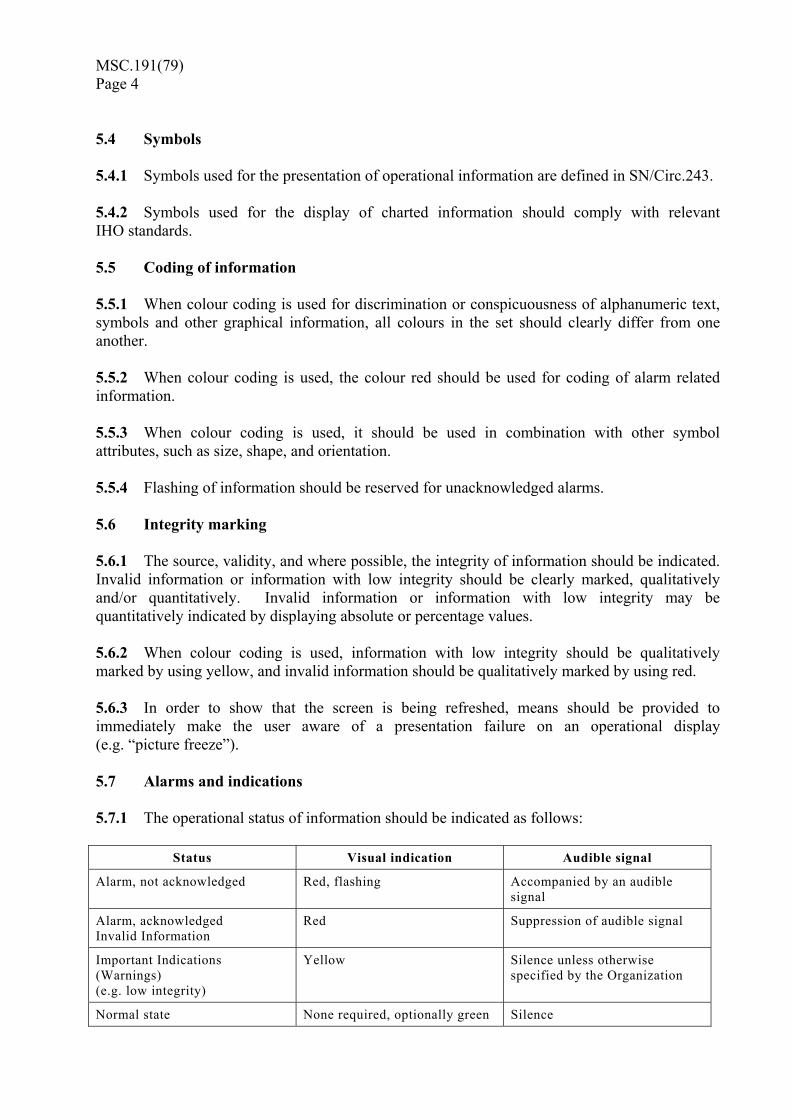
Type of ship
Applicable Size
New ships (constructed on or after)
Existing ships
Oil tankers 3,000 gt and upwards
1 July 2012 Not later than 1st survey on or after 1 July 2015
50,000 gt and upwards
1 July 2013 Not later than 1st survey on or after 1 July 2016
20,000 gt and upwards but less than 50,000 gt
1 July 2013 Not later than 1st survey on or after 1 July 2017
10,000 gt and upwards but less than 20,000 gt
1 July 2013 Not later than 1st survey on or after 1 July 2018
Other cargo ships
3,000 gt and upwards but less than 10,000 gt
1 July 2014 No retrofitting is required for existing ships less than 10,000 gt
Exemption 3. In accordance with the provisions in this regulation, the MPA may exempt ships from the application of the ECDIS requirements when such ships are to be taken permanently out of service within two years after the implementation date specified in the phase-in schedule. Performance Standards and Type Approval 4. As stated in Shipping Circular no. 29 of 2006, ECDIS shall be type-approved to meet the Performance Standards for ECDIS as per resolution A.817(19), as amended by MSC.232(82). The appropriate method of testing and required test results in the Performance Standards is contained in IEC 61174. Shipowners should approach the nine Recognised Organisations1 to carry out the assessment, type approval and certification of ECDIS. 5. Shipowners are advised to comply with the mandatory carriage requirement as early as practicably possible before the phase-in date for their vessels. Training 6. MPA's policy on ECDIS training is as follows:
a. All navigating officers serving on ships fitted with an approved ECDIS shall have completed an approved training on use of ECDIS (IMO model course 1.27 or equivalent; ECDIS training as contained in the STCW Convention and Code);
b. The ECDIS training programme shall be approved by MPA or by
a foreign maritime administration whose certificates of
1 viz. American Bureau of Shipping (ABS), Bureau Veritas (BV), China Classification Society
(CCS), Det Norske Veritas (DNV), Germanischer Lloyd (GL), Korean Register of Shipping (KR), Lloyd’s Register of Shipping (LR), Nippon Kaiji Kyokai (ClassNK) and the Registro Italiano Navale (RINA)

competency are recognised by MPA for service on board Singapore ships; and
c. The navigating officers should also be provided training on the
specific make and model installed on their ships. This equipment-specific training can be provided by the shipping company itself as part of ship familiarisation, using services of trainers appointed by the manufacturer or manufacturer's agent.
7. In addition, the ISM Code requires that ship officers have familiarisation training for all safety equipment fitted onboard. Shipowners should be aware of their responsibility under the ISM Code to ensure that their ship officers are competent in the use of ECDIS to maintain safety of navigation, who may be expected to demonstrate their competence to Port State Control officers. Documentary evidence of ECDIS training attended by ship officers should also be available on board. Training providers in Singapore 8. Currently, MPA-approved ECDIS training in Singapore is provided by three Training Service Providers, whose courses are based on the IMO Model Course 1.27 Operational Use of Electronic Chart Display and Information Systems (ECDIS). These are the Singapore Maritime Academy, ST Education & Training Pte Ltd, Wavelink Maritime Institute. Recognition of ECDIS Training from Overseas 9 MPA will also accept ECDIS training from overseas, if these courses were based on the IMO Model Course 1.27, and if they were approved by foreign maritime administrations from countries whose certificates of competency are recognised by MPA for service on board Singapore ships. It is not necessary and MPA will not issue endorsement to recognise overseas ECDIS training. Additional advice to Shipowners 10. Shipowners need to plan for the transition to ECDIS as early as possible and not wait for the phase-in dates. Shipowners are advised to consider the following when transiting from paper to electronic charts:
a. Setting clear company policies on ECDIS. These may include related digital nautical publications.
b. Laying out of the programme for the retrofitting of ECDIS on
existing ships, taking into consideration the SOLAS phase-in dates.
c. Training of ship officers, both generic (approved MPA training
service providers) and specific training from equipment manufacturers.

d. Reviewing of bridge procedures. Methods and procedures for electronic navigation have to be developed and taking into consideration a number of useful SN circulars and IHO publications2, a list of which are provided in Annex B.
e. Reviewing of company’s and ship’s safety management systems
under the ISM Code for navigational procedures and crew documentation relating to ECDIS training.
f. Selection of service providers for chart services which are most
appropriate to the company’s operational needs and which fulfil the carriage requirements, including updating service. A poor updating service, including continued using of cancelled ENCs, will render the ECDIS unfit for navigational use.
g. Consideration of the ENCs required for the voyages undertaken
by the company’s vessels. There will be ENC cells which are more frequently used than others and consideration of the purchase of individual, units or folios of ENCs to cover areas of the various routes used by the company’s vessels. It is important to remember that to improve safety of navigation as ECDIS is intended, it is essential that all the required ENCs for each voyage are always on board and always available.
h. Consideration of back-up arrangements, eg. paper charts,
second ECDIS or other solutions. i. Consideration of the special requirements when using
computers on board ship.
Digital Nautical Publications 11 The new regulation on ECDIS does not apply to digital nautical publications. As such, shipowners would continue to apply to MPA for a Letter of Equivalence if they wish to install digital nautical publications on board their ships, in accordance with Shipping Circular no. 29 of 2006. 12. Any query relating to this circular should be directed to Mr Ong Hua Siong (Tel: 63756210) CHEONG KENG SOON DIRECTOR OF MARINE MARITIME AND PORT AUTHORITY OF SINGAPORE Related circular: No. 29 of 2006
2 SN.1/Circ.276 Transitioning from paper chart to electronic chart display and ECDIS; SN/Circ.207
Rev.1 Differences between RCDS and ECDIS; SN/Circ.266 Maintenance of ECDIS software, and
others.

RESOLUTION MSC.282(86)
(adopted on 5 June 2009)
ADOPTION OF AMENDMENTS TO THE INTERNATIONAL CONVENTION FOR THE SAFETY OF LIFE AT SEA, 1974, AS AMENDED
THE MARITIME SAFETY COMMITTEE,
RECALLING Article 28(b) of the Convention on the International Maritime Organization concerning the functions of the Committee,
RECALLING FURTHER article VIII(b) of the International Convention for the Safety of Life at Sea (SOLAS), 1974 (hereinafter referred to as �the Convention�), concerning the amendment procedure applicable to the Annex to the Convention, other than to the provisions of chapter I thereof,
HAVING CONSIDERED, at its eighty-sixth session, amendments to the Convention, proposed and circulated in accordance with article VIII(b)(i) thereof, 1. ADOPTS, in accordance with article VIII(b)(iv) of the Convention, amendments to the Convention, the text of which is set out in the Annex to the present resolution; 2. DETERMINES, in accordance with article VIII(b)(vi)(2)(bb) of the Convention, that the said amendments shall be deemed to have been accepted on 1 July 2010, unless, prior to that date, more than one third of the Contracting Governments to the Convention or Contracting Governments the combined merchant fleets of which constitute not less than 50% of the gross tonnage of the world�s merchant fleet, have notified their objections to the amendments; 3. INVITES SOLAS Contracting Governments to note that, in accordance with article VIII(b)(vii)(2) of the Convention, the amendments shall enter into force on 1 January 2011 upon their acceptance in accordance with paragraph 2 above; 4. REQUESTS the Secretary-General, in conformity with article VIII(b)(v) of the Convention, to transmit certified copies of the present resolution and the text of the amendments contained in the Annex to all Contracting Governments to the Convention; 5. FURTHER REQUESTS the Secretary-General to transmit copies of this resolution and its Annex to Members of the Organization, which are not Contracting Governments to the Convention.

RESOLUTION MSC.282(86)Page 2
ANNEX
AMENDMENTS TO THE INTERNATIONAL CONVENTION FOR THE SAFETY OF LIFE AT SEA, 1974, AS AMENDED
CHAPTER II-1 CONSTRUCTION � STRUCTURE, SUBDIVISION AND STABILITY, MACHINERY
AND ELECTRICAL INSTALLATIONS
Part A-1 Structure of ships
Regulation 3-5 − New installation of materials containing asbestos 1 The existing text of paragraph 2 is replaced by the following:
�From 1 January 2011, for all ships, new installation of materials which contain asbestos shall be prohibited.�
Part C Machinery installations
Regulation 35-1 � Bilge pumping arrangements 2 The following new paragraph 2.6.3 is added after the existing paragraph 2.6.2:
�2.6.3 Provisions for the drainage of closed vehicle and ro-ro spaces and special category spaces shall also comply with regulations II-2/20.6.1.4 and II-2/20.6.1.5.�
CHAPTER V SAFETY OF NAVIGATION
Regulation 19 � Carriage requirements for shipborne navigational systems and equipment 3 In paragraph 2.1, the existing subparagraph .4 is replaced by the following:
�.4 nautical charts and nautical publications to plan and display the ship�s route for the intended voyage and to plot and monitor positions throughout the voyage. An electronic chart display and information system (ECDIS) is also accepted as meeting the chart carriage requirements of this subparagraph. Ships to which paragraph 2.10 applies shall comply with the carriage requirements for ECDIS detailed therein;�.

RESOLUTION MSC.282(86)Page 3
4 In paragraph 2.2, the new subparagraphs .3 and .4 are added after the existing subparagraph .2 as follows:
�.3 a bridge navigational watch alarm system (BNWAS), as follows: .1 cargo ships of 150 gross tonnage and upwards and passenger ships
irrespective of size constructed on or after 1 July 2011; .2 passenger ships irrespective of size constructed before 1 July 2011, not
later than the first survey* after 1 July 2012; .3 cargo ships of 3,000 gross tonnage and upwards constructed
before 1 July 2011, not later than the first survey* after 1 July 2012; .4 cargo ships of 500 gross tonnage and upwards but less than 3,000 gross
tonnage constructed before 1 July 2011, not later than the first survey* after 1 July 2013; and
.5 cargo ships of 150 gross tonnage and upwards but less than 500 gross
tonnage constructed before 1 July 2011, not later than the first survey* after 1 July 2014.
The bridge navigational watch alarm system shall be in operation whenever the ship is underway at sea;
.4 a bridge navigational watch alarm system (BNWAS) installed prior to 1 July 2011 may subsequently be exempted from full compliance with the standards adopted by the Organization, at the discretion of the Administration.�
________________________________
* Refer to the Unified interpretation of the term �first survey� referred to in SOLAS regulations (MSC.1/Circ.1290).
5 After the existing paragraph 2.9, the new paragraphs 2.10 and 2.11 are added as follows:
�2.10 Ships engaged on international voyages shall be fitted with an Electronic Chart Display and Information System (ECDIS) as follows:
.1 passenger ships of 500 gross tonnage and upwards constructed on or after 1 July 2012;
.2 tankers of 3,000 gross tonnage and upwards constructed on or
after 1 July 2012; .3 cargo ships, other than tankers, of 10,000 gross tonnage and upwards
constructed on or after 1 July 2013; .4 cargo ships, other than tankers, of 3,000 gross tonnage and upwards but
less than 10,000 gross tonnage constructed on or after 1 July 2014; .5 passenger ships of 500 gross tonnage and upwards constructed
before 1 July 2012, not later than the first survey* on or after 1 July 2014;

RESOLUTION MSC.282(86)Page 4
.6 tankers of 3,000 gross tonnage and upwards constructed before 1 July 2012, not later than the first survey* on or after 1 July 2015;
.7 cargo ships, other than tankers, of 50,000 gross tonnage and upwards
constructed before 1 July 2013, not later than the first survey* on or after 1 July 2016;
.8 cargo ships, other than tankers, of 20,000 gross tonnage and upwards but
less than 50,000 gross tonnage constructed before 1 July 2013, not later than the first survey* on or after 1 July 2017; and
.9 cargo ships, other than tankers, of 10,000 gross tonnage and upwards but
less than 20,000 gross tonnage constructed before 1 July 2013, not later than the first survey* on or after 1 July 2018.
2.11 Administrations may exempt ships from the application of the requirements of paragraph 2.10 when such ships will be taken permanently out of service within two years after the implementation date specified in subparagraphs .5 to .9 of paragraph 2.10.�
_________________________
* Refer to the Unified interpretation of the term �first survey� referred to in SOLAS regulations (MSC.1/Circ.1290).
CHAPTER VI CARRIAGE OF CARGOES
6 The title of chapter VI is replaced by the following:
�CARRIAGE OF CARGOES AND OIL FUELS�
Regulation 1 � Application 7 At the beginning of paragraph 1, the words �Unless expressly provided otherwise,� are added and the existing word �This� is replaced by the word �this�. Regulation 5-1 � Material safety data sheets 8 The existing text of the regulation is replaced by the following:
�Ships carrying oil or oil fuel, as defined in regulation 1 of Annex 1 of the International Convention for the Prevention of Pollution from Ships, 1973, as modified by the Protocol of 1978 relating thereto, shall be provided with material safety data sheets, based on the recommendations developed by the Organization*, prior to the loading of such oil as cargo in bulk or bunkering of oil fuel.� ____________ * Refer to the Recommendations for material safety data sheets (MSDS) for MARPOL Annex I oil
cargo and oil fuel, adopted by the Organization by resolution MSC.286(86), as may be amended.

RESOLUTION MSC.282(86)Page 5
APPENDIX
CERTIFICATES Record of Equipment for the Passenger Ship Safety Certificate (Form P) 9 In the Record of Equipment for the Passenger Ship Safety Certificate (Form P), in section 5, a new item 14 is inserted as follows:
�14 Bridge navigational watch alarm system (BNWAS)�. Record of Equipment for the Cargo Ship Safety Equipment Certificate (Form E) 10 In the Record of Equipment for the Cargo Ship Safety Equipment Certificate (Form E), in section 3, a new item 14 is inserted as follows:
�14 Bridge navigational watch alarm system (BNWAS)�. Record of Equipment for the Nuclear Passenger Ship Safety Certificate (Form PNUC) 11 In the Record of Equipment for Nuclear Passenger Ship Safety Certificate (Form PNUC), in section 5, a new item 15 is inserted as follows:
�15 Bridge navigational watch alarm system (BNWAS)�. Record of Equipment for the Nuclear Cargo Ship Safety Certificate (Form CNUC) 12 In the Record of Equipment for Nuclear Cargo Ship Safety Certificate (Form CNUC), in section 5, a new item 14 is inserted as follows:
�14 Bridge navigational watch alarm system (BNWAS)�.
* * *
FOOTNOTE TO BE ADDED TO SOLAS REGULATION V/18 In the existing footnote to paragraph 2, the following reference is added after the last reference:
�Performance standards for a bridge navigational watch alarm system (BNWAS) (resolution MSC.128(75))�.
***

RESOLUTION MSC.191(79) (adopted on 6 December 2004)
PERFORMANCE STANDARDS FOR THE PRESENTATION OF
NAVIGATION-RELATED INFORMATION ON SHIPBORNE NAVIGATIONAL DISPLAYS
THE MARITIME SAFETY COMMITTEE, RECALLING Article 28(b) of the Convention on the International Maritime Organization concerning the functions of the Committee, RECALLING ALSO resolution A.886(21) by which the Assembly resolved that the function of adopting performance standards and technical specifications, as well as amendments thereto, shall be performed by the Maritime Safety Committee on behalf of the Organization, RECOGNIZING that harmonization of the requirements for the presentation of navigation-related information on the bridge will ensure that all navigational displays adopt a consistent human-machine interface philosophy and implementation, RECOGNIZING FURTHER that, for safety reasons, the terms, abbreviations and symbols used for the display of navigation-related information on all shipborne navigation equipment and systems should be consistent, HAVING CONSIDERED the recommendation on the performance standards for the presentation of navigation-related information on shipborne navigational displays made by the Sub-Committee on Safety of Navigation at its fiftieth session, 1. ADOPTS the Recommendation on Performance Standards for the Presentation of Navigation-related Information on Shipborne Navigational Displays, set out in the Annex to the present resolution; 2. RECOMMENDS Governments to ensure that navigational shipborne displays on the bridge of a ship installed on or after 1 July 2008 conform, from the presentation of navigation-related information point of view, to performance standards not inferior to those specified in the Annex to the present resolution.

MSC.191(79)Page 2
ANNEX
RECOMMENDATION ON PERFORMANCE STANDARDS FOR THE PRESENTATION OF NAVIGATION-RELATED INFORMATION ON
SHIPBORNE NAVIGATIONAL DISPLAYS 1 PURPOSE These performance standards harmonize the requirements for the presentation of navigation-related information on the bridge of a ship to ensure that all navigational displays adopt a consistent human machine interface philosophy and implementation. These performance standards supplement and, in case of a conflict, take priority over, presentation requirements of the individual performance standards adopted by the Organization for relevant navigational systems and equipment, and cover the presentation of navigation-related information by equipment for which performance standards have not been adopted. 2 SCOPE These performance standards specify the presentation of navigational information on the bridge of a ship, including the consistent use of navigational terms, abbreviations, colours and symbols, as well as other presentation characteristics. These performance standards also address the presentation of navigation information related to specific navigational tasks by recognizing the use of user selected presentations in addition to presentations required by the individual performance standards adopted by the Organization. 3 APPLICATION The general principles of these standards are applicable for all displays on the bridge of a ship.∗ These performance standards are applicable to any display equipment associated with the navigation systems and equipment for which individual performance standards have been adopted by the Organization. They also address display equipment associated with navigation systems and equipment for which individual performance standards have not been adopted. In addition to the general requirements set out in resolution A.694(17)** display equipment should meet the requirements of these performance standards, as applicable. 4 DEFINITIONS Definitions are given in the appendix.
∗ The general principles are addressed in paragraphs 5 and 8. ** IEC Publication 60945 (see Appendix 1).

MSC.191(79)Page 3
5 GENERAL REQUIREMENTS FOR THE PRESENTATION OF INFORMATION 5.1 Arrangement of information 5.1.1 The presentation of information should be consistent with respect to screen layout and arrangement of information. Data and control functions should be logically grouped. Priority of information should be identified for each application, permanently displayed and presented to the user in a prominent manner by, for example, use of position, size and colour. 5.1.2 The presentation of information should be consistent with respect to values, units, meaning, sources, validity, and if available, integrity. 5.1.3 The presentation of information should be clearly separated into an operational display area (e.g. radar, chart) and one or more user dialogue areas (e.g. menus, data, control functions). 5.2 Readability 5.2.1 The presentation of alphanumeric data, text, symbols and other graphical information (e.g. radar image) should support readability from typical user positions under all ambient light conditions likely to be experienced on the bridge of a ship, and with due consideration to the night vision of the officer of the watch. 5.2.2 Alphanumeric data and text should be presented using a clearly legible non-italic, sans-serif font. The font size should be appropriate for the viewing distance from user positions likely to be experienced on the bridge of a ship. 5.2.3 Text should be presented using simple unambiguous language that is easy to understand. Navigation terms and abbreviations should be presented using the nomenclature defined in SN/Circ.243. 5.2.4 When icons are used, their purpose should be intuitively recognized by appearance, placement and grouping. 5.3 Colours and intensity 5.3.1 The colours used for the presentation of alphanumeric data, text, symbols and other graphical information should provide sufficient contrast against the background under all lighting conditions likely to be experienced on the bridge of a ship. 5.3.2 The colours and brightness should take into account the light conditions of daylight, dusk and night. The presentation should support night viewing by showing light foreground information on a dark non-reflecting background at night. 5.3.3 The background colour and contrast should be chosen to allow presented information to be easily discriminated without degrading the colour coding aspects of the presentation.
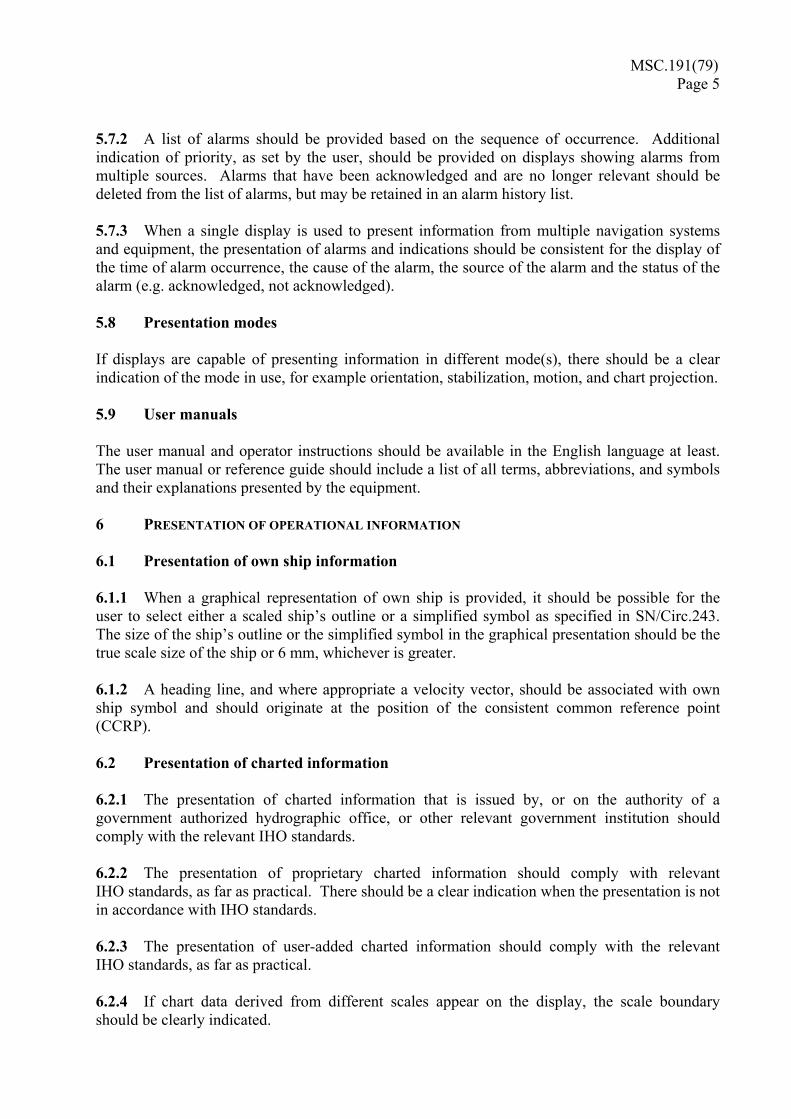
MSC.191(79)Page 4 5.4 Symbols 5.4.1 Symbols used for the presentation of operational information are defined in SN/Circ.243. 5.4.2 Symbols used for the display of charted information should comply with relevant IHO standards. 5.5 Coding of information 5.5.1 When colour coding is used for discrimination or conspicuousness of alphanumeric text, symbols and other graphical information, all colours in the set should clearly differ from one another. 5.5.2 When colour coding is used, the colour red should be used for coding of alarm related information. 5.5.3 When colour coding is used, it should be used in combination with other symbol attributes, such as size, shape, and orientation. 5.5.4 Flashing of information should be reserved for unacknowledged alarms. 5.6 Integrity marking 5.6.1 The source, validity, and where possible, the integrity of information should be indicated. Invalid information or information with low integrity should be clearly marked, qualitatively and/or quantitatively. Invalid information or information with low integrity may be quantitatively indicated by displaying absolute or percentage values. 5.6.2 When colour coding is used, information with low integrity should be qualitatively marked by using yellow, and invalid information should be qualitatively marked by using red. 5.6.3 In order to show that the screen is being refreshed, means should be provided to immediately make the user aware of a presentation failure on an operational display (e.g. �picture freeze�). 5.7 Alarms and indications 5.7.1 The operational status of information should be indicated as follows:
Status Visual indication Audible signal
Alarm, not acknowledged Red, flashing Accompanied by an audible signal
Alarm, acknowledged Invalid Information
Red Suppression of audible signal
Important Indications (Warnings) (e.g. low integrity)
Yellow Silence unless otherwise specified by the Organization
Normal state None required, optionally green Silence
MSC.191(79)Page 5
5.7.2 A list of alarms should be provided based on the sequence of occurrence. Additional indication of priority, as set by the user, should be provided on displays showing alarms from multiple sources. Alarms that have been acknowledged and are no longer relevant should be deleted from the list of alarms, but may be retained in an alarm history list. 5.7.3 When a single display is used to present information from multiple navigation systems and equipment, the presentation of alarms and indications should be consistent for the display of the time of alarm occurrence, the cause of the alarm, the source of the alarm and the status of the alarm (e.g. acknowledged, not acknowledged). 5.8 Presentation modes If displays are capable of presenting information in different mode(s), there should be a clear indication of the mode in use, for example orientation, stabilization, motion, and chart projection. 5.9 User manuals The user manual and operator instructions should be available in the English language at least. The user manual or reference guide should include a list of all terms, abbreviations, and symbols and their explanations presented by the equipment. 6 PRESENTATION OF OPERATIONAL INFORMATION 6.1 Presentation of own ship information 6.1.1 When a graphical representation of own ship is provided, it should be possible for the user to select either a scaled ship�s outline or a simplified symbol as specified in SN/Circ.243. The size of the ship�s outline or the simplified symbol in the graphical presentation should be the true scale size of the ship or 6 mm, whichever is greater. 6.1.2 A heading line, and where appropriate a velocity vector, should be associated with own ship symbol and should originate at the position of the consistent common reference point (CCRP). 6.2 Presentation of charted information 6.2.1 The presentation of charted information that is issued by, or on the authority of a government authorized hydrographic office, or other relevant government institution should comply with the relevant IHO standards. 6.2.2 The presentation of proprietary charted information should comply with relevant IHO standards, as far as practical. There should be a clear indication when the presentation is not in accordance with IHO standards. 6.2.3 The presentation of user-added charted information should comply with the relevant IHO standards, as far as practical. 6.2.4 If chart data derived from different scales appear on the display, the scale boundary should be clearly indicated.
MSC.191(79)Page 6 6.3 Presentation of radar information 6.3.1 Radar images should be displayed by using a basic colour that provides optimum contrast. Radar echoes should be clearly visible when presented on top of a chart background. The relative strength of echoes may be differentiated by tones of the same basic colour. The basic colour may be different for operation under different ambient light conditions. 6.3.2 Target trails should be distinguishable from targets and clearly visible under all ambient light conditions. 6.4 Presentation of target information 6.4.1 General 6.4.1.1 Target information may be provided by radar target tracking and/or by reported target information from the Automatic Identification System (AIS). 6.4.1.2 The operation of the radar target tracking function and the processing of reported AIS information, including the number of targets presented, related to screen size, is defined within the Performance standards for radar equipment, as adopted by the Organization. The presentation of radar target tracking and AIS information is defined within these performance standards. 6.4.1.3 As far as practical, the user interface and data format for operating, displaying and indicating radar tracking and AIS information should be consistent. 6.4.2 Target capacity 6.4.2.1 There should be an indication when the target tracking and/or reported target processing/display capacity is about to be exceeded. 6.4.2.2 There should be an indication when the target tracking and/or reported target processing/display capacity has been exceeded. 6.4.3 Filtering of AIS sleeping targets 6.4.3.1 To ensure that the clarity of the total presentation is not substantially impaired, it should be possible to filter the presentation of sleeping AIS targets (e.g. by target range, CPA/TCPA or AIS target class A/B, etc.). 6.4.3.2 If a filter is applied, there should be a clear and permanent indication. The filter criteria in use should be readily available. 6.4.3.3 It should not be possible to remove individual AIS targets from the display.
MSC.191(79) Page 7
6.4.4 Activation of AIS targets 6.4.4.1 If zones for the automatic activation of AIS targets are provided, they should be the same as for automatic radar target acquisition, if available. Any user defined zones (e.g. acquisition/activation zones) in use should be presented in graphical form. 6.4.4.2 In addition, sleeping AIS targets should be automatically activated when meeting user defined parameters (e.g. target range, CPA/TCPA or AIS target class A/B). 6.4.5 Graphical presentation 6.4.5.1 Targets should be presented with their relevant symbols according to SN/Circ.243. 6.4.5.2 AIS information should be graphically presented either as sleeping or activated targets. 6.4.5.3 The course and speed of a tracked radar target or reported AIS target should be indicated by a vector that clearly shows the predicted motion. The vector time (length) should be consistent for presentation of any target regardless of its source. 6.4.5.4 The presentation of vector symbols should be consistent irrespective of the source of information. The presentation mode should be clearly and permanently indicated, including for example: True/Relative vector, vector time and vector stabilisation. 6.4.5.5 The orientation of the AIS target symbol should indicate its heading. If the heading information is not received, the orientation of the AIS symbol should be aligned to the COG. When available, the turn or rate of turn (ROT) indicator and/or the path prediction should indicate the manoeuvre of an activated AIS target. 6.4.5.6 A consistent common reference point should be used for the alignment of tracked target symbols and AIS target symbols with other information on the same display. 6.4.5.7 On large scale/low range displays, a means to present a true scale outline of an activated AIS target should be provided. 6.4.5.8 It should be possible to display the past positions of activated targets. 6.4.6 Target data 6.4.6.1 A target selected for the display of its alphanumeric information should be identified by the relevant symbol. If more than one target is selected for data display, the symbols and the corresponding data should be clearly identified. 6.4.6.2 There should be a clear indication to show that the target data is derived from radar or AIS or from a combination of these.
MSC.191(79) Page 8
6.4.6.3 For each selected tracked radar target the following data should be presented in alphanumeric form: Source(s) of data, measured range of target, measured bearing of target, predicted target range at the closest point of approach (CPA), predicted time to CPA (TCPA), true course of target, true speed of target. Additional target information should be provided on request. 6.4.6.4 For each selected AIS target the following data should be presented in alphanumeric form: Source of data, ship�s identification, position and its quality, calculated range of target, calculated bearing of target, CPA, TCPA, COG, SOG, navigational status. Ship�s heading and rate of turn should also be made available. Additional target information should be provided on request. 6.4.6.5 If the received AIS information is incomplete, the absent information should be clearly indicated in the target data field as missing. 6.4.6.6 The data should be displayed and continually updated, until another target is selected for data display or until the window is closed. 6.4.6.7 Means should be provided to present own ship AIS data on request. 6.4.6.8 The alphanumeric displayed data should not obscure graphically presented operational information. 6.4.7 Operational alarms 6.4.7.1 A clear indication of the status of the alarms and of the alarm criteria should be given. 6.4.7.2 A CPA/TCPA alarm of a tracked radar or activated AIS target should be clearly indicated and the target should be clearly marked by a dangerous target symbol. 6.4.7.3 If a user defined acquisition/activation zone facility is provided, a target entering the zone should be clearly identified with the relevant symbol and for tracked radar targets an alarm should be given. The zone should be identified with the relevant symbology, and should be applicable to tracked radar and AIS targets. 6.4.7.4 The last position of a lost target should be clearly marked by a lost target symbol on the display, and the lost target alarm should be given. The lost target symbol should disappear if the signal is received again, or after the alarm has been acknowledged. There should be a clear indication whether the lost target alarm function for AIS targets is enabled or disabled. 6.4.8 AIS and radar target association 6.4.8.1 An automatic target association function serves to avoid the presentation of two target symbols for the same physical target. If target data from AIS and radar tracking are both available and if the AIS and radar information are considered as one target, then as a default condition, the activated AIS target symbol and the alphanumeric AIS target data should be automatically selected and displayed. The user should have the option to change the default condition to the display of tracked radar targets and should be permitted to select either radar tracking or AIS alphanumeric data.
MSC.191(79) Page 9
6.4.8.2 If the AIS and radar information are considered as two distinct targets, one activated AIS target and one tracked radar target should be displayed. No alarm should be raised. 6.4.9 AIS presentation status The AIS presentation status should be indicated as follows:
Function Cases to be presented Presentation
AIS ON/OFF AIS processing switched ON / graphical presentation switched OFF
AIS processing switched ON / graphical presentation switched ON
Alphanumeric or graphical
Filtering of sleeping AIS targets (6.4.3)
Filter status Filter status Alphanumeric or graphical
Activation of Targets (6.4.4)
Activation criteria Graphical
CPA/TCPA Alarm (6.4.7)
Function ON/OFF CPA/TCPA Criteria
Sleeping targets included
Function ON/OFF CPA/TCPA Criteria
Sleeping targets included
Alphanumeric and graphical
Lost Target Alarm (6.4.7)
Function ON/OFF Lost target filter criteria
Function ON/OFF Lost target filter criteria
Alphanumeric and graphical
Target Association (6.4.8)
Function ON/OFF Association criteria
Default target priority
Function ON/OFF Association criteria
Default target priority
Alphanumeric
6.4.10 Trial manoeuvre A trial manoeuvre simulation should be clearly identified by the relevant symbol positioned astern of own ship within the operational display area of the screen. 7 OPERATIONAL DISPLAYS 7.1 General 7.1.1 If the display equipment is capable of supporting the presentation of multiple functions then there should be a clear indication of the primary function supported by the presentation (e.g. Radar, ECDIS). It should be possible to select the Radar presentation (see 7.2) or the ECDIS presentation (see 7.3) by a simple operator action. 7.1.2 If a radar image and an electronic chart are displayed together, the chart and the radar image should use a consistent common reference point and match in scale, projection and orientation. Any offset should be indicated.
MSC.191(79)Page 10 7.1.3 Range scales of 0.25, 0.5, 0.75, 1.5, 3, 6, 12 and 24 NM should be provided. Additional range scales are permitted. These range scales do not apply when presenting raster chart data. The range scale should be permanently indicated. 7.1.4 When range rings are displayed, the range ring scale should be indicated. 7.1.5 No part of the operational display area should be permanently used for presentation of information that is not part of the navigation presentation (e.g. pop up displays, drop down menus and information windows). Temporary, limited and relevant alphanumeric data may be displayed adjacent to a selected symbol, graphic or target within the operational display area. 7.2 Radar display 7.2.1 General 7.2.1.1 Radar video, tracked radar targets and AIS targets should not be substantially degraded, masked or obscured by other presented information. 7.2.1.2 It should be possible to temporarily suppress all graphical information from the display, retaining only radar video and trails. 7.2.1.3 The brightness of radar echoes and associated graphic symbols for tracked radar targets should be variable. It should be possible to control the brightness of all displayed information. There should be independent means to adjust the brightness of groups of displayed graphics and alphanumeric data. The brilliance of the heading line should not be variable to extinction. 7.2.2 Display of chart information on radar 7.2.2.1 Vector chart information may be displayed on a radar presentation. This should be accomplished using layers selected from the chart database. As a minimum, the elements of the ECDIS Standard Display should be available for individual selection by category or layer, but not as individual objects. As far as practical, chart information should be presented in accordance with the ECDIS performance standards and with these presentation standards. 7.2.2.2 If chart information is displayed within the operational display area, the display of radar information should have priority. The chart information should be clearly perceptible as such. The chart information should not substantially degrade, mask or obscure the radar video, tracked radar targets and AIS targets. 7.2.2.3 When chart information is displayed, there should be a permanent indication of its status. Source and update information should also be made available. 7.2.3 Display of maps on radar Map graphics may be displayed, but should not substantially degrade, mask or obscure the radar video, tracked radar targets and AIS targets.
MSC.191(79)Page 11
7.3 ECDIS display 7.3.1 General 7.3.1.1 The ENC and all updates to it should be displayed without any degradation of their information content. 7.3.1.2 Chart information should not be substantially degraded, masked or obscured by other presented information. 7.3.1.3 It should be possible to temporarily suppress all supplemental information from the display, retaining only chart related information contained in the Display Base. 7.3.1.4 It should be possible to add or remove information from the ECDIS display. It should not be possible to remove information contained in the Display Base from the ECDIS display. 7.3.1.5 It should be possible to select a safety contour from the depth contours provided by the ENC. The safety contour should be emphasized over other contours on the display. 7.3.1.6 It should be possible to select a safety depth. Soundings equal to or less than the safety depth should be emphasized whenever spot soundings are selected for display. 7.3.1.7 An indication should be provided if the information is displayed at a larger scale than that contained in the ENC, or if own ship's position is covered by an ENC at a larger scale than that provided by the display. 7.3.1.8 Overscaled areas shown on the ECDIS display should be identified. 7.3.2 Display of radar information on ECDIS 7.3.2.1 Radar and target information may be displayed on ECDIS but should not substantially degrade, mask or obscure the chart information. As far as practical, radar and target information should be presented in accordance with the radar performance standard and with these presentation standards. 7.3.2.2 Radar and target information should be clearly distinguishable from the chart information. It should be possible to remove this information by a simple operator action. 7.3.3 Display of additional information on ECDIS 7.3.3.1 Information from additional sources may be displayed on ECDIS but should not substantially degrade, mask or obscure the chart information. 7.3.3.2 Additional information should be clearly distinguishable from the chart information. It should be possible to remove this information by a simple operator action.

MSC.191(79)Page 12 7.4 User selected (task orientated) presentation 7.4.1 The user may configure a presentation for a specific task at hand. The presentation may include radar and/or chart information, in combination with other navigation or ship related data. When not fully compliant with the Radar or ECDIS performance standards, such a presentation should be identified as an auxiliary presentation. 7.4.2 As far as practical, the presentation of any radar and/or ECDIS related functions should be compliant with the requirements of the relevant performance standards and of these presentation standards, with the exception of size requirements for the operational area. Chartlets or windows of radar information may be presented along with other information associated with the task at hand. 8 PHYSICAL REQUIREMENTS 8.1 Display adjustment 8.1.1 It should be possible to adjust the contrast and brightness of the display provided, as applicable to the display technology. It should be possible to dim the display. The range of control should permit the display to be legible under all ambient light conditions. 8.1.2 It should be possible for the navigator to reset the values of contrast and/or brightness to a preset or default condition. 8.1.3 Where magnetic fields degrade the presentation of navigation information, a means to neutralise the effect of magnetic fields should be provided. 8.2 Screen size 8.2.1 Display equipment should be of sufficient size to support the requirements of the relevant performance standards adopted by the Organization. 8.2.2 The operational display area of the chart presentation for route monitoring should be at least 270 x 270 mm. 8.2.3 The operational display area of the radar presentation should be at least a circle of diameter of:
- 180 mm for ships smaller than 500 gross tonnage; - 250 mm for ships larger than 500 gross tonnage and High-Speed Craft (HSC) less than
10,000 gross tonnage; - 320 mm for ships larger than 10,000 gross tonnage.
8.3 Colours 8.3.1 Multicoloured display equipment should be used except where monochrome displays are permitted within individual performance standards adopted by the Organization.

MSC.191(79)Page 13
8.3.2 Multicoloured operational displays including multifunction displays (e.g. conning displays) should provide a minimum of 64 colours except where permitted or not required by the Organization, or when used for a single specific purpose (e.g. speed log, echo-sounder). 8.4 Screen resolution Operational display equipment including multifunction displays (e.g. conning displays) should provide a minimum screen resolution of 1280 x 1024, or equivalent for a different aspect ratio, except where permitted or not required by the Organization, or when used for a single specific purpose (e.g. speed log, echo-sounder). 8.5 Screen viewing angle The display should support the reading of information under all ambient light conditions, simultaneously, by at least two users, from standing and sitting operator positions likely to be found on the bridge of a ship.
MSC.191(79)Page 14
APPENDIX
DEFINITIONS Activated AIS target A target representing the automatic or manual activation
of a sleeping target for the display of additional graphically presented information.
AIS target A target generated from an AIS message. Associated target A target simultaneously representing a tracked radar
target and AIS target having similar parameters (e.g. position, course, speed) and which comply with an association algorithm.
CCRP The Consistent Common Reference Point is a location
on own ship, to which all horizontal measurements such as target range, bearing, relative course, relative speed, closest point of approach (CPA) or time to closest point of approach (TCPA) are referenced, typically the conning position of the bridge.
Dangerous target A target with a predicted CPA and TCPA that violates
values preset by the operator. The respective target is marked by a �dangerous target� symbol.
Display base The level of information which cannot be removed from
the ECDIS display, consisting of information which is required at all times in all geographic areas and all circumstances. It is not intended to be sufficient for safe navigation.
ENC Electronic Navigational Chart. The database
standardized as to content, structure and format according to relevant IHO standards and issued by, or on the authority of, a Government.
Heading Direction in which the bow of a ship is pointing
expressed as an angular displacement from north. Important indication A marking of an operational status of displayed
information which needs special attention, e.g. information with low integrity or invalid information.
Lost target A target representing the last valid position of a target
before its data was lost. The target is displayed by a �lost target� symbol.
MSC.191(79)Page 15
Operational display area Area of the display used to graphically present chart and
radar information, excluding the user dialogue area. On the chart display this is the area of the chart presentation. On the radar display this is the area encompassing the radar image.
Past positions Equally time-spaced past position marks of a tracked or
reported target and own ship. The co-ordinates used to display past positions may be either relative or true.
Sleeping AIS target A target indicating the presence and orientation of a
vessel equipped with AIS in a certain location. The target is displayed by a �sleeping target� symbol. No additional information is presented until activated.
Selected target A target selected manually for the display of detailed
alphanumeric information in a separate data display area. The target is displayed by a �selected target� symbol.
Standard display The level of information that should be shown when a
chart is first displayed on ECDIS. The level of the information it provides for route planning or route monitoring may be modified by the mariner according to the mariner�s needs.
Trial manoeuvre Facility used to assist the operator to perform a
proposed manoeuvre for navigation and collision avoidance purposes, by displaying the predicted future status of all tracked and AIS targets as a result of own ship�s simulated manoeuvres.
User dialogue area An area of the display consisting of data fields and/or
menus that is allocated to the interactive presentation and entry or selection of operational parameters, data and commands mainly in alphanumeric form.
User selected presentation An auxiliary presentation configured by the user for a
specific task at hand. The presentation may include radar and/or chart information, in combination with other navigation or ship related data.
***


I:\CIRC\SN\01\207-Rev-1.doc
INTERNATIONAL MARITIME ORGANIZATION 4 ALBERT EMBANKMENT LONDON SE1 7SR Telephone: 020 7735 7611 Fax: 020 7587 3210
IMO
E
Ref. T2-OSS/2.7 SN.1/Circ.207/Rev.1 22 October 2007
DIFFERENCES BETWEEN RCDS AND ECDIS 1 The Maritime Safety Committee, at its eighty-third session (3 to 12 October 2007), adopted revised performance standards for Electronic Chart Display and Information Systems (ECDIS) and accordingly agreed to the revision of SN/Circ.207 on difference between Raster Chart Display System (RCDS) and ECDIS. 2 ECDIS has the ability to operate in two modes:
.1 the ECDIS mode when Electronic Navigational Charts (ENCs) are used; and
.2 the RCDS mode when ENCs are not available and Raster Navigational Charts (RNCs) are used instead.
However, the RCDS mode does not have the full functionality of ECDIS, and can only be used together with an appropriate portfolio of up-to-date paper charts. 3 The mariners� attention is therefore drawn to the following limitations of the RCDS mode:
.1 unlike ENC, where there are no displayed boundaries, RNCs are based on paper charts and as such have boundaries which are evident in ECDIS;
.2 RNCs will not trigger automatic alarms (e.g., anti-grounding). However alarms
and indications can be generated with the manual addition, during passage planning, e.g., of clearing lines, ship safety contour lines, isolated danger markers and danger areas to mitigate these limitations;
.3 horizontal datums and chart projections may differ between RNCs. Mariners
should understand how a chart�s horizontal datum relates to the datum of the position fixing system in use. In some instances, this may appear as a shift in position. This difference may be most noticeable at grid intersections;
.4 a number of RNCs cannot be referenced to either WGS-84 or PE 90 geodetic
datums. Where this is the case, ECDIS should give a continuous indication; .5 the display of RNCs features cannot be simplified by the removal of features to
suit a particular navigational circumstance or task at hand. This could affect the superimposition of radar/ARPA;
.6 without selecting different scale charts the look-ahead capability may be limited.
This may lead to inconvenience when determining range and bearing or the identity of distant objects;

SN.1/Circ.207/Rev.1 - 2 -
I:\CIRC\SN\01\207-Rev-1.doc
.7 orientation of the RCDS display to other than chart-up, may affect the readability of chart text and symbols (e.g., course-up, route-up);
.8 it is not possible to interrogate RNC features to gain additional information about
charted objects. Whether using ENC or RNC, in the planning process a navigator should consult all relevant publications (such as sailing directions, etc.);
.9 with RNC it is not possible to display a ship's safety contour or safety depth and
highlight it on the display, unless these features are manually entered during route planning;
.10 depending on the source of the RNC, different colours may be used to show
similar chart information. There may also be differences in colours used during day and night time;
.11 an RNC is intended to be used at the scale of the equivalent paper chart.
Excessive zooming in or zooming out can seriously degrade the displayed image. If the RNC is displayed at a larger scale than the equivalent paper chart, the ECDIS will provide an indication; and
.12 ECDIS provides an indication in the ENC which allows a determination of the
quality of hydrographic the data. When using RNCs, mariners are invited to consult the source diagram or the zone of confidence diagram, if available.
4 Member Governments are requested to bring this information to the attention of the relevant authorities and all seafarers for guidance and action, as appropriate.
___________

I:\CIRC\SN\243.doc
INTERNATIONAL MARITIME ORGANIZATION 4 ALBERT EMBANKMENT LONDON SE1 7SR Telephone: 020 7735 7611 Fax: 020 7587 3210
IMO
E
Ref. T2-OSS/2.7.1 SN/Circ.243 15 December 2004
GUIDELINES FOR THE PRESENTATION OF NAVIGATION-RELATED SYMBOLS, TERMS AND ABBREVIATIONS
1 The Sub-Committee on Safety of Navigation (NAV), at its fiftieth session (5 to 9 July 2004), agreed on Guidelines for the presentation of navigation-related symbols, given in annex 1, and terms and abbreviations, given in annex 2, and that they should be used for the display of navigation-related information on all shipborne navigational equipment and systems in consistent and uniform manner. 2 The Maritime Safety Committee, at its seventy-ninth session (1 to 10 December 2004), concurred with the Sub-Committee's views, approved the annexed Guidelines and encouraged their use for all shipborne navigational systems and equipment. 3 Member Governments are invited to bring the annexed Guidelines to the attention of all concerned.
***


SN/Circ.243
I:\CIRC\SN\243.doc
ANNEX 1
Guidelines for the Presentation of Navigation-related Symbols 1 Purpose The purpose of these annexed guidelines is to provide guidance on the appropriate use of navigation-related symbols to achieve a harmonized and consistent presentation. 2 Scope The use of these guidelines will insure that the symbols used for the display of navigation-related information on all shipborne navigational systems and equipment are presented in a consistent and uniform manner. 3 Application These guidelines apply to all shipborne navigational systems and equipment. The symbols listed in the appendix should be used for the display of navigation-related information to promote consistency in the symbol presentation on navigational equipment. The symbols listed in the Appendix should replace symbols which are currently contained in existing performance standards. Where a standard symbol is not available, another symbol may be used, but this symbol should not conflict with the symbols listed in the appendix.

SN/Circ.243 ANNEX 1 Page 2
I:\CIRC\SN\243.doc
APPENDIX
Navigation-related Symbols
Table 1: Own Ship Symbols
Topic Symbol Description
Own ship
Double circle, located at own ship�s reference position.
Use of this symbol is optional, if own ship position is shown by the combination of Heading Line and Beam Line.
Own Ship True scale outline
True scale outline located relative to own ship�s reference position, oriented along own ship�s heading.
Used on small ranges/large scales.
Own Ship Radar Antenna Position
Cross, located on a true scale outline of the ship at the physical location of the radar antenna that is the current source of displayed radar video.
Own Ship Heading line
Solid line thinner than the speed vector line style, drawn to the bearing ring or of fixed length, if the bearing ring is not displayed. Origin is at own ship�s reference point.
Own Ship Beam line
Solid line of fixed length; optionally length variable by
operator. Midpoint at own ship�s reference point.
Own Ship Speed vector
Dashed line � short dashes with spaces approximately twice the line width of heading line.
Time increments between the origin and endpoint may optionally be marked along the vector using short intersecting lines.
To indicate Water/Ground stabilization optionally one arrowhead for water stabilization and two arrowheads for ground stabilization may be added.
Own Ship Path prediction
A curved vector may be provided as a path predictor.
Own Ship Past Track
Thick line for primary source. Thin line for secondary source.
Optional time marks are allowed.
SN/Circ.243 ANNEX 1
Page 3
I:\CIRC\SN\243.doc
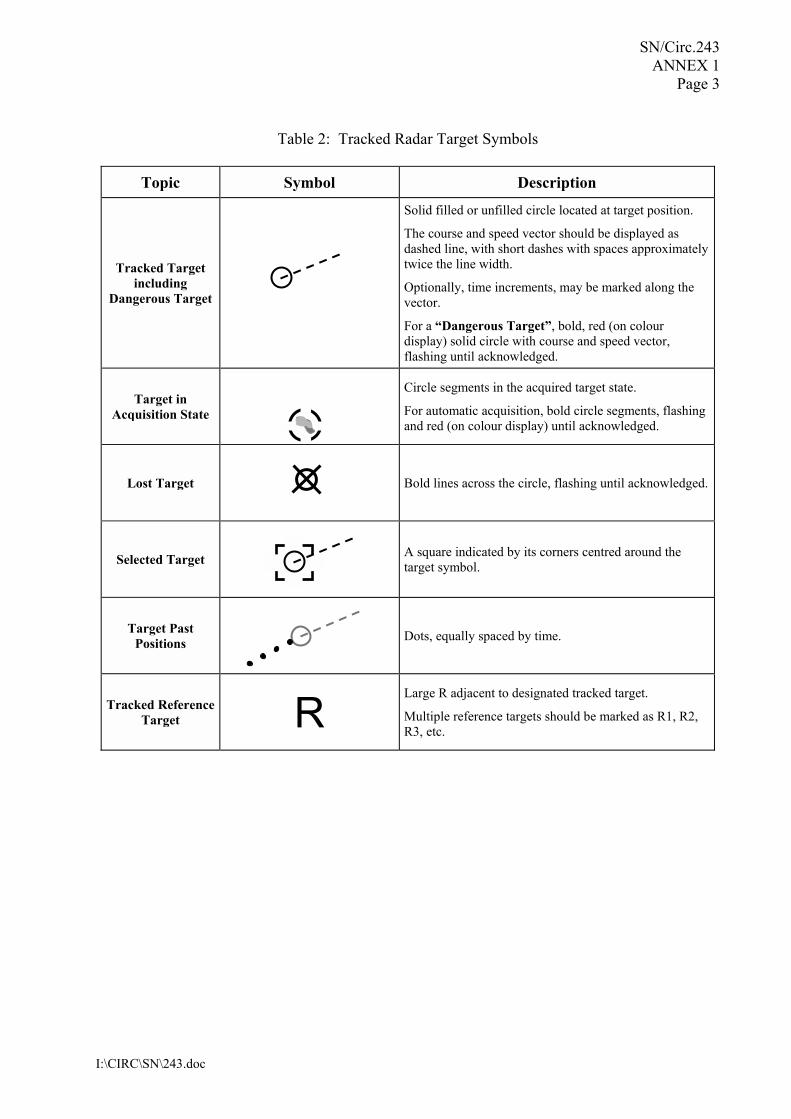
Table 2: Tracked Radar Target Symbols
Topic Symbol Description
Tracked Target including
Dangerous Target
Solid filled or unfilled circle located at target position.
The course and speed vector should be displayed as dashed line, with short dashes with spaces approximately twice the line width.
Optionally, time increments, may be marked along the vector.
For a �Dangerous Target�, bold, red (on colour display) solid circle with course and speed vector, flashing until acknowledged.
Target in Acquisition State
Circle segments in the acquired target state.
For automatic acquisition, bold circle segments, flashing and red (on colour display) until acknowledged.
Lost Target
Bold lines across the circle, flashing until acknowledged.
Selected Target
A square indicated by its corners centred around the target symbol.
Target Past Positions
Dots, equally spaced by time.
Tracked Reference Target R
Large R adjacent to designated tracked target.
Multiple reference targets should be marked as R1, R2, R3, etc.
SN/Circ.243 ANNEX 1 Page 4
I:\CIRC\SN\243.doc
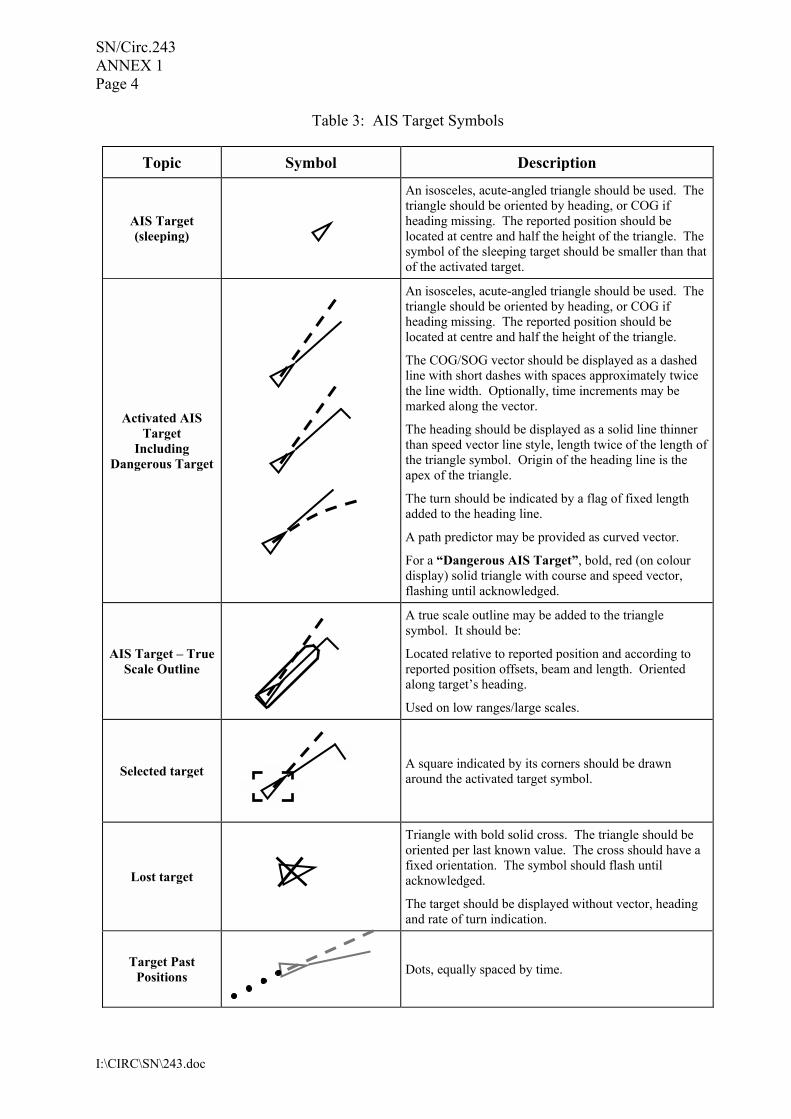
Table 3: AIS Target Symbols
Topic Symbol Description
AIS Target (sleeping)
An isosceles, acute-angled triangle should be used. The triangle should be oriented by heading, or COG if heading missing. The reported position should be located at centre and half the height of the triangle. The symbol of the sleeping target should be smaller than that of the activated target.
Activated AIS Target
Including Dangerous Target
An isosceles, acute-angled triangle should be used. The triangle should be oriented by heading, or COG if heading missing. The reported position should be located at centre and half the height of the triangle.
The COG/SOG vector should be displayed as a dashed line with short dashes with spaces approximately twice the line width. Optionally, time increments may be marked along the vector.
The heading should be displayed as a solid line thinner than speed vector line style, length twice of the length of the triangle symbol. Origin of the heading line is the apex of the triangle.
The turn should be indicated by a flag of fixed length added to the heading line.
A path predictor may be provided as curved vector.
For a �Dangerous AIS Target�, bold, red (on colour display) solid triangle with course and speed vector, flashing until acknowledged.
AIS Target � True Scale Outline
A true scale outline may be added to the triangle symbol. It should be:
Located relative to reported position and according to reported position offsets, beam and length. Oriented along target�s heading.
Used on low ranges/large scales.
Selected target
A square indicated by its corners should be drawn around the activated target symbol.
Lost target
Triangle with bold solid cross. The triangle should be oriented per last known value. The cross should have a fixed orientation. The symbol should flash until acknowledged.
The target should be displayed without vector, heading and rate of turn indication.
Target Past Positions
Dots, equally spaced by time.
SN/Circ.243 ANNEX 1
Page 5
I:\CIRC\SN\243.doc
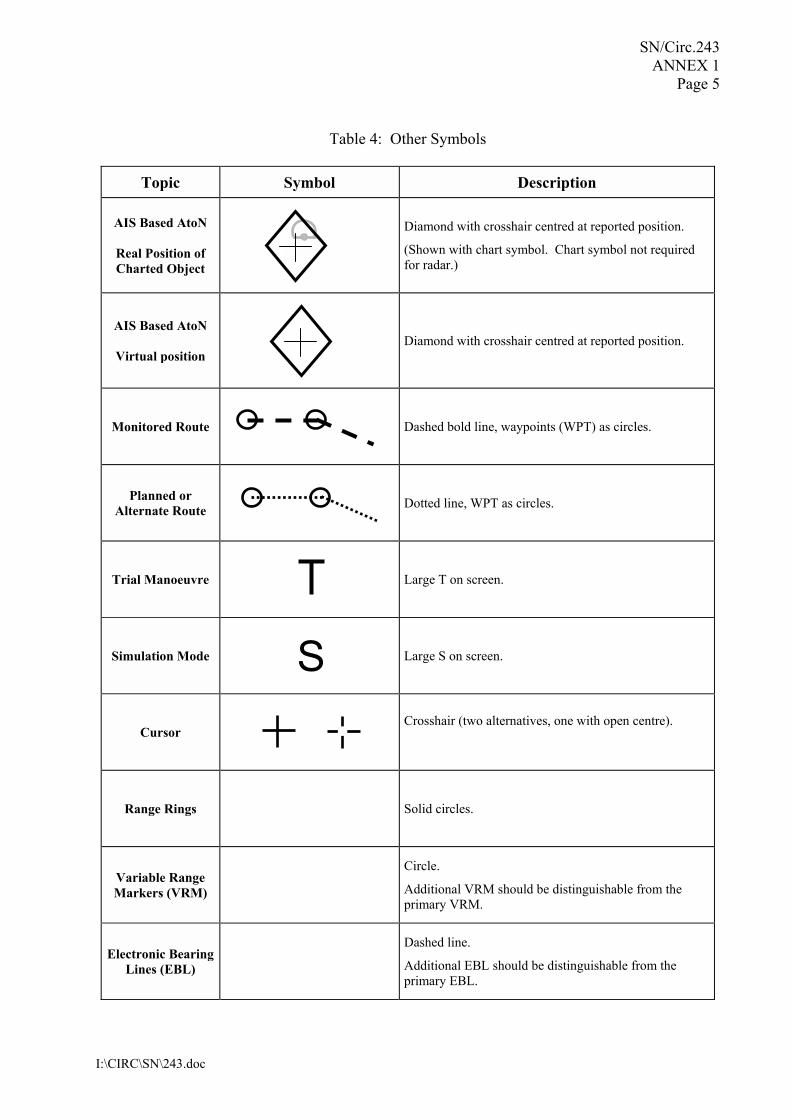
Table 4: Other Symbols
Topic Symbol Description
AIS Based AtoN
Real Position of Charted Object
Diamond with crosshair centred at reported position.
(Shown with chart symbol. Chart symbol not required for radar.)
AIS Based AtoN
Virtual position
Diamond with crosshair centred at reported position.
Monitored Route Dashed bold line, waypoints (WPT) as circles.
Planned or Alternate Route Dotted line, WPT as circles.
Trial Manoeuvre Large T on screen.
Simulation Mode S Large S on screen.
Cursor
Crosshair (two alternatives, one with open centre).
Range Rings Solid circles.
Variable Range Markers (VRM)
Circle.
Additional VRM should be distinguishable from the primary VRM.
Electronic Bearing Lines (EBL)
Dashed line.
Additional EBL should be distinguishable from the primary EBL.

SN/Circ.243 ANNEX 1 Page 6
I:\CIRC\SN\243.doc
Topic Symbol Description
Acquisition/ Activation Area
Solid line boundary for an area.
Event Mark
Rectangle with diagonal line, clarified by added text (e.g. �MOB� for man overboard cases).
***
SN/Circ.243
I:\CIRC\SN\243.doc
ANNEX 2
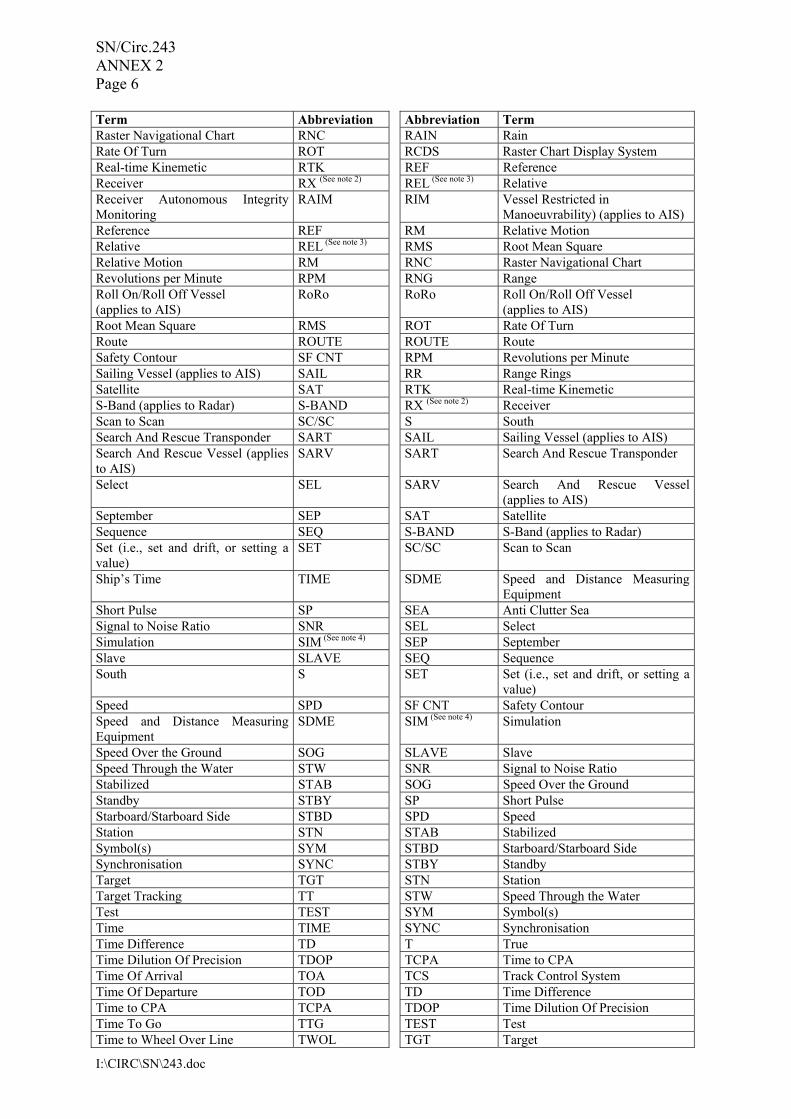
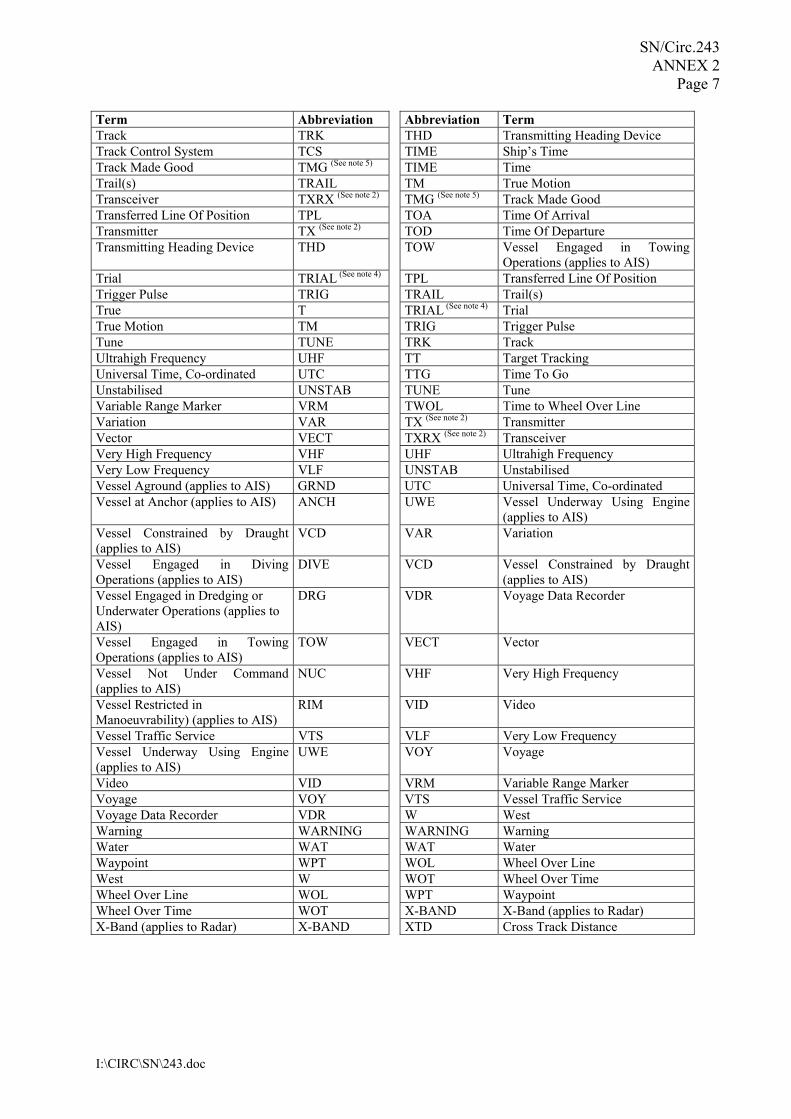
Guidelines for the Presentation of Navigation-related Terms and Abbreviations 1 Purpose The purpose of these guidelines is to provide guidance on the use of appropriate navigation-related terminology and abbreviations intended for presentation on shipborne navigational displays. These are based on terms and abbreviations used in existing navigation references. 2 Scope These guidelines are issued to ensure that the terms and abbreviations used for the display of navigation-related information on all shipborne navigation equipment and systems are consistent and uniform. 3 Application These guidelines apply to all shipborne navigational systems and equipment including, radar, ECDIS, AIS, INS and IBS. When navigation-related information is displayed as text, the standard terms or abbreviations listed in the Appendix should be used, instead of using terms and abbreviations which are currently contained in existing performance standards. Where a standard term and abbreviation is not available, another term or abbreviation may be used. This term or abbreviation should not conflict with the standard terms or abbreviations listed in the Appendix and provide a clear meaning. Standard marine terminology should be used for this purpose. When the meaning is not clear from its context, the term should not be abbreviated. Unless otherwise specified, standard terms should be shown in lower case while abbreviations should be presented using upper case.

SN/Circ.243 ANNEX 2 Page 2
I:\CIRC\SN\243.doc
APPENDIX
List of Standard Terms and Abbreviations
Term Abbreviation Abbreviation Term Acknowledge ACK ACK Acknowledge Acquire, Acquisition ACQ ACQ Acquire, Acquisition Acquisition Zone AZ ADJ Adjust, Adjustment Adjust, Adjustment ADJ AFC Automatic Frequency Control Aft AFT AFT Aft Alarm ALARM AGC Automatic Gain Control Altitude ALT AIS Automatic Identification System Amplitude Modulation AM ALARM Alarm Anchor Watch ANCH ALT Altitude Antenna ANT AM Amplitude Modulation Anti Clutter Rain RAIN ANCH Anchor Watch Anti Clutter Sea SEA ANCH Vessel at Anchor (applies to AIS) April APR ANT Antenna Audible AUD APR April August AUG AUD Audible Automatic AUTO AUG August Automatic Frequency Control AFC AUTO Automatic Automatic Gain Control AGC AUX Auxiliary System/Function Automatic Identification System AIS AVAIL Available Auxiliary System/Function AUX AZ Acquisition Zone Available AVAIL BITE Built in Test Equipment Background BKGND BKGND Background Bearing BRG BRG Bearing Bearing Waypoint To Waypoint BWW BRILL Brilliance Brilliance BRILL BWW Bearing Waypoint To Waypoint Built in Test Equipment BITE C Carried (e.g. carried EBL origin) Calibrate CAL C UP (See note 2) Course Up Cancel CNCL CAL Calibrate Carried (e.g. carried EBL origin) C CCRP Consistent Common Reference
Point Centre CENT CCRS Consistent Common Reference
System Change CHG CENT Centre Circular Polarised CP CHG Change Clear CLR CLR Clear Closest Point of Approach CPA CNCL Cancel Consistent Common Reference Point
CCRP COG Course Over the Ground
Consistent Common Reference System
CCRS CONT Contrast
Contrast CONT CORR Correction Correction CORR CP Circular Polarised Course CRS CPA Closest Point of Approach Course Over the Ground COG CRS Course Course Through the Water CTW CTS Course To Steer Course To Steer CTS CTW Course Through the Water Course Up C UP (See note 2) CURS Cursor Cross Track Distance XTD D Dropped
(e.g. dropped EBL origin) Cursor CURS DATE Date Dangerous Goods DG DAY/NT Day/Night Date DATE DEC December
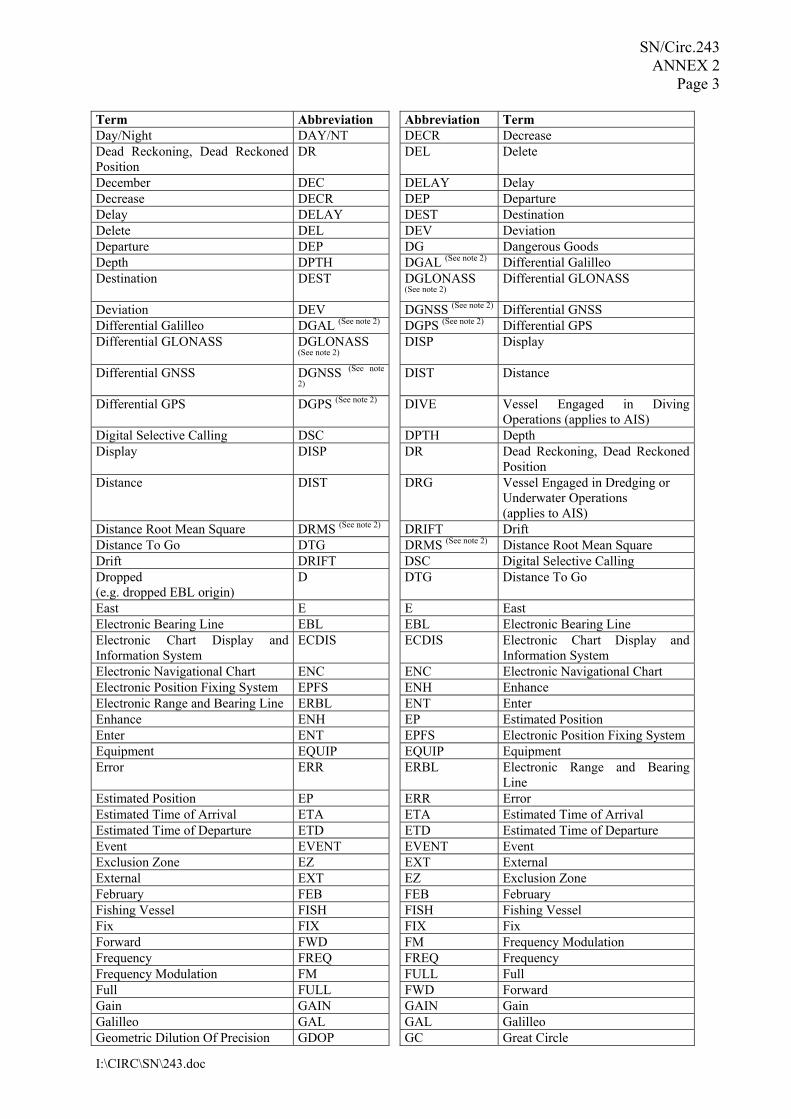
SN/Circ.243 ANNEX 2
Page 3
I:\CIRC\SN\243.doc
Term Abbreviation Abbreviation Term Day/Night DAY/NT DECR Decrease Dead Reckoning, Dead Reckoned Position
DR DEL Delete
December DEC DELAY Delay Decrease DECR DEP Departure Delay DELAY DEST Destination Delete DEL DEV Deviation Departure DEP DG Dangerous Goods Depth DPTH DGAL (See note 2) Differential Galilleo Destination DEST DGLONASS
(See note 2) Differential GLONASS
Deviation DEV DGNSS (See note 2) Differential GNSS Differential Galilleo DGAL (See note 2) DGPS (See note 2) Differential GPS Differential GLONASS DGLONASS
(See note 2) DISP Display
Differential GNSS DGNSS (See note
2) DIST Distance
Differential GPS DGPS (See note 2) DIVE Vessel Engaged in Diving Operations (applies to AIS)
Digital Selective Calling DSC DPTH Depth Display DISP DR Dead Reckoning, Dead Reckoned
Position Distance DIST DRG Vessel Engaged in Dredging or
Underwater Operations (applies to AIS)
Distance Root Mean Square DRMS (See note 2) DRIFT Drift Distance To Go DTG DRMS (See note 2) Distance Root Mean Square Drift DRIFT DSC Digital Selective Calling Dropped (e.g. dropped EBL origin)
D DTG Distance To Go
East E E East Electronic Bearing Line EBL EBL Electronic Bearing Line Electronic Chart Display and Information System
ECDIS ECDIS Electronic Chart Display and Information System
Electronic Navigational Chart ENC ENC Electronic Navigational Chart Electronic Position Fixing System EPFS ENH Enhance Electronic Range and Bearing Line ERBL ENT Enter Enhance ENH EP Estimated Position Enter ENT EPFS Electronic Position Fixing System Equipment EQUIP EQUIP Equipment Error ERR ERBL Electronic Range and Bearing
Line Estimated Position EP ERR Error Estimated Time of Arrival ETA ETA Estimated Time of Arrival Estimated Time of Departure ETD ETD Estimated Time of Departure Event EVENT EVENT Event Exclusion Zone EZ EXT External External EXT EZ Exclusion Zone February FEB FEB February Fishing Vessel FISH FISH Fishing Vessel Fix FIX FIX Fix Forward FWD FM Frequency Modulation Frequency FREQ FREQ Frequency Frequency Modulation FM FULL Full Full FULL FWD Forward Gain GAIN GAIN Gain Galilleo GAL GAL Galilleo Geometric Dilution Of Precision GDOP GC Great Circle
SN/Circ.243 ANNEX 2 Page 4
I:\CIRC\SN\243.doc
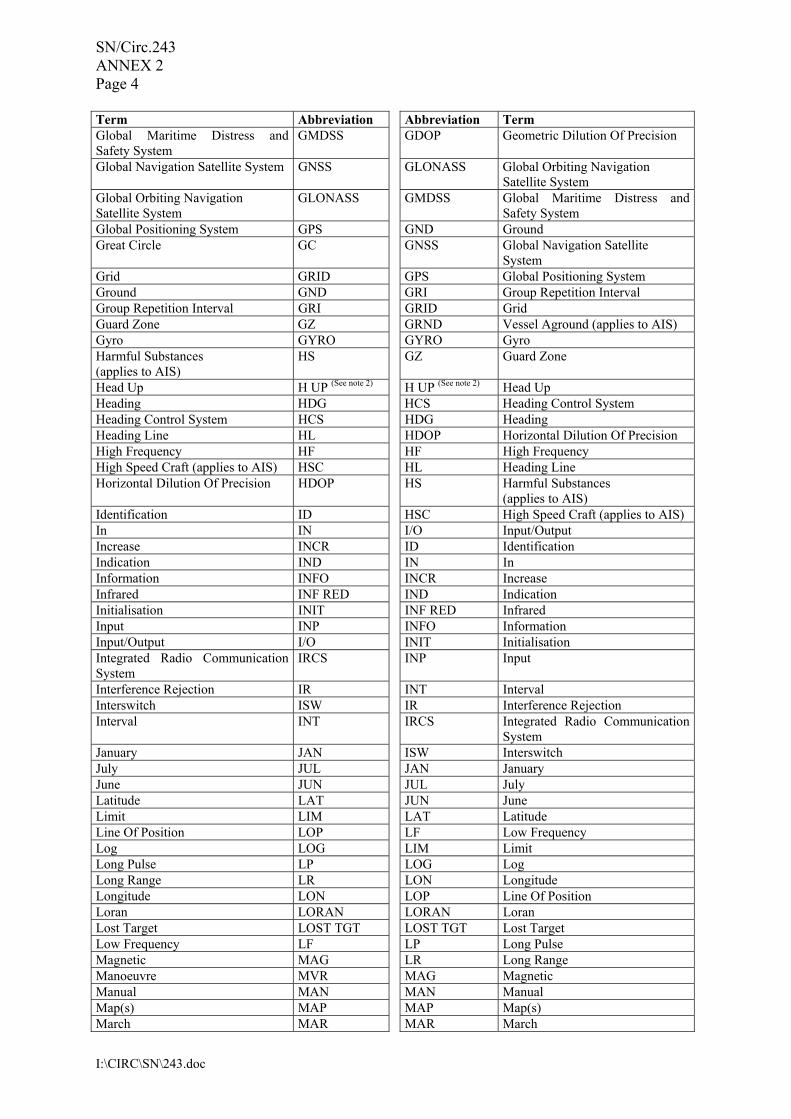
Term Abbreviation Abbreviation Term Global Maritime Distress and Safety System
GMDSS GDOP Geometric Dilution Of Precision
Global Navigation Satellite System GNSS GLONASS Global Orbiting Navigation Satellite System
Global Orbiting Navigation Satellite System
GLONASS GMDSS Global Maritime Distress and Safety System
Global Positioning System GPS GND Ground Great Circle GC GNSS Global Navigation Satellite
System Grid GRID GPS Global Positioning System Ground GND GRI Group Repetition Interval Group Repetition Interval GRI GRID Grid Guard Zone GZ GRND Vessel Aground (applies to AIS) Gyro GYRO GYRO Gyro Harmful Substances (applies to AIS)
HS GZ Guard Zone
Head Up H UP (See note 2) H UP (See note 2) Head Up Heading HDG HCS Heading Control System Heading Control System HCS HDG Heading Heading Line HL HDOP Horizontal Dilution Of Precision High Frequency HF HF High Frequency High Speed Craft (applies to AIS) HSC HL Heading Line Horizontal Dilution Of Precision HDOP HS Harmful Substances
(applies to AIS) Identification ID HSC High Speed Craft (applies to AIS) In IN I/O Input/Output Increase INCR ID Identification Indication IND IN In Information INFO INCR Increase Infrared INF RED IND Indication Initialisation INIT INF RED Infrared Input INP INFO Information Input/Output I/O INIT Initialisation Integrated Radio Communication System
IRCS INP Input
Interference Rejection IR INT Interval Interswitch ISW IR Interference Rejection Interval INT IRCS Integrated Radio Communication
System January JAN ISW Interswitch July JUL JAN January June JUN JUL July Latitude LAT JUN June Limit LIM LAT Latitude Line Of Position LOP LF Low Frequency Log LOG LIM Limit Long Pulse LP LOG Log Long Range LR LON Longitude Longitude LON LOP Line Of Position Loran LORAN LORAN Loran Lost Target LOST TGT LOST TGT Lost Target Low Frequency LF LP Long Pulse Magnetic MAG LR Long Range Manoeuvre MVR MAG Magnetic Manual MAN MAN Manual Map(s) MAP MAP Map(s) March MAR MAR March
SN/Circ.243 ANNEX 2
Page 5
I:\CIRC\SN\243.doc
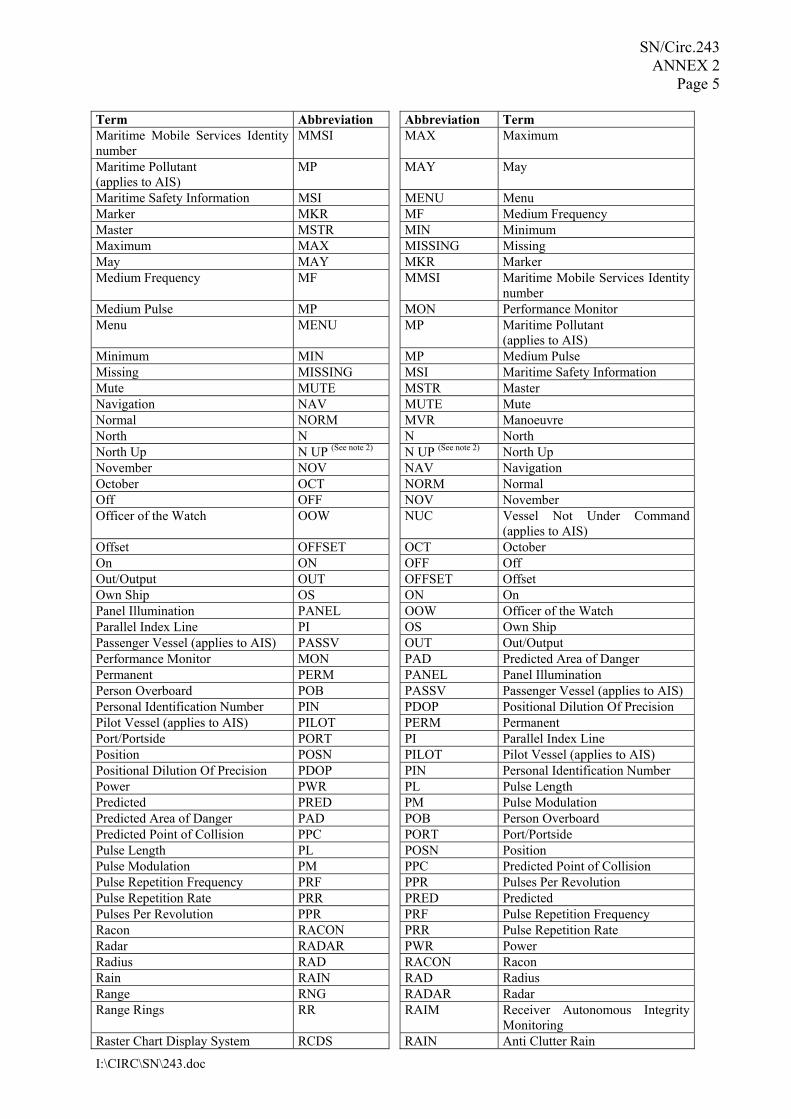
Term Abbreviation Abbreviation Term Maritime Mobile Services Identity number
MMSI MAX Maximum
Maritime Pollutant (applies to AIS)
MP MAY May
Maritime Safety Information MSI MENU Menu Marker MKR MF Medium Frequency Master MSTR MIN Minimum Maximum MAX MISSING Missing May MAY MKR Marker Medium Frequency MF MMSI Maritime Mobile Services Identity
number Medium Pulse MP MON Performance Monitor Menu MENU MP Maritime Pollutant
(applies to AIS) Minimum MIN MP Medium Pulse Missing MISSING MSI Maritime Safety Information Mute MUTE MSTR Master Navigation NAV MUTE Mute Normal NORM MVR Manoeuvre North N N North North Up N UP (See note 2) N UP (See note 2) North Up November NOV NAV Navigation October OCT NORM Normal Off OFF NOV November Officer of the Watch OOW NUC Vessel Not Under Command
(applies to AIS) Offset OFFSET OCT October On ON OFF Off Out/Output OUT OFFSET Offset Own Ship OS ON On Panel Illumination PANEL OOW Officer of the Watch Parallel Index Line PI OS Own Ship Passenger Vessel (applies to AIS) PASSV OUT Out/Output Performance Monitor MON PAD Predicted Area of Danger Permanent PERM PANEL Panel Illumination Person Overboard POB PASSV Passenger Vessel (applies to AIS) Personal Identification Number PIN PDOP Positional Dilution Of Precision Pilot Vessel (applies to AIS) PILOT PERM Permanent Port/Portside PORT PI Parallel Index Line Position POSN PILOT Pilot Vessel (applies to AIS) Positional Dilution Of Precision PDOP PIN Personal Identification Number Power PWR PL Pulse Length Predicted PRED PM Pulse Modulation Predicted Area of Danger PAD POB Person Overboard Predicted Point of Collision PPC PORT Port/Portside Pulse Length PL POSN Position Pulse Modulation PM PPC Predicted Point of Collision Pulse Repetition Frequency PRF PPR Pulses Per Revolution Pulse Repetition Rate PRR PRED Predicted Pulses Per Revolution PPR PRF Pulse Repetition Frequency Racon RACON PRR Pulse Repetition Rate Radar RADAR PWR Power Radius RAD RACON Racon Rain RAIN RAD Radius Range RNG RADAR Radar Range Rings RR RAIM Receiver Autonomous Integrity
Monitoring Raster Chart Display System RCDS RAIN Anti Clutter Rain
SN/Circ.243 ANNEX 2 Page 6
I:\CIRC\SN\243.doc
Term Abbreviation Abbreviation Term Raster Navigational Chart RNC RAIN Rain Rate Of Turn ROT RCDS Raster Chart Display System Real-time Kinemetic RTK REF Reference Receiver RX (See note 2) REL (See note 3) Relative Receiver Autonomous Integrity Monitoring
RAIM RIM Vessel Restricted in Manoeuvrability) (applies to AIS)
Reference REF RM Relative Motion Relative REL (See note 3) RMS Root Mean Square Relative Motion RM RNC Raster Navigational Chart Revolutions per Minute RPM RNG Range Roll On/Roll Off Vessel (applies to AIS)
RoRo RoRo Roll On/Roll Off Vessel (applies to AIS)
Root Mean Square RMS ROT Rate Of Turn Route ROUTE ROUTE Route Safety Contour SF CNT RPM Revolutions per Minute Sailing Vessel (applies to AIS) SAIL RR Range Rings Satellite SAT RTK Real-time Kinemetic S-Band (applies to Radar) S-BAND RX (See note 2) Receiver Scan to Scan SC/SC S South Search And Rescue Transponder SART SAIL Sailing Vessel (applies to AIS) Search And Rescue Vessel (applies to AIS)
SARV SART Search And Rescue Transponder
Select SEL SARV Search And Rescue Vessel (applies to AIS)
September SEP SAT Satellite Sequence SEQ S-BAND S-Band (applies to Radar) Set (i.e., set and drift, or setting a value)
SET SC/SC Scan to Scan
Ship�s Time TIME SDME Speed and Distance Measuring Equipment
Short Pulse SP SEA Anti Clutter Sea Signal to Noise Ratio SNR SEL Select Simulation SIM (See note 4) SEP September Slave SLAVE SEQ Sequence South S SET Set (i.e., set and drift, or setting a
value) Speed SPD SF CNT Safety Contour Speed and Distance Measuring Equipment
SDME SIM (See note 4) Simulation
Speed Over the Ground SOG SLAVE Slave Speed Through the Water STW SNR Signal to Noise Ratio Stabilized STAB SOG Speed Over the Ground Standby STBY SP Short Pulse Starboard/Starboard Side STBD SPD Speed Station STN STAB Stabilized Symbol(s) SYM STBD Starboard/Starboard Side Synchronisation SYNC STBY Standby Target TGT STN Station Target Tracking TT STW Speed Through the Water Test TEST SYM Symbol(s) Time TIME SYNC Synchronisation Time Difference TD T True Time Dilution Of Precision TDOP TCPA Time to CPA Time Of Arrival TOA TCS Track Control System Time Of Departure TOD TD Time Difference Time to CPA TCPA TDOP Time Dilution Of Precision Time To Go TTG TEST Test Time to Wheel Over Line TWOL TGT Target
SN/Circ.243 ANNEX 2
Page 7
I:\CIRC\SN\243.doc
Term Abbreviation Abbreviation Term Track TRK THD Transmitting Heading Device Track Control System TCS TIME Ship�s Time Track Made Good TMG (See note 5) TIME Time Trail(s) TRAIL TM True Motion Transceiver TXRX (See note 2) TMG (See note 5) Track Made Good Transferred Line Of Position TPL TOA Time Of Arrival Transmitter TX (See note 2) TOD Time Of Departure Transmitting Heading Device THD TOW Vessel Engaged in Towing
Operations (applies to AIS) Trial TRIAL (See note 4) TPL Transferred Line Of Position Trigger Pulse TRIG TRAIL Trail(s) True T TRIAL (See note 4) Trial True Motion TM TRIG Trigger Pulse Tune TUNE TRK Track Ultrahigh Frequency UHF TT Target Tracking Universal Time, Co-ordinated UTC TTG Time To Go Unstabilised UNSTAB TUNE Tune Variable Range Marker VRM TWOL Time to Wheel Over Line Variation VAR TX (See note 2) Transmitter Vector VECT TXRX (See note 2) Transceiver Very High Frequency VHF UHF Ultrahigh Frequency Very Low Frequency VLF UNSTAB Unstabilised Vessel Aground (applies to AIS) GRND UTC Universal Time, Co-ordinated Vessel at Anchor (applies to AIS) ANCH UWE Vessel Underway Using Engine
(applies to AIS) Vessel Constrained by Draught (applies to AIS)
VCD VAR Variation
Vessel Engaged in Diving Operations (applies to AIS)
DIVE VCD Vessel Constrained by Draught (applies to AIS)
Vessel Engaged in Dredging or Underwater Operations (applies to AIS)
DRG VDR Voyage Data Recorder
Vessel Engaged in Towing Operations (applies to AIS)
TOW VECT Vector
Vessel Not Under Command (applies to AIS)
NUC VHF Very High Frequency
Vessel Restricted in Manoeuvrability) (applies to AIS)
RIM VID Video
Vessel Traffic Service VTS VLF Very Low Frequency Vessel Underway Using Engine (applies to AIS)
UWE VOY Voyage
Video VID VRM Variable Range Marker Voyage VOY VTS Vessel Traffic Service Voyage Data Recorder VDR W West Warning WARNING WARNING Warning Water WAT WAT Water Waypoint WPT WOL Wheel Over Line West W WOT Wheel Over Time Wheel Over Line WOL WPT Waypoint Wheel Over Time WOT X-BAND X-Band (applies to Radar) X-Band (applies to Radar) X-BAND XTD Cross Track Distance
SN/Circ.243 ANNEX 2 Page 8
I:\CIRC\SN\243.doc
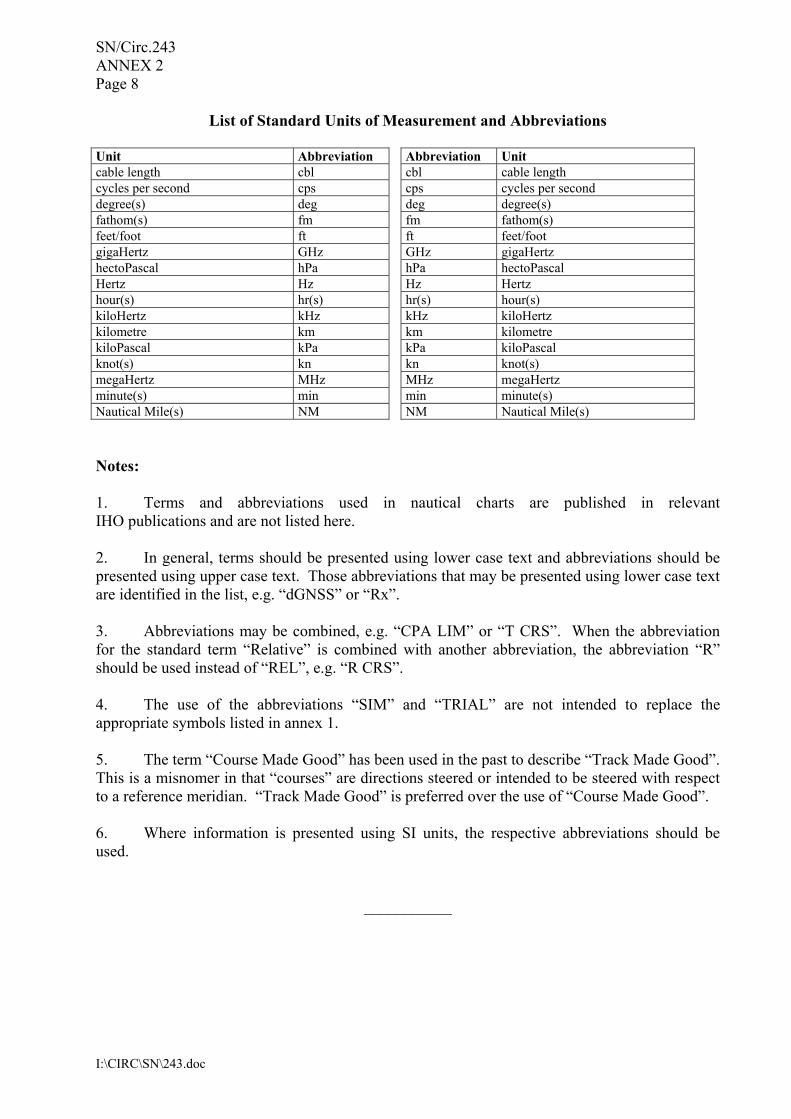
List of Standard Units of Measurement and Abbreviations
Unit Abbreviation Abbreviation Unit cable length cbl cbl cable length cycles per second cps cps cycles per second degree(s) deg deg degree(s) fathom(s) fm fm fathom(s) feet/foot ft ft feet/foot gigaHertz GHz GHz gigaHertz hectoPascal hPa hPa hectoPascal Hertz Hz Hz Hertz hour(s) hr(s) hr(s) hour(s) kiloHertz kHz kHz kiloHertz kilometre km km kilometre kiloPascal kPa kPa kiloPascal knot(s) kn kn knot(s) megaHertz MHz MHz megaHertz minute(s) min min minute(s) Nautical Mile(s) NM NM Nautical Mile(s) Notes: 1. Terms and abbreviations used in nautical charts are published in relevant IHO publications and are not listed here. 2. In general, terms should be presented using lower case text and abbreviations should be presented using upper case text. Those abbreviations that may be presented using lower case text are identified in the list, e.g. �dGNSS� or �Rx�. 3. Abbreviations may be combined, e.g. �CPA LIM� or �T CRS�. When the abbreviation for the standard term �Relative� is combined with another abbreviation, the abbreviation �R� should be used instead of �REL�, e.g. �R CRS�. 4. The use of the abbreviations �SIM� and �TRIAL� are not intended to replace the appropriate symbols listed in annex 1. 5. The term �Course Made Good� has been used in the past to describe �Track Made Good�. This is a misnomer in that �courses� are directions steered or intended to be steered with respect to a reference meridian. �Track Made Good� is preferred over the use of �Course Made Good�. 6. Where information is presented using SI units, the respective abbreviations should be used.
___________

I:\CIRC\SN\01\243-Add-1.doc
INTERNATIONAL MARITIME ORGANIZATION 4 ALBERT EMBANKMENT LONDON SE1 7SR Telephone: 020 7735 7611 Fax: 020 7587 3210
IMO
E
Ref. T2-OSS/2.7.1 SN.1/Circ.243/Add.1 10 December 2008
AMENDMENT TO GUIDELINES FOR THE PRESENTATION OF NAVIGATION-RELATED SYMBOLS, TERMS AND ABBREVIATIONS
1 The Sub-Committee on Safety of Navigation (NAV), at its fifty-fourth session (30 June to 4 July 2008), agreed on an addition to table 3 of the appendix of annex 1 of the Guidelines for the presentation of navigation-related symbols, terms and abbreviations (SN.1/Circ.243). 2 This amendment introduces a new symbol for the presentation of an AIS Search and Rescue Transmitter (AIS-SART) as described in the performance standards given in resolution MSC.246(83). 3 The Maritime Safety Committee, at its eighty-fifth session (26 November to 5 December 2008), concurred with the Sub-Committee’s views and approved the amendment to the Guidelines for the presentation of navigation-related symbols, terms and abbreviations, as set out at annex. 4 Member Governments are invited to bring the annexed addition to the attention of all concerned.
***
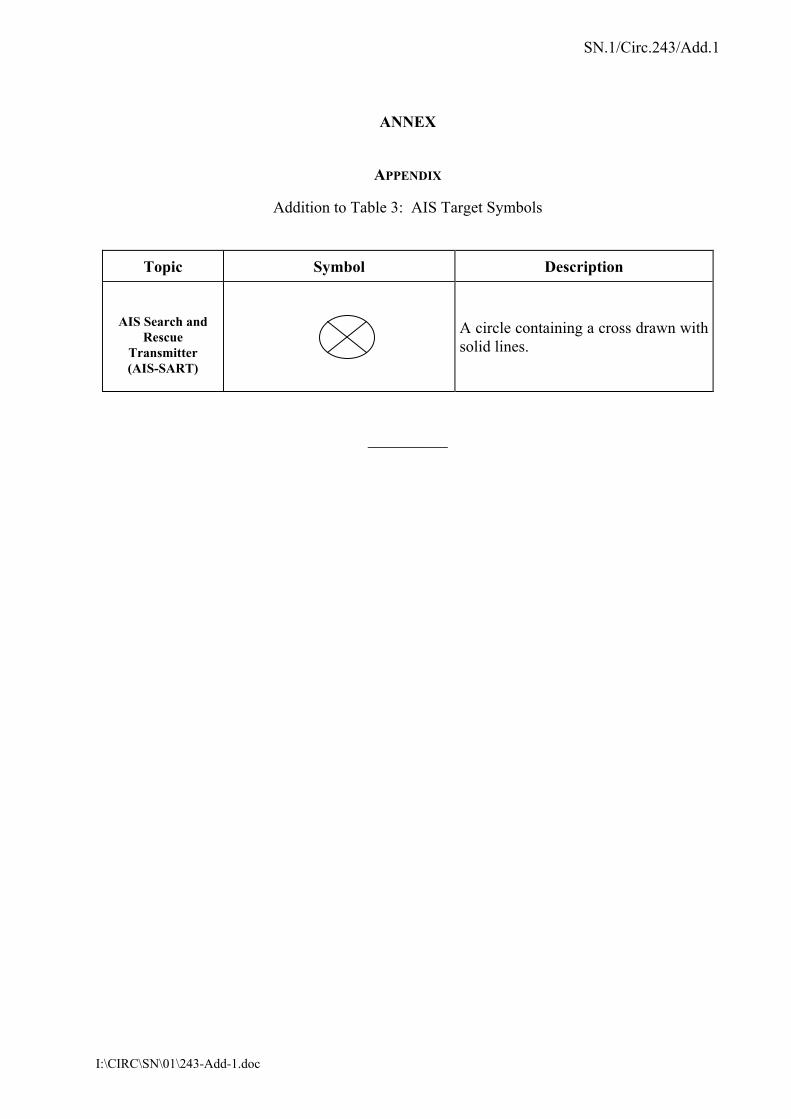
SN.1/Circ.243/Add.1
I:\CIRC\SN\01\243-Add-1.doc
ANNEX
APPENDIX
Addition to Table 3: AIS Target Symbols
Topic Symbol Description
AIS Search and Rescue
Transmitter (AIS-SART)
A circle containing a cross drawn with solid lines.
__________

I:\CIRC\MSC\982.doc
INTERNATIONAL MARITIME ORGANIZATION 4 ALBERT EMBANKMENT LONDON SE1 7SR Telephone: 020-7735 7611 Fax: 020-7587 3210 Telex: 23588 IMOLDN G
IMO
E
Ref. T2/2.06 MSC/Circ.982
20 December 2000
GUIDELINES ON ERGONOMIC CRITERIA FOR BRIDGE EQUIPMENT AND LAYOUT
1 The Maritime Safety Committee, at its seventy-third session (27 November to 6 December 2000), adopted the annexed Guidelines on Ergonomic Criteria for Bridge Equipment and Layout which have been developed to assist designers in realising a sufficient ergonomic design of the bridge, with the objective of improving the reliability and efficiency of navigation. 2 These Guidelines have been prepared to support provisions of the revised regulation V/15 of the SOLAS Convention – Principles relating to bridge design, design and arrangement of navigational systems and equipment and bridge procedures, which is expected to enter into force on 1 July 2002. 3 Member Governments are invited to bring these Guidelines to the attention of all parties concerned.
***


MSC/Circ.982
I:\CIRC\MSC\982.doc
ANNEX
GUIDELINES ON ERGONOMIC CRITERIA FOR BRIDGE EQUIPMENT AND LAYOUT
Contents
1 Scope
2 Purpose
3 Application
4 Description of the Workstations on the Bridge
5 Ergonomic Requirements
5.1 Bridge Layout
5.1.1 Sight
5.1.1.1 Field of Vision
5.1.1.2 Windows
5.1.2 Arrangement
5.1.3 Accessibility and Movement
5.2 Work Environment
5.2.1 Climate
5.2.2 Ventilation and Air-conditioning
5.2.3 Noise and Acoustics
5.2.4 Vibration
5.2.5 Illumination and Lighting
5.2.6 Occupational Safety
5.3 Workstation Layout
5.3.1 Consoles
5.3.2 Devices, Control and Display Integration
5.3.3 Arrangement and Grouping of Controls
5.3.4 Display Arrangement
5.3.5 Labelling of Controls and Displays
5.3.6 Lighting of Devices

MSC/Circ.982 ANNEX Page 2
I:\CIRC\MSC\982.doc
5.4 Alarms
5.4.1 Alarm Management
5.4.2 Visual Alarms
5.4.3 Audible Alarms
5.5 Information Display
5.5.1 General Display Requirements
5.5.2 Arrangement of Visual Information
5.5.3 Visual Display Units (VDU)
5.5.4 Coding and Highlighting
5.5.5 Display Elements
5.6 Interactive Control
5.6.1 General User Input Guidelines
5.6.2 User Input Formats
5.6.3 System Operational Information
5.6.4 System Response
5.6.5 Prevention/Detection/Correction of Errors
APPENDIX 1: Definitions
APPENDIX 2: Recommended Equipment of Workstations
APPENDIX 3: Existing international standards dealing with Ergonomic Criteria for Bridge
Equipment and Layout

MSC/Circ.982 ANNEX
Page 3
I:\CIRC\MSC\982.doc
1 Scope The Guidelines are developed to realize a successful ergonomic design of the bridge and the equipment on the bridge, which will improve the reliability and efficiency of navigation. These Guidelines therefore contain ergonomic requirements as well as a functionally oriented bridge layout to support watch-keeping personnel in their tasks by a user-centred design of the bridge equipment and layout. 2 Purpose The purpose of these Guidelines is to provide ergonomic requirements for the bridge equipment and layout to render assistance to enable consistent, reliable and efficient bridge operation. 3 Application These Guidelines are intended to apply to new ships. 4 Description of the Workstations on the Bridge Workstation for navigating and manoeuvring: Main workstation for ship's handling conceived for working in seated/standing position with optimum visibility and integrated presentation of information and operating equipment to control and consider ship's movement. It should be possible from this place to operate the ship safely, in particular when a fast sequence of actions is required.
Workstation for monitoring: Workstation from which operating equipment and surrounding environment can be permanently observed in seated / standing position; when several crew members are working on the bridge it serves for relieving the navigator at the workstation for navigating and manoeuvring and/or for carrying out control and advisory functions by master and/or pilot.
Workstation for manual steering (Helmsman's workstation): Workstation from which the ship can be steered by a helmsman as far as legally or otherwise required or deemed to be necessary, preferably conceived for working in seated position.
Workstation for docking (bridge wing): The workstation for docking operations on the bridge wing should enable the navigator together with a pilot (when present) to observe all relevant external and internal information and control the manoeuvring of the ship.
Workstation for planning and documentation: Workstation at which ship’s operations are planned (e.g. route planning, deck log). Fixing and documenting all facts of ship's operation.
Workstation for safety: Workstation at which monitoring displays and operating elements or systems serving safety are co-located.
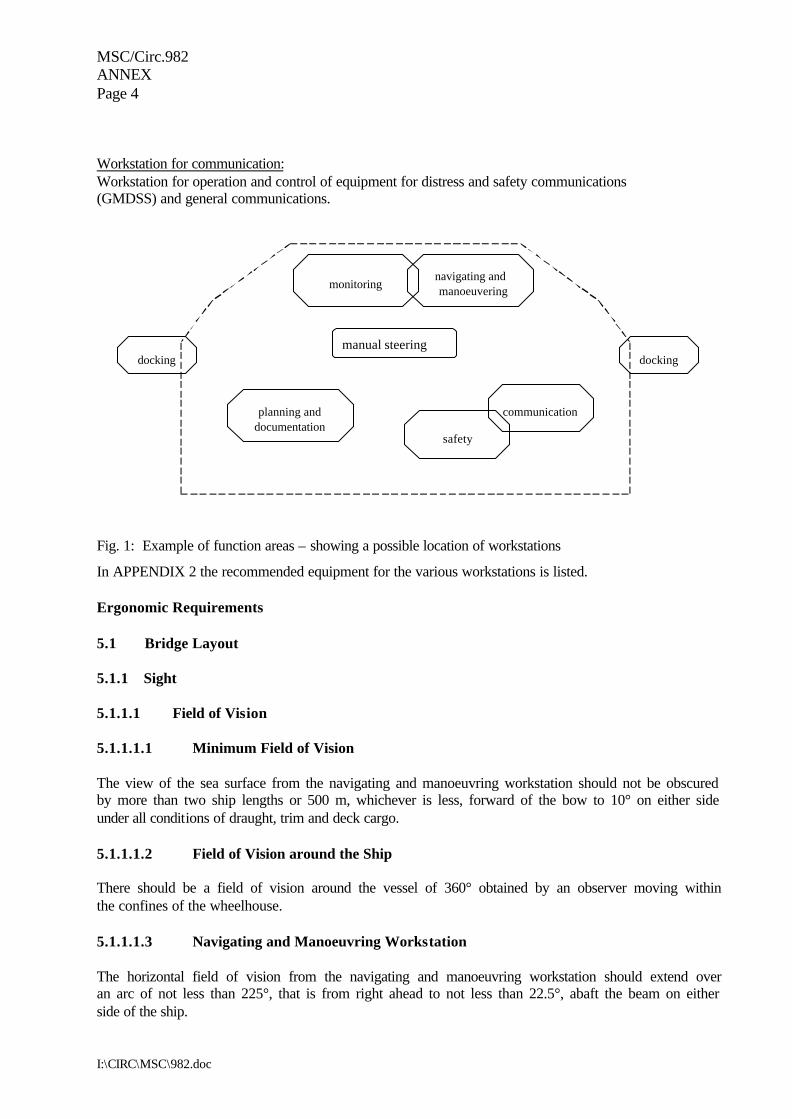
MSC/Circ.982 ANNEX Page 4
I:\CIRC\MSC\982.doc
Workstation for communication: Workstation for operation and control of equipment for distress and safety communications (GMDSS) and general communications.
planning anddocumentation
communication
dockingdocking
navigating andmanoeuveringmonitoring
safety
manual steering
Fig. 1: Example of function areas – showing a possible location of workstations
In APPENDIX 2 the recommended equipment for the various workstations is listed. Ergonomic Requirements 5.1 Bridge Layout 5.1.1 Sight 5.1.1.1 Field of Vision 5.1.1.1.1 Minimum Field of Vision The view of the sea surface from the navigating and manoeuvring workstation should not be obscured by more than two ship lengths or 500 m, whichever is less, forward of the bow to 10° on either side under all conditions of draught, trim and deck cargo. 5.1.1.1.2 Field of Vision around the Ship There should be a field of vision around the vessel of 360° obtained by an observer moving within the confines of the wheelhouse. 5.1.1.1.3 Navigating and Manoeuvring Workstation The horizontal field of vision from the navigating and manoeuvring workstation should extend over an arc of not less than 225°, that is from right ahead to not less than 22.5°, abaft the beam on either side of the ship.

MSC/Circ.982 ANNEX
Page 5
I:\CIRC\MSC\982.doc
22,5°
5.1.1.1.4 Monitoring Workstation From the monitoring workstation, the field of vision should extend at least over an arc from 90° on the port bow, through forward, to 22.5° abaft the beam on starboard.
22,5°
5.1.1.1.5 Bridge Wing From each bridge wing the horizontal field of vision should extend over an arc at least 225°, that is at least 45° on the opposite bow through right ahead and then from right ahead to right astern through 180° on the same side of the ship.
45°
45°

MSC/Circ.982 ANNEX Page 6
I:\CIRC\MSC\982.doc
5.1.1.1.6 Main Steering Position From the main steering position (workstation for manual steering) the horizontal field of vision should extend over an arc from right ahead to at least 60° on each side of the ship.
60°
60°
5.1.1.1.7 Blind Sectors The safe look-out from the navigating and manoeuvring workstation should not be influenced by blind sectors. No blind sector caused by cargo, cargo gear or other obstructions outside of the wheelhouse forward of the beam which obstructs the view of the sea surface as seen from the navigating and manoeuvring workstation, should exceed 10°. The total arc of blind sectors should not exceed 20°. The clear sector between two blind sectors should be at least 5°. Over an arc from right ahead to at least 10° on each side, each individual blind sector should not exceed 5°. 5.1.1.1.8 View of the Ship's Side The ship’s side should be visible from the bridge wing. Bridge wings should be provided out to the maximum beam of the ship. The view over the ship’s side should not be obstructed.
5.1.1.2 Windows
5.1.1.2.1 Lower Edge of the Front Window
The height of the lower edge of the front windows should allow a forward view over the bow for a person in a sitting position at the workstation for navigating and manoeuvring and the workstation for monitoring.
Within the required field of vision the height of the lower edge of the windows above the bridge deck should be kept as low as possible. In no case should the lower edge present an obstruction to the forward view as described in 5.1.1.1.
5.1.1.2.2 Upper Edge of the Front Window
The upper edge of the front windows should allow a forward view of the horizon for a person in a standing position with an eye height of 1.800 mm above the bridge deck at the navigating and manoeuvring workstation, when the ship is pitching in heavy seas. If 1.800 mm eye height is unreasonable and impractical, the eye height may be reduced, but not less than 1.600 mm.

MSC/Circ.982 ANNEX
Page 7
I:\CIRC\MSC\982.doc
5.1.1.2.3 Framing Between Windows
Framing between windows should be kept to a minimum and not be installed immediately forward of any workstation, or the centre-line. If stiffeners between windows are to be covered, this should not cause further obstructions of the field of view from any position inside the wheelhouse.
5.1.1.2.4 Front Window Inclination
To help avoid reflections, the bridge front windows should be inclined from the vertical plane top out, at an angle of not less than 10° and not more than 25°.
5.1.1.2.5 Rear and Side Window Inclination
To help avoid reflections, rear and side windows should be inclined from the vertical plane top out, at an angle of not less than 10° and not more than 25°. Exceptions can be made for windows in bridge wing doors.
5.1.1.2.6 Removable Sunscreens
To ensure a clear view and to avoid reflections in bright sunshine, sunscreens with minimum colour distortion should be provided at all windows. Such screens should be readily removable and not permanently installed.
5.1.1.2.7 Glass Characteristics
Polarized and tinted windows should not be fitted.
5.1.1.2.8 Clear View
A clear view through at least two of the bridge windows and, depending on the bridge configuration, an additional number of windows with a clear view should be provided at all times, regardless of the weather conditions.
5.1.2 Arrangement
5.1.2.1 Wheelhouse Dimensions
The clear ceiling height in the wheelhouse should be designed with regard to the installation of overhead panels and devices. The clear height between the bridge deck surface covering and the underside of the deck head beams should be at least 2.25 m. The lower edge of deckhead mounted equipment should be at least 2.1 m above the deck in open areas, passageways and at standing workstations.
5.1.2.2 View of the area in front of the bridge superstructure
It should be possible to watch the area in front of the bridge superstructure from the wheelhouse.
5.1.2.2.1 Position close to the Forward Centre Window
A position should be provided close to the forward centre window.
If the view in the centre-line is obstructed by large masts, cranes, etc., two additional positions giving a clear view ahead should be provided, one on the port side and one on the starboard side of the centre-line, no more than 5 m apart.

MSC/Circ.982 ANNEX Page 8
I:\CIRC\MSC\982.doc
5.1.2.2.2 Access to Front Window
A second close approach access besides the position should be possible or the width of the position should be sufficient to accommodate two persons.
5.1.2.3 Position of the Workstation for Navigating and Manoeuvring
The workstation for navigating and manoeuvring should be laid out if practicable, at the starboard side close to the centre-line.
5.1.2.4 Position of the Workstation for Manual Steering
The workstation for manual steering should preferably be located on the ship’s centre-line. If the view ahead is obstructed by large masts, cranes, etc., the steering station should be located a distance to starboard of the centre-line, sufficient to obtain a clear view ahead. If the workstation for manual steering is located off the centre-line, special steering references for use by day and night should be provided, e.g. sighting marks forward.
5.1.2.5 Position of the Workstation for Monitoring
The workstation for monitoring should be laid out if practicable, at the port side close to the centre-line.
5.1.2.6 Bridge Wing Communication
An internal communication system between the workstation for docking and the workstation for navigating and manoeuvring should be provided when the distance between the workstations is greater than 10 m. An internal communication system should always be provided between the workstation for navigating and manoeuvring and open bridge wings. Where workstations are widely spread, internal communication systems should be provided so that unhampered communications can be achieved under all operating conditions. It is important that all order/action communication systems be two-way.
5.1.2.7 Doors
All wheelhouse doors should be operable with one hand. Bridge wing doors should not be self-closing. Means should be provided to hold bridge wing doors open.
5.1.2.8 Portable Items
Portable items, such as safety equipment, tools, lights, pencils, should be stored at appropriate places, specially designed wherever necessary.
5.1.3 Accessibility and Movement
5.1.3.1 Clear Route
A clear route across the wheelhouse from bridge wing to bridge wing should be provided. The width of the passageway should be at least 1 200 mm.
5.1.3.2 Adjacent Workstation Distances
The distance between adjacent workstations should be sufficient to allow unobstructed passage to persons not working at the stations.
The free passage in passageways between different workstation areas should be at least 700 mm. The workstation operating area should be part of the workstation not of the passageway.

MSC/Circ.982 ANNEX
Page 9
I:\CIRC\MSC\982.doc
5.1.3.3 Passageway Dimensions
The distance from the bridge front bulkhead, or from any consoles or installations placed against the front bulkhead, to any consoles or installations placed away from the bridge front should be sufficient for two persons to pass each other. The distance of a passageway between the front bulkhead and any consoles should preferably be at least 1 000 mm, and not less than 800 mm.
5.2 Work Environment
5.2.1 Climate
5.2.1.1 Effective Temperature
The optimum range of effective temperature for accomplishing light work while dressed appropriately for the season or climate is 21 - 27 °C in a warm climate or during the summer, and 18 - 24 °C in a colder climate or during the winter.
5.2.1.2 Temperature Differences
Temperature difference between any two points within the workplace should be maintained below 5 °C, e.g. the temperature of the air at floor level and at head level.
5.2.1.3 Humidity
Humidity should be maintained between 20 % and 60% with 40 % to 45 % preferred. Approximately 45% relative humidity should be provided at 21°C. This value should decrease with rising temperatures, but should remain above 20 % to prevent irritation and drying of body tissues, eyes, skin, and respiratory tract.
5.2.2 Ventilation and Air-conditioning
5.2.2.1 Air-conditioning
The wheelhouse should be equipped with an adequate air-conditioning or mechanical ventilation system to regulate temperature and humidity. The temperature and the humidity should be adjustable within the limits of the foregoing requirements 5.2.1, by closed wheelhouse doors and windows.
5.2.2.2 Hot Air Discharge
Heating systems should be designed so that hot air discharge is not directed at personnel.
5.2.2.3 Cold Air Discharge
Air conditioning systems should be designed such that cold air discharge is not directed at personnel.
5.2.2.4 Air Velocities
Ventilating systems should not produce air velocities exceeding 0,5 m/s. If possible, the preferred air velocity of 0,3 m/s should be used to preclude manual pages from being turned or papers from being blown off work surfaces.
5.2.3 Noise and Acoustics
Workplace noise should be maintained at levels that do not: (1) interfere with necessary voice, telephone and radio communications, (2) cause fatigue or injury and (3) degrade overall system effectiveness.

MSC/Circ.982 ANNEX Page 10
I:\CIRC\MSC\982.doc
5.2.4 Vibration
Uncomfortable levels of vibration should be avoided on the bridge. Vibrations on the bridge should be reduced to such extent that the bridge personnel are neither hindered in their functions nor put at a health risk.
5.2.5 Illumination and Lighting
A satisfactory level of lighting should be available to enable the bridge personnel to complete such tasks as maintenance, chart and office work satisfactorily, both at sea and in port, daytime and night time.
5.2.5.1 Dark Adaptation
Red or filtered white light should be used to maintain dark adaptation whenever possible in areas or on items of equipment requiring illumination in the operational mode. This should include devices in the bridge wings.
5.2.5.2 Luminance Contrast
High contrast in luminance between work area and surrounding should be avoided, i.e. luminance of the task area should not be greater than 3 times the average luminance of the surrounding area.
5.2.5.3 Flexible Lighting System
The lighting system should enable the bridge personnel to adjust the lighting in brightness and direction as required in different areas of the bridge and by the needs of individual devices. The following table lists the recommended general illumination:
Place Colour/Illumination
Bridge, night Red or filtered white, continuously variable from 0 to 20 lux
Adjacent corridors and rooms, day White, continuously variable from 0 to at least 300 lux
Adjacent corridors and rooms, night Red or filtered white, continuously variable from 0 to 20 lux
Obstacles, night Red spotlights, continuously variable from 0 to 20 lux Chart table, day White floodlight, continuously variable from 0 to
1000 lux White spotlights, continuously variable from 0 to 100 lux
Chart table, night Filtered white floodlight or spotlights, continuously variable from 0 to 20 lux
5.2.5.4 Light Dimming
A light dimming capability should be provided.
5.2.5.5 Glare Avoidance
Up most care should be taken to avoid glare and stray image reflections in the bridge environment.
5.2.5.6 Lighting Sources
Lighting sources should be designed and located to avoid creating glare from working and display surfaces.

MSC/Circ.982 ANNEX Page 11
I:\CIRC\MSC\982.doc
5.2.5.7 Reflection in Windows
Reflection in windows of devices, instruments and consoles and other reflective enclosures should be avoided.
5.2.5.8 Glare and Reflection Avoidance
Devices should be designed and fitted to minimize glare or reflection or being obscured by strong light.
5.2.5.9 Flicker Avoidance
Light sources should not have a perceptible flicker.
5.2.5.10 Lighting Controls
Lighting controls should be provided at entrances and exits of enclosed workplace areas.
5.2.5.11 Lighting Control Illumination
Lighting controls should be illuminated.
5.2.5.12 Interior Colour Design
For the interior nonsaturated colours should be chosen which give a calm overall impression and minimize reflectance. Bright colors should not be used. Dark or mid-green colours are recommended, alternatively blue or brown may be used.
5.2.6 Occupational Safety
5.2.6.1 Non-slip Surfaces
Wheelhouse, bridge wings and upper bridge decks should have non-slip surfaces.
5.2.6.2 General Wheelhouse Safety
There should be no sharp edges or protuberances which could cause injury to personnel.
5.2.6.3 Hand and Grab Rails
Sufficient hand- or grab-rails should be fitted to enable personnel to move or stand safely in bad weather. Protection of stairway openings should be given special consideration.
5.2.6.4 Safety Equipment Marking
All safety equipment carried on the bridge should be clearly marked, be easily accessible and have its stowage position clearly indicated.
5.3 Workstation Layout
5.3.1 Consoles
5.3.1.1 Workstation Area
The workstations for navigating and manoeuvring, monitoring and for the bridge wings should be planned, designed and placed within an area spacious enough for not less than two operators, but close enough for the workstations to be operated by one person.

MSC/Circ.982 ANNEX Page 12
I:\CIRC\MSC\982.doc
5.3.1.2 Single Ope rator Console Width for Seated Operations
The console should be dimensioned and configured so that all relevant controls can be reached from a sitting position.
5.3.1.3 Left-to-Right Viewing Angle
The console should be designed that from the normal working position the total required left-to-right viewing angle should not exceed 190°. This angle shall be reduced whenever possible through appropriate control-display layout.
5.3.1.4 Console Height
The top of the consoles should not exceed a height of 1200 mm.
5.3.1.5 Console Leg Room
The upper leg room of the console should have a minimum of 450 mm in depth and the lower leg room a minimum of 600 mm in depth.
5.3.1.6 Chart Table Dimensions
The chart table should be large enough to accommodate all chart sizes normally used internationally for navigation.
5.3.1.7 Chair Design
Chairs at workstations designed for a sitting position should be capable of rotating with the foot rest being arrested, adjustable in height, and capable of being arrested on the floor. Chairs should be movable out of the operating area.
5.3.2 Device, Control and Display Integration
5.3.2.1 Logical Arrangement
The devices, displays and controls should be fitted in a logical arrangement and combined into function groups.
5.3.2.2 Location Consistency
Location of recurring functional groups and individual items should be similar from console to console.
5.3.2.3 Visual Information for more than one User
Displays providing visual information to more than one person on duty should be located for easy viewing by all users concurrently, or if this is not possible, the displays should be duplicated.
5.3.2.4 Control and Display Location
Controls and their associated displays should be located that the information on the displays can be easily read, during the operation of the controls.
5.3.2.5 Simultaneous Use
A visual display that must be monitored concurrently with manipulation of a related control should be located so that the operator is not required to observe the display from an extreme visual angle and thus introduce the possibility of parallax error.

MSC/Circ.982 ANNEX Page 13
I:\CIRC\MSC\982.doc
5.3.2.6 Control/Indicator Discernability
Controls or combined controls/indicators should be visually and tactually distinguishable from elements which only indicate.
5.3.2.7 High Priority Displays
Where two operators must use the same display, and the displays have high priority duplicate sets should be provided whenever there is adequate space. Otherwise, displays should be centred between the operators, alternatively they can be placed that they can be easily monitored by both operators, e.g., above the front window.
5.3.2.8 Centring of Shared Displays
Where two operators must use the same display, and secondary displays must be shared, they should be centred between the operators if they are equally important to each operator. If the displays are more important to one operator than to the other, they should be placed nearest the operator having the principal requirements for using them, alternatively they can be placed that they can be easily monitored by both operators, e.g., above the front window.
5.3.3 Arrangement and Grouping of Controls
5.3.3.1 Control Placement
Controls requiring frequent or accurate settings should not be placed more than 675 mm from the front edge of the console.
5.3.3.2 Control Positioning for Simultaneous Operation
Controls should be located so that simultaneous operation of two controls will not necessitate a crossing or interchanging of hands.
5.3.3.3 Location of Primary and Frequently Used Controls
The most important and frequently used controls should have the most favourable position with respect to ease of reaching and grasping (particularly rotary controls and those requiring fine settings), e.g., keys for emergency functions should have a prominent position.
5.3.3.4 Consistent Arrangement
The arrangement of functionally similar or identical controls should be consistent from workstation to workstation, panel to panel throughout the bridge.
5.3.3.5 Spacing Between Controls
Appropriate spacing between the controls should be provided.
5.3.4 Display Arrangement
5.3.4.1 Immediate Field of View
The most important and/or frequently used displays should be located within the operator's immediate field of view (viewing area with eye rotation only) (Fig. 5.1).
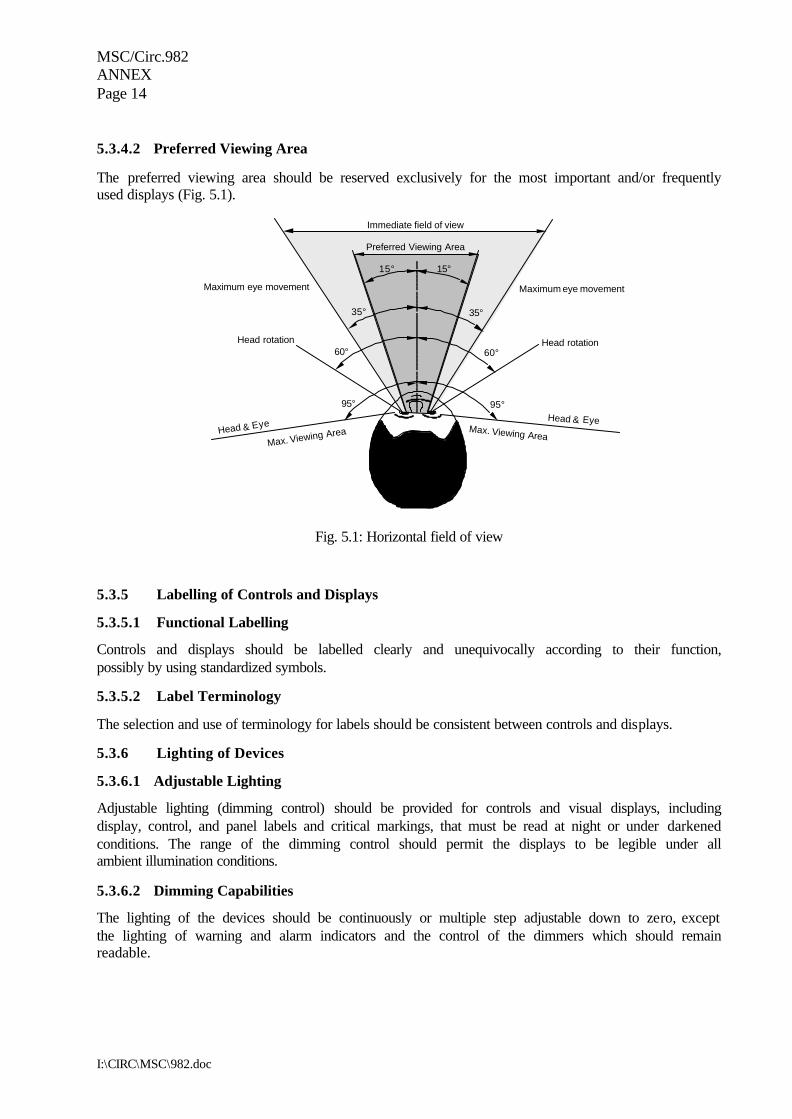
MSC/Circ.982 ANNEX Page 14
I:\CIRC\MSC\982.doc
5.3.4.2 Preferred Viewing Area
The preferred viewing area should be reserved exclusively for the most important and/or frequently used displays (Fig. 5.1).
Immediate field of view
Max. Viewing Area Max. Viewing AreaHead & Eye
Head & Eye
Head rotation
35°
Maximum eye movement
15° 15°
35°
60° 60°
95° 95°
Head rotation
Maximum eye movement
Preferred Viewing Area
Fig. 5.1: Horizontal field of view
5.3.5 Labelling of Controls and Displays
5.3.5.1 Functional Labelling
Controls and displays should be labelled clearly and unequivocally according to their function, possibly by using standardized symbols.
5.3.5.2 Label Terminology
The selection and use of terminology for labels should be consistent between controls and displays.
5.3.6 Lighting of Devices
5.3.6.1 Adjustable Lighting
Adjustable lighting (dimming control) should be provided for controls and visual displays, including display, control, and panel labels and critical markings, that must be read at night or under darkened conditions. The range of the dimming control should permit the displays to be legible under all ambient illumination conditions.
5.3.6.2 Dimming Capabilities
The lighting of the devices should be continuously or multiple step adjustable down to zero, except the lighting of warning and alarm indicators and the control of the dimmers which should remain readable.

MSC/Circ.982 ANNEX Page 15
I:\CIRC\MSC\982.doc
5.3.6.3 Individual Lighting Adjustment
Each device should be fitted with an individual lighting adjustment. In addition functional groups of devices, displays and controls should be equipped with common light adjustment.
5.4 Alarms
5.4.1 Alarm Management
5.4.1.1 Alarm Acknowledgement
A method of acknowledging all alarms (silence audible alarms and set visual alarms to steady state), including the indication of the source of the alarm, should be provided at the navigating and manoeuvring workstation, to avoid distraction by alarms which require attention but have no direct influence on the safe navigation of the ship and which do not require immediate action to restore or maintain the safe navigation of the ship.
5.4.1.2 Fire and Emergency Alarms
The alarm indicators and controls of the fire alarm and emergency alarm should be located at the safety workstation.
5.4.1.3 Failure or Reduction of Power Supply
Alarms should be provided to indicate failure or reduction in the power supply which would effect the safe operation of the equipment.
5.4.1.4 Sensor Input Failure or Absence
Alarms should be provided to indicate sensor input failure or absence.
5.4.1.5 Alarm Status
Alarm systems should clearly distinguish between alarm, acknowledged alarm, and no alarm (normal condition).
5.4.1.6 Acknowledgement of Alarms
Alarms should be maintained until they are acknowledged.
5.4.1.7 Cancellation of Alarms
Alarms and acknowledged alarm should only be capable of being cancelled if the alarm condition is rectified. This cancellation should only be possible at the individual equipment.
5.4.1.8 Alarm Minimization
The number of alarms should be minimized.
5.4.1.9 Alarm Testing
Provision should be made for functionally testing alarms.
5.4.1.10 Power supply
Required alarm systems should be continuously powered and should have an automatic change-over to a stand-by power supply in case of loss of normal power supply.
5.4.1.11 Indication of Alarms
Alarms should be indicated in order of sequence and provided with aids for decision-making. An explanation or justification of an alarm should be available (on request).

MSC/Circ.982 ANNEX Page 16
I:\CIRC\MSC\982.doc
5.4.1.12 Presentation of Alarms
The presentation of alarms should be clear, distinctive, unambiguous, and consistent.
5.4.1.13 Modes of Alarms
All required alarms should be presented through both visual and auditory means.
5.4.2 Visual Alarms
5.4.2.1 Discrimination of Visual Alarms
Visual alarms should clearly differ from routine information on displays.
5.4.2.2 Presentation of Visual Alarms
Visual alarms should be flashing. The flashing display should change to steady display upon acknowledgement.
5.4.2.3 Presentation of Acknowledged Alarms
Acknowledged alarms should be presented by steady display.
5.4.2.4 Presentation of Normal Conditions (No Alarm)
Alarm indicators should be designed to show no light in normal conditions (no alarm) or should be non-existent on displays.
5.4.2.5 Flash Rate
Flashing visual alarms should be illuminated for at least 50 % of the cycle and have a pulse frequency in the range of 0.5 Hz to 1.5 Hz.
5.4.2.6 Night Vision
Visual alarms on the navigating bridge should not interfere with night vision.
5.4.3 Audible Alarms
5.4.3.1 Use of Audible Alarms
Audible alarms should be used simultaneously with visual alarms.
5.4.3.2 Audible Alarms
Audible alarms should go off upon acknowledgement.
5.4.3.3 Focusing on Audible Alarms
Audible alarms should be differentiated from routine signals, such as bells, buzzers, and normal operation noises.
5.4.3.4 Sound Characteristic
Under normal working conditions, the alarm signals should be heard properly inside the wheelhouse and outside on the bridge wings and their sound characteristics should not be inconvenient to the human ear.

MSC/Circ.982 ANNEX Page 17
I:\CIRC\MSC\982.doc
5.4.3.4.1 Sound Pressure
Audible alarm sound pressure, one metre from the source should be at least 75 dB(A), and at least 10 dB(A), or preferable 20 dB(A), above ambient noise levels existing during normal operations. Audible alarm sound pressures in a space should not exceed 115 dB(A).
5.4.3.4.2 Sound Frequency
With the exception of bells, audible alarms should have a signal frequency between 200 Hz and 2500 Hz, with the preferable range between 500 Hz and 1500 Hz.
5.5 Input Devices
5.5.1 Movement of Controls
Movement of a control forward, clockwise to the right, or up, should:
- turn the equipment or component on, or
- cause the quantity to increase, or
- move the equipment or component forward, clockwise, to the right, or up.
5.5.2 Corresponding Movements
Controls should be selected so that the direction of movement of the control will be consistent with the related movement of an equipment component, or vessel. The direction of motion of operating elements for manoeuvring equipment should correspond with the direction of the effect on the ship caused by the installations controlled.
5.5.3 Return to Navigation Monitoring Mode
When a single device is used simultaneously for voyage planning and navigation monitoring it should be possible to revert to the monitoring mode with a single operator action.
5.5.4 Minimal User Actions
Control actions should be simple, particularly for real-time tasks requiring fast user response; control logic should permit completion of a transaction sequence with the minimum number of actions.
5.5.5 Consistency of Control Actions
The same functions should be activated on devices by the same control actions, as far as practicable.
5.5.6 Feedback
Visual, auditory or mechanical feedback should be provided to indicate that a controller input has been registered.
5.5.7 Operation of Controls
Controls should be easy to identify and operate.
5.5.8 Accessibility of Controls for Important Functions
The controls for the most important and/or frequently used functions should be easily visible and accessible to the user from the normal working position.

MSC/Circ.982 ANNEX Page 18
I:\CIRC\MSC\982.doc
5.5.9 Operation of Controls for Important Functions
The controls for the most important and/or frequently used functions should require only a single actuation to accomplish their function.
5.5.10 Assignment of Controls of Important Functions
The controls for the most important and/or frequently used functions should be assigned to only one function.
5.5.11 Accidental Input or Actuation Prevention
The system should be designed to prevent the accidental manipulation of controls, e.g. physical protection, which could result in changes to the status of the system, the system functions, components, or data, e.g. loss of power.
5.6 Information Display
5.6.1 General Display Requirements
5.6.1.1 Lack of Ambiguity
Display indicators should clearly and unambiguously direct and guide the appropriate control response.
5.6.1.2 Use of Digital Displays
Digital displays should be used for the presentation of quantitative data when exact values are required and continuos trend or rate of change information is not required.
5.6.1.3 Digital Readout
A digital readout should not be used when the information changes with a frequency of more than 0,5 Hz; a higher frequency may be used when the information perception from other displays is not disturbed.
5.6.1.4 Update of Information
The displayed information should be continuously updated.
5.6.1.5 Information Duration
For signals or displays which frequently or consistently change their outputs, the information displayed should have duration's of sufficient length to be reliably detected under expected operator workload and operational environment.
5.6.1.6 Display Simplicity
Displays should present the simplest information consistent with their function; information irrelevant to the task should not be displayed, and extraneous text and graphics should not be present.
5.6.1.7 Only Necessary Data Displayed
Displayed data should be tailored to users needs, providing only necessary and immediately usable data for any transaction. Displays should not be overloaded with extraneous data.
5.6.1.8 Uncluttered Displays
Displays should be as uncluttered as possible.

MSC/Circ.982 ANNEX Page 19
I:\CIRC\MSC\982.doc
5.6.1.9 Display of Important Information
Highly important and/or frequently used information should be permanently displayed.
5.6.1.10 Display Fields for the Display of Important Information
The display fields for the presentation of the most important and/or frequently used information should be assigned exclusively to them and should not be used to display any other information.
5.6.1.11 Graphic Display Enhancement With Numeric Values
When precise reading of a graphic display is required, the display should be annotated with actual data values to supplement their graphic representation.
5.6.1.12 Indication of Scale
The scale of maps and charts (data) shown on the display should always be indicated.
5.6.1.13 Aiding Distance Judgements
When a user must judge distances accurately on a map or other graphic display, computer aids should be provided for that judgement.
5.6.2 Arrangement of Visual Information
5.6.2.1 Screen Organization
A standard display screen organization should be evident for the location of various system functions (such as a data display zone, control zone, message zone) from one display to another.
5.6.2.2 Grouping of Information in a Display
Information on a display should be grouped according to obvious principles, e.g., by task, system, function, sequence, etc., based upon the user's requirements in performance of the ongoing task.
5.6.2.3 Demarcation of Groups
Information groups should be visually distinct, e.g., separated by blanks, lines, colour coding, or other means.
5.6.2.4 Consistent Presentation
The arrangement and presentation of identical visual information should be consistent from application to application.
5.6.3 Visual Display Units (VDU)
5.6.3.1 Night Display
All information should be presented emitting as little light as possible at night.
5.6.3.2 Day and Night Legibility
Displays should be capable of being read day and night.
5.6.3.3 Background Colour
A single neutral background colour should be used that has a hue which allows the information (foreground) to be easily visible and which does not distort or interfere with the coding aspects of the display.

MSC/Circ.982 ANNEX Page 20
I:\CIRC\MSC\982.doc
5.6.3.4 VDU Resolution
The display should have adequate resolution; i.e., users can discriminate all display elements and codes from the maximum intended viewing distance.
5.6.3.5 VDU Contrast
The contrast ratio of the display should be greater than 3 : 1 and less than 15 : 1; a contrast ratio of 7 : 1 is preferred.
5.6.3.6 Background Luminance
A background luminance level of 15 cd/m2 to 20 cd/m2 should be used at daylight.
5.6.3.7 Display Luminance
The display luminance should be between 80 cd/m2 to 160 cd/m2 at daylight.
5.6.3.8 Flicker
The display should be "flicker free"; the refresh rate should have a minimum of 65 Hz.
5.6.3.9 Image Continuity
The display should maintain the illusion of a continuous image, i.e., users should not be able to resolve scan lines or matrix spots.
5.6.3.10 CRT Image Linearity
The display should be free of geometric distortion.
5.6.4 Coding and Highlighting
5.6.4.1 Highlighting Selected Data
When a user is performing an operation on some selected display item, that item should be highlighted.
5.6.4.2 Flash Coding
Red flash coding should be reserved for Alarms.
5.6.4.3 Redundant Colour Coding
Colour coding should be redundant with some other display feature, i.e. add colour coding after displays have already been designed as effectively as possible in a monochrome format.
5.6.4.4 Easily Discriminable Colours
When selecting colours for coding discrete categories of data, those colours should be easily discriminable.
5.6.4.5 Minimum Colour Differences
When colour coding is used for discriminability or conspicuity of displayed information, all colours in the set should differ from one another by a minimum of 40 ∆E (CIE L*u*v*) distances.
5.6.4.6 Establishing Standards for Shape Coding
When shape coding is used, codes should be based on established standards or conventional meanings.

MSC/Circ.982 ANNEX Page 21
I:\CIRC\MSC\982.doc
5.6.5 Display Elements
5.6.5.1 Font Style
A clearly legible font should be utilized. Fonts should have true ascenders and descenders, uniform stroke width, and uniform aspect ratio. .
5.6.5.2 Meaningful Abbreviations
When abbreviations or acronyms are used, they should be meaningful, in common usage and kept to a minimum.
5.6.5.3 Units of Measurement
The units of measurement (volts, psi, inches, etc.) should be labelled.
5.6.5.4 Appropriate Use of Icons
Icons should be designed to look like the objects, processes, or operations they represent, by use of literal, functional, or operational representations.
5.6.5.5 Representation and Discrimination
Each icon or symbol should represent only one object or function, and should be easily discriminable from all other icons and symbols.
5.6.5.6 Size
Icons and symbols should be large enough for the user to perceive the representation and discriminate it from other icons and symbols.
5.6.5.7 Highlighting
An icon or symbol that the user has selected should be highlighted.
5.6.5.8 Scaling in Standard Intervals
Scales should have tick marks at a standard interval of 1, 2, 5, or 10 (or multiples of 10) for labelled divisions; intervening tick marks to aid visual interpolation should be consistent with the labelled scale interval.
5.6.5.9 Expansion of Graphic Displays
When a graphic display has been expanded from its normal coverage, some scale indicator of the expansion factor should be provided.
5.6.5.10 Unobtrusive Grids
When grid lines are displayed, they should be unobtrusive and not obscure data elements (e.g., curves, plotted points).
5.7 Interactive Control
5.7.1 General User Input Guidelines
5.7.1.1 Consistent Procedures
Procedures for entering commands or information should be consistent in form.

MSC/Circ.982 ANNEX Page 22
I:\CIRC\MSC\982.doc
5.7.1.2 Standard Procedures
Standard procedures should be used for updating and deleting information.
5.7.1.3 Consistent Wording of Commands
All terms employed in the user-system interface, and their abbreviations, should be consistent in meaning from one transaction to another, and from one task to another.
5.7.1.4 Unnecessary Entry of Information
A user should not be required to re-enter information already entered to the system.
5.7.1.5 Only Available Options Offered
Only control options that are actually available for the current transaction should be offered to users.
5.7.2 User Input Formats
5.7.2.1 Logical Ordering of Menu Options
Menu options should be ordered and grouped logically.
5.7.2.2 Consistent Design of Hierarchic Menus
The display format and selection logic of hierarchic menus should be consistent at every level.
5.7.2.3 Consistent Display of Menu Options
When menus are provided in different displays, they should be designed so that option lists are consistent in wording and ordering.
5.7.2.4 Minimal Steps in Sequential Menu Selection
When users must step through a sequence of menus to make a selection, the hierarchic menu structure should be designed to minimize the number of steps required.
5.7.2.5 Return to Higher-Level Menus
Users should have to take only one simple key action to return to the next higher level in hierarchic menus.
5.7.2.6 Return to General Menu
Users should have to take only one simple key action to return to the general menu at the top level in hierarchic menus.
5.7.2.7 Explanatory Title for Menu
An explanatory title should be provided for each menu that reflects the nature of the choice to be made, so that the function of the menu is evident to the user.
5.7.2.8 ON/OFF Menu Items
For menu items that can be in an "On" or "Off" state, the "On" state should be indicated by making the item perceptually distinct.
5.7.2.9 Form Filling for Command Entry
Form filling should be provided as an aid for composing complex command entries.

MSC/Circ.982 ANNEX Page 23
I:\CIRC\MSC\982.doc
5.7.3 System Operational Information
5.7.3.1 Indicating System Status
The system status should be indicated to users at all times.
5.7.3.2 Operational Mode
The currently selected mode should clearly be indicated, when the results of user action are contingent upon different operational modes.
5.7.3.3 Status and Type of External Sensors
The type and status of external sensors should be permanently indicated.
5.7.3.4 Presentation of Planned and Actual Data
When a device is used for planning it must be clear to the user that this mode is selected so that there is no confusion between the presentation of planned and actual data.
5.7.3.5 Source of Position Information
The information of position should be displayed with an indication of its source.
5.7.3.6 Simulated Operations
Simulated operations should be clearly distinguished from real operations.
5.7.4 System Response
5.7.4.1 Standard Display Location
System messages should appear in standard locations.
5.7.4.2 Familiar Wording
System messages should use familiar terminology.
5.7.4.3 Periodic Feedback
When system functioning requires the user to stand-by, periodic feedback should be provided to indicate normal system operation.
5.7.4.4 Distinctive and Consistent Warnings
Warnings should be distinctive and consistent.
5.7.4.5 Informative Error Messages
When the information systems detects an error, an error message should be displayed stating the error and possible subsequent operations.
5.7.4.6 Task-Oriented Error Messages
Error messages should be appropriate to the task.
5.7.4.7 On-Line Guidance
Users should be able to request on-line guidance information regarding system capabilities, procedures, commands and abbreviations, etc..

MSC/Circ.982 ANNEX Page 24
I:\CIRC\MSC\982.doc
5.7.5 Prevention/Detection/Correction of Errors
5.7.5.1 Protection from Data Loss by Interruption
When a proposed user action will interrupt a current transaction sequence, automatic means to prevent data loss should be provided.
5.7.5.2 Segregating Real from Simulated Data
When simulated data and system functions are displayed or provided, real data should be protected.

MSC/Circ.982 ANNEX Page 25
I:\CIRC\MSC\982.doc
APPENDIX 1
DEFINITIONS
Alarm: An alarm announces by audible means, or audible and visual means, a condition of an abnormal situation requiring attention.
Alphanumerics: Characters presented on a visual display as letters, numbers, digits, and usually other characters, such as punctuation marks or combinations of them.
Ambient Light: Light originating from sources other than the operator's visual displays, i.e., the general level of illumination on the bridge due to sunlight or lights and lamps.
Ambient Noise: All of the background sounds in the work environment, e.g., the general level of background noise on the shipbridge.
Brightne ss: An attribute of visual sensation that is determined by the intensity of light radiation reaching the eye. Along with hue and saturation, a component of perceived colour.
Character: A letter, digit, or other symbol that is used as part of the organization, control, or representation of data. A character is often in the form of a spatial arrangement of adjacent or connected strokes.
Character Size: Measured by the height of a displayed character in terms of its visual angle.
Coding: Use of a system of symbols, shapes, colors, or other variable sensory stimuli to represent specific information.
Console: The structural framework for the integration of devices, equipment, and storage and which together compromise a workstation.
Contrast: The difference in luminance between foreground objects and their background or, generally, between any two areas of a display, measured with the contrast ratio (division of the luminance of the foreground by the luminance of the background).
Control: A mechanism used to regulate or guide the operation of a machine, equipment component, subsystem, or system.
Cursor: A highlighted, moveable indicator on the computer screen that shows the current location for data entry, editing, or selection of a displayed object.
Display (Visual): Means which presents visual information, including conventional instrumentation.
Display Field: An area of the display screen reserved for the display of information.
Effective Temperature: An index which combines into a single value the effect of temperature, humidity, and air movement on the sensation of warmth or cold felt by the human body. The numerical value is that of the temperature of still, saturated air which would induce an identical sensation.
Ergonomics: The study and design of working environments (e.g., workstation, cockpit, ship bridges) and their components, work practices, and work procedures for the benefit of the worker’s productivity, health, comfort, and safety. Application of the human factor in the analysis and design of equipment, work and working environment.
Field of Vision: Angular size of a scene that can be observed from a position on the ship’s bridge.
MSC/Circ.982 ANNEX Page 26
I:\CIRC\MSC\982.doc
Glare: Excessive demand for visual adaptation brought on by the retina’s exposure to more light than it can tolerate. Produced when any luminance within the visual field is sufficiently greater than the luminance to which the eye is adjusted.
Highlighting: Emphasizing displayed data or format features, e.g., through the use of underlining, bolding, or inverse video, for calling the user’s attention to some displayed area or information.
Hue: One component of the perception of colour (for example, red, green, yellow). Other components are saturation and brightness.
Icon: Pictorial or other nonverbal representation of objects or actions.
Illumination: The amount of light (luminance flux) falling on a surface, measured in lumen/m2 = lux.
Input Device: A workstation component used for data entry and display control, e.g., keyboard, trackball, mouse.
Label: Alphanumeric information that identifies or describes an object or displayed data.
Layout: The physical arrangement of the parts and components that make up a module or a unit of equipment.
Line of Sight: An imaginary line extended from the plane of the viewer's eyes; the horizontal line of sight occupies the same horizontal plane as the centre of the pupils. The normal line of sight declines 15 degrees below the horizontal; maintaining a horizontal or higher line of sight takes effort and can be fatiguing over time.
Luminance: Luminance is the amount per unit area emitted or reflected from a surface and is measured in candela per square meters (cd/m2).
Menu: A set of related options listed together for selection by the user, i.e. a type of dialogue in which a user selects one item out of a list of displayed alternatives.
Mode: An internally defined state or condition of computer operation, such as keyboard input mode, help mode, edit mode, save mode, planning mode or operational mode.
Reflection: A mirror image of the surrounding environment that is coincidentally superimposed on screen content.
Resolution: A characteristic of a visual display, expressed in pixels per square inch.
Symbol: A graphic or alphanumeric representation of something by reason of relationship, association, or convention.
Workstation: The combination of all job-related items, including the console with all devices, equipment and the furniture, to fulfil certain tasks.

MSC/Circ.982 ANNEX Page 27
I:\CIRC\MSC\982.doc
APPENDIX 2
PROPOSED EQUIPMENT FOR WORKSTATIONS
Workstation for navigating and manoeuvring
Equipment Accessory
• radar / radar plotting • ECDIS • automatic visual position indicator • information of position fixing systems • information of Automatic Ship Identification System (AIS) • (adjustment) heading / track control system • controls for main engine(s) incl. crash manoeuvres, emergency stop • controls for main rudder (incl. override facility) • controls for thruster • indications for
∗ for propeller revolutions (actual and desired) ∗ main engine revolution in the case of reduction geared engine ∗ propeller pitch in the case of controllable pitch propeller ∗ torque ∗ starting air ∗ lateral thrust ∗ speed (possibly longitudinal and lateral) ∗ rudder angle ∗ rate-of-turn ∗ gyro compass heading ∗ magnetic compass heading ∗ heading reminder (pre-set heading) ∗ water depth incl. depth warning adjustment ∗ time ∗ wind direction and velocity ∗ air and water temperature + ∗ group alarms (with aids for decision-making)
• signal transmitter for ∗ whistle ∗ automatic device for fog signals, ∗ general alarm ∗ morse signalling light
• automatic device for emergency alarm • controls for console lighting • two-way VHF radiotelephone (walkie-talkie) with charging connection and/or
paging system • internal communication equipment • public address system • VHF point with channel selector • remote control for search light • rudder pump selector switch • steering mode selector switch • steering position selector switch • controls for windscreen wiper, washer, heater • night vision equipment • sound reception system • acknowledgement of watch alarm
• sufficient shelves for binoculars, ashtray cup, etc.
• writing space • adjustable chair

MSC/Circ.982 ANNEX Page 28
I:\CIRC\MSC\982.doc
Workstation for monitoring Equipment Accessory
• radar / radar plotting • signal transmitter for whistle • acknowledgement of watch alarm • indications for
∗ propeller revolutions ∗ pitch of controllable pitch propeller ∗ speed ∗ rudder angle ∗ gyro compass heading ∗ time ∗ rate-of-turn ∗ water depth ∗ alarms
• internal communication equipment • VHF point with channel selector • Controls for windscreen wiper, washer, heater
• shelf for binoculars etc. • shelf for notes etc. • adjustable chair
Workstation for manual steering (helmsman's)
Equipment Accessory
• steering wheel / steering lever • rudder pump selector switch • indications for
∗ gyro compass heading ∗ magnetic compass heading ∗ pre-set heading ∗ rudder angle ∗ rate of turn
• talkback to bridge wing workstation • controls for windscreen wiper, washer, heater
• adjustable chair

MSC/Circ.982 ANNEX Page 29
I:\CIRC\MSC\982.doc
Workstation for docking (bridge wing)
Equipment Accessory
• controls for main engine(s) • controls for thruster • controls for rudder • controls for whistle • steering position selector switch • indications for
∗ gyro compass heading ∗ propeller revolutions ∗ main engine revolution in the case of reduction geared engine ∗ propeller pitch in the case of controllable pitch propeller ∗ lateral thrust ∗ rate-of-turn ∗ rudder angle ∗ longitudinal and lateral movement of ship ∗ wind direction and velocity
• talkback system to the workstations navigating and manoeuvring, monitoring, manual steering, and to manoeuvring stations, except muster stations
• system for external communication with tugs, pilot boat (VHF point) • controls for morse lamp and searchlight • acknowledgement of watch alarm
Workstation for planning and documentation
Equipment Accessory • ECDIS including navigation planning station • route planning devices • chart table • position fixing receiver • retaining device for drawing triangles, dividers, magnifying lens, pencils, etc. • weather chart plotter • main clock • chronometer with receiving facility for time signals • radio direction finder • log, incl. distance indicator, course plotter • echograph • barograph • indication for air and water temperature + • command printer • VHF point
• facility for storing charts
• facility for storing nautical publications, manuals, etc.

MSC/Circ.982 ANNEX Page 30
I:\CIRC\MSC\982.doc
Workstation for safety
Equipment Accessory
• fire alarm for areas machinery, superstructure/accommodations, cargo • remote control and monitoring of fire-extinguishing system • remote control and monitoring of watertight doors/fire doors (open/closed) • emergency stop for air condition, ventilation and refrigerating installations • controls for anti-rolling device • indicator for bilge monitor • indicator for strength load incl. alarm • indicator for further safety systems • clinometer • keys and control-elements for lights and signals (navigation lights, signal
lamps, bridge lighting, deck lighting searchlights, as well as all fuses) • internal communication system, in particular to muster stations • adjustment of watch alarm system and acknowledgement button • status indication for bow-, rearflap • controls/indications for ballast water handling • tools for documentation • main station for two-way VHF radiotelephone (walkie-talkie) ++
• writing space
Workstation for communications
Equipment Accessory • GMDSS equipment as required for the applicable sea area:
∗ VHF-DSC, radiotelephone ∗ MF-DSC, radiotelephone ∗ MF/HF-DSC, NBDP, radiotelephone ∗ Inmarsat-SES ∗ NAVTEX/EGC/HF direct printing telegraph ∗ EPIRB trigger ∗ main station for two-way VHF radiotelephone (walkie-talkie) ++
• writing space • chair
+ Located at the workstation for navigating and manoeuvring or at the workstation for planning and
documentation. ++ Located at the safety or communication workstation.
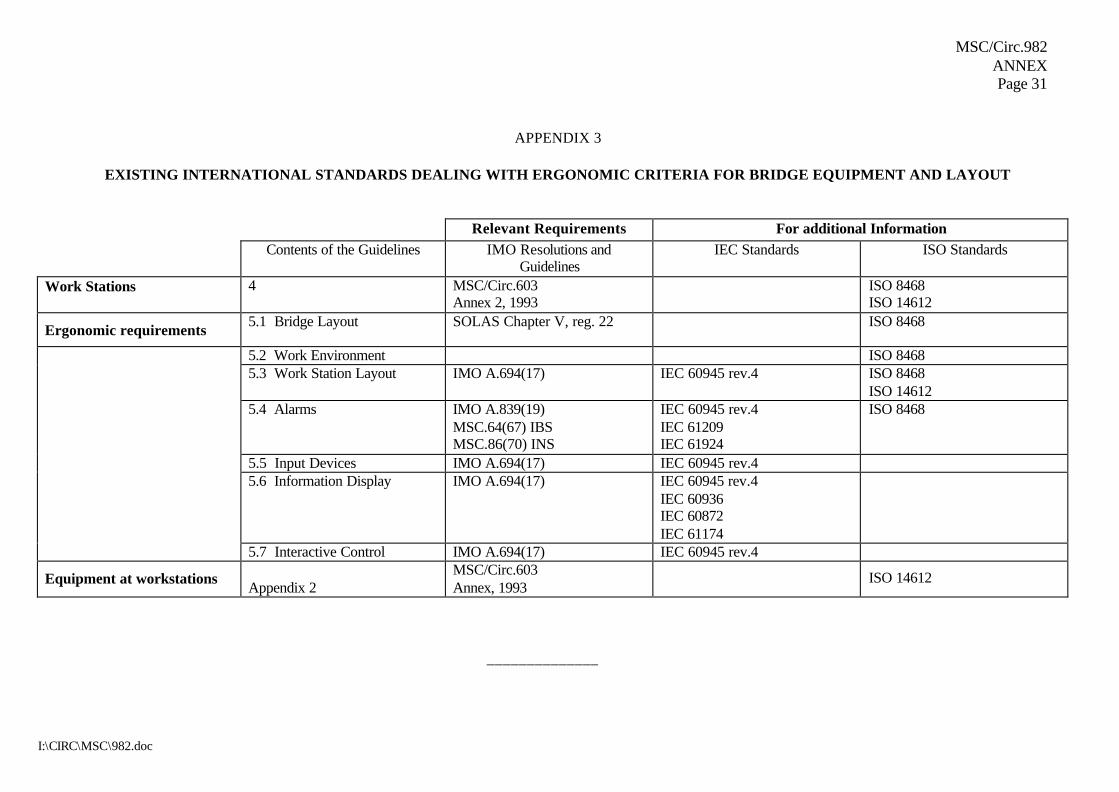
MSC/Circ.982 ANNEX Page 31
I:\CIRC\MSC\982.doc
APPENDIX 3
EXISTING INTERNATIONAL STANDARDS DEALING WITH ERGONOMIC CRITERIA FOR BRIDGE EQUIPMENT AND LAYOUT
Relevant Requirements For additional Information Contents of the Guidelines IMO Resolutions and
Guidelines IEC Standards ISO Standards
Work Stations 4 MSC/Circ.603 Annex 2, 1993
ISO 8468 ISO 14612
Ergonomic requirements 5.1 Bridge Layout SOLAS Chapter V, reg. 22 ISO 8468
5.2 Work Environment ISO 8468 5.3 Work Station Layout IMO A.694(17) IEC 60945 rev.4 ISO 8468
ISO 14612 5.4 Alarms IMO A.839(19)
MSC.64(67) IBS MSC.86(70) INS
IEC 60945 rev.4 IEC 61209 IEC 61924
ISO 8468
5.5 Input Devices IMO A.694(17) IEC 60945 rev.4 5.6 Information Display IMO A.694(17) IEC 60945 rev.4
IEC 60936 IEC 60872 IEC 61174
5.7 Interactive Control IMO A.694(17) IEC 60945 rev.4
Equipment at workstations Appendix 2
MSC/Circ.603 Annex, 1993
ISO 14612
______________
RESOLUTION MSC.232(82)
(adopted on 5 December 2006)
ADOPTION OF THE REVISED PERFORMANCE STANDARDS FOR
ELECTRONIC CHART DISPLAY AND INFORMATION SYSTEMS (ECDIS)
THE MARITIME SAFETY COMMITTEE, RECALLING Article 28(b) of the Convention on the International Maritime Organization concerning the functions of the Committee, RECALLING ALSO resolution A.886(21), by which the Assembly resolved that the function of adopting performance standards and technical specifications, as well as amendments thereto shall be performed by the Maritime Safety Committee and/or the Marine Environment Protection Committee, as appropriate, on behalf of the Organization, RECALLING ALSO regulations V/19 and V/27 of the International Convention for the Safety of Life at Sea (SOLAS), 1974, which requires all ships to carry adequate and up-to-date charts, sailing directions, lists of lights, notices to mariners, tide tables and all other nautical publications necessary for the intended voyage, NOTING that the up-to-date charts required by SOLAS regulations V/19 and V/27 can be provided and displayed electronically on board ships by electronic chart display and information systems (ECDIS), and that the other nautical publications required by regulation V/27 may also be so provided and displayed, RECOGNIZING the need to improve the previously adopted, by resolution A.817(19), as amended, performance standards for ECDIS in order to ensure the operational reliability of such equipment and taking into account the technological progress and experience gained, HAVING CONSIDERED the recommendation made by the Sub-Committee on Safety of Navigation, at its fifty-second session, 1. ADOPTS the Revised performance standards for electronic chart display and information systems (ECDIS), set out in the Annex to the present resolution; 2. RECOMMENDS Governments ensure that ECDIS equipment: (a) if installed on or after 1 January 2009, conform to performance standards not
inferior to those specified in the Annex to the present resolution; and
(b) if installed on or after 1 January 1996 but before 1 January 2009, conform to performance standards not inferior to those specified in the Annex to resolution A.817(19), as amended by resolutions MSC.64(67) and MSC.86(70).
RESOLUTION MSC.232(82)Page 2
ANNEX
REVISED PERFORMANCE STANDARDS FOR ELECTRONIC CHART DISPLAY AND INFORMATION SYSTEMS (ECDIS)
1 SCOPE OF ECDIS 1.1 The primary function of the ECDIS is to contribute to safe navigation. 1.2 ECDIS with adequate back-up arrangements may be accepted as complying with the
up-to-date charts required by regulations V/19 and V/27 of the 1974 SOLAS Convention, as amended.
1.3 ECDIS should be capable of displaying all chart information necessary for safe and
efficient navigation originated by, and distributed on the authority of, government authorized hydrographic offices.
1.4 ECDIS should facilitate simple and reliable updating of the electronic navigational chart. 1.5 ECDIS should reduce the navigational workload compared to using the paper chart.
It should enable the mariner to execute in a convenient and timely manner all route planning, route monitoring and positioning currently performed on paper charts. It should be capable of continuously plotting the ship�s position.
1.6 The ECDIS display may also be used for the display of radar, radar tracked target
information, AIS and other appropriate data layers to assist in route monitoring. 1.7 ECDIS should have at least the same reliability and availability of presentation as the
paper chart published by government authorized hydrographic offices. 1.8 ECDIS should provide appropriate alarms or indications with respect to the information
displayed or malfunction of the equipment (see appendix 5). 1.9 When the relevant chart information is not available in the appropriate form (see section 4),
some ECDIS equipment may operate in the Raster Chart Display System (RCDS) mode as defined in appendix 7. RCDS mode of operation should conform to performance standards not inferior to those set out in appendix 7.
2 APPLICATION OF THESE STANDARDS 2.1 These performance standards should apply to all ECDIS equipment carried on all ships,
as follows: - dedicated standalone workstation. - a multifunction workstation as part of an INS. 2.2 These performance standards apply to ECDIS mode of operation, ECDIS in RCDS mode
of operation as specified in appendix 7 and ECDIS backup arrangements as specified in appendix 6.

RESOLUTION MSC.232(82)Page 3
2.3 Requirements for structure and format of the chart data, encryption of chart data as well
as the presentation of chart data are within the scope of relevant IHO standards, including those listed in appendix 1.
2.4 In addition to the general requirements set out in resolution A.694(17)*, the presentation
requirements set out in resolution MSC.191(79), ECDIS equipment should meet the requirements of these standards and follow the relevant guidelines on ergonomic principles adopted by the Organization1.
3 DEFINITIONS
For the purpose of these performance standards: 3.1 Electronic Chart Display and Information System (ECDIS) means a navigation
information system which with adequate back-up arrangements can be accepted as complying with the up-to-date chart required by regulations V/19 and V/27 of the 1974 SOLAS Convention, as amended, by displaying selected information from a system electronic navigational chart (SENC) with positional information from navigation sensors to assist the mariner in route planning and route monitoring, and if required display additional navigation-related information.
3.2 Electronic Navigational Chart (ENC) means the database, standardized as to content,
structure and format, issued for use with ECDIS by or on the authority of a Government, authorized Hydrographic Office or other relevant government institution, and conform to IHO standards. The ENC contains all the chart information necessary for safe navigation and may contain supplementary information in addition to that contained in the paper chart (e.g. sailing directions) which may be considered necessary for safe navigation.
3.3 System Electronic Navigational Chart (SENC) means a database, in the manufacturer�s
internal ECDIS format, resulting from the lossless transformation of the entire ENC contents and its updates. It is this database that is accessed by ECDIS for the display generation and other navigational functions, and is equivalent to an up-to-date paper chart. The SENC may also contain information added by the mariner and information from other sources.
3.4 Standard Display is the display mode intended to be used as a minimum during route
planning and route monitoring. The chart content is listed in appendix 2. 3.5 Display Base means the chart content as listed in appendix 2 and which cannot be
removed from the display. It is not intended to be sufficient for safe navigation. 3.6 Further information on ECDIS definitions may be found in IHO Hydrographic Dictionary
Special Publication S-32 (see appendix 1).
* Refer to Publication IEC 60945. 1 MSC/Circ.982.
RESOLUTION MSC.232(82)Page 4 MODULE A - DATABASE 4 PROVISION AND UPDATING OF CHART INFORMATION 4.1 The chart information to be used in ECDIS should be the latest edition, as corrected by
official updates, of that issued by or on the authority of a Government, government-authorized Hydrographic Office or other relevant government institution, and conform to IHO standards2.
4.2 The contents of the SENC should be adequate and up-to-date for the intended voyage to
comply with regulation V/27 of the 1974 SOLAS Convention as amended. 4.3 It should not be possible to alter the contents of the ENC or SENC information
transformed from the ENC. 4.4 Updates should be stored separately from the ENC. 4.5 ECDIS should be capable of accepting official updates to the ENC data provided in
conformity with IHO standards. These updates should be automatically applied to the SENC. By whatever means updates are received, the implementation procedure should not interfere with the display in use.
4.6 ECDIS should also be capable of accepting updates to the ENC data entered manually
with simple means for verification prior to the final acceptance of the data. They should be distinguishable on the display from ENC information and its official updates and not affect display legibility.
4.7 ECDIS should keep and display on demand a record of updates including time of
application to the SENC. This record should include updates for each ENC until it is superseded by a new edition.
4.8 ECDIS should allow the mariner to display updates in order to review their contents and
to ascertain that they have been included in the SENC. 4.9 ECDIS should be capable of accepting both non-encrypted ENCs and ENCs encrypted in
accordance with the IHO Data Protection Scheme3.
2 IHO Special Publication S-52 and S-57 (see appendix 1). 3 IHO Special Publication S-63 (see appendix 1).

RESOLUTION MSC.232(82)Page 5
MODULE B � OPERATIONAL AND FUNCTIONAL REQUIREMENTS 5 DISPLAY OF SENC INFORMATION 5.1 ECDIS should be capable of displaying all SENC information. An ECDIS should be
capable of accepting and converting an ENC and its updates into a SENC. The ECDIS may also be capable of accepting a SENC resulting from conversion of ENC to SENC ashore, in accordance with IHO TR 3.114. This method of ENC supply is known as SENC delivery.
5.2 SENC information available for display during route planning and route monitoring
should be subdivided into the following three categories, Display Base, Standard Display and All Other Information (see appendix 2).
5.3 ECDIS should present the Standard Display at any time by a single operator action. 5.4 When an ECDIS is switched on following a switch off or power failure, it should return
to the most recent manually selected settings for display. 5.5 It should be easy to add or remove information from the ECDIS display. It should not be
possible to remove information contained in the Display Base. 5.6 For any operator identified geographical position (e.g. by cursor picking) ECDIS should
display on demand the information about the chart objects associated with such a position.
5.7 It should be possible to change the display scale by appropriate steps e.g. by means of
either chart scale values or ranges in nautical miles. 5.8 It should be possible for the mariner to select a safety contour from the depth contours
provided by the SENC. ECDIS should emphasize the safety contour over other contours on the display, however:
.1 if the mariner does not specify a safety contour, this should default to 30m. If the
safety contour specified by the mariner or the default 30 m contour is not in the displayed SENC, the safety contour shown should default to the next deeper contour;
.2 if the safety contour in use becomes unavailable due to a change in source data,
the safety contour should default to the next deeper contour; and
.3 in each of the above cases, an indication should be provided. 5.9 It should be possible for the mariner to select a safety depth. ECDIS should emphasize
soundings equal to or less than the safety depth whenever spot soundings are selected for display.
5.10 The ENC and all updates to it should be displayed without any degradation of their
information content.
4 IHO Miscellaneous Publication M-3.
RESOLUTION MSC.232(82)Page 6 5.11 ECDIS should provide a means to ensure that the ENC and all updates to it have been
correctly loaded into the SENC. 5.12 The ENC data and updates to it should be clearly distinguishable from other displayed
information, including those listed in appendix 3. 6 SCALE 6.1 ECDIS should provide an indication if:
.1 the information is displayed at a larger scale than that contained in the ENC; or .2 own ship�s position is covered by an ENC at a larger scale than that provided by
the display. 7 DISPLAY OF OTHER NAVIGATIONAL INFORMATION 7.1 Radar information and/or AIS information may be transferred from systems compliant
with the relevant standards of the Organization. Other navigational information may be added to the ECDIS display. However, it should not degrade the displayed SENC information and it should be clearly distinguishable from the SENC information.
7.2 It should be possible to remove the radar information, AIS information and other
navigational information by single operator action. 7.3 ECDIS and added navigational information should use a common reference system. If
this is not the case, an indication should be provided. 7.4 Radar 7.4.1 Transferred radar information may contain a radar image and/or tracked target
information. 7.4.2 If the radar image is added to the ECDIS display, the chart and the radar image should
match in scale, projection and in orientation. 7.4.3 The radar image and the position from the position sensor should both be adjusted
automatically for antenna offset from the conning position. 8 DISPLAY MODE AND GENERATION OF THE NEIGHBOURING AREA 8.1 It should always be possible to display the SENC information in a �north-up� orientation.
Other orientations are permitted. When such orientations are displayed, the orientation should be altered in steps large enough to avoid unstable display of the chart information.
8.2 ECDIS should provide for true motion mode. Other modes are permitted. 8.3 When true motion mode is in use, reset and generation of the chart display of the
neighbouring area should take place automatically at own ship's distance from the edge of the display as determined by the mariner.

RESOLUTION MSC.232(82)Page 7
8.4 It should be possible to manually change the displayed chart area and the position of own
ship relative to the edge of the display.
8.5 If the area covered by the ECDIS display includes waters for which no ENC at a scale
appropriate for navigation is available, the areas representing those waters should carry an indication (see appendix 5) to the mariner to refer to the paper chart or to the RCDS mode of operation (see appendix 7).
9 COLOURS AND SYMBOLS 9.1 IHO recommended colours and symbols should be used to represent SENC information5. 9.2 The colours and symbols other than those mentioned in 9.1 should comply with the
applicable requirements contained in the IMO standards for navigational symbols6. 9.3 SENC information displayed at the scale specified in the ENC should use the specified
size of symbols, figures and letters5.
9.4 ECDIS should allow the mariner to select whether own ship is displayed in true scale or as a symbol.
10 DISPLAY REQUIREMENTS 10.1 ECDIS should be capable of displaying information for:
.1 route planning and supplementary navigation tasks; and .2 route monitoring.
10.2 The effective size of the chart presentation for route monitoring should be at
least 270 mm x 270 mm. 10.3 The display should be capable of meeting colour and resolution recommendations of
IHO5. 10.4 The method of presentation should ensure that the displayed information is clearly visible
to more than one observer in the conditions of light normally experienced on the bridge of the ship by day and by night.
10.5 If information categories included in the Standard Display (See appendix 2) are removed
to customize the display, this should be permanently indicated. Identification of categories which are removed from the Standard Display should be shown on demand.
5 Special Publication S-52, Appendix 2 (see appendix 1)

RESOLUTION MSC.232(82)Page 8 11 ROUTE PLANNING, MONITORING AND VOYAGE RECORDING 11.1 It should be possible to carry out route planning and route monitoring in a simple and
reliable manner. 11.2 The largest scale data available in the SENC for the area given should always be used by
the ECDIS for all alarms or indications of crossing the ship's safety contour and of entering a prohibited area, and for alarms and indications according to appendix 5.
11.3 Route Planning 11.3.1 It should be possible to carry out route planning including both straight and curved
segments. 11.3.2 It should be possible to adjust a planned route alphanumerically and graphically
including:
.1 adding waypoints to a route;
.2 deleting waypoints from a route; and
.3 changing the position of a waypoint. 11.3.3 It should be possible to plan one or more alternative routes in addition to the selected route. The selected route should be clearly distinguishable from the other routes. 11.3.4 An indication is required if the mariner plans a route across an own ship's safety contour. 11.3.5 An indication should be given if the mariner plans a route closer than a user-specified distance from the boundary of a prohibited area or a geographic area for which special conditions exist (see appendix 4).An indication should also be given if the mariner plans a route closer than a user-specified distance from a point object, such as a fixed or floating aid to navigation or isolated danger. 11.3.6 It should be possible for the mariner to specify a cross track limit of deviation from the
planned route at which an automatic off-track alarm should be activated. 11.4 Route monitoring 11.4.1 For route monitoring the selected route and own ship's position should appear whenever
the display covers that area. 11.4.2 It should be possible to display a sea area that does not have the ship on the display (e.g.
for look ahead, route planning), while route monitoring. If this is done on the display used for route monitoring, the automatic route monitoring functions (e.g. updating ship�s position, and providing alarms and indications) should be continuous. It should be possible to return to the route monitoring display covering own ship's position immediately by single operator action.
11.4.3 ECDIS should give an alarm if, within a specified time set by the mariner, own ship will
cross the safety contour.
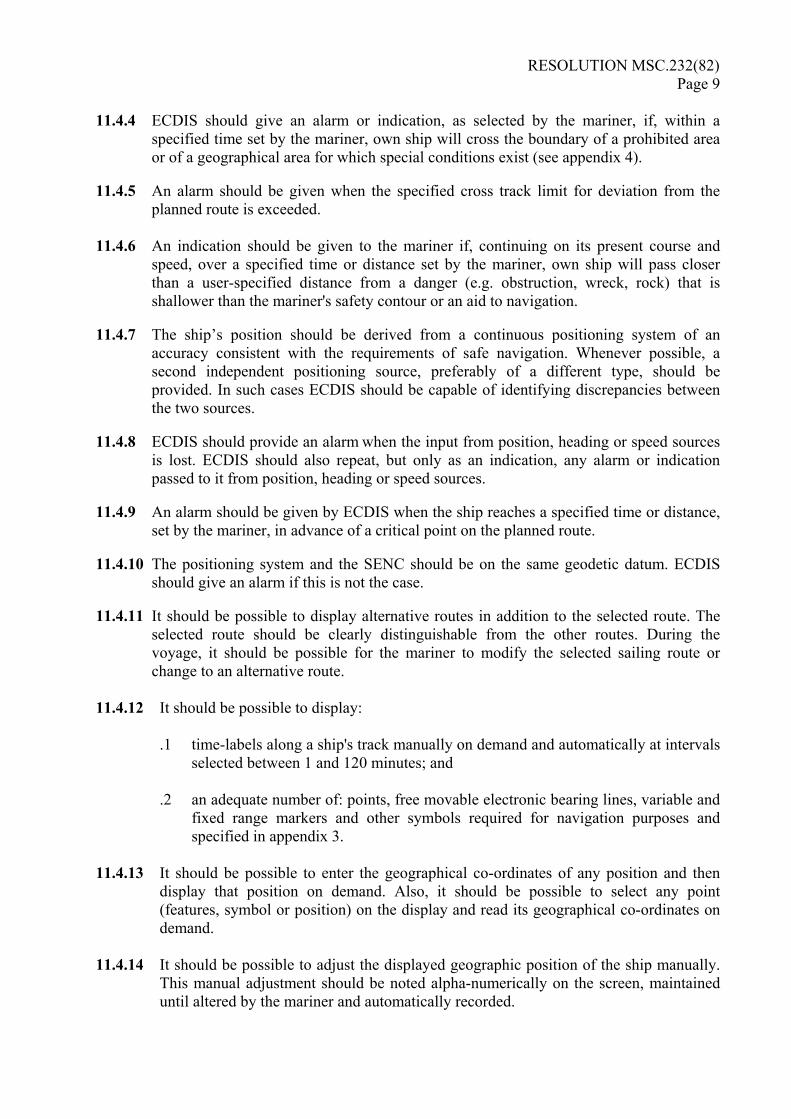
RESOLUTION MSC.232(82)Page 9
11.4.4 ECDIS should give an alarm or indication, as selected by the mariner, if, within a
specified time set by the mariner, own ship will cross the boundary of a prohibited area or of a geographical area for which special conditions exist (see appendix 4).
11.4.5 An alarm should be given when the specified cross track limit for deviation from the
planned route is exceeded.
11.4.6 An indication should be given to the mariner if, continuing on its present course and speed, over a specified time or distance set by the mariner, own ship will pass closer than a user-specified distance from a danger (e.g. obstruction, wreck, rock) that is shallower than the mariner's safety contour or an aid to navigation.
11.4.7 The ship�s position should be derived from a continuous positioning system of an
accuracy consistent with the requirements of safe navigation. Whenever possible, a second independent positioning source, preferably of a different type, should be provided. In such cases ECDIS should be capable of identifying discrepancies between the two sources.
11.4.8 ECDIS should provide an alarm when the input from position, heading or speed sources
is lost. ECDIS should also repeat, but only as an indication, any alarm or indication passed to it from position, heading or speed sources.
11.4.9 An alarm should be given by ECDIS when the ship reaches a specified time or distance,
set by the mariner, in advance of a critical point on the planned route. 11.4.10 The positioning system and the SENC should be on the same geodetic datum. ECDIS
should give an alarm if this is not the case. 11.4.11 It should be possible to display alternative routes in addition to the selected route. The
selected route should be clearly distinguishable from the other routes. During the voyage, it should be possible for the mariner to modify the selected sailing route or change to an alternative route.
11.4.12 It should be possible to display:
.1 time-labels along a ship's track manually on demand and automatically at intervals selected between 1 and 120 minutes; and
.2 an adequate number of: points, free movable electronic bearing lines, variable and
fixed range markers and other symbols required for navigation purposes and specified in appendix 3.
11.4.13 It should be possible to enter the geographical co-ordinates of any position and then
display that position on demand. Also, it should be possible to select any point (features, symbol or position) on the display and read its geographical co-ordinates on demand.
11.4.14 It should be possible to adjust the displayed geographic position of the ship manually.
This manual adjustment should be noted alpha-numerically on the screen, maintained until altered by the mariner and automatically recorded.
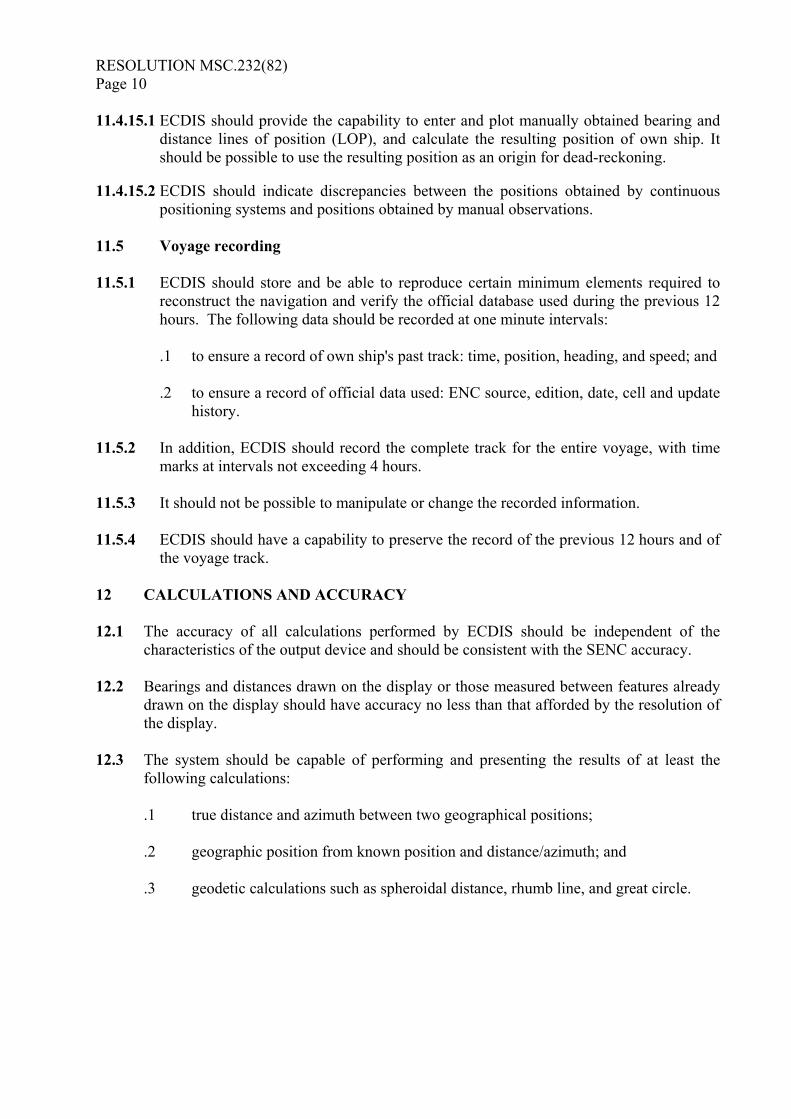
RESOLUTION MSC.232(82)Page 10 11.4.15.1 ECDIS should provide the capability to enter and plot manually obtained bearing and
distance lines of position (LOP), and calculate the resulting position of own ship. It should be possible to use the resulting position as an origin for dead-reckoning.
11.4.15.2 ECDIS should indicate discrepancies between the positions obtained by continuous
positioning systems and positions obtained by manual observations.
11.5 Voyage recording 11.5.1 ECDIS should store and be able to reproduce certain minimum elements required to
reconstruct the navigation and verify the official database used during the previous 12 hours. The following data should be recorded at one minute intervals:
.1 to ensure a record of own ship's past track: time, position, heading, and speed; and
.2 to ensure a record of official data used: ENC source, edition, date, cell and update
history. 11.5.2 In addition, ECDIS should record the complete track for the entire voyage, with time
marks at intervals not exceeding 4 hours. 11.5.3 It should not be possible to manipulate or change the recorded information. 11.5.4 ECDIS should have a capability to preserve the record of the previous 12 hours and of
the voyage track. 12 CALCULATIONS AND ACCURACY 12.1 The accuracy of all calculations performed by ECDIS should be independent of the
characteristics of the output device and should be consistent with the SENC accuracy. 12.2 Bearings and distances drawn on the display or those measured between features already
drawn on the display should have accuracy no less than that afforded by the resolution of the display.
12.3 The system should be capable of performing and presenting the results of at least the
following calculations:
.1 true distance and azimuth between two geographical positions;
.2 geographic position from known position and distance/azimuth; and
.3 geodetic calculations such as spheroidal distance, rhumb line, and great circle.

RESOLUTION MSC.232(82)Page 11
13 PERFORMANCE TESTS, MALFUNCTIONS ALARMS AND INDICATIONS 13.1 ECDIS should be provided with means for either automatically or manually carrying out
on-board tests of major functions. In case of a failure, the test should display information to indicate which module is at fault.
13.2 ECDIS should provide a suitable alarm or indication of system malfunction. 14 BACK-UP ARRANGEMENTS Adequate back-up arrangements should be provided to ensure safe navigation in case of
an ECDIS failure; see appendix 6.
.1 Facilities enabling a safe take-over of the ECDIS functions should be provided in order to ensure that an ECDIS failure does not develop into a critical situation.
.2 A back-up arrangement should provide means of safe navigation for the
remaining part of a voyage in the case of an ECDIS failure. MODULE C � INTERFACING AND INTEGRATION 15 CONNECTIONS WITH OTHER EQUIPMENT 7 15.1 ECDIS should not degrade the performance of any equipment providing sensor inputs.
Nor should the connection of optional equipment degrade the performance of ECDIS below this standard.
15.2 ECDIS should be connected to the ship's position fixing system, to the gyro compass and
to the speed and distance measuring device. For ships not fitted with a gyro compass, ECDIS should be connected to a marine transmitting heading device.
15.3 ECDIS may provide a means to supply SENC information to external equipment. 16 POWER SUPPLY 16.1 It should be possible to operate ECDIS and all equipment necessary for its normal
functioning when supplied by an emergency source of electrical power in accordance with the appropriate requirements of chapter II-1 of the 1974 SOLAS Convention, as amended.
16.2 Changing from one source of power supply to another or any interruption of the supply
for a period of up to 45 seconds should not require the equipment to be manually re-initialized.
7 Publication IEC 61162.
RESOLUTION MSC.232(82)Page 12
Appendix 1
REFERENCE DOCUMENTS
The following international organizations have developed technical standards and specifications, as listed below, for use in conjunction with this standard. The latest edition of these documents should be obtained from the organization concerned: INTERNATIONAL MARITIME ORGANIZATION (IMO)
Address: International Maritime Organization Phone: +44 207 735 76 11 4 Albert Embankment Fax: +44 207 587 32 10 London SE1 7SR E-mail:[email protected] United Kingdom Web: http://www.imo.org
Publications IMO resolution MSC.191(79) on Performance Standards for the presentation of
navigation related information on shipborne navigational displays
IMO resolution A.694(17) on Recommendations on general requirements for shipborne radio equipment forming part of the Global Maritime Distress and Safety System (GMDSS) and for electronic navigational aids
SN.Circ/207 (1999) on Differences between RCDS and ECDIS
IMO SN/Circ.243 (2004) on Guidelines for the Presentation of Navigation-related Symbols, Terms and Abbreviations
IMO MSC/Circ.982 (2000) on Guidelines on ergonomic criteria for bridge equipment and layout
INTERNATIONAL HYDROGRAPHIC ORGANIZATION (IHO)
Address: Directing Committee Phone: +377 93 10 81 00 International Hydrographic Bureau Fax: +377 93 10 81 40 BP 445 E-mail:[email protected] MC 98011 Monaco Cedex Web: http://www.iho.shom.fr Principality of Monaco

RESOLUTION MSC.232(82)Page 13
Publications
Special Publication No. S-52, Specifications for Chart Content and Display Aspects of ECDIS
Special Publication No. S-52 appendix 1, Guidance on Updating the Electronic Navigational Chart
Special Publication No. S-52 appendix 2, Colour and Symbol Specifications for ECDIS
Special Publication No. S-32, Hydrographic Dictionary Special Publication No. S-57, IHO Transfer Standard for Digital Hydrographic Data Special Publication No. S-61, IHO Product specification for Raster Navigational Charts (RNC) Special Publication No. S-63, IHO Data Protection Scheme Miscellaneous Publication No. M-3, Resolutions of the IHO
INTERNATIONAL ELECTROTECHNICAL COMMISSION (IEC)
Address: IEC Central Office Phone: +41 22 734 01 50 3 rue de Varembé Fax: +41 22 733 38 43 PO Box 131 CH-1211 Geneva 20 Switzerland
Publications
IEC Publication 61174, Electronic Chart Display and Information Systems (ECDIS) - Operational and Performance Requirements, Method of Testing and Required Test Results.
IEC Publication 60945, General Requirements for Shipborne Radio Equipment Forming Part of the Global Maritime Distress and Safety System and Marine Navigational Equipment. IEC Publication 61162, Digital Interfaces - Navigation and Radiocommunication Equipment On board Ship. [IEC Publication 62288, Maritime Navigation and Radiocommunication Equipment and Systems � Presentation of navigation related information � General requirements, methods of test and required test results.]

RESOLUTION MSC.232(82)Page 14
Appendix 2
SENC INFORMATION AVAILABLE FOR DISPLAY DURING ROUTE PLANNING AND ROUTE MONITORING
1 Display base to be permanently shown on the ECDIS display, consisting of:
.1 coastline (high water);
.2 own ship's safety contour;
.3 isolated underwater dangers of depths less than the safety contour which lie within the safe waters defined by the safety contour;
.4 isolated dangers which lie within the safe water defined by the safety contour, such as fixed structures, overhead wires, etc.;
.5 scale, range and north arrow;
.6 units of depth and height; and
.7 display mode.
2 Standard display consisting of:
.1 display base
.2 drying line
.3 buoys, beacons, other aids to navigation and fixed structures
.4 boundaries of fairways, channels, etc.
.5 visual and radar conspicuous features
.6 prohibited and restricted areas
.7 chart scale boundaries
.8 indication of cautionary notes
.9 ships� routeing systems and ferry routes
.10 archipelagic sea lanes.
3 All other information, to be displayed individually on demand, for example:
.1 spot soundings .2 submarine cables and pipelines .3 details of all isolated dangers .4 details of aids to navigation .5 contents of cautionary notes .6 ENC edition date .7 most recent chart update number .8 magnetic variation .9 graticule .10 place names.

RESOLUTION MSC.232(82)Page 15
Appendix 3
NAVIGATIONAL ELEMENTS AND PARAMETERS
1 Own ship.
.1 Past track with time marks for primary track.
.2 Past track with time marks for secondary track. 2 Vector for course and speed made good. 3 Variable range marker and/or electronic bearing line. 4 Cursor. 5 Event.
.1 Dead reckoning position and time (DR).
.2 Estimated position and time (EP). 6 Fix and time. 7 Position line and time. 8 Transferred position line and time.
.1 Predicted tidal stream or current vector with effective time and strength.
.2 Measured tidal stream or current vector with effective time and strength. 9 Danger highlight. 10 Clearing line. 11 Planned course and speed to make good. 12 Waypoint. 13 Distance to run. 14 Planned position with date and time. 15 Visual limits of lights arc to show rising/dipping range. 16 Position and time of �wheel over�.

RESOLUTION MSC.232(82)Page 16
Appendix 4
AREAS FOR WHICH SPECIAL CONDITIONS EXIST
The following are the areas which ECDIS should detect and provide an alarm or indication under sections 11.3.5 and 11.4.4:
Traffic separation zone Inshore traffic zone Restricted area Caution area Offshore production area Areas to be avoided User defined areas to be avoided Military practise area Seaplane landing area Submarine transit lane Anchorage area Marine farm/aquaculture PSSA (Particularly Sensitive Sea Area)
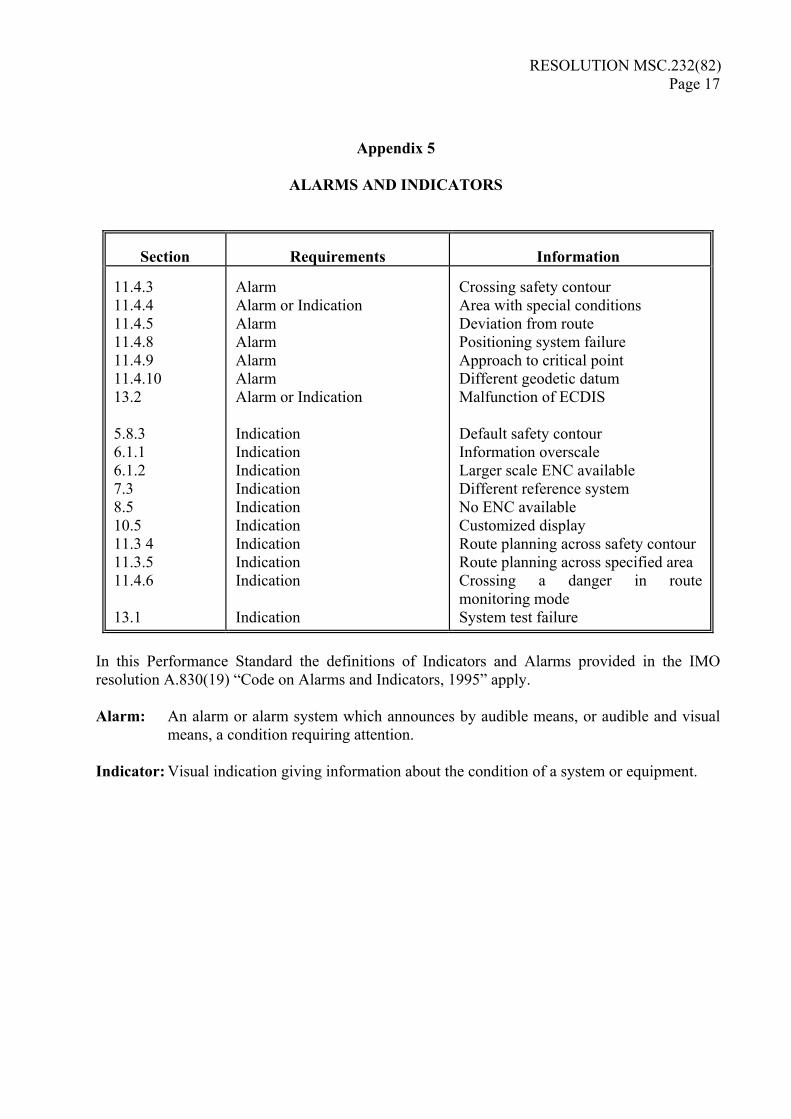
RESOLUTION MSC.232(82)Page 17
Appendix 5 ALARMS AND INDICATORS
Section
Requirements
Information
11.4.3 11.4.4 11.4.5 11.4.8 11.4.9 11.4.10 13.2 5.8.3 6.1.1 6.1.2 7.3 8.5 10.5 11.3 4 11.3.5 11.4.6 13.1
Alarm Alarm or Indication Alarm Alarm Alarm Alarm Alarm or Indication Indication Indication Indication Indication Indication Indication Indication Indication Indication Indication
Crossing safety contour Area with special conditions Deviation from route Positioning system failure Approach to critical point Different geodetic datum Malfunction of ECDIS Default safety contour Information overscale Larger scale ENC available Different reference system No ENC available Customized display Route planning across safety contour Route planning across specified area Crossing a danger in route monitoring mode System test failure
In this Performance Standard the definitions of Indicators and Alarms provided in the IMO resolution A.830(19) �Code on Alarms and Indicators, 1995� apply. Alarm: An alarm or alarm system which announces by audible means, or audible and visual
means, a condition requiring attention. Indicator: Visual indication giving information about the condition of a system or equipment.

RESOLUTION MSC.232(82)Page 18
Appendix 6
BACK-UP REQUIREMENTS 1 INTRODUCTION
As prescribed in section 14 of this performance standard, adequate independent back-up arrangements should be provided to ensure safe navigation in case of ECDIS failure. Such arrangements include:
.1 facilities enabling a safe take-over of the ECDIS functions in order to ensure that an ECDIS failure does not result in a critical situation;
.2 a means to provide for safe navigation for the remaining part of the voyage in case
of ECDIS failure. 2 PURPOSE
The purpose of an ECDIS back-up system is to ensure that safe navigation is not compromised in the event of ECDIS failure. This should include a timely transfer to the back-up system during critical navigation situations. The back-up system shall allow the vessel to be navigated safely until the termination of the voyage. 3 FUNCTIONAL REQUIREMENTS 3.1 Required functions and their availability 3.1.1 Presentation of chart information The back-up system should display in graphical (chart) form the relevant information of the hydrographic and geographic environment which are necessary for safe navigation. 3.1.2 Route planning The back-up system should be capable of performing the route planning functions, including:
.1 taking over of the route plan originally performed on the ECDIS;
.2 adjusting a planned route manually or by transfer from a route planning device. 3.1.3 Route monitoring The back-up system should enable a take-over of the route monitoring originally performed by the ECDIS, and provide at least the following functions:
.1 plotting own ship�s position automatically, or manually on a chart;
.2 taking courses, distances and bearings from the chart;
.3 displaying the planned route;
RESOLUTION MSC.232(82)Page 19
.4 displaying time labels along ship�s track;
.5 plotting an adequate number of points, bearing lines, range markers, etc., on the
chart. 3.1.4 Display information If the back-up is an electronic device, it should be capable of displaying at least the information equivalent to the standard display as defined in this performance standard. 3.1.5 Provision of chart information
.1 The chart information to be used in the backup arrangement should be the latest edition, as corrected by official updates, of that issued by or on the authority of a Government, authorized Hydrographic Office or other relevant government institution, and conform to IHO standards.
.2 It should not be possible to alter the contents of the electronic chart information.
.3 The chart or chart data edition and issuing date should be indicated.
3.1.6 Updating The information displayed by the ECDIS back-up arrangements should be up-to-date for the entire voyage. 3.1.7 Scale
If an electronic device is used, it should provide an indication:
.1 if the information is displayed at a larger scale than that contained in the database; and
.2 if own ship�s position is covered by a chart at a larger scale than that provided by
the system. 3.1.8 If radar and other navigational information are added to an electronic back-up display, all
the corresponding requirements for radar information and other navigation information of this performance standard should be met.
3.1.9 If an electronic device is used, the display mode and generation of the neighbouring area
should be in accordance with section 8 of this performance standard. 3.1.10 Voyage recording The back-up arrangements should be able to keep a record of the ship�s actual track, including positions and corresponding times.

RESOLUTION MSC.232(82)Page 20 3.2 Reliability and accuracy 3.2.1 Reliability The back-up arrangements should provide reliable operation under prevailing environmental and normal operating conditions. 3.2.2 Accuracy Accuracy should be in accordance with section 12 of this performance standard. 3.3 Malfunctions, warnings, alarms and indications If an electronic device is used, it should provide a suitable alarm or indication of system malfunction. 4 OPERATIONAL REQUIREMENTS 4.1 Ergonomics If an electronic device is used, it should be designed in accordance with the ergonomic principles of ECDIS. 4.2 Presentation of information If an electronic device is used:
.1 Colours and symbols should be in accordance with the colours and symbols requirements of ECDIS.
.2 The effective size of the chart presentation should be not less than 250 mm x 250 mm
or 250 mm diameter. 5 POWER SUPPLY
If an electronic device is used:
.1 the back-up power supply should be separate from the ECDIS; and
.2 conform to the requirements in this ECDIS performance standard. 6 CONNECTIONS WITH OTHER EQUIPMENT 6.1 If an electronic device is used, it should:
.1 be connected to systems providing continuous position-fixing capability; and
.2 not degrade the performance of any equipment providing sensor input. 6.2 If radar with selected parts of the ENC chart information overlay is used as an element of
the back-up, the radar should comply with resolution MSC.192(79).

RESOLUTION MSC.232(82)Page 21
Appendix 7
RCDS MODE OF OPERATION
Whenever in this appendix reference is made to any provisions of the annex related to ECDIS, the term ECDIS should be substituted by the term RCDS, SENC by SRNC and ENC by RNC, as appropriate. This appendix refers to each paragraph of the performance standards for ECDIS (i.e. the Annex to which this part is appendix 7) and specifies which paragraphs of the Annex either: .1 apply to RCDS; or .2 do not apply to RCDS; or .3 are modified or replaced as shown in order to apply to RCDS. Any additional requirements applicable to RCDS are also described. 1 SCOPE 1.1 Paragraph applies to RCDS. 1.2 When operating in RCDS-mode, an appropriate portfolio of up-to-date paper
charts (APC) should be carried on board and be readily available to the mariner. 1.3 - 1.7 Paragraphs apply to RCDS. 1.8 RCDS should provide appropriate alarms or indications with respect to the
information displayed or malfunction of the equipment (see Table 1 of this appendix).
1.9 Refers to Appendix 7 and applies to RCDS. 2 APPLICATION OF THESE STANDARDS 2.1 � 2.4 Paragraphs apply to RCDS. 3 DEFINITIONS 3.1 Raster Chart Display System (RCDS) means a navigation information system
displaying RNCs with positional information from navigation sensors to assist the mariner in route planning and route monitoring, and if required, display additional navigation-related information.
3.2 Raster Navigational Chart (RNC) means a facsimile of a paper chart originated
by, or distributed on the authority of, a government-authorized hydrographic office. RNC is used in these standards to mean either a single chart or a collection of charts.
RESOLUTION MSC.232(82)Page 22 3.3 System Raster Navigational Chart Database (SRNC) means a database resulting
from the transformation of the RNC by the RCDS to include updates to the RNC by appropriate means.
3.4-3.5 Paragraphs do not apply to RCDS. 3.6 Paragraph applies to RCDS. 3.7 Appropriate Portfolio of up to date paper Charts (APC) means a suite of paper
charts of a scale to show sufficient detail of topography, depths, navigational hazards, aids to navigation, charted routes, and routeing measures to provide the mariner with information on the overall navigational environment. The APC should provide adequate look-ahead capability. Coastal States will provide details of the charts which meet the requirement of this portfolio, and these details are included in a worldwide database maintained by the IHO. Consideration should be given to the details contained in this database when determining the content of the APC.
MODULE A - DATABASE 4 PROVISION AND UPDATING OF CHART INFORMATION 4.1 The RNC used in RCDS should be the latest edition of that originated by, or
distributed on the authority of, a government authorized hydrographic office and conform to IHO standards. RNCs not on WGS 84 or PE-90 should carry meta-data (i.e., additional data) to allow geo-referenced positional data to be displayed in the correct relationship to SRNC data.
4.2 The contents of the SRNC should be adequate and up-to-date for that part of the
intended voyage not covered by ENC. 4.3 It should not be possible to alter the contents of the RNC. 4.4 � 4.8 All paragraphs apply to RCDS. 4.9 Paragraph does not apply to RCDS MODULE B � OPERATIONAL AND FUNCTIONAL REQUIREMENTS 5 DISPLAY OF SRNC INFORMATION 5.1 RCDS should be capable of displaying all SRNC information. 5.2 SRNC information available for display during route planning and route
monitoring should be subdivided into two categories:
.1 the RCDS standard display consisting of RNC and its updates, including its scale, the scale at which it is displayed, its horizontal datum, and its units of depths and heights; and
.2 any other information such as mariner�s notes.
RESOLUTION MSC.232(82)Page 23
5.3- 5.4 Paragraphs apply to RCDS. 5.5 It should be easy to add to, or remove from; the RCDS display any information
additional to the RNC data, such as mariner's notes. It should not be possible to remove any information from the RNC.
5.6 � 5.9 Paragraphs do not apply to RCDS. 5.10 � 5.12 Paragraphs apply to RCDS. 5.13 There should always be an indication if the ECDIS equipment is operating in
RCDS mode. 6 SCALE This section applies to RCDS. 7 DISPLAY OF OTHER NAVIGATIONAL INFORMATION 7.1 - 7.4 All paragraphs apply to RCDS. 8 DISPLAY MODE AND GENERATION OF THE NEIGHBOURING AREA 8.1 It should always be possible to display the SRNC in �chart-up� orientation. Other
orientations are permitted. 8.2 - 8.4 All paragraphs apply to RCDS. 8.5 Paragraph refers to RCDS mode of operation. 9 COLOURS AND SYMBOLS 9.1 IHO recommended colours and symbols should be used to represent SRNC
information. 9.2 Paragraph applies to RCDS. 9.3 Paragraph does not apply to RCDS. 9.4 Paragraph applies to RCDS. 10 DISPLAY REQUIREMENTS 10.1-10.2 Paragraphs apply to RCDS. 10.3 Paragraph does not apply to RCDS.
RESOLUTION MSC.232(82)Page 24 10.4 Paragraph applies to RCDS. 10.5 Paragraph does not apply to RCDS. 10.6 RCDS should be capable of displaying, simply and quickly, chart notes which are
not located on the portion of the chart currently being displayed. 11 ROUTE PLANNING, MONITORING AND VOYAGE RECORDING 11.1 Paragraphs apply to RCDS. 11.2 Paragraph does not apply to RCDS. 11.3 Route Planning 11.3.1-11.3.3 Paragraphs apply to RCDS. 11.3.4-11.3.5 Paragraphs do not apply to RCDS. 11.3.6 Paragraph applies to RCDS. 11.3.7 It should be possible for the mariner to enter points, lines and areas which activate
an automatic alarm. The display of these features should not degrade the SRNC information and it should be clearly distinguishable from the SRNC information.
11.4 Route monitoring 11.4.1 Paragraph applies to RCDS. 11.4.2 It should be possible to display a sea area that does not have the ship on the
display (e.g. for look ahead, route planning), while route monitoring. If this is done on the display used for route monitoring, the automatic route monitoring functions in 10.4.6 and 10.4.7 should be continuous. It should be possible to return to the route monitoring display covering own ship's position immediately by single operator action.
11.4.3-11.4.4 Paragraphs do not apply to RCDS. 11.4.5 Paragraph apply to RCDS. 11.4.6 Paragraphs do not apply to RCDS. 11.4.7-11.4.9 Paragraphs apply to RCDS. 11.4.10 The RCDS should only accept positional data referenced to the WGS 84 or PE-90
geodetic datum. RCDS should give an alarm if the positional data is not referenced to one of these datum. If the displayed RNC cannot be referenced to the WGS 84 or PE-90 datum then a continuous indication should be provided.

RESOLUTION MSC.232(82)Page 25
11.4.11-11.4.15 Paragraphs apply to RCDS. 11.4.16 RCDS should allow the user to manually align the SRNC with positional data.
This can be necessary, for example, to compensate for local charting errors. 11.4.17 It should be possible to activate an automatic alarm when the ship crosses a point,
line, or is within the boundary of a mariner entered feature within a specified time or distance.
11.5 Voyage recording 11.5.1-11.5.4 All paragraphs apply to RCDS. 12 CALCULATIONS AND ACCURACY
12.1-12.3 All paragraphs apply to RCDS. 12.4 RCDS should be capable of performing transformations between a local datum
and WGS 84 Datum. 13 PERFORMANCE TESTS, MALFUNCTION ALARMS AND INDICATIONS 13.1-13.2 All paragraphs apply to RCDS. 14 BACK-UP ARRANGEMENTS All paragraphs apply to RCDS. MODULE C � INTERFACING AND INTEGRATION 15 CONNECTIONS WITH OTHER EQUIPMENT 15.1-15.3 All paragraphs apply to RCDS. 16 POWER SUPPLY 16.1-16.2 All paragraphs apply to RCDS.
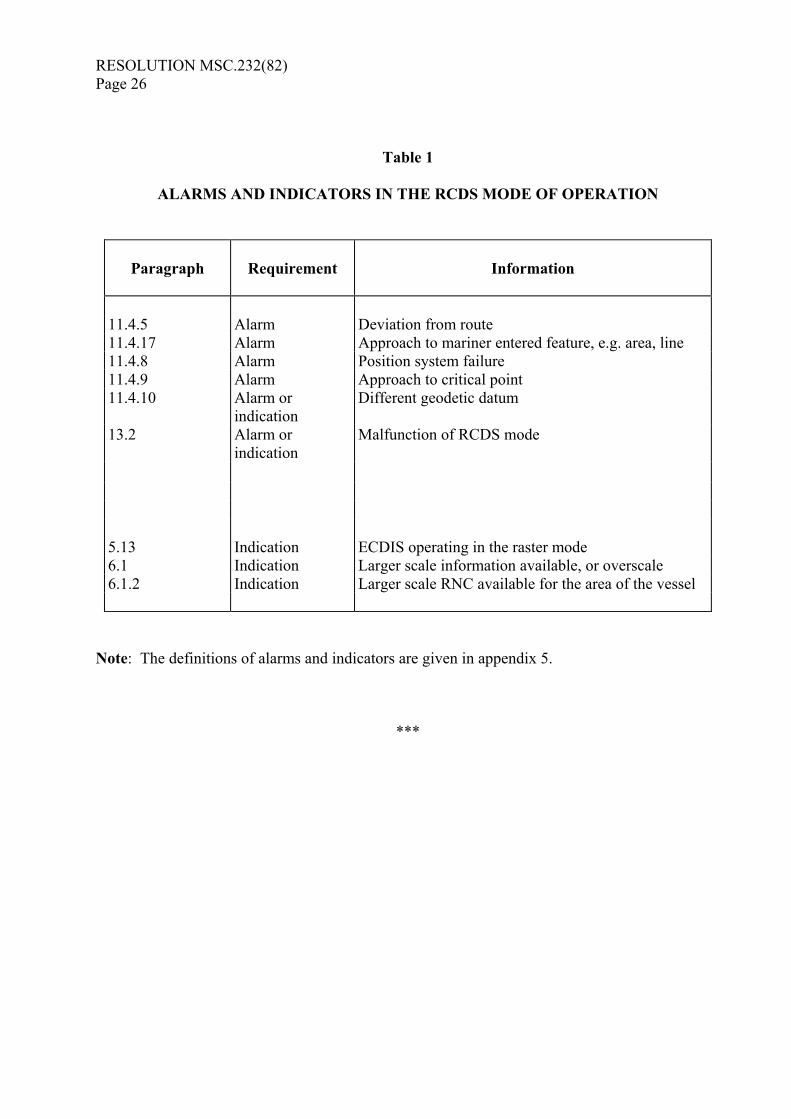
RESOLUTION MSC.232(82)Page 26
Table 1
ALARMS AND INDICATORS IN THE RCDS MODE OF OPERATION
Paragraph
Requirement
Information
11.4.5
Alarm
Deviation from route
11.4.17 Alarm Approach to mariner entered feature, e.g. area, line 11.4.8 Alarm Position system failure 11.4.9 Alarm Approach to critical point 11.4.10 Alarm or
indication Different geodetic datum
13.2 Alarm or indication
Malfunction of RCDS mode
5.13
Indication
ECDIS operating in the raster mode
6.1 Indication Larger scale information available, or overscale 6.1.2 Indication Larger scale RNC available for the area of the vessel
Note: The definitions of alarms and indicators are given in appendix 5.
***

I:\CIRC\SN\01\276.doc
INTERNATIONAL MARITIME ORGANIZATION 4 ALBERT EMBANKMENT LONDON SE1 7SR Telephone: 020 7735 7611 Fax: 020 7587 3210
IMO
E
Ref. T2-OSS/2.7.1 SN.1/Circ.276 10 December 2008
TRANSITIONING FROM PAPER CHART TO ELECTRONIC CHART DISPLAY AND INFORMATION SYSTEMS (ECDIS) NAVIGATION
1 The Sub-Committee on Safety of Navigation (NAV), at its fifty-fourth session (30 June to 4 July 2008), while developing draft carriage requirements for ECDIS, recognizing that proper training will be an important factor in the successful implementation of an ECDIS carriage requirement; and, notwithstanding the expectation that the current review of the STCW Convention and STCW Code, due for completion in 2010, will fully take into account the human element and training requirements necessary for a smooth transition from the use of paper charts to ECDIS, agreed that Administrations, seafarers, shipowners and operators, maritime training organizations and ECDIS equipment manufacturers would all benefit from corresponding guidance transitioning from paper chart to ECDIS navigation, whenever ships are first equipped with ECDIS, regardless of whether or not it is part of a mandatory carriage requirement. 2 The NAV Sub-Committee therefore developed Guidance on transitioning from paper chart to Electronic Chart Display and Information Systems (ECDIS) navigation, as set out in the annex. 3 The Maritime Safety Committee, at its eighty-fifth session (26 November to 5 December 2008), concurred with the Sub-Committee’s views, approved the Guidance on transitioning from paper chart to Electronic Chart Display and Information Systems (ECDIS) navigation, as set out in the annex and encouraged their use by the relevant authorities. 4 Contracting Governments and international organizations are invited to bring the annexed Guidance to the attention of all concerned.
***


SN.1/Circ.276
I:\CIRC\SN\01\276.doc
ANNEX GUIDANCE ON TRANSITIONING FROM PAPER CHART TO ECDIS NAVIGATION
Introduction 1 The following guidance and information is provided to assist those involved with the transition from paper chart to ECDIS navigation. Transition and training 2 As an initial step, shipowners and operators should undertake an assessment of the issues involved in changing from paper chart to ECDIS navigation. Ships’ crews should participate in any such assessment so as to capture any practical concerns or needs of those that would be required to use ECDIS. Such a process will help facilitate an early understanding of any issues to be addressed and will aid ships’ crews prepare for change. 3 Documenting the assessment of issues, combined with the development of ECDIS standard operating procedures, will help lead to the adoption of robust ECDIS navigation practices, simplification of crew training and facilitate smooth handovers between crews. 4 In addition, shipowners and operators should ensure that their ships’ crews are provided with a comprehensive familiarization programme* and type-specific training; and that the ships’ crew fully understand that the use of electronic charts aboard ship continues to require the need for passage planning. IHO catalogue of chart coverage 5 The International Hydrographic Organization (IHO) provides an online chart catalogue that details the coverage of Electronic Navigational Charts (ENC) and Raster Navigational Charts (RNC) (where they exist and where there is not yet ENC coverage) together with references to coastal State guidance on any requirements for paper charts (where this has been provided). The catalogue also provides links to IHO Member States’ websites where additional information may be found. The IHO online chart catalogue can be accessed from the IHO website at: www.iho.int. Additional information 6 In addition to national and international rules, regulations, the IMO model course and performance standards, the IHO has published an online publication Facts about electronic charts and carriage requirements. It is a recommended source of information on ECDIS hardware, training and the technical aspects of electronic chart data. Copies are available free of charge from various sources including: www.iho.int and http://www.ic-enc.org/page_news_articles2.asp?id=12.
* IMO Model Course 1.27 on Operational Use of Electronic Chart Display and Information Systems (ECDIS).

SN.1/Circ.276 ANNEX Page 2
I:\CIRC\SN\01\276.doc
7 Another useful source of information on ECDIS is The Electronic Chart, 2nd edition, by Hecht, Berking, Büttgenbach, Jonas and Alexander (2006). This book describes the basic components, functionality and capabilities and limitations of ECDIS. The Electronic Chart is published by GITC, The Netherlands, ISBN: 90-806205-7-2 and is available via: www.hydro-international.com. 8 Reference should also be made to other Safety of Navigation Circulars (SN/Circs.) issued by the Organization, in particular, SN/Circ.207/Rev.1 on Differences between RCDS and ECDIS; SN/Circ.213 on Guidance on chart datums and the accuracy of positions on charts; SN/Circ.255 on Additional guidance on chart datums and the accuracy of positions on charts; and SN/Circ.266 on Maintenance of Electronic Chart Display and Information System (ECDIS) software. These and other IMO guidance material can be downloaded from the IMO website, www.imo.org. 9 Shipowners and operators should always refer to their national Administrations for the latest information on ECDIS carriage and use.
__________

I:\CIRC\SN\01\266-Rev-1.doc
E
4 ALBERT EMBANKMENT
LONDON SE1 7SR Telephone: +44 (0)20 7735 7611 Fax: +44 (0)20 7587 3210
Ref. T2-OSS/2.7.1 SN.1/Circ.266/Rev.1 7 December 2010
MAINTENANCE OF ELECTRONIC CHART DISPLAY AND
INFORMATION SYSTEM (ECDIS) SOFTWARE 1 The Sub-Committee on Safety of Navigation (NAV), at its fifty-sixth session (26 to 30 July 2010), reviewed the text of SN.1/Circ.266 and agreed that the text of the original circular should be amended as this was an important issue for ensuring the safety of navigation. 2 The Maritime Safety Committee, at its eighty-eighth session (24 November to 3 December 2010), concurred with the Sub-Committee's views, approved the revised Guidance on the maintenance of Electronic Chart Display and Information System (ECDIS) software, as set out in the annex, and encouraged their use by the relevant authorities. 3 Member Governments are invited to bring the attached revised SN circular to the attention of all concerned for information and in particular to ensure that mariners always have the latest safety-related information available to them.
***


SN.1/Circ.266/Rev.1 Annex, page 1
I:\CIRC\SN\01\266-Rev-1.doc
ANNEX 1 Resolution MSC.282(86), adopted on 5 June 2009, introduced a mandatory carriage requirement for Electronic Chart and Display Systems (ECDIS) to be phased in, according to size and class of ship, between 1 July 2012 and 1 July 2018. ECDIS Performance Standards have been adopted by IMO and in turn refer to the International Hydrographic Organization (IHO) Standards that govern the transfer and presentation of the chart information used in ECDIS. 2 ECDIS in operation comprises hardware, software and data. It is important for the safety of navigation that the application software within the ECDIS works fully in accordance with the Performance Standards and is capable of displaying all the relevant digital information contained within the Electronic Navigational Chart (ENC). 3 ECDIS that is not updated for the latest version of IHO Standards may not meet the chart carriage requirements as set out in SOLAS regulation V/19.2.1.4. 4 For example, in January 2007, Supplement No.1 to the IHO ENC Product Specification1 was introduced in order to include, within the ENC, the then recently introduced IMO requirements for Particularly Sensitive Sea Areas (PSSA), Archipelagic Sea Lanes (ASL) and to cater for any future Safety of Navigation requirements. 5 Any ECDIS which is not upgraded to be compatible with the latest version of the Product Specification or the S-52 Presentation Library2 may be unable to correctly display the latest charted features. Additionally, the appropriate alarms and indications may not be activated even though the features have been included in the ENC. Similarly any ECDIS which is not updated to be fully compliant with the latest version of the S-63 Data Protection Standard may fail to decrypt or to properly authenticate some ENCs, leading to failure to load or install. 6 In 2010, the status of IHO standards affecting ECDIS Equipment is:
IHO ECDIS Standards Current Edition Electronic Navigational Chart (ENC) S-57 Edition 3.1 Presentation Library for ECDIS S-52 PresLib Edition 3.4 ENC Data Protection Scheme S-63 Edition 1.1 Raster Navigational Chart (RNC) (Only if ECDIS software supports RCDS mode)
S-61 Edition 1.0
An up-to-date list of all the relevant IHO standards relating to ECDIS equipment is maintained within the "About ENCs" section of the IHO website (www.iho.int).
1 S-57 Appendix B.1, ENC Product Specification, ed. 3.1. 2 S-52 Appendix 2, Annex A, Presentation Library, ed. 3.4.

SN.1/Circ.266/Rev.1 Page 2
I:\CIRC\SN\01\266-Rev-1.doc
7 The need for safe navigation requires that manufacturers should provide a mechanism to ensure software maintenance arrangements are adequate. This may be achieved through the provision of software version information using a website. Such information should include the IHO Standards which have been implemented. 8 Administrations should inform shipowners and operators that proper ECDIS software maintenance is an important issue and that adequate measures need to be implemented by masters, shipowners and operators in accordance with the International Safety Management (ISM) Code.
___________

© Copyright International Hydrographic Organization [2010]
This work is copyright. Apart from any use permitted in accordance with the Berne Convention for the Protection of Literary and Artistic Works (1886), and except in the circumstances described below, no part may be translated, reproduced by any process, adapted, communicated or commercially exploited without prior written permission from the International Hydrographic Bureau (IHB). Copyright in some of the material in this publication may be owned by another party and permission for the translation and/or reproduction of that material must be obtained from the owner.
This document or partial material from this document may be translated, reproduced or distributed for general information, on no more than a cost recovery basis. Copies may not be sold or distributed for profit or gain without prior written agreement of the IHB and any other copyright holders.
In the event that this document or partial material from this document is reproduced, translated or distributed under the terms described above, the following statements are to be included:
“Material from IHO publication [reference to extract: Title, Edition] is reproduced with the permission of the International Hydrographic Bureau (IHB) (Permission No ……./…) acting for the International Hydrographic Organization (IHO), which does not accept responsibility for the correctness of the material as reproduced: in case of doubt, the IHO’s authentic text shall prevail. The incorporation of material sourced from IHO shall not be construed as constituting an endorsement by IHO of this product.”
“This *document/publication] is a translation of IHO [document/publication] [name]. The IHO has not checked this translation and therefore takes no responsibility for its accuracy. In case of doubt the source version of [name] in [language] should be consulted.”
The IHO Logo or other identifiers shall not be used in any derived product without prior written permission from the IHB.

INTERNATIONAL HYDROGRAPHIC ORGANIZATION
SPECIFICATIONS FOR CHART CONTENT AND DISPLAY ASPECTS OF ECDIS
Edition 6.0, March 2010
Publication S-52
Published by the International Hydrographic Bureau
4 quai Antoine Ier B.P. 445 - MC 98011 MONACO Cedex
Principauté de Monaco Telefax: (377) 93.10.81.40
E-mail: [email protected] Web: www.iho.int

Page intentionally left blank
i
S-52, Edition 6.0 March 2010
CHANGE CONTROL HISTORY SINCE 1996
Amendment Abbreviations: MD Maintenance Document IA Immediate Amendment DA Deferred Amendment
Specifications for Chart Content and Display Aspects of ECDIS
(S-52)
Previous Edition Amendments Applied Resulting Edition
Edition 5.0 (Dec 1996) Mar 1999 " 5th Edition, amended Mar 1999"
" 5th Edition, amended Mar 1999" Dec 2001 " 5th Edition, amended
Mar 1999 & Dec 2001"
" 5th Edition, amended Mar 1999 & Dec 2001"
MD7 + Merging with former S-52
App. 2 (C&S specs) Edition 6.0 (March 2010)
Guidance on Updating the Electronic Navigational Chart (S-52, Appendix 1)
Current Edition Amendments Applied
Edition 3.0 (Dec 1996) No revisions since 1996
Colours & Symbols Specifications (Former S-52, Appendix 2)
Previous Edition Amendments Applied Resulting Edition
Edition 3.0 (July 1996) July 1997 Edition 4.0 (July 1997)
Edition 4.0 (July 1997) MD1 IA i01 Edition 4.1 (Jan 1999)
Edition 4.1 (Jan 1999) MD2 DA d02 MD4 DA d6 Edition 4.2 (Mar 2004)
Edition 4.2 (Mar 2004) MD5 DA d7 Edition 4.3 (Jan 2008)
Glossary of ECDIS-Related Terms Specifications (Former S-52, Appendix 3)
Previous Edition Amendments Applied Resulting Edition
Edition 3.0 (Dec 1997) Transferred to S-32 S-32, Appendix 1 (Sep 2007)
Presentation Library (Annex A to former S-52, Appendix 2)
Previous Edition
Amendments Applied Resulting Edition Digital PresLib
Paper Addendum
to Part I
Edition 3.0 (July 1997) MD1 IA i01 Edition 3.1 (Jan 1999) PRSLIB03.dai (July 1997)
PSLB03_1.dai (Dec 1998)
Edition 3.1 (Jan 1999) MD 3 IA i04 Edition 3.2 (May 2000) PSTY03_0.dai (June 1999)
PSLB03_2.dai (May 2000) Users’ Manual
(2003)
Edition 3.2 (May 2000)
MD2 DA d02 MD3 DA d05 MD4 DA d6
Edition 3.3 (2004) PSTY3_2b.dai (Oct 2001) PSLB03_3.dai (Mar 2004)
Users’ Manual (2007)
Edition 3.3 (2004)
MD5 IA i5 MD5 DA d7 MD6 IA i6
Edition 3.4 (2008) PSLB03_4.dai (Jan 2008) Users’ Manual (2008)
Edition 3.4 (2008) MD7 DA d8

ii
S-52, Edition 6.0 March 2010
Page intentionally left blank
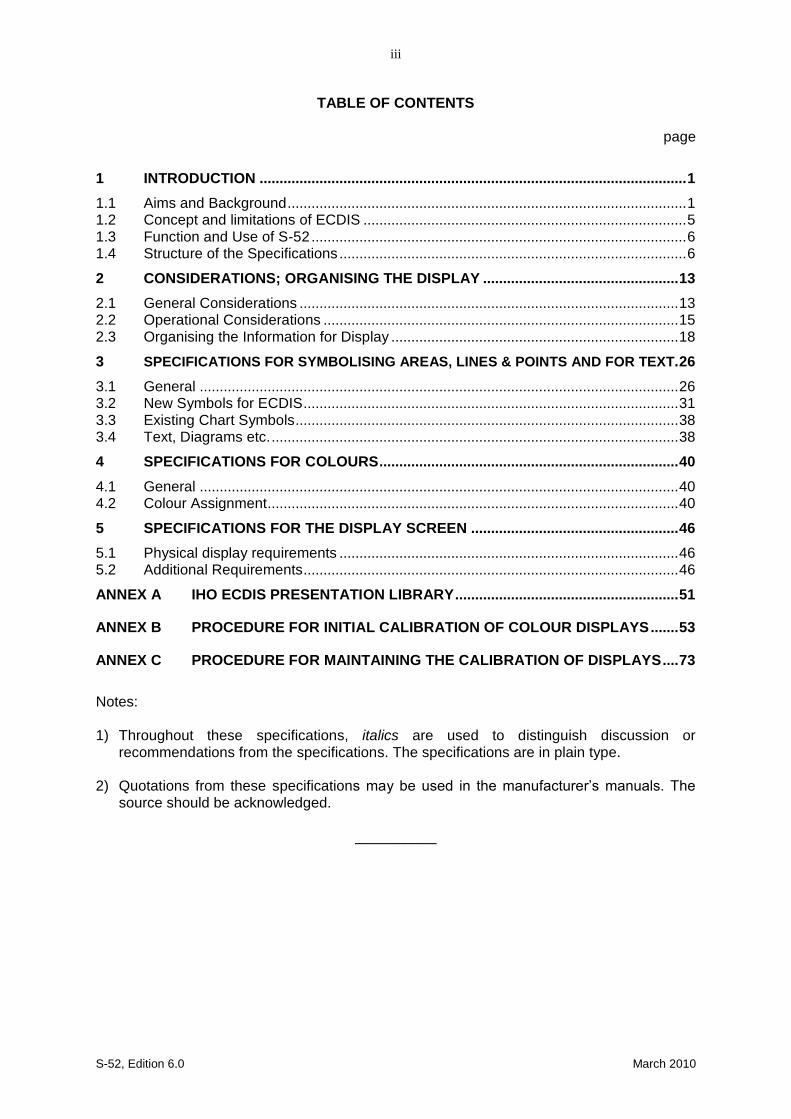
iii
S-52, Edition 6.0 March 2010
TABLE OF CONTENTS page
1 INTRODUCTION ........................................................................................................... 1
1.1 Aims and Background .................................................................................................... 1 1.2 Concept and limitations of ECDIS ................................................................................. 5 1.3 Function and Use of S-52 .............................................................................................. 6 1.4 Structure of the Specifications ....................................................................................... 6
2 CONSIDERATIONS; ORGANISING THE DISPLAY ................................................. 13
2.1 General Considerations ............................................................................................... 13 2.2 Operational Considerations ......................................................................................... 15 2.3 Organising the Information for Display ........................................................................ 18
3 SPECIFICATIONS FOR SYMBOLISING AREAS, LINES & POINTS AND FOR TEXT. 26
3.1 General ........................................................................................................................ 26 3.2 New Symbols for ECDIS .............................................................................................. 31 3.3 Existing Chart Symbols ................................................................................................ 38 3.4 Text, Diagrams etc. ...................................................................................................... 38
4 SPECIFICATIONS FOR COLOURS ........................................................................... 40
4.1 General ........................................................................................................................ 40 4.2 Colour Assignment ....................................................................................................... 40
5 SPECIFICATIONS FOR THE DISPLAY SCREEN .................................................... 46
5.1 Physical display requirements ..................................................................................... 46 5.2 Additional Requirements .............................................................................................. 46
ANNEX A IHO ECDIS PRESENTATION LIBRARY ........................................................ 51
ANNEX B PROCEDURE FOR INITIAL CALIBRATION OF COLOUR DISPLAYS ....... 53
ANNEX C PROCEDURE FOR MAINTAINING THE CALIBRATION OF DISPLAYS .... 73
Notes: 1) Throughout these specifications, italics are used to distinguish discussion or
recommendations from the specifications. The specifications are in plain type. 2) Quotations from these specifications may be used in the manufacturer’s manuals. The
source should be acknowledged.
__________

iv
S-52, Edition 6.0 March 2010
Page intentionally left blank

1
S-52, Edition 6.0 March 2010
1 INTRODUCTION 1.1 Aims and Background 1.1.1 Aims
These Specifications for Chart Content and Display Aspects of ECDIS are intended to contribute to the safe operation of ECDIS by:
- ensuring a base and supplementary levels of display for ENC data; standards of
symbols, colours and their standardized assignment to features; scale limitations of data presentation; and appropriate compatibility with paper chart symbols as standardized in the Chart Specifications of the IHO.
- ensuring the display is clear and unambiguous,
- ensuring that there is no uncertainty over the meaning of colours and symbols on
the display,
- establishing an accepted pattern for ECDIS presentation that becomes familiar to mariners and so can be recognized instantly without confusion.
1.1.2 Definitions
ECDIS terminology used in these Specifications is defined in the IHO S-32 “IHO Hydrographic Dictionary”, Appendix 1, “Glossary of ECDIS Related Terms."
1.1.3 Historical Background
In 1986 the North Sea Hydrographic Commission completed a study on the consequences of the development of Electronic Chart Display and Information Systems (ECDIS) for Hydrographic Offices (HOs). Its conclusions included: (1) Specifications for standardized data content, format and updating procedures should be arrived at by a new IHO ECDIS Working Group as a matter of high priority. (2) To assure the integrity of Electronic Navigational Charts (ENC's), their production should be the responsibility of the Hydrographic Offices; the ENC's will be made available in a standard format and all equipment should be designed to accept it. (3) When official ENC's are available, ECDIS users should be required to carry them in full, and ECDIS manufacturers or other intermediaries should not make preliminary selections of data before supplying them to the mariners. It was then decided to establish an International Hydrographic Organization (IHO) Committee on ECDIS (COE *). As several manufacturers were now developing these systems, it was of immediate importance to all concerned (Hydrographic Offices, mariners, national shipping authorities, and manufacturers) to have at least a first draft of the IHO and International Maritime Organization (IMO) guidance for both the Electronic Navigation Chart (ENC) and its display systems.
* Subsequently renamed the Committee on Hydrographic Requirements for Information Systems (CHRIS) and
now known as the Hydrographic Services and Standards Committee (HSSC).

2
S-52, Edition 6.0 March 2010
Therefore, the COE asked the Netherlands Hydrographer to prepare a working paper on ECDIS specifications to address the following issues: (1) Minimum and supplementary data content of the ENC and required characteristics of that data base such as the cataloguing of sea areas, density of digitization of chart data and reliability and worldwide compatibility of chart data and other nautical information produced. (2) Minimum and supplementary content of the ENC display, standards of symbols, colours and their standardized assignment to features, scale limitations of data presentation, and appropriate compatibility with paper chart symbols as standardized in the Chart Specifications of the IHO. (3) Methods for the timely updating of the ENC, and means to ensure worldwide compatibility of the correction system data. (4) Criteria for a standard format for exchange of digital data for the ECDIS between Hydrographic Offices and for supply to the data user, and procedures and financial aspects of such an exchange and supply A first draft of the specifications was presented to IHO Member State Hydrographers in May 1987 at the 13th International Hydrographic Conference in Monaco. This draft was also widely distributed to National Shipping Authorities, mariner associations and manufacturers, for comment. In November 1988, the COE established the Colours & Symbols Maintenance Working Group (CSMWG) to develop specifications and guidelines for chart symbol and colour definition for evaluation by hydrographic offices, ECDIS users, and manufacturers. In January 1989, the Safety of Navigation sub-committee of the IMO Maritime Safety Committee noted the need to define symbols and colours for both chart and navigation purposes, and invited the Comité International Radio-Maritime (CIRM) and the IHO to make detailed technical proposals. Work on ECDIS display design had already started, exemplified by the Canadian E.C. Testbed on the Norwegian "North Sea Project" in 1988. The CSMWG made its first report in September 1989, based on a study for the Netherlands HO by the TNO Perception Institute, and a review by the DCIEM Perception Institute, Toronto. The initial performance specifications were prepared in June 1990. Seven Cs GmbH, of Hamburg, developed a digital Provisional Presentation Library, under contract to Canada and the United States, leading to the development of the Presentation Library over the next two years, and culminating in the issue of the first operational editions after a meeting of CSMWG in November 1994. Meanwhile, more research and development in colours and symbols was carried out in Canada. Australia also provided support for completing the Presentation Library and the Mariner's Navigational Object catalogue which implements the IEC Navigational Symbols. In parallel with the development of the IHO Specifications, the IMO/IHO Harmonizing Group on ECDIS developed Provisional Performance Standards for ECDIS, which were first published in May 1989 by the IMO. An amended version of the Provisional Performance Standards was prepared in the light of experience and it was adopted in 1995 through IMO resolution A.817(19). The Performance Standards have

3
S-52, Edition 6.0 March 2010
incorporated many of the elements of the original IHO Specification. Therefore, S-52 now only provides the details of the hydrographic requirements for ECDIS. Another parallel effort was carried out by the IHO Committee on Hydrographic Requirements for Information Systems (CHRIS), which developed the S-57, “IHO Transfer Standard for Digital Hydrographic Data.” S-57 describes the standard to be used for the exchange of ENC data. It was adopted by the 14th International Hydrographic Conference, Monaco, May 1992. The IHO Transfer Standard Maintenance and Application Development Working Group (TSMAD) currently maintains S-57. While many of the general elements of S-52 were being incorporated into the IMO Performance Standards, the specifics were being expanded in the S-52, Appendix 2, "Colour & Symbol Specifications” into a model for presenting all chart and navigational objects on the ECDIS display, according to the developing IMO requirements. IHO published a provisional edition of the S-52, Appendix 2 in 1991 and the first operational edition, complete with Annex A, "Presentation Library", was issued in 1994. After 1994, considerable maintenance to adapt the colours and symbols Specifications and Presentation Library to sea experience and to changes in S-57 was carried out in Canada, first by USL/CARIS of Fredericton and later by NDI of St. Johns, funded by the Canadian Hydrographic Service and the Canadian Coast Guard. In 2001, the Federal Maritime and Hydrographic Agency of Germany (BSH), relieved the Canadian Hydrographic Service as the HO responsible for ECDIS Colours and Symbols. In 2004, a new edition bringing all accumulated deferred amendments into effect was issued. It included a detailed 'hard-copy' version of the symbol library developed at Hochschule Wismar, Fachbereich Seefahrt Warnemunde; in addition Furuno, Helsinki, provided the updated digital version for those who use it. The version of S-52 published in 2008 focused on adapting Appendix 2, Annex A to the revised IMO ECDIS Performance Standards and the introduction of new symbology for Particular Sensitive Sea Areas, Archipelagic Sea Lanes and generic objects which may be used for future cartographic requirements initiated by the IMO. In 2008, the 20th meeting of CHRIS endorsed the recommendation of the CSMWG to revise and restructure S-52 to accommodate the revised IMO ECDIS Performance Standards, MSC.232(82) and the associated new IEC 61174 Specification for ECDIS type approval testing. This has resulted in the creation of Edition 6 of S-52. All references to the previous IMO Performance Standards have been replaced with the appropriate references to MSC.232(82). The structure of S-52 has also been simplified; the S-52, Appendix 2 has been incorporated into the main portion of S-52 and the three annexes of the former Appendix 2 have become annexes to the main document. All of the Appendix 2 paragraph numbers have been retained in the newly integrated S-52 main document so that references to the former S-52, Appendix 2 may be mapped directly to the revised main portion of S-52. CHRIS, which changed its name to the Hydrographic Services and Standards Committee (HSSC) in 2009, also changed the name of the CSMWG to the Digital Information Portrayal Working Group (DIPWG). The scope of the DIPWG was also redefined to include maintenance of all components of S-52, except for Appendix 1, “Guidance on Updating the Electronic Navigational Chart," which was delegated to the new ENC Updating Working Group (EUWG) to “review and revise.”
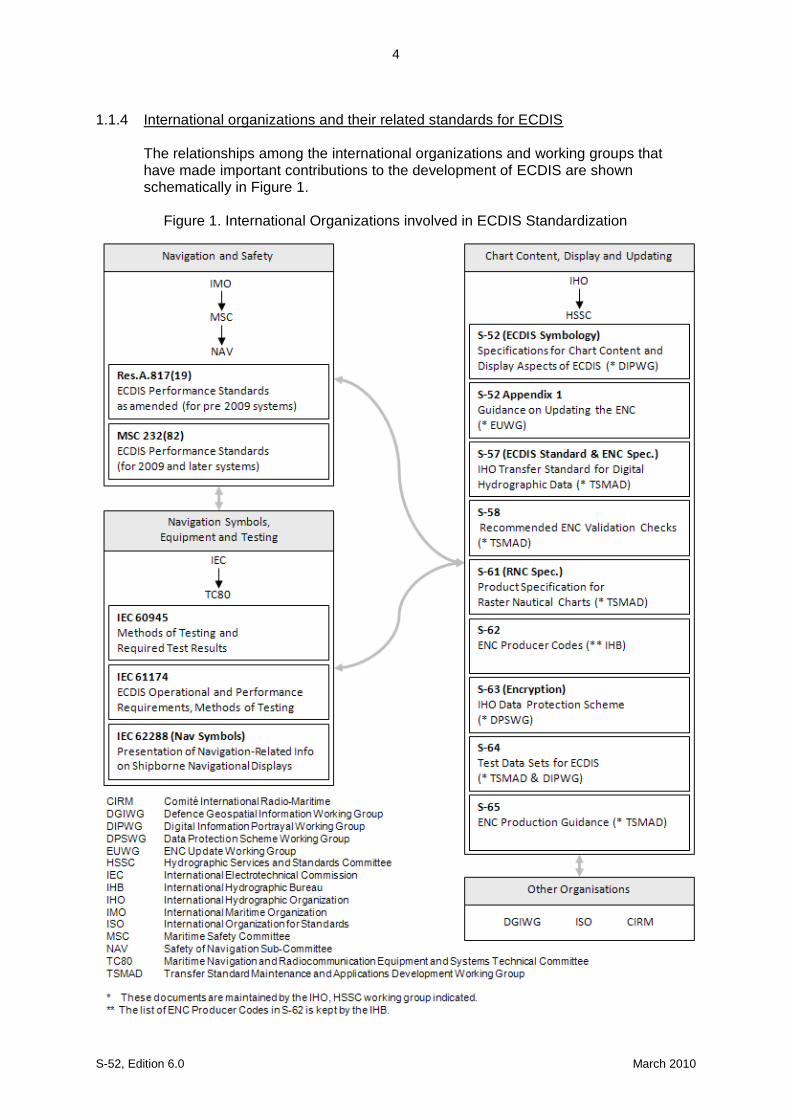
4
S-52, Edition 6.0 March 2010
1.1.4 International organizations and their related standards for ECDIS
The relationships among the international organizations and working groups that have made important contributions to the development of ECDIS are shown schematically in Figure 1.
Figure 1. International Organizations involved in ECDIS Standardization

5
S-52, Edition 6.0 March 2010
The following have been used as references within these Specifications: (1) IMO Performance Standards for ECDIS, 1995 edition (Resolution A.817(19) refers) and current edition (Resolution MSC.232(82) refers)); (2) IHO S-57 "IHO Transfer Standard for Digital Hydrographic Data", current edition,
IHB, Monaco; (3) IHO INT 1 "Symbols, Abbreviations, Terms used on Charts". BSH, Hamburg,
current edition; (4) IEC 62288 “Presentation of navigation related information - General
requirements, methods of test and required test results”, current edition; (5) IEC 61174 "ECDIS - Operational and performance requirements, methods of
testing and required test results", current edition;
(6) IEC 60945 "Maritime Navigation and Radio Communication Equipment and Systems – General Requirements – Methods of Testing and Required Test Results", current edition;
(7) IHO S-32 Appendix 1: "Hydrographic Dictionary - Glossary of ECDIS-related
terms", current edition. (8) IHO S-60 "User´s Handbook on Datum Transformations involving WGS-84",
current edition Excerpts from the above references are quoted where they form a necessary part of these specifications.
1.2 Concept and limitations of ECDIS
It may be noted that the concept of ECDIS is outlined in the introduction section of the IMO Performance Standards. The following contains additional ECDIS related considerations.
(a) ECDIS, used together with official data, [is] accepted as complying with the up-
to-date charts carriage requirements for nautical publications required by regulation V/19 of the 1974 SOLAS Convention amended in 2009. It may be noted that electronic chart systems not meeting these ECDIS specifications of IHO and IMO, or ECDIS using non-official data, are known as ECS (Electronic Chart Systems).
(b) Chart information may be used in conjunction with a radar overlay on ECDIS.
Integration of tracked radar targets provided for collision avoidance radar (ARPA) and targets tracked by AIS (Automatic Identification System) into the ECDIS display is another option.
(c) The colours and symbols defined in this Specification are conceptually based on
the familiar symbology of conventional paper charts. However, due to the special conditions of the ECDIS chart display as a computer generated image, the ECDIS presentation of ENC data does not match the appearance of a conventional paper chart closely. Instead, there are considerable differences in symbology in shape, colour and size, and in the placement of text in particular.

6
S-52, Edition 6.0 March 2010
The display of the ENC data and the conventional paper chart do not necessarily have to be identical in their appearance.
(d) ECDIS combines chart and navigational positioning information. It should be
noted that modern navigation systems (e.g. differential GPS) may offer a more accurate positioning than was available to position some of the surveys from which the digital chart data ENC was derived.
(e) The display categories specified in the IMO Performance Standards and the IHO
priorities of the various types of chart information (alarms, updates, mariners and non-HO chart data, etc.) are applied to every object by the display category and draw priority assignments of the look-up tables and symbolisation procedures of Annex A of this Specification.
(f) Depth information should only be displayed as it has been provided in the ENC
and not adjusted by tidal height. 1.3 Function and Use of S-52
(a) The IHO has produced Specifications for the Chart Content and Display Aspects of ECDIS that appear in this publication (S-52), in order to ensure that hydrographic data supplied by its Member States' HO is used in a manner that will enhance the safety and efficiency of navigation by satisfying the requirements set out in the IMO Performance Standards for ECDIS.
(b) The objective stated in (a) is also met through the publication of the "IHO
Transfer Standard for Digital Hydrographic Data" (S-57) which includes the "ENC Product Specification" (S-57, Appendix B.1).
(c) S-52 should be read with the IMO Performance Standards. It should also be
read in conjunction with the ENC Product Specification in S-57.
(d) Users of these Specifications should also refer to publications of the International Electrotechnical Commission (IEC) when dealing with equipment design and tests.
(e) Not all operational aspects of the updating mechanism of ECDIS contained in
Appendix 1 “Guidance on Updating the Electronic Navigational Chart” are mandatory for an ECDIS and should primarily be read as guidance. Since Appendix 1 was drafted, much practical experience with ECDIS and its updating mechanisms have been gained and advanced requirements for operational behaviour of ECDIS updating mechanisms may supersede the guidance given in Appendix 1 of this Specification.
1.4 Structure of the Specifications 1.4.1 S-52 components These Specifications consist of the following components (see Figure 2): .1 The Specifications for Chart Content and Display Aspects of ECDIS, which
describes the requirements and methods in relatively general terms. .2 Annex A, the Presentation Library as a separate document, which gives full
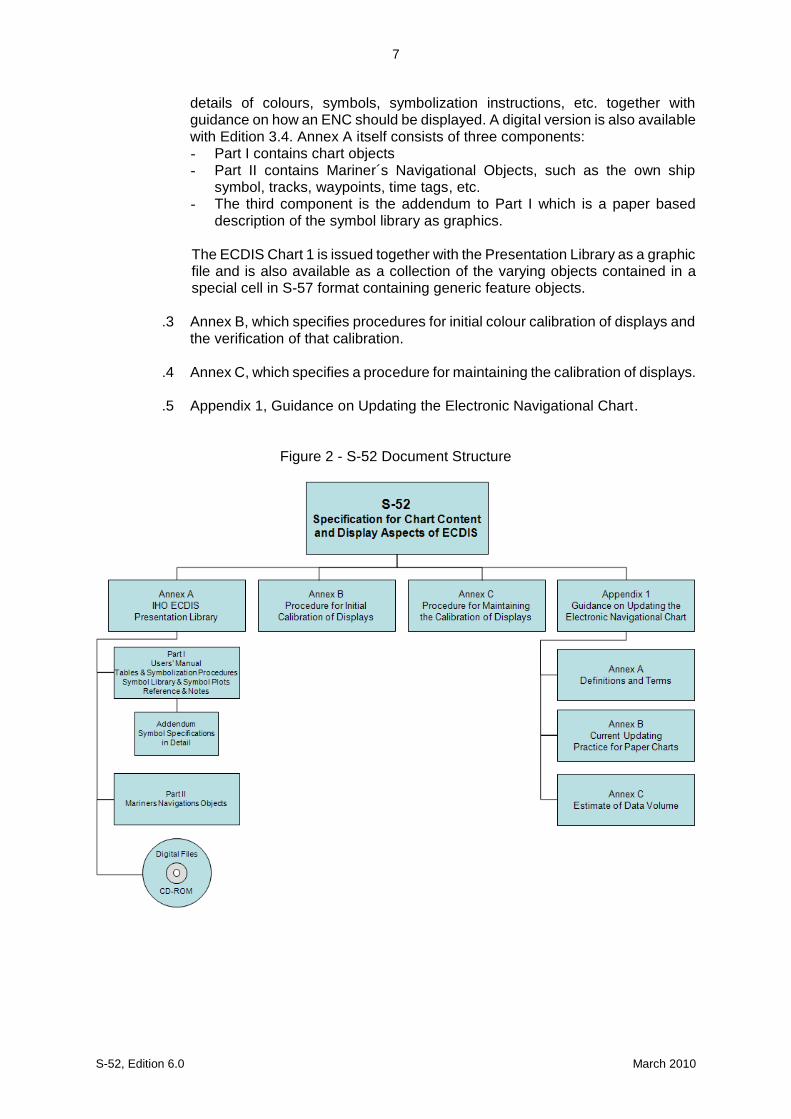
7
S-52, Edition 6.0 March 2010
details of colours, symbols, symbolization instructions, etc. together with guidance on how an ENC should be displayed. A digital version is also available with Edition 3.4. Annex A itself consists of three components: - Part I contains chart objects - Part II contains Mariner´s Navigational Objects, such as the own ship
symbol, tracks, waypoints, time tags, etc. - The third component is the addendum to Part I which is a paper based
description of the symbol library as graphics.
The ECDIS Chart 1 is issued together with the Presentation Library as a graphic file and is also available as a collection of the varying objects contained in a special cell in S-57 format containing generic feature objects.
.3 Annex B, which specifies procedures for initial colour calibration of displays and
the verification of that calibration. .4 Annex C, which specifies a procedure for maintaining the calibration of displays. .5 Appendix 1, Guidance on Updating the Electronic Navigational Chart.
Figure 2 - S-52 Document Structure

8
S-52, Edition 6.0 March 2010
1.4.2 Presentation Library and its status The Presentation Library links every object class and attribute of the SENC, including the IEC Mariner's Navigational Objects, to the appropriate presentation on the ECDIS display. It carries all the details of these specifications, organised as shown on figure 2.
A digital version in .dai format containing the Symbol Library, Colour Tables and Look-up Tables is provided as a manufacturer's option for edition 3.4, but may not be provided for succeeding editions.
Note that the Presentation Library contains some features and procedures which are not required in the IMO standards or IEC specifications, such as four depth shades, etc. These are identified, and their use is optional.
References to the Presentation Library in this document refer to its Part I unless otherwise stated.
1.4.3 Amending the Colour & Symbol Specifications and the Presentation Library 1.4.3.1 In the life of each edition of S-52, amendments to the structure of the Presentation
Library which might affect the ECDIS software (for example changing the number of fields in the look-up tables, or changing the logic of a conditional symbology procedure) will be avoided as far as possible. However incremental changes to detail in these Specifications and the Presentation Library will be required.
In a major revision, changes in structure will be made if necessary. Details of the
amendment process are given in 1.4.4 below. 1.4.3.2 The current editions of S-52 remain in force until the issue of either: (a) an immediate correction which is essential for reasons of safety of navigation, or (b) a new edition which is identified as bringing outstanding deferred amendments
into force.
Either of these will result in a new edition of these Specifications and/or the Presentation library, whichever is affected.
1.4.3.3 Amendments will be distributed as described in section 1.4.4 for information or for
implementation. As noted above, immediate correction amendments may have to be issued under certain circumstances.
The manufacturer should implement any immediate corrections in all his ECDIS systems fitted onboard ship, as soon as possible. When an amendment is implemented in a type-approved ECDIS, the manufacturer should inform the type approval authority in case re-testing may be required.
1.4.4 Amendment Procedures
1.4.4.1 Definitions of three classes of amendments. (i) "Clarification": an improvement to the wording of S-52 which does not result in
any substantive change to the specifications. A substantive change is one which would result in a change in symbolization.

9
S-52, Edition 6.0 March 2010
(ii) "Correction": a relatively specific change to S-52 to correct errors of commission or omission; or to improve the ECDIS presentation in the light of practical experience; or to take into account changes in another specification; etc.
(iii) "Extension": an extension has no immediate effect. It is a more general change
to S-52 intended to improve the ECDIS presentation. 1.4.4.2 Amendments. An amendment may consist of more than one item, as follows:
- an immediate amendment will contain only immediate correction items,
- a deferred amendment may contain either: (a) clarifications and deferred correction items, or
(b) extension items, which are distributed separately.
1.4.4.3 Immediate and deferred amendments. In exceptional cases, applying only to corrections and only where a correction affects safety of navigation, an immediate amendment will be made.
Normally, the implementation of amendments will be deferred until the next edition which is identified as bringing outstanding deferred amendments into force.
1.4.4.4 Edition number of these Specifications and the PresLib. The respective edition
numbers of these Specifications and of the PresLib are of the form “mm.n” where “mm” is the edition number which changes for a major change in the specification, and “n” is an incremental change number which increases by one for every immediate amendment applied. The edition number does not change for a deferred amendment.
Major revisions of these Specifications and the PresLib will be identified by an
increment in the "mm" number, followed by a zero, i.e. 04.0, 05.0, etc. Smaller revisions involving immediate amendments, and also revisions which are not major but bring outstanding deferred amendments into force, will be identified by an increment in the "n" number, e.g. 04.1, 04.2, etc.
It should be possible to identify the edition number in use on the ECDIS.
Edition numbers refer only to these Specifications and to the Presentation Library. Edition numbers are used in the numbering of amendment items in order to point to the particular edition of these Specifications or PresLib to which that item should be applied. For example amendment item no. “PL03.4.d7.co.2” should be applied to the Presentation Library Edition 3.4.
1.4.4.5 Amendment item identifiers. Each item within an amendment is assigned a unique
identifier, with the following form "ssmm.n.aa.dd.nnn", where:
ss = Specifications for Chart Content and Display Aspects of ECDIS (CS) or Presentation Library (PL), depending on which the amendment applies to,
mm.n = the edition number to which the amendment applies, aa. = deferred (d) or immediate (i) amendment followed by the sequential
number of the amendment, dd. = clarification (cl), correction (co) or extension (ex), n = sequential number of the item within the amendment.
For example, look at item no: "PL03.4.d7.co.2", reading from the last number group

10
S-52, Edition 6.0 March 2010
back to the first: "2" this is item 2 of the amendment,
"co" this item is a correction, "d7" it is a part of deferred amendment 7,
"PL03.4" it applies to PresLib edition 3.4 ( Note that:
i) the edition number of the PresLib would not advance after applying this deferred amendment.
ii) If this example had been an immediate amendment the item number would have been PL03.4.i7.co.2". In the case of an immediate amendment the edition number of the PresLib would have automatically advanced to 3.5 once the amendment was applied.
iii) The next amendment would have been numbered "amendment 8" whether it was an immediate amendment or a deferred amendment. )
1.4.4.6 Distribution 1.4.4.6.1 Immediate corrections to both these Specifications and the Presentation Library are
posted on the IHO website www.iho.int. They will need to be applied to the current edition of S-52.
1.4.4.6.2 Clarifications and deferred corrections. These deferred amendments will be
posted on the IHO website www.iho.int.
All existing deferred amendments will be implemented in the next edition of S-52 which is identified as bringing them into force. However an ECDIS manufacturer may implement a deferred amendment earlier if he wishes to do so, except when it is specifically stated that a particular amendment should not be implemented before the edition bringing deferred amendments into force is issued (in order to preserve uniformity in symbolising the ENC).
When an amendment is implemented in a type-approved ECDIS, the manufacturer should inform the type approval authority in case re-testing may be required.
1.4.4.6.3 Extensions are working documents, available from the IHB for test purposes on
request. A description of the extension will be put on the IHO website www.iho.int. 1.4.4.6.4 Before and after plots. Where appropriate, before and after plots will, whenever
possible, accompany amendments that make a change in symbolization. 1.4.4.6.5 Change control history. Amendments will include a change control history and a
reference to the current editions. The history of the previous changes to these specifications and the Presentation Library is provided at the beginning of this document.
1.4.4.7 Application and entry in to force.
The grace periods from the issuing date of a new edition after which changes are required to be included in an ECDIS are:
- for new development one year - for new selling (already type-approved before date of issue) one year

11
S-52, Edition 6.0 March 2010
1.4.5 Note on the Specifications as a whole
The effective use of chart colours and symbols on the ECDIS display requires consideration of a variety of factors: purpose (e.g. route planning/route monitoring); bridge lighting conditions (e.g. day/night lighting); human factors (e.g. colour perception, stress); interaction with "non-chart" information on the display (e.g. ship's tracks, navigator's notes, radar); interaction with other displays on the bridge (e.g. ARPA); ECDIS interactions (e.g. relation between ENC structure and display capability); technology (e.g. display calibration); and so on.
The working group has used good advice from ergonomic professionals and ECDIS manufacturers, and has taken advantage of the limited opportunities to test the standards at sea. However the group is conscious that operational sea experience, adaptations in the mode of use of ECDIS and technology developments will probably bring about the need for considerable modifications to the standards in the future.
Reports of experience with these specifications will be welcomed. They should be sent to: The Chairman, IHO DIPWG, International Hydrographic Bureau, BP 445, MC 98011, Principality of Monaco. E-mail: [email protected].
1.4.6 Type Approval - Minor Deviations to the Presentation Library
It is acknowledged that the manufacturers of navigational equipment and software are in constant contact with ECDIS users. To allow for fast response to suggestions for improvement to the chart display, the IHO Presentation Library for ECDIS is designed to provide a framework and guideline for chart symbolization from which the ECDIS manufacturer can derive a customized Presentation Library. The following criteria shall serve as a guide for judging whether any symbolization on an ECDIS which is visibly different from the symbolization provided by the IHO Presentation Library and as demonstrated by the IHO Test Data Set print-outs is still compliant. The symbolization used:
1.) should be the same in general shape and size as the IHO version; 2.) should be clear and sharp so that there is no uncertainty over meaning; 3.) should be close enough to the IHO version to avoid ambiguity in meaning
between that model and any other model of ECDIS; 4.) should use only the colours as specified in S-52; 5.) should comply with the various considerations of scientific design described in
S-52; 6.) should comply with the priority of prominence on the display in proportion to
importance to safety of navigation which is built into the Presentation Library, and
7.) should avoid any increase in clutter. Any symbolization which does not meet these criteria is not compliant.
The type-approval authority is strongly encouraged to contact the chairman of the IHO DIPWG in any case of uncertainty over differences in symbolization, ideally attaching graphics to illustrate the situation. The chairman of the WG will give the reason for the particular symbolization on the Test Data Plots, and will comment on any perceived advantages or disadvantages of the manufacturer's version, with reasons.
Manufacturers, type-approval authorities, and above all mariners, are always encouraged to contact the IHO over any improvements, criticisms, questions or

12
S-52, Edition 6.0 March 2010
comments that they may have about the ECDIS display, in order that the specifications can be kept effective and up to date. Send informal notes to the address in paragraph 1.4.5.

13
S-52, Edition 6.0 March 2010
2 CONSIDERATIONS; ORGANISING THE DISPLAY 2.1 General Considerations 2.1.1 Design considerations
The aim is to ensure that the ECDIS display is always clear and unambiguous. As an operational navigation display, there must be no doubt what the features shown are and what they mean. The basic principle of good display design is to keep the display simple and un-cluttered, and to use well-designed symbols and colours.
A number of guidelines have been used for designing this operational ship-handling display:
- Contrast is needed to carry information; this may be colour contrast or luminance
contrast, or contrast from differing linestyles or symbol shapes. All these inter-relate with each other,
- When planning colours, begin with the background colours, the area fills for
depth zones and land. Then work on the foreground lines and symbols, making sure they have good contrast with all their backgrounds,
- Use redundant coding for important features. For example the ship's planned
route is a prominent dark red, which shows well against both the white deep water of the daytime colour table and the black deep water at night, and it is also a thick dotted line, the only such line on the display,
- Design for the worst case; fit the rest in afterwards. For the ECDIS this means
setting up the display for bright sunlight, when all but the starkest contrast will disappear, and for night when so little luminance is tolerated that area colours are reduced to shades of dark grey (maximum luminance of an area colour is 1.3 cd/sq.m compared with 80 cd/sq.m. for bright sun) and only fine lines can be bright,
- Keep the software simple. For example, line weights are not changed for
different colour tables as this would require a conditional symbology procedure. 2.1.2 The diversity and flexibility of ECDIS
The challenge presented by the versatility of ECDIS is illustrated below: The diversity of information may include: - physical chart information, (e.g. coastline, depth contours, buoys), - traffic routeing; specified areas; cautions; etc., - supplementary HO information from light list, etc., - mariner's notes; additional local chart information; manufacturer's information, - chartwork such as planned route; electronic bearing lines and range rings; etc., - own ship's position and velocity vector; ship's head and rate of turn; past track, - fix accuracy, or position check from secondary positioning system, - possibly, shiphandling options, based on ship's characteristics, alphanumeric
navigation information (ship's latitude, longitude, heading, course, etc.), - information from radar and other sensors, - information from AIS, - navigational indications and alarms generated by ECDIS, - possibly, telemetered information from shore authorities, (traffic, real-time tides
14
S-52, Edition 6.0 March 2010
etc.), - possibly, ice information, - reminders, (e.g. time to contact pilot station), - possibly, messages from other displays (e.g. alarm on engine room display). The flexibility of presentation may include: - displaying/removing various types of chart and non-chart information, - selecting standard chart display or a thinned out display, and full or simplified
symbols, - using cursor interrogation for further detail, - overlaying/removing radar video or radar target information (in order to: confirm
ship's positioning; aid radar interpretation; show the entire navigation situation on one screen),
- overlaying/removing various other sensor information, or information telemetered from shore,
- changing the scale or orientation of the display, - selecting true motion or relative motion, - changing screen layout with windowed displays, text information in the margins,
etc., - possibility of pull-down menus and other operator interaction devices being
alongside the operational navigation display and so interacting with it, - giving navigation and chart warnings such as "too close approach to safety
contour"; "about to enter prohibited area"; "overscale display"; "more detailed (larger scale) data available"; etc.,
- possibly, a diagrammatic representation of a computer evaluation of grounding danger,
- possibly, a diagrammatic representation of the immediate vicinity of the ship to aid in close quarters manoeuvring,
- other future developments. (Further presentation requirements and techniques appropriate to ECDIS are likely to be developed in future).
2.1.3 Colour discrimination on the display: perception effects and display calibration
Since colour is a prime means of distinguishing features, the maximum range of colours should be available. However the colours selected must be such that they can be clearly discriminated by a mariner with normal colour vision, and colour induction effects must be avoided (for example a small green object on a saturated blue background will tend to appear yellow).
Absolute accuracy in colour reproduction is not required but relative colour fidelity is important. To ensure clear contrast between colour-coded features the display screen should be calibrated before use, and this calibration should as far as possible be maintained while in service. If this is not done, lines, symbols, and area shades may become indistinct, and information may then be lost or become misleading. This problem is discussed in section 4 and 5 and Annexes B and C.
The ambient lighting on the bridge varies between the extremes of bright sunlight, which washes out information on the display, and night, when the light emitted by the display has to be low enough that it does not affect the mariner's night vision. These specifications have been designed to meet these difficult requirements rather than less demanding normal day conditions.

15
S-52, Edition 6.0 March 2010
2.2 Operational Considerations 2.2.1 Similarity to the paper chart
Because much experience is embodied in the paper chart, and to avoid confusion in the extended period while paper charts and ENCs co-exist, the two presentations should be similar wherever possible. While recognising that the application of ECDIS extends beyond that of the paper chart, paper chart practice should be followed unless otherwise specified in these specifications.
However, because the ECDIS display uses emitted light, compared with reflected light for the paper chart, ECDIS must switch to a negative image of the chart at night, using a dark background in place of the white background of the paper chart, in order not to impair night vision.
In addition, studies and early experience indicate that the need for good visual communication between the ECDIS display and the user may require simplification and change of symbols traditionally used on paper charts. Some alternative display methods have been introduced as options in the Presentation Library.
2.2.2 Distinguishing between features and between sources
It should be possible to distinguish clearly on the display between a very large number of features. These are listed as classes in section 2.1, such as different water depths, various types of buoys and beacons, chart lines compared with navigators lines, and so on. It should also be possible to distinguish between sources, such as ENC information; hand-entered N to Ms, local information, and mariner's notes and manufacturer's additional information.
The means available for coding these distinctions are limited. They include:
- coloured areas, lines and symbols, - coded lines (e.g. dashed) and areas (e.g. patterned), - symbols, - text labels (but these cause clutter), - cursor interrogation, - switching a class of information on/off either automatically or by hand, - splitting information into separate windows, - common sense interpretation (e.g. a red buoy, a red arc indicating a light sector,
and a dotted red line indicating planned route, are unlikely to be confused, even though all are coloured red).
Because there are more demands for making distinctions than there are coding methods available, duplicate coding will sometimes be unavoidable, as in the above example. Distinctions should be made logically and systematically, giving priority to features that have greater operational significance.
2.2.3 Route Planning / Route Monitoring: Look-ahead
The IMO Performance Standards for ECDIS distinguish between the route planning and route monitoring modes of using ECDIS. It is expected that in route planning the display will be viewed, without urgency, from the normal screen viewing distance of about 70 cm, and so the display can contain considerable detail without causing confusion.
16
S-52, Edition 6.0 March 2010
Experience up to now of route monitoring indicates that in that mode the display will be used for immediate decision-making, sometimes under stress, and that it may be viewed from a distance of several metres. The route monitoring display should therefore be planned to present only the immediately relevant information, in a manner that ensures it can be taken in quickly, clearly and without ambiguity.
In particular, text is difficult to read and tends to cause clutter. It should be kept to a minimum on the route monitoring display.
If there is a delay in preparing data for the route monitoring display (e.g. due to a request for scale change, or look-ahead to another area) the ECDIS should inform the mariner. The previous display should be maintained, and updated, until the new display is ready for draw.
Because the display screen is smaller than the paper chart, the IMO PS specify that the ECDIS display should have the capacity for local as well as distant look-ahead. To provide this will be an important consideration in presentation design. While, for example, manufacturers may provide a smaller scale look-ahead display by windowing, these Specifications must take into account the fact that important features such as lights, future waypoints, etc., may often lie out of sight off the screen.
2.2.4 Important features should always be clear and conspicuous
These specifications are designed to make important features (e.g. own-ship symbol, own-ship safety contour, etc.) more conspicuous than minor features.
Ergonomic specialists point out that, to avoid ambiguity, important features, such as those in the IMO PS Display Base, should be redundantly coded. (Two examples are the own-ship safety contour, which is a thick line and has a sharp change in the colour of the depth shade, and the planned route, which is red and is the only heavy dotted line on the display). This serves to improve the visibility of important features on the route monitoring display, and it also helps to distinguish features in bright sun or at night.
Chart features should normally be written over the radar image. See section 2.3.2b for details.
2.2.5 Scale and range indicators
The "(indication of) scale and range" required as part of the Display Base by IMO PS Appendix 2 is intended to give the mariner an immediate appreciation of (a) how close to his ship are hazards seen on the display, and (b) how much time he has to decide on any necessary avoiding action. Two indicators should be provided:
- a one-mile scale bar for a large scale display and a ten-mile latitude scale for a
small scale display (see section 3.2.3(9) for details). This indicates roughly how close display features are; the cursor or VRM should be used for exact range measurement,
- an emphasized six-minute marker on the course and speed made good vector
(see IEC symbol 3 and Part II of the Presentation Library).

17
S-52, Edition 6.0 March 2010
2.2.6 Effect of bright sunlight, and the dark night display
It will not be possible to read the ECDIS display if the sun is shining directly onto it. Even diffused bright sunlight on the bridge tends to wash out the colours of the display so that they tend to look grey. The "day" colour table has strong contrast to combat this effect. But it helps to shield the face of the screen. The face of the display screen acts as a mirror to white shirts, sometimes seriously obscuring the chart display. Wearing a black cotton (not synthetic) watch-coat will greatly improve viewing on a sunlit bridge.
At night several factors combine to reduce colour discrimination:
- the display must be darkened to a level at which it does not impair the mariner's
night vision, hence his ability to keep a look-out, - the ability of the human eye to distinguish colour is reduced at low light levels, - the display screen is less capable of discriminating between colours at low
levels. A dark colour may drop below the screen cut-off and become black.
Note that ships tend to arrive in port at 0800 and sail by 1700, to reduce port charges; thus the critical passage through the port approaches often occurs at night.
The night colour tables are designed to overcome night viewing problems as far as possible, and some other measures are taken as well:
- important features are distinguished by redundant symbol/linestyle coding as well
as colour, (e.g. own-ship is a unique double circle , in heavy white at night), - if it happens that the entire night display area consists of only one depth zone,
the mariner will not be able to judge by absolute colour discrimination which of these depth zones the ship is in. A clearly visible "depth less than safety contour" pattern is provided to indicate shallow water (section 3.2.3(15)),
- the mariner should be advised to adjust the night display of a display screen by
contrast control, not by brightness, which may shift dark colours below cut-off.
Use of a 0.9 ND optical filter over a relatively bright display is a better solution for night viewing than reducing the display brightness.
2.2.7 Location for the ECDIS display Experience in sea tests has shown that it is important to select an appropriate location for ECDIS. For example: - the navigator should be able to see the display clearly, and to reach the controls,
from his normal conning position, - it is an advantage to locate radar and ECDIS side by side, - the face of the display should be shaded from direct sunlight, and the display
should not be located where the viewer may find the sun directly behind it.
2.2.8 Displaying text The power of ECDIS lies in conveying operational information quickly, clearly and comprehensively through a picture, a birds-eye view of the ship and her surroundings. Text should be avoided on this graphical operational display unless it is

18
S-52, Edition 6.0 March 2010
absolutely necessary, because it conveys limited information and, since it has to be written large to be readable, causes confusing clutter. However some text may be unavoidable, both on the operational display (e.g. buoy numbers if these are required for VTS reporting) or on a separate text display (e.g. course to steer, heading; alarms; tidal information; user interaction to control the ECDIS, etc.). (See also sections 2.3.3c, 3.1.5 and 3.4, and section 7.1.3 of the Presentation Library).
2.2.9 Flashing to draw attention The capability to flash a symbol should be used only rarely in very special cases. It should be used to draw attention rather than to simulate a real flashing object.
2.2.10 Operator control of information should be effective and simple In order to handle the diversity of information and flexibility of display options provided by ECDIS without confusion, the presentation of information must be designed carefully. In particular, the operator interface should provide clear, simple control of the display such that there is no danger of confusion, or of failure to retrieve important chart information in a stressful situation. "Viewing Groups", as an optional way of giving the mariner control over the information on the display, are described in section 8.3.4.4 of the Presentation Library. The mariner should have full control over any automatically linked display changes, including the option to inhibit such changes. Examples of linked display changes include changing the source of data when a larger scale becomes available, or displaying lights automatically when the mariner selects the "Dusk" colour table.
There should be enough commonality between the user interfaces of the various makes of ECDIS that a pilot, or watch officer new to the ship, can use an unfamiliar type of ECDIS. However, over-strict standardisation will hamper development of an effective interface.
2.3 Organising the Information for Display 2.3.1 Display of non-chart information 2.3.1a Distinguishing between chart data and additional data
IMO PS section 1.5 states that ECDIS should enable the mariner to execute the chartwork at present performed on the paper chart and section 3.3 states that the SENC may contain information from other sources than ENCs. This specification requires that ECDIS distinguish between chart data and additional data from users (mariners) and manufacturers. The following colour and symbol usage for mariners and manufacturers data is designed to implement this while ensuring the display remains clear and uncluttered.
Part II of Annex A "Presentation Library" describes "Mariner's Navigational Objects" for route planning and route monitoring chartwork, and for adding mariner's and manufacturer's information to the SENC. The descriptions are in the same format as
19
S-52, Edition 6.0 March 2010
chart objects, in order to avoid the ECDIS having to deal with two differently coded types of data. The colours, symbols, categories and display procedures that apply to all these objects are included in Part I of the Presentation Library, along with the procedures for chart objects.
Mariners may alter the IMO categories for Mariner's Objects (but not for chart objects). Note, however, that IMO PS 11.4.1 requires that own ship and selected planned route should always appear, and should therefore remain in Display Base.
Note that Mariner's Objects should be kept independent of chart data in the SENC, and that mariners' information does not need to be split into cells.
In referring to Mariner's Objects it is important to distinguish between:
"Add/Enter", "Revise" or "Delete" mariner's or manufacturer's information; this refers to the contents of the SENC, and:
"Display" or "Remove" the information; this refers to the ECDIS display. 2.3.1b Mariner's Information on the route monitoring display
In addition to the ability to enter manual chart corrections and to carry out route planning and route monitoring chartwork, the mariner should be provided with the capability of adding at least the following symbols, lines and areas to the SENC, and should be able to revise or delete them:
.1 the caution “(!)” or information “[i]” symbol section 3.2.3 (6b), (6c), used to call up
a note on the text display by cursor picking, .2 simple lines and areas with or without colour fill, set up for cursor picking to give
an explanatory note in the text display, .3 any of the chart symbols in the Presentation Library, .4 text notes.
Non-ENC chart information added by the mariner should be in normal chart colours, identified as described in the Presentation Library, Part I, section 8.7.2.
Other information added by the mariner should be distinguished by the colour orange (colour token NINFO) except for colour fill, which should use transparent yellow (colour token ADINF). (Transparent orange tends to look magenta in colour over blue backgrounds).
Mariner's information should not overwrite ENC information.
The symbols and instructions for using the IEC "Mariners' Navigational Objects" are given in Part II of the Presentation Library.
2.3.1c Manufacturer’s Information on the route monitoring display .1 If the manufacturer should add non-chart information to the SENC, he should use
the following symbols, lines and areas:
(i) the circled “!” caution symbol SY(CHINFO11), or boxed “i” information symbol SY(CHINFO10), used to call up a note on the alphanumeric display by cursor picking,
20
S-52, Edition 6.0 March 2010
(ii) simple lines, or areas without colour fill, set up for cursor picking to give an explanatory note in the alphanumeric display (colour fill should not be used).
(iii) Non-chart information entered by the manufacturer should be distinguished
by the colour yellow (colour token ADINF). It should not overwrite HO ENC information.
.2 If the manufacturer should add non-HO (non- ENC) chart information to the
SENC it should be symbolised in the same way as HO chart information and distinguished from HO chart information as described for the various cases below:
(i) Limited non-HO data is added to existing HO data to augment the chart
information. Each object should be marked by the special identifiers described in the Presentation Library, section 8.7.2.
(ii) An area of non-HO data is located in waters for which HO chart data
exists; it is superimposed on the HO data. In some cases the non-HO data may be more appropriate for the intended purpose, for example it may be more detailed.
In this situation it is at the mariner’s discretion whether to use the HO or the non-HO data.
If the mariner selects the non-HO data, the boundary of this data should be identified on the ECDIS display by the line LC(NONHODAT) and the warning “Unofficial data displayed; refer to official RNC or paper chart” should be displayed.
Note that the LC(NONHODAT) is a “one-sided line”, and the boundary of the area of non-HO data must be drawn according to S-57 rules to ensure that the diagonal stroke of the line is on the non-HO data side of the line. More details are given in PresLib section 12 conditional symbology procedure DATCVR section 2.1.
(iii) An area of non-HO data is located wholly outside the area covered by HO
data (although it may share a boundary with the HO data) but is shown on the same display as HO data. The non-HO data should be bounded by the line LC(NONHODAT) and the warning “Unofficial data displayed; refer to official RNC or paper chart.” should be displayed.
(iv) The entire display contains nothing but non-HO data. The warning “No
official data available; refer to official RNC or paper chart.” should be displayed. In this case, special identifiers need not be used."
.3 The mariner should be able to remove all manufacturer's information if the need
should arise. 2.3.1d Displaying the radar image
The radar image may be displayed by an opaque overlay or a transparent overlay, using colour tokens RADHI and RADLO. Further details are given in section 4.2.7.

21
S-52, Edition 6.0 March 2010
2.3.1e Displaying pick reports
The following information should be shown on demand on the same screen as the chart display or on an additional graphic or text display: - Positional data and time;
- legend; - object description and associated attributes (result of "cursor query") in human
readable language, including the meaning given in the Presentation Library for any symbol selected by cursor-pick; textual information from ENC, e.g. cell name, compilation date, date of issue;
- record of ENC-updates; - ECDIS Chart 1 [formerly mistakenly named “list of abbreviations" (from INT 1)]; - [colour differentiation diagram]; - [black adjust symbol for contrast adjustment]; - list of categories which are removed from Standard Display; - Edition number of Presentation Library in use.
2.3.1f Units
There should be no ambiguity about the units in use at a particular time. The units listed below should be indicated in the display legend:
(1) Position: latitude and longitude in degrees, minutes and decimal
minutes.
(2) Depth: metres and decimetres.
(3) Height: metres.
(4) Distance: nautical miles and decimal miles, or metres.
(5) Speed: knots and decimal knots. 2.3.1g Legend
A standard legend of general information relating to the area displayed, applicable to the ships position, should be shown on a graphic or text display. This legend should contain at minimum:
(1) units for depth
(2) units for height
(3) scale of display; in addition overscale indication where appropriate
(4) data quality indicator
(5) sounding/vertical datum
(6) horizontal datum
(7) the value of the safety depth if used
(8) the value of the safety contour selected by the mariner, as well as the
value of the safety contour displayed (which may be different from that
22
S-52, Edition 6.0 March 2010
selected by the mariner)
(9) magnetic variation
(10) date and number of last update affecting the chart cells currently in use
(11) edition number and date of issue of the ENC
(12) chart projection 2.3.2 Priority of information 2.3.2a Priority layers
The IMO PS divides SENC information into three categories that determine what data is to be on the display: Display Base (always present on the display); Standard Display (the default display); and Other Information (displayed on demand). (IMO PS section 3 and Appendix 2). (See section 2.3.3a).
There are 10 priority layers for the drawing sequence of the data on the display:
(1) ECDIS visual alarms/indications (e.g. caution, overscale)
(2) HO-data: points/lines and areas + official updates
(3) NtMs, manual input and Radio Navigational Warnings
(4) HO-caution (ENC cautions)
(5) HO-colour-fill area data
(6) HO's on demand data
(7) Radar information
(8) Mariners data: points/lines and areas
(9) Manufacturer's data: points/lines and areas
(10) Mariners colour-fill area data
This list is not intended to indicate a drawing sequence, but to specify that the information content of category n+1 must not obscure the information content of category n, or any higher category (i.e. n-1 etc.).
Category (7) should have a radar off switch to facilitate its removal.
The look-up tables and conditional procedures of the Presentation Library assign a category, and a display priority (drawing sequence), to every object (object class-attribute combination) in the ENC.
2.3.2b Radar priority
The priority of HO chart data over radar is carried out by the single action "remove radar" control (IMO PS 7.2). When present, the radar data is always written over the

23
S-52, Edition 6.0 March 2010
eight opaque area fills (see 3.1.2). Chart line and point features should normally be written over the radar image, with some exceptions, as described in the "over-radar" field of the Presentation Library look-up table. But in order to meet the requirements of IMO PS 11.4.14 to adjust the ship's position, the ECDIS may incorporate the capability of changing the radar priority of the Presentation Library. Operation of this feature should be clearly indicated.
2.3.3 Display categories 2.3.3a IMO categories
The IMO "Standard Display" provides a starting point. It is a list of objects that the mariner may either add further objects to, or remove objects (except Display Base) from, in deciding what is to be displayed. Note that as soon as any object on this list is removed from the display, or any object not on this list is added to the display, the display no longer shows the IMO "Standard Display".
The IMO "Display Base" is that part of the Standard Display that should never be removed. It is a list of basic objects which the IMO consider are required at all times, in all geographic areas and under all circumstances. Note that the IMO do not intend the Display Base to be sufficient for safe navigation on its own; therefore it should not be a display option to "Show Display Base" without any additions.
The IMO category "Other Information" contains every object in the SENC which is not classed as "Standard Display".
The mariner should be able to remove information selectively from "Standard Display", except that he cannot remove any object of the "Display Base". And he should be able to add selectively to the Standard Display any items of the "Other" category.
Field 6 of the look-up table of the Presentation Library assigns the IMO category in detail to every object in the SENC, including Mariner's Navigational Objects. The mariner may override the category for mariner's objects, but not for chart objects.
2.3.3b Selecting objects for the route monitoring display
Section 5.5 of the IMO Performance Standard requires that "It should be easy to add or remove information from the ECDIS display". For example, the mariner might want to retain "caution areas" from the Standard Display (see Table 4 of this document) but remove the remaining thirteen areas, including such as protected areas (e.g. "game preserve"). Another example is that he might want to add soundings from "Other", but omit submarine cables (which cause serious clutter at certain ocean terminals).
As an aid to adding and removing information from the display, field 7 of the look-up table also assigns every feature in the SENC to a viewing set, and these sets are arranged in groups of ten which are related to the lettered groups of INT 1 for the paper chart, a classification which is familiar to the mariner. The details are given in the Presentation Library, Part I, section 8.3.4.4 and Table 13.2.
The manufacturer is responsible for organising SENC features, viewing sets and viewing groups for display in such a way that the mariner has reasonable flexibility in selecting what he sees without the selection process becoming too complex. Note that it is not necessary to provide access to each feature, viewing set or even viewing group individually.

24
S-52, Edition 6.0 March 2010
Note that combined groups which include features from different IMO categories should not be linked permanently, since doing so would, in effect, drag additional features into the Display Base or Standard Display. For example, if a combined group includes soundings (which are "Other") and lights (which are "Standard Display"), this link should not cause soundings to be shown with the Standard Display on first switching on the ECDIS.
2.3.3c Selecting text for the route monitoring display
The ECDIS manufacturer should provide the mariner with control over the selection and display of text on the route monitoring display.
Text should not appear automatically whenever the object it is associated with appears on the display. It should always be possible to remove text independently of the object. The IMO Display Category for text is "other".
As a guide to adding and removing text from the display, the Presentation Library distinguishes between "Important text" and "Other text", and provides suggested groupings for text display, in section 7.1 and Table 13.3 of the Presentation Library.
Section 3.4 of this document gives further details on text.
2.3.3d Linkages in selecting mariner's options
Many other options are available to the mariner in addition to those discussed above. Although these may at first be confusing, linkages which reduce these options but which also reduce the performance of the ECDIS should not be used. For example:
- lights should not be automatically displayed when the night colour table is
selected. (Lights cause clutter and under certain circumstances the mariner may not want them on the display.)
- as stated in section 3.1.1, symbolized area boundaries should not be
automatically selected when paper chart point symbols are selected. (Symbolized area boundaries are needed for large scale displays showing a number of overlapping areas, whereas the selection of paper chart point symbols is a personal preference and is independent of display scale.)
Because vessels vary widely in their requirements and their operational procedures, linkages between options which reduce the flexibility of the ECDIS should be avoided.
2.3.4 Displaying ECDIS updates
For guidance on updating the ENC, see Appendix 1. This section deals with how updates should be displayed. It is keyed to the relevant sections of the IMO PS.
IMO PS 4.5 Automatic and semi-automatic updates: these should be
displayed in the same manner as ENC information, using standard colours and symbols.
IMO PS 4.6 Manual updates: these should be displayed in standard colours
and symbols and distinguished as described in the Presentation Library , Part I, section 8.7.
25
S-52, Edition 6.0 March 2010
IMO PS 4.8 The mariner should be able to display updates for review as follows:
For automatic updates: the manufacturer should provide a
means of distinguishing these. One method suggested is to identify automatic updates temporarily in the same manner as manual updates. The temporary switch-on/switch-off of the identifiers would distinguish automatic from manual updates.
For manual updates: display all SENC information. The
manual updates should be distinguishable as described in the Presentation Library , Part I, section 8.7.

26
S-52, Edition 6.0 March 2010
3 SPECIFICATIONS FOR SYMBOLISING AREAS, LINES & POINTS AND FOR TEXT 3.1 General 3.1.1 Mariner's options in symbols and linestyles
Although buoys and beacons are aids to navigation, they may also become a collision hazard if their presence is not noticed. The Presentation Library therefore provides, as a mariner's option, an alternative set of symbols for buoys and beacons which are more prominent than the paper chart symbols, particularly on the night display. Two look-up tables are provided, to display either simplified or paper-chart type buoy and beacon symbols.
Areas are difficult to symbolise on an ECDIS, for reasons given below. The Presentation Library therefore provides, as a mariner's option, symbolised area boundary linestyles for use on large scale displays. These make the areas easier to figure out than the plain linestyles recommended for small scale displays, where symbolised lines would cause clutter. Two look-up tables are provided, to display either symbolised or plain area boundary linestyles.
The mariner should be given the option of selecting the buoy symbols and area boundary linestyles that best fit the situation, without linkages. For example, boundary linestyle should be selectable independent of the choice of buoy symbol, and independent of the actual display scale.
3.1.2 Areas
The moving display window of ECDIS, coupled with the possibility of the mariner using a large scale (small area) display window that could lie wholly within a given area, so that the border is not visible, give problems in symbolising.
Areas can be identified both by symbolising the area itself and by symbolising its boundary.
The mariner has to be made aware of any important area, and its identity, but the symbolising should not cause clutter.
3.1.2.1 The following methods of symbolising the area are used:
.1 Opaque colour fill: depth areas and land areas. These consist of (with colour token):
deep water, and also user interface - background (DEPDW & UIBCK) medium deep water (DEPMD) medium shallow (DEPMS) very shallow (DEPVS) intertidal area (DEPIT) land in general (LANDA) built-up areas (CHBRN) no chart data (NODTA)
Eight colours are used, which matches 8-bit graphics devices. They form a subdued background giving maximum contrast to foreground information, including the radar image, all of which are drawn on top.

27
S-52, Edition 6.0 March 2010
.2 Semi-transparent colour fill: Depth zones should show through this, and all other information is drawn on top, e.g.:
- traffic separation zone and mariners chartwork area fill.
.3 Patterns of lines: for important area features in busy waters; the pattern should not be distracting, e.g.:
- traffic junctions - closely spaced magenta diagonal lines - AP(TSSJCT 02), - grossly overscale part of chart display compiled from two compilation
scales - faint grey vertical lines - AP(OVERSC 01) .4 Continuous textures: need to show up in small areas; may be used for features in
busy waters and so should not be distracting, e.g.: - area with no data - AP(NODATA 03), - dredged area - ordered dot pattern, AP(DRGARE 01), - ice area - random short lines, AP(ICEARE 04). .5 Patterns of symbols: used in less busy areas, or displayed temporarily and then
removed, so can be more distracting, e.g.: - aquaculture - AP(MARCUL 02) - quality of bathymetry - AP(DQUAL 11) .6 Single centred symbol: used for important features in busy waters, such as traffic
lanes, restricted areas. The symbol is large to give it visibility, but faint in colour to reduce clutter, e.g.:
- traffic lane - SY(TSSLPT 51) - anchorage prohibited or restricted - SY(ACHRES 51)
These artificial areas are difficult to symbolise because one symbol must apply to all sizes, for example from the case when the display window is wholly inside a traffic lane, to an "area to be avoided" the size of a postage stamp on the display.
In addition, some areas such as traffic routeing systems often have multiple conditions (e.g. “traffic direction” + "deep water route" + "entry restricted"). Many of the symbols in the Presentation Library have deliberate offsets from the pivot point to avoid overwriting.
The Presentation Library provides large transparent symbols for centred symbols and small symbols for pattern coverage:
(a) Centred symbols are used where it is important to avoid clutter, particularly in
traffic lanes. The symbol must be placed within the area. See Presentation Library 7.4 for one method of centring a symbol.
(b) (i) For a pattern of small symbols, the spacing between the symbols lies
within the limits: minimum distance apart: 2 cm. maximum distance apart: 10 cm. (ii) It would be ideal to space the symbols further apart for a large area and
closer together for a smaller area. However reliable symbolising is more important, and a constant fixed-space symbol pattern should be used until "scale dependent spacing" has been developed and proved. See Symbol Library in Addendum.
28
S-52, Edition 6.0 March 2010
(iii) While a good-looking solution is desirable, identification without clutter is more important. Pattern symbols need not line up exactly between cells; and they need not stay in the same geographic position on re-draw.
(c) It should always be possible to identify an area by cursor picking on any point
within the area.
(d) If the ECDIS offers a ship-centred display mode, the manufacturer should avoid overwriting between the ship symbol and a centred symbol for an area which wholly encloses the display (for example the traffic direction arrow (TSSLPT) in a very large traffic lane such as Dover Strait).
3.1.2.2 Symbolising the area boundary: .1 Discussion: on a large scale display of busy waters the boundaries of many
areas may appear without the whole of each area being on the display. While the centred symbols will be there, it will often be difficult to know which area they apply to. It may also be difficult to decide which side of a particular boundary line is the inside of the area.
To help clarify this situation, the Presentation Library includes two area look-up tables: (i) the "symbolised area boundaries" table, using symbolised and "one-sided" versions of the boundary lines of important areas. This is for use at large scale as a mariner-optional alternative to (ii) the "plain area boundaries" table, which uses simple linestyle area boundaries. This will normally be preferred at smaller scales to avoid clutter.
.2 Symbolised complex linestyles: to identify the area, symbols (or letters acting as
symbols) are embedded in the line, e.g.: anchoring prohibited or restricted - LC(ACHRES 51) deep water route - LC(DWRUTE 51)
.3 One-sided complex linestyles: to identify the side of the boundary line on which
the area lies, restricted areas use the traditional "T" linestyle of the paper chart, e.g.:
entry prohibited or restricted - LC(ENTRES 51).
Other important areas use a boundary linestyle like the cold front on a weather map, e.g.:
waiting area - LC(CTYARE 51) fairway - LC(NAVARE 51)
.4 Simple linestyles: dashed lines are generally used for area boundaries. In
ECDIS, the dotted line is reserved for the danger line around foul areas, etc. .5 Colours: the colour magenta is used for important areas, grey for less important
areas, e.g.: traffic areas, caution areas - magenta harbour limits - grey
3.1.3 Symbol Specifications: Presentation Library
All symbols are specified in the Symbol Library for ECDIS, which is in the addendum to the Presentation Library.
29
S-52, Edition 6.0 March 2010
Some object classes do not have a symbol (e.g. territorial sea). Such "no symbol" objects may be picked up by cursor interrogation of the area.
Should an "unknown object" occur in the SENC which is not adequately defined or for which no symbol exists, its presence should be indicated on the display by a magenta"?" SY(QUESMRK1) with the IMO category "Standard Display".
Some objects are symbolised differently depending on circumstances (for example the symbol for a contour depends on whether it is the safety contour.) The Presentation Library includes conditional symbology procedure diagrams for features whose symbols cannot be supplied by a fixed look-up table. Some of these procedures are unavoidably complex, and they should be evaluated carefully.
3.1.4 Paper chart INT 1 and ECDIS Chart 1
IHO INT 1 for paper charts is both the starting point for the new simplified symbols and the check-list for paper-chart type symbols on the ECDIS. The new symbols simplify the paper chart symbols where operationally proved necessary, to improve readability and drawing speed on the display; they also symbolise new features introduced for ECDIS, such as the Daymark.
Note: the digital version of ECDIS Chart 1 depends on a volunteer to update it, and
it may be omitted from editions after 3.4.
Section 14 of the Presentation Library includes an ECDIS chart 1, a graphical index of ECDIS symbols including both simplified and paper-chart point symbols, and also the symbolized lines and area boundary linestyles. This is intended to familiarize the mariner with the colour and symbol coding used by the ECDIS. The symbols are grouped according to INT1, which is familiar to the mariner, but are numbered with a look-up sheet, not labelled. A digital version of ECDIS Chart 1 is part of the PresLib; the manufacturer should provide linking by cursor interrogation between the symbols and the explanations given in the symbol library.
The ECDIS Chart 1 is intended for use off-line and in route planning. It is not needed during route monitoring, when the mariner can use cursor enquiry to find the meaning of symbols.
Technical details of the digital ECDIS Chart 1 are given in sections 18.8 and 19.3 of the Presentation Library.
3.1.5 Size of lines, symbols and text; fonts
Lines and symbols and text should be large enough that they can be easily interpreted at the operational viewing distance. This will be about 70 cm for route planning, but experience to date indicates that the viewing distance for important features during route monitoring may be several metres. Human factors experts quote a minimum requirement that symbols and characters subtend 20 arc minutes at the observers eye (for example, a symbol viewed from 70cm for route planning should be about 4mm in size, 1.5 times the size of a normal chart symbol. Two times chart size is a good general rule.). Symbols and characters important for route monitoring may have to be significantly bigger.
For clear representation, symbols require a minimum number of screen units (pixels), depending on their complexity. A simple chart symbol should extend about 12 pixels

30
S-52, Edition 6.0 March 2010
(that is about 4 mm for an IHO standard screen).
The minimum sizes for all symbols should be as shown in the Presentation Library.
In addition, the symbols should always be drawn with at least the same number of pixels as are required to draw the symbol at the size defined in the Library for the minimum resolution and minimum chart display area (270x270 mm). That is, the minimum height in pixels of a symbol is: (symbol height in mm) divided by 0.312 mm (where 0.312 mm is the "pixel size" for the minimum size chart display in Section 5.1 – Physical Display Requirements). When the display scale is enlarged by zooming in, it should be possible to hold symbol size constant. The same applies to text. Symbol and text size should never be decreased when zooming out.
The text on the ECDIS should be readable from 1 metre.* Sans serif, non-italic fonts should be used. The computer ø should not be used.
Because several appropriate commercial fonts are available, the Presentation Library does not specify alphanumerics, except for soundings. The manufacturer should make his own arrangements for the use of a font. A plain, clearly readable font such as Univers should be used. In most fonts, pica 8 is too small to read.
*IEC 60945 specifies that character size in mm be not less than 3.5 x the viewing
distance in metres. Hence "readable from 1 metre" requires that characters be not less than 3.5 mm in size.
3.1.6 Display Orientation
It should always be possible to display the chart north-up (IMO PS section 8.1), but other orientations are allowed. (Human factors specialists point out that course-up orientation offers some safety advantages, and operational reports support this)
Symbols and text should always be drawn screen-up, no matter what the orientation of the screen may be. Symbols which include “rotate” in the symbology instruction (eg light flares) should be rotated with respect to the top of the screen. However symbols that are oriented according to an S-57 attribute such as ORIENT should be oriented with respect to true north. Further details are given in the Presentation Library, Part I, section 7.2.3.
If the display is oriented course-up, the orientation should not be altered too frequently, in order to avoid jitter from frequent rewriting of chart information.
The north arrow is always required on the display, as part of the IMO Performance Standards Display Base.
3.1.7 ENC scale; Graphical Index of ENCs by Navigational Purpose; Limit of HO data
.1 ENC scale. The compilation scale of the ENC is the scale at which the ENC was designed to be displayed. It may not be the same as the scale of the source data. As required by IMO Performance Standards, section 6.1.1, an overscale indication should be shown whenever the mariner selects a display scale that is larger than the compilation scale. See Presentation Library, Part I, section 12.2.2 DATCVR for details.
31
S-52, Edition 6.0 March 2010
.2 Automatic overscale at a scale boundary. Where ENCs of different navigational purpose overlap, the ECDIS display of the overlap area should show two “chart compilation scale boundaries”, at the beginning and end of the overlap. Beyond one boundary the part of the display taken from the smaller scale ENC will often be grossly overscale. (See section 3.2.3 8(b))
Only the major changes in compilation scale resulting from a change in
“navigational purpose” should be shown as scale boundaries on the display. Small changes in compilation scale within a navigational purpose should not be shown.
The Presentation Library, Part I, section 12.2.2 DATCVR, specifies how the scale
boundaries and the overscale area should be symbolised.
When the display cannot be completely covered with ENC data for the selected navigational purpose, the remaining part of the display should be filled with data based on a more general navigational purpose (if available).
.3 Graphical Index of ENCs by Navigational Purpose. Without cursor enquiry of the
chart area it will not always be clear what compilation scale applies to a given part of a mixed source display. S-52 requires a graphical index of the navigational purpose of the data to clarify the situation. This is also needed for route planning.
.4 Limit of HO data. The end of HO chart data on this graphical index defines the
limit of HO ENC coverage. Details are given in the Presentation Library, Part 1, section 12.2.2 DATCVR.
3.1.8 Chart data quality indicator
A bathymetric data quality indicator by zones of confidence (M_QUAL CATZOC) will cover the entire area of depth data or bathymetry for the ENC (although not all data will be assessed initially). The table of "CATZOC" values giving the meaning of each zone of confidence should be readily available to the mariner.
3.1.9 Cursor enquiry
It should be possible to call up any of the information associated with an object by cursor enquiry on its symbol. This should extend to areas (restricted area, depth area, etc.) and to "no symbol" areas (territorial seas, etc.) and meta-areas (information about the area such as compilation scale, etc.). The search for area information needs to extend only to the cell boundaries enclosing the position of the cursor.
See Presentation Library, Part I, section 8.8 for further discussion. 3.2 New Symbols for ECDIS (These are illustrated in the ECDIS Chart 1, provided in the Presentation Library). 3.2.1 Types of new symbols
Four types of new symbols have been introduced for ECDIS:
(1) Special ECDIS chart symbols to identify unsafe depths, such as the safety

32
S-52, Edition 6.0 March 2010
contour, safety depth, isolated dangers etc.
(2) Optional simplified chart symbols for buoys and beacons, and symbolized area boundary linestyles.
Since buoys and beacons are a potential hazard as well as an aid to navigation, simplified buoy and beacon symbols have been designed which are more compact and more prominent than the paper chart symbols, particularly at night.
On a large scale display, the boundary lines of areas can become confusing; symbolised area boundaries have been designed which identify the type of area involved and also indicate on which side of the boundary line the area lies.
The ECDIS should provide the mariner with the option of using either the traditional paper chart buoy and beacon symbols or the new simplified symbols, and either the symbolized or the plain area boundary linestyles, as best fits his purpose. The symbol tables of the Presentation Library are organised to facilitate these options.
(3) New chart symbols, such as north arrow, scale boundary, depth area less than
safety contour, etc., needed to explain the more flexible, electronic display based, presentation of ECDIS.
(4) IEC Mariner's Navigational Elements developed by IEC for IMO, which include
the important planned route and own ship symbols. The authority for these features is IEC Standard 61174 and IEC 62288, and they are included in the Presentation Library for convenient reference by agreement with the IEC. They are described by objects and attributes in the same manner as chart features so that only one symbolising routine is required (see Part II of the Presentation Library).
3.2.2 Special ECDIS chart symbols to identify unsafe depths
The ECDIS highlights in new ways four features that are important for safe navigation. These are the safety contour, depth shades, the safety depth and isolated dangers:
(1) The own-ship safety contour, selected by the mariner from among the contours
in the SENC, is double-coded by a thick line and a prominent change in depth shade.
If the safety contour selected by the mariner is not available in the SENC, the ECDIS should default to next deeper contour and inform the mariner. If, when the ship moves onto a new chart, the safety contour previously in use is no longer available, the ECDIS should again select the next deeper contour, and inform the mariner.
If the mariner does not select a safety contour, the value should default to 30 m. See Presentation Library, Part I, section 12.2.5 conditional procedure
DEPCNTnn for details.
(2) Depth zone shades, defined by the safety contour and selected shallow and deep contours and the drying line.
The safety contour defines two depth zone shades and the drying line a third:
33
S-52, Edition 6.0 March 2010
deep water: deeper than the safety contour (colour token DEPDW), shallow water: shallower than the safety contour (colour token DEPVS), intertidal area: area exposed at low water (colour token DEPIT).
These are the only three depth shades that can be clearly distinguished on the night display, and they can only be distinguished by contrast, when seen on the display together. If, at night, the entire display consists of shallow water, the mariner will not be able to recognise this dangerous situation. Therefore, a "depth less than safety contour" pattern is provided in the Presentation Library to reinforce the depth shade. It is optional for the manufacturer to provide this feature, but its inclusion is strongly recommended as a safety feature.
The mariner should be given the option of whether to use this pattern, by night or by day (although it is not strictly necessary by day when the shallow water can be clearly identified by the difference in depth shade). This mariner’s option is built into conditional symbology procedure “SEABEDnn”. See Presentation Library , sections 8.5.7 and 12.2.18.
It is recommended that the ECDIS should also allow the mariner the option of selecting a deep contour and a shallow contour from among the contours in the SENC, thus establishing the following five depth zones:
deep water: deeper than the deep contour (colour token DEPDW), medium-deep water: depths between the deep contour and the safety
contour (DEPMD), medium-shallow: depths between the safety contour and the shallow
contour (DEPMS),
very shallow water: depths between the shallow contour and zero metre contour (DEPVS)
drying foreshore: intertidal area (DEPIT) The following depth zones may be used as default values:
deep water: deeper than 30 m (deep draught vessels)
medium deep: own-ship safety contour to 30 m
medium shallow: 2 m to the own-ship safety contour
very shallow: 0 to 2 m (defines waters accessible to small craft)
intertidal: exposed at low water
(3) The own-ship safety depth is intended as an aid when no appropriate safety
contour is available in the SENC. Soundings equal to or less than the safety depth selected by the mariner are made more conspicuous than deeper soundings. A separate set of sounding figures is provided in the Presentation Library.
(4) Isolated dangers (small shoals, rocks, wrecks, obstructions) of depth less than
the safety contour, and also lying within the 'safe' water defined by the safety contour, are highlighted by a special symbol. Because the mariner may sometimes have to navigate in water shallower than a default safety contour, the mariner may also select to show isolated dangers in the 'unsafe' water between the displayed safety contour and the zero metre contour.
34
S-52, Edition 6.0 March 2010
Instructions for these four procedures are given in the Presentation Library, Part I, section 12 'Conditional Symbology Procedures'.
3.2.3 Other new and simplified ECDIS symbols and their use
Other new chart symbols required by the difference in purpose between ECDIS and the paper chart, as well as the difference between paper and electronic presentation, are described below.
Note that all simplified point symbols are centred on the position of the feature.
(1) Simplified buoy symbols.
Sloping topmark symbols are used for lateral, cardinal, isolated danger and safe water buoys. They are coloured in the single most distinctive colour of the buoy (mixed colours in a small buoy symbol look faint on the night display). Special mark buoys are filled yellow circles, and all mooring buoys resemble the paper chart "installation buoy". The default buoy, used when a buoy is not fully described in the ENC or has no specific symbol in the Presentation Library, is a filled grey circle.
All symbols are centred on the position of the buoy.
When the name or number of the buoy is displayed, it is prefixed "By" by the Presentation Library, since otherwise a number can be mistaken for a sounding.
Note 1: this way of displaying buoys is designed primarily to show clearly that a
buoy is there, both to avoid collision with the buoy and as an aid to navigation. The details of buoy characteristics, which cause clutter and are difficult to show clearly on an electronic display under all bridge lighting conditions, should be provided by text command or by individual cursor interrogation.
Note 2: green radar on green buoys or light flares does not contrast well, hence
buoys and light flares are written over the radar and all light flares are surrounded by a black outline.
(2) Simplified beacon symbols.
Upright topmark symbols are used for cardinal and isolated danger beacons. Lateral beacons, safe water beacons and specials mark beacons are drawn as specific symbols for minor beacons, general beacons, and beacon towers. Beacons are shown in the same colour as buoys, except for the safe water beacon which is black (white at night). The default beacon is a grey general beacon symbol.
All symbols are centred on the position of the beacon. When the name or number of a beacon is displayed, it is prefixed "Bn".
(3) General symbol for isolated underwater danger.
This conspicuous magenta symbol is applied automatically to rocks, wrecks, small shoals, etc., of depth equal to or less than the own-ship safety contour
35
S-52, Edition 6.0 March 2010
and which are in deeper water than the safety contour. Optionally, the mariner may extend displaying isolated dangers to shallow waters between the safety contour and the zero metre contour, in case he is forced by circumstances to navigate in such waters.
(4) The dredged area is shown by a grey dotted area fill pattern.
(5) Radar conspicuous coastline.
This includes cliffs and abrupt coastlines that can be expected to return a strong radar echo consistently from the same part of the feature. The magenta highlight line is only used if the coastline is identified as "radar conspicuous" in the ENC.
(6) Prohibitions, cautions and information notes are symbolized with small
symbols for point application and with large centred symbols for areas, as illustrated in screens (AB), (JKL) and (MN) of the ECDIS Chart 1. Multiple symbols are used when necessary to convey more than one restriction.
Regulated areas are divided for symbolization into Cautionary Areas (including the existing caution area) and Information Areas, following the distinction established by the IMO/IHO Harmonisation Group on ECDIS in 1992. (See Table 4 of this document).
Point cautions and notes entered by the mariner and the manufacturer are distinguished by the colours orange and yellow respectively.
(7) Unknown object.
A magenta "?" marks the position of an object which cannot be identified or for which there is no entry in the Presentation Library look-up table.
(8a) Scale boundary.
This shows where the compilation scale of the chart data available changes. The ECDIS should warn the mariner of upcoming chart scale change. Only the major changes in compilation scale resulting from a change in "navigational purpose" should be shown. Small changes in compilation scale within a navigational purpose should not be shown. See Presentation Library, Part I, section 12.2.2 DATCVR for details.
(8b) Overscale area at scale boundary.
All the chart data on the display must be shown at the same scale. In order to avoid leaving part of the display blank, the chart display may extend beyond the edge of a relatively large scale ENC to include information from an adjoining smaller scale ENC, which may be from a different "navigational purpose". The smaller scale data will normally be enlarged to match the larger scale ENC, and in this case the "overscale area" symbol should be used to identify any part of the chart display shown at more than twice the compilation scale. See Presentation Library, Part I, section 12.2.2 DATCVR for details.
Note that this symbol applies only to the automatic overscaling performed by the ECDIS in matching ENCs at different compilation scales. It should not be applied to an overscale display deliberately requested by the mariner, which
36
S-52, Edition 6.0 March 2010
should trigger the overscale indication required by IMO Performance Standard section 6.1.1.
(8c) Change of units of depth. (This section is deleted) (8d) Change of horizontal (geodetic) datum.
The use of non-WGS 84 ENC data does not comply with IHO S-57, and the boundary at which the local geodetic datum changes is not symbolized by the Presentation Library.
The ENC may include information on the relation between the local geodetic datum and WGS 84 (M_HDAT, HORDAT), but this is intended for use in converting local data to WGS 84 for use in the SENC, should the need arise.
(9) Scale bar or latitude scale.
The IMO PS require an indication of scale and range as part of the Display Base. The display scale decides which should be used:
(a) for display scales larger than 1/80,000: always display the 1 mile scale
bar provided in the Presentation Library (b) for display scales at 1/80,000 or smaller: always display the 10 mile
latitude scale provided in the Presentation Library.
The scale bar or latitude scale should always be drawn vertically at the left side of the chart display, just clear of the border of the display.
The mariner should be able to remove any labels on the scales to avoid clutter.
"Display Scale" is defined as: [distance between two features on the display] / [distance between the same two features on the earth's surface]. This means that 1/75,000 is a larger scale than 1/80,000.
(10) North arrow.
The IMO PS requires a north arrow as part of the Display Base. The north arrow should always be shown at the top left corner of the chart display, just clear of the scale bar or latitude scale.
(11) Manual chart correction.
Small orange identifiers are used to distinguish hand-entered chart corrections, which are subject to human error, from corrections entered automatically by electronic means. The original chart object should not be removed or altered. (See 2.3.4 for details).
(12) Ramark, Racon.
This is introduced to distinguish beacons that will appear on the radar display from other radio-beacons.
(13) Data from non-HO sources
37
S-52, Edition 6.0 March 2010
The non-HO data boundary LC(NONHODAT) serves to separate ENC data
from non-HO chart information. See section 2.3.1c for further details on identifying non-HO data.
(14) No data areas. The first action of the ECDIS display re-draw should be to cover the entire
screen with the NODTA area colour fill and the AP(NODATA03) area pattern. These will remain to identify any area not subsequently covered by chart information as a no data area.
(15) Identifying pattern for depth areas less than the safety contour. (this section is covered by section 3.2.2 (2)) (16a) Identifying pattern for traffic junctions, crossings and roundabouts. A pattern of diagonal magenta lines is used to identify the areas of a traffic
separation scheme which are traffic junctions, crossings or roundabouts, or precautionary areas.
(16b) Traffic routeing and regulated areas in general. New centred symbols are provided in the Presentation Library, to avoid the
clutter caused by a pattern of symbols in these often critical waters. Details are given on screens (JKL). (M) and (N) of the ECDIS Chart 1.
(17) Glacier or ice shelf. A random pattern of short lines symbolising "candled" ice is provided to
indicate a glacier or area of shore-fast ice. (18) Daymark. The daymark symbols are designed so that they can be over-written on a
beacon which is highlighted by a daymark. (19) Paper chart symbols for an opening bridge and a radar reflector on an
overhead cable have been revised to fit any orientation of the bridge or cable - see ECDIS Chart 1.
(20) A one-sided linestyle is provided for use on large-scale displays to indicate
the side of an area boundary on which the area lies, when only a part of the boundary can be seen on the display.
(21) Meta-data (information about the chart data), such as chart data confidence
areas. The "zones of confidence " in the chart data (section 3.1.8) are symbolised by
a system of stars. Other meta-data items, including compilation scale, IALA "A" or "B" buoyage, etc, are left to cursor picking.
(22) Special identifiers.
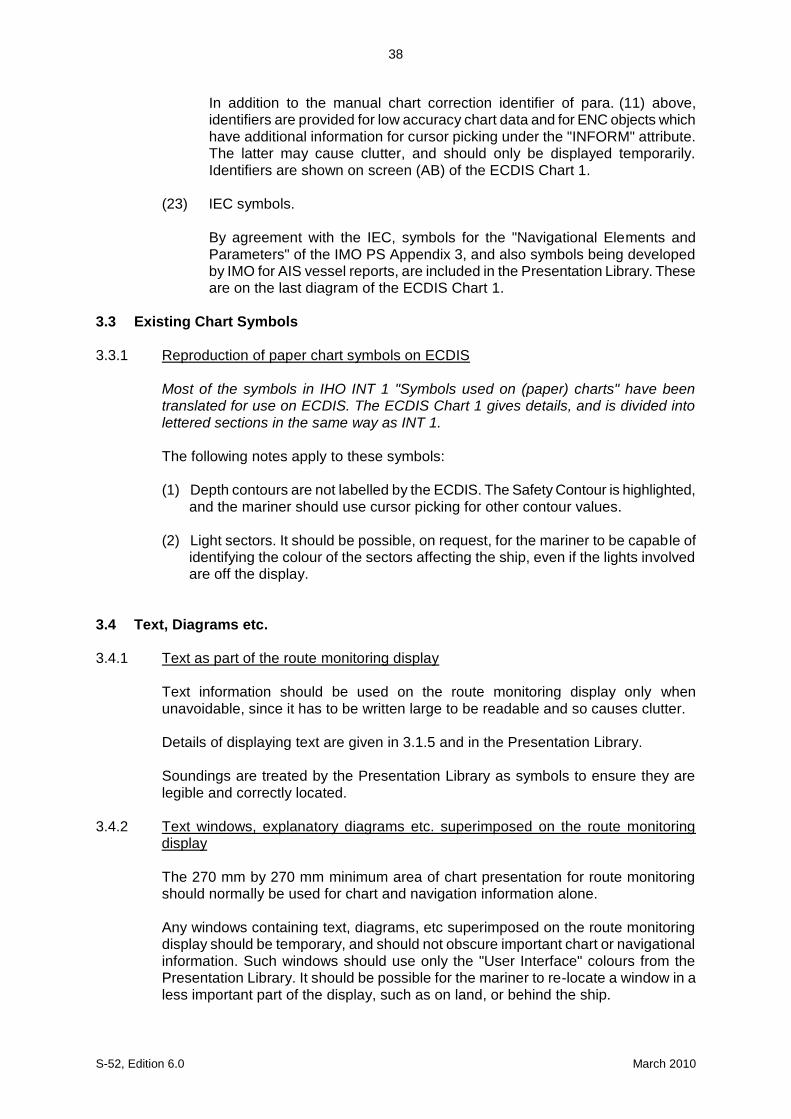
38
S-52, Edition 6.0 March 2010
In addition to the manual chart correction identifier of para. (11) above, identifiers are provided for low accuracy chart data and for ENC objects which have additional information for cursor picking under the "INFORM" attribute. The latter may cause clutter, and should only be displayed temporarily. Identifiers are shown on screen (AB) of the ECDIS Chart 1.
(23) IEC symbols. By agreement with the IEC, symbols for the "Navigational Elements and Parameters" of the IMO PS Appendix 3, and also symbols being developed by IMO for AIS vessel reports, are included in the Presentation Library. These are on the last diagram of the ECDIS Chart 1.
3.3 Existing Chart Symbols 3.3.1 Reproduction of paper chart symbols on ECDIS
Most of the symbols in IHO INT 1 "Symbols used on (paper) charts" have been translated for use on ECDIS. The ECDIS Chart 1 gives details, and is divided into lettered sections in the same way as INT 1.
The following notes apply to these symbols:
(1) Depth contours are not labelled by the ECDIS. The Safety Contour is highlighted,
and the mariner should use cursor picking for other contour values.
(2) Light sectors. It should be possible, on request, for the mariner to be capable of identifying the colour of the sectors affecting the ship, even if the lights involved are off the display.
3.4 Text, Diagrams etc. 3.4.1 Text as part of the route monitoring display
Text information should be used on the route monitoring display only when unavoidable, since it has to be written large to be readable and so causes clutter.
Details of displaying text are given in 3.1.5 and in the Presentation Library.
Soundings are treated by the Presentation Library as symbols to ensure they are legible and correctly located.
3.4.2 Text windows, explanatory diagrams etc. superimposed on the route monitoring
display
The 270 mm by 270 mm minimum area of chart presentation for route monitoring should normally be used for chart and navigation information alone.
Any windows containing text, diagrams, etc superimposed on the route monitoring display should be temporary, and should not obscure important chart or navigational information. Such windows should use only the "User Interface" colours from the Presentation Library. It should be possible for the mariner to re-locate a window in a less important part of the display, such as on land, or behind the ship.

39
S-52, Edition 6.0 March 2010
3.4.3 Separate text panel on the same screen as the route monitoring display
A Mariner's Information Panel, consisting mainly of text (alphanumerics), might include:
- ECDIS alarms and indications, e.g." crossing safety contour", - navigation information, e.g. time, position, course to make good, etc., - chart information, e.g. contour selected for own-ship safety contour, - supplementary chart information, e.g. tide tables, sailing directions, - interface dialogue, e.g. "change to night colour table". - etc.
Sea experience has shown that the text panel on the route monitoring display may have a prominence out of proportion to its significance to safety of navigation. This is particularly damaging to ECDIS performance at night, when the strictly dimmed chart display, which carries nearly all of the information of importance to navigation, may be overwhelmed by the light emitted from large, bold or bright characters on the text display, some conveying relatively unimportant information.
The text panel should be outside the 270 by 270 mm minimum area designated for the route monitoring chart display by the IMO PS. The colours, symbols and luminance of this user interface panel should not degrade the SENC information on the chart display.
At night it is essential that any interface panel or other information added by the manufacturer to the screen carrying the chart display should never generate more light than the chart display itself. Great care is taken to reduce the light emitted by the chart in order to preserve the mariners night vision, and it is dangerous to ship safety if added non-chart information defeats that purpose.
It is particularly important to limit the information shown using the conspicuous colour token "UINFD", which is reserved for important information. Even a small panel of text in this colour can produce more light on the bridge than the entire route monitoring chart display.
3.4.4 Text shown on a separate auxiliary screen
A separate screen may be provided for text display, either instead of or in addition to a panel on the main screen used for the route monitoring display. The presentation on this auxiliary screen need not follow these specifications in detail, but should conform in general, to avoid confusion, and should meet the same bridge lighting constraints.
All information displays should be designed in accordance with ergonomic principles.

40
S-52, Edition 6.0 March 2010
4 SPECIFICATIONS FOR COLOURS 4.1 General
The ECDIS manufacturer can use any technology to build his display as long as his display fulfils the requirements of this specification. It is known that at least displays based on CRT, TFT or LCD can be made to fulfill the requirements of this standard.
The colours are specified in CIE (Commission Internationale de l'Eclairage) xy chromaticity coordinates and luminance L. CIE colour coordinates are used because any other colour specification, such as RGB, is specific to a particular monitor and so cannot be specified either in relative or in absolute terms. Procedures for converting these CIE coordinates to RGB values for the ECDIS display are described in sections 4.2.6, 5.2.3 and 5.2.4 below, and in Annex B. It is strongly recommended that these procedures be followed.
The ECDIS manufacturer may use other methodology if he wishes, however the colours of features on the ECDIS display should appear the same as would be obtained by following the procedures in this document.
The Colour Tables are in the Presentation Library, Part I, section 13. The Colour Tables are also included in the .dai file of the digital Presentation Library, however the maintenance of this file depends on a volunteer provider.
Note that these colour specifications apply to both the operational chart display (for route planning and route monitoring), and also to any text on the same screen as the chart display.
The colour tables have been carefully designed by perception specialists to give the maximum clarity and contrast between features on the display under all light conditions on the bridge.
4.2 Colour Assignment
Since chart and navigation lines and symbols must show clearly against the background shades, the colour tables were constructed by first selecting the background area shades and then selecting colours for lines and symbols that contrast with their background. In selecting foreground colours for point and line features, lines and symbols, the aim has been to highlight important information by giving it greater contrast with the background.
In order to accommodate the very large change in bridge lighting between bright sun and dark night , the colours switch from a light background with dark foreground details , which has been found to give the best contrast under bright sun, to a dark background with light foreground details by night. The night display has to be dim enough that it can be viewed without impairing the mariner's night vision. The Dusk table is also a black-background table, for optional use by day as well as at twilight.
The design of both colours and symbols has concentrated on ensuring that important chart and navigation features remain clearly visible under the extremes of bright sun and dark night viewing.
The general assignment of colours is given in Table 1 and condensed Colour Tables are in Table 2.
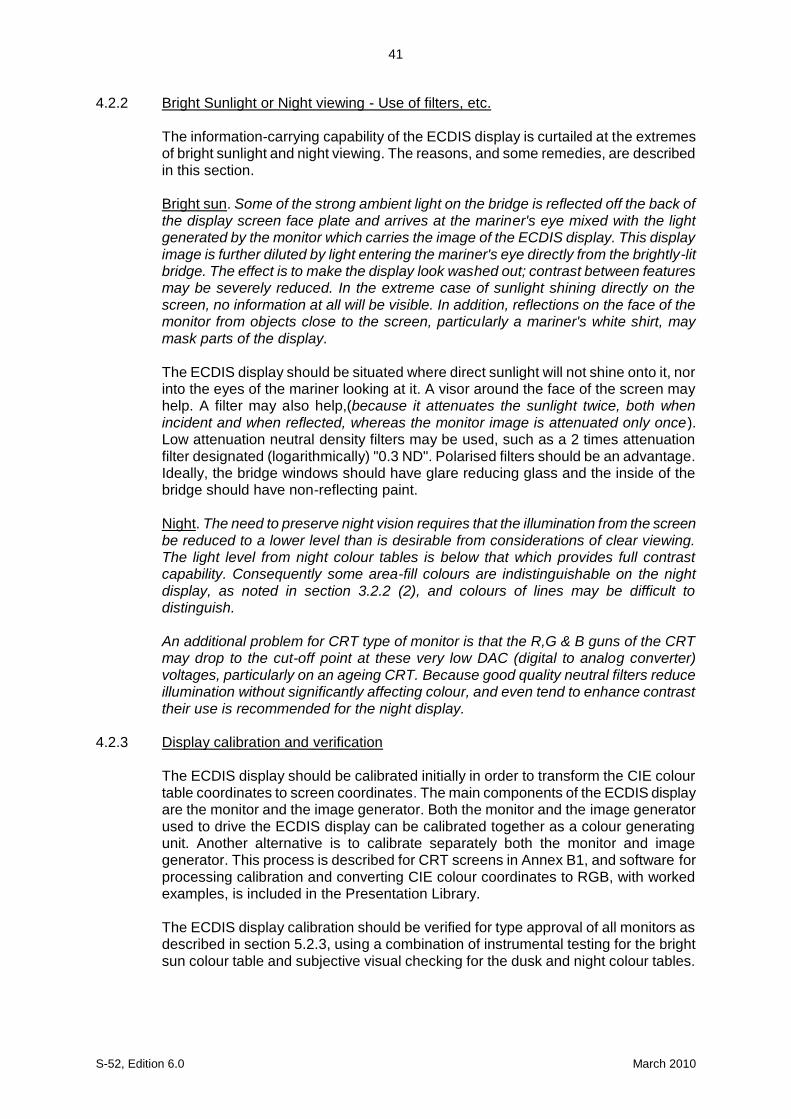
41
S-52, Edition 6.0 March 2010
4.2.2 Bright Sunlight or Night viewing - Use of filters, etc.
The information-carrying capability of the ECDIS display is curtailed at the extremes of bright sunlight and night viewing. The reasons, and some remedies, are described in this section.
Bright sun. Some of the strong ambient light on the bridge is reflected off the back of the display screen face plate and arrives at the mariner's eye mixed with the light generated by the monitor which carries the image of the ECDIS display. This display image is further diluted by light entering the mariner's eye directly from the brightly-lit bridge. The effect is to make the display look washed out; contrast between features may be severely reduced. In the extreme case of sunlight shining directly on the screen, no information at all will be visible. In addition, reflections on the face of the monitor from objects close to the screen, particularly a mariner's white shirt, may mask parts of the display.
The ECDIS display should be situated where direct sunlight will not shine onto it, nor into the eyes of the mariner looking at it. A visor around the face of the screen may help. A filter may also help,(because it attenuates the sunlight twice, both when incident and when reflected, whereas the monitor image is attenuated only once). Low attenuation neutral density filters may be used, such as a 2 times attenuation filter designated (logarithmically) "0.3 ND". Polarised filters should be an advantage. Ideally, the bridge windows should have glare reducing glass and the inside of the bridge should have non-reflecting paint.
Night. The need to preserve night vision requires that the illumination from the screen be reduced to a lower level than is desirable from considerations of clear viewing. The light level from night colour tables is below that which provides full contrast capability. Consequently some area-fill colours are indistinguishable on the night display, as noted in section 3.2.2 (2), and colours of lines may be difficult to distinguish.
An additional problem for CRT type of monitor is that the R,G & B guns of the CRT may drop to the cut-off point at these very low DAC (digital to analog converter) voltages, particularly on an ageing CRT. Because good quality neutral filters reduce illumination without significantly affecting colour, and even tend to enhance contrast their use is recommended for the night display.
4.2.3 Display calibration and verification
The ECDIS display should be calibrated initially in order to transform the CIE colour table coordinates to screen coordinates. The main components of the ECDIS display are the monitor and the image generator. Both the monitor and the image generator used to drive the ECDIS display can be calibrated together as a colour generating unit. Another alternative is to calibrate separately both the monitor and image generator. This process is described for CRT screens in Annex B1, and software for processing calibration and converting CIE colour coordinates to RGB, with worked examples, is included in the Presentation Library.
The ECDIS display calibration should be verified for type approval of all monitors as described in section 5.2.3, using a combination of instrumental testing for the bright sun colour table and subjective visual checking for the dusk and night colour tables.
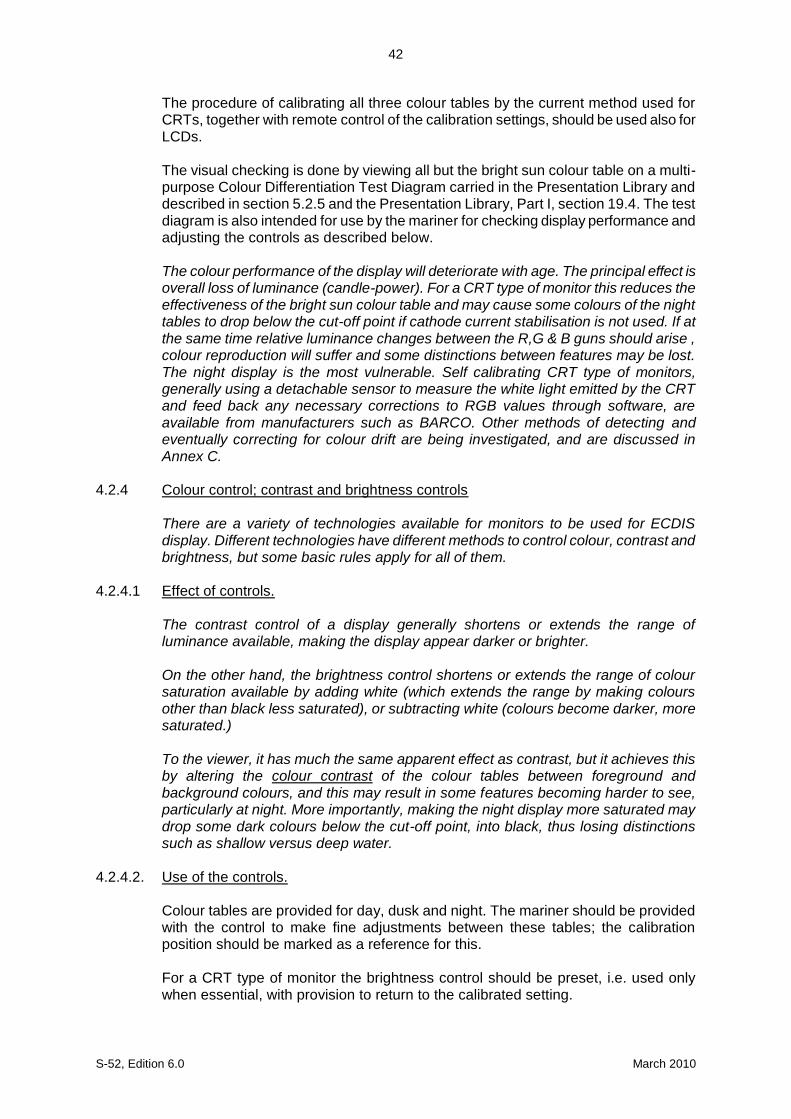
42
S-52, Edition 6.0 March 2010
The procedure of calibrating all three colour tables by the current method used for CRTs, together with remote control of the calibration settings, should be used also for LCDs.
The visual checking is done by viewing all but the bright sun colour table on a multi-purpose Colour Differentiation Test Diagram carried in the Presentation Library and described in section 5.2.5 and the Presentation Library, Part I, section 19.4. The test diagram is also intended for use by the mariner for checking display performance and adjusting the controls as described below.
The colour performance of the display will deteriorate with age. The principal effect is overall loss of luminance (candle-power). For a CRT type of monitor this reduces the effectiveness of the bright sun colour table and may cause some colours of the night tables to drop below the cut-off point if cathode current stabilisation is not used. If at the same time relative luminance changes between the R,G & B guns should arise , colour reproduction will suffer and some distinctions between features may be lost. The night display is the most vulnerable. Self calibrating CRT type of monitors, generally using a detachable sensor to measure the white light emitted by the CRT and feed back any necessary corrections to RGB values through software, are available from manufacturers such as BARCO. Other methods of detecting and eventually correcting for colour drift are being investigated, and are discussed in Annex C.
4.2.4 Colour control; contrast and brightness controls
There are a variety of technologies available for monitors to be used for ECDIS display. Different technologies have different methods to control colour, contrast and brightness, but some basic rules apply for all of them.
4.2.4.1 Effect of controls.
The contrast control of a display generally shortens or extends the range of luminance available, making the display appear darker or brighter.
On the other hand, the brightness control shortens or extends the range of colour saturation available by adding white (which extends the range by making colours other than black less saturated), or subtracting white (colours become darker, more saturated.)
To the viewer, it has much the same apparent effect as contrast, but it achieves this by altering the colour contrast of the colour tables between foreground and background colours, and this may result in some features becoming harder to see, particularly at night. More importantly, making the night display more saturated may drop some dark colours below the cut-off point, into black, thus losing distinctions such as shallow versus deep water.
4.2.4.2. Use of the controls.
Colour tables are provided for day, dusk and night. The mariner should be provided with the control to make fine adjustments between these tables; the calibration position should be marked as a reference for this.
For a CRT type of monitor the brightness control should be preset, i.e. used only when essential, with provision to return to the calibrated setting.
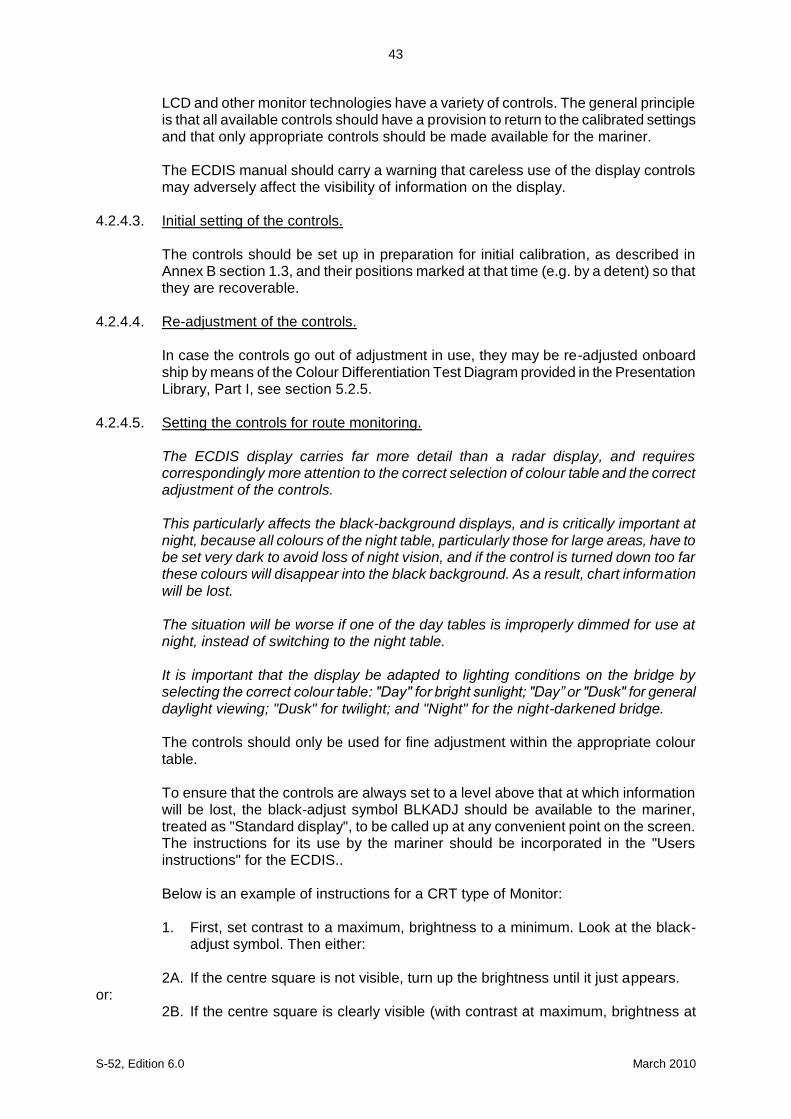
43
S-52, Edition 6.0 March 2010
LCD and other monitor technologies have a variety of controls. The general principle is that all available controls should have a provision to return to the calibrated settings and that only appropriate controls should be made available for the mariner. The ECDIS manual should carry a warning that careless use of the display controls may adversely affect the visibility of information on the display.
4.2.4.3. Initial setting of the controls. The controls should be set up in preparation for initial calibration, as described in Annex B section 1.3, and their positions marked at that time (e.g. by a detent) so that they are recoverable.
4.2.4.4. Re-adjustment of the controls. In case the controls go out of adjustment in use, they may be re-adjusted onboard ship by means of the Colour Differentiation Test Diagram provided in the Presentation Library, Part I, see section 5.2.5.
4.2.4.5. Setting the controls for route monitoring. The ECDIS display carries far more detail than a radar display, and requires correspondingly more attention to the correct selection of colour table and the correct adjustment of the controls. This particularly affects the black-background displays, and is critically important at night, because all colours of the night table, particularly those for large areas, have to be set very dark to avoid loss of night vision, and if the control is turned down too far these colours will disappear into the black background. As a result, chart information will be lost. The situation will be worse if one of the day tables is improperly dimmed for use at night, instead of switching to the night table. It is important that the display be adapted to lighting conditions on the bridge by selecting the correct colour table: "Day" for bright sunlight; "Day” or "Dusk" for general daylight viewing; "Dusk" for twilight; and "Night" for the night-darkened bridge. The controls should only be used for fine adjustment within the appropriate colour table. To ensure that the controls are always set to a level above that at which information will be lost, the black-adjust symbol BLKADJ should be available to the mariner, treated as "Standard display", to be called up at any convenient point on the screen. The instructions for its use by the mariner should be incorporated in the "Users instructions" for the ECDIS.. Below is an example of instructions for a CRT type of Monitor: 1. First, set contrast to a maximum, brightness to a minimum. Look at the black-
adjust symbol. Then either: 2A. If the centre square is not visible, turn up the brightness until it just appears.
or: 2B. If the centre square is clearly visible (with contrast at maximum, brightness at
44
S-52, Edition 6.0 March 2010
minimum), turn the contrast down until the inner square disappears, then turn contrast back up until the inner square is just visible again.
(If the above adjustment is not successful, select a more appropriate colour table and
repeat this procedure). The "black level" is now correctly set. If a brighter display is required use the contrast
control, but it is better not to re-adjust the controls unless lighting conditions on the bridge change.
Note that the black-adjust symbol should be displayed to check that the inner square
remains visible on the following occasions: - every time that the brightness or contrast controls are adjusted, - every time that the display is switched to the night colour table. Below is an example of instruction for LCD type of Monitor. The LCD type of monitor
used in this example has only one mariner control, which is called brilliance. Internally the monitor has also other controls available for service engineers. These internal controls include also controls named as contrast and brightness.
1. First, set brilliance to calibration position. Look at the black-adjust symbol. Then
either: 2A. If the centre square is not visible, turn up the brilliance until it just appears.
or: 2B. If the centre square is clearly visible, turn down the brilliance until the inner
square disappears, then turn brilliance back up until the inner square is just visible again.
(If the above adjustment is not successful, select a more appropriate colour table and
repeat this procedure). The "black level" is now correctly set. If a brighter display is required use the brilliance
control, but it is better not to re-adjust the controls unless lighting conditions on the bridge change.
Note that the black-adjust symbol should be displayed to check that the inner square
remains visible on the following occasions: - every time that the brightness or contrast controls are adjusted, - every time that the display is switched to the night colour table. It is recommended that the BLKADJ symbol be displayed automatically all the time
that the night colour table is selected, with a mariner over-ride to remove it if necessary.
4.2.5 The colour tables
Earlier editions of S-57 App.2 provided five colour tables. To simplify the operation of
ECDIS by the mariner these have been reduced to three colour tables, all of which should be made available to the mariner. These are listed in a condensed form in Table 2 and specified in detail in the Presentation Library. They are as follows:
DAY (table 2.1) The "Day" table uses a white background as a result of a

45
S-52, Edition 6.0 March 2010
comparative test outdoors in bright sunlight which showed that a display background of maximum luminance gives the best contrast achievable under near-washout conditions. This conclusion has been confirmed by subsequent sea experience.
DUSK (table 2.2) The "Dusk" colour table is a black background table, which may
also be used by day as a mariner's option. NIGHT (table 2.3) At night the light emitted by the display must be strictly limited to
avoid impairing night vision. In case the luminance needs to be further reduced, the "Night" colour table may be augmented by a luminance-reducing neutral density filter which should have 8 times attenuation, designated (logarithmically) "0.9 ND". (This is a manufacturer's option).
4.2.6 The colour scheme - colour tokens
The colour scheme of the Presentation Library is designed to fit current computer architecture. A digital look-up table assigns all object/attribute combinations of features from the SENC to one of 64 "colour tokens". A few tokens apply to only one feature, but most include a group of similar features; e.g. traffic lanes, traffic direction arrows, prohibited areas and other such features share the "trfcd" for "traffic control dominant (conspicuous)" colour token. In turn, each token is assigned colour coordinates in the digital colour tables of the Presentation Library. Tables 2 and 3 at the end of this document illustrate how this scheme works.
4.2.7 Transparency Transparent area colour fill is used at present:
(i) so that the background colours, lines and symbols show through an area shade (e.g. depth shades and contours should show through a traffic separation zone),
(ii) to reduce the prominence of a large symbol (e.g. too prominent a centred
anchorage area symbol would cause clutter on the display). Transparent fill can be achieved in two ways:
1.) with a given percentage of the pixels having the transparent fill colour (see Presentation Library, Part I, section 7.4.2),
2.) by mixing the fill and underlay colour according to the procedure given in the
Presentation Library, Part I, section 4.2.3.2. This must be done in such a way that no appearance of change in colour or shape occurs in any SENC feature on the display, at any intermediate transparency value. The underlying SENC information must remain distinguishable, except when the overlay colour approaches 100%, in which case Section 2.3.2 (b) applies, and an indication is required.

46
S-52, Edition 6.0 March 2010
5 SPECIFICATIONS FOR THE DISPLAY SCREEN 5.1 Physical display requirements
The requirements of S-52 for the main graphic display are:
"Size: minimum effective size of the area for chart display: 270 x 270 mm.
"Resolution: minimum lines per mm (L) given by L=864/s, where s is the smaller dimension of the chart display area. (e.g. for the minimum chart area, s=270 mm and the resolution L=3.20 lines per mm, giving a "picture unit" size of 0.312 mm)
"Colours: 64.
Information should be displayed in the ECDIS on one or more physical screens, which
may be divided into more than one chart display. Information may be displayed automatically, on demand or as a result of mariners selection.
Redraw during route monitoring to follow the ship's progress, including scale changes
due to change in the scale of the chart information, should take less than 5 seconds. Demands by the mariner that cannot be predicted by the ECDIS, such as draw at a different scale or in a different area may take more than 5 seconds. In the latter case: - the mariner should be informed; - the display should continue route monitoring until the new information is ready to
draw within 5 seconds. 5.2 Additional Requirements 5.2.1 Reproducing small features and symbols
The specifications above permit a chart display whose minimum resolution (lines/mm) may vary depending on the size of the display. To maintain a clearly readable chart display under this flexibility requires the following constraints to ensure that enough "picture units" (pixels) are always used to draw small features and symbols clearly:
(1) Chart features: Chart features should never be drawn with fewer "picture units"
(ie. lines, pixels, dot-pitch intervals) than when drawn on a 270 x 270 mm chart area at SENC scale.
(2) Symbols: For clear representation, symbols require a minimum number of picture
units, depending on their complexity. A simple chart symbol should extend about 12 pixels (that is at least 3.5mm for an IHO standard screen.) See section 3.1.5 for details on the size of symbols.
5.2.2 Colour display capability
The colours, as specified in CIE x,y chromaticity co-ordinates and luminance L, are intended for a display capable of at least 256 luminance steps in each of red green and blue
For night performance it is essential that the ECDIS hardware has a graphics card capable of giving "blacker than black", ie complete control of colour, and that the
47
S-52, Edition 6.0 March 2010
software can control that function.
For CRT type of monitor cathode (beam) current stabilisation is desirable, to prevent dark colours dropping below the cut-off point.
5.2.3 Colour conversion tolerances and tests 5.2.3.1 Tolerances. The tolerances quoted below apply only to the process of converting CIE
colour coordinates to RGB values, and so should be evaluated shortly after the ECDIS leaves the manufacturer's plant.
Considerable operational experience will be needed before it will be possible to state colour maintenance tolerances for ECDIS onboard ship.
The colour tables developed have been selected to ensure maximum colour discrimination between features. Colour discrimination depends on both the colour difference and the luminance difference between two colours. Colour science (as represented by the C.I.E. colour convention) has defined colour difference units ΔE* and ΔC*. ΔE* is a measure of the overall discrimination (including both colour and luminance differences). ΔC* is a measure of the discrimination in colour alone, excluding luminance differences.
Note: “Δ” represents the Greek letter “Delta”, although it may appear differently on
some computers.
The tolerances for the conversion of the colour tables from the CIE colours defined in these specifications to the actual RGB values for the ECDIS CRT are defined in three terms:
1. Overall discrimination between actual colours within the converted table : ΔE*.
This is to ensure that all the colours within the RGB table remain discriminably separate, ie. that the relative colour distinctions have been maintained.
2. Colour discrimination differences between the defined and the actual values :
ΔC*. This is to ensure that the actual RGB colours resulting from the conversion remain reasonably close to the CIE colours defined in the specifications, ie. that the blues stay blue and the greens stay green.
3. Luminance differences between the defined values and the actual values : L.
This is to ensure that the luminance remains the same within acceptable limits.
Note: The CIE L*u*v* human perception colour model, which is the source of the tolerances described above, has not yet been evaluated at the low luminances of the night colour table, at which the less colour-sensitive rods of the eye take over from the daytime cones. Consequently these tolerances should not be applied to the night table, and for type-approval purposes they are restricted to the bright sun table.
Colour tolerance values:
1. The discrimination difference between any two colours displayed (except those with a tabular ΔE* less than 20 - see list in Annex B 4.5) should be not less than 10 ΔE* units.
2. The difference between the colour displayed and the CIE colour defined in these
specifications should be not greater than 16 ΔC* units. If a monitor is
48
S-52, Edition 6.0 March 2010
independently tested then the difference shall be not greater than 8 ΔC* units.
3. The luminance of the colour displayed should be within 20% of its specified value. Black is a special case and the luminance of it shall be not greater than 0.52 cd/m² for bright sun colour table.
5.2.3.2 Instrumental calibration verification test. For CRT displays, an instrumental test to
check that the results of the colour conversion calibration described in Annex B1 are within tolerance should be made by displaying the colours of the Day colour table (restricted to colour pairs of tabular ΔE* greater than 20); measuring their CIE coordinates x,y and L; and applying a tolerance test. The procedure is described in Annex B section 4. For LCD displays the instrumental test should be applied to all three colour tables.
Note that since the tolerance test is intended solely to check successful colour calibration, and not to test colour maintenance at sea, this test should be performed on the bench in the manufacturer's or type-approval authority's plant under normal conditions of temperature, humidity and vibration.
Should the colour tolerances be tested independently (as by a type approval authority) without also carrying out colour conversion calibration, a slightly extended procedure is necessary, involving individual control of the R, G and B colours. This is also described in Annex B4. Manufacturers of ECDIS can choose between two different methods of colour calibration. The first method is a test of a monitor as part of an integrated system. In this method both the monitor and the image generator parts of ECDIS display are tested together. The second method is an independent test of the monitor. In this method the monitor and the image generator of ECDIS display are separately tested against a reference (i.e. the monitor is tested against a reference image generator and the image generator is tested against a reference monitor). The second method has tighter tolerance for displayed colour than the first method (see section 5.2.3.1).
5.2.3.3 Test using Colour Differentiation Test Diagram. The dusk and night tables should be checked subjectively by means of the colour differentiation test diagram, which is provided as a S-57 file on the Presentation Library CD (.tif file diagrams must not be used for this purpose), as follows: (1) The person carrying out the test should have passed the Isihara colour blindness
test, or other test used to qualify bridge watchkeepers, and should adapt to night viewing for 10 minutes before checking the night display;
(2) The controls should be set to their calibrated settings; (3) While the display is off, adjust the ambient light reflected from white paper
positioned on the display screen to the following values: Colour table Light level Day 200 cd/sq m Dusk 10 cd/sq m Night darkness (the ECDIS display is the predominant light source) Preferably use natural daylight for the day table. (4) Under each of the above conditions, display the appropriate colour differentiation

49
S-52, Edition 6.0 March 2010
test diagram described in section 5.2.5 for the colour tables. Select each table in turn and ensure that:
- each foreground diagonal line is clearly distinguished from its background; - the foreground lines representing yellow, orange, magenta (purple), green, blue
and grey may be clearly identified.
5.2.4 Software for colour calibration and tolerance verification
Software is provided in the Presentation Library to compute the instrumental calibration results, the CIE to RGB conversion, and the tolerance checks.
5.2.5 Colour Differentiation Test Diagram; grey scale The use of symbol BLKADJ to adjust the controls every time that the night colour table is selected has been described in section 4.2.4.5. This section describes further checks on the colour performance of the ECDIS display. A multi-purpose colour differentiation test diagram is illustrated in the Presentation Library, Part I, section 15.4, and is described in the Presentation Library, Part I, sections 19.3 and 19.4. This consists of 20 squares each coloured with one of the 4 main background colour fills (such as shallow water blue), and each having a diagonal line in one of the six important foreground colours (such as mariner's orange). Each diagonal line is 2 pixels wide. The diagram is in the form of an ENC and so can be displayed using any of the three colour tables. This diagram is intended: (1) for use by the mariner to check and if necessary re-adjust the controls,
particularly for use at night; (2) for use by the mariner to satisfy himself that an ageing ECDIS display remains
capable of providing the necessary colour differentiation; (3) for initial colour verification of the day, dusk and night colour tables. Both the Colour Test Diagram and the instructions for its use (see Presentation Library, Part I, sections 18.8 and 19.4) should be made available to the mariner. In addition, a grey scale is described in Annex C for use by maintenance technicians in checking colour tracking in an ageing display. The Colour Differentiation Test diagram is intended for use off-line. It is not needed during route monitoring. Note that the Colour Differentiation Test Diagram will not be true to colour unless it is projected on a calibrated screen and is generated using the digital format described in the Presentation Library, Part I, section 19.4 which correctly reproduces the colour tokens of the Presentation Library.
50
S-52, Edition 6.0 March 2010
TABLE 1: GENERAL COLOUR ASSIGNMENT FOR ECDIS FEATURES black/white (black by day / white by night) is used for critical navigation features which need
highlighting by contrast against their background to give them adequate prominence. Examples are the own-ship symbol, dangerous soundings less than the safety depth, buoys, conspicuous objects on land etc. It is also used for text, which is less clear in any other colour.
white/black (white by day / black by night) as a background area shade is used for deep,
safe, water. magenta is used to highlight critically important features such as isolated dangers, traffic
routes, anchorages; and for restricted areas, submarine cables, gas pipelines etc. It is also used for aids to navigation and services such as daymarks, racons, and pilot stations.
grey is used for many features which are black on the paper chart. It is used with thick
lines for critical physical objects such as bridges and overhead cables, and with thin lines for important but less critical physical features such as non-dangerous soundings, sandwaves, overfalls, water pipelines and fish farms. It is similarly used for chart features such as fairways, harbour areas, tidal information and for information about the chart such as quality of chart data, overscale areas, etc.
grey as a background area shade is used with a prominent pattern for no-data
areas. blue as a background area shade is used to distinguish depth zones. blue as foreground colour for AIS and VTS information; also reserved for future
requirements. green is used for the radar image and synthetics, and for buoy and lights colours. blue-green is used for transferred ARPA. yellow-green ('moss-green') as a background area shade is used for the intertidal area
between high and low waterlines, yellow is used as the manufacturer's colour; for the mariner's transparent colour fill; and
for buoy and lights colours. red is used for the important planned route, for the mariner's danger highlight, and
for buoy and lights colours. orange is the mariner's colour, for notes, chartwork, chart corrections. The scale bar,
north arrow, and mariner's navigation objects such as EBLs and VRMs are also orange.
brown as a background area shade is used for the land, and dark brown is used for
features on land and in the intertidal area that do not have any strong significance for navigation.
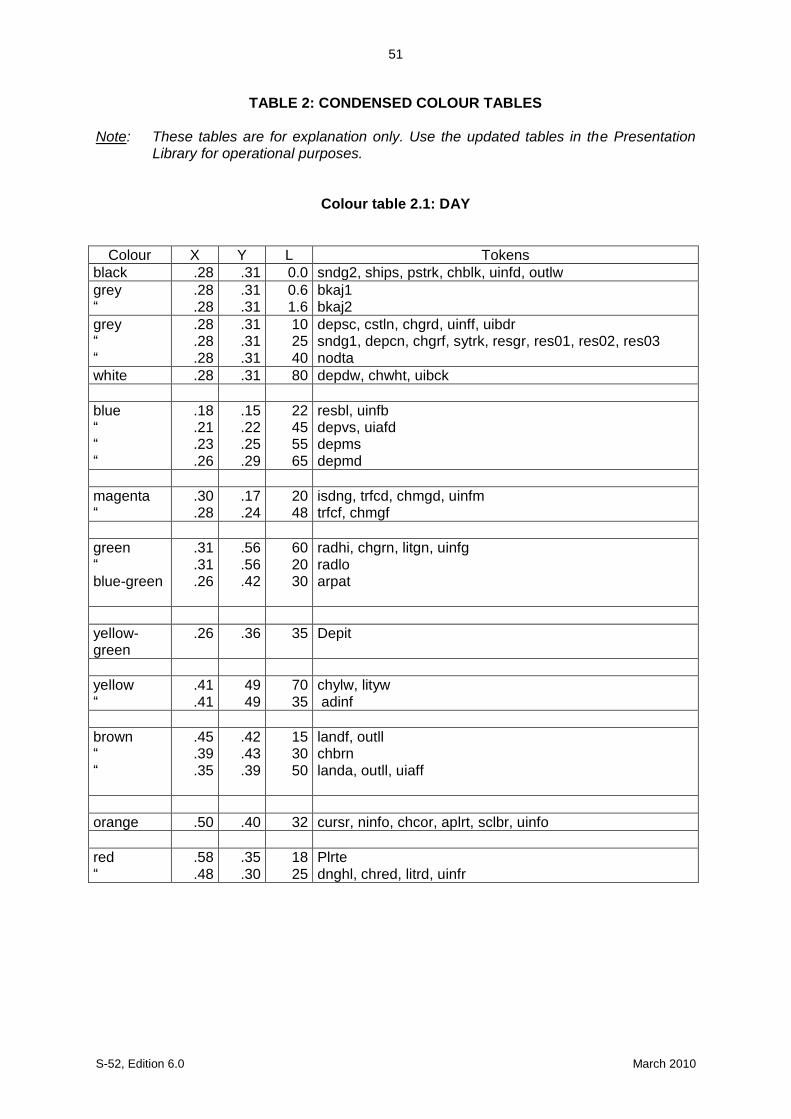
51
S-52, Edition 6.0 March 2010
TABLE 2: CONDENSED COLOUR TABLES Note: These tables are for explanation only. Use the updated tables in the Presentation
Library for operational purposes.
Colour table 2.1: DAY
Colour X Y L Tokens black .28 .31 0.0 sndg2, ships, pstrk, chblk, uinfd, outlw grey “
.28
.28 .31 .31
0.6 1.6
bkaj1 bkaj2
grey “ “
.28
.28
.28
.31
.31
.31
10 25 40
depsc, cstln, chgrd, uinff, uibdr sndg1, depcn, chgrf, sytrk, resgr, res01, res02, res03 nodta
white .28 .31 80 depdw, chwht, uibck blue “ “ “
.18
.21
.23
.26
.15
.22
.25
.29
22 45 55 65
resbl, uinfb depvs, uiafd depms depmd
magenta “
.30
.28 .17 .24
20 48
isdng, trfcd, chmgd, uinfm trfcf, chmgf
green “ blue-green
.31
.31
.26
.56
.56
.42
60 20 30
radhi, chgrn, litgn, uinfg radlo arpat
yellow-green
.26 .36 35 Depit
yellow “
.41
.41 49 49
70 35
chylw, lityw adinf
brown “ “
.45
.39
.35
.42
.43
.39
15 30 50
landf, outll chbrn landa, outll, uiaff
orange .50 .40 32 cursr, ninfo, chcor, aplrt, sclbr, uinfo red “
.58
.48 .35 .30
18 25
Plrte dnghl, chred, litrd, uinfr
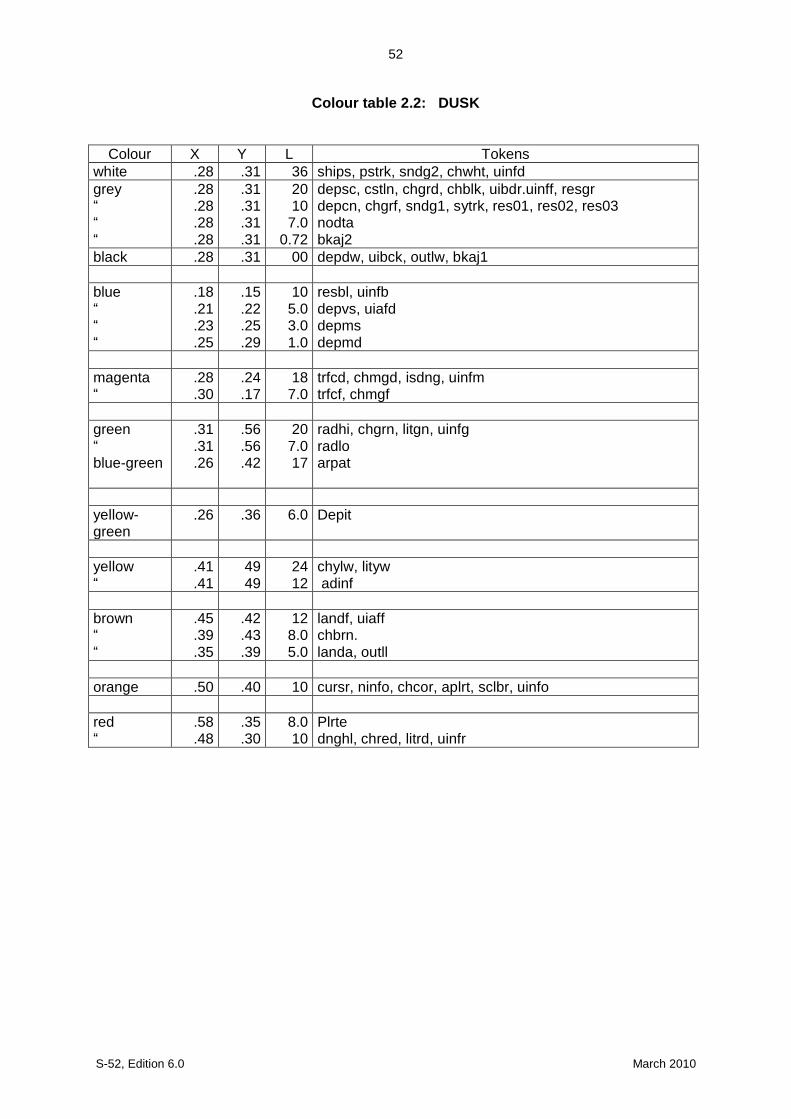
52
S-52, Edition 6.0 March 2010
Colour table 2.2: DUSK
Colour X Y L Tokens white .28 .31 36 ships, pstrk, sndg2, chwht, uinfd grey “ “ “
.28
.28
.28
.28
.31
.31
.31
.31
20 10 7.0
0.72
depsc, cstln, chgrd, chblk, uibdr.uinff, resgr depcn, chgrf, sndg1, sytrk, res01, res02, res03 nodta bkaj2
black .28 .31 00 depdw, uibck, outlw, bkaj1 blue “ “ “
.18
.21
.23
.25
.15
.22
.25
.29
10 5.0 3.0 1.0
resbl, uinfb depvs, uiafd depms depmd
magenta “
.28
.30 .24 .17
18 7.0
trfcd, chmgd, isdng, uinfm trfcf, chmgf
green “ blue-green
.31
.31
.26
.56
.56
.42
20 7.0 17
radhi, chgrn, litgn, uinfg radlo arpat
yellow-green
.26 .36 6.0 Depit
yellow “
.41
.41 49 49
24 12
chylw, lityw adinf
brown “ “
.45
.39
.35
.42
.43
.39
12 8.0 5.0
landf, uiaff chbrn. landa, outll
orange .50 .40 10 cursr, ninfo, chcor, aplrt, sclbr, uinfo red “
.58
.48 .35 .30
8.0 10
Plrte dnghl, chred, litrd, uinfr

53
S-52, Edition 6.0 March 2010
Colour table 2.3: NIGHT
Colour X Y L Tokens white .28 .31 5.0 sndg2, chwht, ships, pstrk, uinfd grey “ “ “
.28
.28
.28
.28
.31
.31
.31
.31
2.5 1.25
1.2 0.1
chgrd, chblk,cstln, depsc, uibdr, uinff chgrf, sndg1, depcn, resgr, sytrk, res01, res02, res03 nodta bkaj2
black .28 .31 00 depdw, uibck, outlw, bkadj1 blue “ “ “
.18
.21
.23
.25
.15
.22
.25
.29
1.25 0.8 0.4 0.2
resbl, uinfb depvs, uiafd depms depmd
magenta .30 .17 2.0 isdng, trfcd, trfcf, chmgd, chmgf, uinfm green “ blue-green
.31
.31
.26
.56
.56
.42
2.5 0.8
1.75
radhi, chgrn, litgn, uinfg radlo arpat
yellow-green
.26 .36 1.2 Depit
yellow “
.41
.41 49 49
3.0 1.5
chylw, lityw adinf
brown “ “ “
.45
.45
.39
.35
.42 42 .43 .39
3.2 1.6 1.3 0.8
Uiaff Landf Chbrn landa, outll
orange .50 .40 1.25 cursr, sclbr, ninfo, aplrt, chcor, uinfo red “
.48
.58 .30 .35
1.25 0.9
dnghl, chred, litrd, uinfr. Plrte
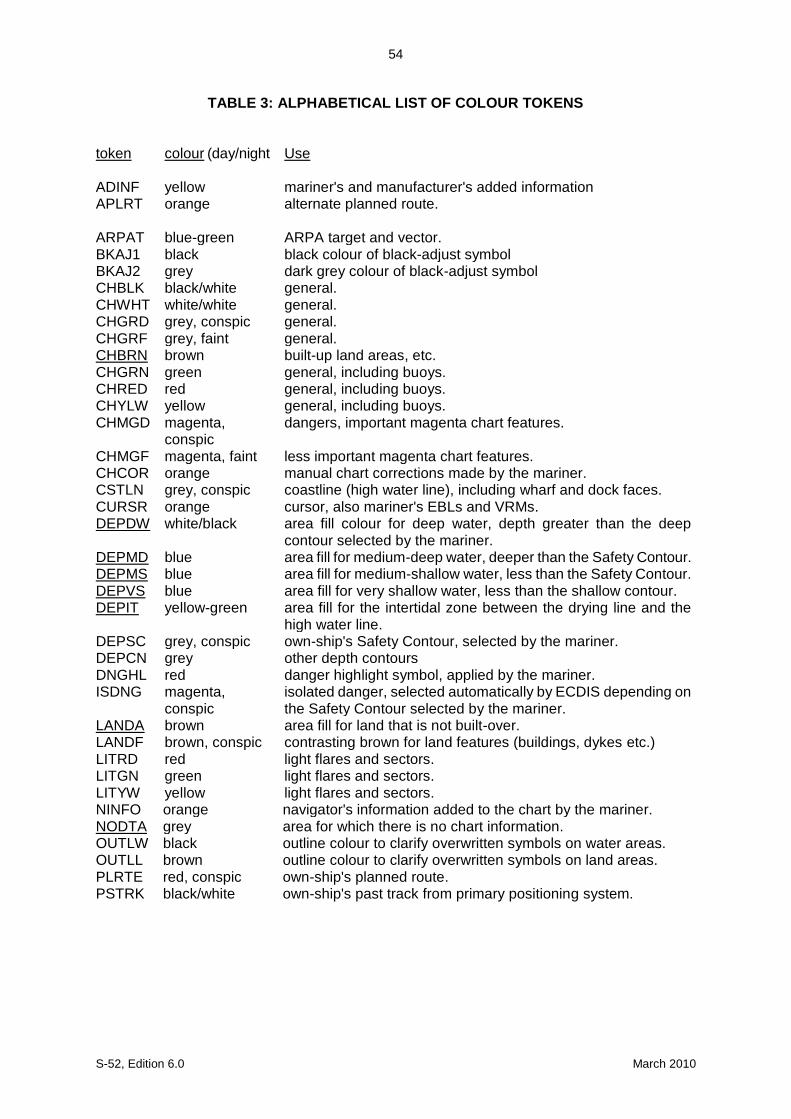
54
S-52, Edition 6.0 March 2010
TABLE 3: ALPHABETICAL LIST OF COLOUR TOKENS token
colour (day/night Use
ADINF yellow mariner's and manufacturer's added information APLRT orange alternate planned route. ARPAT blue-green ARPA target and vector. BKAJ1 black black colour of black-adjust symbol BKAJ2 grey dark grey colour of black-adjust symbol CHBLK black/white general. CHWHT white/white general. CHGRD grey, conspic general. CHGRF grey, faint general. CHBRN brown built-up land areas, etc. CHGRN green general, including buoys. CHRED red general, including buoys. CHYLW yellow general, including buoys. CHMGD magenta,
conspic dangers, important magenta chart features.
CHMGF magenta, faint less important magenta chart features. CHCOR orange manual chart corrections made by the mariner. CSTLN grey, conspic coastline (high water line), including wharf and dock faces. CURSR orange cursor, also mariner's EBLs and VRMs. DEPDW white/black area fill colour for deep water, depth greater than the deep
contour selected by the mariner. DEPMD blue area fill for medium-deep water, deeper than the Safety Contour. DEPMS blue area fill for medium-shallow water, less than the Safety Contour. DEPVS blue area fill for very shallow water, less than the shallow contour. DEPIT yellow-green area fill for the intertidal zone between the drying line and the
high water line. DEPSC grey, conspic own-ship's Safety Contour, selected by the mariner. DEPCN grey other depth contours DNGHL red danger highlight symbol, applied by the mariner. ISDNG magenta,
conspic isolated danger, selected automatically by ECDIS depending on the Safety Contour selected by the mariner.
LANDA brown area fill for land that is not built-over. LANDF brown, conspic contrasting brown for land features (buildings, dykes etc.) LITRD red light flares and sectors. LITGN green light flares and sectors. LITYW yellow light flares and sectors. NINFO orange navigator's information added to the chart by the mariner. NODTA grey area for which there is no chart information. OUTLW black outline colour to clarify overwritten symbols on water areas. OUTLL brown outline colour to clarify overwritten symbols on land areas. PLRTE red, conspic own-ship's planned route. PSTRK black/white own-ship's past track from primary positioning system.
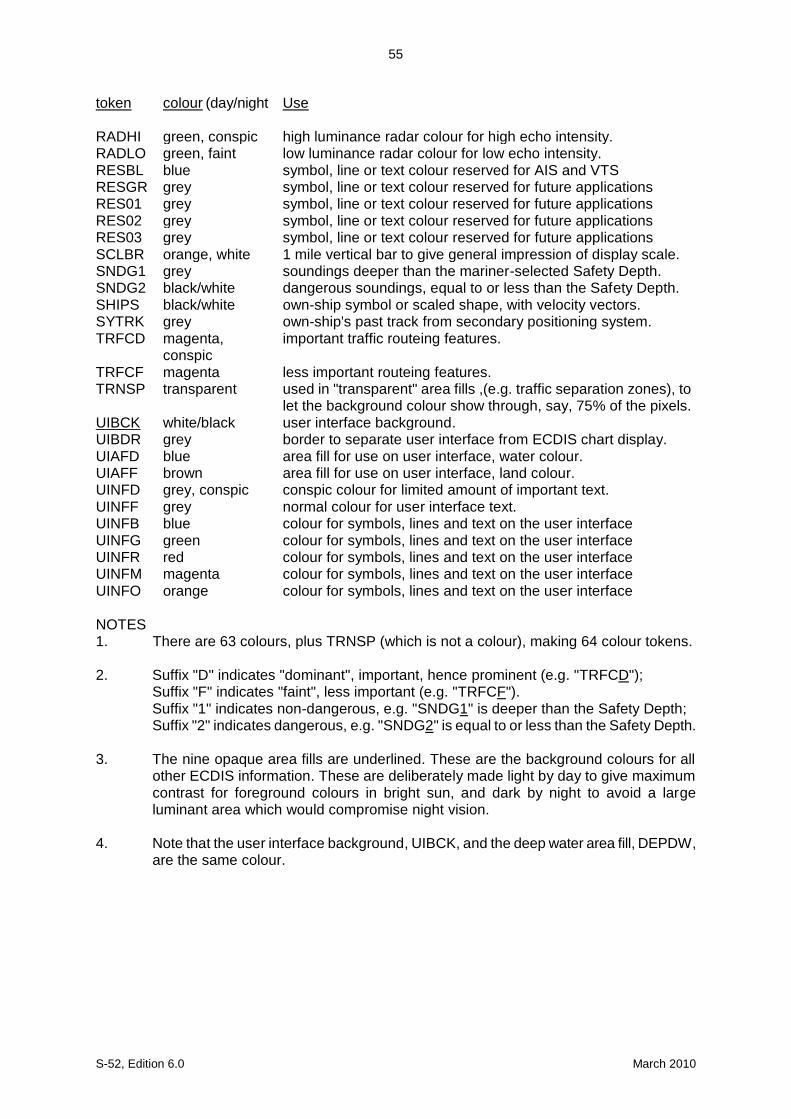
55
S-52, Edition 6.0 March 2010
token
colour (day/night Use
RADHI green, conspic high luminance radar colour for high echo intensity. RADLO green, faint low luminance radar colour for low echo intensity. RESBL blue symbol, line or text colour reserved for AIS and VTS RESGR grey symbol, line or text colour reserved for future applications RES01 grey symbol, line or text colour reserved for future applications RES02 grey symbol, line or text colour reserved for future applications RES03 grey symbol, line or text colour reserved for future applications SCLBR orange, white 1 mile vertical bar to give general impression of display scale. SNDG1 grey soundings deeper than the mariner-selected Safety Depth. SNDG2 black/white dangerous soundings, equal to or less than the Safety Depth. SHIPS black/white own-ship symbol or scaled shape, with velocity vectors. SYTRK grey own-ship's past track from secondary positioning system. TRFCD magenta,
conspic important traffic routeing features.
TRFCF magenta less important routeing features. TRNSP transparent used in "transparent" area fills ,(e.g. traffic separation zones), to
let the background colour show through, say, 75% of the pixels. UIBCK white/black user interface background. UIBDR grey border to separate user interface from ECDIS chart display. UIAFD blue area fill for use on user interface, water colour. UIAFF brown area fill for use on user interface, land colour. UINFD grey, conspic conspic colour for limited amount of important text. UINFF grey normal colour for user interface text. UINFB blue colour for symbols, lines and text on the user interface UINFG green colour for symbols, lines and text on the user interface UINFR red colour for symbols, lines and text on the user interface UINFM magenta colour for symbols, lines and text on the user interface UINFO orange colour for symbols, lines and text on the user interface NOTES 1. There are 63 colours, plus TRNSP (which is not a colour), making 64 colour tokens. 2. Suffix "D" indicates "dominant", important, hence prominent (e.g. "TRFCD");
Suffix "F" indicates "faint", less important (e.g. "TRFCF"). Suffix "1" indicates non-dangerous, e.g. "SNDG1" is deeper than the Safety Depth; Suffix "2" indicates dangerous, e.g. "SNDG2" is equal to or less than the Safety Depth.
3. The nine opaque area fills are underlined. These are the background colours for all
other ECDIS information. These are deliberately made light by day to give maximum contrast for foreground colours in bright sun, and dark by night to avoid a large luminant area which would compromise night vision.
4. Note that the user interface background, UIBCK, and the deep water area fill, DEPDW,
are the same colour.
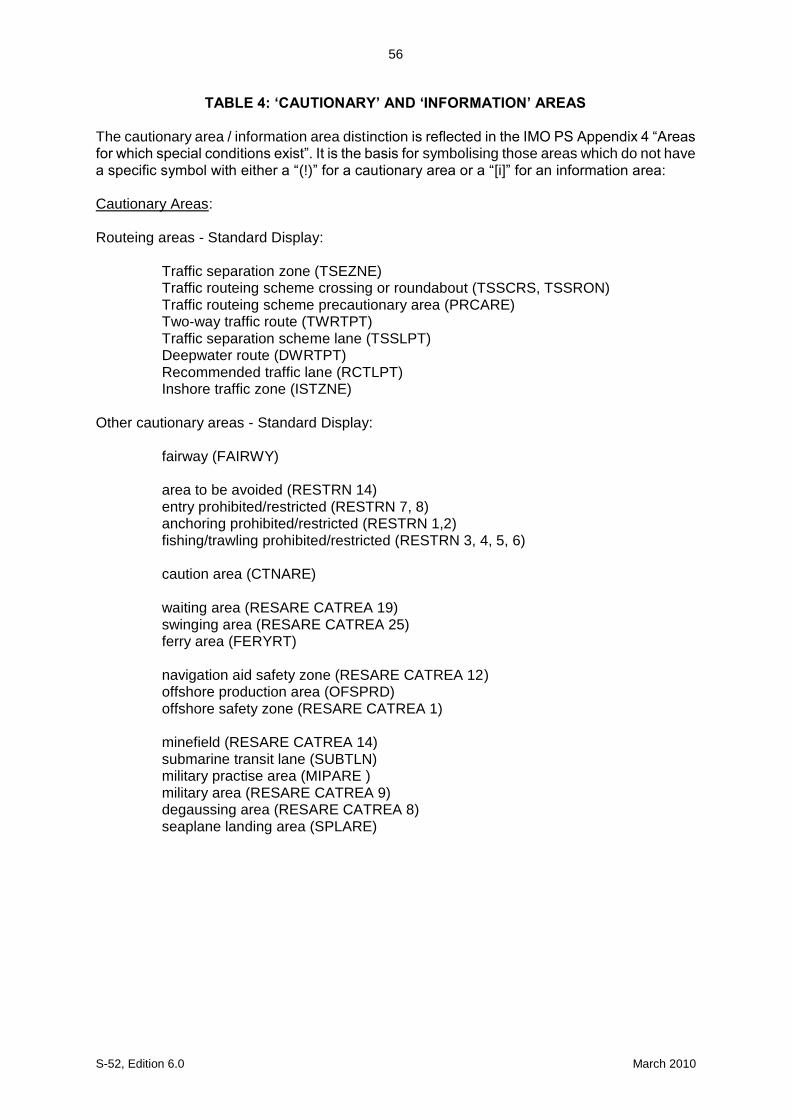
56
S-52, Edition 6.0 March 2010
TABLE 4: ‘CAUTIONARY’ AND ‘INFORMATION’ AREAS The cautionary area / information area distinction is reflected in the IMO PS Appendix 4 “Areas for which special conditions exist”. It is the basis for symbolising those areas which do not have a specific symbol with either a “(!)” for a cautionary area or a “[i]” for an information area: Cautionary Areas: Routeing areas - Standard Display:
Traffic separation zone (TSEZNE) Traffic routeing scheme crossing or roundabout (TSSCRS, TSSRON) Traffic routeing scheme precautionary area (PRCARE) Two-way traffic route (TWRTPT) Traffic separation scheme lane (TSSLPT) Deepwater route (DWRTPT) Recommended traffic lane (RCTLPT) Inshore traffic zone (ISTZNE)
Other cautionary areas - Standard Display:
fairway (FAIRWY)
area to be avoided (RESTRN 14) entry prohibited/restricted (RESTRN 7, 8) anchoring prohibited/restricted (RESTRN 1,2) fishing/trawling prohibited/restricted (RESTRN 3, 4, 5, 6)
caution area (CTNARE)
waiting area (RESARE CATREA 19) swinging area (RESARE CATREA 25) ferry area (FERYRT)
navigation aid safety zone (RESARE CATREA 12) offshore production area (OFSPRD) offshore safety zone (RESARE CATREA 1)
minefield (RESARE CATREA 14) submarine transit lane (SUBTLN) military practise area (MIPARE ) military area (RESARE CATREA 9) degaussing area (RESARE CATREA 8) seaplane landing area (SPLARE)

S-52, Edition 6.0 March 2010
50
Information areas - Standard Display:
anchorage area (ACHARE) anchor berth (ACHBRT)
dumping ground (DMPGRD)
fishing ground (FSHGRD) pipeline area (PIPARE) cable area (CBLARE)
cargo transhipment area (CTSARE) incineration area (ICNARE)
specially protected areas - sanctuaries etc (RESARE CATREA 4, 5, 6, 7,10, 18, 20, 22, 23, 27, 28)
no wake area (RESARE CATREA 24)
For further details, see conditional symbology procedures RESAREnn and RESTRNnn in the Presentation Library, section 12.

S-52, Edition 6.0 March 2010
51
ANNEX A IHO ECDIS PRESENTATION LIBRARY The Presentation Library is published separately. See Figure 1 for details.
In summary the Presentation Library implements the display specifications in S-52 by decoding and symbolising the SENC. It contains: 1. the ECDIS symbol library, including the IEC navigation symbols, 2. the ECDIS colour tables for day, dusk and night viewing, 3. look-up tables with symbology instructions linking SENC objects to the
appropriate colour and symbol and giving their IMO category, draw priority, priority over radar, and suggested viewing group,
4. conditional symbology procedures for: - cases where symbolising depends on circumstances such as the mariner's
choice of safety contour, - cases where symbolising is too complex to be defined in a direct look-up
table, 5. symbolising instructions for special cases which are not handled by 3. or 4.
above, such as north arrow and scalebar, manual chart corrections, etc., 6. description of the symbology instructions, 7. mariners' navigational objects, specified in the same format as chart objects
for convenience in processing by the ECDIS, 8. supplementary features such as the ECDIS Chart 1, colour differentiation test
diagram, colour calibration software. The IHO Presentation Library is part of the S-52 package. A digital version is also available for edition 3.4; updating this digital version will depend on a volunteer provider.
__________

S-52, Edition 6.0 March 2010
52
Page intentionally left blank
S-52, Edition 6.0 March 2010
53
ANNEX B PROCEDURE FOR INITIAL CALIBRATION OF COLOUR DISPLAYS
(Note that the specifications in this Annex are generally applicable to all types of monitors. Some sentences which apply only to CRTs are in italics.)
_________
B.1 Introduction
Calibration is required to transform the CIE co-ordinates of these specifications into RGB values that apply to the particular monitor used by the ECDIS manufacturer. Note that the primary aim is to reproduce the colour distinctions needed to distinguish between different features on the display. Accurate absolute colour matching between different monitor's is not required.
Calibration defines the monitor performance in terms of the relationship between input signal and the colour and luminance output on the screen. This is performed for each of the red, green, and blue (R, G, B) channels. The signal that drives the CRT monitor is specified in terms of three DAC (Digital to Analog Converter) values - one each for R, G, and B. These are usually from 0 to 255, and colour is specified in CIE co-ordinates of x-y, and luminance (L) in candelas per square metre. The DAC values are programmed within the image generator to generate specific colours required by the system.
Calibration consists of two parts - measurement of the monitor colour characteristics and data processing to generate the transform between CIE colour co-ordinates and RGB inputs to the monitor.
A comprehensive calibration of the monitor is required upon initial use.
In case the monitor colours deteriorate after extended use at sea, two further capabilities are necessary:
1. A means of detecting when the colour calibration has deteriorated to the extent
that the colour distinction on the display is lost. This is described in Annex C. 2. A method of restoring the original colour distinctions. This is not yet developed.
B.2 Initial Calibration
This process will provide the conversion between CIE x, y, L co-ordinates and RGB signals to be applied to the monitor.
B.2.1 Equipment required
Make sure your ECDIS hardware has an image generator capable of giving "blacker than black", i.e. complete control of colour, and that the software can control that function.
The monitor may be calibrated independently of the image generator. In this case, the generator is expected to output a signal that is linear and repeatable from unit to unit. If the accuracy of the image generator output is unknown, then it should be calibrated as an integrated unit with the monitor.
S-52, Edition 6.0 March 2010
54
The equipment required for the process is listed below: - Monitor to be calibrated. It is important to note that the monitor to be calibrated
must be capable of a white screen (D-6500) of at least 85 cd/m², or the calibration process will fail.
- Image generator to be used with the monitor.
- Photometer. The photometer must have a luminance accuracy of better than +/-
5% and a sensitivity of 1.0 x 10⁻⁴ candelas per square metre. The photometer is one that must be intended for use in measurement of the selected monitor, and should have colourimeter capability. The required performance can be achieved by a Graseby model 370 "Optometer" with a model 221 radiometric head used in conjunction with a Minolta CS100 Colorimeter for measuring phosphor co-ordinates and calibrating the Graseby radiometric head for each phosphor.
The Minolta CS 100 must be calibrated to "Illuminant A".
- Software to generate the required colours for use during the calibration. This will
be a program that allows the user to adjust the colour DAC values from 0 to 255 in each of Red, Green and Blue.
- Software to calculate the transformation between RGB and CIE x, y, L values.
(This software is part of the Presentation Library.) B.2.2 Calibration set-up
Important - The calibration procedure is very sensitive to stray light, and inaccurate results will occur if special care is not taken. All measurements should be taken in the dark, and all stray light and sources of reflections must be removed from the measurement area. The measurements are best taken with light absorbers in place around the monitor and measurement apparatus. This can be created by making a matte black cardboard tunnel around the monitor and colourimeter. Care must be taken by the operator that his clothing does not reflect light back into the measurement area. The instrument that is measuring the screen of the monitor must point at the same location on the screen for all measurements, otherwise errors will result.
B.2.3 Monitor set-up for calibration
The monitor must be set up properly before calibration. The following are required for accurate calibration:
B.2.3.1 Burn-in
To age the monitor sufficiently, a burn-in of 48 hours is required with a 50% luminance white picture covering the entire screen.
B.2.3.2 Colour temperature tracking
The monitor should not show any change in colour on white signals, when they go from dark gray to bright white. This can be best checked out by displaying a gray scale of about 8 steps from dark gray to white. If the colour of the gray changes or shows a drift to pink, blue, or green, as the level changes, then the monitor is improperly adjusted and should not be calibrated. This step is a qualitative
S-52, Edition 6.0 March 2010
55
assessment, and requires some judgement from the tester. B.2.3.3 Setting the Controls The controls are used to adjust the black level of the monitor. This is the point where
the monitor screen is seen as black, and this setting will create the blackest black that can be displayed. After the control is set, it must be locked in place. Any further adjustment of the black level setting after calibration invalidates the process.
In use, the black level controls may either be locked or accessible to the user. If they
are accessible, they must have a detent type of setting where it is properly set up so that the user can find that position again after the control has been moved. This will ensure that the proper colour settings can be maintained.
The process for correctly setting the controls is as follows: with the monitor in a dark
room, and with the monitor turned on and warmed up to the manufacturer's specification, drive the monitor with a black signal (0, 0, 0). Measure the Luminance of this area. It should be less than 0.52 candelas per square metre (cd/m²). Lock the appropriate controls for the calibration process.
The controls should be adjusted to achieve maximum required output level at full
white signal. Using the photometer and a peak white signal, (DAC values of 255, 255, 255) adjust the controls for a luminance of at least 80 cd/m² (note that depending on the characteristics of monitor you may need 85 cd/m² or even higher values to get all colours inside the reproducible range). Lock appropriate controls for the duration of the calibration. (Note that the controls may be available for the mariner's adjustment during use of the ECDIS system.)
At this point, the monitor is set up and ready for calibration. B.3 Data Collection The data collection consists of two parts: measuring the CIE chromaticity co-
ordinates of the principal colour producing elements and measuring the gamma function of the principal colour producing elements.
B.3.1 Principal colour producing element Chromaticities The principal colour producing element chromaticities can be measured directly by
the photometer (e.g. Minolta CS 100) as follows: .1 Put a square of pure red on the screen (DAC values of (255,0,0). This square
should be as large as possible, covering at least ten times the sampling area of the photometer, and preferably covering at least 80% of the screen.
.2 With the photometer normal to the screen and pointing at the centre, with light
shielding in place and the room darkened, measure the red chromaticity directly according to the colourimeter manufacturer's instructions.
.3 Repeat steps 1 and 2 for green and blue, using DAC values of (0,255,0) and
(0,0,255) respectively. Principal colour producing element chromaticities may be available from the monitor
vendor. These data may be used instead of measuring the chromaticities directly, as long as the data takes into account the effect of the monitor faceplate.
S-52, Edition 6.0 March 2010
56
B.3.2 Measurement of the Gamma of the principal colour producing elements B.3.2.1 The principal colour producing elements have typically a non linear transfer
characteristic describing the relationship between the R, G, B input values and the light output on the face of the monitor. This is called the Gamma Function or Gamma of the monitor. This transfer characteristic is used to select the proper mixing of colours to create the correct combined colour on the screen.
B.3.2.2 The Gamma is measured for each principal colour producing element separately. A
test square in the centre of the screen of size at least 5 cm by 5 cm (but not exceeding 25% of the area of the screen) should be used for this calibration. The screen outside the test area should remain black. Use a sensitive radiometer for this measurement (e.g. Graseby 370). Set up the radiometer head contacting the centre of the screen. Ensure that the instrument is always pointed at the same part of the screen for the entire series of measurements (red, green and blue). Put shields in place to block any stray light and darken the room to black.
B.3.2.3 Start with the red colour. Drive the monitor with DAC values starting at (0, 0, 0) and
increasing to (255, 0, 0). Increase in increments of 8 for the low values (below 100) and in increments of 16 for the higher values. (There is no harm in using a smaller increment if desired.) Record the light output in candelas per square metre (if available) against each DAC value. Otherwise, (for example in the case of the Graseby with radiometric head) record the output reading in amperes. Then, when the maximum DAC value is achieved, use a calibrated photometer/colorimeter (e.g. Minolta CS 100) to take a luminance reading. This luminance reading is then used to develop a conversion factor to convert from the radiometer's ampere reading to candelas per square metre.
B.3.2.4 Repeat the measurement sequence for each of the other two colours. Repeat the
photometer calibration for each of the other colours as well. B.3.2.5 To prepare the radiometer output data for processing, convert it from nano amperes
to candelas per square metre using the calibration constants derived above for each phosphor colour.
B.4 Calculations to achieve Correct Colours
The colours for ECDIS are specified in CIE x, y, L co-ordinates, and the system that outputs the colours to the monitor uses RGB values. A calculation is performed to compute the correct RGB values to yield the correct colour (in CIE x, y, L) on the screen.
At the end of the measurement sequence, there are two sets of data collected - a set of RGB co-ordinates for the principal colour elements of the monitor {(xr yr), (xg yg), (xb yb)} and a set of gamma function data in the form of (DAC Value, L out) for each of red, green and blue. The data should consist of about 23 sets of numbers for each colour.
The calculation routine uses this data to calculate the correct RGB values that correspond to the desired x, y, L co-ordinate description.
The calculation details are handled by a computer program that is part of the Presentation Library. This procedure described here details the user input and output procedure for using the program. In addition, the mathematical basis for the
S-52, Edition 6.0 March 2010
57
calculations is explained in section B.6.
B.4.1 Calibration computations using the CIE2RGB software in the Presentation Library
A utility exists in the Presentation Library called CIE2RGB which will take a series of CIE colour co-ordinates and luminance values and convert them to RGB DAC values for use in ECDIS, according to the specific calibration characteristics of the monitor used. Instructions for using this utility are appended to this Annex in section B.7.
B.5 Calibration Verification This section discusses the instrumental verification of the calibration of the colours in the earlier PL edition 3.2 bright sun (DAY_BRIGHT) colour table. The procedure applies equally to the edition 3.3 "DAY" table. Basically, it is carried out by measuring blocks of known colour and comparing their co-ordinates to the standard colours. All of the distinct colours of the bright sun colour table should be verified instrumentally, however certain colour pairs are exempt from the comparison as explained in B 5.5. The procedure for verifying the remaining colour tables visually is described in B 5.6.
Note: The procedure of calibrating/verifying all three colour tables of an LCD instrumentally by the current method used for CRTs on the Day table alone, together with remote control of the calibration settings, should also be used for LCDs.
There are no inexpensive instruments available that will directly measure and read out x, y, and L co-ordinates over the entire range of specified colours. (It is the low luminance colours that are a problem.) With a mathematical routine, colour co-ordinate data can be derived from the Graseby 370 radiometer that is used for the basic monitor calibration. This has the advantage of being accurate over a very wide range of luminances.
B.5.1 Theory of measurement
Mathematical relationships exist between red, green, and blue luminance components of a colour as seen on a monitor and its x, y, and L co-ordinates. (This relationship is developed in B.6.2). This requires that the chromaticity of the principal colour producing elements is known, and that the luminance of the red, green, and blue components of each measured colour are known. Using this information, and the mathematical relationship, it is possible to derive the colour co-ordinates of any on-screen colour.
The actual measurements are made by measuring individually the red, green and blue colour luminance components of each colour to be measured. These are then computed to give the colour co-ordinates. Note that each colour sample must be displayed three times - once each with only its red, green, and blue components.
B.5.2 Equipment required
This testing requires that the proper signals be generated and that the colour co-ordinates be measured. The following equipment is required:

S-52, Edition 6.0 March 2010
58
- Monitor to be verified, connected to image generation system. - Software in image system to create all the colours of each colour table. This
must allow the red green and blue components to be displayed separately for each colour. These colours should be displayed in a rectangle of about 5 cm square, in the centre of the screen.
- Luminance meter such as the Graseby 370 to measure the luminance of the red, green, and blue components of the test colours.
- Colorimeter, such as Minolta CS 100 to measure the colour co-ordinates of the phosphor on the test CRT. This should be calibrated to "Illuminant A".
- Software utility to perform the calculations to verify the calibration integrity. - Calibration factors for each phosphor to convert Graseby readings from amperes
to candelas per metre squared (cd/m²). (See section B.3.2).
B.5.3 Set-up for measurement
Important - These measurements are very sensitive to stray light entering the experimental area, and inaccurate results will occur if special care is not taken. All measurements should be taken with the measurement area properly shielded against stray light. The measurements are best taken with light absorbers in place around the monitor and measurement apparatus. A black felt drape over the measurement area works well. Care must be taken by the operator that his clothing does not reflect light back into the measurement area.
B.5.3.1 Monitor set-up
The monitor must be adjusted to its calibration conditions. (See section B.2.3). This means the controls are set to its calibration position i.e. black (CHBLK) on the screen is 0.52 cd/m² or below and a white square (CHWHT) on the screen has a luminance of 80 cd/m² (note that if the tolerance of luminance is 20%, then the acceptable range of CHWHT is from 64 to 96 cd/m²). This ensures that the monitor is set up as closely as possible to its factory settings, and the colours will be as close to calibrated values as possible.
B.5.3.2 Principal colour producing element chromaticity measurement
The Chromaticity (colour co-ordinates) of the principal colour producing elements is measured using the procedure outlined in B.3.1.
B.5.3.3 Luminance/radiance meter set-up
The luminance or radiance meter should be secured so that it measures the same part of the screen for all measurements. A suction cup with hanging bracket works well. The measurement area of the luminance meter should be well within the square of the test colour.
B.5.4 Measurement procedure
This procedure is well suited for automation. Under software control, the test patterns can be generated, and the output of the luminance meter recorder, and colour x, y, and L data calculated:

S-52, Edition 6.0 March 2010
59
1. Set up the software so that it generates the test patterns and colours. The test pattern should be a square of size approximately 5 cm per side. The software should cycle through the colours in the particular colour table being verified. The Red, Green, and Blue colour components for each test colour should be sent to the monitor separately.
2. Measure separately the luminance of each of red, green, and blue for each
colour of each table to be tested. In the crudest sense, this is accomplished by disconnecting the two colour channels that are not being currently measured. Under software control, this can be more elegantly controlled, where the computer that is creating the colour test square will send only the individual colour components to the monitor screen one at a time.
3. The luminance of each colour is calculated by using the calibration factor for
each colour that is derived under section B.3.2 above.
4. Calculate the x, y, and L for each colour measured using the procedure outlined in section B.6.2.
B.5.5 Measurement verification
The measurements must be within required limits of each colour, as specified in section 5.2.3 of this document, "Colour Conversion Tolerance".
The following colour pairs of the BRIGHT_SUN colour table have a ΔE* of <20.
In order to allow for measurement errors, which might put them outside the tolerance limits, they are exempt from the colour separation tolerance test which requires a ΔE* of >10.
Token
Colour x, y, L
Token
Colour x, y, L
ΔE*
DEPMD
(.27 .30 65) pale blue
CHWHT
DEPDW
UIBCK
(.28 .31 80)
white
11
CHBRN
(.42 .45 30)
brown
ADINF
(.41, .47. 35)
yellow
14
DEPMS
(.24 .26, 55) medium blue
DEPVS
UIAFD
(.22 .24 45)
medium blue
17
DEPMD
(.27 .30 65) pale blue
CHGRF NODTA Ed 3.3 colours have
greater ΔE
(.28 .31 45) faint grey
18
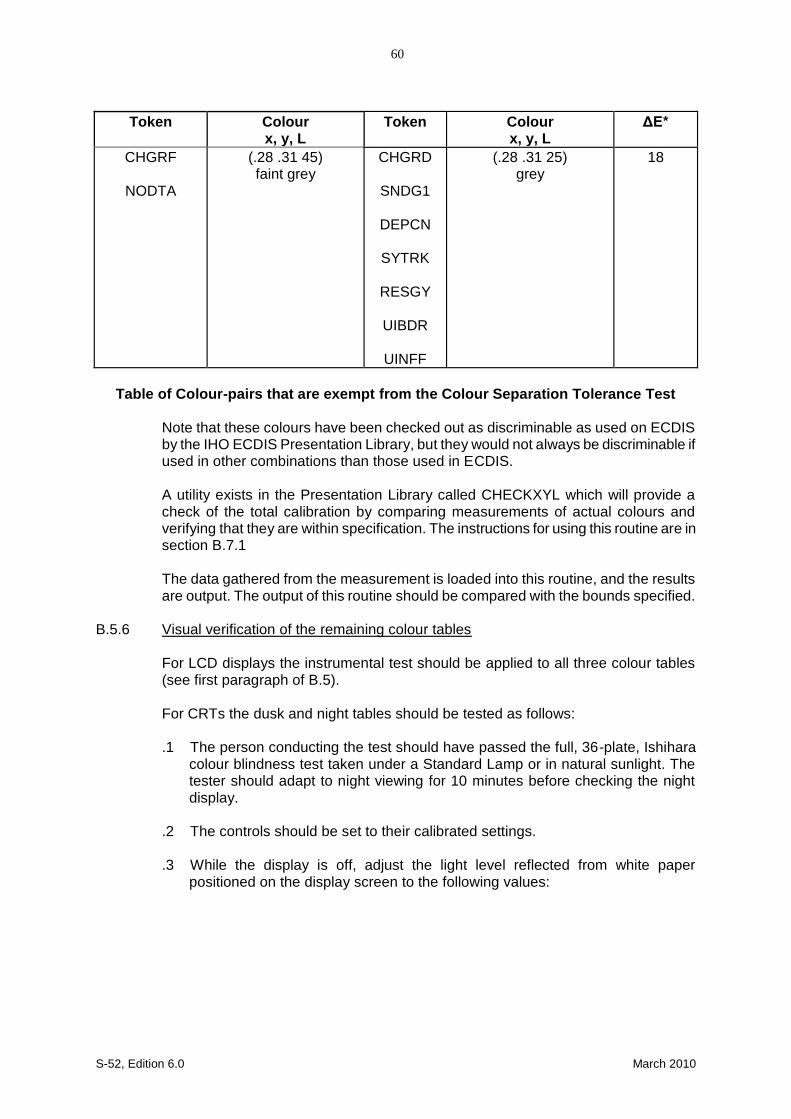
S-52, Edition 6.0 March 2010
60
Token
Colour x, y, L
Token
Colour x, y, L
ΔE*
CHGRF
NODTA
(.28 .31 45) faint grey
CHGRD
SNDG1
DEPCN
SYTRK
RESGY
UIBDR
UINFF
(.28 .31 25)
grey
18
Table of Colour-pairs that are exempt from the Colour Separation Tolerance Test
Note that these colours have been checked out as discriminable as used on ECDIS by the IHO ECDIS Presentation Library, but they would not always be discriminable if used in other combinations than those used in ECDIS.
A utility exists in the Presentation Library called CHECKXYL which will provide a check of the total calibration by comparing measurements of actual colours and verifying that they are within specification. The instructions for using this routine are in section B.7.1
The data gathered from the measurement is loaded into this routine, and the results are output. The output of this routine should be compared with the bounds specified.
B.5.6 Visual verification of the remaining colour tables
For LCD displays the instrumental test should be applied to all three colour tables (see first paragraph of B.5).
For CRTs the dusk and night tables should be tested as follows:
.1 The person conducting the test should have passed the full, 36-plate, Ishihara
colour blindness test taken under a Standard Lamp or in natural sunlight. The tester should adapt to night viewing for 10 minutes before checking the night display.
.2 The controls should be set to their calibrated settings.
.3 While the display is off, adjust the light level reflected from white paper
positioned on the display screen to the following values:

S-52, Edition 6.0 March 2010
61
table light level day-black background 200 cd/m² +/- 50% dusk 10 cd/m² +/- 50% night darkness (ECDIS display predominant light)
Preferably use natural daylight for the daytime and dusk tables.
.4 Under each of the above conditions display the appropriate Colour Differentiation
Test Diagram** described in the Presentation Library, Part I, section 19.4 for the above tables. Select each table in turn and ensure that:
- each foreground stripe is clearly distinguished from its background;
- the foreground stripes representing yellow, orange, magenta, green, blue and
grey may be clearly identified.
** Note that the Colour Differentiation Test Diagram supplied as pseudo S-57 files on the CD carrying the Presentation Library must be used for this test, because only that source will reproduce the colours stored in the ECDIS for use in drawing the chart display. Any other source for the Colour Test Diagram which does not use the same colours that are used in drawing the display will not provide a valid test.
B.6 Mathematical Model used in Calibration
Typically colour on a monitor screen is the specific mixture between red, green and blue light. The specific colour is a function of the luminances of the red, green, and blue principal colour producing elements and the colour of each of the principal colour producing elements. The mathematical relationships are developed elsewhere, so the relationships will be given here and assumed correct. The required luminances for the guns to achieve a desired colour are given in matrix notation as follows:
Z
Y
X
A
L
L
L
b
g
r
1
where: Lr , Lb , and Lg are the luminance outputs of the colour producing elements at the screen and A-1 is the inverse of the matrix A for the colour co-ordinates of the colour producing elements, given by:
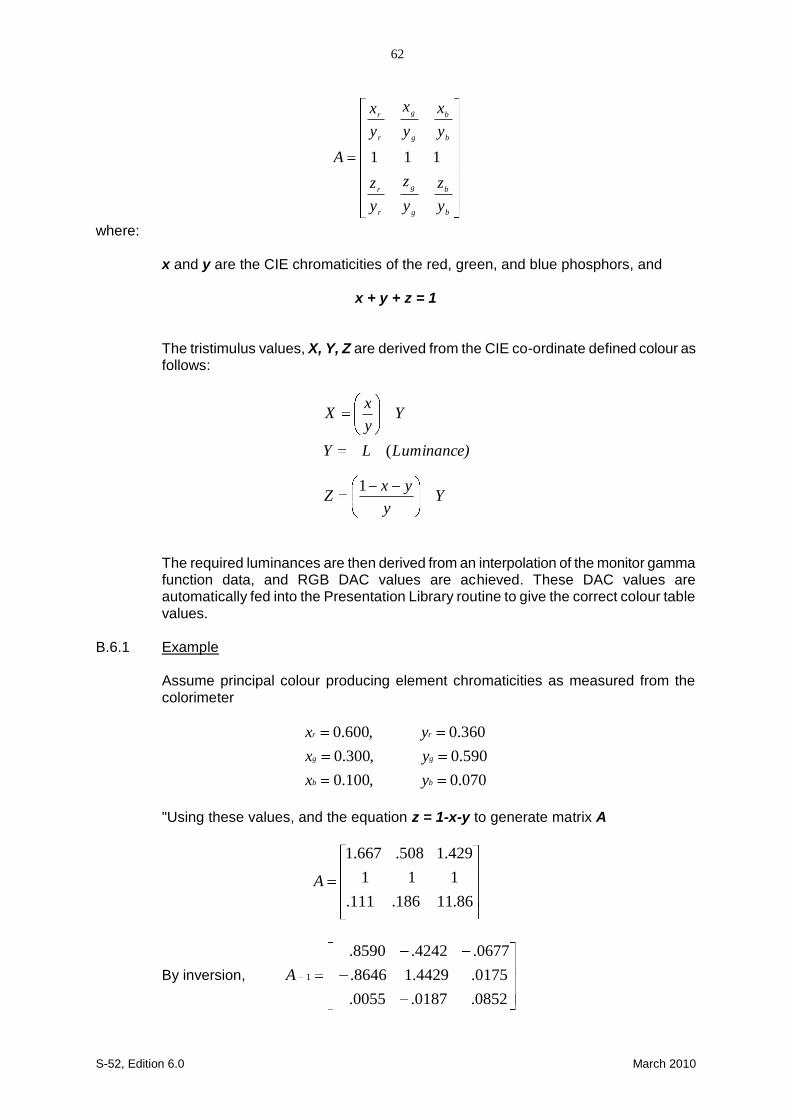
S-52, Edition 6.0 March 2010
62
b
b
g
g
r
r
b
b
g
g
r
r
y
z
y
z
y
z
y
x
y
x
y
x
A 111
where:
x and y are the CIE chromaticities of the red, green, and blue phosphors, and
x + y + z = 1
The tristimulus values, X, Y, Z are derived from the CIE co-ordinate defined colour as follows:
Yy
yxZ
Luminance)LY
Yy
xX
1
(
The required luminances are then derived from an interpolation of the monitor gamma function data, and RGB DAC values are achieved. These DAC values are automatically fed into the Presentation Library routine to give the correct colour table values.
B.6.1 Example Assume principal colour producing element chromaticities as measured from the colorimeter
070.0,100.0
590.0,300.0
360.0,600.0
bb
gg
rr
yx
yx
yx
"Using these values, and the equation z = 1-x-y to generate matrix A
86.11186.111.
111
429.1508.667.1
A
By inversion,
0852.0187.0055.
0175.4429.18646.
0677.4242.8590.
1A
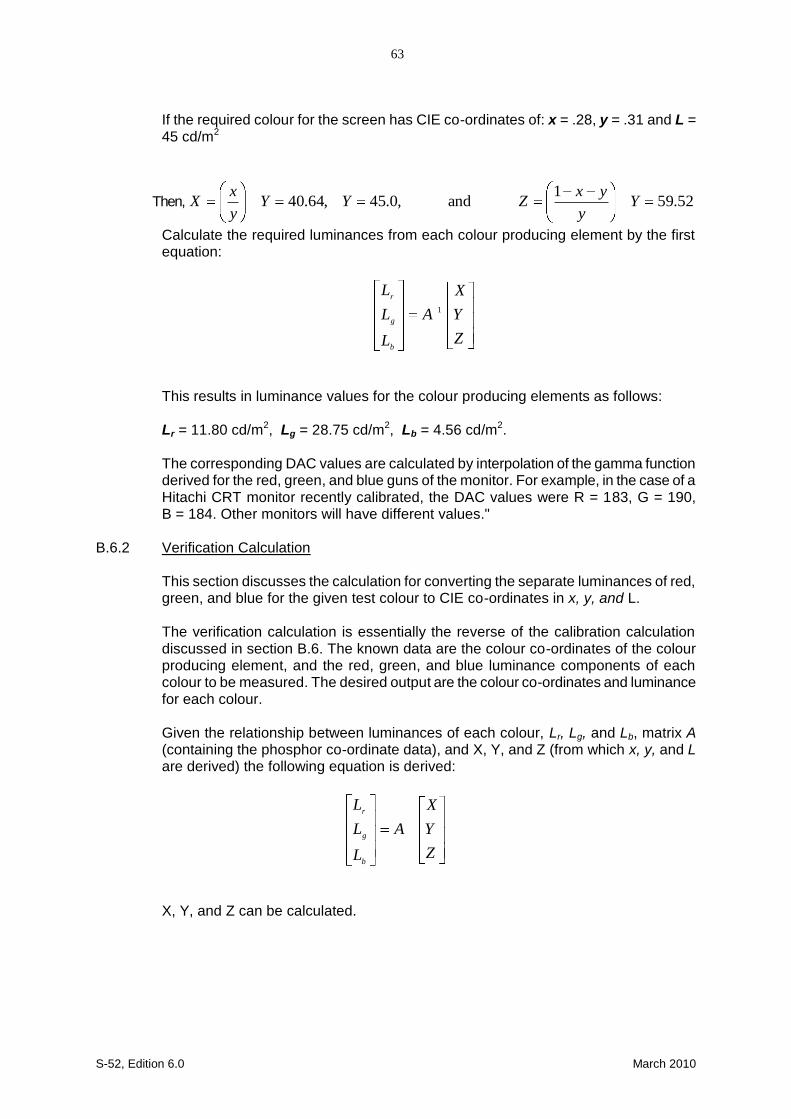
S-52, Edition 6.0 March 2010
63
If the required colour for the screen has CIE co-ordinates of: x = .28, y = .31 and L = 45 cd/m2
Then, 52.591
and,0.45,64.40 Yy
yxZYY
y
xX
Calculate the required luminances from each colour producing element by the first equation:
Z
Y
X
A
L
L
L
b
g
r
1
This results in luminance values for the colour producing elements as follows:
Lr = 11.80 cd/m2, Lg = 28.75 cd/m2, Lb = 4.56 cd/m2.
The corresponding DAC values are calculated by interpolation of the gamma function derived for the red, green, and blue guns of the monitor. For example, in the case of a Hitachi CRT monitor recently calibrated, the DAC values were R = 183, G = 190, B = 184. Other monitors will have different values."
B.6.2 Verification Calculation
This section discusses the calculation for converting the separate luminances of red, green, and blue for the given test colour to CIE co-ordinates in x, y, and L.
The verification calculation is essentially the reverse of the calibration calculation discussed in section B.6. The known data are the colour co-ordinates of the colour producing element, and the red, green, and blue luminance components of each colour to be measured. The desired output are the colour co-ordinates and luminance for each colour.
Given the relationship between luminances of each colour, Lr, Lg, and Lb, matrix A (containing the phosphor co-ordinate data), and X, Y, and Z (from which x, y, and L are derived) the following equation is derived:
Z
Y
X
A
L
L
L
b
g
r
X, Y, and Z can be calculated.
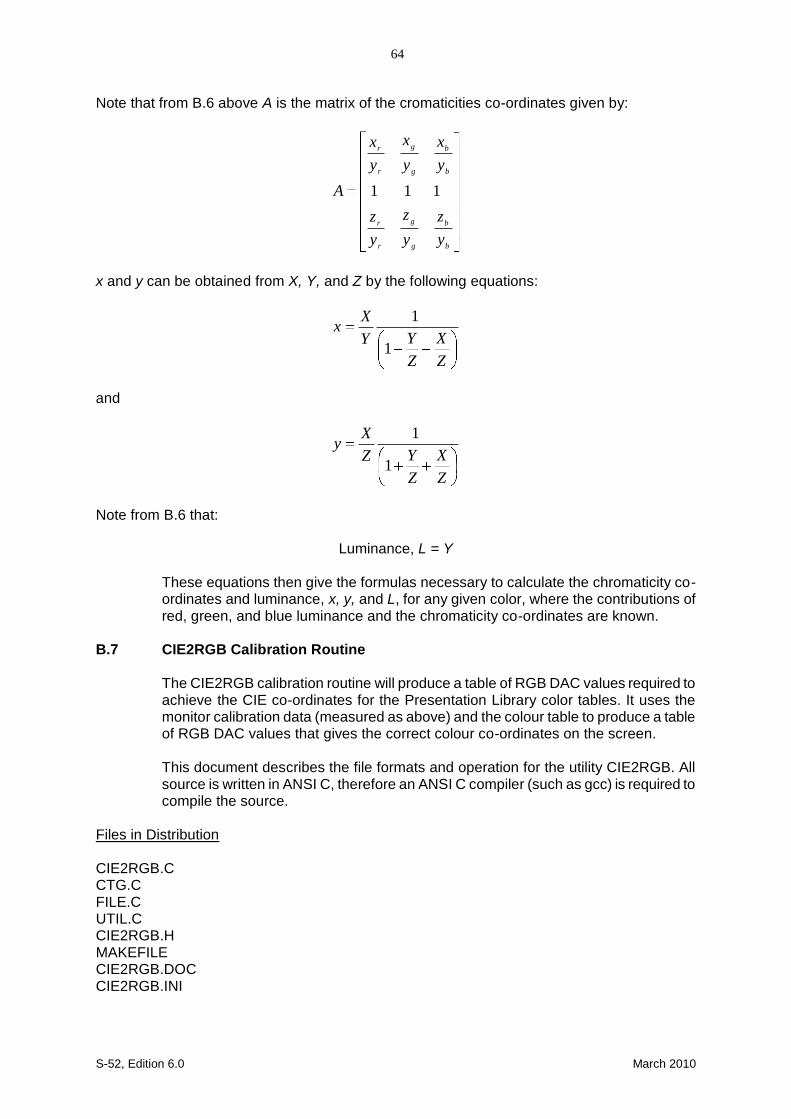
S-52, Edition 6.0 March 2010
64
Note that from B.6 above A is the matrix of the cromaticities co-ordinates given by:
b
b
g
g
r
r
b
b
g
g
r
r
y
z
y
z
y
z
y
x
y
x
y
x
A 111
x and y can be obtained from X, Y, and Z by the following equations:
Z
X
Z
YY
Xx
1
1
and
Z
X
Z
YZ
Xy
1
1
Note from B.6 that:
Luminance, L = Y
These equations then give the formulas necessary to calculate the chromaticity co-ordinates and luminance, x, y, and L, for any given color, where the contributions of red, green, and blue luminance and the chromaticity co-ordinates are known.
B.7 CIE2RGB Calibration Routine The CIE2RGB calibration routine will produce a table of RGB DAC values required to
achieve the CIE co-ordinates for the Presentation Library color tables. It uses the monitor calibration data (measured as above) and the colour table to produce a table of RGB DAC values that gives the correct colour co-ordinates on the screen.
This document describes the file formats and operation for the utility CIE2RGB. All
source is written in ANSI C, therefore an ANSI C compiler (such as gcc) is required to compile the source.
Files in Distribution CIE2RGB.C CTG.C FILE.C UTIL.C CIE2RGB.H MAKEFILE CIE2RGB.DOC CIE2RGB.INI

S-52, Edition 6.0 March 2010
65
Command Line Arguments The command line format for CIE2RGB is as follows: CIE2RGB source_file colour_table output_file config_file where: source_file = the input colour table file from the Presentation Library. It is in ASCII format (like the .dai file, provided in the digital PL files). colour_table = one of the following: DAY, DUSK, NIGHT This is the name of the table being processed. It corresponds to the data in the source file output_file = the generated file which contains the desired RGB values for each colour
in the colour table. A check on the colour tolerance (ΔE*) is calculated in the routine, and out or tolerance values are flagged in the output file. (This is a check of the monitor's capability to produce the colour as opposed to a check of the actual colour value achieved. Actual colour measurements must be made to check real tolerances.) Care must be taken in choosing the filename for the output file. If a file by this name already exists, the new file will be renamed to its current name, with the last character in the filename changed to a 0. For example, if the output_file argument was "OUT.LIB", and this file already existed, the new file would be renamed to "OUT.LI0" before writing the new colour table information.
config_file = a configuration file which contains the monitor's characteristics, formatting
strings, gamma function values, etc. This file is described below. If this command line argument is not specified, the default file is CIE2RGB.INI, which is a 'dummy' file with data for a 'typical' monitor. If this command line argument is not used, then the default values will be used. It should be noted here that the output colours from this calibration will be accurate only if the monitor is calibrated and the calibration data is used for the calculations.
Configuration File Format is in standard Microsoft Windows initialization file format.
This file is divided, for example, CIE2RGB's configuration file has a heading called "General" under which key values such as units, co-ordinate system, formatting strings, etc., are stored.
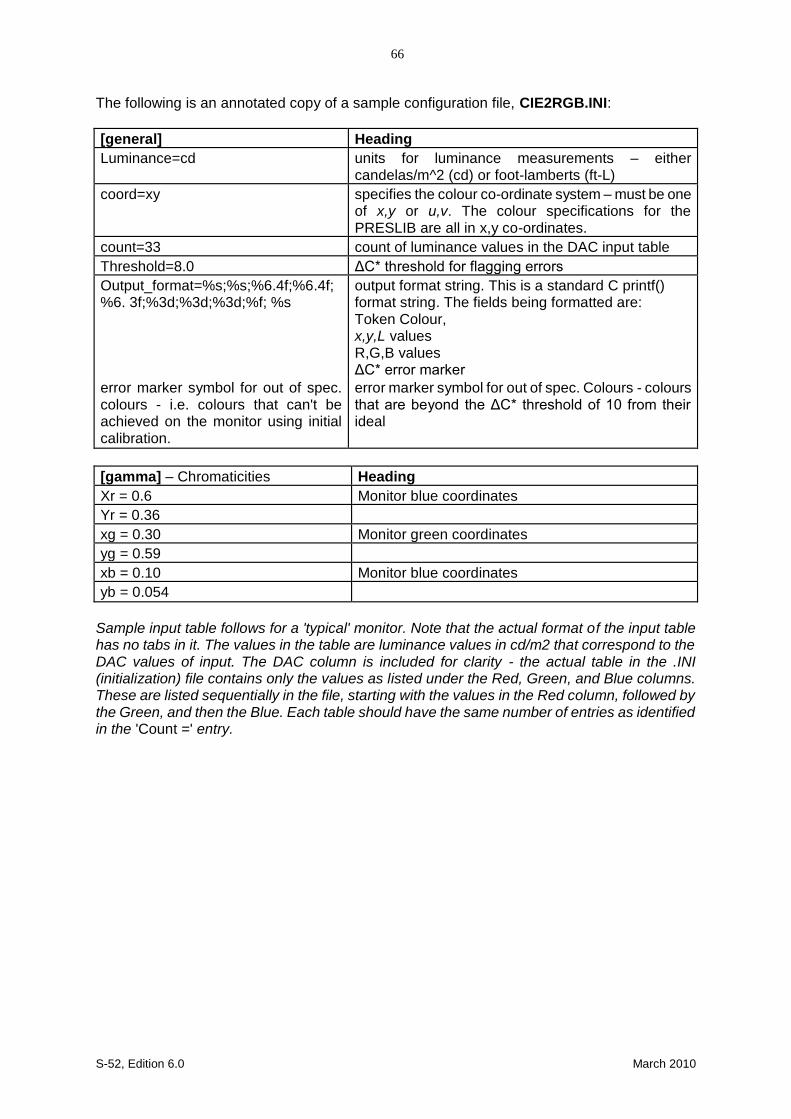
S-52, Edition 6.0 March 2010
66
The following is an annotated copy of a sample configuration file, CIE2RGB.INI: [general]
Heading
Luminance=cd units for luminance measurements – either candelas/m^2 (cd) or foot-lamberts (ft-L)
coord=xy specifies the colour co-ordinate system – must be one of x,y or u,v. The colour specifications for the PRESLIB are all in x,y co-ordinates.
count=33 count of luminance values in the DAC input table
Threshold=8.0 ΔC* threshold for flagging errors
Output_format=%s;%s;%6.4f;%6.4f;%6. 3f;%3d;%3d;%3d;%f; %s
output format string. This is a standard C printf() format string. The fields being formatted are: Token Colour, x,y,L values R,G,B values ΔC* error marker
error marker symbol for out of spec. colours - i.e. colours that can't be achieved on the monitor using initial calibration.
error marker symbol for out of spec. Colours - colours that are beyond the ΔC* threshold of 10 from their ideal
[gamma] – Chromaticities
Heading
Xr = 0.6 Monitor blue coordinates
Yr = 0.36
xg = 0.30 Monitor green coordinates
yg = 0.59
xb = 0.10 Monitor blue coordinates
yb = 0.054
Sample input table follows for a 'typical' monitor. Note that the actual format of the input table has no tabs in it. The values in the table are luminance values in cd/m2 that correspond to the DAC values of input. The DAC column is included for clarity - the actual table in the .INI (initialization) file contains only the values as listed under the Red, Green, and Blue columns. These are listed sequentially in the file, starting with the values in the Red column, followed by the Green, and then the Blue. Each table should have the same number of entries as identified in the 'Count =' entry.
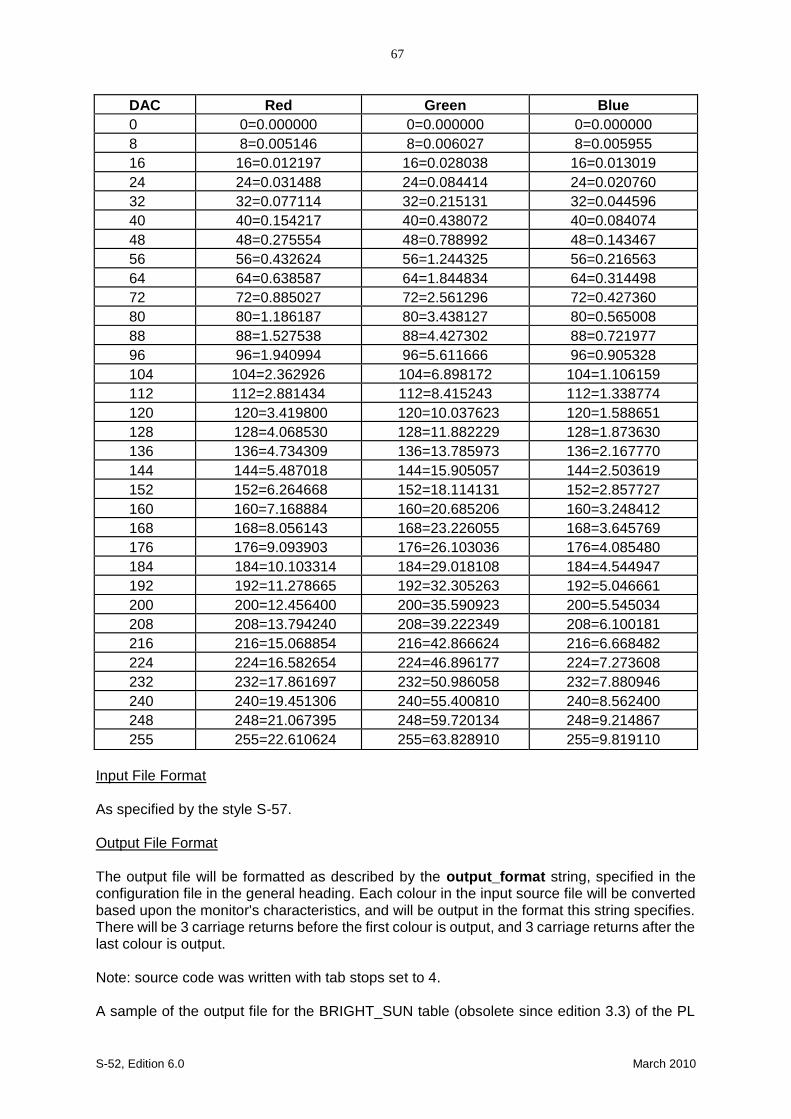
S-52, Edition 6.0 March 2010
67
DAC
Red
Green
Blue
0
0=0.000000
0=0.000000
0=0.000000 8
8=0.005146
8=0.006027
8=0.005955
16
16=0.012197
16=0.028038
16=0.013019 24
24=0.031488
24=0.084414
24=0.020760
32
32=0.077114
32=0.215131
32=0.044596 40
40=0.154217
40=0.438072
40=0.084074
48
48=0.275554
48=0.788992
48=0.143467 56
56=0.432624
56=1.244325
56=0.216563
64
64=0.638587
64=1.844834
64=0.314498 72
72=0.885027
72=2.561296
72=0.427360
80
80=1.186187
80=3.438127
80=0.565008 88
88=1.527538
88=4.427302
88=0.721977
96
96=1.940994
96=5.611666
96=0.905328 104
104=2.362926
104=6.898172
104=1.106159
112
112=2.881434
112=8.415243
112=1.338774 120 120=3.419800 120=10.037623
120=1.588651
128
128=4.068530
128=11.882229
128=1.873630 136
136=4.734309
136=13.785973
136=2.167770
144
144=5.487018
144=15.905057
144=2.503619 152
152=6.264668
152=18.114131
152=2.857727
160
160=7.168884
160=20.685206
160=3.248412 168
168=8.056143
168=23.226055
168=3.645769
176
176=9.093903
176=26.103036
176=4.085480 184
184=10.103314
184=29.018108
184=4.544947
192
192=11.278665
192=32.305263
192=5.046661 200
200=12.456400
200=35.590923
200=5.545034
208
208=13.794240
208=39.222349
208=6.100181 216
216=15.068854
216=42.866624
216=6.668482
224
224=16.582654
224=46.896177
224=7.273608 232
232=17.861697
232=50.986058
232=7.880946
240
240=19.451306
240=55.400810
240=8.562400 248
248=21.067395
248=59.720134
248=9.214867
255
255=22.610624
255=63.828910
255=9.819110 Input File Format As specified by the style S-57. Output File Format The output file will be formatted as described by the output_format string, specified in the configuration file in the general heading. Each colour in the input source file will be converted based upon the monitor's characteristics, and will be output in the format this string specifies. There will be 3 carriage returns before the first colour is output, and 3 carriage returns after the last colour is output. Note: source code was written with tab stops set to 4. A sample of the output file for the BRIGHT_SUN table (obsolete since edition 3.3) of the PL
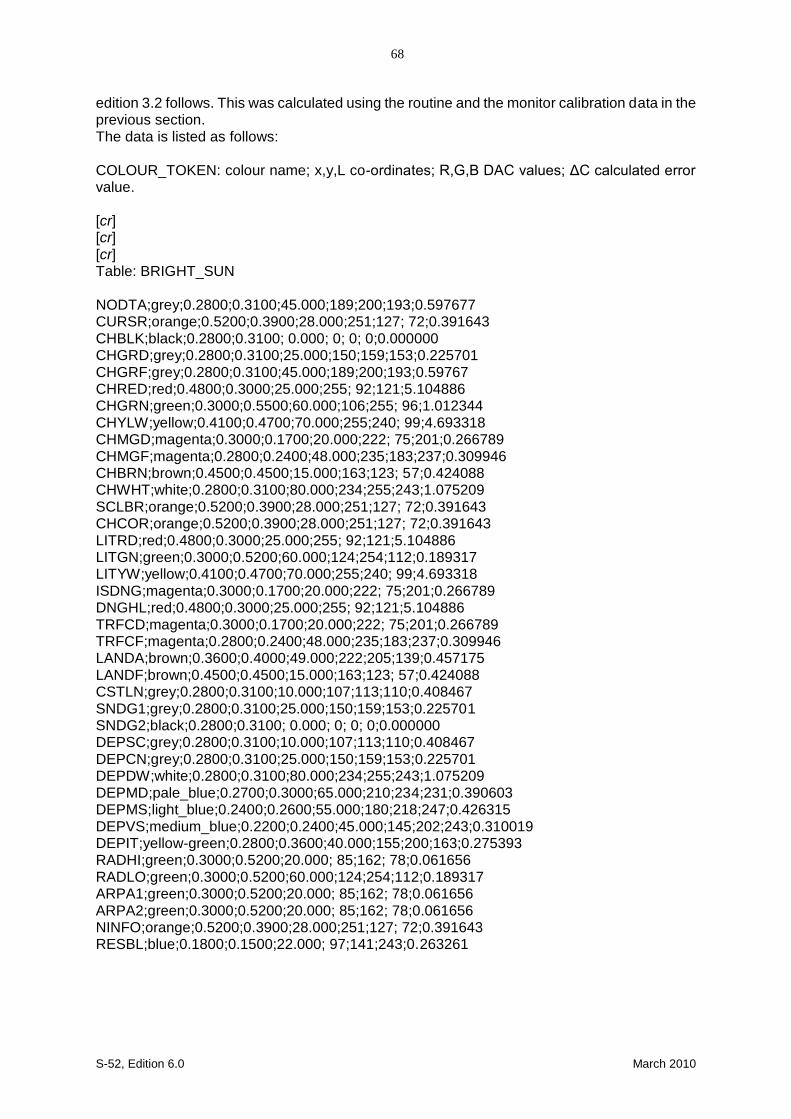
S-52, Edition 6.0 March 2010
68
edition 3.2 follows. This was calculated using the routine and the monitor calibration data in the previous section. The data is listed as follows: COLOUR_TOKEN: colour name; x,y,L co-ordinates; R,G,B DAC values; ΔC calculated error value. [cr] [cr] [cr] Table: BRIGHT_SUN NODTA;grey;0.2800;0.3100;45.000;189;200;193;0.597677 CURSR;orange;0.5200;0.3900;28.000;251;127; 72;0.391643 CHBLK;black;0.2800;0.3100; 0.000; 0; 0; 0;0.000000 CHGRD;grey;0.2800;0.3100;25.000;150;159;153;0.225701 CHGRF;grey;0.2800;0.3100;45.000;189;200;193;0.59767 CHRED;red;0.4800;0.3000;25.000;255; 92;121;5.104886 CHGRN;green;0.3000;0.5500;60.000;106;255; 96;1.012344 CHYLW;yellow;0.4100;0.4700;70.000;255;240; 99;4.693318 CHMGD;magenta;0.3000;0.1700;20.000;222; 75;201;0.266789 CHMGF;magenta;0.2800;0.2400;48.000;235;183;237;0.309946 CHBRN;brown;0.4500;0.4500;15.000;163;123; 57;0.424088 CHWHT;white;0.2800;0.3100;80.000;234;255;243;1.075209 SCLBR;orange;0.5200;0.3900;28.000;251;127; 72;0.391643 CHCOR;orange;0.5200;0.3900;28.000;251;127; 72;0.391643 LITRD;red;0.4800;0.3000;25.000;255; 92;121;5.104886 LITGN;green;0.3000;0.5200;60.000;124;254;112;0.189317 LITYW;yellow;0.4100;0.4700;70.000;255;240; 99;4.693318 ISDNG;magenta;0.3000;0.1700;20.000;222; 75;201;0.266789 DNGHL;red;0.4800;0.3000;25.000;255; 92;121;5.104886 TRFCD;magenta;0.3000;0.1700;20.000;222; 75;201;0.266789 TRFCF;magenta;0.2800;0.2400;48.000;235;183;237;0.309946 LANDA;brown;0.3600;0.4000;49.000;222;205;139;0.457175 LANDF;brown;0.4500;0.4500;15.000;163;123; 57;0.424088 CSTLN;grey;0.2800;0.3100;10.000;107;113;110;0.408467 SNDG1;grey;0.2800;0.3100;25.000;150;159;153;0.225701 SNDG2;black;0.2800;0.3100; 0.000; 0; 0; 0;0.000000 DEPSC;grey;0.2800;0.3100;10.000;107;113;110;0.408467 DEPCN;grey;0.2800;0.3100;25.000;150;159;153;0.225701 DEPDW;white;0.2800;0.3100;80.000;234;255;243;1.075209 DEPMD;pale_blue;0.2700;0.3000;65.000;210;234;231;0.390603 DEPMS;light_blue;0.2400;0.2600;55.000;180;218;247;0.426315 DEPVS;medium_blue;0.2200;0.2400;45.000;145;202;243;0.310019 DEPIT;yellow-green;0.2800;0.3600;40.000;155;200;163;0.275393 RADHI;green;0.3000;0.5200;20.000; 85;162; 78;0.061656 RADLO;green;0.3000;0.5200;60.000;124;254;112;0.189317 ARPA1;green;0.3000;0.5200;20.000; 85;162; 78;0.061656 ARPA2;green;0.3000;0.5200;20.000; 85;162; 78;0.061656 NINFO;orange;0.5200;0.3900;28.000;251;127; 72;0.391643 RESBL;blue;0.1800;0.1500;22.000; 97;141;243;0.263261
S-52, Edition 6.0 March 2010
69
RESYW;yellow;0.4100;0.4700;70.000;255;240; 99;4.693318 RESGR;grey;0.2300;0.2600; 6.500; 76; 98;110;0.623020 SHIPS;black;0.2800;0.3100; 0.000; 0; 0; 0;0.000000 PLRTE;red;0.5800;0.3500;18.000;241; 71; 60;0.124164 APLRT;orange;0.4900;0.4100;35.000;255;152; 79;0.172613 UINFD;black;0.2800;0.3100; 0.000; 0; 0; 0;0.000000 UINFF;grey;0.2800;0.3100;25.000;150;159;153;0.225701 UIBCK;white;0.2800;0.3100;80.000;234;255;243;1.075209 UIAFD;medium_blue;0.2200;0.2400;45.000;145;202;243;0.310019 UINFR;red;0.4800;0.3000;25.000;255; 92;121;5.104886 UINFG;green;0.3000;0.5200;60.000;124;254;112;0.189317 UINFO;orange;0.5200;0.3900;28.000;251;127; 72;0.391643 UINFB;blue;0.1800;0.1500;22.000; 97;141;243;0.263261 UINFM;magenta;0.3000;0.1700;20.000;222; 75;201;0.266789 UIBDR;grey;0.2800;0.3100;25.000;150;159;153;0.225701 UIAFF;brown;0.3600;0.4000;49.000;222;205;139;0.457175 OUTLW;black;0.2800;0.3100; 0.000; 0; 0; 0;0.000000 OUTLL;brown;0.3600;0.4000;49.000;222;205;139;0.457175 B.7.1 CHECKXYL calibration verification utility
This section describes the file formats and operation for the utility CHECKXYL. All source is written in ANSI C, therefore an ANSI C compiler (such as gcc) is required to compile the source.
This utility will allow a system calibration to be verified, by making measurements of actual colour co-ordinates and luminances on the screen, and using them as inputs to the utility to compare the actual co-ordinates to the specified co-ordinates. This is done in the CIE ΔE units.
Files in Distribution CHECKXYL.C COMPARE.C UTIL.C CHECKXYL.H MF (a makefile that can be used by invoking: make -f mf) CHECKXYL.DOC CHECKXYL.INI
S-52, Edition 6.0 March 2010
70
Command Line Arguments The command line format for CHECKXYL is as follows: CHECKXYL src_file pres_lib colourtable dest_file [config_file]\n\n"); where: src_file = the input file, which contains a list of colours that were measured on the target
monitor. These colours are supplied in a Microsoft Windows style database file, which has sections labeled with the colour table names (see below), and colours with the measured values. For an example, study the following excerpt from a CHECKXYL source file:
[DAY_BRIGHT] NODTA=0.279499;0.309014;44.893479 CURSR=0.520329;0.389384;28.026698
Here we see a colour called NODTA, with the x, y and L values stored in a semicolon separated list, for the DAY_BRIGHT colour table. NODTA will be compared against the original values stored in the Presentation Library file (see below).
pres_lib = the Presentation Library file, which has the format specified by S-57. dest_file = the generated file which contains a list of out of spec. colours (which differ
from the desired colours listed in the presentation library file), the non-distinguishable colours, as well as colours which differ greatly in luminance values from their intended values. If a destination file with the same name already exists, the existing file will be renamed to its current name, with the last character in the filename changed to a 0. For example, if the output_file argument was "OUT.LIB", and this file already existed, the existing file would be renamed to "OUT.LI0" before writing the new colour table information.
config_file = a configuration file (optional argument) which contains the monitor's
characteristics, formatting strings, gamma function values, etc. This file is described below. If this command line argument is not specified, the default file is CHECKXYL.INI
Configuration File Format This file is a standard Microsoft Windows initialization file format, which is a convenient method of storing simple database values. The database is divided into headings, and key values are stored under each heading. For example, CHECKXYL's configuration file has a heading called "general", under which key values such as the ΔE and ΔC thresholds are stored. The following is an annotated copy of a sample configuration file: [general] heading deltaCthreshold=8.0 delta C threshold for flagging errors deltaEthreshold=10.0 delta E threshold for flagging errors luminancethreshold=0.2 luminance threshold (fraction) for flagging luminance errors

S-52, Edition 6.0 March 2010
71
Sample Output Data Note in these examples that both the "out of spec" colour and "can't be distinguished" colours are both within specified tolerances and are used as examples to show the format of the output data. In the case of "out of spec colours", the value of dC must be greater than 8.0 to constitute an improper colour, and for "colours that can't be distinguished", dE is to be less than 10 for the colours to be too close in value. Table: DAY_BRIGHT Out of spec colours: (list of colours that fall outside of tolerance for original colour specification , in following format:) Meas: 0.2797;0.3092;44.9668 Orig: 0.2800;0.3100;45.0000 RES05 grey dC: 0.5004 Colours that can not be distinguished: (list of colours that cannot be distinguished from other colours.) NODTA: 0.2797;0.3092;44.9668 CHGRD: 0.2807;0.3112;24.8055 dE: 18.1919
__________

S-52, Edition 6.0 March 2010
72
Page intentionally left blank
S-52, Edition 6.0 March 2010
73
ANNEX C PROCEDURE FOR MAINTAINING THE CALIBRATION OF DISPLAYS C.1 Introduction
The application of ECDIS to practical marine use necessitates the development of a greater understanding of monitor limitations as they relate to an accurate colour display and a marine environment.
The factors that effect colour accuracy and the life of the monitor are discussed and an approach for onboard monitor testing and calibration is described in this Annex.
C.2 System Requirements
Monitor calibration is necessary for accurate colour reproduction. Several factors are important to review about the monitor system:
1. When the monitor is initially installed in the system, it should be calibrated and
the system matched to the IHO colour tables.
2. In use, the monitor should not let the colours shift beyond a certain perceptible relative limit. Each colour must be perceived as it was intended, and in a relative sense, one colour must not be mistaken for another.
3. When a colour shift occurs that is beyond limits, it should be possible to identify
that the shift is beyond limits without the need for special instruments and completely dark environments.
4. Monitor's will develop calibration errors with time, requiring a periodic
recalibration of the system. C.2.1 Display calibration-drift processes Monitors may lose calibration through a number of mechanisms:
- Wearout: For example over time, the electron gun structure of the CRT type of monitor wears, reducing the efficiency of the gun. This causes a relative diminishing of the output of the colour that is wearing fastest, and causes a colour shift toward the other colours. The wearing is 'coulombic', so depends on the total number of electrons that are emitted by the gun over time. In a practical computer graphic CRT, this effect will start to become noticeable (if you are looking for it) after 10,000 to 20,000 hours of operation. Usually it is roughly equal in each gun (because the dominant colour displayed is generally grey/white) and results in very little colour shift. In a situation where one colour dominates over time, colour shifts may appear.
- Drift: Drift occurs as components age. Drift will result in a change in the white
point of the monitor. For a CRT type of monitor this change in white point will usually result in a shift in the colour of grey over the luminance range. For CRT's that are used in computer graphics situations, this drift is usually not a serious concern. In shipboard applications, drift will be a greater concern because of the constant vibration causing internal set-up controls to change, as well as ECDIS
S-52, Edition 6.0 March 2010
74
being a more colour-critical application. It is expected that recalibration due to drift will be required after several thousands of operational hours.
- Component Failures: Component failure in the monitor or image generator
component can cause problems ranging from drift to complete failure. Failures can result in a display shifting its colours or in a complete failure of one of the colours or even the complete picture. It is possible that the shift will be proportionally different at different drive levels. High quality monitors are designed with mean time before failure (MTBF) of 50,000 hours or more which results in a long life of the imaging system. The shipboard environment will degrade this due to the vibration and salt air.
In practice these mechanisms will cause a drift in the white point. This means that the specific colour of white will drift to cause the picture to appear a little more pinkish, bluish, or greenish. Usually, this can be 'touched up', without requiring a completely new calibration.
C.3 Verification of the display performance at sea C.3.1 Calibration tests to be used for verification of display's performance onboard ship
Colour calibration has traditionally been a complex and difficult task. Significant advances have been made in this area to achieve accurate results using instrumentation. This has been achieved by using modern photometric instruments to measure luminance, and ensuring that the monitor to be calibrated is well shielded from stray light entering the measurement area.
Because instrument-based testing is still not practical as an ongoing test on shipboard, an alternate approach has been chosen. Specifically a "Greyscale Test" and an onboard "Colour Differentiation Test Diagram" have been chosen as subjective measures of the monitor's performance.
C.3.1.1 Greyscale test
Greyscale is a well understood test pattern in the Video Monitor world, and it has a natural application here.
The Greyscale test is a visual test that is used to determine the colour tracking of the monitor. It is general, it is non quantitative and requires judgement on the part of the operator to use. On the other hand, it is quite sensitive, and familiar to video technicians.
This test is simple to use. It consists of putting a greyscale of at least 8 steps from black to white on the screen. The greyscale should be made of rectangles that are at least 2.5 cm by 10 cm. These can be oriented in either a horizontal or vertical direction. The greyscale is critically observed by the viewer from a distance of about 50 cm to 100 cm and any colour shifts in any of the rectangles of grey are noted.
The greyscale should appear to be a neutral shade of white in all rectangles. Each should appear to be the same 'colour' as the others, even though varying in intensity from black to white. Colour shading in any of the rectangles indicates a problem in the adjustment of the display.
S-52, Edition 6.0 March 2010
75
Interpretation of results:
The observer will see either a greyscale that is pure and free from colouring, or one which shows varying degrees of shading. If no colouring is seen, then the display is performing properly. If slight shading is seen, then the display is usable. If there is a lot of shading, then the display may be providing false colour information.
This test meets the criteria of simplicity and universality, but fails to be either quantitative or accurate. It should be used as an indication of performance of the display, but not an absolute measure. It should be noted that the identification and the degree of problem will vary according to the operator, so should not be considered as a quantitative test.
C.3.1.2 Colour Differentiation Test Diagram
At the mariner's level, a test is required that reassures him that the display is functioning adequately or alternatively that servicing is required. This is provided in the Presentation Library, Part I, sections 15.4, 19.3 and 19.4. It provides test diagrams that allows the mariner to confirm that his display clearly differentiates the important colours, as well as acting as a test chart for setting the controls for night use.
Note that the Colour Test Diagram must be implemented using the software specifically intended to generate this diagram, which comes with the Colours & Symbol CD, in order to ensure that the colours actually used to generate the chart display are shown on the diagram. Any other form of the Colour Test Diagram (.tif file etc.) will not display the correct colours.
C.4 Re-calibration of the Monitor
Recalibration of the monitor should be performed by a knowledgeable monitor technician, who has experience of light measurement.
Two levels of calibration can be performed: White Point Touch-up and Complete.
Before undertaking either calibration procedure, it is necessary to set and lock the controls for the duration of the calibration:
Setting the Controls:
The Brightness control is used to adjust the black level of the monitor. This is the point where the monitor screen is seen as black, and this setting will create the blackest black that can be displayed. After the control is set, it must be locked in place. Any adjustment of the brightness setting after calibration invalidates the process, unless it is returned to its calibrated position, (e.g. a detent position).
With the monitor in a dark environment (accomplished either at night or with the monitor area darkened with a hood), and with the monitor turned on and warmed up to the manufacturer's specification, drive the monitor with a black signal (0, 0, 0). Observe the border around the CRT where the tube is normally black, and visually compare its intensity to the black square in the centre of the screen. First adjust the brightness control to its maximum, then adjust it down until there is no distinction between the black square and the background. Adjust the control up until the active area just shows. (If a luminance meter is available, measure the Luminance of this area. It should be less than 0.52 candelas per square metre). Lock the control for the

S-52, Edition 6.0 March 2010
76
remainder of the calibration process. Setting the Contrast Control:
The contrast control should be adjusted to achieve maximum required output level at full white signal. Using a luminance meter and a peak white signal, (DAC values of 255, 255, 255) adjust the contrast control for the maximum luminance required by the system. Lock this control for the remainder of the calibration process.
C.4.1 White point touch-up
On the first order, the colour shifting will be primarily caused by white point shifts. Calibration can be maintained by 'touching up' the white point on a periodic basis. This can be done by a CRT technician who adjusts controls inside the CRT, or can be performed by adjusting the colour DAC values through an adjustment and calculational process. (The DAC adjustment would have to be designed into the software system by the ECDIS manufacturer).
- White Point Calibration in the CRT: (Performed by adjusting the CRT
electronics) The white point of a CRT is set up by comparing the white colour on the screen to a standard lamp. The standard lamps for this purpose are fairly rugged, and compact. The process is reasonably accurate. The process is as follows:
1. Put a black signal onto the screen. Adjust the black level of each gun
(using the R,G,B cut-off controls) to just extinguish the raster in each colour.
2. Put a white signal on the screen, and adjust the individual gain controls of
the R,G, and B guns to achieve a white that matches the standard lamp.
- White Point Calibration in the Frame Buffer: Use an interface to the computer (keyboard or trackball) that allows the technician to adjust the white point by adjusting the maximum output of the DAC's to yield a white that compares with the standard. The computer will then adjust the DAC values in the middle of the range appropriately to maintain colour fidelity.
1. Put a white signal in the screen.
2. Adjust the input signal levels (DAC values) of red, green, and blue to give
the correct white level.
3. Instruct the computer to compute the DAC value corrections in the range. C.4.2 Automatic Calibration monitors
Several manufacturers make monitors's that have built-in calibration capability. (e.g. Barco). These monitor's will perform a white point calibration by adjusting internal controls through the use of their own light sensor and calibration system. This recalibration process is in general suitable for the white point touch-up requirements of this Annex.
S-52, Edition 6.0 March 2010
77
C.4.3 Complete calibration
Calibration and adjustment beyond the white point adjustments are the domain of a more detailed and complex procedure, and are not practical to undertake on the Bridge. Under normal conditions, when a display fails the white balance test or cannot be corrected by a white balance adjustment, it should be returned to the factory for re-calibration and/or repair. (See Annex B: Procedure for Initial Calibration of Colour Displays.)
This Annex was researched and written by:
Matthew Cowan 18 McAllister Lane
Bloomingdale, Ontario under a contract funded by The Canadian Coast Guard.
The Grayscale Test was suggested by:
Dave Hannah, Kelvin Hughes Limited, Ilford, Essex, U.K.
This annex was amended as generic for any type of monitor by: Hannu Peiponen, Furuno Oy, Espoo, Finland.
__________
INTERNATIONAL HYDROGRAPHIC ORGANIZATION
GUIDANCE ON UPDATING THEELECTRONIC NAVIGATIONAL CHART
3rd Edition, December 1996
Special Publication No. 52APPENDIX 1
published by theInternational Hydrographic Bureau
MONACO
400-XII-1996 S-52 App 1

INTERNATIONAL HYDROGRAPHIC ORGANIZATION
GUIDANCE ON UPDATING THEELECTRONIC NAVIGATIONAL CHART
3rd Edition, December 1996
Special Publication No. 52APPENDIX 1
published by theInternational Hydrographic Bureau
4, Quai Antoine 1erB.P. 445 - MC 98011 MONACO Cedex
Principauté de MonacoTelex : 479 164 MC - INHORG
Telefax : (377) 93 25 20 03 (till 30 April 1997) (377) 93 10 81 40 (from 1 May 1997)
E-mail: [email protected] http://www.iho.shom.fr

Page intentionally left blank

i
TABLE OF CONTENTS
Page
1. INTRODUCTION .................................................................................................................. 1
1.1 Background and References ..........................................................................................1
1.2 Scope and Objectives ....................................................................................................4
2. MODEL OF UPDATING ........................................................................................................5
2.1 Introduction ...................................................................................................................5
2.2 Terminology ..................................................................................................................5
2.3 Updating Entities...........................................................................................................6
2.4 Service Categories .........................................................................................................8
2.5 Updating Categories ......................................................................................................8
3. SPECIFIC UPDATING GUIDANCE ..................................................................................14
3.1 Source provider (Hydrographic Office).......................................................................14
3.2 Issuing Authority (Regional ENC Coordinating Centre).............................................15
3.3 Distributors..................................................................................................................16
3.4 ECDIS Manufacturers .................................................................................................17
3.5 ECDIS Users ...............................................................................................................20
ANNEXES
Annex A Definitions and Terms ............................................................................................... A.1
Annex B Current Updating Practice for Paper Charts .............................................................. B.1
Annex C Estimate of Data Volume .......................................................................................... C.1
__________

ii
Page intentionally left blank

1
1 INTRODUCTION
1.1 Background and References
1.1.1 Background
This publication, Guidance on Updating the Electronic Navigational Chart (ENC), wasdeveloped by the Updating Working Group (UWG) of the IHO Committee On HydrographicRequirements for Information Systems (CHRIS). There has been considerable progress intechnology, knowledge and practical experience with ECDIS since the UWG was firstconstituted. The scope, aims and assumptions upon which this latest work is based arereviewed below.
1.1.2 References
Care has been taken to be consistent with and be guided by the contents of relevant reportswith particular recognition being given to the latest edition of:
.1 IMO Performance Standards for ECDIS, Assembly Resolution A.817 (19)
.2 IHO Publication S-52 "Specifications for Chart Content and Display Aspects ofECDIS" with:
Appendix 2 - "Colour & Symbol Specifications for ECDIS"Appendix 3 - "Glossary of ECDIS - related Terms".
.3 IHO Publication S-57 "IHO Transfer Standard for Digital Hydrographic Data". .4 IHO CL 27/1994, Encl., "Worldwide Electronic Navigational Chart Data Base
(WEND), Report of Activities of the Special Committee, 1994".
1.1.3 Terminology
Terminology used in this report is consistent with S-52 Appendix 3, "Glossary of ECDIS-related Terms". Additions and amplifications are described in Section 2 and Annex A.
1.1.4 Sea Trials
Various aspects of ECDIS have been evaluated and tested during the past few years. Projectreports of these practical and, in most cases, at-sea experiences, have also been consideredin this report. In particular:
.1 Canadian ECDIS Testbed Project
.2 The North Sea Project ("The North Sea Project - Final Report", NorwegianHydrographic Service, 1989).
.3 The Seatrans Project ("The Seatrans Project", Norwegian Hydrographic Service, 1991). .4 "Hamburg Ferry" ECDIS Testbed, Germany (1991).
.5 The Netherlands ECDIS Project ("Report of ECDIS Sea Trials", NetherlandsHydrographic Service, 1991).
.6 US ECDIS Test and Evaluation Program.
.7 BANET Trial, Germany, UK, Finland (1993-95)
.8 US Coast Guard Field Trial on Manual Updating (1996)

2
1.1.5 WEND Committee
The IHO Special Committee on a Worldwide Electronic Navigational Chart Data Base(WEND) has agreed on the following definition of WEND:
1. The Worldwide Electronic Navigational Chart Database (WEND) System is acommon, worldwide network of ENC datasets, based on IHO standards, designedspecifically to meet the needs of international maritime traffic using ECDIS whichconform to the IMO Performance Standards.
2. The System will utilize HO national ENC datasets, which are integrated and may bedistributed and updated through regional centres.
3. WEND represents an IHO System based on the cooperation of participating MemberStates.
A Regional Centre under the WEND concept is designated a Regional ENCCoordinating Centre (RENC). This Guidance on Updating the ENC addresses theupdating support recommended to be provided by the RENC.
A number of principles adopted at the WEND meeting have a direct bearing on ENCupdating:
1 Ownership and Responsibility
a) A Member State has responsibility for preparation and provision of digital dataand its subsequent updating for waters of national jurisdiction.
b) A Member State responsible for originating the data should validate it.
f) Legal liability must be recognized by participants.
2 Cooperation and Coordination
e) Neighbouring Member States are encouraged to cooperate in boundary areas.
4 Standards and Quality Management
a) A recognized standard of quality management (e.g., ISO 9000) should beemployed to ensure a high quality of the ENC services.
b) There should be compliance with all relevant IHO and IMO standards andcriteria.
5 Distribution
a) Distribution of products may be separate from the data base management.
b) Methods to be adopted should ensure that data bear a stamp or seal of approvalof the issuing HO.
3
6 Updating
a) Technically and economically effective solutions for updating should beestablished.
b) National HO’s providing source data are responsible for advising the issuing HOof update information in a timely manner.
c) The issuing HO is responsible for providing timely updates to the ENC for themariner.
d) Updating information to regional or greater area ENC datasets should beavailable world-wide.
The conceptual model agreed by the WEND Committee for the operation of anRENC is at Figure 1, with updating segments emphasized.
1.2 Scope and Objectives
The basic objective of this publication is the facilitation of the development of technically andeconomically feasible solutions for updating the ENC within a shipboard ECDIS to supportsafe and efficient navigation that:
.1 are efficient, effective, applicable world wide and easily verifiable, and.2 maximize the speed, accuracy and reliability advantages of digital data transfer.
Specifically, this publication sets forth the guidance for the updating service and the ECDISto support the updating of the official navigational data base specified by IMO AssemblyResolution A.817 (19), defined by IHO publications S-52 and S-57, and issued through anRENC. Some requirements may be satisfied by one of a variety of service options.
1.2.1 Updating of paper charts
The existing process for updating the paper chart is described at Annex B. Safety ofnavigation dictates that many of the processes described will need to have their counterpartin any update process for the ENC.
1.2.2 Volume of updates
An estimate of the anticipated volume of data required to update a worldwide set of ENCs isgiven in Annex C. The update mechanism described in S-57 should facilitate efficientupdating by electronic means based on the estimated data volume given in Annex C.
1.2.3 Electronic Chart Systems
Electronic Chart Systems (ECS), which are not the equivalent of the conventional nautical(paper) chart, are not considered here.
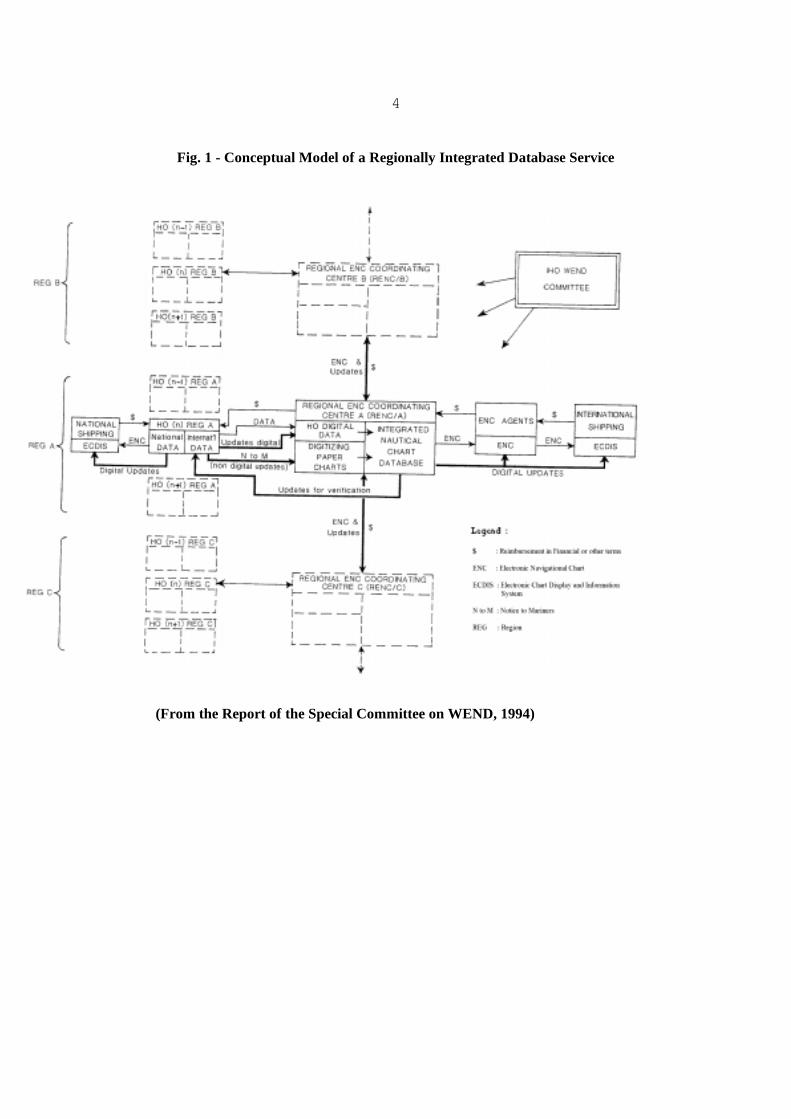
4
Fig. 1 - Conceptual Model of a Regionally Integrated Database Service
(From the Report of the Special Committee on WEND, 1994)
5
2 MODEL OF UPDATING
2.1 Introduction
In this section, updating the Electronic Navigational Chart is considered an application processinvolving several real systems. The analysis which follows is concerned with the informationexchange between the various entities involved with updating. No attempt is made, however,to describe internal functions within a participating system, such as the access to an updateinformation file, or details of check procedures.
The scope of the model is:
.1 To define the possible transfer types capable of transferring the ENC updateinformation for ECDIS,
.2 To identify any interfaces at the end systems and within the updating for each possibletransfer type,
.3 To define the services required at the interfaces, and which of them need specification.
2.2 Terminology
(a) ENC Update Information encompasses the information necessary at a certainmoment to render an ENC current and correct as required.
(b) ENC Updating is the process of producing, disseminating and incorporating the ENCupdate information in an ECDIS. To accomplish an update of an ENC, updates areapplied to the SENC. Issuing a new edition of the ENC, and the reissuing of a versionof the current edition ENC which incorporates all changes which have beendisseminated as ENC Updates up to a specific date (the equivalent of a "correctedreprint" paper chart), although logically the most comprehensive update operations,are not treated here. ENC Updating involves:
.1 Entities engaged in processing the ENC update information;
.2 Physical Media used to carry the update information;
.3 Update Operations, chosen by the issuer of the update information and subjectto his responsibility, to provide the update information to the SENC in the mostefficient way;
.4 Transfer Procedures of update information, depending on the media andchannels used as well as validation procedures required to secure correctness;
.5 Data Base Operations for incorporating the update information and verifyingthe updated data base.

6
2.3 Updating Entities
(a) The following entities are involved in updating (see Fig. 2):
.1 Source Provider: an originator, such as an originating HO, or anotherinformation source, such as a local authority, providing navigational warnings.
.2 Issuing Authority: an entity assembling an ENC update data set from updateinformation provided from various sources, and being responsible for setting upthe transfer of the update set. By definition, the Issuing Authority is the issuer ofthe ENC to which the update applies. The Issuing Authority under the WENDsystem is the Regional ENC Coordinating Centre (RENC).
.3 Distributor: an entity responsible for packaging, repackaging, and/ordisseminating an update set to all users, or a group of users.
.4 Receiver: usually the mariner on board ship, or the telecom receiver linked to theECDIS.
.5 Applier: an entity controlling the application of the update information, e.g. themariner keying in update information, or the software inside ECDISautomatically processing the ENC update information.
.6 SENC: the ECDIS data base to be ultimately updated, and actually being usedfor data access.
(b) Source Provider and SENC are the primary entities as they represent origin andtarget of the updating process. They must always be present. The other entities arecalled transit entities as they perform intermediary functions which are not requiredfor all transfer media.
(c) Entities that actually participate in the updating depend on the media used fortransferring the update information. For example, a direct link (e.g. via telephone)between a receiving ECDIS and an RENC does not involve an intermediatedistributor.
(d) Entities do not necessarily have to be considered as organizationally distinct.Depending on the organizational concept adopted for updating, two or more entities(e.g. source provider and issuing authority, or issuing authority and distributor) maybe coincident. The particulars of the organizational concept are beyond the scope ofthis Guidance.
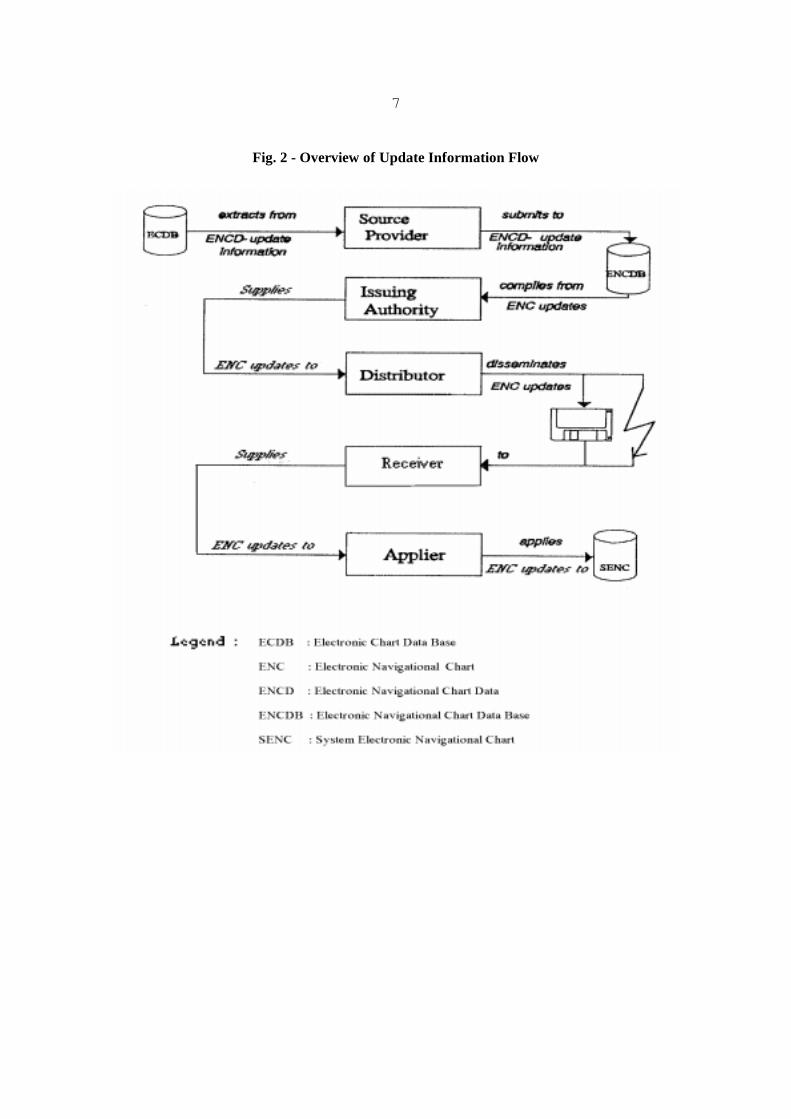
7
Fig. 2 - Overview of Update Information Flow

8
2.4 Service Categories
(a) Scheduled Service. An updating service at regular intervals known in advance by boththe sender and receiver. The dates of transmission can be those agreed upon in abilateral contract between e.g., distributor and receiver, or a broadcast or mailingschedule of the distributor published in an official publication. There may becustomized service modes, such as expedited transfer or direct on-line transfer, whichstill are considered scheduled as long as they follow a previously agreed schedule.
(b) On-demand Service. Any updating service at the expressed request of an individualuser, e.g. transmission of updates called up by the user in a dial-up session with anofficial updating data base (another example is the request for retransmission of amissing Update Set). All update supply actions initiated by the user are regarded "ondemand" unless the supplier itself relies on strict observation of a previously agreedschedule (and issues a "nil-message" if no updates are available).
(c) Extraordinary Service. Any updating transmission not following a regular schedule,and not individually requested by the user, such as an extraordinary navigationalwarning containing urgent ENC-related information.
2.5 Updating Categories
The updating methods can be subdivided into different categories:
2.5.1 Application Categories
(a) Manual Updating consists of a human operator entering information manually intothe ECDIS, usually based on unformatted update information that is not machine-readable (such as printed NtMs, voice radio, verbal communication etc.). However,in order for the ECDIS to accept manual updates, the update information must beentered in a structured way at least compatible with the relevant ECDIS standards.
(b) Automatic Updating consists of an updating process by which the updatinginformation is applied, within the ECDIS, to the SENC without operator intervention. All automatic updating requires the data to be formatted according to the relevantECDIS standards. Automatic updating can be broken down into the following twosub-classes:
.1 Fully-automatic Updating is an updating method where the update datareaches the ECDIS directly from the distributor without any humanintervention. This may be accomplished through a broadcasttransmission, INTERNET, etc. Following an acknowledgement oracceptance procedure, the ECDIS automatically processes the update tothe SENC.
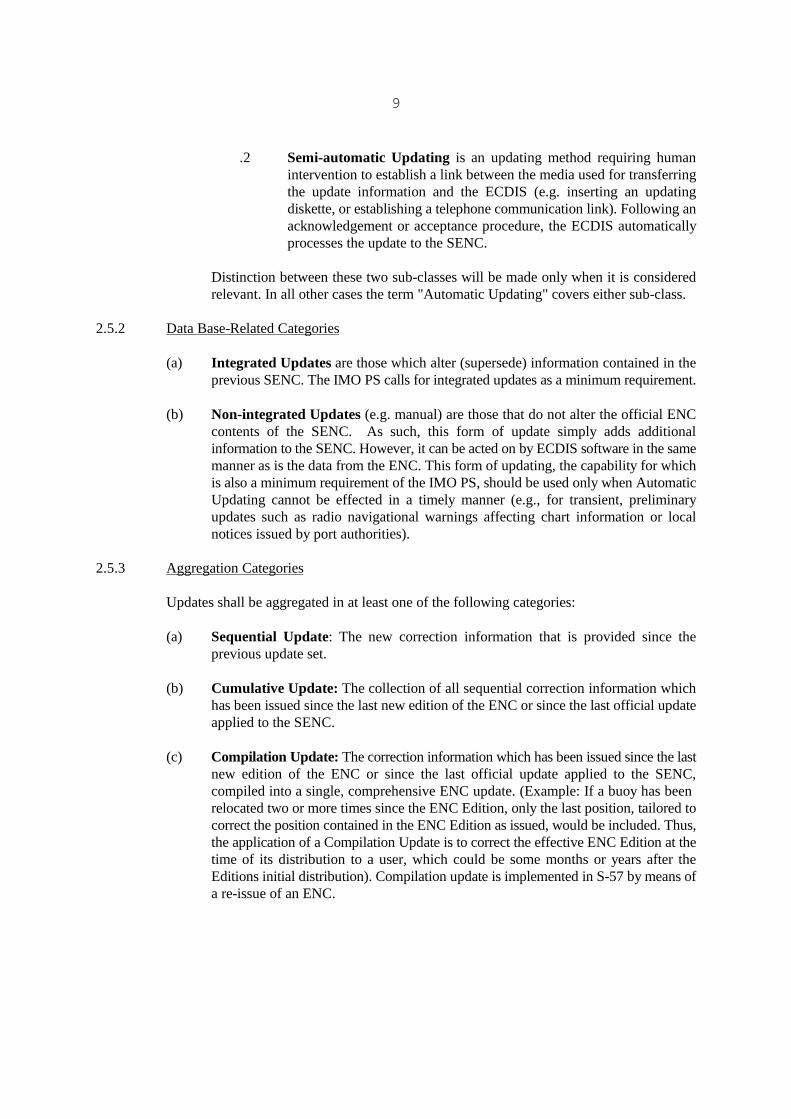
9
.2 Semi-automatic Updating is an updating method requiring humanintervention to establish a link between the media used for transferringthe update information and the ECDIS (e.g. inserting an updatingdiskette, or establishing a telephone communication link). Following anacknowledgement or acceptance procedure, the ECDIS automaticallyprocesses the update to the SENC.
Distinction between these two sub-classes will be made only when it is consideredrelevant. In all other cases the term "Automatic Updating" covers either sub-class.
2.5.2 Data Base-Related Categories
(a) Integrated Updates are those which alter (supersede) information contained in theprevious SENC. The IMO PS calls for integrated updates as a minimum requirement.
(b) Non-integrated Updates (e.g. manual) are those that do not alter the official ENCcontents of the SENC. As such, this form of update simply adds additionalinformation to the SENC. However, it can be acted on by ECDIS software in the samemanner as is the data from the ENC. This form of updating, the capability for whichis also a minimum requirement of the IMO PS, should be used only when AutomaticUpdating cannot be effected in a timely manner (e.g., for transient, preliminaryupdates such as radio navigational warnings affecting chart information or localnotices issued by port authorities).
2.5.3 Aggregation Categories
Updates shall be aggregated in at least one of the following categories:
(a) Sequential Update: The new correction information that is provided since theprevious update set.
(b) Cumulative Update: The collection of all sequential correction information whichhas been issued since the last new edition of the ENC or since the last official updateapplied to the SENC.
(c) Compilation Update: The correction information which has been issued since the last
new edition of the ENC or since the last official update applied to the SENC,compiled into a single, comprehensive ENC update. (Example: If a buoy has been relocated two or more times since the ENC Edition, only the last position, tailored tocorrect the position contained in the ENC Edition as issued, would be included. Thus,the application of a Compilation Update is to correct the effective ENC Edition at thetime of its distribution to a user, which could be some months or years after theEditions initial distribution). Compilation update is implemented in S-57 by means ofa re-issue of an ENC.

10
2.5.4 Formatting Categories
(a) Unformatted Updating: Any updating based on updating information provided ina format not complying with the IHO Standard or not being machine-readable.
(b) Formatted Updating: Updating based on machine-readable updating informationprovided in accordance with the IHO Standard.
2.5.5 Concepts of Typical Information Flow, Application Flow and Delivery (At Sea) ofUpdates are illustrated in Fig. 3, 4 and 5 respectively.
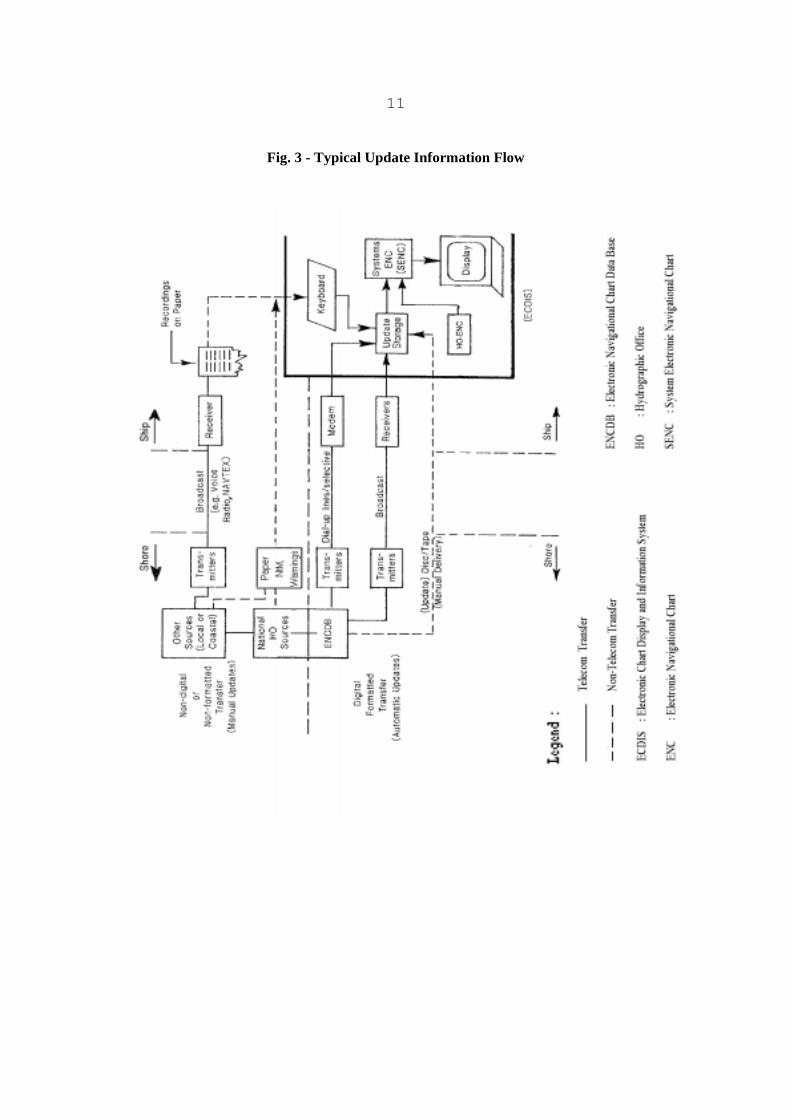
11
Fig. 3 - Typical Update Information Flow
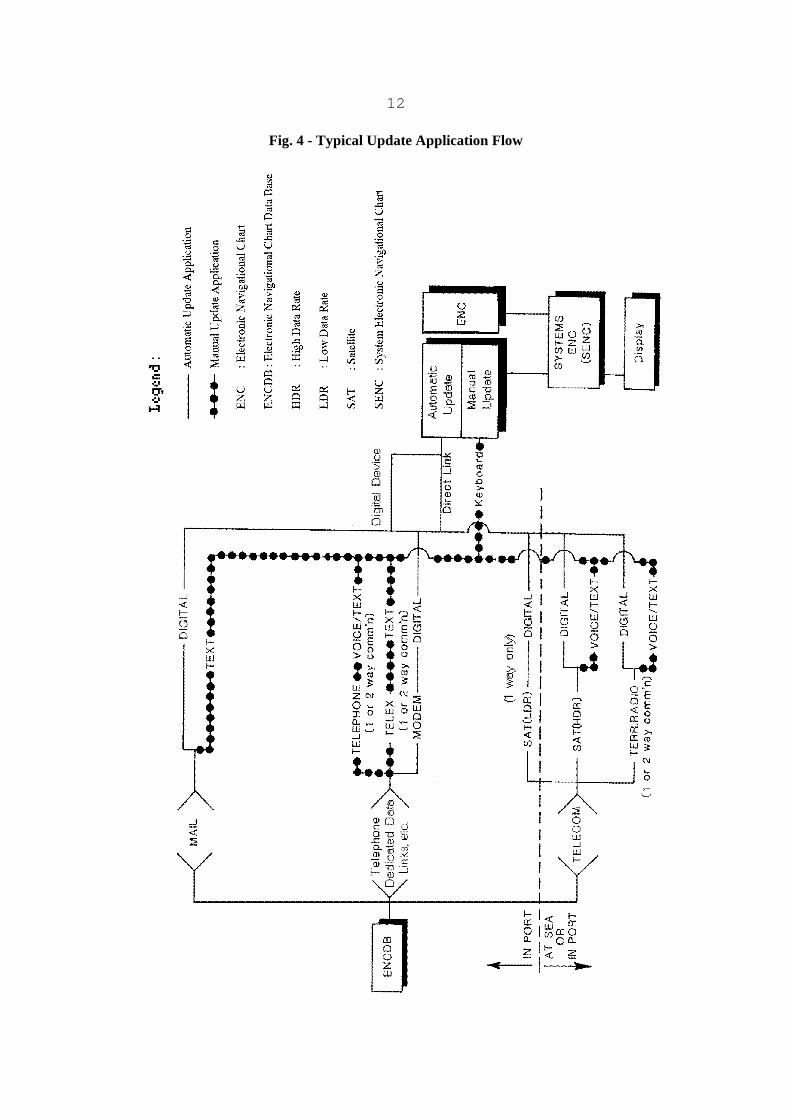
12
Fig. 4 - Typical Update Application Flow
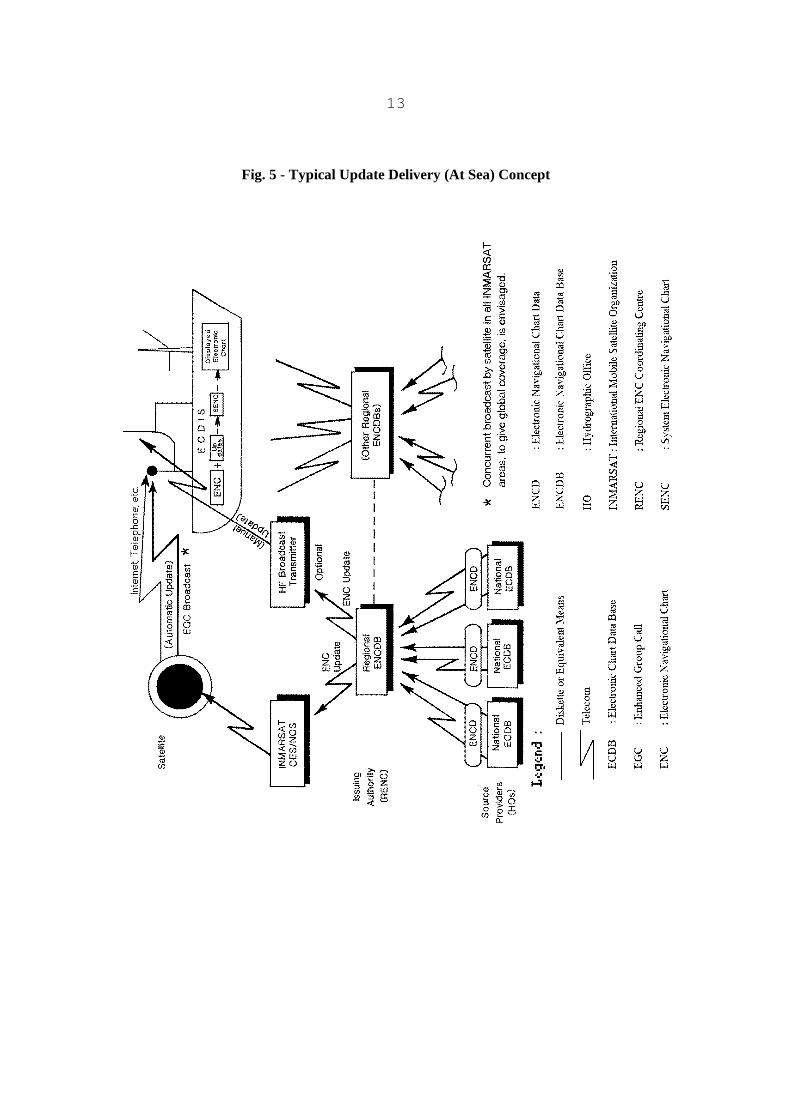
13
Fig. 5 - Typical Update Delivery (At Sea) Concept

14
3 SPECIFIC UPDATING GUIDANCE
An ENC may contain several cells for various areas and navigational purposes. However, forclarity in presenting Specific Updating Guidance, the ENC referred to in this section is anindividual cell file based on the ENC Product Specification of S-57. An individual ENC cellfully complies with the ENC definition given in the Glossary of ECDIS-related Terms.
There are a number of ways the ENC data in the ECDIS SENC may be updated. Guidance isprovided to define a minimum capability for the ECDIS on these methods, directed to:
.1 The Hydrographic Office (Source Provider) that originates the update information;
.2 The Issuing Authority responsible for the ENCDB, ENC, and ENC Update;
.3 The Distributor of the ENC Update;
.4 The Manufacturer of the ECDIS, and;
.5 The User (normally the mariner).
3.1 Source Provider (Hydrographic Office)
(a) Provision of Update Information. Hydrographic Offices which provide ENC Data(ENCD) to an Issuing Authority should take the same responsibility for updates asthey do for the ENCD supplied. That is:
.1 the update information must be furnished in a manner such that the change itreflects can be distinguished by the Issuing Authority;
.2 the update information must accomodate all scales or navigational purposes, asappropriate, for which the ENCD was furnished.
(b) Time Interval for Issuing of Updates. According to accepted practice (Ref.IHO/IMO World-Wide Navigational Warning Service, Guidance Document, IHOPub. S-53), the time interval from the initial broadcast of a Radio NavigationalWarning to the issue of its corresponding Notice to Mariners should not exceed 42days. All agencies involved in the preparation and distribution of ENC Updates shouldmeet the same requirement. A considerable reduction in this time interval should bepossible by taking advantage of existing digital and telecommunications technology.
(c) Coordination of Boundary Area Updates. Neighbouring HOs should coordinate thecontent and submission to the Issuing Authority of ENC Update information whichimpacts their boundary areas.
(d) Quality Management. HOs should establish appropriate quality managementinfrastructures for the production, management and distribution of ENC Updateinformation.

15
(e) Marine Safety Information (MSI). Other information such as coastal radio warnings,local notices to mariners/notices to shipping, etc. provided to the mariner by other thanhydrographic authorities may be relevant to ECDIS. While specific guidance to thoseproviders for the purpose of manually updating the SENC is beyond the scope of thisdocument, those providers should bear in mind that, with time, more mariners will beentering this information into their ECDIS. They should therefore endeavour to easethis task for the mariner by adding whatever additional information might beappropriate to facilitate manual input.
3.2 Issuing Authority (Regional ENC Coordinating Centre)
(a) Responsibility for ENC Updates. The Issuing Authority for an ENC is responsiblefor official updates for that ENC.
(b) Quality Management. Issuing Authorities should establish appropriate qualitymanagement infrastructures for the production, management and distribution of ENCUpdates.
(c) Distribution Network. It is the responsibility of the Issuing Authority to establish adistribution network for ENC updates.
(d) Media and Schedule for Distribution. In order to support at least Semi-automaticupdating via hard media, ENC Updates shall be prepared and provided in adequatequantities for distribution on a regular schedule adequate to support safe navigation.The scheduled broadcast on INMARSAT-C SafetyNET of update information forFully Automatic updating for the ENC at sea is desirable. Other updating services,such as direct access by the mariner via high speed telecommunications networks tothe Issuing Authority’s ENC update information, should be investigated.
(e) Data Integrity. The ENC will employ the error detection scheme designated in theENC Product Specification in S-57.
(f) Availability to Other Issuing Authorities. ENC Updates should be madeimmediately available to other Issuing Authorities.
(g) Method for Implementation. Official ENC Updates shall conform to the ECDISRevision (ER) Application Profile of S-57.
(h) Distinguishable Update. The ENC updates must allow the changes to bedistinguished on the ECDIS display.
(i) Identification. Each update shall be clearly and uniquely identified as described inthe Product Specification of S-57.
(j) Broadcast Medium. Scheduled broadcasts of ENC Updates, e.g. over theINMARSAT-C EGC SafetyNET service, should be established as early as feasibleworldwide.
16
(k) Non-availability of Updates. A nil message should be issued if no updates areavailable for a scheduled broadcast.
(l) Bilateral Arrangements. The relationship and legal liability arrangements betweenthe HO and the Issuing Authority for updating are matters to be determined betweenthe parties involved.
(m) New Editions of ENCs. A new edition of an ENC should be announced at least 8weeks, and made available at least 4 weeks, prior to its effective date to ensure timelyreceipt by affected ECDIS users. On the effective date of the new edition, the previousedition will be superseded and no further Updates will be issued for it.
3.3 Distributors
3.3.1 General
(a) Distribution Network. A distribution network for ENC Updates will exist asestablished by the Issuing Authority.
(b) Scheduling. Updates received from the Issuing Authority should be made availableto the mariner within a time interval adequate to support safe navigation.
(c) Quality Management. Distributors should establish appropriate quality managementinfrastructures for the distribution of ENC Updates.
3.3.2 Fully Automatic Updates
(a) Broadcast Data Integrity. To ensure the integrity of the broadcast update, effectivesafe transmission mechanisms and/or error detection methods should be employed.
3.3.3 Semi-automatic Updates
(a) Hard Media. ENC Updates should at least be made available on 3.5" high densitydiskettes.
(b) Telecommunications. On-demand service via a telecommunications link should bemade available.
(c) Stocks of Updates. Distributors of ENCs should keep hard media stocks of all ENCUpdates in effect against the ENC editions stocked.
(d) ENC and its Updates. All updates in force for an ENC edition should accompany thatENC upon distribution.
(e) User-friendliness. Semi-automatic Updating of the ENC occurs at the ECDISequipment, and should be accomplished by the mariner without the need for theassistance of the Distributor or Manufacturer.
17
(f) Repackaging. Distributors may repackage the ENC Updates provided that thecontents are not altered.
3.4 ECDIS Manufacturers
3.4.1 General
(a) Data Integrity. The ECDIS should be able to process ENC Updates withoutdegradation of the information content of the ENC or ENC Update. For example, allinformation regarding attributes, logical relationships, geometry, and topology mustbe accounted for.
(b) Verification of Application. The ECDIS should provide a method to ensure thatupdates have been correctly applied to the SENC. Those updates are either an OfficialENC Update integrated into the SENC display or temporary information that wasentered manually.
(c) Integrated/Non-integrated Updates Distinction. Updates should be clearlydistinguishable on the display. Once accepted, integrated updates should beindistinguishable from ENC data. Non-integrated updates (i.e., those enteredmanually) shall be distinguishable as described in IHO S-52, App.2/2.3.4.
(d) Storage Separation. ECDIS should store all updates separately from the ENC.However, such separate storage may utilize the same data storage device.
(e) Recall for Display. It should be possible on demand to review previously installedupdates.
(f) Compatibility. ENC Updates comply with the ENC Product Specification of IHO S-57.
(g) Non-interference. ECDIS should be able to receive updates without interfering withits current operation.
(h) Log File. ECDIS should keep a record of updates, including time of application andidentification parameters described in paragraph 3.2 (i), through a logfile. The logfileshould contain, for each update applied to or rejected by the SENC, the followinginformation:
.1 date and time of application/rejection;
.2 complete and unique identification of update as described in the S-57 ProductSpecification;
.3 any anomalies encountered during application;
.4 type of application: manual/automatic.

18
(i) Update out of sequence. The ECDIS should warn the user when an ENC Update isapplied out of sequence, terminate the update operation and restore the SENC as itwas before the application of the Update File.
3.4.2 Automatic Update
(a) Interface
(i) Fully Automatic Updates. The ECDIS should be capable of being interfacedto an INMARSAT-C EGC SafetyNET-capable receiver for direct data transferof ENC Updates.
(ii) Semi-automatic Updates. The ECDIS should be capable of receiving ENCUpdates in standard IHO format by 3.5" high density diskette and through atelephone network.
(b) Reception of ENC Updates
(i) ENC Update data shall be recorded automatically in the update storage of theECDIS.
(ii) The identification of the Issuing Authority of the ENC Update should bechecked for conformance with the corresponding identifier of the ENC.
(iii) If any errors are detected from the receiving device, the reception procedureshall be terminated and the ENC Update flagged invalid in the record ofupdates. The user should be informed of the corruption.
(c) Sequence Check. The following sequence number checks should be performed at thetime of application, for sequential and cumulative updates:
.1 File extension of the ENC Update
.2 Update number of the ENC Update
.3 Update sequence number of the individual records in the ENC Update
Refer to the ENC Product Specification of S-57 for details on how the sequencenumbers are encoded in the ENCUpdate.
(d) Consistency Check. The mariner should be warned of any previous ENC Updateswhich have not been successfully applied.
(e) Geographic Applicability. ENC Updates not relating to a cell within the set of ENCsin the ECDIS may be discarded.
19
(f) Summary Report. A summary report for each of the Issuing Authority’s OfficialUpdate Files should be given after completion of receipt containing at least:
.1 identification of Issuing Authority;
.2 update numbers of the Update Files;
.3 Cell Identifiers of cells affected;
.4 Edition Number and date of cell involved;
.5 number of updates in the affected cells.
(g) Review of ENC Updates. It should be possible for the mariner to review the updatesapplied through displaying the SENC contents with the updates highlighted.
(h) Modification of Updates. Rejection or amendment of an update by the mariner shallbe achieved by the manual update method. The questionable update should be notedas an anomaly in the Log File [See 3.4.1 (h)].
(i) Formatted Non-integrated Updates, for example a temporary military exercise area,will be processed as manual updates.
3.4.3 Manual Update
(a) Keying and Symbology. The ECDIS should enable manual entry of updates for non-integrated presentation on the display. A capacity should exist to enable the marinerto:
.1 enter the update so it can be displayed as described in S-52 App.2.
.2 ensure all update text information relevant to the new condition and to the sourceof the update, as entered by the mariner, is recorded by the system for display ondemand.
(b) Indications and Alarms. The ECDIS should be capable of sensing indications andalarms related to non-integrated (manual) updates, just as it does for integrated ENCUpdates.
(c) Presentation. Manual updates shall be displayed as described in S-52,Appendix 2/2.3.4.
(d) Text. It should be possible to enter text into the ECDIS.
(e) Archiving of Manual Updates. It should be possible to remove from the display anymanual update. The removed update should be retained in the ECDIS for futurereview until commencement of the next voyage, but will not be otherwise displayed.
20
3.5 ECDIS Users
3.5.1 General
(a) Responsibility. As they are for the paper nautical charts, mariners are responsible formaintaining an up-to-date SENC.
(b) Legal Updates. Only official ENC Updates, i.e. those provided in digital format bythe Issuing Authority responsible for the ENC carried by the vessel, shall be integratedinto the SENC. All other updates or other navigation safety information should beentered manually. This additional information could come from Notice to Mariners,local Notice of Mariners, radio navigational warnings, mariner’s notes, etc.
(c) Status of Manual Updates. Manual updates shall be considered as interim measuresonly, and should be replaced at the earliest opportunity with ENC Updates from theIssuing Authority.
__________
A.1
ANNEX A - DEFINITIONS AND ACRONYMS
Automatic Update Either the Semi-Automatic or the Fully Automatic (see definitions) means ofupdating the ENC/SENC.
Cell Identifier Unique number assigned to each individual cell.
CCIR International Radio Consultative Committee.
CHRIS Committee on Hydrographic Requirements for Information Systems.
Corrupted Data Any change in data introduced during, and as a result of, its transmission.
ECDB The master data base for Electronic navigational Chart Data (ENCD), held indigital form by the national hydrographic authority, containing chartinformation and other nautical and hydrographic information.
ECDIS Electronic Chart Display and Information System means a navigationinformation system which with adequate back-up arrangements can beaccepted as complying with the up-to-date chart required by regulation V/20of the 1974 SOLAS Convention, by displaying selected information from asystem electronic navigational chart (SENC) with positional information fromnavigation sensors to assist the mariner in route planning and routemonitoring, and if required display additional navigation-related information.
EGC Enhanced Group Call - A global automatic service by INMARSAT foraddressing commercial messages (FleetNET) or marine safety information(MSI) (SafetyNET) to groups of ships or all vessels in both fixed and variablegeographical areas. Data transmission is based on INMARSAT-C and takesplace at an effective transmission rate of 600 bit/s.
ENC Electronic Navigational Chart means the database, standardized as to content,structure and format, issued for use with ECDIS on the authority ofgovernment authorized hydrographic offices. The ENC contains all the chartinformation necessary for safe navigation and may contain supplementaryinformation in addition to that contained in the paper chart (e.g. sailingdirections) which may be considered necessary for safe navigation.
ENCD Electronic Navigational Chart Data - The national data for an Electronicnavigational Chart (ENC) in a format acceptable to an ENC Coordinator.
ENCDB Electronic Navigational Chart Data Base -The master data base for productionand maintenance of the ENC, compiled from national ENC data (ENCD).

A.2
Fully Automatic The application of corrections to ENC data in the SENC in a fully Updating integrated state, without human intervention at the receiving end.
GMDSS Global Maritime Distress and Safety System. The communication service, co-ordinated worldwide, comprising functions which include among others, the:
- dissemination of marine safety information: broadcast of navigationaland meteorological warnings, Notices to mariners, and urgentinformation to shipping;
- general radio communications: those communications between shipstations and shore-based communication networks which concern themanagement of the ship and may have an impact on its safety, and
- bridge-to-bridge communications: inter-ship VHF radiotelephonecommunications for the purpose of assisting the safe movement of theship.
HO Hydrographic Office.
IHO International Hydrographic Organization.
IMO International Maritime Organization.
IMO PS International Maritime Organization Performance Standard for ECDIS,Assembly Resolution A.817 (19).
INMARSAT International Mobile Satellite Organization.
Integrated Update A correction to the ENC data in the SENC which is fully integrated into theECDIS display and can be acted on by ECDIS software in the same manneras is the data from the basic ENC.
Issuing Authority The official agency which issues the ENC and ENC updates. Its identity willdepend on the organizational structure adopted for ECDIS support.
Local Updates A generic term to indicate all update information other than official updates,regardless of source; for application as a manual update only.
MSI Maritime Safety Information - Navigational and meteorological warnings,Notice to Mariners, meteorological forecasts, and other urgent safetymessages.
NAVAREA A geographical sea area established for the purpose of co-ordinating thetransmission of long range Radio Navigational Warnings.
NAVINFONET Navigational Information Network - A US (NIMA) automated service forproviding Notice to mariners and other safety information via digital link atuser request.
A.3
NAVTEX Narrow-band direct-printing telegraphy system for transmission of navigationaland meteorological warnings and urgent information to ships.
NBDP Narrow Band Direct Printing.
NCS Network Coordination Station, an INMARSAT Coast Earth Station (CES)configured to process messages in the EGC System.
NON-Integrated Updates All correction information other than Official Updates to be applied only bymanual update methods in a manner that does not alter the ENC content in theSENC or on the display.
NTM Notice to Mariners - A periodical or casual notice issued by hydrographicoffices, or other competent authorities, regarding changes in aids tonavigation, dangers to navigation, important new soundings, and, in general,all such information as affects nautical charts, sailing directions, light lists andother nautical publications.
Official Updates Updates provided in digital format by the Issuing Authority of the ENC beingcorrected, for integration with the ENC data in the SENC.
RENC Regional ENC Coordinating Centre.
SafetyNET INMARSAT Broadcast Service for MSI - A service provided throughINMARSAT’S EGC system which will be used by Administrations for thepromulgation of Maritime Safety Information, such as NAVAREA and stormwarnings, Notice to Mariners, shore-to-shore distress alerts and routineweather forecasts to the high seas and those coastal waters not served byNAVTEX. IHO proposes to include promulgation of electronic chartcorrections as well.
Semi-Automatic The application of corrections to ENC data in the SENC Updating in a fullyintegrated state, by hard media or telecommunications transfer in a mannerwhich requires human intervention at the ECDIS interface.
SENC System Electronic Navigational Chart means a database resulting from thetransformation of the ENC by ECDIS for appropriate use, updates to the ENCby appropriate means and other data added by the mariner. It is this databasethat is actually accessed by ECDIS for the display generation and othernavigational functions, and is the equivalent to an up-to-date paper chart. TheSENC may also contain information from other sources.
SES INMARSAT Ship Earth Station.
SOLAS Convention on Safety of Life at Sea.
Update Storage An area on a physical storage device in the ECDIS where the ENC Updatesare kept separately from the ENC.

A.4
Update Set The collection of corrections to ENC data promulgated together by an IssuingAuthority on a schedule basis. Equivalent to the periodic set of Notice toMariners issued for the correction of paper charts and nautical publications.
WEND Worldwide Electronic Navigational Chart Database.
WMO World Meteorological Organization.
WWNWS World Wide Navigational Warning Service - A coordinated global service forthe promulgation by radio of information on hazards to navigation whichmight endanger international shipping.
__________

B.1
ANNEX B - CURRENT UPDATING PRACTICE FOR PAPER CHARTS
1. NOTICE TO MARINERS
1.1 Traditional services provided by a National Hydrographic Authority include a routine systemfor the update of all conventional charts on regular sale or supply to users. Certain chartproducing nations produce a global product; those countries with smaller portfolios cover onlytheir areas of interest and responsibility.
1.2 Generically, these small corrections have been termed ’Notice to Mariners’. Normally they arecollated on a weekly basis and mailed, through a series of agencies or directly, to the customer. Some authorities, however, also produce such Notices on a daily basis to spread out the loadof the bulk stock chart correction within the office and at major sales agencies, and to expeditethe information to other chart producing authorities.
1.3 The weekly edition of Notice to Mariners may contain several independent sections, viz:
(a) General explanatory notes (a standard item) and current index;
(b) Chart correcting notices;
(c) Notices announcing the publication of new charts, new editions, cancellation ofexisting charts and consequential effects on remaining charts;
(d) Notices affecting the total range of an HO’s publications with regard to:
.1 content and change;
.2 supersession;
.3 recapitulatory listing of NAVAREA warnings in force for a particular area andadjacent areas. In addition, an edited listing of important messages for theremaining NAVAREAs worldwide may be included;
.4 corrections to List of Lights;
.5 corrections to Sailing Directions; and
.6 corrections to List of Radio Signals.
1.4 An individual Notice must be framed in such a way that it provides clear, concise andunambiguous instructions to the mariner for the correction of his copy of the chart.
1.5 As the selection of material for publication of an individual notice is governed only byconsiderations of safety of navigation, it follows that any collection of notices will interest allclasses of vessels from small to large.
B.2
1.6 In addition to the conventional printed paper Weekly Edition published by NationalHydrographic Authorities, certain supplementary services such as the United States’Navigation Information Network (NAVINFONET) exist. NAVINFONET provides accessby digital data link via the telephone system to the data used to print the weekly Notice toMariners, in-force Broadcast Warnings, corrections to Light Lists, etc. Although digital, thedata can only be printed and is therefore equivalent to, but more immediately accessible than,the conventional means of obtaining this information. NAVINFONET can be accessed bytelephone modem and therefore by ships at sea via telephone link using INMARSAT-A, andis available to all.
1.7 It is the mariners’ responsibility to insert an individual Notice correctly on his chart. He isadvised to adopt a standard format for symbology and to record the presence of a change onboth his chart and his folio log.
1.8 To aid this procedure, each Notice is identified uniquely by a number which, after thecorrection is made, is added to the correctional block of the chart to provide a historical record. Notices are valid only until they are superseded by a New Edition or New Chart of the areaconcerned. The mariner is also advised as to the source of the correctional data.
1.9 As an aid to plotting, a tracing showing the correction to be applied may be produced by theNational Hydrographic Authority. This is capable of being reproduced and distributed to chartusers to aid the process of hand correcting. In some agencies the correctional load to aparticular chart can be quite high if notices held are above the norm and the individualcorrection is complex (i.e. the insertion of a lengthy submarine cable, or the alteration of amulti-sectored light or routeing measure).
1.10 The time comes when material is at hand whose significance demands action by Notice toMariners but which, by its very length or complexity, will overwhelm and confuse theindividual chart corrector. In such circumstances one of two methods of approach can bechosen by the National Hydrographic Authority. Firstly, the material could be incorporatedinto a new edition of the chart or, secondly, it could be promulgated as a chartlet (block orpatch) to be affixed physically to the current edition of the chart.
1.11 Such chartlets bear an individual Notice number, have their limits chosen carefully withrespect to fitting points, and are chosen to be of the minimum size necessary to encompass thenew material properly. They are perforce expensive to produce, require special printing andcollating techniques and, by virtue of being distributed together with all other notices, havea large degree of redundancy.
1.12 In addition to chart correcting notices, mariners are advised of Temporary or Preliminarymatters affecting their charts by a series of printed ’T&P’ Notices. These notices are designedto be of short term duration, typically under two years. An updating list of effective T&PNotices may be printed monthly and incorporated in totality in Annual Notices. The marineris advised to mark on his chart the existence of such a notice and to keep readily available acorrected file of all notices in force.

B.3
1.13 Local harbor authorities may issue Notice to Mariners in a local series. These changes shouldbe noted by the mariner who is using the area and maintained on file. Such information doesnot constitute a permanent change to a particular chart until such time as it is promulgated bythe National Authority with responsibility for that chart.
1.14 The criteria for updating the Electronic Chart will be the same as that explicit above whichgoverns the updating of the paper chart. Only the procedures will change. The updatingservice must take full advantage of the capabilities of digital data transfer modes and of digitaldata manipulation to ensure a fully adequate and safe ECDIS.
2. RADIO NAVIGATIONAL WARNINGS
2.1 Radio Navigational Warnings provide early warning of navigational hazards.
2.2 Such warnings are normally transient and of short duration or speak of matters not relevantto the chart, such as an unwieldy tow, and thereby do not warrant chart correcting action. Those that do contain information of such importance as to warrant notice action, i.e. a newlysunken wreck in shallow waters, will remain in force and be broadcast until consequentialchart correction action (i.e., issuance and distribution of a Notice to Mariners) can be taken.This may mean an individual warning message will remain in force for up to 6 weeks. Themariner is expected to take note of these warnings and review them when he is approachingtheir geographic area of application.
2.3 The IMO/IHO World Wide Navigational Warning Service (WWNWS) exists to:
.1 collect, exchange and collate navigational safety information;
.2 broadcast messages in a way that can be received and understood by all mariners; and
.3 control the huge amount of raw information so that the mariner is not overloaded.
2.4 To achieve this, 3 types of Radio Navigational Warnings have been established, each designedto serve the needs of the mariner in a particular location by exploiting the characteristics ofthe radio networks he will be using. They are:
(a) The NAVAREA Warnings Service which broadcasts warnings concerning routeingand passage along major shipping lanes to ships on the high seas by radio telegraphyat HF worldwide. In some NAVAREAs duplicate broadcasts by HF radio teletype orat MF, or by SafetyNET EGC, are available as well. Sixteen designated areacoordinators manage such broadcasts.
B.4
(b) The second level of warnings, and perhaps the most prolific, are Coastal warnings. These are often the most important warnings, and have traditionally been broadcast using voice communications at both MF and VHF. These warnings give short termnotice of generally transient hazards, such as lights temporarily extinguished, ofinterest only in the vicinity of the transmitter. Currently, a number of coastal warningsare also broadcast as NAVAREA warnings. With the implementation under GMDSSof mandatory carriage of a NAVTEX receiver by convention ships in August 1993,however, in areas of NAVTEX coverage only coastal warnings of major importance,such as those which might cause a mariner to amend his planned track substantially,are also disseminated by transmission as a NAVAREA warning.
(c) The final, lower level of radio warning is the Local warning. It may be issued by PortAuthorities and sometimes by local Coast Guards, for broadcast usually on VHF voiceand only in the national language.
3. THE GLOBAL MARITIME DISTRESS AND SAFETY SYSTEM (GMDSS)
3.1 The radio navigational warning is the first of the three basic information categories to achievea measure of international coordination and standardization. The total package of MaritimeSafety Information (MSI) requires the addition of meteorological broadcasts and search andrescue information, and also includes Notice to Mariners.
3.2 GMDSS has been developed by IMO (with IHO, WMO, INMARSAT and others) to upgradeexisting worldwide distress and safety communications by the mid-1990’s.
The main purpose of GMDSS is to support distress notification and search and rescueoperations. GMDSS also provides for urgency and safety communications and for thedissemination of maritime safety information including Notice to Mariners, and navigationaland meteorological warnings. GMDSS will merge and unify the existing land based MSIdissemination systems with an upgraded INMARSAT service.
3.3 IMO initiated a study of satellite communications systems in 1972 which led to the formationof the International Maritime (now «Mobile») Satellite Organization (INMARSAT) in 1979. The INMARSAT system consists of four geostationary satellites covering the Atlantic, Indianand Pacific Oceans, giving comprehensive coverage worldwide with the exclusion only of thePolar Regions. Satellites link with terrestrial telecommunications stations known as CoastEarth Stations (CES) located around the world. The INMARSAT shipboard installation isknown as a Ship Earth Station (SES) and the most prevalent existing equipment is designatedINMARSAT-A. INMARSAT-A supports voice telephone and data telex services,teleprinters, video display units, fax machines and data transmission equipment. To useINMARSAT-A the vessel must be fitted with a gyro stabilized one meter diameter dishantenna. However, slower and cheaper INMARSAT SES equipment has recently becomeavailable. It supports, amongst other things, data transmission for telex at a 600 bit/sec rateusing a small omnidirectional antenna. Class II, the most common configuration, and ClassIII INMARSAT-C receivers support Enhanced Group Call (EGC), a global automated servicecapable of addressing commercial messages (FleetNET) or MSI (SafetyNET) to groups ofships or all vessels in both fixed and variable geographic areas. CES which are speciallyequipped to handle messages in the EGC system are designated Network CoordinatingStations (NCS).
B.5
3.4 Under the GMDSS, the present day NAVAREA radiotelegraphy service will be ineffectiveand is being replaced by a satellite broadcast service using INMARSAT’s Enhanced GroupCall (EGC) SafetyNET facilities. NAVAREA warnings traffic volume will be greatly reducedby the worldwide implementation of NAVTEX Broadcast Services (see para. 3.6 below).
3.5 CCIR has found that correction information to ships at sea may be communicated byINMARSAT-A or-C(EGC), or by VHF. (See CCIR Recommendation 826.)
3.6 The NAVTEX Service, now nearly fully established worldwide, broadcasts warnings in thearea up to at least 200 miles offshore on a time share basis at 518 kHz to a dedicated receiveron board ship. Because most warnings pertain to coastal areas and the NAVTEXtransmissions are frequent, many warnings which were required to be promulgated throughthe NAVAREA service are now being broadcast only by NAVTEX.
3.7 It is again emphasized that the text of the Notice to Mariners and Radio Warnings is writtento be clear, concise and unambiguous to the mariner reading the text. However, utilization ofthe correction information by ECDIS makes different demands on its structure; thereforemessages prepared for the automated update of the SENC or its display will be entirelydifferent.
__________

B.6
Page intentionally left blank

C.1
ANNEX C - ESTIMATE OF DATA VOLUME
1. A rough estimation of the data volume for automatically updating the SENC has been carriedout based on an evaluation of the Notice to Mariners (NtM) by Germany’s HydrographicAuthority, the Bundesamt für Seeschiffahrt und Hydrographie (BSH), with the objective ofestimating the data volume to be transmitted by slow satellite broadcast (INMARSAT C-EGC)of only that information which is considered necessary for safe navigation.
2. BSH evaluation of NtM
(a) The BSH evaluation rested on the following assumptions:
.1 only the needs of the larger vessels (Draft ≥ 5m) have been considered(approximately 70% of the total NtM chart correction information publishedapplies)*;
.2 if any corrections affected other objects contained in the charts (e.g. light sectors),these have been taken into account as additional (indirect) corrections, if theywere deemed necessary for safe navigation; (this accounts for an additional 10%corrections);
.3 corrections were taken into account only once regardless of the number of chartsaffected, because of the anticipated efficiency in scheming the ENC.
(b) The evaluation was carried out by mariners of the BSH who are in charge ofpublishing the German NtM.
(c) The evaluation covered only the BSH sea area 20 (European North Ocean includingNorth Sea), shown in Fig. C-1, an area, however, which is known to be heavilyaffected by chart updates. Twenty weeks of consecutive NtM were processed for thisarea. The area was considered representative of the nine such areas which encompassthe oceans of the world.
(d) The investigation resulted in a table containing the frequency of insertions, deletionsand additions for 18 distinct types of chart information, involving 1127 correctionsaffecting 1255 geographical positions (see Table C-1). For items requiring attributes,the average number of those attributes has been determined. Line features (such asdepth lines, cables, etc.) were estimated to contain 10 positions on average.
_____________________* In the event ships of all drafts were to be served, the total data volume would increase to 143% of thetotal noted for only the larger vessels.
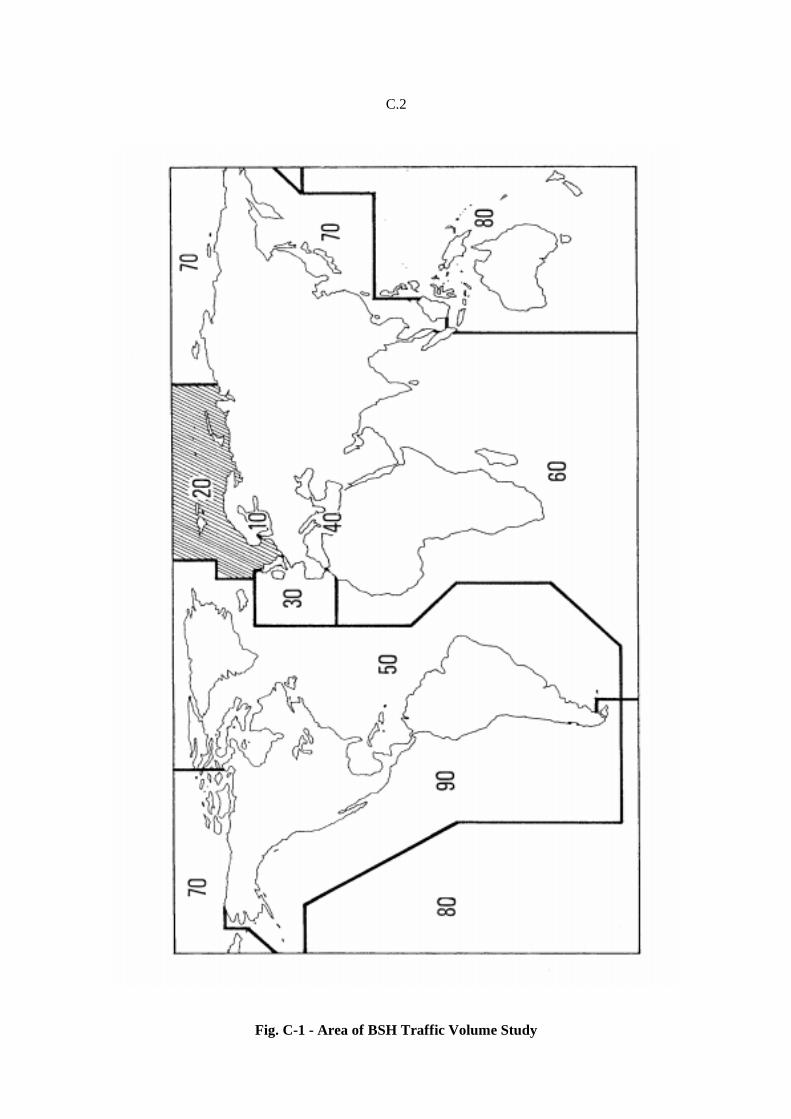
C.2
Fig. C-1 - Area of BSH Traffic Volume Study
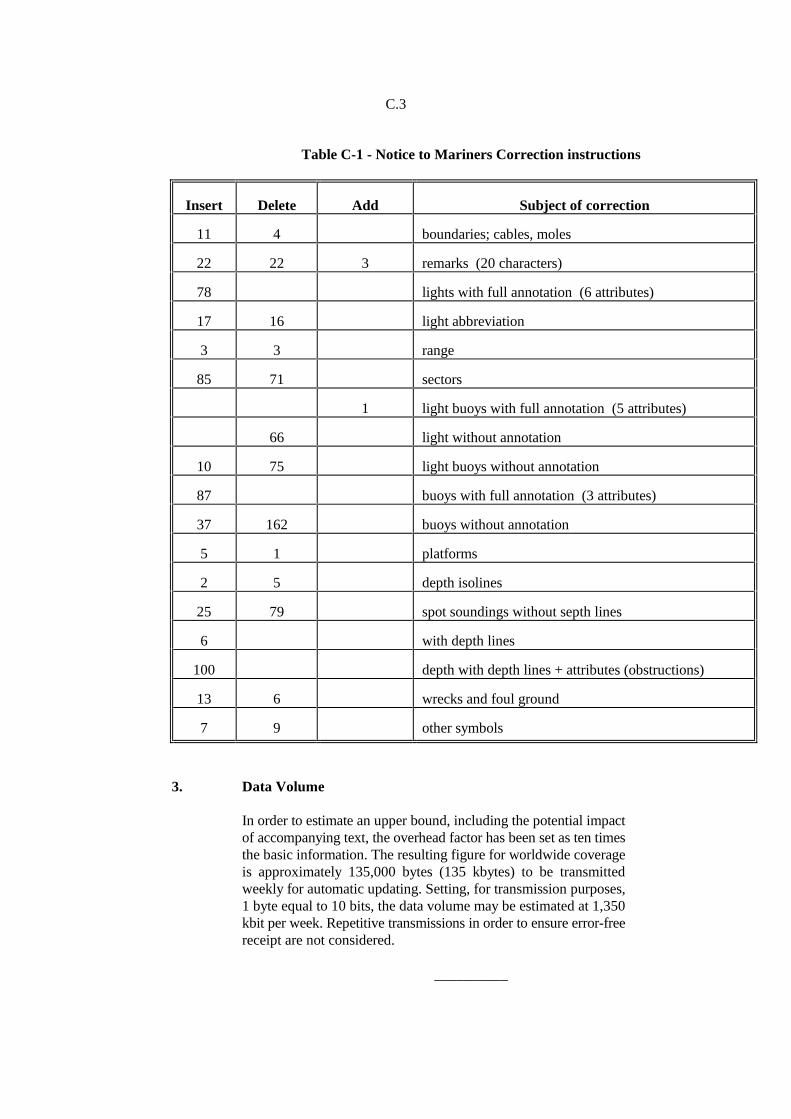
C.3
Table C-1 - Notice to Mariners Correction instructions
Insert Delete Add Subject of correction
11 4 boundaries; cables, moles
22 22 3 remarks (20 characters)
78 lights with full annotation (6 attributes)
17 16 light abbreviation
3 3 range
85 71 sectors
1 light buoys with full annotation (5 attributes)
66 light without annotation
10 75 light buoys without annotation
87 buoys with full annotation (3 attributes)
37 162 buoys without annotation
5 1 platforms
2 5 depth isolines
25 79 spot soundings without septh lines
6 with depth lines
100 depth with depth lines + attributes (obstructions)
13 6 wrecks and foul ground
7 9 other symbols
3. Data Volume
In order to estimate an upper bound, including the potential impactof accompanying text, the overhead factor has been set as ten timesthe basic information. The resulting figure for worldwide coverageis approximately 135,000 bytes (135 kbytes) to be transmittedweekly for automatic updating. Setting, for transmission purposes,1 byte equal to 10 bits, the data volume may be estimated at 1,350kbit per week. Repetitive transmissions in order to ensure error-freereceipt are not considered.
__________

C.4
Page intentionally left blank

C.5
INTERNATIONAL HYDROGRAPHIC ORGANIZATION
COLOUR & SYMBOL SPECIFICATIONS FOR ECDIS
Edition 4.3, January 2008
Special Publication No. 52 APPENDIX 2
published by the
International Hydrographic Bureau MONACO
S-52 Appendix 2

INTERNATIONAL HYDROGRAPHIC ORGANIZATION
COLOUR & SYMBOL SPECIFICATIONS FOR ECDIS
Edition 4.3, January 2008
Special Publication No. 52 APPENDIX 2
published by the International Hydrographic Bureau
4 quai Antoine Ier B.P. 445 - MC 98011 MONACO Cedex
Principauté de Monaco Telefax: (377) 93.10.81.40
E-mail: [email protected] Web: www.iho.int


i
S-52 App.2 e4.3 January 2008
CHANGE CONTROL HISTORY The history of the previous changes to the Colours & Symbols Specifications and the Presenta-tion Library is as follows:
Notes: MD stands for IHO Maintenance Document IA stands for Immediate Amendment DA stands for Deferred Amendment 1. Colours & Symbols Specifications (C&SS - S-52 Appendix 2)
• Edition 4.0 (July 1997) + MD1 IA i01 --> Edition 4.1 (January 1999)
• Edition 4.1 + MD2 DA d02 + MD4 DA d6 --> Edition 4.2 (2004)
• Edition 4.2 + MD5 DA d7 Edition 4.3 (January 2008)
2. Presentation Library (PresLib - Annex A to S-52 Appendix 2)
• Edition 3.0 (July 1997) + MD1 IA i01 --> Edition 3.1 (January 1999)
• Edition 3.1 + MD 3 IA i04 --> Edition 3.2 (May 2000)
• Edition 3.2 + MD2 DA d02 + MD3 DA d05 + MD4 DA d6 --> Edition 3.3 (2004)
• Edition 3.3 + MD5 IA i5 + MD5 DA d7 + MD6 IA i6 Edition 3.4 (2008)
• Digital versions:
- PRSLIB03.dai (July 1997), - PSLB03_1.dai (December 1998), - PSLB03_2.dai (May 2000), - PSLB03_3.dai (March 2004), - PSLB03_4.dai (January 2008).
• Temporary digital files: PSTY03_0.dai (June 1999), PSTY3_2b.dai (October 2001) (see
amendment d05.cl.005) • Paper based description of symbols:
- Addendum to Part I, Users’ Manual (2003) - Addendum to Part I, Users’ Manual (2007) - Addendum to Part I, Users’ Manual (2008), Edition 3.4
Edition 4.2 of the C&SS and Edition 3.3 of the PresLib, issued in March 2004, brought all out-standing deferred amendments to Editions 4.1 of the C&SS (issued January 1999) and 3.2 of the PresLib (issued May 2000) into effect. Edition 4.3 of the C&SSS does not contain substantial changes compared to the preceding version with the exception of the reference to Edition 3.4 of the PresLib, which was triggered by the introduction of new objects, object attributes and attrib-ute values in S-57 Supplement No. 1 (Edition 3.1.1) issued in January 2007.

ii
S-52 App.2 e4.3 January 2008
The grace periods from the issuing date of a new edition after which changes are required to be included in an ECDIS are: - for new development one year - for new selling (already type-approved before date of issue) one year As an exceptional case, Edition 3.4 of the PresLib itself is to come into force in conjunction with the S-57 Supplement No. 1 by 1 January 2008 to meet IMO requirements for the depiction of Archipelagic Sea Lanes (ASL) and Particularly Sensitive Sea Areas. In addition, this issue of the PresLib reflects the consequences of the adoption of the revised ECDIS Performance Stan-dard by IMO in 2006 to the chart presentation. The revised ECDIS Performance Standards of IMO will come into force by 1 January 2009. However, the implementation of Edition 3.4 allows compliance with the changed requirements as far as chart presentation is concerned, in ad-vance of this date.

iii
S-52 App.2 e4.3 January 2008
TABLE OF CONTENTS page
1 INTRODUCTION......................................................................................................... 1 1.1 Aims and Background ................................................................................................. 1 1.2 Structure of the Specifications .................................................................................... 2 2 CONSIDERATIONS; ORGANISING THE DISPLAY................................................ 10 2.1 General Considerations ............................................................................................ 10 2.2 Operational Considerations....................................................................................... 12 2.3 Organising the Information for Display...................................................................... 15 3.1 General ..................................................................................................................... 21 3.2 New Symbols for ECDIS ........................................................................................... 26 3.3 Existing Chart Symbols ............................................................................................. 33 3.4 Text, Diagrams etc. ................................................................................................... 33 4. SPECIFICATIONS FOR COLOURS ........................................................................ 35 4.1 General ..................................................................................................................... 35 5. SPECIFICATIONS FOR THE DISPLAY SCREEN................................................... 41 5.1 Requirements of S-52 ............................................................................................... 41 5.2 Additional Requir ements of S-52 Appendix 2 (These specifications)....................... 41 Notes: 1) Throughout these specifications, italics are used to distinguish discussion or recommenda-
tions from the specifications. The specifications are in plain type. 2) Quotations from these specifications may be used in the manufacturer’s manuals. The
source should be acknowledged.
__________

iv
S-52 App.2 e4.3 January 2008
Page intentionally left blank

1
S-52 App.2 e4.3 January 2008
1 INTRODUCTION 1.1 Aims and Background 1.1.1 Aims
These Colour and Symbol Standards are intended to contribute to the safe operation of ECDIS by:
- ensuring the display is clear and unambiguous,
- ensuring that there is no uncertainty over the meaning of colours and symbols on
the display,
- establishing an accepted pattern for ECDIS presentation that becomes familiar to mariners and so can be recognized instantly without confusion.
1.1.2 Definitions
ECDIS terminology used in these standards is defined in the IHO "ECDIS Glossary", S-52 Appendix 3.
1.1.3 Background
In November 1988, the IHO Committee on ECDIS set up a Colours & Symbols Work-ing Group (C&SWG) to develop specifications and guidelines for chart symbol and colour definition, for evaluation by hydrographic offices, ECDIS users, and manufac-turers. In January 1989, the Safety of Navigation sub-committee of the IMO Maritime Safety Committee noted the need to define symbols and colours for both chart and navigation purposes, and invited CIRM and the IHO to make detailed technical pro-posals. Work on ECDIS display design had already started, exemplified by the Canadian E.C.Testbed on the Norwegian "North Sea Project" in 1988. The IHO C&SWG made its first report in September 1989, based on a study for the Netherlands H.O. by the TNO Perception Institute, and a review by the DCIEM Perception Institute, Toronto. The initial performance specifications were prepared in June 1990. The development accelerated in March 1992 with a seagoing workshop onboard the Hamburg - Harwich ferry "Hamburg" involving mariners, H.O.s, and manufacturers, using the German SUSAN EC Testbed. Following this Seven Cs GmbH, of Hamburg, developed first a discussion sample and then the full digital Provisional Presentation Library, under contract to Canada and the USA, leading to the development of the Presentation Library over the next two years, and culminating in the issue of the first operational editions after a meeting of C&SWG onboard the Helsinki-Travemunde ferry "Finnjet" in November 1994. Meanwhile, more R&D in colours and symbols was carried out in Canada, and Australia provided support for completing the Presentation Library (PresLib) and the Mariner's Navigational Object catalogue which implements the IEC Navigational Symbols. From 1994 onwards considerable maintenance to adapt the C&S Specifications and PresLib to sea experience and changes in S-57 was carried out in Canada first by USL/CARIS of Fredericton and later by NDI of St. Johns, funded by the Canadian Hydrographic Service and Canadian Coast Guard. In 2001 the BSH, Hamburg, relieved the Canadian Hydrographic Service as the H.O. responsible for ECDIS Colours and Symbols. An early aim was to introduce a wholly
2
S-52 App.2 e4.3 January 2008
word-processed version of S-52 App.2, and this became the official version in 2004 in a new edition bringing all accumulated deferred amendments into effect. It included a detailed 'hard-copy' version of the symbol library developed at Seefahrt Hochschule Wismar, Fachbereich Seefahrt Warnemunde; in addition Furuno, Helsinki, provided the updated digital version for those who use it.
The version published in 2008 essentially concentrates on the adaptation of Annex A to the revised ECDIS Performance Standards of IMO and the introduction of new symbology for Particular Sensitive Sea Area, Archipelagic Sea Lanes and generic ob-jects which may be used for future cartographic requirements initiated by IMO.
1.1.4 References The following are authorities and references for these specifications: (1) IMO Performance Standards for ECDIS current edition (IMO PS); (2) IHO S-52 "Specifications for Chart Content and Display Aspects of ECDIS", cur-
rent edition, IHB, Monaco; (3) IHO S-57 "IHO Transfer Standard for Digital Hydrographic Data", current edition,
IHB, Monaco; (4) IHO INT 1 "Symbols, Abbreviations, Terms used on Charts". BSH, Hamburg,
current edition; (5) IEC 62288 “Presentation of navigation related information - General require-
ments, methods of test and required test results” , current edition; (6) IEC 61174 "ECDIS", Annex E "Navigational Symbols", current edition; (7) IHO S-32 Appendix 1: "Hydrographic Dictionary - Glossary of ECDIS-related
terms", current edition. Excerpts from the above references are quoted where they form a necessary part of these colours and symbols specifications. The ECDIS Mariner's Navigational Sym-bols are included in Part II of Annex A of these specifications for convenience of ref-erence, by courtesy of IEC, who are the authority for them. Part II itself will be super-seded by IEC standards 61174, 3rd edition, and 62288, 1st edition, when they are pub-lished.
1.2 Structure of the Specifications 1.2.1 Two main components The IHO "Colours & Symbols Specifications for ECDIS" (C&S Specs), which are Ap-
pendix 2 to IHO S-52 "Specifications for Chart Content and Display of ECDIS", spec-ify the method and means of presenting SENC information on the ECDIS display in a manner that meets the requirements of the IMO Performance Standards and of IHO S-52.
The C&S Specs consist of two main parts and two smaller components (see fig. 1):

3
S-52 App.2 e4.3 January 2008
.1 The Colour & Symbol Specifications (this document), which describes the re-quirements and methods in relatively general terms,
.2 Annex A, the Presentation Library (PresLib), which gives full details of colours,
symbols, symbolization instructions, etc. together with guidance on how an ENC should be displayed. The PresLib is issued as a word processed document and a digital version is also available with edition 3.3,
.3 Annex B, which specifies procedures for colour calibration of CRT displays and
the verification of that calibration, .4 Annex C, on the currently little-developed methods of colour maintenance.
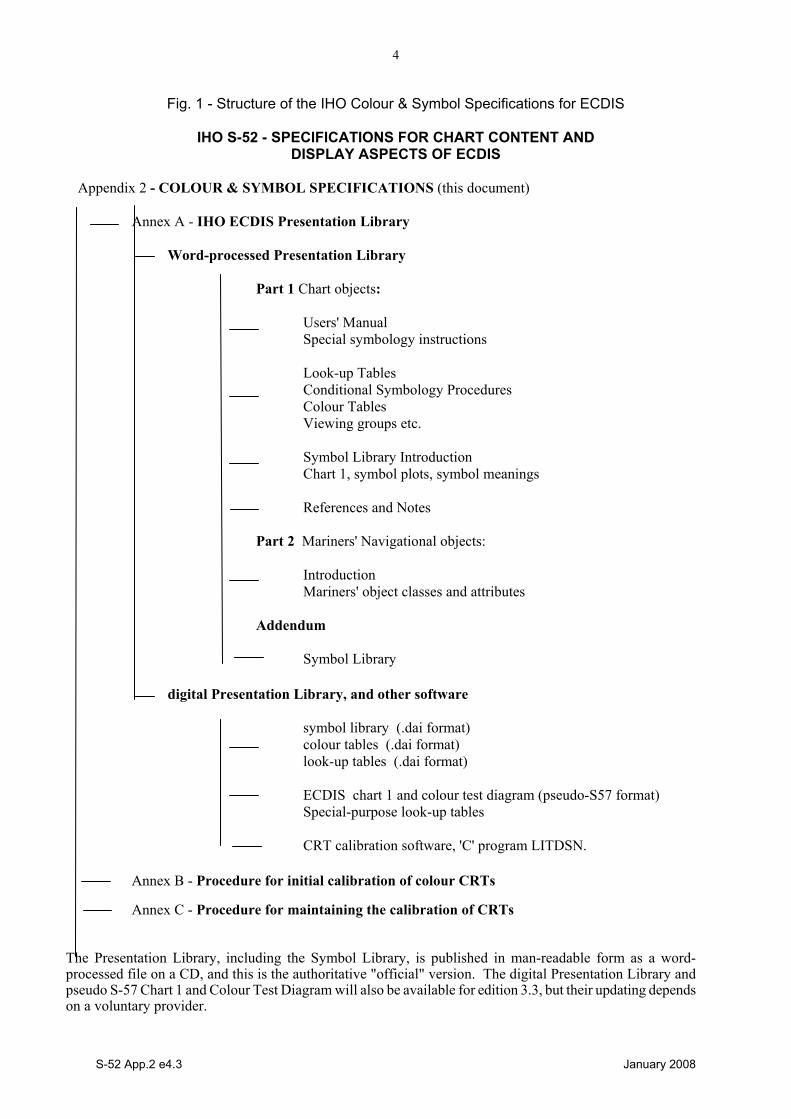
4
S-52 App.2 e4.3 January 2008
Fig. 1 - Structure of the IHO Colour & Symbol Specifications for ECDIS
IHO S-52 - SPECIFICATIONS FOR CHART CONTENT AND DISPLAY ASPECTS OF ECDIS
Appendix 2 - COLOUR & SYMBOL SPECIFICATIONS (this document)
Annex A - IHO ECDIS Presentation Library
Word-processed Presentation Library Part 1 Chart objects: Users' Manual Special symbology instructions Look-up Tables Conditional Symbology Procedures Colour Tables Viewing groups etc. Symbol Library Introduction Chart 1, symbol plots, symbol meanings References and Notes Part 2 Mariners' Navigational objects: Introduction Mariners' object classes and attributes Addendum Symbol Library
digital Presentation Library, and other software symbol library (.dai format) colour tables (.dai format) look-up tables (.dai format) ECDIS chart 1 and colour test diagram (pseudo-S57 format) Special-purpose look-up tables CRT calibration software, 'C' program LITDSN.
Annex B - Procedure for initial calibration of colour CRTs Annex C - Procedure for maintaining the calibration of CRTs
The Presentation Library, including the Symbol Library, is published in man-readable form as a word-processed file on a CD, and this is the authoritative "official" version. The digital Presentation Library and pseudo S-57 Chart 1 and Colour Test Diagram will also be available for edition 3.3, but their updating depends on a voluntary provider.

5
S-52 App.2 e4.3 January 2008
1.2.2 Presentation Library and its status The Presentation Library links every object class and attribute of the SENC, including the IEC Mariner's Navigational Objects, to the appropriate presentation on the ECDIS display. It carries all the details of these specifications, organised as shown on figure 1.
The Presentation Library, together with the Colour & Symbol Specifications, are sup-plied as a word-processed file on a CD which carries a subscription charge for each new edition to help to cover maintenance costs. This is the "Official Version" of the Presentation Library. A digital version in .dai format containing the Symbol Library, Colour Tables and Look-up Tables is provided as a manufacturer's option for edition 3.4, but may not be provided for succeeding editions.
Note that the Presentation Library contains some features and procedures which are not required in the IMO standard or the IHO or IEC specifications, such as four depth shades, etc. These are identified, and their use is optional.
References to the Presentation Library in this document refer to Part I unless other-wise stated.
1.2.3 Amending the Colour & Symbol Specifications and the Presentation Library 1.2.3.1 It is inevitable that amendments to the Colour & Symbol Specifications and the Pres-
entation Library will be required as further testing is done and as sea experience ac-cumulates.
ECDIS manufacturers should bear in mind that ECDIS is a new and developing aid to navigation. If it is to achieve its full potential it must be capable of changing to meet the mariner’s evolving requirements. The ECDIS should be designed with enough flexibility to adapt to necessary and significant further developments with future edi-tions of S-52 App.2.
In the life of each edition of S-52 App.2, amendments to the structure of the Presenta-tion Library which might affect the ECDIS software (for example changing the number of fields in the look-up tables, or changing the logic of a conditional symbology proce-dure) will be avoided as far as possible. However incremental changes to detail in the Colour & Symbol Specifications and the Presentation Library will be required.
In a major revision, changes in structure will be made if necessary.
Details of the amendment process are given in 1.2.4 below.
1.2.3.2 The current editions of S-52 App.2 remain in force until the issue of either: (a) an immediate correction which is essential for reasons of safety of navigation, or (b) a new edition which is identified as bringing outstanding deferred amendments
into force.
Either of these will result in a new edition of the Colour & Symbol Specifications and/or the Presentation library, whichever is affected.
1.2.3.3 Amendments will be distributed as described in section 1.2.4 for information or for
implementation. As noted above, immediate correction amendments may have to be issued under certain circumstances.

6
S-52 App.2 e4.3 January 2008
The manufacturer should implement any immediate corrections in all his ECDIS sys-tems fitted onboard ship, as soon as possible. When an amendment is implemented in a type-approved ECDIS, the manufacturer should inform the type approval authority in case re-testing may be required.
1.2.4 Amendment Procedures
1.2.4.1 Definitions
1.2.4.1.1 There are three classes of amendments: (i) "Clarification": an improvement to the wording of S-52 App.2 which does not re-
sult in any substantive change to the specifications. A substantive change is one which would result in a change in symbolization.
(ii) "Correction": a relatively specific change to S-52 App.2 to correct errors of com-
mission or omission; or to improve the ECDIS presentation in the light of practical experience; or to take into account changes in another specification; etc.
(iii) "Extension": a more general change to S-52 App.2 intended to improve the
ECDIS presentation, and approved by the Colours & Symbols Maintenance Working Group for inclusion in the next edition of S-52 App.2 which is identified as bringing outstanding deferred amendments into force. An extension has no immediate effect.
1.2.4.1.2 Amendments: An amendment may consist of more than one item, as follows:
- an immediate amendment will contain only immediate correction items,
- a deferred amendment may contain either: (a) clarifications and deferred corrections items, or
(b) extension items, which are distributed separately.
1.2.4.1.3 Immediate and deferred amendments: in exceptional cases, applying only to correc-tions and only where a correction affects safety of navigation, an immediate amend-ment will be made.
Normally, the implementation of amendments will be deferred until the next edition which is identified as bringing outstanding deferred amendments into force.
1.2.4.1.4 Edition number of the C&S Specs and the PresLib: The edition number of the C&S
Specs. or the PresLib. is of the form “mm.n” where “mm” is the edition number which changes for a major change in the specification, and “n” is an incremental change number which increases by one for every immediate amendment applied. The edition number does not change for a deferred amendment.
Major revisions of the C&S Specs and the PresLib will be identified by an increment
in the "mm" number, followed by a zero, i.e. 04.0, 05.0, etc. Smaller revisions involv-ing immediate amendments, and also revisions which are not major but bring out-standing deferred amendments into force, will be identified by an increment in the "n" number, e.g. 04.1, 04.2, etc.
It should be possible to identify the edition number in use on the ECDIS.
7
S-52 App.2 e4.3 January 2008
Edition numbers refer only to the Colour & Symbol Specifications and to the Presenta-tion Library. Edition numbers are used in the numbering of amendment items in order to point to the particular edition of the C&SS or PL to which that item should be ap-plied. For example amendment item no. “PL03.3.d7.co.2” should be applied to the Presentation Library edition 3.3.
1.2.4.1.5 Amendment item identifiers : Each item within an amendment is assigned a unique
identifier, with the following form "ssmm.n.aa.dd.nnn", where:
ss = Colour & Symbol Specifications (CS) or Presentation Library (PL), depending on which the amendment applies to,
mm.n = the edition number to which the amendment applies, aa. = deferred (d) or immediate (i) amendment followed by the sequential
number of the amendment, dd. = clarification (cl), correction (co) or extension (ex), n = sequential number of the item within the amendment.
For example, look at item no: "PL03.3.d7.co.2", reading from the last number group back to the first: "2" this is item 2 of the amendment,
"co" this item is a correction, "d7" it is a part of deferred amendment 7,
"PL03.3" it applies to PresLib edition 3.3 ( Note that:
i) the edition number of the PresLib would not advance after applying this deferred amendment.
ii) If this example had been an immediate amendment the item number would have been PL03.3.i7.co.2". In the case of an immediate amendment the edition num-ber of the PresLib would have automatically advanced to 3.4 once the amend-ment was applied.
iii) The next amendment would have been numbered "amendment 8" whether it was an immediate amendment or a deferred amendment. )
1.2.4.2 Distribution 1.2.4.2.1 Immediate corrections to both the Colour & Symbol Specifications and the Presenta-
tion Library will be posted on the Maintenance Bulletin Board on the IHO website www.iho.int . They will also be applied to the word processed file provided as an initial delivery of S-52 App2.
1.2.4.2.2 Clarifications and deferred corrections These deferred amendments will be posted
on the IHO Maintenance Bulletin Board.
All existing deferred amendments will be implemented in the next edition of S-52 App.2 which is identified as bringing them into force. However an ECDIS manufac-turer may implement a deferred amendment earlier if he wishes to do so, except when it is specifically stated that a particular amendment should not be implemented before the edition bringing deferred amendments into force is issued (in order to pre-serve uniformity in symbolising the ENC).
When an amendment is implemented in a type-approved ECDIS, the manufacturer should inform the type approval authority in case re-testing may be required.

8
S-52 App.2 e4.3 January 2008
1.2.4.2.3 Extensions are working documents, available from the IHB for test purposes on re-quest. A description of the extension will be put on the web site.
1.2.4.2.4 Before and after plots. Where appropriate, before and after plots will, whenever possi-
ble, accompany amendments that make a change in symbolization. 1.2.4.2.5 Change control history & list of current editions. Amendments will include a change
control history and a reference to the list of current editions on the IHO website.
1.2.5 Note on the Specifications as a whole:
The effective use of chart colours and symbols on the ECDIS display requires con-sideration of a variety of factors: purpose (e.g. route planning/route monitoring); bridge lighting conditions (e.g. day/night lighting); human factors (e.g. colour percep-tion, stress); interaction with "non-chart" information on the display (e.g. ship's tracks, navigator's notes, radar); interaction with other displays on the bridge (e.g. ARPA); ECDIS interactions (e.g. relation between ENC structure and display capability); technology (e.g. CRT calibration); and so on.
The working group has used good advice from ergonomic professionals and ECDIS manufacturers, and has taken advantage of the limited opportunities to test the stan-dards at sea. However the group is conscious that operational sea experience, adap-tations in the mode of use of ECDIS and technology developments will probably bring about the need for considerable modifications to the standards in the future.
These IHO Colour and Symbol Specifications are therefore designed to provide a ba-sis for the initial operational use of ECDIS.
Reports of experience with these specifications will be welcomed. They should be sent to: The Chairman, IHO C&SMWG, International Hydrographic Bureau, BP 445, MC 98011, Principality of Monaco. E-mail: [email protected].
1.2.6 Type Approval - Minor Deviations to the Presentation Library
It is acknowledged that the manufacturers of navigational equipment and software are in constant contact with ECDIS users. To allow for fast response to suggestions for improvement to the chart display, the IHO Presentation Library for ECDIS is designed to provide a framework and guideline for chart symbolization from which the ECDIS manufacturer can derive a customized Presentation Library. The following criteria shall serve as a guide for judging whether any symbolization on an ECDIS which is visibly different from the symbolization provided by the IHO Presentation Library and as demonstrated by the IHO Test Data Set print-outs is still compliant. The symboli-zation used:
1.) should be the same in general shape and size as the IHO version; 2.) should be clear and sharp so that there is no uncertainty over meaning; 3.) should be close enough to the IHO version to avoid ambiguity in meaning be-
tween that model and any other model of ECDIS; 4.) should use only the colours as specified in S-52 App.2; 5.) should comply with the various considerations of scientific design described in
S-52 App. 2; 6.) should comply with the priority of prominence on the display in proportion to
importance to safety of navigation which is built into the Presentation Library, and
7.) should avoid any increase in clutter.

9
S-52 App.2 e4.3 January 2008
Any symbolization which does not meet these criteria is not compliant.
The type-approval authority is strongly encouraged to contact the chairman of the IHO C&SMWG in any case of uncertainty over differences in symbolization, ideally attaching graphics to illustrate the situation. The chairman of the WG will give the reason for the particular symbolization on the Test Data Plots, and will comment on any perceived advantages or disadvantages of the manufacturer's version, with reasons.
Manufacturers, type-approval authorities, and above all mariners, are always en-couraged to contact the IHO over any improvements, criticisms, questions or comments that they may have about the ECDIS display, in order that the specifi-cations can be kept effective and up to date. Address informal notes to the techni-cal staff, care of the IHB member:
Chairman, IHO C&SMWG, International Hydrographic Bureau, MC98011,Monaco. Fax +377 9310 8140 or E-mail: [email protected].

10
S-52 App.2 e4.3 January 2008
2 CONSIDERATIONS; ORGANISING THE DISPLAY 2.1 General Considerations 2.1.1 Design considerations
The aim is to ensure that the ECDIS display is always clear and unambiguous. As an operational navigation display, there must be no doubt what the features shown are and what they mean. The basic principle of good display design is to keep the display simple and un-cluttered, and to use well-designed symbols and colours.
We have used a number of guidelines for designing this operational ship-handling dis play:
- Contrast is needed to carry information; this may be colour contrast or luminance
contrast, or contrast from differing linestyles or symbol shapes. All these inter-relate with each other,
- When planning colours, begin with the background colours, the area fills for
depth zones and land. Then work on the foreground lines and symbols, making sure they have good contrast with all their backgrounds,
- Use redundant coding for important features. For example the ship's planned
route is a prominent dark red, which shows well against both the white deep wa-ter of the daytime colour table and the black deep water at night, and it is also a thick dotted line, the only such line on the display,
- Design for the worst case; fit the rest in afterwards. For the ECDIS this means
setting up the display for bright sunlight, when all but the starkest contrast will disappear, and for night when so little luminance is tolerated that area colours are reduced to shades of dark grey (maximum luminance of an area colour is 1.3 cd/sq.m compared with 80 cd/sq. m. for bright sun) and only fine lines can be bright,
- Keep the software simple. For example, we do not change lineweights for differ-
ent colour tables as this would require a conditional symbology procedure. 2.1.2 The diversity and flexibility of ECDIS
The challenge presented by the versatility of ECDIS is illustrated below (NOTE: these are not intended as a statement of requirements): The diversity of information may include: - physical chart information, (e.g. coastline, depth contours, buoys), - traffic routeing; specified areas; cautions; etc., - supplementary HO information from light list , etc. - mariner's notes; additional local chart information; manufacturer's information, - chartwork such as planned route; electronic bearing lines and range rings; etc., - own ship's position and velocity vector; ship's head and rate of turn; past track , - fix accuracy, or position check from secondary positioning system, - possibly, shiphandling options, based on ship's characteristics, alphanumeric
navigation information (ship's latitude, longitude, heading, course, etc.), - information from radar and other sensors, - information from AIS
11
S-52 App.2 e4.3 January 2008
- navigational indications and alarms generated by ECDIS, - possibly, telemetered information from shore authorities, (traffic, real-time tides
etc.), - possibly, ice information, - reminders, (e.g. time to contact pilot station), - possibly, messages from other displays (e.g. alarm on engine room display). The flexibility of presentation may include: - displaying/removing various types of chart and non-chart information, - selecting standard chart display or a thinned out display, and full or simplified
symbols, - using cursor interrogation for further detail, - overlaying/removing radar video or radar target information (in order to: confirm
ship's positioning; aid radar interpretation; show the entire navigation situation on one screen),
- overlaying/removing various other sensor information, or information telemetered from shore,
- changing the scale or orientation of the display, - selecting true motion or relative motion, - changing screen layout with windowed displays, text information in the margins,
etc., - possibility of pull-down menus and other operator interaction devices being
alongside the operational navigation display and so interacting with it, - giving navigation and chart warnings such as "too close approach to safety con-
tour"; "about to enter prohibited area"; "overscale display"; "more detailed (larger scale) data available"; etc.,
- possibly, a diagrammatic representation of a computer evaluation of grounding danger,
- possibly, a diagrammatic representation of the immediate vicinity of the ship to aid in close quarters manoeuvering,
- other future developments. (Further presentation requirements and techniques appropriate to ECDIS are likely to be developed in future).
2.1.3 Colour discrimination on the display: perception effects and display calibration.
Probably no other display screen application is so demanding as that of ECDIS. Since colour is a prime means of distinguishing features, the maximum range of col-ours should be available. However the colours selected must be such that they can be clearly discriminated by a mariner with no more than adequate colour vision, and colour induction effects must be avoided (for example a small green object on a satu-rated blue background will tend to appear yellow).
Absolute accuracy in colour reproduction is not required but relative colour fidelity is important. To ensure clear contrast between colour-coded features the CRT screen should be calibrated before use, and this calibration should as far as possible be maintained while in service. If this is not done, lines, symbols, and area shades may become indistinct, and information may then be lost or become misleading. This prob-lem is discussed in section 4 and 5 and Annexes B and C. A similar requirement ap-plies to LCD and other types of display.

12
S-52 App.2 e4.3 January 2008
The ambient lighting on the bridge varies between the extremes of bright sunlight, which washes out information on the display, and night, when the light emitted by the display has to be low enough that it does not affect the mariner's night vision. The colour and symbol specifications have to be designed to meet these difficult require-ments rather than less demanding normal day conditions.
2.2 Operational Considerations 2.2.1 Similarity to the paper chart
Because much experience is embodied in the paper chart, and to avoid confusion in the extended period while paper and raster scanned as compared to S-57 coded digi-tal electronic charts co-exist, the two presentations should be similar wherever possi-ble. While recognising that the application of ECDIS extends beyond that of the paper chart, paper chart practice should be followed unless otherwise specified in these specifications.
However, because the ECDIS display uses emitted light, compared with reflected light for the paper chart, ECDIS must switch to a negative image of the chart at night, using a dark background in place of the white background of the paper chart, in order not to impair night vision.
In addition, studies and early experience indicate that the need for good visual com-munication between the ECDIS display and the user may require simplification and change of symbols traditionally used on paper charts. Some alternative display meth-ods are being introduced as options in the Presentation Library.
2.2.2 Distinguishing between features and between sources
It should be possible to distinguish clearly on the display between a very large num-ber of features. These are listed as classes in section 2.1; and in detail comprise, for example, different water depths, various types of buoys and beacons, chart lines compared with navigators lines, and so on. It should also be possible to distinguish between sources, for example between information from the official HO-ENC; hand-entered N to Ms; local information; and mariner's notes and manufacturer's additional information.
The means available for coding these distinctions are limited. They include:
- coloured areas, lines and symbols, - coded lines (e.g. dashed) and areas (e.g. , patterned), - symbols, - text labels (but these cause clutter), - cursor interrogation, - switching a class of information on/off either automatically or by hand, - splitting information into separate windows, - common sense interpretation (e.g.: a red buoy, a red arc indicating a light sector,
and a dotted red line indicating planned route, are unlikely to be confused, even though all are coloured red).
Because there are more demands for making distinctions than there are coding methods available, duplicate coding will sometimes be unavoidable, as in the above example.

13
S-52 App.2 e4.3 January 2008
Distinctions should be made logically and systematically, giving priority to features that have greater operational significance.
2.2.3 Route Planning / Route Monitoring: Look-ahead.
The IMO Performance Standards for ECDIS distinguish between the route planning and route monitoring modes of using ECDIS. It is expected that in route planning the display will be viewed, without urgency, from the normal screen viewing distance of about 70 cm., and so the display can contain considerable detail without causing con-fusion.
Experience up to now of route monitoring indicates that in that mode the display will be used for immediate decision-making, sometimes under stress, and that it may be viewed from a distance of several metres. The route monitoring display should there-fore be planned to present only the immediately relevant information, in a manner that ensures it can be taken in quickly, clearly and without ambiguity.
In particular, text is difficult to read and tends to cause clutter. It should be kept to a minimum on the route monitoring display.
If there is a delay in preparing data for the route monitoring display (e.g. due to a re-quest for scale change, or look-ahead to another area) the ECDIS should inform the mariner. The previous display should be maintained, and updated, until the new dis-play is ready for draw.
Because the display screen is smaller than the paper chart, the IMO PS specify that the ECDIS display should have the capacity for local as well as distant look-ahead. To provide this will be an important consideration in presentation design. While, for example, manufacturers may provide a smaller scale look-ahead display by window-ing, these Colour & Symbol Specifications must take into account the fact that impor-tant features such as lights, future waypoints, etc., may often lie out of sight off the screen.
2.2.4 Important features should always be clear and conspicuous
These specifications are designed to make important features (e.g.. own-ship symbol, own-ship safety contour, etc.) more conspicuous than minor features.
Ergonomic specialists point out that, to avoid ambiguity, important features, such as those in the IMO PS Display Base, should be redundantly coded. (For example the own-ship safety contour has a sharp change in the colour of the depth shade and a thick line; the planned route is red and is the only heavy dotted line on the display). This serves to improve the visibility of important features on the route monitoring dis-play, and it also helps to distinguish features in bright sun or at night.
Chart features should normally be written over the radar image. See section 2.3.2b for details.
2.2.5 Scale and range indicators
The "(indication of) scale and range" required as part of the Display Base by IMO PS Appendix 2 is intended to give the mariner an immediate appreciation of (a) how close to his ship are hazards seen on the display, and (b) how much time he has to decide on any necessary avoiding action. Two indicators should be provided:
14
S-52 App.2 e4.3 January 2008
- a one-mile scale bar for a large scale display and a ten-mile latitude scale for a small scale display (see section 3.2.3(9) for details). This indicates roughly how close display features are; the cursor or VRM should be used for exact range measurement,
- an emphasized six-minute marker on the course and speed made good vector
(see IEC symbol 3 and part 2 of the Presentation Library). This illustrates the time element.
2.2.6 Effect of bright sunlight, and the dark night display
It will not be possible to read the ECDIS display if the sun is shining directly onto it. Even diffused bright sunlight on the bridge tends to wash out the colours of the dis-play so that they tend to look grey. The "day" colour table has strong contrast to com-bat this effect. But it helps to shield the face of the screen. The face of the display screen acts as a mirror to white shirts, sometimes seriously obscuring the chart display. Wearing a black cotton (not synthetic) watch-coat will greatly improve viewing on a sunlit bridge.
At night several factors combine to reduce colour discrimination:
- the display must be darkened to a level at which it does not impair the mariner's
night vision, hence his ability to keep a look-out, - the ability of the human eye to distinguish colour is reduced at low light levels, - the display screen is less capable of discriminating between colours at low lev-
els. A dark colour may drop below the screen cut-off and become black.
Note that ships tend to arrive in port at 0800 and sail by 1700, to reduce port charges; thus the critical passage through the port approaches often occur at night.
The night colour tables are designed to overcome night viewing problems as far as possible, and some other measures are taken as well:
- important features are distinguished by redundant symbol/linestyle coding as well
as colour, (e.g. own-ship is a unique double circle , in heavy white at night), - if it happens that the entire night display area consists of only one depth zone,
the mariner will not be able to judge by absolute colour discrimination which of these depth zones the ship is in. A clearly visible "depth less than safety contour" pattern is provided to indicate shallow water (section 3.2.3(15)),
- the mariner should be advised to adjust the night display of a CRT display screen
by contrast control, not by brightness, which may shift dark colours below cut-off.
Use of a 0.9 ND optical filter over a relatively bright display is a better solution for night viewing than reducing the display brightness.
2.2.7 Location for the ECDIS display Experience in sea tests has shown that it is important to select an appropriate loca-tion for ECDIS. For example: - the navigator should be able to see the display clearly, and to reach the controls,
from his normal conning position,
15
S-52 App.2 e4.3 January 2008
- it is an advantage to locate radar and ECDIS side by side, - the face of the display should be shaded from direct sunlight, and the display
should not be located where the viewer may find the sun directly behind it.
2.2.8 Displaying text The power of ECDIS lies in conveying operational information quickly, clearly and comprehensively through a picture, a birds-eye view of the ship and her surround-ings. Text should be avoided on this graphical operational display unless it is abso-lutely necessary, because it conveys limited information and, since it has to be written large to be readable, causes confusing clutter. However some text may be unavoidable, both on the operational display (eg. buoy numbers if these are required for VTS reporting) or on a separate text display (eg. course to steer, heading; alarms; tidal information; user interaction to control the ECDIS, etc.). (See also sections 2.3.3c, 3.1.5 and 3.4, and section 7.1.3 of the Presentation Li-brary).
2.2.9 Flashing to draw attention The capability to flash a symbol should be used only rarely in very special cases. It should be used to draw attention rather than to simulate a real flashing object.
2.2.10 Operator control of information should be effective and simple In order to handle the diversity of information and flexibility of display options provided by ECDIS without confusion, the presentation of information must be designed care-fully. In particular, the operator interface should provide clear, simple control of the display such that there is no danger of confusion, or of failure to retrieve important chart information in a stressful situation. "Viewing Groups", as an optional way of giving the mariner control over the informa-tion on the display, are described in section 8.3.4.4 of the Presentation Library. The mariner should have full control over any automatically linked display changes, including the option to inhibit such changes. Examples of linked display changes in-clude changing the source of data when a larger scale becomes available, or display-ing lights automatically when the mariner selects the "Dusk" colour table.
There should be enough commonality between the user interfaces of the various makes of ECDIS that a pilot, or watch officer new to the ship, can use an unfamiliar type of ECDIS. However, over-strict standardisation will hamper development of an effective interface.
2.3 Organising the Information for Display 2.3.1a Displaying non-chart information
IMO PS section 1.6 states that ECDIS should enable the mariner to perform the chartwork at present performed on the paper chart and section 6.1 states that the SENC may contain information from other sources than the HO ENC. IHO S-52 re-quires that ECDIS distinguish between chart data and additional data from users (mariners) and manufacturers. The following colour and symbol usage for mariners
16
S-52 App.2 e4.3 January 2008
and manufacturers data is designed to implement this while ensuring the display re-mains clear and uncluttered.
Part 2 of Annex A "Presentation Library" describes "Mariner's Navigational Objects" for route planning and route monitoring chartwork, and for adding mariner's and manufacturer's information to the SENC. The descriptions are in the same format as chart objects, in order to avoid the ECDIS having to deal with two differently coded types of data. The colours, symbols, categories and display procedures that apply to all these objects are included in Part 1 of the Presentation Library, along with the pro-cedures for chart objects.
Mariners may alter the IMO categories for Mariner's Objects (but not for chart ob-jects). Note, however, that IMO PS 10.5.1 requires that own ship and selected planned route should always appear, and should therefore remain in Display Base.
Note that Mariner's Objects should be kept independent of chart data in the SENC, and that mariners' information does not need to be split into cells.
In referring to Mariner's Objects it is important to distinguish between:
"Add/Enter", "Revise" or "Delete" mariner's or manufacturer's information: this refers to the contents of the SENC, and:
"Display" or "Remove" the information: this refers to the ECDIS display. 2.3.1b Mariner's Information on the route monitoring display
In addition to the ability to enter manual chart corrections and to carry out route plan-ning and route monitoring chartwork, the mariner should be provided with the capabil-ity of adding at least the following symbols, lines and areas to the SENC, and should be able to revise or delete them:
.1 the caution (!) or information [i] symbol section 3.2.3 (6b), (6c)], used to call up a
note on the text display by cursor picking, .2 simple lines and areas with or without colour fill, set up for cursor picking to give
an explanatory note in the text display, .3 any of the chart symbols in the Presentation Library, .4 text notes.
The mariner should have full capability of adding chart information, such as his own observations, and route planning and route monitoring information. Non-ENC chart information added by the mariner should be in normal chart colours, identified as described in the Presentation Library section 8.7.2.
Other information added by the mariner should be distinguished by the colour orange (colour token NINFO) except for colour fill, which should use transparent yellow (col-our token ADINF). (Transparent orange tends to look magenta in colour over blue backgrounds).
Mariner's information should not overwrite ENC information.
The symbols and instructions for using the IEC "Mariners' Navigational Objects" are given in Part II of the Presentation Library.
17
S-52 App.2 e4.3 January 2008
2.3.1c Manufacturer’s Information on the route monitoring display .1 If the manufacturer should add non-chart information to the SENC, he should use
the following symbols, lines and areas:
(i) the circled “!” caution symbol SY(CHINFO11), or boxed “i” information symbol SY(CHINFO10), used to call up a note on the alphanumeric display by cursor picking,
(ii) simple lines, or areas without colour fill, set up for cursor picking to give an
explanatory note in the alphanumeric display (colour fill should not be used).
(iii) Non-chart information entered by the manufacturer should be distinguished
by the colour yellow (colour token ADINF). It should not overwrite HO ENC information.
.2 If the manufacturer should add non-HO (non- ENC) chart information to the
SENC it should be symbolised in the same way as HO chart information and dis-tinguished from HO chart information as described for the various cases below:
(i) Limited non-HO data is added to existing HO data to augment the chart in-
formation. Each object should be marked by the special identifiers de-scribed in the Presentation Library, section 8.7.2.
(ii) An area of non-HO data is located in waters for which HO chart data ex-
ists; it is superimposed on the HO data. In some cases the non-HO data may be more appropriate for the intended purpose, for example it may be more detailed.
In this situation it is at the mariner’s discretion whether to use the HO or the non-HO data.
If the mariner selects the non-HO data, the boundary of this data should be identified on the ECDIS display by the line LC(NONHODAT) and the warn-ing “Unofficial data displayed; refer to official RNC or paper chart” should be displayed.
Note that the LC(NONHODAT) is a “one-sided line”, and the boundary of the area of non-HO data must be drawn according to S-57 rules to ensure that the diagonal stroke of the line is on the non-HO data side of the line. More details are given in PresLib section 12 conditional symbology proce-dure DATCVR section2.1.
(iii) An area of non-HO data is located wholly outside the area covered by HO
data (although it may share a boundary with the HO data) but is shown on the same display as HO data. The non-HO data should be bounded by the line LC(NONHODAT) and the warning “Unofficial data displayed; refer to official RNC or paper chart.” should be displayed.
(iv) The entire display contains nothing but non-HO data. The warning “No offi-
cial data available; refer to official RNC or paper chart.” should be dis-played. In this case, special identifiers need not be used."

18
S-52 App.2 e4.3 January 2008
.3 The mariner should be able to remove all manufacturer's information if the need should arise.
2.3.1d Displaying the radar image
The radar image may be displayed by an opaque overlay or a transparent overlay, using colour tokens RADHI and RADLO. Further details are given in section 4.1.7.
2.3.2a Priority of information
The IMO PS divides SENC information into three categories that determine what data is to be on the display: Display Base (always present on the display); Standard Dis-play (the default display); and Other Information (displayed on demand). (IMO PS section 3 and Appendix 2). (See section 2.3.3a of these specifications).
IHO S-52 establishes 10 priority layers for the drawing sequence of the data on the display. This list is not intended to indicate a drawing sequence, but to specify that the information content of category n+1 must not obscure the information content of category n, or any higher category (i.e. n-1 etc.).
The look-up tables and conditional procedures of the Presentation Library assign a category, and a display priority (drawing sequence), to every object (object class-attribute combination) in the ENC. This satisfies the requirement of S-52 quoted im-mediately above.
2.3.2b Radar priority
The priority of HO chart data over radar is carried out by the single action "remove radar" control (IMO PS 6.3.5). When present, the radar data is always written over the eight opaque area fills (see 3.1.2). Chart line and point features should normally be written over the radar image, with some exceptions, as described in the "over-radar" field of the Presentation Library look-up table. But in order to meet the requirements of IMO PS 6.3.4 to adjust the ship's position, the ECDIS may incorporate the capabil-ity of changing the radar priority of the Presentation Library. Operation of this feature should be clearly indicated.
2.3.3a IMO categories
The IMO "Standard Display" provides a starting point. It is a list of objects that the mariner may either add further objects to, or remove objects (except Display Base) from, in deciding what is to be displayed. Note that as soon as any object on this list is removed from the display, or any object not on this list is added to the display, the display no longer shows the IMO "Standard Display".
The IMO "Display Base" is that part of the Standard Display that should never be re-moved. It is a list of basic objects which the IMO consider are required at all times, in all geographic areas and under all circumstances. Note that the IMO do not intend the Display Base to be sufficient for safe navigation on its own; therefore it should not be a display option to "Show Display Base" without any additions.
The IMO category "Other Information" contains every object in the SENC which is not classed as "Standard Display".

19
S-52 App.2 e4.3 January 2008
The mariner should be able to remove information selectively from "Standard Dis-play", except that he cannot remove any object of the "Display Base". And he should be able to add selectively to the Standard Display any items of the "Other" category.
Field 6 of the look-up table of the Presentation Library assigns the IMO category in detail to every object in the SENC, including Mariner's Navigational Objects. The mariner may override the category for mariner's objects, but not for chart objects.
2.3.3b Selecting objects for the route monitoring display
Section 3.5 of the IMO Performance Standard requires that "It should be easy to add or remove information from the ECDIS display". For example, the mariner might want to retain "caution areas" from the Standard Display (see Table 4 of this document) but remove the remaining thirteen areas, including such as protected areas (eg."game preserve"). Another example is that he might want to add soundings from "Other", but omit submarine cables (which cause serious clutter at certain ocean terminals).
As an aid to adding and removing information from the display, field 7 of the look-up table also assigns every feature in the SENC to a viewing set, and these sets are ar-ranged in groups of ten which are related to the lettered groups of INT 1 for the paper chart, a classification which is familiar to the mariner. The details are given in the Presentation Library section 8.3.4.4 and Table 13.2.
The manufacturer is responsible for organising SENC features, viewing sets and viewing groups for display in such a way that the mariner has reasonable flexibility in selecting what he sees without the selection process becoming too complex. Note that it is not necessary to provide access to each feature, viewing set or even viewing group individually.
Note that combined groups which include features from different IMO categories should not be linked permanently, since doing so would, in effect, drag additional fea-tures into the Display Base or Standard Display. For example, if a combined group includes soundings (which are "Other") and lights (which are "Standard Display"), this link should not cause soundings to be shown with the Standard Display on first switching on the ECDIS.
2.3.3c Selecting text for the route monitoring display
The ECDIS manufacturer should provide the mariner with control over the selection and display of text on the route monitoring display.
Text should not appear automatically whenever the object it is associated with ap-pears on the display. It should always be possible to remove text independently of the object.
The IMO Display Category for text is "other"
As a guide to adding and removing text from the display, the Presentation Library dis-tinguishes between "Important text" and "Other text", and provides suggested group-ings for text display, in section 7.1 and Table 13.3 of the Presentation Library.
Section 3.4 of this document gives further details on text.

20
S-52 App.2 e4.3 January 2008
2.3.3d Linkages in selecting mariner's options:
Many other options are available to the mariner in addition to those discussed above. Although these may at first be confusing, linkages which reduce these options but which also reduce the performance of the ECDIS should not be used. For example:
- lights should not be automatically displayed when the night colour table is se-
lected. (Lights cause clutter and under certain circumstances the mariner may not want them on the display.)
- as stated in section 3.1.1, symbolized area boundaries should not be automati-
cally selected when paper chart point symbols are selected (Symbolized area boundaries are needed for large scale displays showing a number of overlapping areas, whereas the selection of paper chart point symbols is a personal prefer-ence and is independant of display scale.).
Because vessels vary widely in their requirements and their operational procedures, linkages between options which reduce the flexibility of the ECDIS should be avoided.
2.3.4 Displaying ECDIS updates
For guidance on updating the ENC, see IHO S-52 Appendix 1. This section deals with how updates should be displayed. It is keyed to the relevant sections of the IMO PS.
IMO PS 4.5 Automatic and semi-automatic updates: these should be dislayed in the same
manner as ENC information, using standard colours and symbols. IMO PS 4.6 Manual updates: these should be displayed in standard colours and symbols and
distinguished as described in the Presentation Library , part 1, section 8.7. IMO PS 4.8 The mariner should be able to display updates for review as follows: For automatic updates: the manufacturer should provide a means of distinguishing these.
One method suggested is to identify automatic updates temporar-ily in the same manner as manual updates. The temporary switch-on/switch-off of the identifiers would distinguish automatic from manual updates.
For manual updates: display all SENC information. The manual updates should be dis-
tinguishable as described in the Presentation Library , part I, sec-tion 8.7.

21
S-52 App.2 e4.3 January 2008
3. SPECIFICATIONS FOR SYMBOLISING AREAS, LINES & POINTS AND FOR TEXT
3.1 General 3.1.1 Mariner's options in symbols and linestyles
Although buoys and beacons are aids to navigation, they may also become a collision hazard if their presence is not noticed. The Presentation Library therefore provides, as a mariner's option, an alternative set of symbols for buoys and beacons which are more prominent than the paper chart symbols, particularly on the night display. Two look-up tables are provided, to display either simplified or paper-chart type buoy and beacon symbols.
Areas are difficult to symbolise on an ECDIS, for reasons given below. The Presenta-tion Library therefore provides, as a mariner's option, symbolised area boundary linestyles for use on large scale displays. These make the areas easier to figure out than the plain linestyles recommended for small scale displays, where symbolised lines would cause clutter. Two look-up tables are provided, to display either symbol-ised or plain area boundary linestyles.
The mariner should be given the option of selecting the buoy symbols and area boundary linestyles that best fit the situation, without linkages. For example, boundary linestyle should be selectable independent of the choice of buoy symbol, and inde-pendent of the actual display scale.
3.1.2 Areas
The moving display window of ECDIS, coupled with the possibility of the mariner us-ing a large scale (small area) display window that could lie wholly within a given area, so that the border is not visible, give problems in symbolising.
Areas can be identified both by symbolising the area itself and by symbolising its boundary.
The mariner has to be made aware of any important area, and its identity, but the symbolising should not cause clutter.
3.1.2.1 The following methods of symbolising the area are used:
.1 Opaque colour fill: depth areas and land areas. These consist of (with colour to-ken):
deep water, and also user interface - background (DEPDW & UIBCK) medium deep water (DEPMD) medium shallow (DEPMS) very shallow (DEPVS) intertidal area (DEPIT) land in general (LANDA) built-up areas (CHBRN) no chart data (NODTA)
Eight colours are used, which matches 8-bit graphics devices. They form a subdued background giving maximum contrast to foreground information, including the radar image, all of which are drawn on top.
22
S-52 App.2 e4.3 January 2008
.2 Semi-transparent colour fill: Depth zones should show through this, and all other information is drawn on top, eg.
- traffic separation zone and mariners chartwork area fill.
.3 Patterns of lines: for important area features in busy waters; the pattern should not be distracting, eg:
- traffic junctions - closely spaced magenta diagonal lines - AP(TSSJCT 02), - grossly overscale part of chart display compiled from two compilation
scales - faint grey vertical lines - AP(OVERSC 01) .4 Continuous textures: need to show up in small areas; may be used for features in
busy waters and so should not be distracting, eg: - area with no data - AP(NODATA 03), - dredged area - ordered dot pattern, AP(DRGARE 01), - ice area - random short lines, AP(ICEARE 04). .5 Patterns of symbols: used in less busy areas, or displayed temporarily and then
removed, so can be more distracting, eg: - aquaculture - AP(MARCUL 02) - quality of bathymetry - AP(DQUAL 11) .6 Single centred symbol: used for important features in busy waters, such as traffic
lanes, restricted areas. The symbol is large to give it visibility, but faint in colour to reduce clutter. eg:
- traffic lane - SY(TSSLPT 51) - anchorage prohibited or restricted - SY(ACHRES 51)
These artificial areas are difficult to symbolise because one symbol must apply to all sizes, for example from the case when the display window is wholly inside a traffic lane, to an "area to be avoided" the size of a postage stamp on the display.
In addition, some areas such as traffic routeing systems often have multiple condi-tions (eg. “traffic direction” + "deep water route" + "entry restricted"). Many of the sym-bols in the Presentation Library have deliberate offsets from the pivot point to avoid overwriting.
The Presentation Library provides large transparent symbols for centred symbols and small symbols for pattern coverage:
(a) Centred symbols are used where it is important to avoid clutter, particularly in
traffic lanes. The symbol must be placed within the area. See Presentation Li-brary 7.4 for one method of centering a symbol.
(b) (i) For a pattern of small symbols, the spacing between the symbols lies
within the limits: minimum distance apart: 2 cm. maximum distance apart: 10 cm. (ii) It would be ideal to space the symbols further apart for a large area and
closer together for a smaller area. However reliable symbolising is more important, and a constant fixed-space symbol pattern should be used until "scale dependent spacing" has been developed and proved. See Symbol Library in Addendum.
23
S-52 App.2 e4.3 January 2008
(iii) While a good-looking solution is desirable, identification without clutter is more important. Pattern symbols need not line up exactly between cells; and they need not stay in the same geographic position on re-draw.
(c) It should always be possible to identify an area by cursor picking on any point
within the area.
(d) If the ECDIS offers a ship-centred display mode, the manufacturer should avoid overwriting between the ship symbol and a centred symbol for an area which wholly encloses the display (for example the traffic direction arrow (TSSLPT) in a very large traffic lane such as Dover Strait).
3.1.2.2 Symbolising the area boundary: .1 Discussion: on a large scale display of busy waters the boundaries of many ar-
eas may appear without the whole of each area being on the display. While the centred symbols will be there, it will often be difficult to know which area they ap-ply to. It may also be difficult to decide which side of a particular boundary line is the inside of the area.
To help clarify this situation, the Presentation Library includes two area look-up ta-bles: (I) the "symbolised area boundaries" table, using symbolised and "one-sided" versions of the boundary lines of important areas. This is for use at large scale as a mariner-optional alternative to (ii) the "plain area boundaries" table, which uses sim-ple linestyle area boundaries. This will normally be preferred at smaller scales to avoid clutter.
.2 Symbolised complex linestyles: to identify the area, symbols (or letters acting as
symbols) are embedded in the line, eg: anchoring prohibited or restricted - LC(ACHRES 51) deep water route - LC(DWRUTE 51)
.3 One-sided complex linestyles: to identify the side of the boundary line on which
the area lies, restricted areas use the traditional "T" linestyle of the paper chart, eg:
entry prohibited or restricted - LC(ENTRES 51).
Other important areas use a boundary linestyle like the cold front on a weather map, eg:
waiting area - LC(CTYARE 51) fairway - LC(NAVARE 51)
.4 Simple linestyles: dashed lines are generally used for area boundaries. In
ECDIS, the a dotted line is reserved for the danger line around foul areas, etc. .5 Colours: the colour magenta is used for important areas, grey for less important
areas, eg: traffic areas, caution areas - magenta harbour limits - grey
3.1.3 Symbol Specifications: Presentation Library
All symbols are specified in the Symbol Library for ECDIS, which is in the addendum to the Presentation Library.
24
S-52 App.2 e4.3 January 2008
Some object classes do not have a symbol (e.g. territorial sea). Such "no symbol" ob-jects may be picked up by cursor interrogation of the area.
Should an "unknown object" occur in the SENC which is not adequately defined or for which no symbol exists, its presence should be indicated on the display by a ma-genta"?" SY(QUESMRK1) with the IMO category "Standard Display".
Some objects are symbolised differently depending on circumstances (for example the symbol for a contour depends on whether it is the safety contour.) The Presenta-tion Library includes conditional symbology procedure diagrams for features whose symbols cannot be supplied by a fixed look-up table. Some of these procedures are unavoidably complex, and they should be evaluated carefully.
3.1.4 Paper chart INT 1 and ECDIS chart 1
IHO INT 1 for paper charts is both the starting point for the new simplified symbols and the check-list for paper-chart type symbols on the ECDIS. The new symbols sim-plify the paper chart symbols where operationally proved necessary, to improve read-ability and drawing speed on the display; they also symbolise new features intro-duced for ECDIS, such as the Daymark.
Note: the digital version of Chart 1 depends on a volunteer tp update it, and it may
be omitted from editions after 3.3.
Section 14 of the Presentation Library includes an ECDIS chart 1, a graphical index of ECDIS symbols including both simplified and paper-chart point symbols, and also the symbolized lines and area boundary linestyles This is intended to familiarize the mariner with the colour and symbol coding used by the ECDIS. The symbols are grouped according to INT1, which is familiar to the mariner, but are numbered with a look-up sheet, not labelled. The 'official' version of Chart 1 is hard-copy, in word-processed form. A digital version is also available on the current PresLib CD; the manufacturer who offers the digital version should provide linking by cursor interroga-tion between the symbols and the explanations given in the symbol library.
The ECDIS Chart 1 is intended for use off-line and in route planning. It is not required during route monitoring, when the mariner should use cursor enquiry to find the meaning of symbols.
Technical details of the digital ECDIS Chart 1 are given in sections 18.8 and 19.3 of the Presentation Library.
3.1.5 Size of lines, symbols and text; fonts
Lines and symbols and text should be large enough that they can be easily inter-preted at the operational viewing distance. This will be about 70 cm for route plan-ning, but experience to date indicates that the viewing distance for important features during route monitoring may be several metres. Human factors experts quote a minimum requirement that symbols and characters subtend 20 arc minutes at the observers eye (for example, a symbol viewed from 70cm for route planning should be about 4mm in size, 1.5 times the size of a normal chart symbol. Two times chart size is a good general rule.) Symbols and characters important for route monitoring may have to be significantly bigger.
25
S-52 App.2 e4.3 January 2008
For clear representation, symbols require a minimum number of screen units (pixels), depending on their complexity. A simple chart symbol should extend about 12 pixels (that is about 4mm for an IHO standard screen.)
The minimum sizes for all symbols should be as shown in the Presentation Library.
In addition, the symbols should always be drawn with at least the same number of pixels as are required to draw the symbol at the size defined in the Library for the minimum resolution and minimum chart display area (270x270 mm). That is, the minimum height in pixels of a symbol is: (symbol height in mm) divided by 0.312 mm (where 0.312 mm is the "pixel size" for the minimum size chart display in S-52 section 8 - Display Resolution). When the display scale is enlarged by zooming in, it should be possible to hold sym-bol size constant. The same applies to text. Symbol and text size should never be decreased when zooming out.
The text on the ECDIS should be readable from 1 metre.* Sans serif, non-italic fonts should be used. The computer ø should not be used.
Because several appropriate commercial fonts are available, the Presentation Library does not specify alphanumerics, except for soundings. The manufacturer should make his own arrangements for the use of a font. A plain, clearly readable font such as Univers should be used. In most fonts, pica 8 is too small too read.
IEC 60945 specifies that character size in mm be not less than 3.5 x the viewing dis-
tance in metres. Hence "readable from 1 metre" requires that characters be not less than 3.5 mm in size.
3.1.6 Display Orientation
It should always be possible to display the chart north-up (IMO PS section 7.1), but other orientations are allowed. (Human factors specialists point out that course-up ori-entation offers some safety advantages, and operational reports support this)
Symbols and text should always be drawn screen-up, no matter what the orientation of the screen may be. Symbols which include “rotate” in the symbology instruction (eg light flares) should be rotated with respect to the top of the screen. However symbols that are oriented according to an S-57 attribute such as ORIENT should be oriented with respect to true north. Further details are given in the Presentation Library, Part I, section 7.2.3.
If the display is oriented course-up, the orientation should not be altered too fre-quently, in order to avoid jitter from frequent rewriting of chart information.
The north arrow is always required on the display, as part of the IMO Performance Standards Display Base.
3.1.7 ENC scale; Graphical Index of ENCs by Navigational Purpose; Limit of HO data
.1 ENC scale. The compilation scale of the ENC is the scale at which the ENC was designed to be displayed. It may not be the same as the scale of the source data. As required by IMO Performance Standards, section 5.1, an overscale indi-cation should be shown whenever the mariner selects a display scale that is lar-ger than the compilation scale. See Presentation Library, Part I, section 12.2.2 DATCVR for details.

26
S-52 App.2 e4.3 January 2008
.2 Automatic overscale at a scale boundary. Where ENCs of different navigational purpose overlap, the ECDIS display of the overlap area should show two “chart compilation scale boundaries”, at the beginning and end of the overlap. Beyond one boundary the part of the display taken from the smaller scale ENC will often be grossly overscale. (See section 3.2.3 8(b))
Only the major changes in compilation scale resulting from a change in “naviga-
tional purpose” should be shown as scale boundaries on the display. Small changes in compilation scale within a navigation purpose should not be shown.
The Presentation Library, section 12.2.2 DATCVR, specifies how the scale
boundaries and the overscale area should be symbolised.
.3 Graphical Index of ENCs by Navigational Purpose. Without cursor enquiry of the chart area it will not always be clear what compilation scale applies to a given part of a mixed source display. S-52 requires a graphical index of the naviga-tional purpose of the data to clarify the situation. This is also needed for route planning.
.4 Limit of HO data. The end of HO chart data on this graphical index defines the
limit of HO ENC coverage. Details are given in the Presentation Library, section 12.2.2 DATCVR.
3.1.8 Chart data quality indicator
A chart data quality indicator by zones of confidence (M_QUAL CATZOC) will cover the entire ENC (although not all data will be assessed initially). The table of "CATZOC" values giving the meaning of each zone of confidence should be readily available to the mariner.
3.1.9 Cursor enquiry
It should be possible to call up any of the information associated with an object by cursor enquiry on its symbol. This should extend to areas (restricted area, depth area, etc.) and to "no symbol" areas (territorial seas, etc.) and meta-areas (information about the area such as compilation scale, etc.). The search for area information needs to extend only to the cell boundaries enclosing the position of the cursor.
See Presentation Library, Part I, section 8.8 for further discussion. 3.2 New Symbols for ECDIS (These are illustrated in the ECDIS chart 1, provided in the Presentation Library). 3.2.1 Types of new symbols
Four types of new symbols have been introduced for ECDIS:
(1) Special ECDIS chart symbols to identify unsafe depths, such as the safety con-tour, safety depth, isolated dangers etc.
(2) Optional simplified chart symbols for buoys and beacons, and symbolized area
boundary linestyles.

27
S-52 App.2 e4.3 January 2008
Since buoys and beacons are a potential hazard as well as an aid to navigation, sim-plified buoy and beacon symbols have been designed which are more compact and more prominent than the paper chart symbols, particularly at night.
On a large scale display, the boundary lines of areas can become confusing; symbol-ised area boundaries have been designed which identify the type of area involved and also indicate on which side of the boundary line the area lies.
The ECDIS should provide the mariner with the option of using either the traditional paper chart buoy and beacon symbols or the new simplified symbols, and either the symbolized or the plain area boundary linestyles, as best fits his purpose. The symbol tables of the Presentation Library are organised to facilitate these options.
(3) New chart symbols, such as north arrow, scale boundary, depth area less than
safety contour, etc., needed to explain the more flexible, electronic display based, presentation of ECDIS.
(4) IEC Mariner's Navigational Elements developed by IEC for IMO, which include
the important planned route and own ship symbols. The authority for these fea-tures is IEC Standard 61174, and they are included in the Presentation Library for convenient reference by agreement with the IEC. They are described by ob-jects and attributes in the same manner as chart features so that only one sym-bolising routine is required (see part 2 of the Presentation Library).
3.2.2 Special ECDIS chart symbols to identify unsafe depths
The ECDIS highlights in new ways four features that are important for safe naviga-tion. These are the safety contour, depth shades, the safety depth and isolated dan-gers:
(1) The own-ship safety contour, selected by the mariner from among the contours
in the SENC, is double-coded by a thick line and a prominent change in depth shade.
If the safety contour selected by the mariner is not available in the SENC, the ECDIS should default to next deeper contour and inform the mariner. If, when the ship moves onto a new chart, the safety contour previously in use is no longer available, the ECDIS should again select the next deeper contour, and inform the mariner.
If the mariner does not select a safety contour, the value should default to 30 m. See Presentation Library section 12.2.5 conditional procedure DEPCNTnn for
details.
(2) Depth zone shades, defined by the safety contour and selected shallow and deep contours and the drying line.
The safety contour defines two depth zone shades and the drying line a third:
deep water: deeper than the safety contour (colour token DEPDW), shallow water: shallower than the safety contour (colour token DEPVS),intertidal area: area exposed at low water (colour token DEPIT).
28
S-52 App.2 e4.3 January 2008
These are the only three depth shades that can be clearly distinguished on the night display, and they can only be distinguished by contrast, when seen on the display together. If, at night, the entire display consists of shallow water, the mariner will not be able to recognise this dangerous situation. Therefore, a "depth less than safety contour" pattern is provided in the Presentation Library to reinforce the depth shade. It is optional for the manufacturer to provide this fea-ture, but its inclusion is strongly recommended as a safety feature.
The mariner should be given the option of whether to use this pattern, by night or by day (although it is not strictly necessary by day when the shallow water can be clearly identified by the difference in depth shade). This mariner’s option is built into conditional symbology procedure “SEABEDnn”. See Presentation Li-brary , sections 8.5.7 and 12.2.18.
It is recommended that the ECDIS should also allow the mariner the option of se-lecting a deep contour and a shallow contour from among the contours in the SENC, thus establishing the following five depth zones:
deep water: deeper than the deep contour (colour token DEPDW),medium-deep water: depths between the deep contour and the safety con-
tour (DEPMD), medium-shallow: depths between the safety contour and the shallow
contour (DEPMS),
very shallow water: depths between the shallow contour and zero metre contour (DEPVS)
drying foreshore: intertidal area (DEPIT) The following depth zones may be used as default values:
deep water: deeper than 30 m (deep draught vessels) medium deep: own-ship safety contour to 30 m medium shallow: 2 m to the own-ship safety contour very shallow: 0 to 2 m (defines waters accessible to small craft) intertidal: exposed at low water
(3) The own-ship safety depth is intended as an aid when no appropriate safety con-
tour is available in the SENC. Soundings equal to or less than the safety depth selected by the mariner are made more conspicuous than deeper soundings. A separate set of sounding figures is provided in the Presentation Library.
(4) Isolated dangers (small shoals, rocks, wrecks, obstructions) of depth less than
the safety contour, and also lying within the 'safe' water defined by the safety contour, are highlighted by a special symbol. Because the mariner may some-times have to navigate in water shallower than a default safety contour, the mari-ner may also select to show isolated dangers in the 'unsafe' water between the displayed safety contour and the zero metre contour.
Instructions for these four procedures are given in section 12 'Conditional Symbology Procedures' of the Presentation Library.

29
S-52 App.2 e4.3 January 2008
3.2.3 Other new and simplified ECDIS symbols and their use
Other new chart symbols required by the difference in purpose between ECDIS and the paper chart, as well as the difference between paper and electronic presentation, are described below.
Note that all simplified point symbols are centred on the position of the feature.
(1) Simplified buoy symbols.
Sloping topmark symbols are used for lateral, cardinal, isolated danger and safe water buoys. They are coloured in the single most distinctive colour of the buoy (mixed colours in a small buoy symbol look faint on the night dis-play). Special mark buoys are filled yellow circles, and all mooring buoys re-semble the paper chart "installation buoy". The default buoy, used when a buoy is not fully described in the ENC or has no specific symbol in the Pres-entation Library, is a filled grey circle.
All symbols are centred on the position of the buoy.
When the name or number of the buoy is displayed, it is prefixed "By" by the Presen-tation Library, since otherwise a number can be mistaken for a sounding.
Note 1: this way of displaying buoys is designed primarily to show clearly that a
buoy is there, both to avoid collision with the buoy and as an aid to naviga-tion. The details of buoy characteristics, which cause clutter and are difficult to show clearly on an electronic display under all bridge lighting conditions, should be provided by text command or by individual cursor interrogation.
Note 2: green radar on green buoys or light flares does not contrast well, hence
buoys and light flares are written over the radar and all light flares are sur-rounded by a black outline.
(2) Simplified beacon symbols.
Upright topmark symbols are used for cardinal and isolated danger beacons. Lateral beacons, safe water beacons and specials mark beacons are drawn as specific symbols for minor beacons, general beacons, and beacon towers. Beacons are shown in the same colour as buoys, except for the safe water beacon which is black (white at night). The default beacon is a grey general beacon symbol.
All symbols are centred on the position of the beacon. When the name or number of a beacon is displayed, it is prefixed "Bn".
(3) General symbol for isolated underwater danger.
This conspicuous magenta symbol is applied automatically to rocks, wrecks, small shoals, etc., of depth equal to or less than the own-ship safety contour and which are in deeper water than the safety contour. Optionally, the mariner may extend displaying isolated dangers to shallow waters between the safety contour and the zero metre contour, in case he is forced by circumstances to navigate in such waters.

30
S-52 App.2 e4.3 January 2008
(4) The dredged area is shown by a grey dotted area fill pattern.
(5) Radar conspicuous coastline.
This includes cliffs and abrupt coastlines that can be expected to return a strong radar echo consistently from the same part of the feature. The ma-genta highlight line is only used if the coastline is identified as "radar con-spicuous" in the HO-ENC.
(6) Prohibitions, cautions and information notes are symbolized with small sym-
bols for point application and with large centred symbols for areas, as illus-trated in screens (AB), (JKL) and (MN) of the ECDIS chart 1. Multiple symbols are used when necessary to convey more than one restriction.
Regulated areas are divided for symbolization into Cautionary Areas (includ-ing the existing caution area) and Information Areas, following the distinction established by the IMO/IHO Harmonisation Group on ECDIS in 1992. (See Table 4 of this publication).
Point cautions and notes entered by the mariner and the manufacturer are distinguished by the colours orange and yellow respectively.
(7) Unknown object.
A magenta "?" marks the position of an object which cannot be identified or for which there is no entry in the Presentation Library look-up table.
(8a) Scale boundary.
This shows where the compilation scale of the chart data available changes. The ECDIS should warn the mariner of upcoming chart scale change. Only the major changes in compilation scale resulting from a change in "naviga-tional purpose" should be shown. Small changes in compilation scale within a navigational purpose should not be shown. See Presentation Library section 12.2.2 DATCVR for details.
(8b) Overscale area at scale boundary.
Overscale area at scale boundary. S-52 points out that all the chart data on the display must be shown at the same scale. In order to avoid leaving part of the display blank, the chart display may extend beyond the edge of a rela-tively large scale ENC to include information from an adjoining smaller scale ENC, which may be from a different "navigational purpose". The smaller scale data will normally be enlarged to match the larger scale ENC, and in this case the "overscale area" symbol should be used to identify any part of the chart display shown at more than twice the compilation scale. See Presentation Li-brary section 12.2.2 DATCVR for details.
Note that this symbol applies only to the automatic overscaling performed by the ECDIS in matching ENCs at different compilation scales. It should not be applied to an overscale display deliberately requested by the mariner, which should trigger the overscale indication required by IMO Performance Standard section 5.1.

31
S-52 App.2 e4.3 January 2008
(8c) Change of units of depth. (This section is deleted because S-57 does not permit any other units of depth than metres to be used in the ENC)
(8d) Change of horizontal (geodetic) datum.
The use of non-WGS 84 ENC data does not comply with IHO S-57, and the boundary at which the local geodetic datum changes is not symbolized by the Presentation Library.
The ENC may include information on the relation between the local geodetic datum and WGS 84 (M_HDAT, HORDAT), but this is intended for use in con-verting local data to WGS 84 for use in the SENC, should the need arise. [See S-52 section 7.1(a)(2)]
(9) Scale bar or latitude scale.
The IMO PS require an indication of scale and range as part of the Display Base. The display scale decides which should be used:
(a) for display scales larger than 1/80,000: always display the 1 mile scale
bar provided in the Presentation Library (b) for display scales at 1/80,000 or smaller: always display the 10 mile lati-
tude scale provided in the Presentation Library.
The scale bar or latitude scale should always be drawn vertically at the left side of the chart display, just clear of the border of the display.
The mariner should be able to remove any labels on the scales to avoid clut-ter.
"Display Scale" is defined as: [distance between two features on the display] / [distance between the same two features on the earth's surface]. This means that 1/75,000 is a larger scale than 1/80,000.
(10) North arrow.
The IMO PS requires a north arrow as part of the Display Base. The north ar-row should always be shown at the top left corner of the chart display, just clear of the scale bar or latitude scale.
(11) Manual chart correction.
Small orange identifiers are used to distinguish hand-entered chart correc-tions, which are subject to human error, from corrections entered automati-cally by electronic means. The original chart object should not be removed or altered. (See 2.3.4 for details).
(12) Ramark, Racon.
This is introduced to distinguish beacons that will appear on the radar display from other radio-beacons.

32
S-52 App.2 e4.3 January 2008
(13) Data from non-HO sources
The non-HO data boundary LC(NONHODAT) serves to separate official HO ENC data from non-HO chart information. See section 2.3.1c for further de-tails on identifying non-HO data.
(14) No data areas. The first action of the ECDIS display re-draw should be to cover the entire
screen with the NODTA area colour fill and the AP(NODATA03) area pattern. These will remain to identify any area not subsequently covered by chart in-formation as a no data area.
(15) Identifying pattern for depth areas less than the safety contour. (this section is covered by section 3.2.2 (2)) (16a) Identifying pattern for traffic junctions, crossings and roundabouts. A pattern of diagonal magenta lines is used to identify the areas of a traffic
separation scheme which are traffic junctions, crossings or roundabouts, or precautionary areas.
(16b) Traffic routeing and regulated areas in general. New centred symbols are provided in the Presentation Library, to avoid the
clutter caused by a pattern of symbols in these often critical waters. Details are given on screens (JKL). (M) and (N) of the ECDIS chart 1.
(17) Glacier or ice shelf. A random pattern of short lines symbolising "candled" ice is provided to indi-
cate a glacier or area of shore-fast ice. (18) Daymark. The daymark symbols are designed so that they can be over-written on a
beacon which is highlighted by a daymark. (19) Paper chart symbols for an opening bridge and a radar reflector on an over-
head cable have been revised to fit any orientation of the bridge or cable - see ECDIS chart 1.
(20) A one-sided linestyle is provided for use on large-scale displays to indicate
the side of an area boundary on which the area lies, when only a part of the boundary can be seen on the display.
(21) Meta-data (information about the chart data), such as chart data confidence
areas. The "zones of confidence " in the chart data (section 3.1.8) are symbolised by
a system of stars. Other meta-data items, including compilation scale, IALA "A" or "B" buoyage, etc, are left to cursor picking.
33
S-52 App.2 e4.3 January 2008
(22) Special identifiers.
In addition to the manual chart correction identifier of para. (11) above, identi-fiers are provided for low accuracy chart data and for ENC objects which have additional information for cursor picking under the "INFORM" attribute. The latter may cause clutter, and should only be displayed temporarily. Identifiers are shown on screen (AB) of the ECDIS chart 1.
(23) IEC symbols. By agreement with the IEC, symbols for the "Navigational Elements and Pa-rameters" of the IMO PS Appendix 3, and also symbols being developed by IMO for future use for AIS vessel reports, are included in the Presentation Li-brary. These are on the last diagram of the ECDIS chart 1.
3.3 Existing Chart Symbols 3.3.1 Reproduction of paper chart symbols on ECDIS
Most of the symbols in IHO INT 1 "Symbols used on (paper) charts" have been trans-lated for use on ECDIS. The ECDIS chart 1 gives details, and is divided into lettered sections in the same way as INT 1.
The following notes apply to these symbols:
(1) Depth contours are not labelled by the ECDIS. The Safety Contour is highlighted,
and the mariner should use cursor picking for other contour values.
(2) Light sectors. It should be possible, on request, for the mariner to be capable of identifying the colour of the sectors affecting the ship, even if the lights involved are off the display.
3.4 Text, Diagrams etc. 3.4.1 Text as part of the route monitoring display
Text information should be used on the route monitoring display only when unavoid-able, since it has to be written large to be readable and so causes clutter.
Details of displaying text are given in 3.1.5 and in the Presentation Library.
Soundings are treated by the Presentation Library as symbols to ensure they are legi-ble and correctly located.
3.4.2 Text windows, explanatory diagrams etc. superimposed on the route monitoring dis-
play
The 270mm by 270mm minimum area of chart presentation for route monitoring should normally be used for chart and navigation information alone.
Any windows containing text, diagrams, etc superimposed on the route monitoring display should be temporary, and should not obscure important chart or navigational information. Such windows should use only the "User Interface" colours from the Presentation Library. It should be possible for the mariner to re-locate a window in a

34
S-52 App.2 e4.3 January 2008
less important part of the display, such as on land, or behind the ship. 3.4.3 Separate text panel on the same screen as the route monitoring display
A Mariner's Information Panel, consisting mainly of text (alphanumerics), might in-clude:
- ECDIS alarms and indications, eg." crossing safety contour", - navigation information, eg. time, position, course to make good, etc., - chart information, eg. contour selected for own-ship safety contour, - supplementary chart information, eg. tide tables, sailing directions, - interface dialogue, eg. "change to night colour table". - etc.
Sea experience has shown that the text panel on the route monitoring display may have a prominence out of proportion to its significance to safety of navigation. This is particularly damaging to ECDIS performance at night, when the strictly dimmed chart display, which carries nearly all of the information of importance to navigation, may be overwhelmed by the light emitted from large, bold or bright characters on the text dis-play, some conveying relatively unimportant information.
The text panel should be outside the 270 by 270 mm minimum area designated for the route monitoring chart display by the IMO PS. The colours, symbols and lumi-nance of this user interface panel should not degrade the SENC information on the chart display.
At night it is essential that any interface panel or other information added by the manufacturer to the screen carrying the chart display should never generate more light than the chart display itself. Great care is taken to reduce the light emitted by the chart in order to preserve the mariners night vision, and it is dangerous to ship safety if added non-chart information defeats that purpose.
It is particularly important to limit the information shown using the conspicuous colour token "UINFD", which is reserved for important information. Even a small panel of text in this colour can produce more light on the bridge than the entire route monitoring chart display.
3.4.4 Text shown on a separate auxiliary screen
A separate screen may be provided for text display, either instead of or in addition to a panel on the main screen used for the route monitoring display. The presentation on this auxiliary screen need not follow these specifications in detail, but should con-form in general, to avoid confusion, and should meet the same bridge lighting con-straints.
All information displays should be designed in accordance with ergonomic principles.

35
S-52 App.2 e4.3 January 2008
4. SPECIFICATIONS FOR COLOURS 4.1 General
The ECDIS manufacturer can use any technology to build his display as long as his display fulfils the requirements of this specification. It is known that at least displays based on CRT, TFT or LCD can be made to fulfill the requirements of this standard.
The colours are specified in CIE (Commission Internationale de l'Eclairage) xy chro-maticity coordinates and luminance L. CIE colour coordinates are used because any other colour specification, such as RGB, is specific to a particular monitor and so can-not be specified either in relative or in absolute terms. Procedures for converting these CIE coordinates to RGB values for the ECDIS display are described in sections 4.1.6, 5.2.3 and 5.2.4 below, and in Annex B. It is strongly recommended that these procedures be followed.
The ECDIS manufacturer may use other methodology if he wishes, however the col-ours of features on the ECDIS display should appear the same as would be obtained by following the procedures in this document.
The official Colour Tables are in section 13 of the Presentation Library. The Colour Tables are also included in the .dai file of the digital Presentation Library, however the maintenance of this file depends on a volunteer provider.
Note that these colour specifications apply to both the operational chart display (for route planning and route monitoring), and also to any text on the same screen as the chart display.
The colour tables have been carefully designed by perception specialists to give the maximum clarity and contrast between features on the display under all light condi-tions on the bridge. They have been tested at sea on several occasions.
4.1.1 Colour assignment
Since chart and navigation lines and symbols must show clearly against the back-ground shades, the colour tables were constructed by first selecting the background area shades and then selecting colours for lines and symbols that contrast with their background. In selecting foreground colours for point and line features, lines and symbols, the aim has been to highlight important information by giving it greater con-trast with the background.
In order to accommodate the very large change in bridge lighting between bright sun and dark night , the colours switch from a light background with dark foreground de-tails , which has been found to give the best contrast under bright sun, to a dark back-ground with light foreground details by night. The night display has to be dim enough that it can be viewed without impairing the mariner's night vision. The Dusk table is also a black-background table, for optional use by day as well as at twilight.
The design of both colours and symbols has concentrated on ensuring that important chart and navigation features remain clearly visible under the extremes of bright sun and dark night viewing.
The general assignment of colours is given in Table 1 and condensed Colour Tables are in Table 2.
36
S-52 App.2 e4.3 January 2008
4.1.2 Bright Sunlight or Night viewing - Use of filters etc
The information-carrying capability of the ECDIS display is curtailed at the extremes of bright sunlight and night viewing. The reasons, and some remedies, are described in this section.
Bright sun. Some of the strong ambient light on the bridge is reflected off the back of the display screen face plate and arrives at the mariner's eye mixed with the light generated by the monitor which carries the image of the ECDIS display. This display image is further diluted by light entering the mariner's eye directly from the brightly-lit bridge. The effect is to make the display look washed out; contrast between features may be severely reduced. In the extreme case of sunlight shining directly on the screen, no information at all will be visible. In addition, reflections on the face of the monitor from objects close to the screen, particularly a mariner's white shirt, may mask parts of the display.
The ECDIS display should be situated where direct sunlight will not shine onto it, nor into the eyes of the mariner looking at it. A visor around the face of the screen may help. A filter may also help,(because it attenuates the sunlight twice, both when inci-dent and when reflected, whereas the monitor image is attenuated only once). Low attenuation neutral density filters may be used, such as a 2 times attenuation filter designated (logarithmically) "0.3 ND". Polarised filters should be an advantage. In addition, a black cotton (not synthetic) watch-coat will eliminate shirt reflections. Ide-ally, the bridge windows should have glare reducing glass and the inside of the bridge should have non-reflecting paint.
Night. The need to preserve night vision requires that the illumination from the screen be reduced to a lower level than is desirable from considerations of clear viewing. The light level from night colour tables is below that which provides full contrast ca-pability. Consequently some area-fill colours are indistinguishable on the night dis-play, as noted in section 3.2.2 (2) of these specifications, and colours of lines may be difficult to distinguish.
An additional problem for CRT type of monitor is that the R,G & B guns of the CRT may drop to the cut-off point at these very low DAC (digital to analog converter) volt-ages, particularly on an ageing CRT. Because good quality neutral filters reduce illu-mination without significantly affecting colour, and even tend to enhance contrast their use is recommended for the night display.
4.1.3 Display calibration and verification
The ECDIS display should be calibrated initially in order to transform the CIE colour table coordinates to screen coordinates. The main components of the ECDIS display are the monitor and the image generator. Both the monitor and the image generator used to drive the ECDIS display can be calibrated together as a colour generating unit. Another alternative is to calibrate separately both the monitor and image genera-tor. This process is described for CRT screens in Annex B1, and software for proc-essing calibration and converting CIE colour coordinates to RGB, with worked exam-ples, is included in the Presentation Library.
The ECDIS display calibration should be verified for type approval of all monitors as described in section 5.2.3, using a combination of instrumental testing for the bright sun colour table and subjective visual checking for the dusk and night colour tables.
37
S-52 App.2 e4.3 January 2008
Only limited experience has been gained with calibration schemes for LCDs. Based on this, the procedure of calibrating all three colour tables by the current method used for CRTs, together with remote control of the calibration settings, should be used for LCDs for the interim (2004).
The visual checking is done by viewing all but the bright sun colour table on a multi-purpose Colour Differentiation Test Diagram carried in the Presentation Library and described in section 5.2.5 and PresLib section 19.4. The test diagram is also intended for use by the mariner for checking display performance and adjusting the controls as described below.
The colour performance of the display will deteriorate with age. The principal effect is overall loss of luminance (candle-power). For a CRT type of monitor this reduces the effectiveness of the bright sun colour table and may cause some colours of the night tables to drop below the cut-off point if cathode current stabilisation is not used. If at the same time relative luminance changes between the R,G & B guns should arise , colour reproduction will suffer and some distinctions between features may be lost. The night display is the most vulnerable. Self calibrating CRT type of monitors, gen-erally using a detachable sensor to measure the white light emitted by the CRT and feed back any necessary corrections to RGB values through software, are available from manufacturers such as BARCO. Other methods of detecting and eventually cor-recting for colour drift are being investigated, and are discussed in Annex C. Today very little experience is available for the aging of other types of display such as TFT and LCD.
4.1.4 Colour control; contrast and brightness controls
There are a variety of technologies available for monitors to be used for ECDIS dis-play. Different technologies have different methods to control colour, contrast and brightness, but some basic rules apply for all of them.
4.1.4.1 Effect of controls.
The contrast control of a display generally shortens or extends the range of lumi-nance available, making the display appear darker or brighter.
On the other hand, the brightness control shortens or extends the range of colour saturation available by adding white (which extends the range by making colours other than black less saturated), or subtracting white (colours become darker, more saturated.)
To the viewer, it has much the same apparent effect as contrast, but it achieves this by altering the colour contrast of the colour tables between foreground and back-ground colours, and this may result in some features becoming harder to see, particu-larly at night. More importantly, making the night display more saturated may drop some dark colours below the cut-off point, into black, thus losing distinctions such as shallow versus deep water.
4.1.4.2. Use of the controls.
Colour tables are provided for day, dusk and night. The mariner should be provided with the control to make fine adjustments between these tables; the calibration posi-tion should be marked as a reference for this.

38
S-52 App.2 e4.3 January 2008
For a CRT type of monitor the brightness control should be preset, i.e. used only when essential, with provision to return to the calibrated setting.
LCD and other monitor technologies have a variety of controls. The general principle is that all available controls should have a provision to return to the calibrated settings and that only appropriate controls should be made available for the mariner. The ECDIS manual should carry a warning that careless use of the display controls may adversely affect the visibility of information on the display.
4.1.4.3. Initial setting of the controls. The controls should be set up in preparation for initial calibration, as described in An-nex B section 1.3, and their positions marked at that time (e.g. by a detent) so that they are recoverable.
4.1.4.4. Re-adjustment of the controls. In case the controls go out of adjustment in use, they may be re-adjusted onboard ship by means of the Colour Differentiation Test Diagram provided in the Presentation Library (see section 5.2.5).
4.1.4.5. Setting the controls for route monitoring. The ECDIS display carries far more detail than a radar display, and requires corre-spondingly more attention to the correct selection of colour table and the correct ad-justment of the controls. This particularly affects the black-background displays, and is critically important at night, because all colours of the night table, particularly those for large areas, have to be set very dark to avoid loss of night vision, and if the control is turned down too far these colours will disappear into the black background. As a result, chart information will be lost. The situation will be worse if one of the day tables is improperly dimmed for use at night, instead of switching to the night table. It is important that the display be adapted to lighting conditions on the bridge by se-lecting the correct colour table: "Day" for bright sunlight; "Day” or "Dusk" for general daylight viewing; "Dusk" for twilight; and "Night" for the night-darkened bridge. The controls should only be used for fine adjustment within the appropriate colour ta-ble. To ensure that the controls are always set to a level above that at which information will be lost, the black-adjust symbol BLKADJ should be available to the mariner, treated as "Standard display", to be called up at any convenient point on the screen. The instructions for its use by the mariner should be incorporated in the "Users in-structions" for the ECDIS.. Below is an example of instructions for a CRT type of Monitor: 1. First, set contrast to a maximum, brightness to a minimum. Look at the black-
adjust symbol. Then either:

39
S-52 App.2 e4.3 January 2008
2A. If the centre square is not visible, turn up the brightness until it just appears. or:
2B. If the centre square is clearly visible (with contrast at maximum, brightness at minimum), turn the contrast down until the inner square disappears, then turn contrast back up until the inner square is just visible again.
(If the above adjustment is not successful, select a more appropriate colour table and
repeat this procedure). The "black level" is now correctly set. If a brighter display is required use the contrast
control, but it is better not to re-adjust the controls unless lighting conditions on the bridge change.
Note that the black-adjust symbol should be displayed to check that the inner square
remains visible on the following occasions: - every time that the brightness or contrast controls are adjusted, - every time that the display is switched to the night colour table. Below is an example of instruction for LCD type of Monitor. The LCD type of monitor
used in this example has only one mariner control, which is called brilliance. Internally the monitor has also other controls available for service engineers. These internal controls include also controls named as contrast and brightness.
1. First, set brilliance to calibration position. Look at the black-adjust symbol. Then
either: 2A. If the centre square is not visible, turn up the brilliance until it just appears.
or: 2B. If the centre square is clearly visible, turn down the brilliance until the inner
square disappears, then turn brilliance back up until the inner square is just visi-ble again.
(If the above adjustment is not successful, select a more appropriate colour table and
repeat this procedure). The "black level" is now correctly set. If a brighter display is required use the brilliance
control, but it is better not to re-adjust the controls unless lighting conditions on the bridge change.
Note that the black-adjust symbol should be displayed to check that the inner square
remains visible on the following occasions: - every time that the brightness or contrast controls are adjusted, - every time that the display is switched to the night colour table. It is recommended that the BLKADJ symbol be displayed automatically all the time
that the night colour table is selected, with a mariner over-ride to remove it if neces-sary.
4.1.5 The colour tables
Earlier editions of S-57 App.2 provided five colour tables. To simplify the operation of
ECDIS by the mariner these have been reduced to three colour tables, all of which should be made available to the mariner. These are listed in a condensed form in Ta-
40
S-52 App.2 e4.3 January 2008
ble 2 and specified in detail in the Presentation Library. They are as follows: DAY (table 2.1) The "Day" table uses a white background as a result of a com-
parative test outdoors in bright sunlight which showed that a dis-play background of maximum luminance gives the best contrast achievable under near-washout conditions. This conclusion has been confirmed by subsequent sea experience.
DUSK (table 2.2) The "Dusk" colour table is a black background table, which may
also be used by day as a mariner's option. NIGHT (table 2.3) At night the light emitted by the display must be strictly limited to
avoid impairing night vision. In case the luminance needs to be further reduced, the "Night" colour table may be augmented by a luminance-reducing neutral density filter which should have 8 times attenuation, designated (logarithmically) "0.9 ND". (This is a manufacturer's option).
4.1.6 The colour scheme - colour tokens
The colour scheme of the Presentation Library is designed to fit current computer ar-chitecture. A digital look-up table assigns all object/attribute combinations of features from the SENC to one of 64 "colour tokens". A few tokens apply to only one feature, but most include a group of similar features; eg. traffic lanes, traffic direction arrows, prohibited areas and other such features share the "trfcd" for "traffic control dominant (conspicuous)" colour token. In turn, each token is assigned colour coordinates in the digital colour tables of the Presentation Library. Tables 2 and 3 below illustrate how this scheme works.
4.1.7 Transparency Transparent area colour fill is used at present:
(i) so that the background colours, lines and symbols show through an area shade (eg. depth shades and contours should show through a traffic separation zone),
(ii) to reduce the prominence of a large symbol (eg. too prominent a centred an-
chorage area symbol would cause clutter on the display). Transparent fill can be achieved in two ways:
1.) with a given percentage of the pixels having the transparent fill colour (see Pres-entation Library section 7.4.2),
2.) by mixing the fill and underlay colour according to the procedure given in the
Presentation Library, Part I, section 4.2.3.2. This must be done in such a way that no appearance of change in colour or shape occurs in any SENC feature on the display, at any intermediate transparency value. The underlying SENC infor-mation must remain distinguishable, except when the overlay colour approaches 100%, in which case Colour & Symbol Specifications 2.3.2 (b) applies, and an indication is required.

41
S-52 App.2 e4.3 January 2008
5. SPECIFICATIONS FOR THE DISPLAY SCREEN 5.1 Requirements of S-52
The requirements of S-52 for the main graphic display are:
"Size: minimum effective size of the area for chart display: 270 x 270 mm.
"Resolution: minimum lines per mm (L) given by L=864/s, where s is the smaller dimension of the chart display area. (eg. for the minimum chart area, s=270 mm and the resolution L=3.20 lines per mm, giving a "picture unit" size of 0.312 mm)
"Colours: 64.
5.2 Additional Requir ements of S-52 Appendix 2 (These specifications) 5.2.1 Reproducing small features and symbols
The above S-52 specification permits a chart display whose minimum resolution (lines/mm) may vary depending on the size of the display. To maintain a clearly read-able chart display under this flexibility requires the following constraints to ensure that enough "picture units" (pixels) are always used to draw small features and symbols clearly:
(1) Chart features: Chart features should never be drawn with fewer "picture units"
(ie. lines, pixels, dot-pitch intervals) than when drawn on a 270 x 270 mm chart area at SENC scale.
(2) Symbols: For clear representation, symbols require a minimum number of picture
units, depending on their complexity. A simple chart symbol should extend about 12 pixels (that is at least 3.5mm for an IHO standard screen.) See section 3.1.5 for details on the size of symbols.
5.2.2 Colour display capability
The colours, as specified in CIE x,y chromaticity co-ordinates and luminance L, are intended for a display capable of at least 256 luminance steps in each of red green and blue
For night performance it is essential that the ECDIS hardware has a graphics card capable of giving "blacker than black", ie complete control of colour, and that the software can control that function. (Some pre-packaged operating systems will not al-low the user to select low luminances).
For CRT type of monitor cathode (beam) current stabilisation is desirable, to prevent dark colours dropping below the cut-off point.
5.2.3 Colour conversion tolerances and tests 5.2.3.1 Tolerances. The tolerances quoted below apply only to the process of converting CIE
colour coordinates to RGB values, and so should be evaluated shortly after the ECDIS leaves the manufacturer's plant.
42
S-52 App.2 e4.3 January 2008
Considerable operational experience will be needed before it will be possible to state colour maintenance tolerances for ECDIS onboard ship.
The colour tables developed have been selected to ensure maximum colour discrimi-nation between features. Colour discrimination depends on both the colour difference and the luminance difference between two colours. Colour science (as represented by the C.I.E. colour convention) has defined colour difference units ∆E* and ∆C*. ∆E* is a measure of the overall discrimination (including both colour and luminance differ-ences). ∆C* is a measure of the discrimination in colour alone, excluding luminance differences.
Note: “∆” represents the greek letter “Delta”, although it may appear differently on
some computers.
The tolerances for the conversion of the colour tables from the CIE colours defined in these specifications to the actual RGB values for the ECDIS CRT are defined in three terms:
1. Overall discrimination between actual colours within the converted table : ∆E*.
This is to ensure that all the colours within the RGB table remain discriminably separate, ie. that the relative colour distinctions have been maintained.
2. Colour discrimination differences between the defined and the actual values :
∆C*. This is to ensure that the actual RGB colours resulting from the conversion remain reasonably close to the CIE colours defined in the specifications, ie. that the blues stay blue and the greens stay green.
3. Luminance differences between the defined values and the actual values : L.
This is to ensure that the luminance remains the same within acceptable limits.
NOTE The CIE L*u*v* human perception colour model, which is the source of the tol-erances described above, has not yet been evaluated at the low luminances of the night colour table, at which the less colour-sensitive rods of the eye take over from the daytime cones. Consequently these tolerances should not be applied to the night table, and for type-approval purposes they are restricted to the bright sun table.
Colour tolerance values:
1. The discrimination difference between any two colours displayed (except those with a tabular ∆E* less than 20 - see list in Annex B 4.5) should be not less than 10 ∆E* units.
2. The difference between the colour displayed and the CIE colour defined in these
specifications should be not greater than 16 ∆C* units. If a monitor is independ-ently tested then the difference shall be not greater than 8 ∆C* units.
3. The luminance of the colour displayed should be within 20% of its specified
value. Black is a special case and the luminance of it shall be not greater than 0.52 cd/m² for bright sun colour table.
5.2.3.2 Instrumental calibration verification test. For CRT displays, an instrumental test to
check that the results of the colour conversion calibration described in Annex B1 are within tolerance should be made by displaying the colours of the Day colour table (re-stricted to colour pairs of tabular ∆E* greater than 20); measuring their CIE coordi-nates x,y and L; and applying a tolerance test. The procedure is described in Annex B
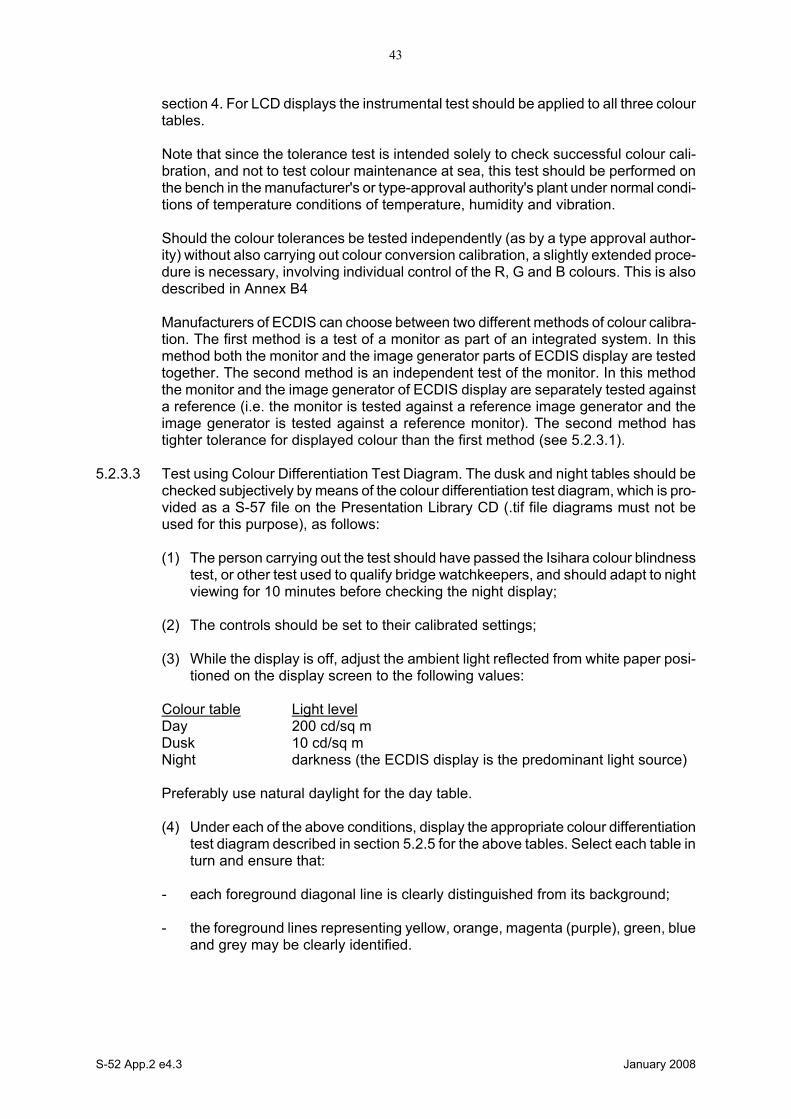
43
S-52 App.2 e4.3 January 2008
section 4. For LCD displays the instrumental test should be applied to all three colour tables.
Note that since the tolerance test is intended solely to check successful colour cali-bration, and not to test colour maintenance at sea, this test should be performed on the bench in the manufacturer's or type-approval authority's plant under normal condi-tions of temperature conditions of temperature, humidity and vibration.
Should the colour tolerances be tested independently (as by a type approval author-ity) without also carrying out colour conversion calibration, a slightly extended proce-dure is necessary, involving individual control of the R, G and B colours. This is also described in Annex B4 Manufacturers of ECDIS can choose between two different methods of colour calibra-tion. The first method is a test of a monitor as part of an integrated system. In this method both the monitor and the image generator parts of ECDIS display are tested together. The second method is an independent test of the monitor. In this method the monitor and the image generator of ECDIS display are separately tested against a reference (i.e. the monitor is tested against a reference image generator and the image generator is tested against a reference monitor). The second method has tighter tolerance for displayed colour than the first method (see 5.2.3.1).
5.2.3.3 Test using Colour Differentiation Test Diagram. The dusk and night tables should be checked subjectively by means of the colour differentiation test diagram, which is pro-vided as a S-57 file on the Presentation Library CD (.tif file diagrams must not be used for this purpose), as follows: (1) The person carrying out the test should have passed the Isihara colour blindness
test, or other test used to qualify bridge watchkeepers, and should adapt to night viewing for 10 minutes before checking the night display;
(2) The controls should be set to their calibrated settings; (3) While the display is off, adjust the ambient light reflected from white paper posi-
tioned on the display screen to the following values: Colour table Light level Day 200 cd/sq m Dusk 10 cd/sq m Night darkness (the ECDIS display is the predominant light source) Preferably use natural daylight for the day table. (4) Under each of the above conditions, display the appropriate colour differentiation
test diagram described in section 5.2.5 for the above tables. Select each table in turn and ensure that:
- each foreground diagonal line is clearly distinguished from its background; - the foreground lines representing yellow, orange, magenta (purple), green, blue
and grey may be clearly identified.

44
S-52 App.2 e4.3 January 2008
5.2.4 Software for colour calibration and tolerance verification
Software is provided in the Presentation Library to compute the instrumental calibra-tion results, the CIE to RGB conversion, and the tolerance checks.
5.2.5 Colour Differentiation Test Diagram; grey scale The use of symbol BLKADJ to adjust the controls every time that the night colour ta-ble is selected has been described in section 4.1.4.5. This section describes further checks on the colour performance of the ECDIS display. A multi-purpose colour differentiation test diagram is illustrated in the Presentation Li-brary section 15.4, and is described in the Presentation Library, sections 19.3 and 19.4. This consists of 20 squares each coloured with one of the 4 main background colour fills (such as shallow water blue), and each having a diagonal line in one of the six important foreground colours (such as mariner's orange). Each diagonal line is 2 pixels wide. The diagram is in the form of an S-57 ENC and so can be displayed using any of the three colour tables. This diagram is intended: (1) for use by the mariner to check and if necessary re-adjust the controls, particu-
larly for use at night; (2) for use by the mariner to satisfy himself that an ageing ECDIS display remains
capable of providing the necessary colour differentiation; (3) for initial colour verification of the day, dusk and night colour tables. Both the Colour Test Diagram and the instructions for its use (see Presentation Li-brary sections 18.8 and 19.4) should be made available to the mariner. In addition, a grey scale is described in Annex C for use by maintenance technicians in checking colour tracking in an ageing display. The Colour Differentiation Test diagram is intended for use off-line. It is not required during route monitoring. Note that the Colour Differentiation Test Diagram will not be true to colour unless it is projected on a calibrated screen and is generated using the digital format described in section 19.4 of the Presentation Library, which correctly reproduces the colour to-kens of the Presentation Library.
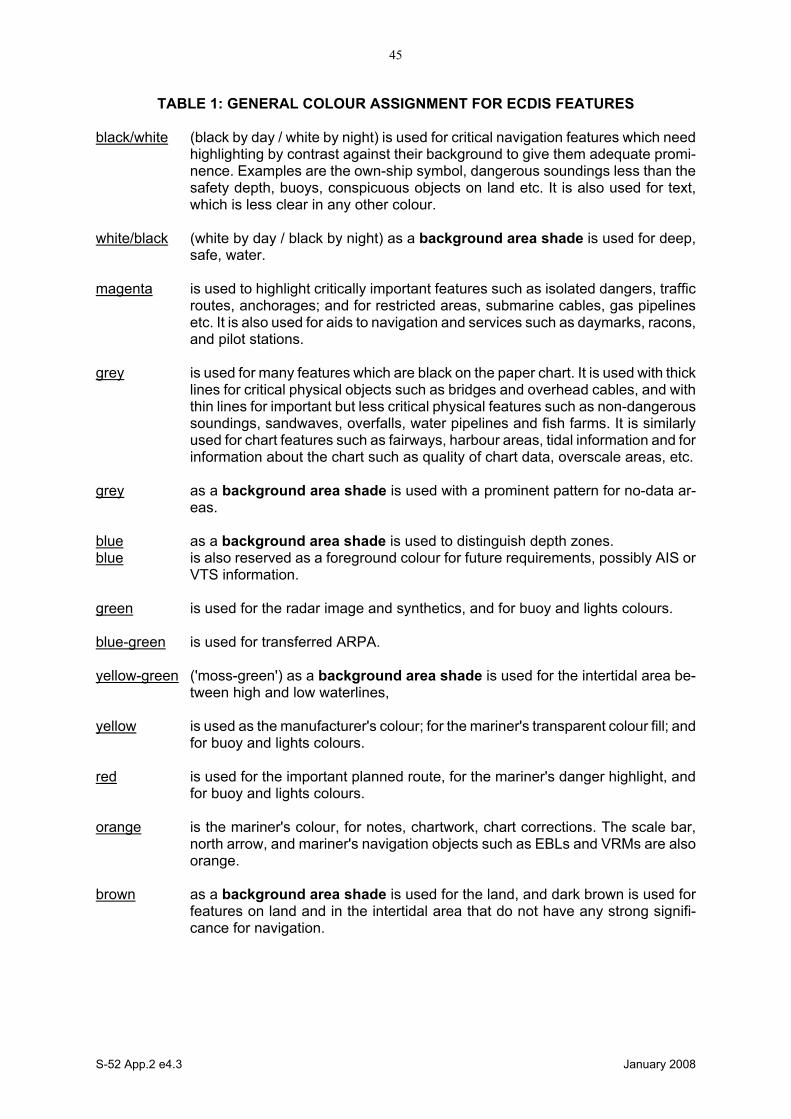
45
S-52 App.2 e4.3 January 2008
TABLE 1: GENERAL COLOUR ASSIGNMENT FOR ECDIS FEATURES black/white (black by day / white by night) is used for critical navigation features which need
highlighting by contrast against their background to give them adequate promi-nence. Examples are the own-ship symbol, dangerous soundings less than the safety depth, buoys, conspicuous objects on land etc. It is also used for text, which is less clear in any other colour.
white/black (white by day / black by night) as a background area shade is used for deep,
safe, water. magenta is used to highlight critically important features such as isolated dangers, traffic
routes, anchorages; and for restricted areas, submarine cables, gas pipelines etc. It is also used for aids to navigation and services such as daymarks, racons, and pilot stations.
grey is used for many features which are black on the paper chart. It is used with thick
lines for critical physical objects such as bridges and overhead cables, and with thin lines for important but less critical physical features such as non-dangerous soundings, sandwaves, overfalls, water pipelines and fish farms. It is similarly used for chart features such as fairways, harbour areas, tidal information and for information about the chart such as quality of chart data, overscale areas, etc.
grey as a background area shade is used with a prominent pattern for no-data ar-
eas. blue as a background area shade is used to distinguish depth zones. blue is also reserved as a foreground colour for future requirements, possibly AIS or
VTS information. green is used for the radar image and synthetics, and for buoy and lights colours. blue-green is used for transferred ARPA. yellow-green ('moss-green') as a background area shade is used for the intertidal area be-
tween high and low waterlines, yellow is used as the manufacturer's colour; for the mariner's transparent colour fill; and
for buoy and lights colours. red is used for the important planned route, for the mariner's danger highlight, and
for buoy and lights colours. orange is the mariner's colour, for notes, chartwork, chart corrections. The scale bar,
north arrow, and mariner's navigation objects such as EBLs and VRMs are also orange.
brown as a background area shade is used for the land, and dark brown is used for
features on land and in the intertidal area that do not have any strong signifi-cance for navigation.
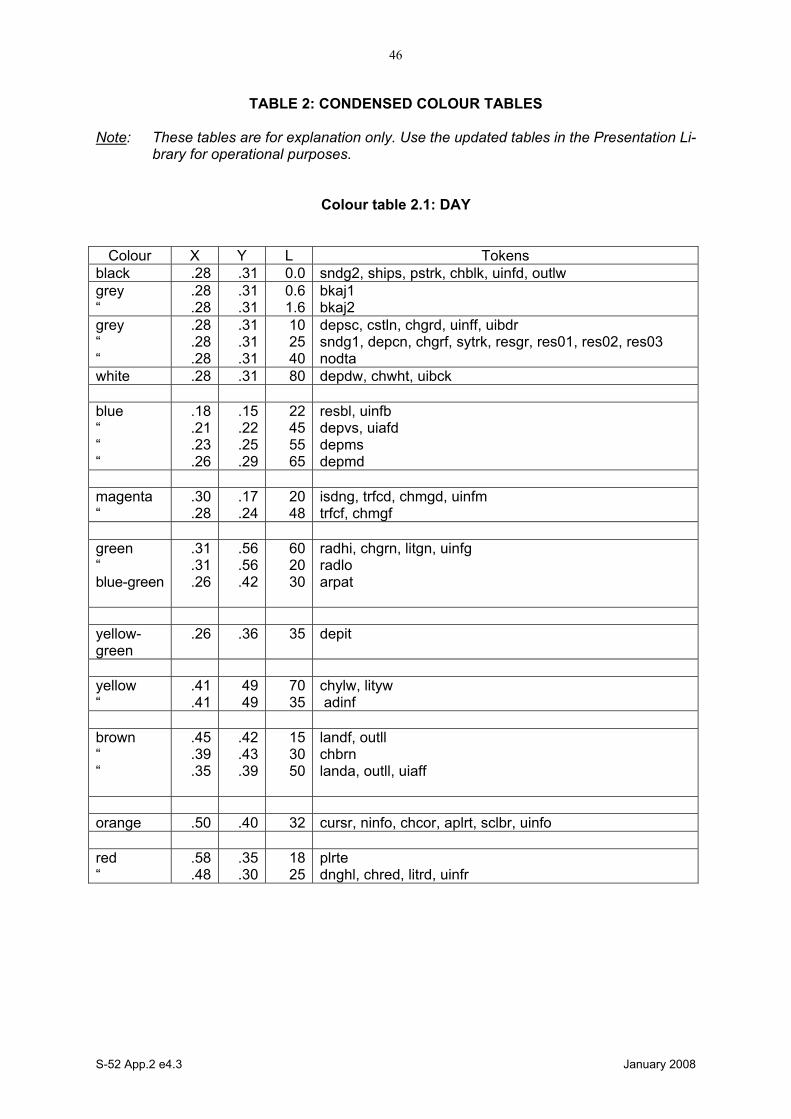
46
S-52 App.2 e4.3 January 2008
TABLE 2: CONDENSED COLOUR TABLES Note: These tables are for explanation only. Use the updated tables in the Presentation Li-
brary for operational purposes.
Colour table 2.1: DAY
Colour X Y L Tokens black .28 .31 0.0 sndg2, ships, pstrk, chblk, uinfd, outlw grey “
.28
.28 .31 .31
0.6 1.6
bkaj1 bkaj2
grey “ “
.28
.28
.28
.31
.31
.31
10 25 40
depsc, cstln, chgrd, uinff, uibdr sndg1, depcn, chgrf, sytrk, resgr, res01, res02, res03 nodta
white .28 .31 80 depdw, chwht, uibck blue “ “ “
.18
.21
.23
.26
.15
.22
.25
.29
22 45 55 65
resbl, uinfb depvs, uiafd depms depmd
magenta “
.30
.28 .17 .24
20 48
isdng, trfcd, chmgd, uinfm trfcf, chmgf
green “ blue-green
.31
.31
.26
.56
.56
.42
60 20 30
radhi, chgrn, litgn, uinfg radlo arpat
yellow-green
.26 .36 35 depit
yellow “
.41
.41 49 49
70 35
chylw, lityw adinf
brown “ “
.45
.39
.35
.42
.43
.39
15 30 50
landf, outll chbrn landa, outll, uiaff
orange .50 .40 32 cursr, ninfo, chcor, aplrt, sclbr, uinfo red “
.58
.48 .35 .30
18 25
plrte dnghl, chred, litrd, uinfr
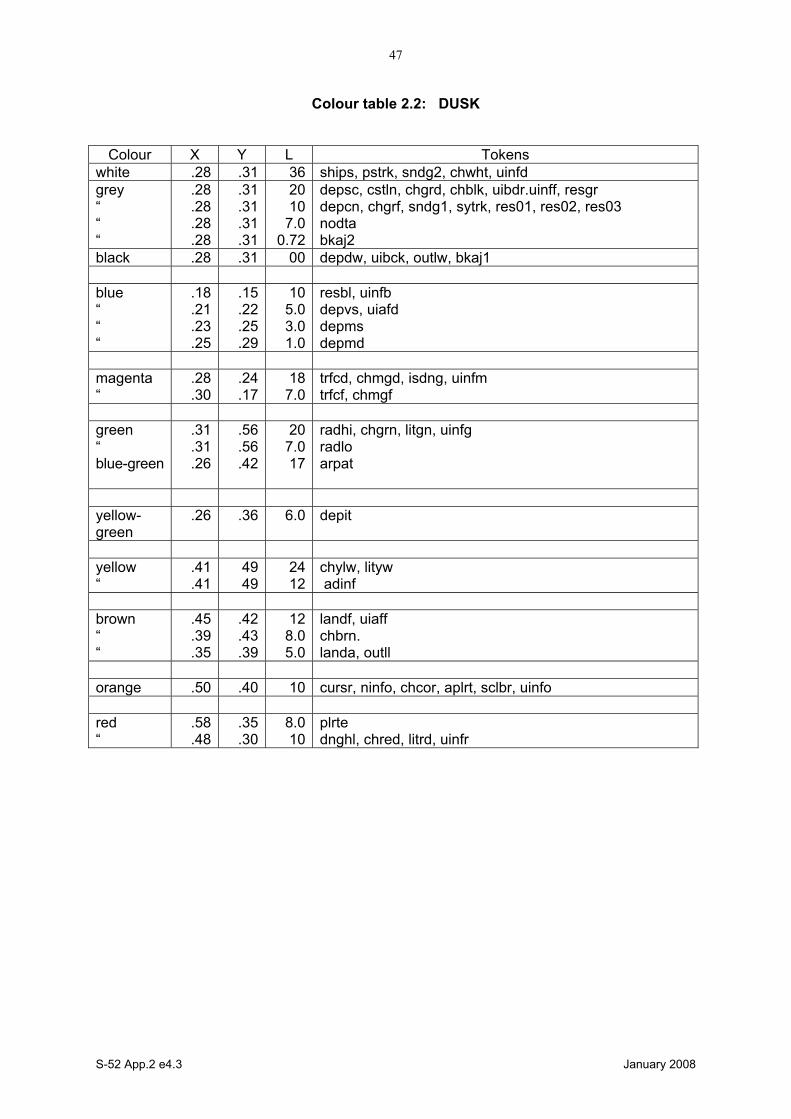
47
S-52 App.2 e4.3 January 2008
Colour table 2.2: DUSK
Colour X Y L Tokens white .28 .31 36 ships, pstrk, sndg2, chwht, uinfd grey “ “ “
.28
.28
.28
.28
.31
.31
.31
.31
20 10
7.0 0.72
depsc, cstln, chgrd, chblk, uibdr.uinff, resgr depcn, chgrf, sndg1, sytrk, res01, res02, res03 nodta bkaj2
black .28 .31 00 depdw, uibck, outlw, bkaj1 blue “ “ “
.18
.21
.23
.25
.15
.22
.25
.29
10 5.0 3.0 1.0
resbl, uinfb depvs, uiafd depms depmd
magenta “
.28
.30 .24 .17
18 7.0
trfcd, chmgd, isdng, uinfm trfcf, chmgf
green “ blue-green
.31
.31
.26
.56
.56
.42
20 7.0 17
radhi, chgrn, litgn, uinfg radlo arpat
yellow-green
.26 .36 6.0 depit
yellow “
.41
.41 49 49
24 12
chylw, lityw adinf
brown “ “
.45
.39
.35
.42
.43
.39
12 8.0 5.0
landf, uiaff chbrn. landa, outll
orange .50 .40 10 cursr, ninfo, chcor, aplrt, sclbr, uinfo red “
.58
.48 .35 .30
8.0 10
plrte dnghl, chred, litrd, uinfr

48
S-52 App.2 e4.3 January 2008
Colour table 2.3: NIGHT
Colour X Y L Tokens white .28 .31 5.0 sndg2, chwht, ships, pstrk, uinfd grey “ “ “
.28
.28
.28
.28
.31
.31
.31
.31
2.5 1.25
1.2 0.1
chgrd, chblk,cstln, depsc, uibdr, uinff chgrf, sndg1, depcn, resgr, sytrk, res01, res02, res03 nodta bkaj2
black .28 .31 00 depdw, uibck, outlw, bkadj1 blue “ “ “
.18
.21
.23
.25
.15
.22
.25
.29
1.25 0.8 0.4 0.2
resbl, uinfb depvs, uiafd depms depmd
magenta .30 .17 2.0 isdng, trfcd, trfcf, chmgd, chmgf, uinfm green “ blue-green
.31
.31
.26
.56
.56
.42
2.5 0.8
1.75
radhi, chgrn, litgn, uinfg radlo arpat
yellow-green
.26 .36 1.2 depit
yellow “
.41
.41 49 49
3.0 1.5
chylw, lityw adinf
brown “ “ “
.45
.45
.39
.35
.42 42
.43
.39
3.2 1.6 1.3 0.8
uiaff landf chbrn landa, outll
orange .50 .40 1.25 cursr, sclbr, ninfo, aplrt, chcor, uinfo red “
.48
.58 .30 .35
1.25 0.9
dnghl, chred, litrd, uinfr. plrte
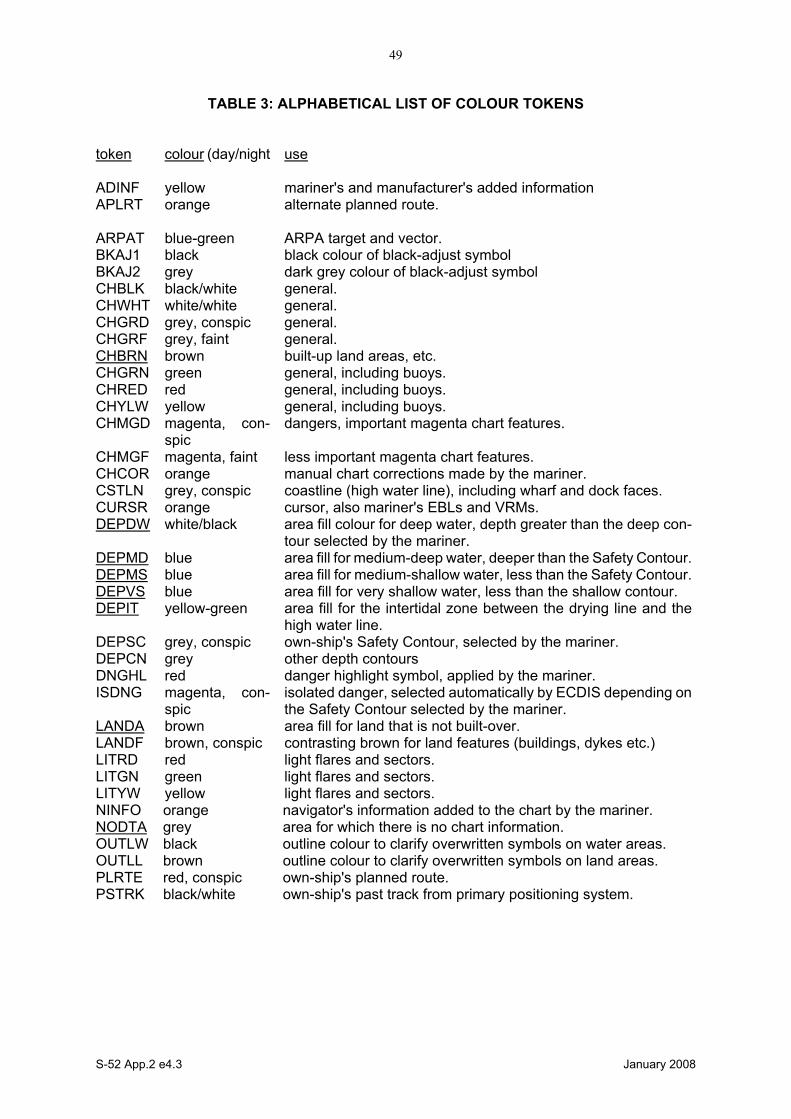
49
S-52 App.2 e4.3 January 2008
TABLE 3: ALPHABETICAL LIST OF COLOUR TOKENS token
colour (day/night use
ADINF yellow mariner's and manufacturer's added information APLRT orange alternate planned route. ARPAT blue-green ARPA target and vector. BKAJ1 black black colour of black-adjust symbol BKAJ2 grey dark grey colour of black-adjust symbol CHBLK black/white general. CHWHT white/white general. CHGRD grey, conspic general. CHGRF grey, faint general. CHBRN brown built-up land areas, etc. CHGRN green general, including buoys. CHRED red general, including buoys. CHYLW yellow general, including buoys. CHMGD magenta, con-
spic dangers, important magenta chart features.
CHMGF magenta, faint less important magenta chart features. CHCOR orange manual chart corrections made by the mariner. CSTLN grey, conspic coastline (high water line), including wharf and dock faces. CURSR orange cursor, also mariner's EBLs and VRMs. DEPDW white/black area fill colour for deep water, depth greater than the deep con-
tour selected by the mariner. DEPMD blue area fill for medium-deep water, deeper than the Safety Contour.DEPMS blue area fill for medium-shallow water, less than the Safety Contour.DEPVS blue area fill for very shallow water, less than the shallow contour. DEPIT yellow-green area fill for the intertidal zone between the drying line and the
high water line. DEPSC grey, conspic own-ship's Safety Contour, selected by the mariner. DEPCN grey other depth contours DNGHL red danger highlight symbol, applied by the mariner. ISDNG magenta, con-
spic isolated danger, selected automatically by ECDIS depending on the Safety Contour selected by the mariner.
LANDA brown area fill for land that is not built-over. LANDF brown, conspic contrasting brown for land features (buildings, dykes etc.) LITRD red light flares and sectors. LITGN green light flares and sectors. LITYW yellow light flares and sectors. NINFO orange navigator's information added to the chart by the mariner. NODTA grey area for which there is no chart information. OUTLW black outline colour to clarify overwritten symbols on water areas. OUTLL brown outline colour to clarify overwritten symbols on land areas. PLRTE red, conspic own-ship's planned route. PSTRK black/white own-ship's past track from primary positioning system.
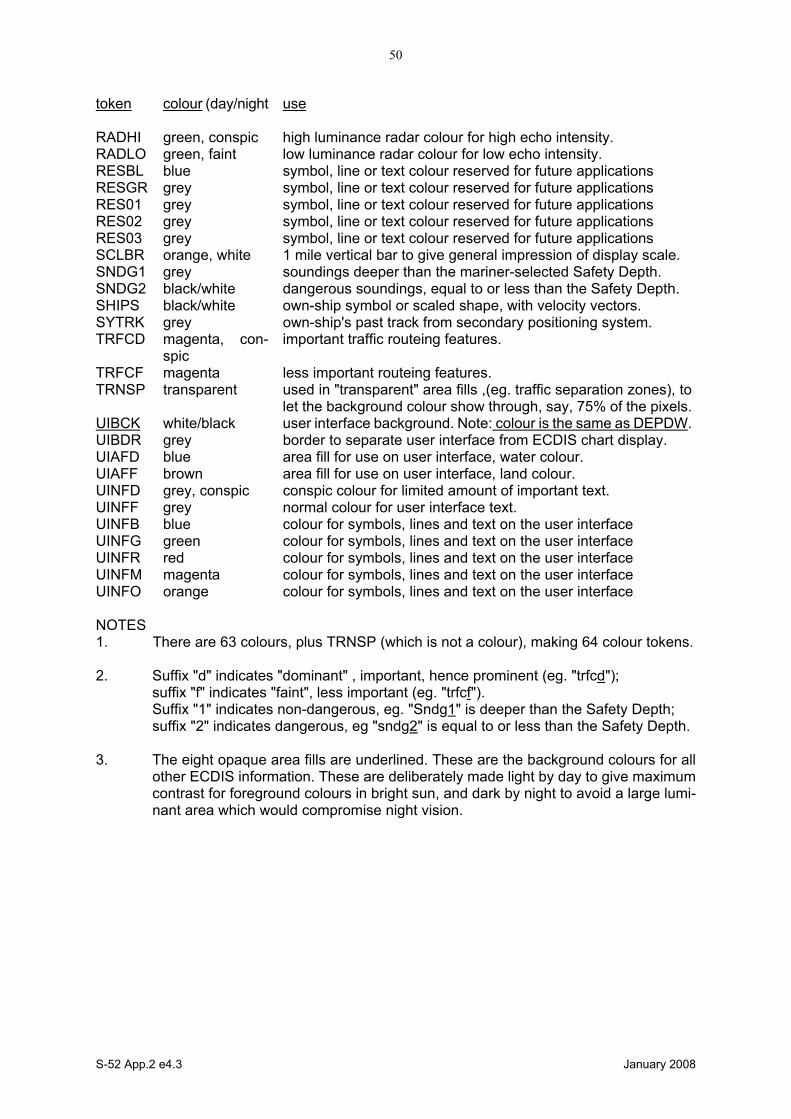
50
S-52 App.2 e4.3 January 2008
token
colour (day/night use
RADHI green, conspic high luminance radar colour for high echo intensity. RADLO green, faint low luminance radar colour for low echo intensity. RESBL blue symbol, line or text colour reserved for future applications RESGR grey symbol, line or text colour reserved for future applications RES01 grey symbol, line or text colour reserved for future applications RES02 grey symbol, line or text colour reserved for future applications RES03 grey symbol, line or text colour reserved for future applications SCLBR orange, white 1 mile vertical bar to give general impression of display scale. SNDG1 grey soundings deeper than the mariner-selected Safety Depth. SNDG2 black/white dangerous soundings, equal to or less than the Safety Depth. SHIPS black/white own-ship symbol or scaled shape, with velocity vectors. SYTRK grey own-ship's past track from secondary positioning system. TRFCD magenta, con-
spic important traffic routeing features.
TRFCF magenta less important routeing features. TRNSP transparent used in "transparent" area fills ,(eg. traffic separation zones), to
let the background colour show through, say, 75% of the pixels.UIBCK white/black user interface background. Note: colour is the same as DEPDW.UIBDR grey border to separate user interface from ECDIS chart display. UIAFD blue area fill for use on user interface, water colour. UIAFF brown area fill for use on user interface, land colour. UINFD grey, conspic conspic colour for limited amount of important text. UINFF grey normal colour for user interface text. UINFB blue colour for symbols, lines and text on the user interface UINFG green colour for symbols, lines and text on the user interface UINFR red colour for symbols, lines and text on the user interface UINFM magenta colour for symbols, lines and text on the user interface UINFO orange colour for symbols, lines and text on the user interface NOTES 1. There are 63 colours, plus TRNSP (which is not a colour), making 64 colour tokens. 2. Suffix "d" indicates "dominant" , important, hence prominent (eg. "trfcd");
suffix "f" indicates "faint", less important (eg. "trfcf"). Suffix "1" indicates non-dangerous, eg. "Sndg1" is deeper than the Safety Depth; suffix "2" indicates dangerous, eg "sndg2" is equal to or less than the Safety Depth.
3. The eight opaque area fills are underlined. These are the background colours for all
other ECDIS information. These are deliberately made light by day to give maximum contrast for foreground colours in bright sun, and dark by night to avoid a large lumi-nant area which would compromise night vision.
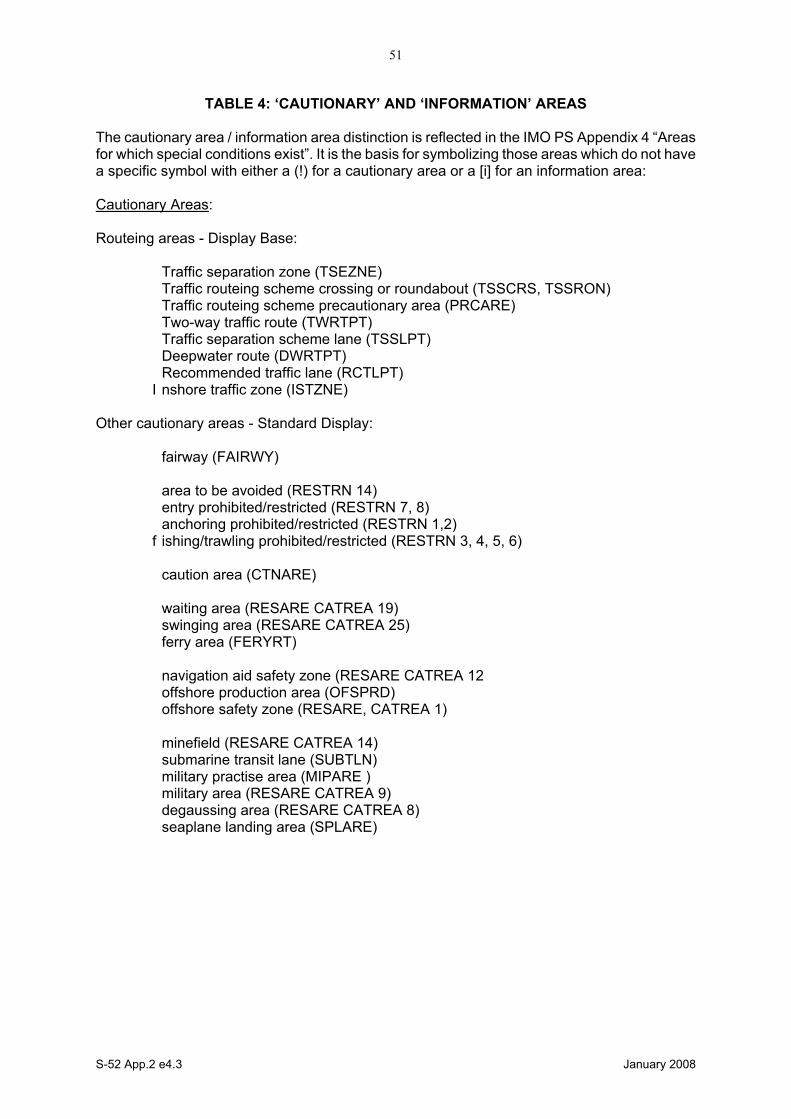
51
S-52 App.2 e4.3 January 2008
TABLE 4: ‘CAUTIONARY’ AND ‘INFORMATION’ AREAS The cautionary area / information area distinction is reflected in the IMO PS Appendix 4 “Areas for which special conditions exist”. It is the basis for symbolizing those areas which do not have a specific symbol with either a (!) for a cautionary area or a [i] for an information area: Cautionary Areas: Routeing areas - Display Base:
Traffic separation zone (TSEZNE) Traffic routeing scheme crossing or roundabout (TSSCRS, TSSRON) Traffic routeing scheme precautionary area (PRCARE) Two-way traffic route (TWRTPT) Traffic separation scheme lane (TSSLPT) Deepwater route (DWRTPT) Recommended traffic lane (RCTLPT) I nshore traffic zone (ISTZNE)
Other cautionary areas - Standard Display:
fairway (FAIRWY)
area to be avoided (RESTRN 14) entry prohibited/restricted (RESTRN 7, 8) anchoring prohibited/restricted (RESTRN 1,2) f ishing/trawling prohibited/restricted (RESTRN 3, 4, 5, 6)
caution area (CTNARE)
waiting area (RESARE CATREA 19) swinging area (RESARE CATREA 25) ferry area (FERYRT)
navigation aid safety zone (RESARE CATREA 12 offshore production area (OFSPRD) offshore safety zone (RESARE, CATREA 1)
minefield (RESARE CATREA 14) submarine transit lane (SUBTLN) military practise area (MIPARE ) military area (RESARE CATREA 9) degaussing area (RESARE CATREA 8) seaplane landing area (SPLARE)

S-52 App.2 e4.3 January 2008
50
Information areas - Standard Display:
anchorage area (ACHARE) anchor berth (ACHBRT)
dumping ground (DMPGRD)
fishing ground (FSHGRD) pipeline area (PIPARE) cable area (CBLARE)
cargo transhipment area (CTSARE) incineration area (ICNARE)
specially protected areas - sanctuaries etc (RESARE, CATREA 4,5,6,7,10, 18, 20, 22, 23)
no wake area (RESARE CATREA 24)
For further details, see conditional symbology procedures RESAREnn and RESTRNnn in the Presentation Library , section 12.

S-52 App.2 e4.3 January 2008
51
ANNEX A
IHO ECDIS PRESENTATION LIBRARY The Presentation Library is published separately. See figure 1 for details.
In summary the Presentation Library implements the display specifications in S-52 Appendix 2 by decoding and symbolising the SENC. It contains: 1. the ECDIS symbol library, including the IEC navigation symbols, 2. the ECDIS colour tables for day, dusk and night viewing, 3. look-up tables with symbology instructions linking SENC objects to the appro-
priate colour and symbol and giving their IMO category, draw priority, priority over radar, and suggested viewing group,
4. conditional symbology procedures for: - cases where symbolising depends on circumstances such as the mariner's
choice of safety contour, - cases where symbolizing is too complex to be defined in a direct look-up
table, 5. symbolizing instructions for special cases which are not handled by 3. or 4.
above, such as north arrow and scalebar, manual chart corrections, etc., 6. description of the symbology instructions, 7. mariners' navigational objects, specified in the same format as chart objects
for convenience in processing by the ECDIS, 8. supplementary features such as the ECDIS chart 1, colour differentiation test
diagram, colour calibration software. The official Presentation Library is issued as word-processed files on the S-52 App.2 CD for which there is a significant charge. A digital version is also available for edition 3.4; updating this digital version will depend on a volunteer provider.
__________

S-52 App.2 e4.3 January 2008
52
Page intentionally left blank
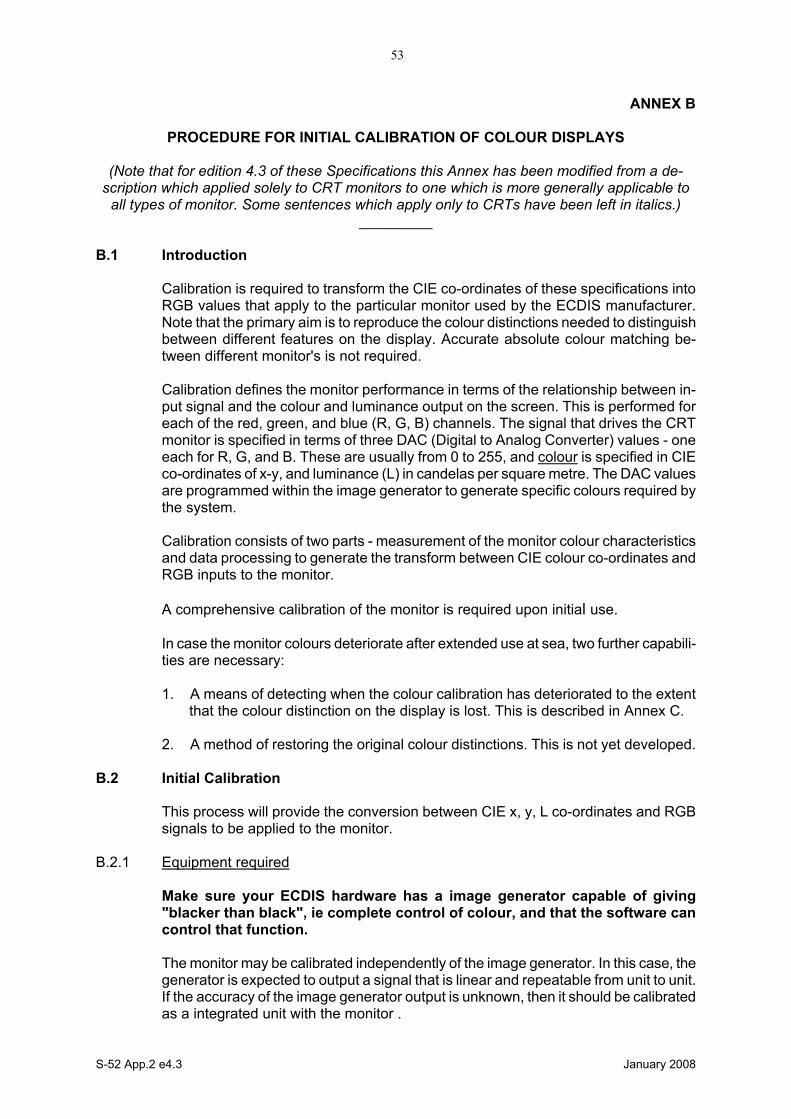
S-52 App.2 e4.3 January 2008
53
ANNEX B
PROCEDURE FOR INITIAL CALIBRATION OF COLOUR DISPLAYS
(Note that for edition 4.3 of these Specifications this Annex has been modified from a de-scription which applied solely to CRT monitors to one which is more generally applicable to
all types of monitor. Some sentences which apply only to CRTs have been left in italics.) _________
B.1 Introduction
Calibration is required to transform the CIE co-ordinates of these specifications into RGB values that apply to the particular monitor used by the ECDIS manufacturer. Note that the primary aim is to reproduce the colour distinctions needed to distinguish between different features on the display. Accurate absolute colour matching be-tween different monitor's is not required.
Calibration defines the monitor performance in terms of the relationship between in-put signal and the colour and luminance output on the screen. This is performed for each of the red, green, and blue (R, G, B) channels. The signal that drives the CRT monitor is specified in terms of three DAC (Digital to Analog Converter) values - one each for R, G, and B. These are usually from 0 to 255, and colour is specified in CIE co-ordinates of x-y, and luminance (L) in candelas per square metre. The DAC values are programmed within the image generator to generate specific colours required by the system.
Calibration consists of two parts - measurement of the monitor colour characteristics and data processing to generate the transform between CIE colour co-ordinates and RGB inputs to the monitor.
A comprehensive calibration of the monitor is required upon initial use.
In case the monitor colours deteriorate after extended use at sea, two further capabili-ties are necessary:
1. A means of detecting when the colour calibration has deteriorated to the extent
that the colour distinction on the display is lost. This is described in Annex C. 2. A method of restoring the original colour distinctions. This is not yet developed.
B.2 Initial Calibration
This process will provide the conversion between CIE x, y, L co-ordinates and RGB signals to be applied to the monitor.
B.2.1 Equipment required
Make sure your ECDIS hardware has a image generator capable of giving "blacker than black", ie complete control of colour, and that the software can control that function.
The monitor may be calibrated independently of the image generator. In this case, the generator is expected to output a signal that is linear and repeatable from unit to unit. If the accuracy of the image generator output is unknown, then it should be calibrated as a integrated unit with the monitor .
S-52 App.2 e4.3 January 2008
54
The equipment required for the process is listed below: - Monitor to be calibrated. It is important to note that the monitor to be calibrated
must be capable of a white screen (D-6500) of at least 85 cd/m², or the calibra-tion process will fail.
- Image generator to be used with the monitor.
- Photometer. The photometer must have a luminance accuracy of better than +/-
5% and a sensitivity of 1.0 x 10⁻⁴ candelas per square metre. The photometer is one that must be intended for use in measurement of the selected monitor, and should have col-ourimeter capability. The required performance can be achieved by a Graseby model 370 "Optometer" with a model 221 radiometric head used in conjunction with a Minolta CS100 Colorimeter for measuring phosphor co-ordinates and cali-brating the Graseby radiometric head for each phosphor.
The Minolta CS 100 must be calibrated to "Illuminant A".
- Software to generate the required colours for use during the calibration. This will
be a program that allows the user to adjust the colour DAC values from 0 to 255 in each of Red, Green and Blue.
- Software to calculate the transformation between RGB and CIE x, y, L values.
(This software is part of Annex A in the Presentation Library.) B.2.2 Calibration set-up
Important - The calibration procedure is very sensitive to stray light, and inaccurate results will occur if special care is not taken. All measurements should be taken in the dark, and all stray light and sources of reflections must be removed from the meas-urement area. The measurements are best taken with light absorbers in place around the monitor and measurement apparatus. This can be created by making a matte black cardboard tunnel around the monitor and colourimeter. Care must be taken by the operator that his clothing does not reflect light back into the measurement area. The instrument that is measuring the screen of the monitor must point at the same lo-cation on the screen for all measurements, otherwise errors will result.
B.2.3 Monitor set-up for calibration
The monitor must be set up properly before calibration. The following are required for accurate calibration:
B.2.3.1 Burn-in
To age the monitor sufficiently, a burn-in of 48 hours is required with a 50% lumi-nance white picture covering the entire screen.
B.2.3.2 Colour temperature tracking
The monitor should not show any change in colour on white signals, when they go from dark gray to bright white. This can be best checked out by displaying a gray scale of about 8 steps from dark gray to white. If the colour of the gray changes or shows a drift to pink, blue, or green, as the level changes, then the monitor is improp-erly adjusted and should not be calibrated. This step is a qualitative assessment, and
S-52 App.2 e4.3 January 2008
55
requires some judgment from the tester. B.2.3.3 Setting the Controls The controls are used to adjust the black level of the monitor. This is the point where
the monitor screen is seen as black, and this setting will create the blackest black that can be displayed. After the control is set, it must be locked in place. Any further ad-justment of the black level setting after calibration invalidates the process.
In use, the black level controls may either be locked or accessible to the user. If they
are accessible, they must have a detent type of setting where it is properly set up so that the user can find that position again after the control has been moved. This will ensure that the proper colour settings can be maintained.
The process for correctly setting the controls is as follows: with the monitor in a dark
room, and with the monitor turned on and warmed up to the manufacturer's specifica-tion, drive the monitor with a black signal (0, 0, 0). Measure the Luminance of this area. It should be less than 0.52 candelas per square metre (cd/m²). Lock the appro-priate controls for the calibration process.
The controls should be adjusted to achieve maximum required output level at full
white signal. Using the photometer and a peak white signal, (DAC values of 255, 255, 255) adjust the controls for a luminance of at least 80 cd/m² (note that depending of the characteristics of monitor you may need 85 cd/m² or even higher values to get all colours inside the reproducible range) . Lock appropriate controls for the duration of the calibration. (Note that the controls may be available for the mariner's adjustment during use of the ECDIS system.)
At this point, the monitor is set up and ready for calibration. B.3 Data Collection The data collection consists of two parts: measuring the CIE chromaticity co-
ordinates of the principal colour producing elements and measuring the gamma func-tion of the principal colour producing elements.
B.3.1 Principal colour producing element Chromaticities The principal colour producing element chromaticities can be measured directly by
the photometer (e.g. Minolta CS 100) as follows: .1 Put a square of pure red on the screen (DAC values of (255,0,0). This square
should be as large as possible, covering at least ten times the sampling area of the photometer, and preferably covering at least 80% of the screen.
.2 With the photometer normal to the screen and pointing at the centre, with light
shielding in place and the room darkened, measure the red chromaticity directly according to the colourimeter manufacturer's instructions.
.3 Repeat steps 1 and 2 for green and blue, using DAC values of (0,255,0) and
(0,0,255) respectively. Principal colour producing element chromaticities may be available from the monitor
vendor. These data may be used instead of measuring the chromaticities directly, as long as the data takes into account the effect of the monitor faceplate.
S-52 App.2 e4.3 January 2008
56
B.3.2 Measurement of the Gamma of the principal colour producing elements B.3.2.1 The principal colour producing elements have typically a non linear transfer charac-
teristic describing the relationship between the R, G, B input values and the light out-put on the face of the monitor. This is called the Gamma Function or Gamma of the monitor. This transfer characteristic is used to select the proper mixing of colours to create the correct combined colour on the screen.
B.3.2.2 The Gamma is measured for each principal colour producing element separately. A
test square in the centre of the screen of size at least 5 cm by 5 cm (but not exceed-ing 25% of the area of the screen) should be used for this calibration. The screen outside the test area should remain black. Use a sensitive radiometer for this meas-urement (e.g. Graseby 370). Set up the radiometer head contacting the centre of the screen. Ensure that the instrument is always pointed at the same part of the screen for the entire series of measurements (red, green and blue). Put shields in place to block any stray light and darken the room to black.
B.3.2.3 Start with the red colour. Drive the monitor with DAC values starting at (0, 0, 0) and
increasing to (255, 0, 0). Increase in increments of 8 for the low values (below 100) and in increments of 16 for the higher values. (There is no harm in using a smaller in-crement if desired.) Record the light output in candelas per square metre (if available) against each DAC value. Otherwise, (for example in the case of the Graseby with ra-diometric head) record the output reading in amperes. Then, when the maximum DAC value is achieved, use a calibrated photometer/colorimeter (e.g. Minolta CS 100) to take a luminance reading. This luminance reading is then used to develop a conversion factor to convert from the radiometer's ampere reading to candelas per square metre.
B.3.2.4 Repeat the measurement sequence for each of the other two colours. Repeat the
photometer calibration for each of the other colours as well. B.3.2.5 To prepare the radiometer output data for processing, convert it from nano amperes
to candelas per square metre using the calibration constants derived above for each phosphor colour.
B.4 Calculations to achieve Correct Colours
The colours for ECDIS are specified in CIE x, y, L co-ordinates, and the system that outputs the colours to the monitor uses RGB values. A calculation is performed to compute the correct RGB values to yield the correct colour (in CIE x, y, L) on the screen.
At the end of the measurement sequence, there are two sets of data collected - a set of RGB co-ordinates for the principal colour elements of the monitor {(xr yr), (xg yg), (xb yb)} and a set of gamma function data in the form of (DAC Value, L out) for each of red, green and blue. The data should consist of about 23 sets of numbers for each colour.
The calculation routine uses this data to calculate the correct RGB values that corre-spond to the desired x, y, L co-ordinate description.
The calculation details are handled by a computer program that is part of the Presen-tation Library. This procedure described here details the user input and output proce-dure for using the program. In addition, the mathematical basis for the calculations is explained in section B.6.
S-52 App.2 e4.3 January 2008
57
B.4.1 Calibration computations using the CIE2RGB software in the Presentation Library
A utility exists in the Presentation Library called CIE2RGB which will take a series of CIE colour co-ordinates and luminance values and convert them to RGB DAC values for use in ECDIS, according to the specific calibration characteristics of the monitor used.
Instructions for using this utility are appended to this Annex in section B.7.
B.5 Calibration Verification This section discusses the instrumental verification of the calibration of the colours in the earlier PL edition 3.2 bright sun (DAY_BRIGHT) colour table. The procedure ap-plies equally to the edition 3.3 "DAY" table. Basically, it is carried out by measuring blocks of known colour and comparing their co-ordinates to the standard colours. All of the distinct colours of the bright sun colour table should be verified instrumentally, however certain colour pairs are exempt from the comparison as explained in B 5.5. The procedure for verifying the remaining colour tables visually is described in B 5.6.
Note: Only limited experience has been gained with calibration/verification schemes for LCDs. Based on this, the procedure of calibrating/verifying all three colour tables of an LCD instrumentally by the current method used for CRTs on the Day table alone, together with remote control of the calibration settings, should be used for LCDs for the interim (2004).
There are no inexpensive instruments available that will directly measure and read out x, y, and L co-ordinates over the entire range of specified colours. (It is the low luminance colours that are a problem.) With a mathematical routine, colour co-ordinate data can be derived from the Graseby 370 radiometer that is used for the basic monitor calibration. This has the advantage of being accurate over a very wide range of luminances.
B.5.1 Theory of measurement
Mathematical relationships exist between red, green, and blue luminance compo-nents of a colour as seen on a monitor and its x, y, and L co-ordinates. (This relation-ship is developed in B.6.2). This requires that the chromaticity of the principal colour producing elements is known, and that the luminance of the red, green, and blue components of each measured colour are known. Using this information, and the mathematical relationship, it is possible to derive the colour co-ordinates of any on-screen colour.
The actual measurements are made by measuring individually the red, green and blue colour luminance components of each colour to be measured. These are then computed to give the colour co-ordinates. Note that each colour sample must be dis-played three times - once each with only its red, green, and blue components.
B.5.2 Equipment required
This testing requires that the proper signals be generated and that the colour co-ordinates be measured. The following equipment is required:

S-52 App.2 e4.3 January 2008
58
- Monitor to be verified, connected to image generation system. - Software in image system to create all the colours of each colour table. This
must allow the red green and blue components to be displayed separately for each colour. These colours should be displayed in a rectangle of about 5 cm square, in the centre of the screen.
- Luminance meter such as the Graseby 370 to measure the luminance of the red, green, and blue components of the test colours.
- Colorimeter, such as Minolta CS 100 to measure the colour co-ordinates of the phosphor on the test CRT. This should be calibrated to "Illuminant A".
- Software utility to perform the calculations to verify the calibration integrity. - Calibration factors for each phosphor to convert Graseby readings from amperes
to candelas per metre squared (cd/m²). (See section B.3.2).
B.5.3 Set-up for measurement
Important - These measurements are very sensitive to stray light entering the ex-perimental area, and inaccurate results will occur if special care is not taken. All measurements should be taken with the measurement area properly shielded against stray light. The measurements are best taken with light absorbers in place around the monitor and measurement apparatus. A black felt drape over the measurement area works well. Care must be taken by the operator that his clothing does not reflect light back into the measurement area.
B.5.3.1 Monitor set-up
The monitor must be adjusted to its calibration conditions. (See section B.2.3). This means the controls are set to its calibration position i.e. black (CHBLK) on the screen is 0.52 cd/m² or below and a white square (CHWHT) on the screen has a luminance of 80 cd/m² (note that if the tolerance of luminance is 20%, then the acceptable range of CHWHT is from 64 to 96 cd/m²). This ensures that the monitor is set up as closely as possible to its factory settings, and the colours will be as close to calibrated values as possible.
B.5.3.2 Principal colour producing element chromaticity measurement
The Chromaticity (colour co-ordinates) of the principal colour producing elements is measured using the procedure outlined in B.3.1.
B.5.3.3 Luminance/radiance meter set-up
The luminance or radiance meter should be secured so that it measures the same part of the screen for all measurements. A suction cup with hanging bracket works well. The measurement area of the luminance meter should be well within the square of the test colour.
B.5.4 Measurement procedure
This procedure is well suited for automation. Under software control, the test patterns can be generated, and the output of the luminance meter recorder, and colour x, y, and L data calculated:
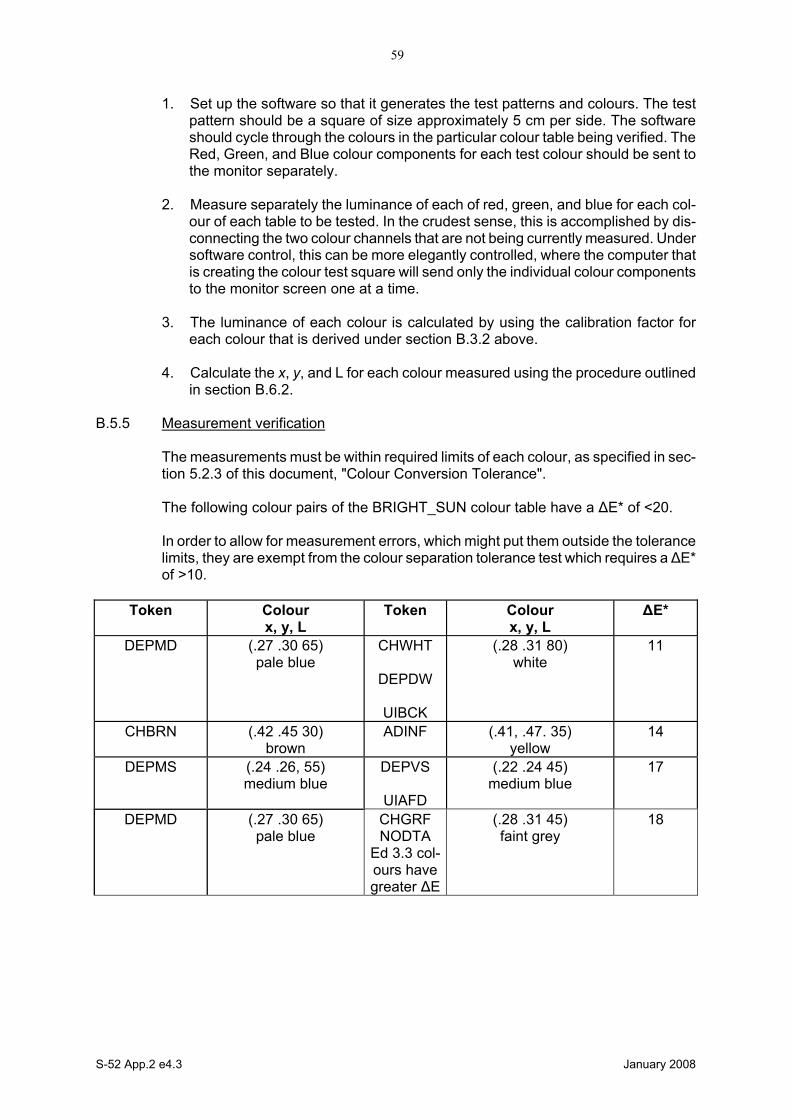
S-52 App.2 e4.3 January 2008
59
1. Set up the software so that it generates the test patterns and colours. The test pattern should be a square of size approximately 5 cm per side. The software should cycle through the colours in the particular colour table being verified. The Red, Green, and Blue colour components for each test colour should be sent to the monitor separately.
2. Measure separately the luminance of each of red, green, and blue for each col-
our of each table to be tested. In the crudest sense, this is accomplished by dis-connecting the two colour channels that are not being currently measured. Under software control, this can be more elegantly controlled, where the computer that is creating the colour test square will send only the individual colour components to the monitor screen one at a time.
3. The luminance of each colour is calculated by using the calibration factor for
each colour that is derived under section B.3.2 above.
4. Calculate the x, y, and L for each colour measured using the procedure outlined in section B.6.2.
B.5.5 Measurement verification
The measurements must be within required limits of each colour, as specified in sec-tion 5.2.3 of this document, "Colour Conversion Tolerance".
The following colour pairs of the BRIGHT_SUN colour table have a ∆E* of <20.
In order to allow for measurement errors, which might put them outside the tolerance limits, they are exempt from the colour separation tolerance test which requires a ∆E* of >10.
Token
Colour x, y, L
Token
Colour x, y, L
∆E*
DEPMD
(.27 .30 65) pale blue
CHWHT
DEPDW
UIBCK
(.28 .31 80)
white
11
CHBRN
(.42 .45 30)
brown
ADINF
(.41, .47. 35)
yellow
14
DEPMS
(.24 .26, 55) medium blue
DEPVS
UIAFD
(.22 .24 45)
medium blue
17
DEPMD
(.27 .30 65) pale blue
CHGRF NODTA
Ed 3.3 col-ours have greater ∆E
(.28 .31 45) faint grey
18

S-52 App.2 e4.3 January 2008
60
Token
Colour x, y, L
Token
Colour x, y, L
∆E*
CHGRF
NODTA
(.28 .31 45) faint grey
CHGRD
SNDG1
DEPCN
SYTRK
RESGY
UIBDR
UINFF
(.28 .31 25)
grey
18
Table of Colour-pairs that are exempt from the Colour Separation Tolerance Test
(Note: this table applied to the "Bright Sun" colour table of edition 3.2. However, the colours of the "Day" table of edition 3.3 are very similar, and except as noted in the table above, the same exemptions apply)
Note that these colours have been checked out as discriminable as used on ECDIS by the IHO ECDIS Presentation Library, but they would not always be discriminable if used in other combinations than those used in ECDIS.
A utility exists in the Presentation Library called CHECKXYL which will provide a check of the total calibration by comparing measurements of actual colours and veri-fying that they are within specification. The instructions for using this routine are in section B.7.1
The data gathered from the measurement is loaded into this routine, and the results are output. The output of this routine should be compared with the bounds specified.
B.5.6 Visual verification of the remaining colour tables
For LCD displays the instrumental test should be applied to all three colour tables (see first paragraph of B.5).
For CRTs the dusk and night tables should be tested as follows:
.1 The person conducting the test should have passed the full, 36-plate, Ishihara
colour blindness test taken under a Standard Lamp or in natural sunlight. The tester should adapt to night viewing for 10 minutes before checking the night dis-play.
.2 The controls should be set to their calibrated settings.
.3 While the display is off, adjust the light level reflected from white paper posi-
tioned on the display screen to the following values:

S-52 App.2 e4.3 January 2008
61
table light level day-black background 200 cd/m² +/- 50% dusk 10 cd/m² +/- 50% night darkness (ECDIS display predominant light)
Preferably use natural daylight for the daytime and dusk tables.
.4 Under each of the above conditions display the appropriate Colour Differentiation
Test Diagram** described in S-52 Appendix 2, Annex A, section 19.4 for the above tables. Select each table in turn and ensure that:
- each foreground stripe is clearly distinguished from its background;
- the foreground stripes representing yellow, orange, magenta, green, blue and
grey may be clearly identified.
** Note that the Colour Differentiation Test Diagram supplied as pseudo S-57 files on the CD carrying the PL must be used for this test, because only that source will reproduce the colours stored in the ECDIS for use in drawing the chart dis-play. Any other source for the Colour Test Diagram which does not use the same colours that are used in drawing the display will not provide a valid test.
B.6 Mathematical Model used in Calibration
Typically colour on a monitor screen is the specific mixture between red, green and blue light. The specific colour is a function of the luminances of the red, green, and blue principal colour producing elements and the colour of each of the principal colour producing elements. The mathematical relationships are developed elsewhere, so the relationships will be given here and assumed correct. The required luminances for the guns to achieve a desired colour are given in matrix notation as follows:
=
−
ZYX
ALLL
b
g
r1
where: Lr , Lb , and Lg are the luminance outputs of the colour producing elements at the screen and A-1 is the inverse of the matrix A for the colour co-ordinates of the colour producing elements, given by:
=
b
b
g
g
r
r
b
b
g
g
r
r
yz
yz
yz
yx
yx
yx
A 111
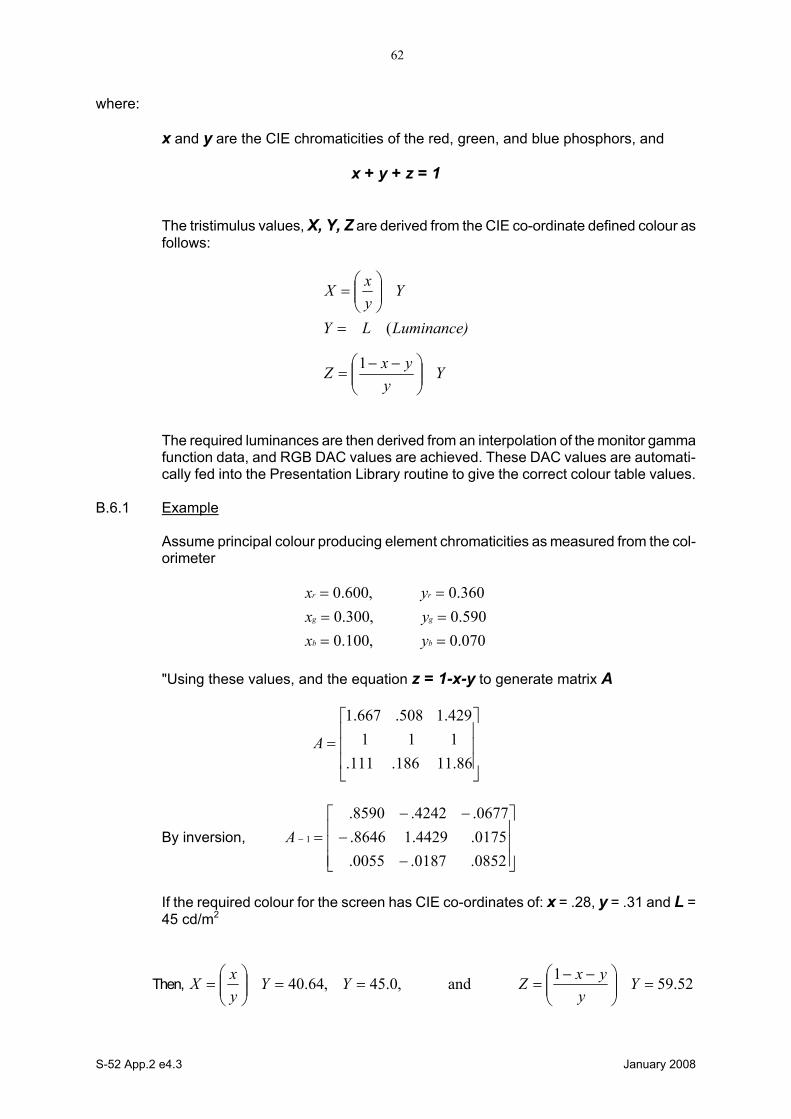
S-52 App.2 e4.3 January 2008
62
where:
x and y are the CIE chromaticities of the red, green, and blue phosphors, and
x + y + z = 1
The tristimulus values, X, Y, Z are derived from the CIE co-ordinate defined colour as follows:
Yy
yxZ
Luminance)LY
YyxX
−−=
=
=
1
(
The required luminances are then derived from an interpolation of the monitor gamma function data, and RGB DAC values are achieved. These DAC values are automati-cally fed into the Presentation Library routine to give the correct colour table values.
B.6.1 Example Assume principal colour producing element chromaticities as measured from the col-orimeter
070.0,100.0590.0,300.0360.0,600.0
======
bb
gg
rr
yxyxyx
"Using these values, and the equation z = 1-x-y to generate matrix A
=86.11186.111.
111429.1508.667.1
A
By inversion,
−−
−−=−
0852.0187.0055.0175.4429.18646.0677.4242.8590.
1A
If the required colour for the screen has CIE co-ordinates of: x = .28, y = .31 and L = 45 cd/m2
Then, 52.591and,0.45,64.40 =
−−===
= Y
yyxZYY
yxX
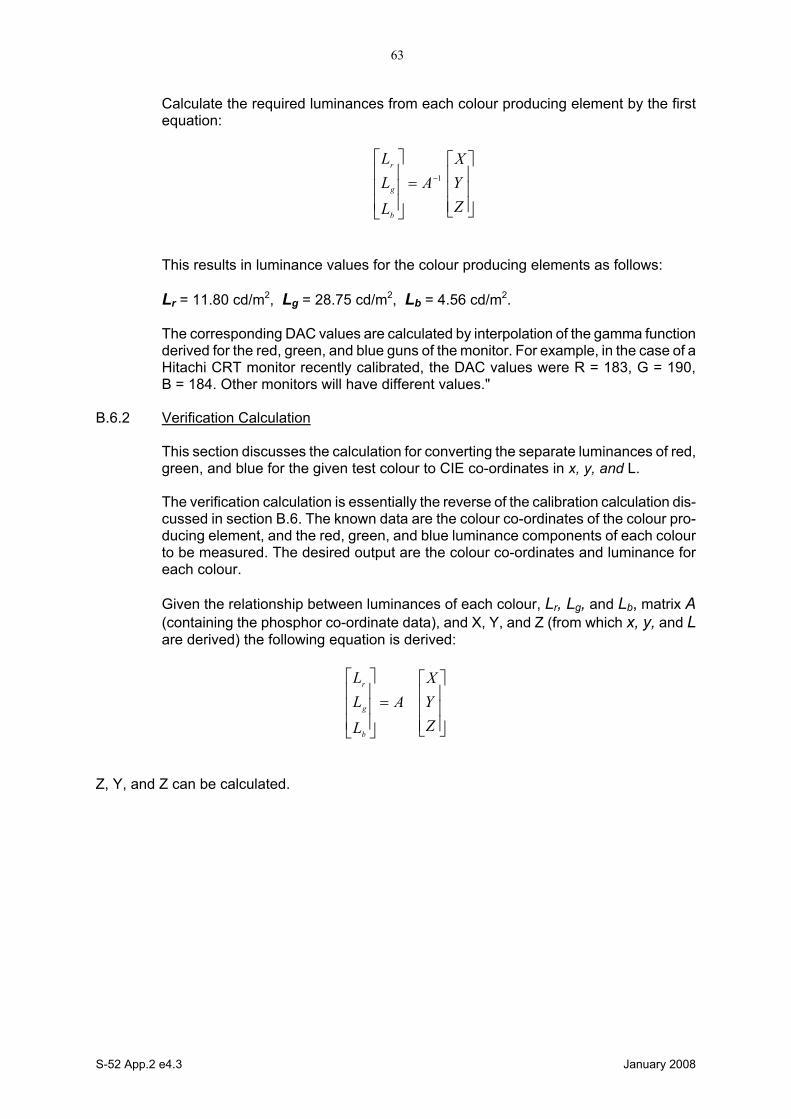
S-52 App.2 e4.3 January 2008
63
Calculate the required luminances from each colour producing element by the first equation:
=
−
ZYX
ALLL
b
g
r1
This results in luminance values for the colour producing elements as follows:
Lr = 11.80 cd/m2, Lg = 28.75 cd/m2, Lb = 4.56 cd/m2.
The corresponding DAC values are calculated by interpolation of the gamma function derived for the red, green, and blue guns of the monitor. For example, in the case of a Hitachi CRT monitor recently calibrated, the DAC values were R = 183, G = 190, B = 184. Other monitors will have different values."
B.6.2 Verification Calculation
This section discusses the calculation for converting the separate luminances of red, green, and blue for the given test colour to CIE co-ordinates in x, y, and L.
The verification calculation is essentially the reverse of the calibration calculation dis-cussed in section B.6. The known data are the colour co-ordinates of the colour pro-ducing element, and the red, green, and blue luminance components of each colour to be measured. The desired output are the colour co-ordinates and luminance for each colour.
Given the relationship between luminances of each colour, Lr, Lg, and Lb, matrix A (containing the phosphor co-ordinate data), and X, Y, and Z (from which x, y, and L are derived) the following equation is derived:
=
ZYX
ALLL
b
g
r
Z, Y, and Z can be calculated.
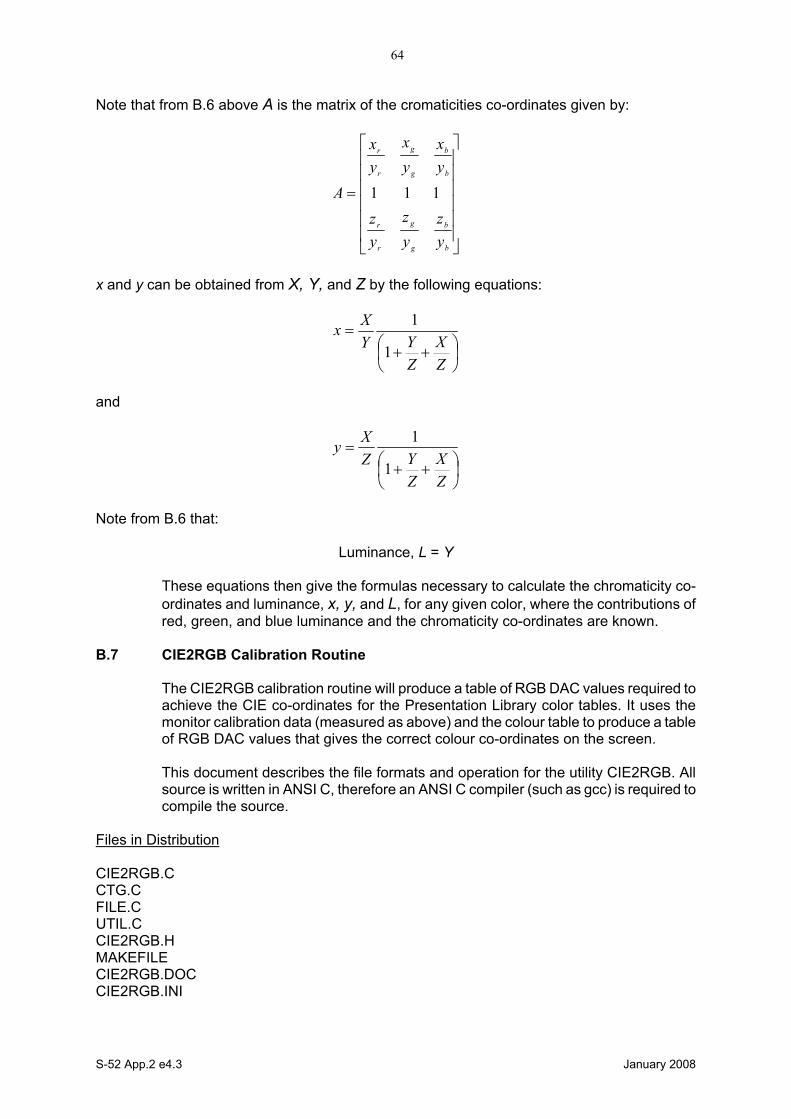
S-52 App.2 e4.3 January 2008
64
Note that from B.6 above A is the matrix of the cromaticities co-ordinates given by:
=
b
b
g
g
r
r
b
b
g
g
r
r
yz
yz
yz
yx
yx
yx
A 111
x and y can be obtained from X, Y, and Z by the following equations:
++
=
ZX
ZYY
Xx1
1
and
++
=
ZX
ZYZ
Xy1
1
Note from B.6 that:
Luminance, L = Y
These equations then give the formulas necessary to calculate the chromaticity co-ordinates and luminance, x, y, and L, for any given color, where the contributions of red, green, and blue luminance and the chromaticity co-ordinates are known.
B.7 CIE2RGB Calibration Routine The CIE2RGB calibration routine will produce a table of RGB DAC values required to
achieve the CIE co-ordinates for the Presentation Library color tables. It uses the monitor calibration data (measured as above) and the colour table to produce a table of RGB DAC values that gives the correct colour co-ordinates on the screen.
This document describes the file formats and operation for the utility CIE2RGB. All
source is written in ANSI C, therefore an ANSI C compiler (such as gcc) is required to compile the source.
Files in Distribution CIE2RGB.C CTG.C FILE.C UTIL.C CIE2RGB.H MAKEFILE CIE2RGB.DOC CIE2RGB.INI
S-52 App.2 e4.3 January 2008
65
Command Line Arguments The command line format for CIE2RGB is as follows: CIE2RGB source_file colour_table output_file config_file where: source_file = the input colour table file from the Presentation Library. It is in ASCII format (like the .dai file, provided in the digital PL files). colour_table = one of the following: DAY, DUSK, NIGHT This is the name of the table being processed. It corresponds to the data in the source file output_file = the generated file which contains the desired RGB values for each colour
in the colour table. A check on the colour tolerance (∆E*) is calculated in the routine, and out or tolerance values are flagged in the output file. (This is a check of the monitor's capability to produce the colour as opposed to a check of the actual colour value achieved. Actual colour measurements must be made to check real tolerances.) Care must be taken in choosing the filename for the output file. If a file by this name already exists, the new file will be renamed to its current name, with the last character in the file-name changed to a 0. For example, if the output_file argument was "OUT.LIB", and this file already existed, the new file would be renamed to "OUT.LI0" before writing the new colour table information.
config_file = a configuration file which contains the monitor's characteristics, formatting
strings, gamma function values, etc. This file is described below. If this command line argument is not specified, the default file is CIE2RGB.INI, which is a 'dummy' file with data for a 'typical' monitor. If this command line argument is not used, then the default values will be used. It should be noted here that the output colours from this calibration will be accurate only if the monitor is calibrated and the calibration data is used for the calcula-tions.
Configuration File Format is in standard Microsoft Windows initialization file format.
This file is divided, for example, CIE2RGB's configuration file has a heading called "General" under which key values such as units, co-ordinate system, formatting strings, etc., are stored.
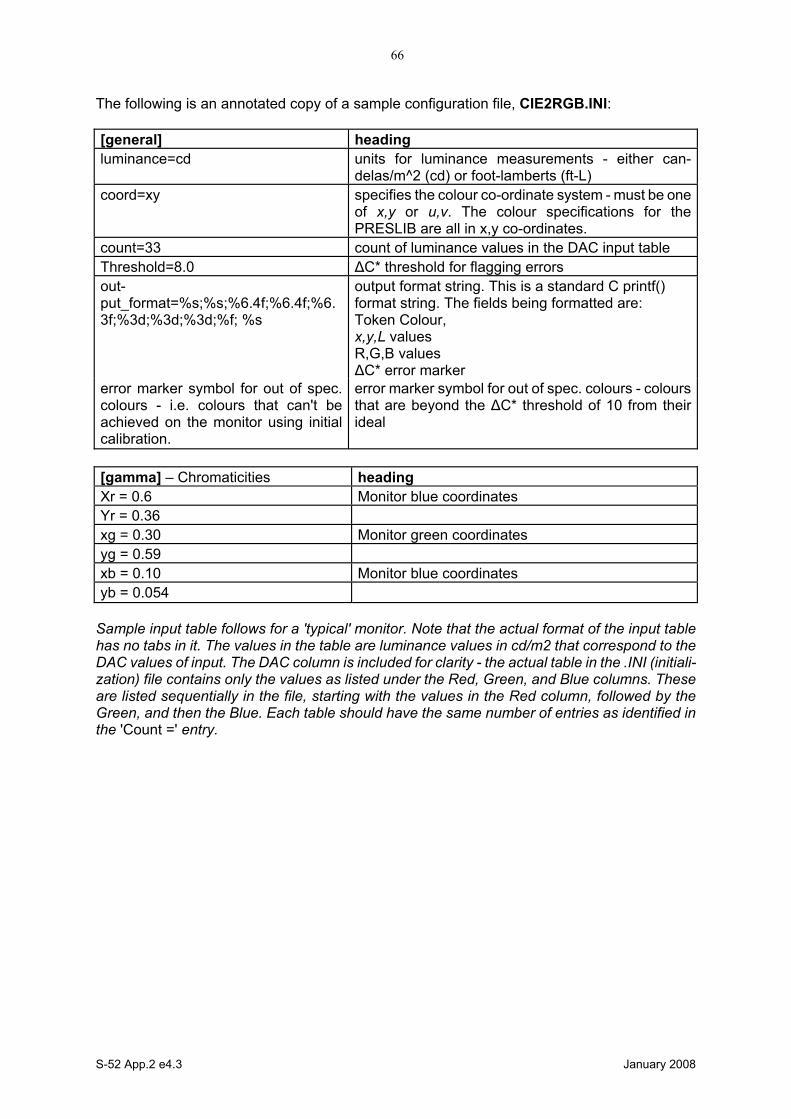
S-52 App.2 e4.3 January 2008
66
The following is an annotated copy of a sample configuration file, CIE2RGB.INI: [general]
heading
luminance=cd units for luminance measurements - either can-delas/m^2 (cd) or foot-lamberts (ft-L)
coord=xy specifies the colour co-ordinate system - must be one of x,y or u,v. The colour specifications for the PRESLIB are all in x,y co-ordinates.
count=33 count of luminance values in the DAC input table
Threshold=8.0 ∆C* threshold for flagging errors
out-put_format=%s;%s;%6.4f;%6.4f;%6. 3f;%3d;%3d;%3d;%f; %s
output format string. This is a standard C printf() format string. The fields being formatted are: Token Colour, x,y,L values R,G,B values ∆C* error marker
error marker symbol for out of spec. colours - i.e. colours that can't be achieved on the monitor using initial calibration.
error marker symbol for out of spec. colours - colours that are beyond the ∆C* threshold of 10 from their ideal
[gamma] – Chromaticities
heading
Xr = 0.6 Monitor blue coordinates
Yr = 0.36
xg = 0.30 Monitor green coordinates
yg = 0.59
xb = 0.10 Monitor blue coordinates
yb = 0.054
Sample input table follows for a 'typical' monitor. Note that the actual format of the input table has no tabs in it. The values in the table are luminance values in cd/m2 that correspond to the DAC values of input. The DAC column is included for clarity - the actual table in the .INI (initiali-zation) file contains only the values as listed under the Red, Green, and Blue columns. These are listed sequentially in the file, starting with the values in the Red column, followed by the Green, and then the Blue. Each table should have the same number of entries as identified in the 'Count =' entry.
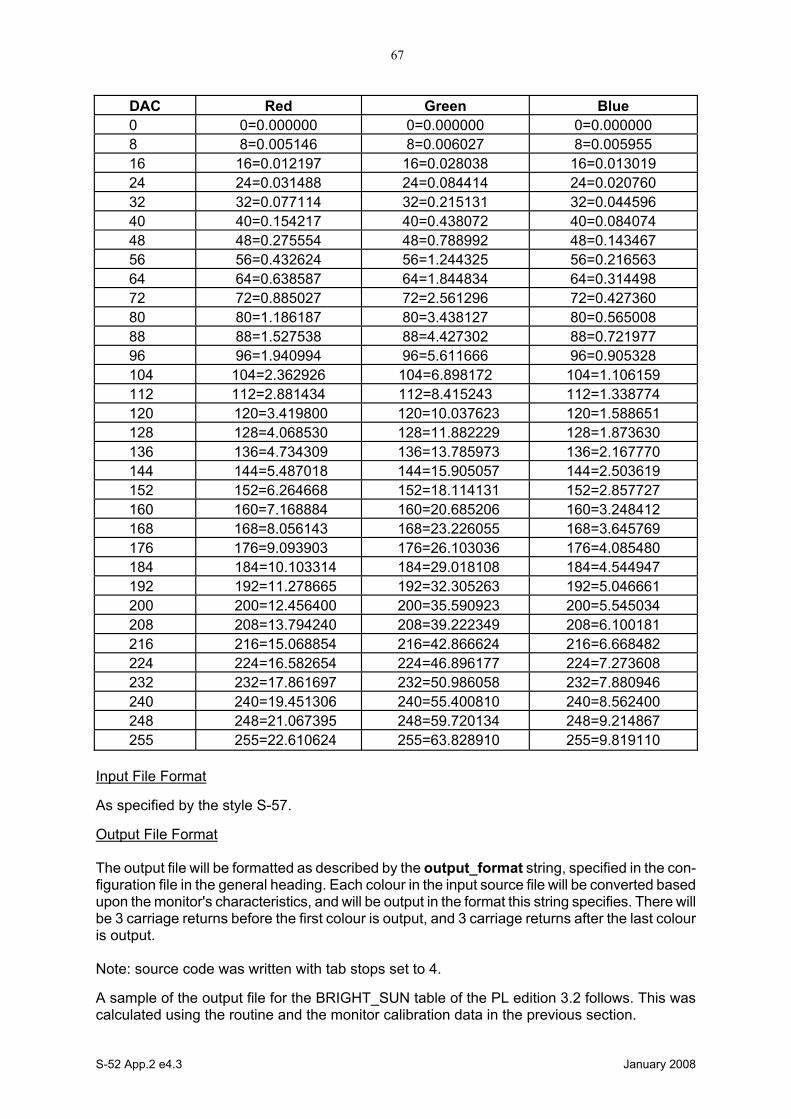
S-52 App.2 e4.3 January 2008
67
DAC
Red
Green
Blue
0
0=0.000000
0=0.000000
0=0.000000 8
8=0.005146
8=0.006027
8=0.005955
16
16=0.012197
16=0.028038
16=0.013019 24
24=0.031488
24=0.084414
24=0.020760
32
32=0.077114
32=0.215131
32=0.044596 40
40=0.154217
40=0.438072
40=0.084074
48
48=0.275554
48=0.788992
48=0.143467 56
56=0.432624
56=1.244325
56=0.216563
64
64=0.638587
64=1.844834
64=0.314498 72
72=0.885027
72=2.561296
72=0.427360
80
80=1.186187
80=3.438127
80=0.565008 88
88=1.527538
88=4.427302
88=0.721977
96
96=1.940994
96=5.611666
96=0.905328 104
104=2.362926
104=6.898172
104=1.106159
112
112=2.881434
112=8.415243
112=1.338774 120 120=3.419800 120=10.037623
120=1.588651
128
128=4.068530
128=11.882229
128=1.873630 136
136=4.734309
136=13.785973
136=2.167770
144
144=5.487018
144=15.905057
144=2.503619 152
152=6.264668
152=18.114131
152=2.857727
160
160=7.168884
160=20.685206
160=3.248412 168
168=8.056143
168=23.226055
168=3.645769
176
176=9.093903
176=26.103036
176=4.085480 184
184=10.103314
184=29.018108
184=4.544947
192
192=11.278665
192=32.305263
192=5.046661 200
200=12.456400
200=35.590923
200=5.545034
208
208=13.794240
208=39.222349
208=6.100181 216
216=15.068854
216=42.866624
216=6.668482
224
224=16.582654
224=46.896177
224=7.273608 232
232=17.861697
232=50.986058
232=7.880946
240
240=19.451306
240=55.400810
240=8.562400 248
248=21.067395
248=59.720134
248=9.214867
255
255=22.610624
255=63.828910
255=9.819110 Input File Format As specified by the style S-57. Output File Format The output file will be formatted as described by the output_format string, specified in the con-figuration file in the general heading. Each colour in the input source file will be converted based upon the monitor's characteristics, and will be output in the format this string specifies. There will be 3 carriage returns before the first colour is output, and 3 carriage returns after the last colour is output. Note: source code was written with tab stops set to 4. A sample of the output file for the BRIGHT_SUN table of the PL edition 3.2 follows. This was calculated using the routine and the monitor calibration data in the previous section.
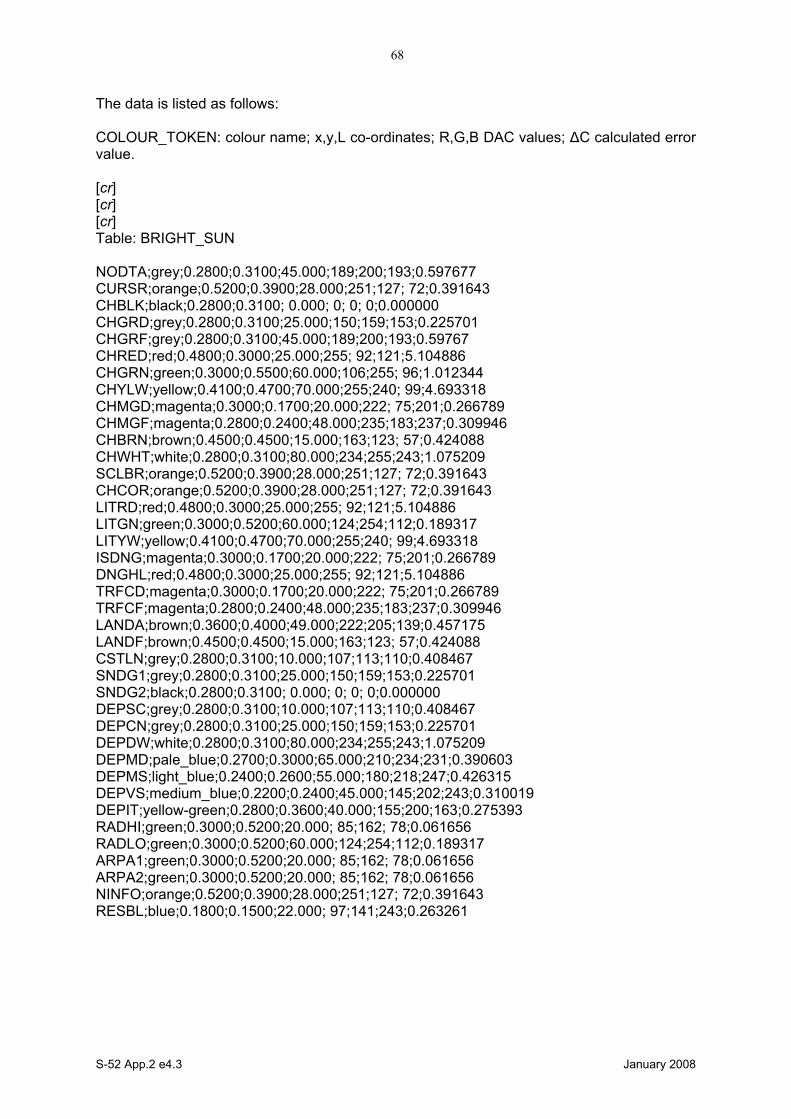
S-52 App.2 e4.3 January 2008
68
The data is listed as follows: COLOUR_TOKEN: colour name; x,y,L co-ordinates; R,G,B DAC values; ∆C calculated error value. [cr] [cr] [cr] Table: BRIGHT_SUN NODTA;grey;0.2800;0.3100;45.000;189;200;193;0.597677 CURSR;orange;0.5200;0.3900;28.000;251;127; 72;0.391643 CHBLK;black;0.2800;0.3100; 0.000; 0; 0; 0;0.000000 CHGRD;grey;0.2800;0.3100;25.000;150;159;153;0.225701 CHGRF;grey;0.2800;0.3100;45.000;189;200;193;0.59767 CHRED;red;0.4800;0.3000;25.000;255; 92;121;5.104886 CHGRN;green;0.3000;0.5500;60.000;106;255; 96;1.012344 CHYLW;yellow;0.4100;0.4700;70.000;255;240; 99;4.693318 CHMGD;magenta;0.3000;0.1700;20.000;222; 75;201;0.266789 CHMGF;magenta;0.2800;0.2400;48.000;235;183;237;0.309946 CHBRN;brown;0.4500;0.4500;15.000;163;123; 57;0.424088 CHWHT;white;0.2800;0.3100;80.000;234;255;243;1.075209 SCLBR;orange;0.5200;0.3900;28.000;251;127; 72;0.391643 CHCOR;orange;0.5200;0.3900;28.000;251;127; 72;0.391643 LITRD;red;0.4800;0.3000;25.000;255; 92;121;5.104886 LITGN;green;0.3000;0.5200;60.000;124;254;112;0.189317 LITYW;yellow;0.4100;0.4700;70.000;255;240; 99;4.693318 ISDNG;magenta;0.3000;0.1700;20.000;222; 75;201;0.266789 DNGHL;red;0.4800;0.3000;25.000;255; 92;121;5.104886 TRFCD;magenta;0.3000;0.1700;20.000;222; 75;201;0.266789 TRFCF;magenta;0.2800;0.2400;48.000;235;183;237;0.309946 LANDA;brown;0.3600;0.4000;49.000;222;205;139;0.457175 LANDF;brown;0.4500;0.4500;15.000;163;123; 57;0.424088 CSTLN;grey;0.2800;0.3100;10.000;107;113;110;0.408467 SNDG1;grey;0.2800;0.3100;25.000;150;159;153;0.225701 SNDG2;black;0.2800;0.3100; 0.000; 0; 0; 0;0.000000 DEPSC;grey;0.2800;0.3100;10.000;107;113;110;0.408467 DEPCN;grey;0.2800;0.3100;25.000;150;159;153;0.225701 DEPDW;white;0.2800;0.3100;80.000;234;255;243;1.075209 DEPMD;pale_blue;0.2700;0.3000;65.000;210;234;231;0.390603 DEPMS;light_blue;0.2400;0.2600;55.000;180;218;247;0.426315 DEPVS;medium_blue;0.2200;0.2400;45.000;145;202;243;0.310019 DEPIT;yellow-green;0.2800;0.3600;40.000;155;200;163;0.275393 RADHI;green;0.3000;0.5200;20.000; 85;162; 78;0.061656 RADLO;green;0.3000;0.5200;60.000;124;254;112;0.189317 ARPA1;green;0.3000;0.5200;20.000; 85;162; 78;0.061656 ARPA2;green;0.3000;0.5200;20.000; 85;162; 78;0.061656 NINFO;orange;0.5200;0.3900;28.000;251;127; 72;0.391643 RESBL;blue;0.1800;0.1500;22.000; 97;141;243;0.263261
S-52 App.2 e4.3 January 2008
69
RESYW;yellow;0.4100;0.4700;70.000;255;240; 99;4.693318 RESGR;grey;0.2300;0.2600; 6.500; 76; 98;110;0.623020 SHIPS;black;0.2800;0.3100; 0.000; 0; 0; 0;0.000000 PLRTE;red;0.5800;0.3500;18.000;241; 71; 60;0.124164 APLRT;orange;0.4900;0.4100;35.000;255;152; 79;0.172613 UINFD;black;0.2800;0.3100; 0.000; 0; 0; 0;0.000000 UINFF;grey;0.2800;0.3100;25.000;150;159;153;0.225701 UIBCK;white;0.2800;0.3100;80.000;234;255;243;1.075209 UIAFD;medium_blue;0.2200;0.2400;45.000;145;202;243;0.310019 UINFR;red;0.4800;0.3000;25.000;255; 92;121;5.104886 UINFG;green;0.3000;0.5200;60.000;124;254;112;0.189317 UINFO;orange;0.5200;0.3900;28.000;251;127; 72;0.391643 UINFB;blue;0.1800;0.1500;22.000; 97;141;243;0.263261 UINFM;magenta;0.3000;0.1700;20.000;222; 75;201;0.266789 UIBDR;grey;0.2800;0.3100;25.000;150;159;153;0.225701 UIAFF;brown;0.3600;0.4000;49.000;222;205;139;0.457175 OUTLW;black;0.2800;0.3100; 0.000; 0; 0; 0;0.000000 OUTLL;brown;0.3600;0.4000;49.000;222;205;139;0.457175 B.7.1 CHECKXYL calibration verification utility
This section describes the file formats and operation for the utility CHECKXYL. All source is written in ANSI C, therefore an ANSI C compiler (such as gcc) is required to compile the source.
This utility will allow a system calibration to be verified, by making measurements of actual colour co-ordinates and luminances on the screen, and using them as inputs to the utility to compare the actual co-ordinates to the specified co-ordinates. This is done in the CIE ∆E units.
Files in Distribution CHECKXYL.C COMPARE.C UTIL.C CHECKXYL.H MF (a makefile that can be used by invoking: make -f mf) CHECKXYL.DOC CHECKXYL.INI

S-52 App.2 e4.3 January 2008
70
Command Line Arguments The command line format for CHECKXYL is as follows: CHECKXYL src_file pres_lib colourtable dest_file [config_file]\n\n"); where: src_file = the input file, which contains a list of colours that were measured on the target
monitor. These colours are supplied in a Microsoft Windows style database file, which has sections labeled with the colour table names (see below), and colours with the measured values. For an example, study the following ex-cerpt from a CHECKXYL source file:
[DAY_BRIGHT] NODTA=0.279499;0.309014;44.893479 CURSR=0.520329;0.389384;28.026698
Here we see a colour called NODTA, with the x, y and L values stored in a semicolon separated list, for the DAY_BRIGHT colour table. NODTA will be compared against the original values stored in the Presentation Library file (see below).
pres_lib = the Presentation Library file, which has the format specified by S-57. dest_file = the generated file which contains a list of out of spec. colours (which differ
from the desired colours listed in the presentation library file), the non-distinguishable colours, as well as colours which differ greatly in luminance values from their intended values. If a destination file with the same name al-ready exists, the existing file will be renamed to its current name, with the last character in the filename changed to a 0. For example, if the output_file ar-gument was "OUT.LIB", and this file already existed, the existing file would be renamed to "OUT.LI0" before writing the new colour table information.
config_file = a configuration file (optional argument) which contains the monitor's charac-
teristics, formatting strings, gamma function values, etc. This file is described below. If this command line argument is not specified, the default file is CHECKXYL.INI
Configuration File Format This file is a standard Microsoft Windows initialization file format, which is a convenient method of storing simple database values. The database is divided into headings, and key values are stored under each heading. For example, CHECKXYL's configuration file has a heading called "general", under which key values such as the ∆E and ∆C thresholds are stored. The following is an annotated copy of a sample configuration file: [general] heading deltaCthreshold=8.0 delta C threshold for flagging errors deltaEthreshold=10.0 delta E threshold for flagging errors luminancethreshold=0.2 luminance threshold (fraction) for flagging luminance errors

S-52 App.2 e4.3 January 2008
71
Sample Output Data Note in these examples that both the "out of spec" colour and "can't be distinguished" colours are both within specified tolerances and are used as examples to show the format of the output data. In the case of "out of spec colours", the value of dC must be greater than 8.0 to constitute an improper colour, and for "colours that can't be distinguished", dE is to be less than 10 for the colours to be too close in value. Table: DAY_BRIGHT Out of spec colours: (list of colours that fall outside of tolerance for original colour specification , in following format:) Meas: 0.2797;0.3092;44.9668 Orig: 0.2800;0.3100;45.0000 RES05 grey dC: 0.5004 Colours that can not be distinguished: (list of colours that cannot be distinguished from other colours.) NODTA: 0.2797;0.3092;44.9668 CHGRD: 0.2807;0.3112;24.8055 dE: 18.1919
__________

S-52 App.2 e4.3 January 2008
72
ANNEX C PROCEDURE FOR MAINTAINING THE CALIBRATION OF DISPLAYS C.1 Introduction
The application of ECDIS to practical marine use necessitates the development of a greater understanding of monitor limitations as they relate to an accurate colour dis-play and a marine environment.
The factors that effect colour accuracy and the life of the monitor are discussed and an approach for onboard monitor testing and calibration is described in this Annex.
C.2 System Requirements
Monitor calibration is necessary for accurate colour reproduction. Several factors are important to review about the monitor system:
1. When the monitor is initially installed in the system, it should be calibrated and
the system matched to the IHO colour tables.
2. In use, the monitor should not let the colours shift beyond a certain perceptible relative limit. Each colour must be perceived as it was intended, and in a relative sense, one colour must not be mistaken for another.
3. When a colour shift occurs that is beyond limits, it should be possible to identify
that the shift is beyond limits without the need for special instruments and com-pletely dark environments.
4. Monitor's will develop calibration errors with time, requiring a periodic recalibra-
tion of the system. C.2.1 Display calibration-drift processes Monitors may lose calibration through a number of mechanisms:
- Wearout: For example over time, the electron gun structure of the CRT type of monitor wears, reducing the efficiency of the gun. This causes a relative dimin-ishing of the output of the colour that is wearing fastest, and causes a colour shift toward the other colours. The wearing is 'coulombic', so depends on the total number of electrons that are emitted by the gun over time. In a practical com-puter graphic CRT, this effect will start to become noticeable (if you are looking for it) after 10,000 to 20,000 hours of operation. Usually it is roughly equal in each gun (because the dominant colour displayed is generally grey/white) and results in very little colour shift. In a situation where one colour dominates over time, colour shifts may appear.
- Drift: Drift occurs as components age. Drift will result in a change in the white
point of the monitor. For a CRT type of monitor this change in white point will usually result in a shift in the colour of grey over the luminance range. For CRT's that are used in computer graphics situations, this drift is usually not a serious concern. In shipboard applications, drift will be a greater concern because of the constant vibration causing internal set-up controls to change, as well as ECDIS
S-52 App.2 e4.3 January 2008
73
being a more colour-critical application. It is expected that recalibration due to drift will be required after several thousands of operational hours.
- Component Failures: Component failure in the monitor or image generator com-
ponent can cause problems ranging from drift to complete failure. Failures can result in a display shifting its colours or in a complete failure of one of the colours or even the complete picture. It is possible that the shift will be proportionally dif-ferent at different drive levels. High quality monitors are designed with mean time before failure (MTBF) of 50,000 hours or more which results in a long life of the imaging system. The shipboard environment will degrade this due to the vibration and salt air.
In practice these mechanisms will cause a drift in the white point. This means that the specific colour of white will drift to cause the picture to appear a little more pinkish, bluish, or greenish. Usually, this can be 'touched up', without requiring a completely new calibration.
C.3 Verification of the display performance at sea C.3.1 Calibration tests to be used for verification of display's performance onboard ship
Colour calibration has traditionally been a complex and difficult task. Significant ad-vances have been made in this area to achieve accurate results using instrumenta-tion. This has been achieved by using modern photometric instruments to measure luminance, and ensuring that the monitor to be calibrated is well shielded from stray light entering the measurement area.
Because instrument-based testing is still not practical as an ongoing test on ship-board, an alternate approach has been chosen. Specifically a "Greyscale Test" and an onboard "Colour Differentiation Test Diagram" have been chosen as subjective measures of the monitor's performance.
C.3.1.1 Greyscale test
Greyscale is a well understood test pattern in the Video Monitor world, and it has a natural application here.
The Greyscale test is a visual test that is used to determine the colour tracking of the monitor. It is general, it is non quantitative and requires judgement on the part of the operator to use. On the other hand, it is quite sensitive, and familiar to video techni-cians.
This test is simple to use. It consists of putting a greyscale of at least 8 steps from black to white on the screen. The greyscale should be made of rectangles that are at least 2.5 cm by 10 cm. These can be oriented in either a horizontal or vertical direc-tion. The greyscale is critically observed by the viewer from a distance of about 50 cm to 100 cm and any colour shifts in any of the rectangles of grey are noted.
The greyscale should appear to be a neutral shade of white in all rectangles. Each should appear to be the same 'colour' as the others, even though varying in intensity from black to white. Colour shading in any of the rectangles indicates a problem in the adjustment of the display.

S-52 App.2 e4.3 January 2008
74
Interpretation of results:
The observer will see either a greyscale that is pure and free from colouring, or one which shows varying degrees of shading. If no colouring is seen, then the display is performing properly. If slight shading is seen, then the display is usable. If there is a lot of shading, then the display may be providing false colour information.
This test meets the criteria of simplicity and universality, but fails to be either quantita-tive or accurate. It should be used as an indication of performance of the display, but not an absolute measure. It should be noted that the identification and the degree of problem will vary according to the operator, so should not be considered as a quanti-tative test.
C.3.1.2 Colour Differentiation Test Diagram
At the mariner's level, a test is required that reassures him that the display is function-ing adequately or alternatively that servicing is required. This is provided in the Pres-entation Library, Part I, sections 15.4, 19.3 and 19.4. It provides test diagrams that al-lows the mariner to confirm that his display clearly differentiates the important col-ours, as well as acting as a test chart for setting the controls for night use.
Note that the Colour Test Diagram must be implemented using the software specifi-cally intended to generate this diagram, which comes with the Colours & Symbol CD, in order to ensure that the colours actually used to generate the chart display are shown on the diagram. Any other form of the Colour Test Diagram (.tif file etc.) will not display the correct colours.
C.4 Re-calibration of the Monitor
Recalibration of the monitor should be performed by a knowledgeable monitor techni-cian, who has experience of light measurement.
Two levels of calibration can be performed: White Point Touch-up and Complete.
Before undertaking either calibration procedure, it is necessary to set and lock the controls for the duration of the calibration:
Setting the Controls:
The Brightness control is used to adjust the black level of the monitor. This is the point where the monitor screen is seen as black, and this setting will create the black-est black that can be displayed. After the control is set, it must be locked in place. Any adjustment of the brightness setting after calibration invalidates the process, unless it is returned to its calibrated position, (e.g. a detent position).
With the monitor in a dark environment (accomplished either at night or with the moni-tor area darkened with a hood), and with the monitor turned on and warmed up to the manufacturer's specification, drive the monitor with a black signal (0, 0, 0). Observe the border around the CRT where the tube is normally black, and visually compare its intensity to the black square in the centre of the screen. First adjust the brightness control to its maximum, then adjust it down until there is no distinction between the black square and the background. Adjust the control up until the active area just shows. (If a luminance meter is available, measure the Luminance of this area. It should be less than 0.52 candelas per square metre). Lock the control for the re-mainder of the calibration process.

S-52 App.2 e4.3 January 2008
75
Setting the Contrast Control:
The contrast control should be adjusted to achieve maximum required output level at full white signal. Using a luminance meter and a peak white signal, (DAC values of 255, 255, 255) adjust the contrast control for the maximum luminance required by the system. Lock this control for the remainder of the calibration process.
C.4.1 White point touch-up
On the first order, the colour shifting will be primarily caused by white point shifts. Calibration can be maintained by 'touching up' the white point on a periodic basis. This can be done by a CRT technician who adjusts controls inside the CRT, or can be performed by adjusting the colour DAC values through an adjustment and calcula-tional process. (The DAC adjustment would have to be designed into the software system by the ECDIS manufacturer).
- White Point Calibration in the CRT: (Performed by adjusting the CRT electron-
ics) The white point of a CRT is set up by comparing the white colour on the screen to a standard lamp. The standard lamps for this purpose are fairly rugged, and compact. The process is reasonably accurate. The process is as follows:
1. Put a black signal onto the screen. Adjust the black level of each gun (us-
ing the R,G,B cut-off controls) to just extinguish the raster in each colour.
2. Put a white signal on the screen, and adjust the individual gain controls of the R,G, and B guns to achieve a white that matches the standard lamp.
- White Point Calibration in the Frame Buffer: Use an interface to the computer
(keyboard or trackball) that allows the technician to adjust the white point by ad-justing the maximum output of the DAC's to yield a white that compares with the standard. The computer will then adjust the DAC values in the middle of the range appropriately to maintain colour fidelity.
1. Put a white signal in the screen.
2. Adjust the input signal levels (DAC values) of red, green, and blue to give
the correct white level.
3. Instruct the computer to compute the DAC value corrections in the range. C.4.2 Automatic Calibration monitors
Several manufacturers make monitors's that have built-in calibration capability. (e.g. Barco). These monitor's will perform a white point calibration by adjusting internal controls through the use of their own light sensor and calibration system. This recali-bration process is in general suitable for the white point touch-up requirements of this Annex.
S-52 App.2 e4.3 January 2008
76
C.4.3 Complete calibration
Calibration and adjustment beyond the white point adjustments are the domain of a more detailed and complex procedure, and are not practical to undertake on the Bridge. Under normal conditions, when a display fails the white balance test or cannot be corrected by a white balance adjustment, it should be returned to the factory for re-calibration and/or repair. (See Annex B: Procedure for Initial Calibration of Colour Displays.)
This Annex was researched and written by:
Matthew Cowan 18 McAllister Lane
Bloomingdale, Ontario under a contract funded by The Canadian Coast Guard.
The Grayscale Test was suggested by:
Dave Hannah, Kelvin Hughes Limited, Ilford, Essex, U.K.
This annex was amended as generic for any type of monitor by: Hannu Peiponen, Furuno Oy, Espoo, Finland.
__________
INTERNATIONAL HYDROGRAPHIC ORGANIZATION
HYDROGRAPHIC DICTIONARY Volume 1 English
Special Publication No. 32 Appendix 1
Glossary of ECDIS Related Terms
September 2007
Published by the International Hydrographic Bureau
MONACO
S-32 App. 1


INTERNATIONAL HYDROGRAPHIC ORGANIZATION
HYDROGRAPHIC DICTIONARY Volume 1 English
Special Publication No. 32 Appendix 1
Glossary of ECDIS Related Terms
September 2007
Published by the International Hydrographic Bureau 4, Quai Antoine 1er B.P. 445 - MC 98011 MONACO Cedex Principauté de Monaco Telefax: (377) 93 10 81 40 E-mail: [email protected] Web: www.iho.org

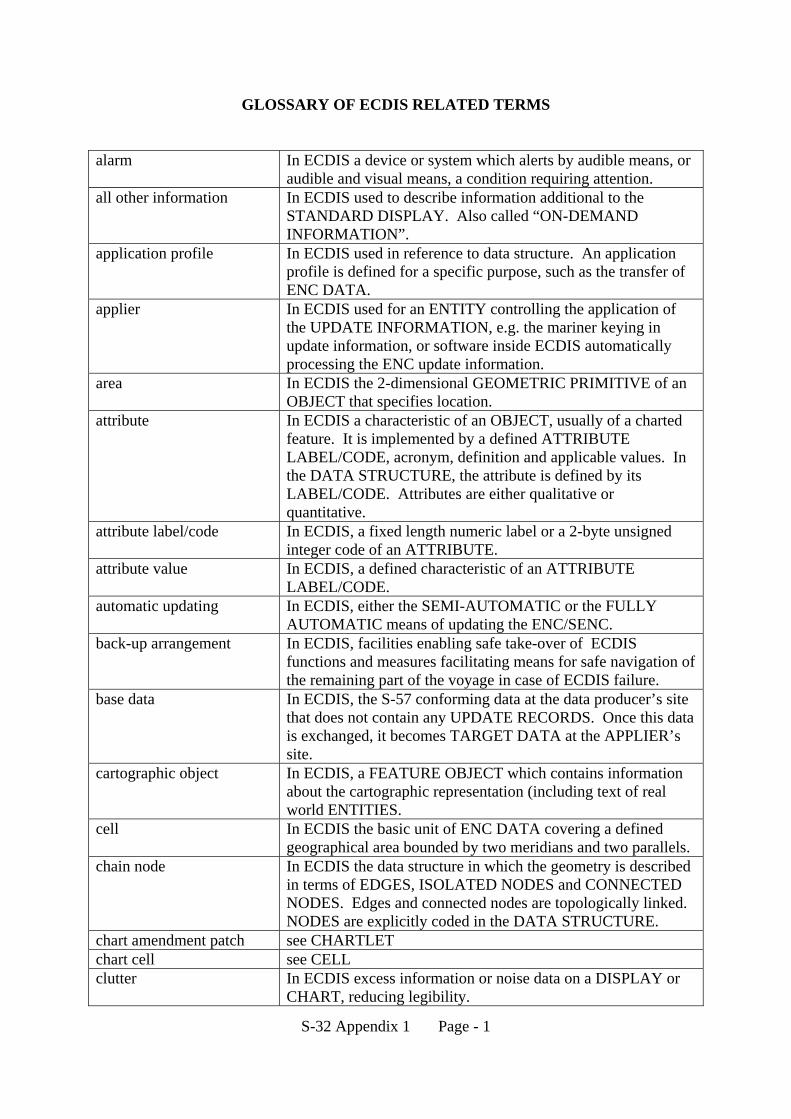
S-32 Appendix 1 Page - 1
GLOSSARY OF ECDIS RELATED TERMS
alarm In ECDIS a device or system which alerts by audible means, or audible and visual means, a condition requiring attention.
all other information In ECDIS used to describe information additional to the STANDARD DISPLAY. Also called “ON-DEMAND INFORMATION”.
application profile In ECDIS used in reference to data structure. An application profile is defined for a specific purpose, such as the transfer of ENC DATA.
applier In ECDIS used for an ENTITY controlling the application of the UPDATE INFORMATION, e.g. the mariner keying in update information, or software inside ECDIS automatically processing the ENC update information.
area In ECDIS the 2-dimensional GEOMETRIC PRIMITIVE of an OBJECT that specifies location.
attribute In ECDIS a characteristic of an OBJECT, usually of a charted feature. It is implemented by a defined ATTRIBUTE LABEL/CODE, acronym, definition and applicable values. In the DATA STRUCTURE, the attribute is defined by its LABEL/CODE. Attributes are either qualitative or quantitative.
attribute label/code In ECDIS, a fixed length numeric label or a 2-byte unsigned integer code of an ATTRIBUTE.
attribute value In ECDIS, a defined characteristic of an ATTRIBUTE LABEL/CODE.
automatic updating In ECDIS, either the SEMI-AUTOMATIC or the FULLY AUTOMATIC means of updating the ENC/SENC.
back-up arrangement In ECDIS, facilities enabling safe take-over of ECDIS functions and measures facilitating means for safe navigation of the remaining part of the voyage in case of ECDIS failure.
base data In ECDIS, the S-57 conforming data at the data producer’s site that does not contain any UPDATE RECORDS. Once this data is exchanged, it becomes TARGET DATA at the APPLIER’s site.
cartographic object In ECDIS, a FEATURE OBJECT which contains information about the cartographic representation (including text of real world ENTITIES.
cell In ECDIS the basic unit of ENC DATA covering a defined geographical area bounded by two meridians and two parallels.
chain node In ECDIS the data structure in which the geometry is described in terms of EDGES, ISOLATED NODES and CONNECTED NODES. Edges and connected nodes are topologically linked. NODES are explicitly coded in the DATA STRUCTURE.
chart amendment patch see CHARTLET chart cell see CELL clutter In ECDIS excess information or noise data on a DISPLAY or
CHART, reducing legibility.
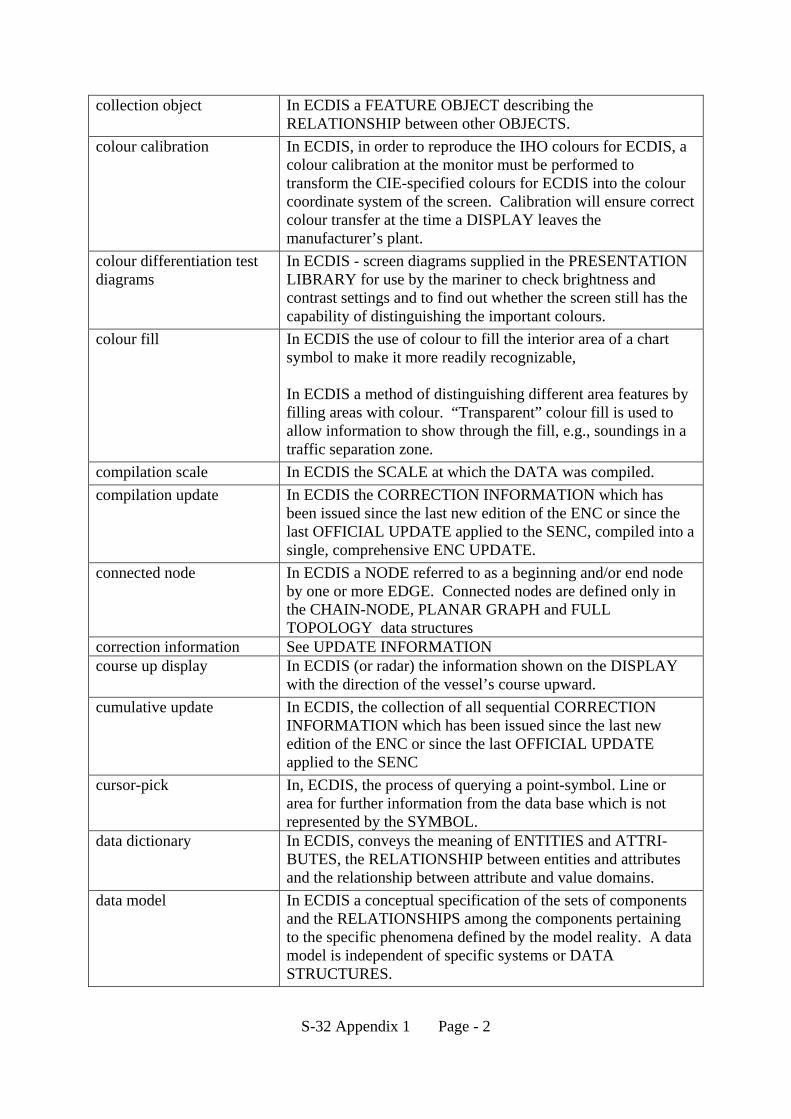
S-32 Appendix 1 Page - 2
collection object In ECDIS a FEATURE OBJECT describing the RELATIONSHIP between other OBJECTS.
colour calibration In ECDIS, in order to reproduce the IHO colours for ECDIS, a colour calibration at the monitor must be performed to transform the CIE-specified colours for ECDIS into the colour coordinate system of the screen. Calibration will ensure correct colour transfer at the time a DISPLAY leaves the manufacturer’s plant.
colour differentiation test diagrams
In ECDIS - screen diagrams supplied in the PRESENTATION LIBRARY for use by the mariner to check brightness and contrast settings and to find out whether the screen still has the capability of distinguishing the important colours.
colour fill In ECDIS the use of colour to fill the interior area of a chart symbol to make it more readily recognizable, In ECDIS a method of distinguishing different area features by filling areas with colour. “Transparent” colour fill is used to allow information to show through the fill, e.g., soundings in a traffic separation zone.
compilation scale In ECDIS the SCALE at which the DATA was compiled. compilation update In ECDIS the CORRECTION INFORMATION which has
been issued since the last new edition of the ENC or since the last OFFICIAL UPDATE applied to the SENC, compiled into a single, comprehensive ENC UPDATE.
connected node In ECDIS a NODE referred to as a beginning and/or end node by one or more EDGE. Connected nodes are defined only in the CHAIN-NODE, PLANAR GRAPH and FULL TOPOLOGY data structures
correction information See UPDATE INFORMATION course up display In ECDIS (or radar) the information shown on the DISPLAY
with the direction of the vessel’s course upward. cumulative update In ECDIS, the collection of all sequential CORRECTION
INFORMATION which has been issued since the last new edition of the ENC or since the last OFFICIAL UPDATE applied to the SENC
cursor-pick In, ECDIS, the process of querying a point-symbol. Line or area for further information from the data base which is not represented by the SYMBOL.
data dictionary In ECDIS, conveys the meaning of ENTITIES and ATTRI-BUTES, the RELATIONSHIP between entities and attributes and the relationship between attribute and value domains.
data model In ECDIS a conceptual specification of the sets of components and the RELATIONSHIPS among the components pertaining to the specific phenomena defined by the model reality. A data model is independent of specific systems or DATA STRUCTURES.
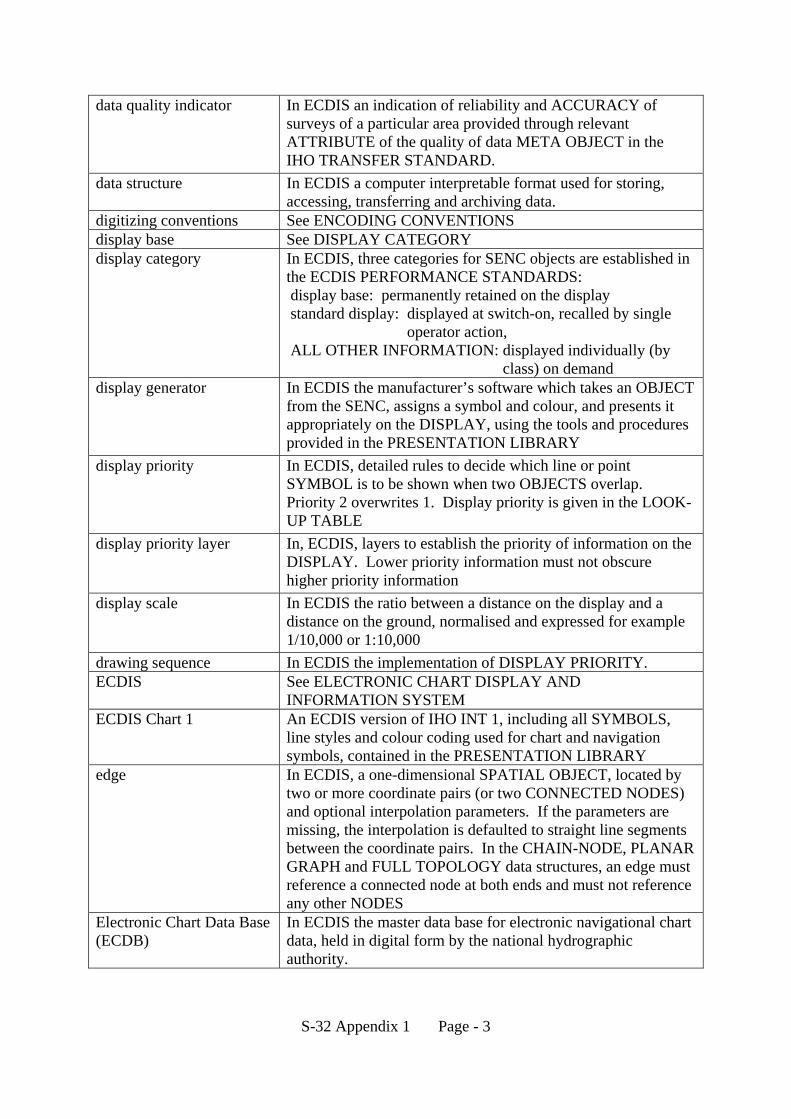
S-32 Appendix 1 Page - 3
data quality indicator In ECDIS an indication of reliability and ACCURACY of surveys of a particular area provided through relevant ATTRIBUTE of the quality of data META OBJECT in the IHO TRANSFER STANDARD.
data structure In ECDIS a computer interpretable format used for storing, accessing, transferring and archiving data.
digitizing conventions See ENCODING CONVENTIONS display base See DISPLAY CATEGORY display category In ECDIS, three categories for SENC objects are established in
the ECDIS PERFORMANCE STANDARDS: display base: permanently retained on the display standard display: displayed at switch-on, recalled by single
operator action, ALL OTHER INFORMATION: displayed individually (by
class) on demand display generator In ECDIS the manufacturer’s software which takes an OBJECT
from the SENC, assigns a symbol and colour, and presents it appropriately on the DISPLAY, using the tools and procedures provided in the PRESENTATION LIBRARY
display priority In ECDIS, detailed rules to decide which line or point SYMBOL is to be shown when two OBJECTS overlap. Priority 2 overwrites 1. Display priority is given in the LOOK-UP TABLE
display priority layer In, ECDIS, layers to establish the priority of information on the DISPLAY. Lower priority information must not obscure higher priority information
display scale In ECDIS the ratio between a distance on the display and a distance on the ground, normalised and expressed for example 1/10,000 or 1:10,000
drawing sequence In ECDIS the implementation of DISPLAY PRIORITY. ECDIS See ELECTRONIC CHART DISPLAY AND
INFORMATION SYSTEM ECDIS Chart 1 An ECDIS version of IHO INT 1, including all SYMBOLS,
line styles and colour coding used for chart and navigation symbols, contained in the PRESENTATION LIBRARY
edge In ECDIS, a one-dimensional SPATIAL OBJECT, located by two or more coordinate pairs (or two CONNECTED NODES) and optional interpolation parameters. If the parameters are missing, the interpolation is defaulted to straight line segments between the coordinate pairs. In the CHAIN-NODE, PLANAR GRAPH and FULL TOPOLOGY data structures, an edge must reference a connected node at both ends and must not reference any other NODES
Electronic Chart Data Base (ECDB)
In ECDIS the master data base for electronic navigational chart data, held in digital form by the national hydrographic authority.
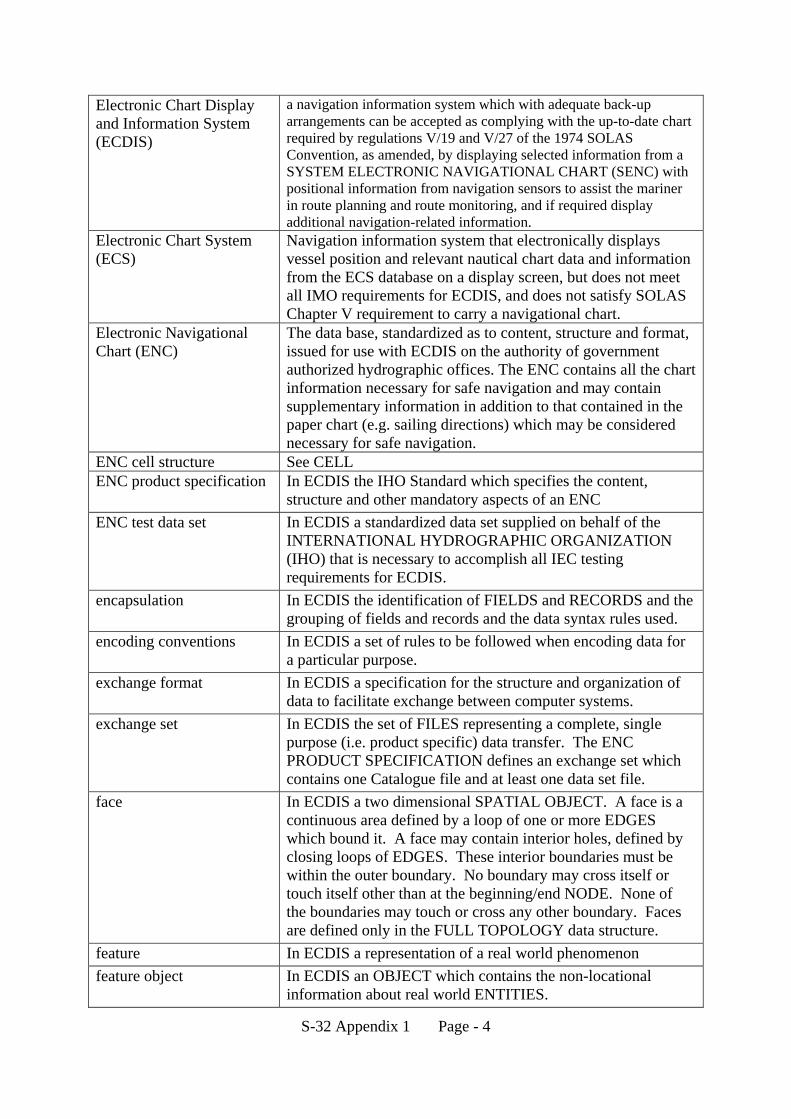
S-32 Appendix 1 Page - 4
Electronic Chart Display and Information System (ECDIS)
a navigation information system which with adequate back-up arrangements can be accepted as complying with the up-to-date chart required by regulations V/19 and V/27 of the 1974 SOLAS Convention, as amended, by displaying selected information from a SYSTEM ELECTRONIC NAVIGATIONAL CHART (SENC) with positional information from navigation sensors to assist the mariner in route planning and route monitoring, and if required display additional navigation-related information.
Electronic Chart System (ECS)
Navigation information system that electronically displays vessel position and relevant nautical chart data and information from the ECS database on a display screen, but does not meet all IMO requirements for ECDIS, and does not satisfy SOLAS Chapter V requirement to carry a navigational chart.
Electronic Navigational Chart (ENC)
The data base, standardized as to content, structure and format, issued for use with ECDIS on the authority of government authorized hydrographic offices. The ENC contains all the chart information necessary for safe navigation and may contain supplementary information in addition to that contained in the paper chart (e.g. sailing directions) which may be considered necessary for safe navigation.
ENC cell structure See CELL ENC product specification In ECDIS the IHO Standard which specifies the content,
structure and other mandatory aspects of an ENC ENC test data set In ECDIS a standardized data set supplied on behalf of the
INTERNATIONAL HYDROGRAPHIC ORGANIZATION (IHO) that is necessary to accomplish all IEC testing requirements for ECDIS.
encapsulation In ECDIS the identification of FIELDS and RECORDS and the grouping of fields and records and the data syntax rules used.
encoding conventions In ECDIS a set of rules to be followed when encoding data for a particular purpose.
exchange format In ECDIS a specification for the structure and organization of data to facilitate exchange between computer systems.
exchange set In ECDIS the set of FILES representing a complete, single purpose (i.e. product specific) data transfer. The ENC PRODUCT SPECIFICATION defines an exchange set which contains one Catalogue file and at least one data set file.
face In ECDIS a two dimensional SPATIAL OBJECT. A face is a continuous area defined by a loop of one or more EDGES which bound it. A face may contain interior holes, defined by closing loops of EDGES. These interior boundaries must be within the outer boundary. No boundary may cross itself or touch itself other than at the beginning/end NODE. None of the boundaries may touch or cross any other boundary. Faces are defined only in the FULL TOPOLOGY data structure.
feature In ECDIS a representation of a real world phenomenon feature object In ECDIS an OBJECT which contains the non-locational
information about real world ENTITIES.
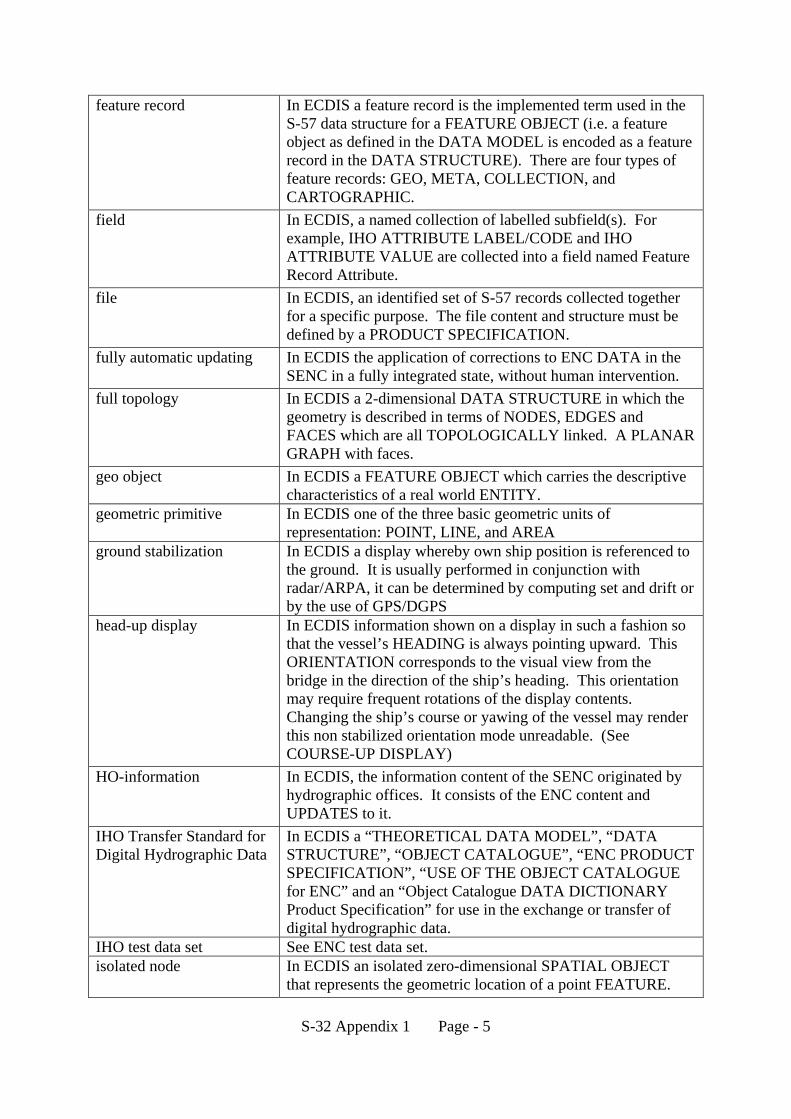
S-32 Appendix 1 Page - 5
feature record In ECDIS a feature record is the implemented term used in the S-57 data structure for a FEATURE OBJECT (i.e. a feature object as defined in the DATA MODEL is encoded as a feature record in the DATA STRUCTURE). There are four types of feature records: GEO, META, COLLECTION, and CARTOGRAPHIC.
field In ECDIS, a named collection of labelled subfield(s). For example, IHO ATTRIBUTE LABEL/CODE and IHO ATTRIBUTE VALUE are collected into a field named Feature Record Attribute.
file In ECDIS, an identified set of S-57 records collected together for a specific purpose. The file content and structure must be defined by a PRODUCT SPECIFICATION.
fully automatic updating In ECDIS the application of corrections to ENC DATA in the SENC in a fully integrated state, without human intervention.
full topology In ECDIS a 2-dimensional DATA STRUCTURE in which the geometry is described in terms of NODES, EDGES and FACES which are all TOPOLOGICALLY linked. A PLANAR GRAPH with faces.
geo object In ECDIS a FEATURE OBJECT which carries the descriptive characteristics of a real world ENTITY.
geometric primitive In ECDIS one of the three basic geometric units of representation: POINT, LINE, and AREA
ground stabilization In ECDIS a display whereby own ship position is referenced to the ground. It is usually performed in conjunction with radar/ARPA, it can be determined by computing set and drift or by the use of GPS/DGPS
head-up display In ECDIS information shown on a display in such a fashion so that the vessel’s HEADING is always pointing upward. This ORIENTATION corresponds to the visual view from the bridge in the direction of the ship’s heading. This orientation may require frequent rotations of the display contents. Changing the ship’s course or yawing of the vessel may render this non stabilized orientation mode unreadable. (See COURSE-UP DISPLAY)
HO-information In ECDIS, the information content of the SENC originated by hydrographic offices. It consists of the ENC content and UPDATES to it.
IHO Transfer Standard for Digital Hydrographic Data
In ECDIS a “THEORETICAL DATA MODEL”, “DATA STRUCTURE”, “OBJECT CATALOGUE”, “ENC PRODUCT SPECIFICATION”, “USE OF THE OBJECT CATALOGUE for ENC” and an “Object Catalogue DATA DICTIONARY Product Specification” for use in the exchange or transfer of digital hydrographic data.
IHO test data set See ENC test data set. isolated node In ECDIS an isolated zero-dimensional SPATIAL OBJECT
that represents the geometric location of a point FEATURE.
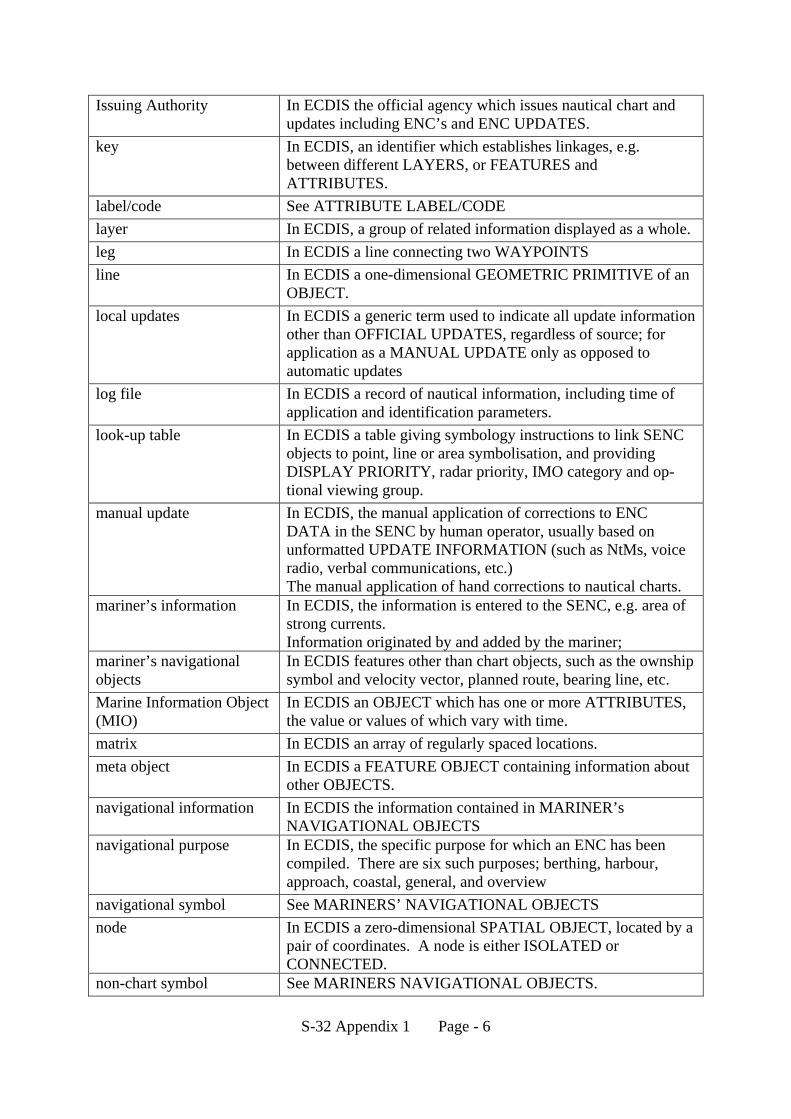
S-32 Appendix 1 Page - 6
Issuing Authority In ECDIS the official agency which issues nautical chart and updates including ENC’s and ENC UPDATES.
key In ECDIS, an identifier which establishes linkages, e.g. between different LAYERS, or FEATURES and ATTRIBUTES.
label/code See ATTRIBUTE LABEL/CODE layer In ECDIS, a group of related information displayed as a whole. leg In ECDIS a line connecting two WAYPOINTS line In ECDIS a one-dimensional GEOMETRIC PRIMITIVE of an
OBJECT. local updates In ECDIS a generic term used to indicate all update information
other than OFFICIAL UPDATES, regardless of source; for application as a MANUAL UPDATE only as opposed to automatic updates
log file In ECDIS a record of nautical information, including time of application and identification parameters.
look-up table In ECDIS a table giving symbology instructions to link SENC objects to point, line or area symbolisation, and providing DISPLAY PRIORITY, radar priority, IMO category and op-tional viewing group.
manual update In ECDIS, the manual application of corrections to ENC DATA in the SENC by human operator, usually based on unformatted UPDATE INFORMATION (such as NtMs, voice radio, verbal communications, etc.) The manual application of hand corrections to nautical charts.
mariner’s information In ECDIS, the information is entered to the SENC, e.g. area of strong currents. Information originated by and added by the mariner;
mariner’s navigational objects
In ECDIS features other than chart objects, such as the ownship symbol and velocity vector, planned route, bearing line, etc.
Marine Information Object (MIO)
In ECDIS an OBJECT which has one or more ATTRIBUTES, the value or values of which vary with time.
matrix In ECDIS an array of regularly spaced locations. meta object In ECDIS a FEATURE OBJECT containing information about
other OBJECTS. navigational information In ECDIS the information contained in MARINER’s
NAVIGATIONAL OBJECTS navigational purpose In ECDIS, the specific purpose for which an ENC has been
compiled. There are six such purposes; berthing, harbour, approach, coastal, general, and overview
navigational symbol See MARINERS’ NAVIGATIONAL OBJECTS node In ECDIS a zero-dimensional SPATIAL OBJECT, located by a
pair of coordinates. A node is either ISOLATED or CONNECTED.
non-chart symbol See MARINERS NAVIGATIONAL OBJECTS.
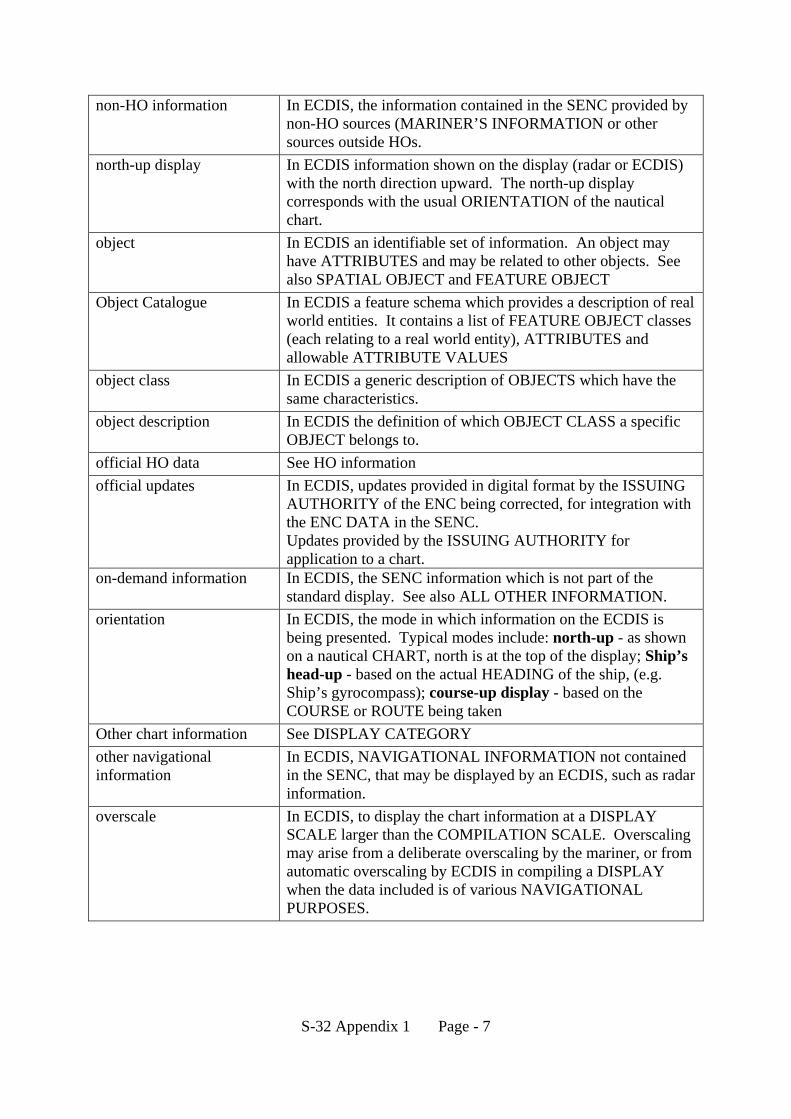
S-32 Appendix 1 Page - 7
non-HO information In ECDIS, the information contained in the SENC provided by non-HO sources (MARINER’S INFORMATION or other sources outside HOs.
north-up display In ECDIS information shown on the display (radar or ECDIS) with the north direction upward. The north-up display corresponds with the usual ORIENTATION of the nautical chart.
object In ECDIS an identifiable set of information. An object may have ATTRIBUTES and may be related to other objects. See also SPATIAL OBJECT and FEATURE OBJECT
Object Catalogue In ECDIS a feature schema which provides a description of real world entities. It contains a list of FEATURE OBJECT classes (each relating to a real world entity), ATTRIBUTES and allowable ATTRIBUTE VALUES
object class In ECDIS a generic description of OBJECTS which have the same characteristics.
object description In ECDIS the definition of which OBJECT CLASS a specific OBJECT belongs to.
official HO data See HO information official updates In ECDIS, updates provided in digital format by the ISSUING
AUTHORITY of the ENC being corrected, for integration with the ENC DATA in the SENC. Updates provided by the ISSUING AUTHORITY for application to a chart.
on-demand information In ECDIS, the SENC information which is not part of the standard display. See also ALL OTHER INFORMATION.
orientation In ECDIS, the mode in which information on the ECDIS is being presented. Typical modes include: north-up - as shown on a nautical CHART, north is at the top of the display; Ship’s head-up - based on the actual HEADING of the ship, (e.g. Ship’s gyrocompass); course-up display - based on the COURSE or ROUTE being taken
Other chart information See DISPLAY CATEGORY other navigational information
In ECDIS, NAVIGATIONAL INFORMATION not contained in the SENC, that may be displayed by an ECDIS, such as radar information.
overscale In ECDIS, to display the chart information at a DISPLAY SCALE larger than the COMPILATION SCALE. Overscaling may arise from a deliberate overscaling by the mariner, or from automatic overscaling by ECDIS in compiling a DISPLAY when the data included is of various NAVIGATIONAL PURPOSES.
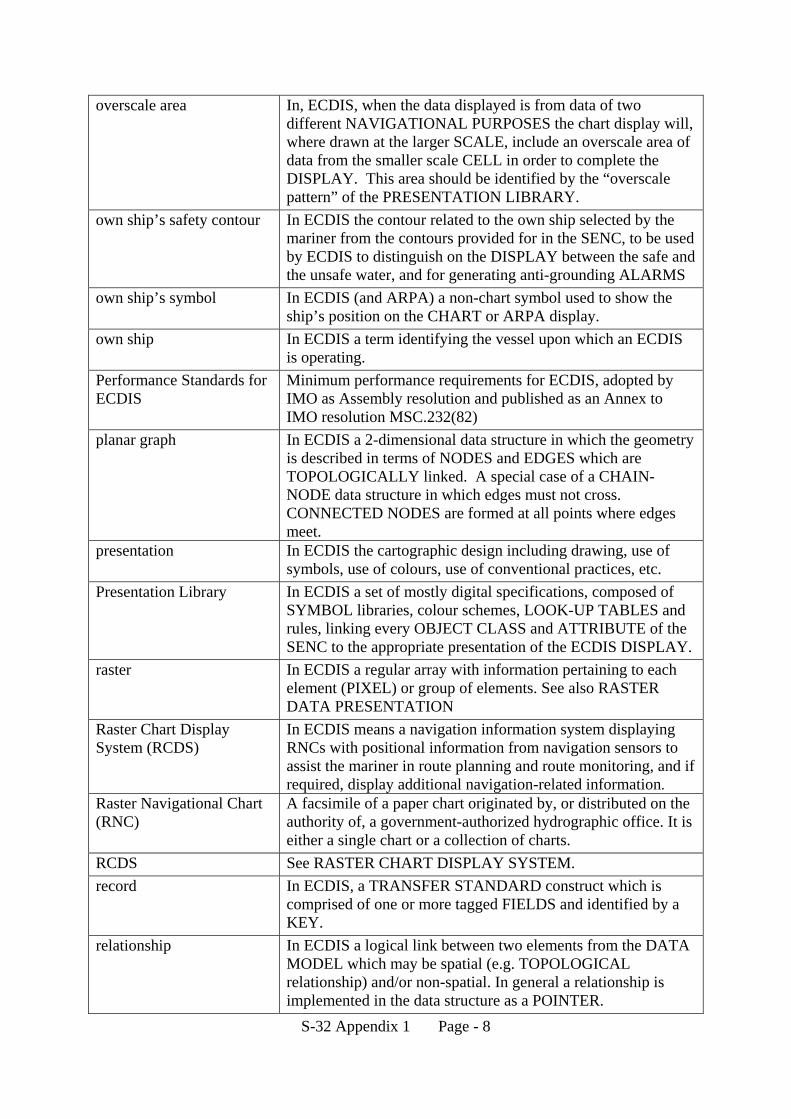
S-32 Appendix 1 Page - 8
overscale area In, ECDIS, when the data displayed is from data of two different NAVIGATIONAL PURPOSES the chart display will, where drawn at the larger SCALE, include an overscale area of data from the smaller scale CELL in order to complete the DISPLAY. This area should be identified by the “overscale pattern” of the PRESENTATION LIBRARY.
own ship’s safety contour In ECDIS the contour related to the own ship selected by the mariner from the contours provided for in the SENC, to be used by ECDIS to distinguish on the DISPLAY between the safe and the unsafe water, and for generating anti-grounding ALARMS
own ship’s symbol In ECDIS (and ARPA) a non-chart symbol used to show the ship’s position on the CHART or ARPA display.
own ship In ECDIS a term identifying the vessel upon which an ECDIS is operating.
Performance Standards for ECDIS
Minimum performance requirements for ECDIS, adopted by IMO as Assembly resolution and published as an Annex to IMO resolution MSC.232(82)
planar graph In ECDIS a 2-dimensional data structure in which the geometry is described in terms of NODES and EDGES which are TOPOLOGICALLY linked. A special case of a CHAIN-NODE data structure in which edges must not cross. CONNECTED NODES are formed at all points where edges meet.
presentation In ECDIS the cartographic design including drawing, use of symbols, use of colours, use of conventional practices, etc.
Presentation Library In ECDIS a set of mostly digital specifications, composed of SYMBOL libraries, colour schemes, LOOK-UP TABLES and rules, linking every OBJECT CLASS and ATTRIBUTE of the SENC to the appropriate presentation of the ECDIS DISPLAY.
raster In ECDIS a regular array with information pertaining to each element (PIXEL) or group of elements. See also RASTER DATA PRESENTATION
Raster Chart Display System (RCDS)
In ECDIS means a navigation information system displaying RNCs with positional information from navigation sensors to assist the mariner in route planning and route monitoring, and if required, display additional navigation-related information.
Raster Navigational Chart (RNC)
A facsimile of a paper chart originated by, or distributed on the authority of, a government-authorized hydrographic office. It is either a single chart or a collection of charts.
RCDS See RASTER CHART DISPLAY SYSTEM. record In ECDIS, a TRANSFER STANDARD construct which is
comprised of one or more tagged FIELDS and identified by a KEY.
relationship In ECDIS a logical link between two elements from the DATA MODEL which may be spatial (e.g. TOPOLOGICAL relationship) and/or non-spatial. In general a relationship is implemented in the data structure as a POINTER.
S-32 Appendix 1 Page - 9
relative motion display In ECDIS, a DISPLAY in which OWN SHIP remains stationary, while all other charted information and targets move relative to own ship’s position. See also TRUE MOTION DISPLAY.
Regional ENC Coordinating Centre (RENC)
An organizational entity where IHO Member States have established cooperation amongst each other to guarantee a world-wide consistent level of high quality data, and for bringing about coordinated services with official ENCs and updates to them.
resolution The capability of depicting detail, represented by the smallest distance apart at which two objects can be seen to be separate. The separation is called the RESOLVING POWER. In ECDIS, it is dependent on PIXEL size.
RNC See RASTER NAVIGATIONAL CHART. route In ECDIS, a sequence of WAYPOINTS and LEGS. route monitoring In ECDIS, the operational navigational function in which the
chart information is displayed, under control of the positioning sensor input, according to the vessel’s present position (either in TRUE MOTION or RELATIVE MOTION DISPLAY mode.)
route planning In ECDIS the pre-determination of COURSE, speed, WAYPOINTS and radius in relation to the waters to be navigated, and in relation to other relevant information and conditions.
safety contour See OWN SHIP’s SAFETY CONTOUR safety depth In ECDIS the depth defined by the mariner, e.g. the ship’s draft
plus under keel clearance, to be used by the ECDIS to emphasize soundings on the DISPLAY equal to or less than this value.
scale bar A graduated line on a MAP, PLAN, PHOTOGRAPH, or MOSAIC, by means of which actual ground distances may be determined. Also called GRAPHIC SCALE or LINEAR SCALE. In ECDIS, a vertical bar scale of 1 nautical mile divided into 1/10ths, intended to convey an immediate sense of distance.
semi-automatic updating In ECDIS, the application of CORRECTIONS to ENC DATA in the SENC updating in a fully integrated state, by hard media or telecommunications transfer in a manner which requires human intervention at the ECDIS interface.
SENC See SYSTEM ELECTRONIC NAVIGATIONAL CHART simplified symbols In ECDIS SYMBOLS designed specifically for fast draw and
to give the maximum clarity under all conditions of viewing the CRT. They are less complex than the equivalent paper CHART SYMBOLS.
spaghetti data In ECDIS a DATA STRUCTURE in which all lines and points are unrelated to each other (i.e. no topological RELATIONSHIPS exist in the data structure)
S-32 Appendix 1 Page - 10
spatial object In ECDIS an OBJECT which contains locational information about real world ENTITIES.
spatial record In ECDIS the implemented term used in the IHO transfer standard data structure for a spatial object (i.e. a SPATIAL OBJECT as defined in the data model is encoded as a spatial record in the data structure). There are three types of spatial records: VECTOR, RASTER and MATRIX.
standard display See DISPLAY CATEGORY supplementary information In ECDIS non-chart hydrographic office information, such as
SAILING DIRECTIONS, TIDE TABLES, LIGHT LISTS. SRNC See SYSTEM RASTER NAVIGATIONAL CHART
DATABASE. System Electronic Navigational Chart (SENC)
In ECDIS means a database, in the manufacturer’s internal ECDIS format, resulting from the lossless transformation of the entire ENC contents and its updates. It is this database that is accessed by ECDIS for the display generation and other navigational functions, and is equivalent to an up-to-date paper chart. The SENC may also contain information added by the mariner and information from other sources.
System Raster Navigational Chart Database (SRNC)
In ECDIS means a database resulting from the transformation of the RNC by the RCDS to include updates to the RNC by appropriate means.
textual HO information In ECDIS information presently contained in separate publications (e.g. SAILING DIRECTIONS) which may be incorporated in the ENC, and also textual information contained in explanatory attributes of specific objects.
time varying object In ECDIS an OBJECT which has one or more ATTRIBUTES, the value or values of which vary with time.
topology In ECDIS and digital data, the set of properties of geometric forms (such as connectivity, neighbourhood) which is defined with the DATA MODEL remaining invariant when subject to a continuous transformation.
true-motion display In ECDIS, a DISPLAY in which OWN SHIP and each target moves with its own true motion, while the position of all charted information remains fixed. See also RELATIVE MOTION DISPLAY.
underscale In ECDIS the condition where data displayed are not the largest scale NAVIGATIONAL PURPOSE data available for that area.
update See UPDATE INFORMATION. (Verb) applying the UPDATE MECHANISM. See also OFFICIAL UPDATES.
update information In ECDIS, the data which are needed to update the TARGET DATA automatically. Update information comprises one or more UPDATE RECORDS.
S-32 Appendix 1 Page - 11
update mechanism In ECDIS, the defined sequence of update operations necessary to update the TARGET DATA by applying the UPDATE INFORMATION to the content of the TARGET DATA so that no operator interaction is involved.
update record In ECDIS a generic term for FEATURE or SPATIAL RECORDS containing update instructions.
warning In ECDIS an ALARM or INDICATION. water stabilization
In ECDIS the reference system relative to the water based on course- and speed-through-water sensors.
waypoint
In ECDIS in conjunction with ROUTE PLANNING, a geographical location (e.g. latitude and longitude) indicating a significant event on a vessel’s planned route (e.g. course alteration point, calling in point, etc.).
Worldwide Electronic Navigational Chart Data Base (WEND)
In ECDIS a common, worldwide network of ENC datasets, based on IHO standards, designed specifically to meet the needs of international maritime traffic using ECDIS which conform to the IMO PERFORMANCE STANDARDS.
zoom In ECDIS a method of enlarging (zoom in) or reducing (zoom out) graphics displayed on a SCREEN.
INTERNATIONAL HYDROGRAPHIC ORGANIZATION
IHO TRANSFER STANDARDfor
DIGITAL HYDROGRAPHIC DATA
Edition 3.1 - November 2000
Special Publication No. 57
Published by theInternational Hydrographic Bureau
MONACO
S-57
Edition 3.1 November 2000 S-57
Important notice
All “Clarifications” in the latest Edition of theMaintenance Document must be taken into accountbefore making use of this document.
Page intentionally left blank

S-57 November 2000 Edition 3.1
INTERNATIONAL HYDROGRAPHIC ORGANIZATION
IHO TRANSFER STANDARDfor
DIGITAL HYDROGRAPHIC DATA
Publication S-57
Edition 3.1 - November 2000
PART 1 - General Introduction
PART 2 - Theoretical Data Model
PART 3 - Data Structure
Appendix A - IHO Object Catalogue
Appendix B - Product Specifications
__________
Published by theInternational Hydrographic Bureau
4, Quai Antoine 1erB.P 445 - MC 98011 MONACO Cedex
Principauté de MonacoTelex: 479 164 MC - INHORGTelefax: (+377) 93 10 81 40
E-mail: [email protected] http://www.iho.shom.fr

Edition 3.1 November 2000 S-57
Important notice
All “Clarifications” in the latest edition of theMaintenance Document must be taken into accountbefore making use of this document.
Page intentionally left blank

S-57 November 2000 Edition 3.1
i
PREFACE
Edition 3.1 of the IHO Transfer Standard for Digital Hydrographic Data, Publication S-57,supersedes the previous Edition 3.0 dated November 1996. Edition 3.1 has been developed by theTransfer Standard Maintenance and Application Development Working Group (TSMAD) of the IHOCommittee on Hydrographic Requirements for Information Systems (CHRIS).
The origin of Edition 3.1 can be traced back to November 1994 when the requirement for adetailed ENC Product Specification (PS) was clearly identified at the 6th CoE 1 Meeting. A workshopfollowed in February 1995 with participation of ECDIS manufacturers, hydrographic offices and regulatoryauthorities, with a view to agreeing on the ENC PS contents. At this workshop, it also became apparentthat a new edition of S-57 was needed to satisfy both Hydrographic Offices and ECDIS manufacturers’requirements.
As a result, the DBWG 2 undertook the preparation of both Edition 3.0 of S-57 and the associatedENC PS. It met four times during 1995/1996 to complete the work. Changes from Version 2.0 includeda binary implementation of the format, in addition to the existing ASCII one; a new cell structure concept;a revised updating mechanism based on unique object identifiers; and a more comprehensive data model.
The contents of the Standard were also significantly re-organized for Edition 3.0 so as to comprisea main section and two appendices. The main section is formed of three parts: a general introduction tothe Standard, a theoretical data model and a description of the data structure. The two appendices containthe Object Catalogue of S-57 and Product Specifications (PS) for different applications. The PS for ENCis of particular interest to ECDIS manufacturers.
It was decided that Edition 3.0 should be frozen, i.e. remained unaltered, for four years fromNovember 1996 onwards, in order to facilitate ENC data production by HOs and the development ofECDIS equipment by manufacturers.
Based on practical experience, some Hydrogaphic Offices identified a limited number of attributevalues that they required for ENC purposes but which were not contained in Edition 3.0. It was thereforeagreed that a limited new edition of S-57, Edition 3.1, would be published at the end of the four-yearperiod, which would incorporate only these additional attribute values.
S-57 Edition 3.1 was officially made available in November 2000. A familiarization version washowever distributed in November 1999 to allow data producers and equipment manufacturers time tofamiliarize themselves with the new content. Edition 3.1 will remain frozen until at least November 2002.
1 Former Committee on ECDIS, now redefined as “CHRIS”.2 Data Base Working Group, now redefined as "TSMAD".

Edition 3.1 November 2000 S-57
ii
All components of the Standard will remain unchanged for the duration of the freeze period, withthe exeption of the “Use of the Object Catalogue for ENC”, “IHO Codes for Producing Agencies”,“Recommended ENC Validation Checks” and “INT 1 to S-57 Cross Reference” documents. Subsequenteditions of which will be published as required in the course of the freeze period. Any “Corrections” or“Extensions” required for future editions of S-57, and any “Clarifications” to the existing frozen text, willbe recorded in the “cumulative Maintenance Document”. (Available from the IHO web site:http://www.iho.shom.fr). The MD document is usually updated after meetings of the TSMADWorking Group.
RAdm Neil GUY, IHB DirectorChairman, IHO CHRISNovember 2000
S-57 November 2000 Edition 3.1
iii
CONTENTS
S-57 Part 1 General Introduction………………………………………………………………...1.11. Scope…………………………………………………………………………………………………… 1.12. Structure of the standard…………………………………………………………………………… 1.13. ISO/IEC 8211 encapsulation………………………………………………………………………... 1.14. References…………………………………………………………………………………………….. 1.15. Definitions…………………………………………………………………………………………….. 1.26. Conformance………………………………………………………………………………………….. 1.67. Maintenance…………………………………………………………………………………………… 1.6
S-57 Part 2 Theoretical data model1. Model introduction…………………………………………………………………………………….. 2.12. Model implementation………………………………………………………………………………… 2.1
2.1 Feature objects……………………………………………………………………………………. 2.12.2 Spatial objects………………………………………………………………………………………2.2
2.2.1 Vector model…………………………………………………………………………………… 2.22.2.1.1 Cartographic spaghetti…………………………………………………………………… 2.42.2.1.2 Chain-node………………………………………………………………………………… 2.42.2.1.3 Planar graph………………………………………………………………………………. 2.42.2.1.4 Full topology………………………………………………………………………………. 2.4
2.2.2 Raster model…………………………………………………………………………………… 2.52.2.3 Matrix model……………………………………………………………………………………. 2.5
3. Presentation……………………………………………………………………………………………. 2.5
S-57 Part 3 Data Structure1. Structure introduction…………………………………………………………………………………. 3.1
1.1 Model to structure translation…………………………………………………………………….. 3.11.2 Records…………………………………………………………………………………………….. 3.3
1.2.1 General…………………………………………………………………………………………..3.31.2.2 Data set descriptive records………………………………………………………………….. 3.31.2.3 Catalogue records………………………………………………………………………………3.31.2.4 Data dictionary records……………………………………………………………………… 3.41.2.5 Feature records…………………………………………………………………………………3.41.2.6 Spatial records…………………………………………………………………………………. 3.4
1.2.6.1 Vector records…………………………………………………………………………….. 3.41.2.6.2 Raster records…………………………………………………………………………….. 3.41.2.6.3 Matrix records………………………………………………………………………………3.4
1.3 Meta data…………………………………………………………………………………………… 3.51.4 Rules for specific applications……………………………………………………………………. 3.5
1.4.1 Product specifications…………………………………………………………………………. 3.51.4.2 Application profiles…………………………………………………………………………….. 3.5
2. General coding conventions…………………………………………………………………………..3.72.1 Omitted constructs………………………………………………………………………………….3.72.2 Record identifier…………………………………………………………………………………….3.7
2.2.1 Record name RCNM]………………………………………………………………………..…3.82.2.2 Record identification number [RCID]………………………………………………………… 3.8
2.3 Use of non-Object Catalogue codes and values………………………………………………. 3.82.4 Use of character sets…………………………………………………………………………… 3.92.5 Field and Subfield termination…………………………………………………………………...3.102.6 Floating point values……………………………………………………………………………...3.102.7 Media and size restrictions……………………………………………………………………… 3.102.8 Data quality……………………………………………………………………………………….. 3.11
Edition 3.1 November 2000 S-57
iv
3. Meta record coding conventions…………………………………………………………………….3.123.1 Topology………………………………………………………………………………………….. 3.123.2 Coordinate system, units and projection……………………………………………………… 3.12
3.2.1 Coordinate units……………………………………………………………………………… 3.133.2.2 Projection and registration control…………………………………………………………. 3.13
3.3 3-D (sounding) multiplication factor……………………………………………………………. 3.143.4 Checksums……………………………………………………………………………………….. 3.15
4. Feature record coding conventions…………………………………………………………………3.164.1 General……………………………………………………………………………………………. 3.164.2 Feature record identifier field…………………………………………………………………….3.16
4.2.1 Object geometric primitive [PRIM] subfield…………………………………………………3.174.2.2 Group [GRUP] subfield………………………………………………………………………. 3.174.2.3 Object label/code [OBJL] subfield………………………………………………………….. 3.17
4.3 Feature object identifier field……………………………………………………………………. 3.174.3.1 Producing agency [AGEN] subfield………………………………………………………… 3.184.3.2 Feature Object identification number and subdivision [FIDN, FIDS] subfield…………..3.18
4.4 Feature record attribute field……………………………………………………………………. 3.184.5 Feature record national attribute field………………………………………………………….. 3.184.6 Feature record to feature object pointer field…………………………………………………..3.184.7 Feature record to spatial record pointer field…………………………………………………..3.19
4.7.1 Feature record to spatial record pointer field — use by point features…………………. 3.194.7.2 Feature record to spatial record pointer field — use by line features……………………3.194.7.3 Feature record to spatial record pointer field — use by area features…………………..3.20
4.7.3.1 General…………………………………………………………………………………… 3.204.7.3.2 Direction of area boundaries…………………………………………………………… 3.214.7.3.3 Interior and exterior boundaries……………………………………………………….. 3.214.7.3.4 Masking of area boundaries…………………………………………………………… 3.22
5. Spatial record coding conventions…………………………………………………………………. 3.235.1 Vector records……………………………………………………………………………………. 3.23
5.1.1 Vector record identifier field…………………………………………………………………. 3.235.1.2 Vector record attribute field…………………………………………………………………..3.235.1.3 Vector record pointer field…………………………………………………………………… 3.24
5.1.3.1 Vector record pointer field — use by isolated nodes……………………………….. 3.245.1.3.2 Vector record pointer field — use by edges…………………………………………. 3.245.1.3.3 Vector record pointer field — use by faces………………………………………….. 3.25
5.1.4 Coordinate fields……………………………………………………………………………… 3.255.1.4.1 Coordinate fields — use by soundings……………………………………………….. 3.265.1.4.2 Coordinate fields — use by isolated nodes………………………………………….. 3.265.1.4.3 Coordinate fields — use by connected nodes……………………………………….. 3.265.1.4.4 Coordinate fields — use by edges…………………………………………………….. 3.26
5.2 Raster record coding conventions……………………………………………………………… 3.285.3 Matrix record coding conventions……………………………………………………………….3.28
6. Relationship coding………………………………………………………………………………….. 3.296.1 Catalogue Cross Reference record……………………………………………………………. 3.296.2 Collection feature record………………………………………………………………………… 3.296.3 Nominated "master" feature record……………………………………………………………..3.30
7. Structure implementation…………………………………………………………………………….3.317.1 Introduction……………………………………………………………………………………….. 3.317.2 Notations used in this clause…………………………………………………………………….3.31
7.2.1 Tree structure diagrams………………………………………………………………………3.317.2.2 Field tables……………………………………………………………………………………..3.32
7.2.2.1 Data format………………………………………………………………………………. 3.337.2.2.2 Permitted S-57 (ASCII) Data domains…………………………………………………3.34
7.3 Data set descriptive records……………………………………………………………………..3.34
S-57 November 2000 Edition 3.1
v
7.3.1 Data set general information record structure…………………………………………….. 3.347.3.1.1 Data set identification field structure………………………………………………….. 3.347.3.1.2 Data set structure information field structure………………………………………… 3.35
7.3.2 Data set geographic reference record structure………………………………………….. 3.367.3.2.1 Data set parameter field structure…………………………………………………….. 3.367.3.2.2 Data set projection field structure………………………………………………………3.377.3.2.3 Data set registration control field structure…………………………………………… 3.37
7.3.3 Data set history record structure……………………………………………………………. 3.387.3.4 Data set accuracy record structure………………………………………………………… 3.38
7.4 Catalogue records……………………………………………………………………………….. 3.397.4.1 Catalogue directory record structure……………………………………………………….. 3.397.4.2 Catalogue cross reference record structure………………………………………………..3.40
7.5 Data dictionary records………………………………………………………………………….. 3.407.5.1 Data dictionary definition record structure…………………………………………………. 3.40
7.5.1.1 Data dictionary definition field structure………………………………………………. 3.417.5.1.2 Data dictionary definition reference field structure………………………………….. 3.41
7.5.2 Data dictionary domain record structure…………………………………………………… 3.427.5.2.1 Data dictionary domain identifier field structure……………………………………… 3.427.5.2.2 Data dictionary domain field structure………………………………………………… 3.427.5.2.3 Data dictionary domain reference field structure……………………………………. 3.43
7.5.3 Data dictionary schema record structure…………………………………………………. 3.437.5.3.1 Data dictionary schema identifier field structure…………………………………….. 3.437.5.3.2 Data dictionary schema field structure…………………………………………………3.44
7.6 Feature record structure………………………………………………………………………….3.447.6.1 Feature record identifier field structure…………………………………………………….. 3.447.6.2 Feature object identifier field structure……………………………………………………...3.457.6.3 Feature record attribute field structure……………………………………………………...3.457.6.4 Feature record national attribute field structure…………………………………………… 3.457.6.5 Feature record to feature object pointer control field structure………………………….. 3.467.6.6 Feature record to feature object pointer field structure………………………………….. 3.467.6.7 Feature record to spatial record pointer control field structure…………………………. 3.467.6.8 Feature record to spatial record pointer field structure………………………………….. 3.47
7.7 Spatial record structure…………………………………………………………………………. 3.477.7.1 Vector record structure………………………………………………………………………. 3.47
7.7.1.1 Vector record identifier field structure………………………………………………….3.487.7.1.2 Vector record attribute field structure…………………………………………………..3.487.7.1.3 Vector record pointer control field structure………………………………………….. 3.487.7.1.4 Vector record pointer field structure……………………………………………………3.497.7.1.5 Coordinate control field structure……………………………………………………….3.497.7.1.6 2-D Coordinate field structure…………………………………………………………..3.507.7.1.7 3-D Coordinate field structure…………………………………………………………..3.507.7.1.8 Arc/Curve definition field structure…………………………………………………….. 3.507.7.1.9 Arc coordinates field structure…………………………………………………………. 3.517.7.1.10 Ellipse coordinates field structure…………………………………………………… 3.517.7.1.11 Curve coordinates field structure……………………………………………………..3.52
7.7.2 Raster record structure……………………………………………………………………….3.527.7.3 Matrix record structure………………………………………………………………………. 3.52
8. Updating………………………………………………………………………………………………. 3.538.1 General……………………………………………………………………………………………. 3.538.2 Update data flow…………………………………………………………………………………..3.538.3 Identity of constructs within the update mechanism…………………………………………..3.54
8.3.1 General…………………………………………………………………………………………3.548.3.2 Record identity within the update mechanism…………………………………………….. 3.548.3.3 Attribute identity within the update mechanism…………………………………………….3.548.3.4 Pointer identity within the update mechanism…………………………………………….. 3.54
Edition 3.1 November 2000 S-57
vi
8.3.5 Coordinate identity within the update mechanism………………………………………… 3.548.4 Update record…………………………………………………………………………………….. 3.55
8.4.1 General…………………………………………………………………………………………3.558.4.2 Constructs for updating the feature record…………………………………………………3.55
8.4.2.1 Record version subfield — use for feature record…………………………………… 3.558.4.2.2 Record update instruction subfield — use for feature record………………………. 3.55
a. Modification of the ATTF and NATF fields……………………………………………...3.56b. Modification of the FFPT and FSPT fields……………………………………………...3.56
8.4.2.3 Feature record to feature object pointer control field…………………………………3.568.4.2.4 Feature record to spatial record pointer control field…………………………………3.57
8.4.3 Constructs for updating the vector record…………………………………………………..3.588.4.3.1 Record version subfield — use for vector record……………………………………. 3.588.4.3.2 Record update instruction subfield — use for vector record……………………….. 3.58
a. Modification of the ATTV field…………………………………………………………… 3.58b. Modification of the VRPT field……………………………………………………………3.58c. Modification of the SG2D, SG3D, AR2D and EL2D fields…………………………….3.59
8.4.3.3 Coordinate control field…………………………………………………………………. 3.59
Annex A - ISO/IEC 8211 summary and examplesA. ISO/IEC 8211 summary and examples………………………………………………………… 3.A.1
A.1 Relationship between the data structure and the encapsulation…………………………. 3.A.1A.2 ISO/IEC 8211 interchange file structure…………………………………………………… 3.A.1
A.2.1 Logical records……………………………………………………………………………… 3.A.1A.2.2 Leader……………………………………………………………………………………….. 3.A.2
A.2.2.1 DDR leader……………………………………………………………………………. 3.A.2A.2.2.2 DR leader……………………………………………………………………………… 3.A.3
A.2.3 Directory……………………………………………………………………………………… 3.A.3A.2.4 Field area…………………………………………………………………………………….. 3.A.3
A.2.4.1 Field area of the DDR………………………………………………………………… 3.A.4a. Field control field…………………………………………………………………………. 3.A.4b. Data descriptive fields…………………………………………………………………….3.A.4
A.2.4.2 Field area of the DR's………………………………………………………………….3.A.5A.3 Use of ISO/IEC 8211 for S-57…………………………………………………………………. 3.A.5A.4 Example of an exchange file……………………………………………………………………3.A.6
A.4.1 ASCII example………………………………………………………………………………. 3.A.7A.4.2 Binary example……………………………………………………………………………….3.A.9
S-57 November 2000 Edition 3.1
vii
B. Alternate character setsB.1 Implementation of alternate character sets in S-57…………………………………………. 3.B.1B.2 Implementation of alternate character sets in ISO/IEC 8211………………………………. 3.B.1B.3 Code tables……………………………………………………………………………………….3.B.2
B.3.1 General……………………………………………………………………………………….. 3.B.2B.3.2 Level 0 Text Repertoire……………………………………………………………………...3.B.3B.3.3 Level 1 Text Repertoire…………………………………………………………………….. 3.B.4B.3.4 Level 2 Text Repertoire…………………………………………………………………….. 3.B.5
Appendixes
A. IHO Object Catalogue
B. Product SpecificationsB.1 ENC product specificationB.2 IHO Object Catalogue Data Dictionary product specification

Edition 3.1 November 2000 S-57
viii
Page intentionally left blank

S-57 Part 1General Introduction
Edition 3.1

General Introduction
Edition 3.1 November 2000 S-57 Part 1
Important notice
All “Clarifications” in the latest edition of theMaintenance Document must be taken into accountbefore making use of this document.
Page intentionally left blank
General Introduction
S-57 Part 1 November 2000 Edition 3.1
1.1
1. Scope
The publication “S-57—IHO Transfer Standard for Digital Hydrographic Data” describes the standard tobe used for the exchange of digital hydrographic data between national hydrographic offices and for itsdistribution to manufacturers, mariners and other data users. For example, this standard is intended tobe used for the supply of data for ECDIS. This transfer and distribution has to take place in such a waythat none of the meaning of the data is lost.
The Standard was prepared by the International Hydrographic Organization's (IHO) Committee onHydrographic Requirements for Information Systems (CHRIS).
The Standard was adopted as the official IHO standard, by the XIVth International HydrographicConference, Monaco, 4-15 May 1992.
2. Structure of the standard
The contents of this standard are organized as follows:
Part 1 provides a general introduction including a list of references and definitions of terms used in the restof the Standard.
Part 2 describes the theoretical data model on which the entire Standard is based.
Part 3 defines the data structure or format that is used to implement the data model and defines thegeneral rules for encoding data into that format.
The Standard also has two appendixes:
Appendix A is the Object Catalogue. This provides the official, IHO approved data schema that can beused within an exchange set to describe entities in the real world.
Appendix B contains the IHO approved Product Specifications. These are additional sets of rulesapplicable to specific applications.
3. ISO/IEC 8211 encapsulation
S-57 uses the international standard ISO/IEC 8211 (“Specification for a data descriptive file for informationinterchange”) as a means of encapsulating data. The ISO/IEC 8211 standard provides a file basedmechanism for the transfer of data from one computer system to another, independent of make. Inaddition, it is independent of the medium used to establish such a transfer. It permits the transfer of dataand also the description of how such data is organized.
4. References
This Standard is based upon the specifications contained in the standards listed below. All standards aresubject to revision, therefore, parties to agreements based on this Standard are encouraged to use themost recent editions of the standards indicated below. Members of IEC and ISO maintain registers ofcurrently valid international standards.
General Introduction
Edition 3.1 November 2000 S-57 Part 1
1.2
ISO/IEC 646, “Information technology - ISO 7-bit coded character set for information interchange”
ISO 2022, “Information processing - ISO 7-bit and 8-bit coded character sets - Code extensiontechniques”
ISO 2375, “Data processing - Procedure for registration of escape sequences”
ISO 6093, “Information processing - Representation of numerical values in character strings forinformation interchange”
ISO 6937, “Information processing - Coded character sets for text communication”
ISO/IEC 8211, “Information processing - Specification for a data descriptive file for informationinterchange”
ISO 8859, “Information processing - 8-bit single-byte coded graphic character setsPart 1: Latin alphabet No.1"
ISO/IEC 10646, “Information technology - Universal Multiple-Octet Coded Character Set (UCS)Part 1: Architecture and Basic Multilangual Plane”
5. Definitions
The following are definitions of various terms as used in S-57.
Application profile A defined subset of the S-57 data structure.
Applier The entity (software) controlling the application of the update information.
Attribute A characteristic of an object. It is implemented by a defined attribute label/code,acronym, definition and applicable values (see Appendix A, IHO ObjectCatalogue). In the data structure, the attribute is identified by its label/code. Theacronym is only used as a quick reference in related documents and productspecifications. Attributes are either qualitative or quantitative.
Attribute label/code A fixed length numeric label or a 2-byte unsigned integer code of an attribute asdefined in Appendix A, the IHO Object Catalogue.
Base data S-57 conforming data at the data producer’s site that does not contain anyupdate records. Once this data is exchanged it becomes target data at theapplier’s site.
Blank ASCII space (2/0).
Chain-node *) Data structure in which the geometry is described in terms of edges, isolatednodes and connected nodes. Edges and connected nodes are topologicallylinked. Nodes are explicitely coded in the data structure.
*) Previously known in S-57 2.0 as chain-explicit-node.
Connected node A node referred to as a beginning and/or end node by one or more edge.Connected nodes are defined only in the chain-node, planar graph and fulltopology data structures.

General Introduction
S-57 Part 1 November 2000 Edition 3.1
1.3
Data set A logical grouping of S-57 data to which the S-57 data set descriptive recordsapply. The data set descriptive records contain meta data. The use of data setdescriptive records is product specific and is, therefore, defined by a productspecification. If the data set descriptive records are repeated for each file in anexchange set, an instance of a file containing the data set descriptive recordsis called a data set. If the data set descriptive records are encoded generally forthe whole exchange set, the exchange set is referred to as a data set.
Domain The set of all permissible values for an attribute.
Edge A one-dimensional spatial object, located by two or more coordinate pairs (ortwo connected nodes) and optional interpolation parameters. If the parametersare missing, the interpolation is defaulted to straight line segments between thecoordinate pairs. In the chain-node, planar graph and full topology datastructures, an edge must reference a connected node at both ends and mustnot reference any other nodes.
Encapsulation The identification of fields and records and the grouping of fields and recordsand the data syntax rules used.
Enumerated A domain defined by an arbitrary value; each value is explicitly listed anddescribed.
Exchange set The set of files representing a complete, single purpose (i.e. product specific)data transfer. For example, the “ENC product specification” defines anexchange set which contains one Catalogue file and at least one Data Set file.
Face A two dimensional spatial object. A face is a continuous area defined by a loopof one or more edges which bound it. A face may contain interior holes, definedby closing loops of edges. These interior boundaries must be within the outerboundary. No boundary may cross itself or touch itself other than at thebeginning/end node. None of the boundaries may touch or cross any otherboundary. Faces are defined only in the full topology data structure.
Feature object An object which contains the non-locational information about real world entities.Feature objects are defined in Appendix A, IHO Object Catalogue.
Feature record A feature record is the implemented term used in the S-57 data structure for afeature object (i.e. a feature object as defined in the data model is encoded asa feature record in the data structure). There are four types of feature records:geo, meta, collection and cartographic.
Field A named collection of labeled subfield(s). For example, IHO attribute label/codeand IHO Attribute Value are collected into a field named Feature RecordAttribute.
File An identified set of S-57 records collected together for a specific purpose. Thefile content and structure must be defined by a product specification.
Foreign key The key or the object identifier of one record and held by another record as areference. In the case of a reference between feature records, the foreign keyis always the object identifier of the referenced feature record. In all other casesthe foreign key is the key of the referenced record. The foreign key is held in thepointer field.
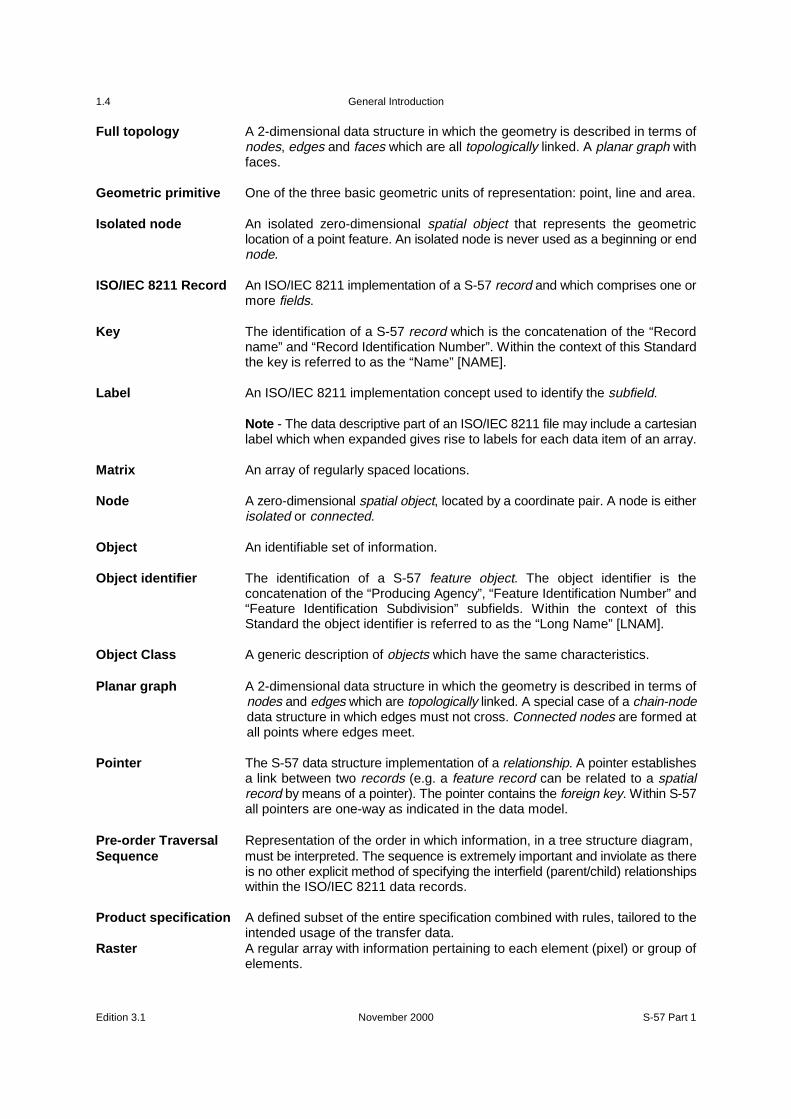
General Introduction
Edition 3.1 November 2000 S-57 Part 1
1.4
Full topology A 2-dimensional data structure in which the geometry is described in terms ofnodes, edges and faces which are all topologically linked. A planar graph withfaces.
Geometric primitive One of the three basic geometric units of representation: point, line and area.
Isolated node An isolated zero-dimensional spatial object that represents the geometriclocation of a point feature. An isolated node is never used as a beginning or endnode.
ISO/IEC 8211 Record An ISO/IEC 8211 implementation of a S-57 record and which comprises one ormore fields.
Key The identification of a S-57 record which is the concatenation of the “Recordname” and “Record Identification Number”. Within the context of this Standardthe key is referred to as the “Name” [NAME].
Label An ISO/IEC 8211 implementation concept used to identify the subfield.
Note - The data descriptive part of an ISO/IEC 8211 file may include a cartesianlabel which when expanded gives rise to labels for each data item of an array.
Matrix An array of regularly spaced locations.
Node A zero-dimensional spatial object, located by a coordinate pair. A node is eitherisolated or connected.
Object An identifiable set of information.
Object identifier The identification of a S-57 feature object. The object identifier is theconcatenation of the “Producing Agency”, “Feature Identification Number” and“Feature Identification Subdivision” subfields. Within the context of thisStandard the object identifier is referred to as the “Long Name” [LNAM].
Object Class A generic description of objects which have the same characteristics.
Planar graph A 2-dimensional data structure in which the geometry is described in terms ofnodes and edges which are topologically linked. A special case of a chain-nodedata structure in which edges must not cross. Connected nodes are formed atall points where edges meet.
Pointer The S-57 data structure implementation of a relationship. A pointer establishesa link between two records (e.g. a feature record can be related to a spatialrecord by means of a pointer). The pointer contains the foreign key. Within S-57all pointers are one-way as indicated in the data model.
Pre-order Traversal Representation of the order in which information, in a tree structure diagram,Sequence must be interpreted. The sequence is extremely important and inviolate as there
is no other explicit method of specifying the interfield (parent/child) relationshipswithin the ISO/IEC 8211 data records.
Product specification A defined subset of the entire specification combined with rules, tailored to theintended usage of the transfer data.
Raster A regular array with information pertaining to each element (pixel) or group ofelements.
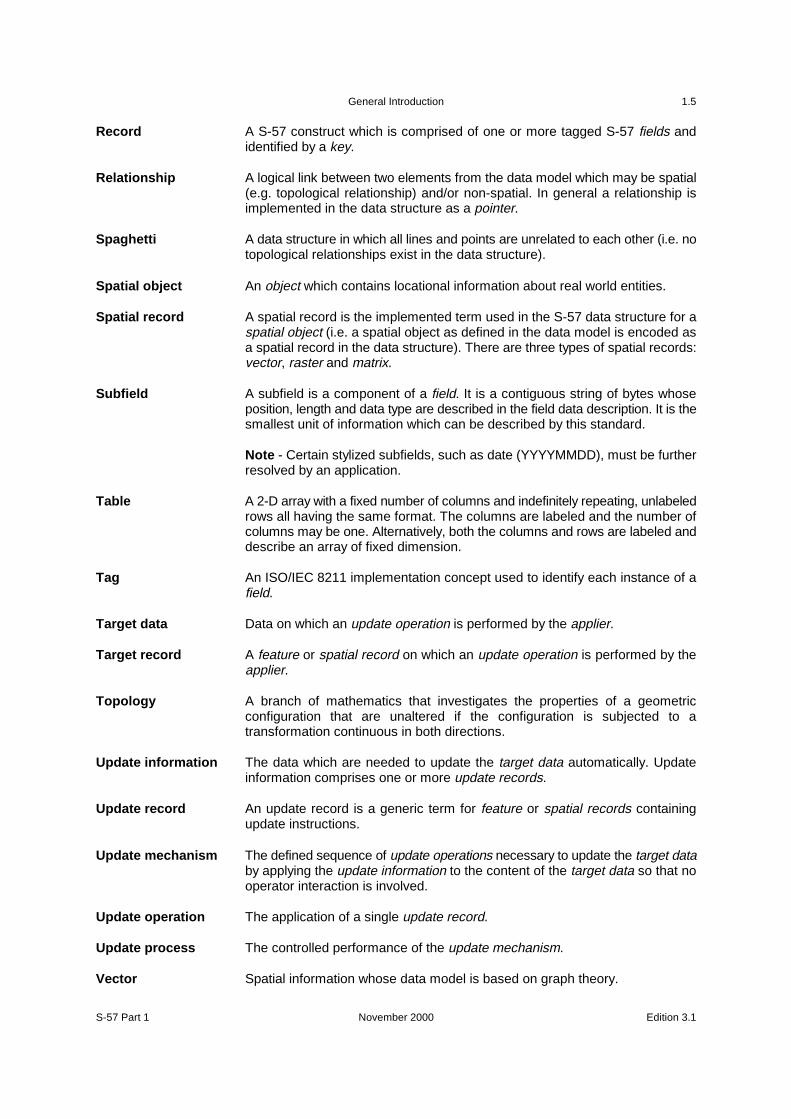
General Introduction
S-57 Part 1 November 2000 Edition 3.1
1.5
Record A S-57 construct which is comprised of one or more tagged S-57 fields andidentified by a key.
Relationship A logical link between two elements from the data model which may be spatial(e.g. topological relationship) and/or non-spatial. In general a relationship isimplemented in the data structure as a pointer.
Spaghetti A data structure in which all lines and points are unrelated to each other (i.e. notopological relationships exist in the data structure).
Spatial object An object which contains locational information about real world entities.
Spatial record A spatial record is the implemented term used in the S-57 data structure for aspatial object (i.e. a spatial object as defined in the data model is encoded asa spatial record in the data structure). There are three types of spatial records:vector, raster and matrix.
Subfield A subfield is a component of a field. It is a contiguous string of bytes whoseposition, length and data type are described in the field data description. It is thesmallest unit of information which can be described by this standard.
Note - Certain stylized subfields, such as date (YYYYMMDD), must be furtherresolved by an application.
Table A 2-D array with a fixed number of columns and indefinitely repeating, unlabeledrows all having the same format. The columns are labeled and the number ofcolumns may be one. Alternatively, both the columns and rows are labeled anddescribe an array of fixed dimension.
Tag An ISO/IEC 8211 implementation concept used to identify each instance of afield.
Target data Data on which an update operation is performed by the applier.
Target record A feature or spatial record on which an update operation is performed by theapplier.
Topology A branch of mathematics that investigates the properties of a geometricconfiguration that are unaltered if the configuration is subjected to atransformation continuous in both directions.
Update information The data which are needed to update the target data automatically. Updateinformation comprises one or more update records.
Update record An update record is a generic term for feature or spatial records containingupdate instructions.
Update mechanism The defined sequence of update operations necessary to update the target databy applying the update information to the content of the target data so that nooperator interaction is involved.
Update operation The application of a single update record.
Update process The controlled performance of the update mechanism.
Vector Spatial information whose data model is based on graph theory.

General Introduction
Edition 3.1 November 2000 S-57 Part 1
1.6
Volume An exchangeable physical unit of storage media (e.g. a reel of magnetic tape).A volume may contain part of a file, a complete file or more than one file.
6. Conformance
An exchange set conforms to this standard when all of its contents conform to the specifications of thisstandard. Requirements for specific user applications must be defined by a product specification. Whenincluded in Appendix B, these product specifications form an integral part of this standard. An exchangeset based on any of these product specifications, therefore, conforms to this standard.Any statement of conformance must specify the edition number of this standard and the productspecification on which it is based.
7. Maintenance
Changes to this Standard are coordinated by the “Transfer Standard Maintenance Working Group”(TSMWG) of the IHO. National hydrographic offices which wish changes to be made to the standard,either to correct errors which they have identified or to enhance its applicability, must address theircomments to the International Hydrographic Bureau. Other users of the Standard, for example equipmentmanufacturers, must address their comments to their national hydrographic office. (Addresses of IHOMember States' hydrographic offices can be found in IHO Yearbook, publication P-05).
The International Hydrographic Bureau maintains the Standard by means of the following threedocuments:
Clarifications Document. This contains improvements to the wording of the Standard. These are editorialamendments which do not result in any substantive change to the Standard. The clarifications documentis distributed with the Standard and its contents are also available on the IHB's Bulletin Board System (Tel:377 93 10 81 27-28) and on the IHO Web site (http://www.iho.shom.fr).
Corrections Document. This contains changes to the Standard to correct factual errors and makenecessary amendments to the Standard. The corrections document is distributed with the Standard andits contents are also available on the IHB's Bulletin Board System (Tel: 377 93 10 81 27-28) and on theIHO Web site (http://www.iho.shom.fr).
Extensions Document. This contains extensions, or other significant changes to the Standard, which havebeen agreed by the appropriate IHO committee or working group and will be included in the next editionof the standard. This is a working document which is only available on demand.
These documents, and the associated maintenance mechanism, do not apply to the product specificationscontained in Appendix B of this Standard. The maintenance procedure for a particular productspecification is described in that specification.

S-57 Part 2Theoretical data model
Edition 3.1

Theoretical data model
Edition 3.1 November 2000 S-57 Part 2
Important notice
All “Clarifications” in the latest edition of theMaintenance Document must be taken into accountbefore making use of this document.
Page intentionally left blank
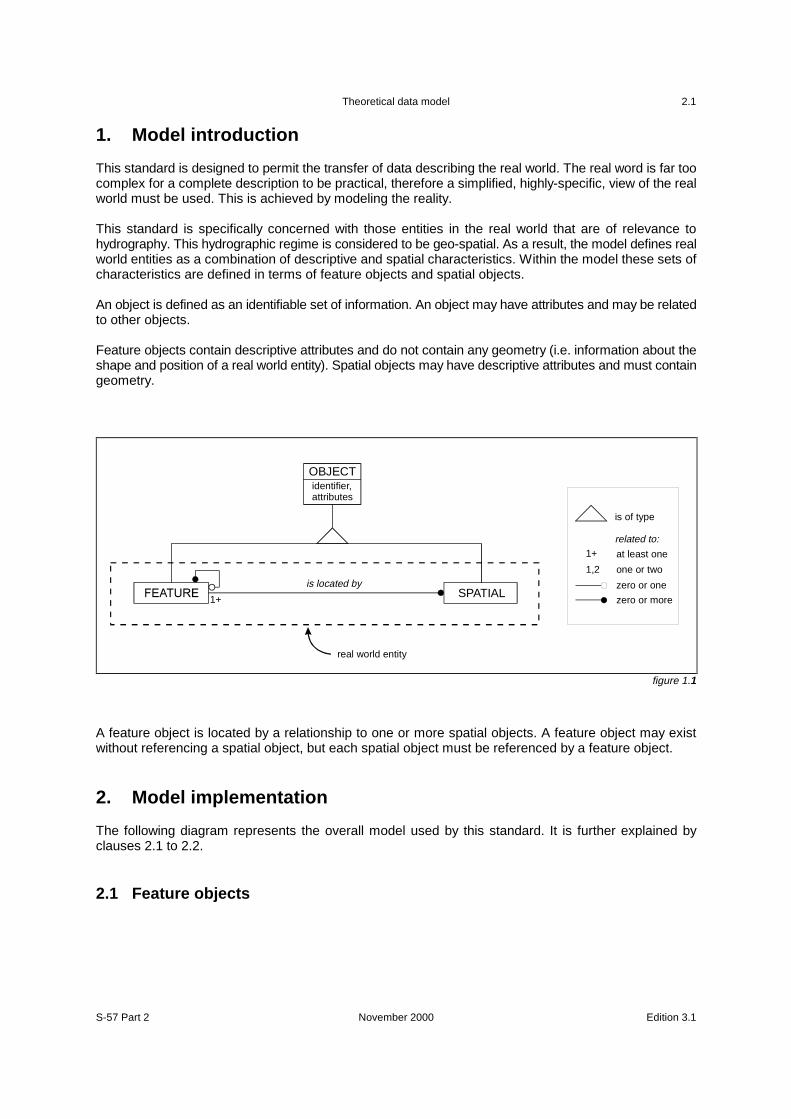
Theoretical data model
S-57 Part 2 November 2000 Edition 3.1
2.1
1. Model introduction
This standard is designed to permit the transfer of data describing the real world. The real word is far toocomplex for a complete description to be practical, therefore a simplified, highly-specific, view of the realworld must be used. This is achieved by modeling the reality.
This standard is specifically concerned with those entities in the real world that are of relevance tohydrography. This hydrographic regime is considered to be geo-spatial. As a result, the model defines realworld entities as a combination of descriptive and spatial characteristics. Within the model these sets ofcharacteristics are defined in terms of feature objects and spatial objects.
An object is defined as an identifiable set of information. An object may have attributes and may be relatedto other objects.
Feature objects contain descriptive attributes and do not contain any geometry (i.e. information about theshape and position of a real world entity). Spatial objects may have descriptive attributes and must containgeometry.
A feature object is located by a relationship to one or more spatial objects. A feature object may existwithout referencing a spatial object, but each spatial object must be referenced by a feature object.
2. Model implementation
The following diagram represents the overall model used by this standard. It is further explained byclauses 2.1 to 2.2.
2.1 Feature objects
SPATIALis located by
1+
1+
1,2
real world entity
is of type
at least one
one or two
related to:
zero or more
zero or one
OBJECTidentifier,attributes
figure 1.1
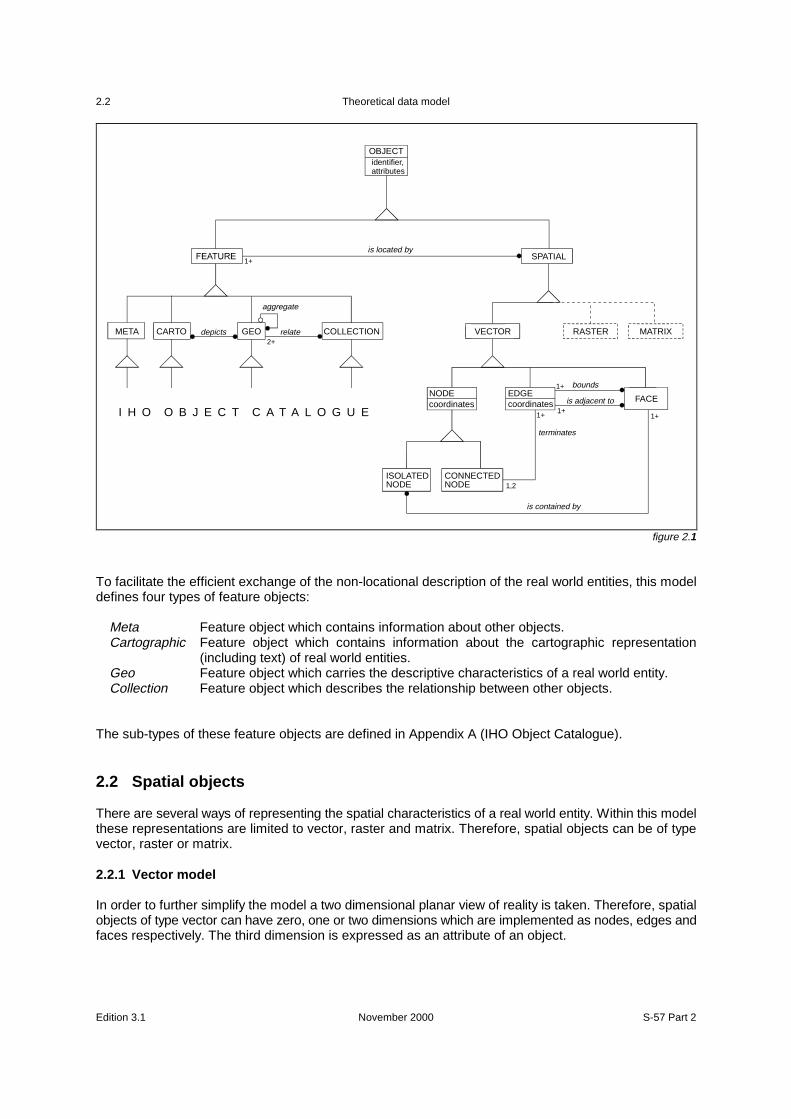
Theoretical data model
Edition 3.1 November 2000 S-57 Part 2
2.2
To facilitate the efficient exchange of the non-locational description of the real world entities, this modeldefines four types of feature objects:
Meta Feature object which contains information about other objects.Cartographic Feature object which contains information about the cartographic representation
(including text) of real world entities.Geo Feature object which carries the descriptive characteristics of a real world entity.Collection Feature object which describes the relationship between other objects.
The sub-types of these feature objects are defined in Appendix A (IHO Object Catalogue).
2.2 Spatial objects
There are several ways of representing the spatial characteristics of a real world entity. Within this modelthese representations are limited to vector, raster and matrix. Therefore, spatial objects can be of typevector, raster or matrix.
2.2.1 Vector model
In order to further simplify the model a two dimensional planar view of reality is taken. Therefore, spatialobjects of type vector can have zero, one or two dimensions which are implemented as nodes, edges andfaces respectively. The third dimension is expressed as an attribute of an object.
I H O O B J E C T C A T A L O G U E
COLLECTION
SPATIAL
VECTOR RASTER
FACE
ISOLATEDNODE
CONNECTEDNODE
MATRIXCARTOMETA
NODEcoordinates
EDGEcoordinates
GEOdepicts relate
aggregate
is located by
bounds
is adjacent to
terminates
is contained by
2+
1+
1,2
1+1+1+
1+
OBJECTidentifier,attributes
figure 2.1
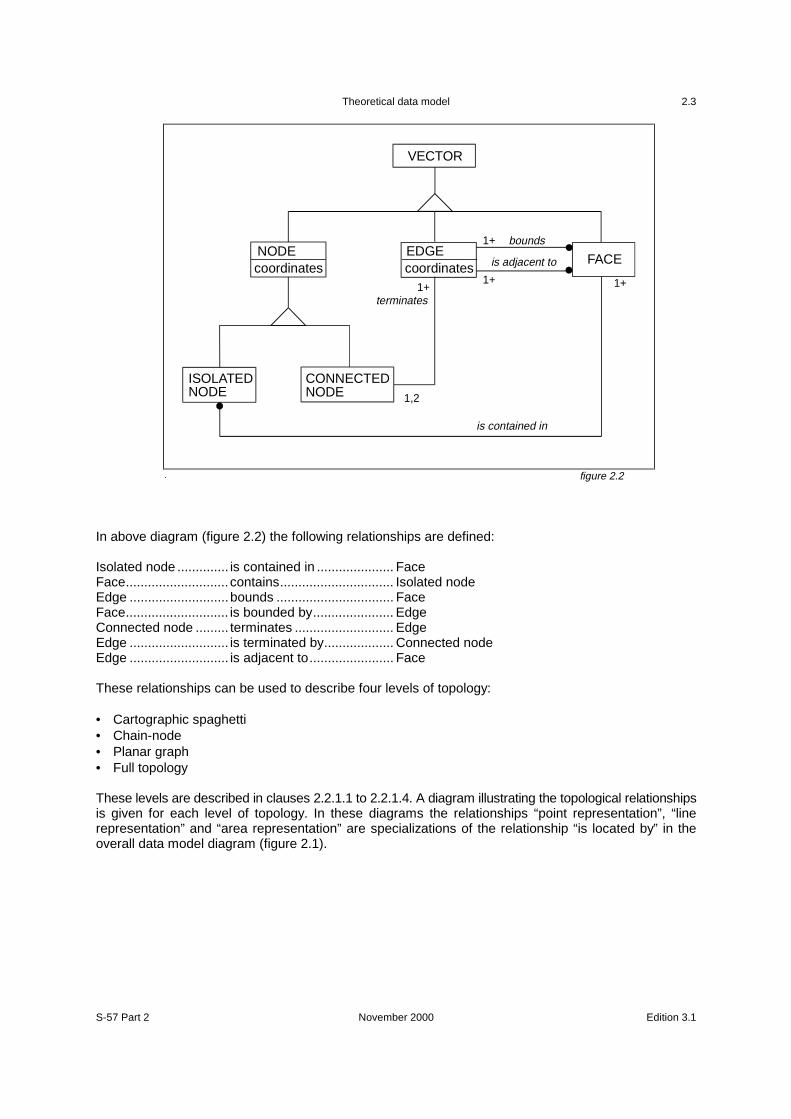
Theoretical data model
S-57 Part 2 November 2000 Edition 3.1
2.3
In above diagram (figure 2.2) the following relationships are defined:
Isolated node .............. is contained in ..................... FaceFace............................ contains............................... Isolated nodeEdge ...........................bounds ................................ FaceFace............................ is bounded by...................... EdgeConnected node ......... terminates ........................... EdgeEdge ........................... is terminated by................... Connected nodeEdge ........................... is adjacent to....................... Face
These relationships can be used to describe four levels of topology:
• Cartographic spaghetti• Chain-node• Planar graph• Full topology
These levels are described in clauses 2.2.1.1 to 2.2.1.4. A diagram illustrating the topological relationshipsis given for each level of topology. In these diagrams the relationships “point representation”, “linerepresentation” and “area representation” are specializations of the relationship “is located by” in theoverall data model diagram (figure 2.1).
VECTOR
FACE
ISOLATEDNODE
CONNECTEDNODE
NODE EDGEcoordinatescoordinates
bounds
is adjacent to
terminates
is contained in
1,2
1+1+1+
1+
figure 2.2
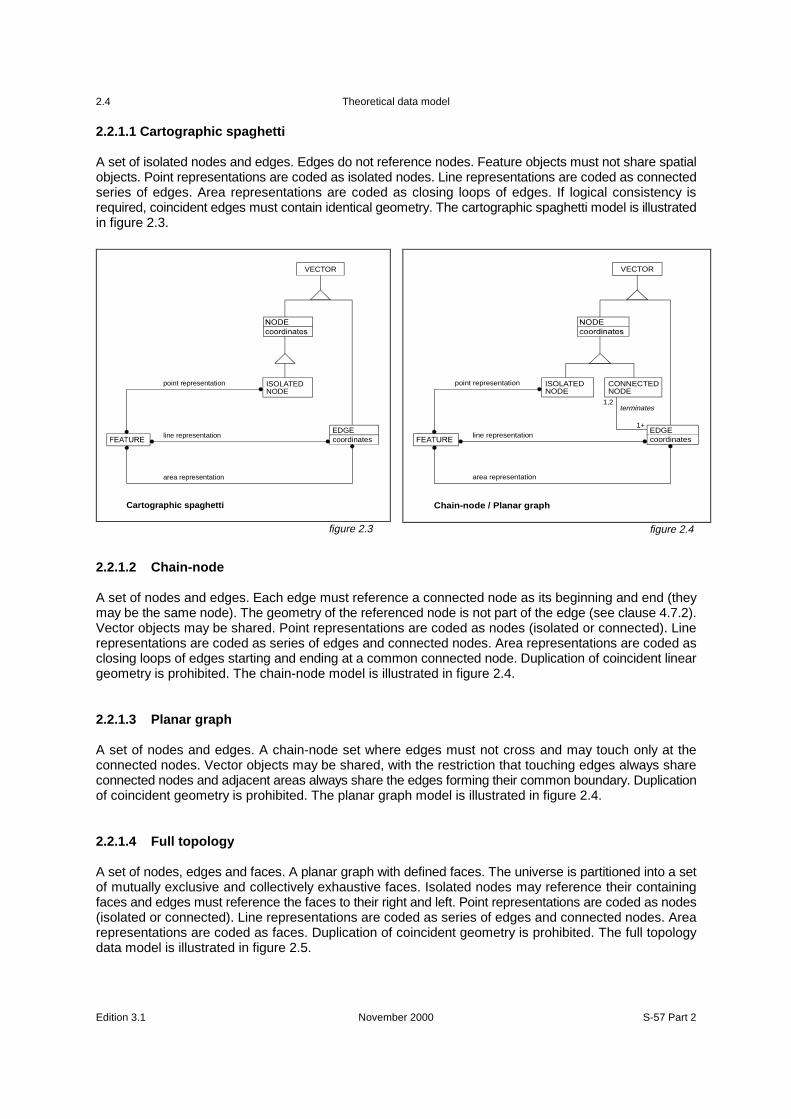
Theoretical data model
Edition 3.1 November 2000 S-57 Part 2
2.4
2.2.1.1 Cartographic spaghetti
A set of isolated nodes and edges. Edges do not reference nodes. Feature objects must not share spatialobjects. Point representations are coded as isolated nodes. Line representations are coded as connectedseries of edges. Area representations are coded as closing loops of edges. If logical consistency isrequired, coincident edges must contain identical geometry. The cartographic spaghetti model is illustratedin figure 2.3.
2.2.1.2 Chain-node
A set of nodes and edges. Each edge must reference a connected node as its beginning and end (theymay be the same node). The geometry of the referenced node is not part of the edge (see clause 4.7.2).Vector objects may be shared. Point representations are coded as nodes (isolated or connected). Linerepresentations are coded as series of edges and connected nodes. Area representations are coded asclosing loops of edges starting and ending at a common connected node. Duplication of coincident lineargeometry is prohibited. The chain-node model is illustrated in figure 2.4.
2.2.1.3 Planar graph
A set of nodes and edges. A chain-node set where edges must not cross and may touch only at theconnected nodes. Vector objects may be shared, with the restriction that touching edges always shareconnected nodes and adjacent areas always share the edges forming their common boundary. Duplicationof coincident geometry is prohibited. The planar graph model is illustrated in figure 2.4.
2.2.1.4 Full topology
A set of nodes, edges and faces. A planar graph with defined faces. The universe is partitioned into a setof mutually exclusive and collectively exhaustive faces. Isolated nodes may reference their containingfaces and edges must reference the faces to their right and left. Point representations are coded as nodes(isolated or connected). Line representations are coded as series of edges and connected nodes. Arearepresentations are coded as faces. Duplication of coincident geometry is prohibited. The full topologydata model is illustrated in figure 2.5.
VECTOR
ISOLATEDNODE
EDGEcoordinates
point representation
Cartographic spaghetti
line representation
area representation
figure 2.3
VECTOR
ISOLATEDNODE
CONNECTEDNODE
EDGEcoordinates
Chain-node / Planar graph
point representation
1,2terminates
1+line representation
area representation
figure 2.4
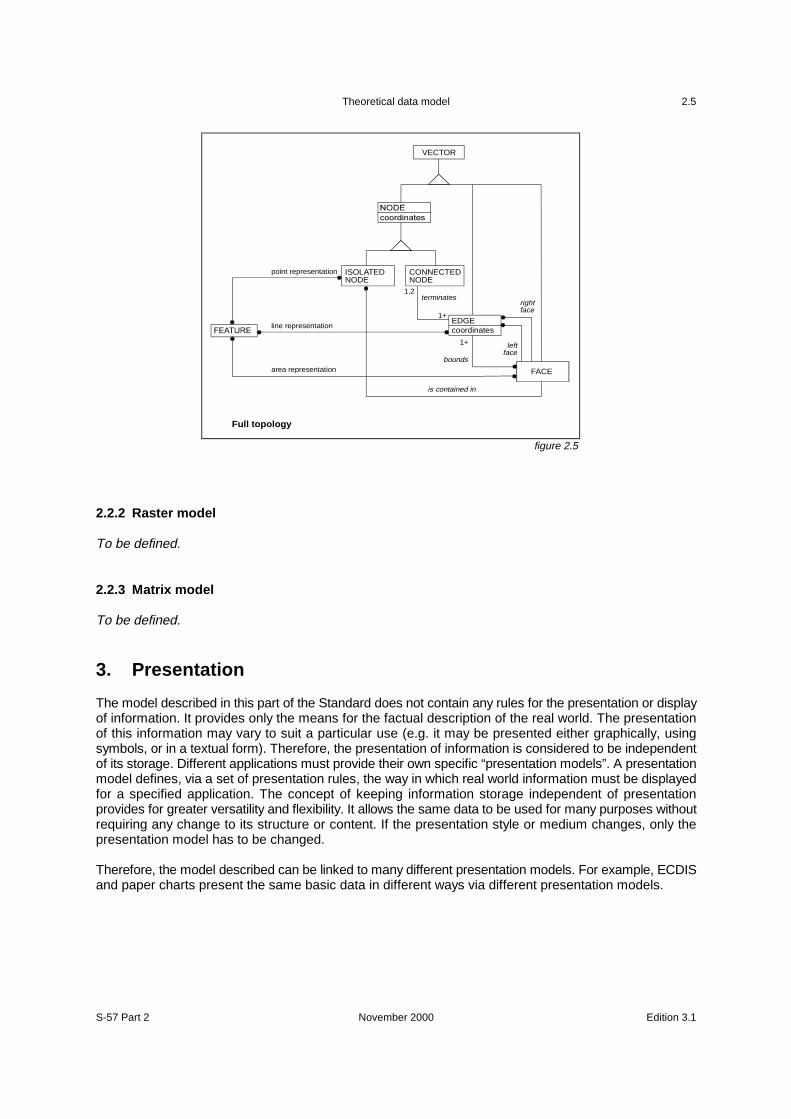
Theoretical data model
S-57 Part 2 November 2000 Edition 3.1
2.5
2.2.2 Raster model
To be defined.
2.2.3 Matrix model
To be defined.
3. Presentation
The model described in this part of the Standard does not contain any rules for the presentation or displayof information. It provides only the means for the factual description of the real world. The presentationof this information may vary to suit a particular use (e.g. it may be presented either graphically, usingsymbols, or in a textual form). Therefore, the presentation of information is considered to be independentof its storage. Different applications must provide their own specific “presentation models”. A presentationmodel defines, via a set of presentation rules, the way in which real world information must be displayedfor a specified application. The concept of keeping information storage independent of presentationprovides for greater versatility and flexibility. It allows the same data to be used for many purposes withoutrequiring any change to its structure or content. If the presentation style or medium changes, only thepresentation model has to be changed.
Therefore, the model described can be linked to many different presentation models. For example, ECDISand paper charts present the same basic data in different ways via different presentation models.
VECTOR
ISOLATEDNODE
CONNECTEDNODE
EDGE
FACE
coordinates
Full topology
point representation
1,2terminates
1+
1+
bounds
is contained in
rightface
leftface
line representation
area representation
figure 2.5

Theoretical data model
Edition 3.1 November 2000 S-57 Part 2
2.6
Page intentionally left blank

S-57 Part 3Data Structure
Edition 3.1
Data Structure
Edition 3.1 November 2000 S-57 Part 3
Important notice
All “Clarifications” in the latest edition of theMaintenance Document must be taken into accountbefore making use of this document.
Page intentionally left blank
Data Structure
S-57 Part 3 November 2000 Edition 3.1
3.1
1. Structure introduction
This part of the standard specifies how the Theoretical Data Model (see part 2) is translated into the S-57data structure. This translation implies a linkage between logical constructs taken from the model andphysical constructs used in the structure. That linkage is explained in this chapter.Although the translation from model to structure is independant of use, each application or productspecifies its own rules for implementing the data structure. This set of rules is called a productspecification. The concept of product specifications is introduced in this chapter (see clause 1.4).
1.1 Model to structure translation
In order to transfer information about the real world, a layered approach is used.
First the real world is simplified by modeling reality. This step is described in part 2 of this standard(Theoretical Data Model). The resulting model is translated into named constructs (e.g. records andfields). Part of that translation is the definition of rules and constraints for both the constructs and theircontent. The translation results in a data structure.The data structure itself can not be translated directly from one computer system to an other. To allow forthat, the structure must be encapsulated in a physical transfer standard. S-57 uses ISO/IEC 8211 as itsencapsulation.
This chapter deals with the implementation of the data model (i.e. the translation from model to structure).The relationship between the model and structure constructs is shown below.
Model Structure
Feature object................................................................ Feature recordMeta feature object........................................................ Meta feature recordCartographic feature object ........................................... Cartographic feature recordGeo feature object ......................................................... Geo feature recordCollection feature object ................................................ Collection feature recordSpatial object ................................................................. Spatial recordVector object.................................................................. Vector recordIsolated node object ...................................................... Isolated node vector recordConnected node object.................................................. Connected node vector recordEdge object.................................................................... Edge vector record
figure 1.1
Data Structure
Edition 3.1 November 2000 S-57 Part 3
3.2
Face object .................................................................... Face vector record or (loop of) edge vectorrecord(s)
Raster object ................................................................. Raster recordMatrix object .................................................................. Matrix recordAttributes ....................................................................... Feature or spatial attribute fieldRelationship between feature objects............................ Collection feature record or pointer fieldRelationship between feature and spatial objects ......... Pointer field
Usually, more than one object is involved in an exchange. Therefore, since an object is structured into arecord, an exchange is comprised of more than one record. To facilitate this, records are grouped intofiles. The set of information which is finally exchanged is called an exchange set.The way in which records are grouped into files and files are grouped into exchange sets is consideredto be application specific (see clause 1.4). However, the following general rules apply:
• an exchange set is formed of one or more files;• a file is formed of one or more records;• a record is formed of one or more fields;• a field is formed of one or more subfields.
The hierarchy is shown below
figure 1.2
A dotted line is shown in figure 1.2. The constructs below the dotted line are part of the S-57 data structureand are specified in detail in chapter 7. The constructs above the line are specific to an application orproduct and are, therefore, defined by the relevant product specification (see clause 1.4 and Appendix B).
The lowest level construct, the subfield, must only contain one elementary data item, for example, oneattribute value. Formatted subfields, such as date subfields, must be further resolved by an applicationprogram. In this specification, such subfields are not divisible.
The S-57 data structure has both ASCII and binary implementations. The implementation to be used fora specific exchange is defined by the relevant product specification.
Exchange set| Product specification|---<R>--File(s)
|..........................................................................................
|---<R>--Record(s)||---<R>--Field(s)
||---<R>--Subfields(s)
S-57 data structure
<R> construct is allowed to repeat

Data Structure
S-57 Part 3 November 2000 Edition 3.1
3.3
1.2 Records
1.2.1 General
This standard defines a set of records from which an exchange set can be built. These records fall intofive categories:
• Data Set Descriptive (meta)• Catalogue• Data Dictionary• Feature• Spatial
A detailed description of the contents of these records is given in chapter 7. Clauses 1.2.2 to 1.2.6 givea short description. The exact use of records, fields and subfields may be further defined by a productspecification. For example, a product specification may prohibit the use of certain records, fields andsubfields.
1.2.2 Data set descriptive records
The data set descriptive (meta) records contain the following information:
• Information required to identify the general purpose and nature of the exchanged information. (Forexample, the product specification employed is defined in this part).
[Data Set General Information record (see clause 7.3.1)]
• Information about the coordinate system, the projection, the horizontal and vertical datums used, thesource scale and the units of height and depth measurement
[Data Set Geographic Reference record (see clause 7.3.2)]
• Information about the origins of the data set.[Data Set History record (see clause 7.3.3)]
• Information describing the accuracy of the locational data in the spatial records.[Data Set Accuracy record (see clause 7.3.4)]
Information held in these records defines the default for the data set. The default can be overruled bymore detailed information at the feature record level using either meta feature records or attributes of anobject (see clause 1.3).
1.2.3 Catalogue records
The catalogue records contain the following information:
• Information required to allow the decoder to locate and reference files within the entire exchange set.This part can be compared with a table of contents.
[Catalogue Directory record (see clause 7.4.1)]
• Information about special relationships between individual records within the exchange set. [CatalogueCross Reference record (see clause 7.4.2)]
S-57 has both binary and ASCII implementations. The implementation to be used is specified in the"Catalogue Directory" record. To ensure correct interpretation, the “Catalogue Directory” record is alwaysencoded using the ASCII implementation.
Data Structure
Edition 3.1 November 2000 S-57 Part 3
3.4
1.2.4 Data dictionary records
The data dictionary records contain the description of objects, attribute and attribute values used in anexchange set. It is not necessary to utilize these records in an exchange set if the IHO Object Catalogue(Appendix A) is used exclusively. However, if any non-IHO Object Catalogue objects, attributes or attributevalues are used in an exchange set, they must be described in these records (see clause 2.3). The DataDictionary records contain the following information:
• Information defining the object classes and attributes.[Data Dictionary Definition record (see clause 7.5.1)]
• Information about the attribute value domains.[Data Dictionary Domain record (see clause 7.5.2)]
• Information identifying which attributes are valid for an object class.[Data Dictionary Schema record (see clause 7.5.3)]
1.2.5 Feature records
The feature records contain the non-locational real-world data. They may be of type meta, cartographic,geo or collection.
Feature records include the following information:
• The object information describing the real world, including relationships and update instructions.[Feature record (see chapter 4 and clause 7.6)]
1.2.6 Spatial records
The spatial records contain the locational data. They may be of type vector, raster or matrix. An exchangeset may contain a mixture of the different spatial record types.
1.2.6.1 Vector records
Vector records include the following information:
• The coordinate geometry related to the feature records, including spatial attributes, topologicalrelationships and update instructions. Vector records may be of type node, edge or face.
[Vector record (see clause 5.1 and clause 7.7.1)]
1.2.6.2 Raster records
To be defined.
1.2.6.3 Matrix records
To be defined.
Data Structure
S-57 Part 3 November 2000 Edition 3.1
3.5
1.3 Meta data
Meta data can be provided at three levels within an exchange set. These levels are defined below. Alsodefined below are the rules that apply when meta data provided at different levels conflicts:
a) Meta information which is defined in the data set descriptive records (see clause 1.2.2) provides thedefault for the data set in which those records are contained. Whether data set descriptive records aredefined at the file or the exchange set level depends on the product specification used.
b) Information which is defined by meta objects overrides the default defined by the data set descriptiverecords. Meta objects are defined in the IHO Object Catalogue (Appendix A) and are encoded asfeature objects.
c) Information which is defined by attributes of individual objects overrides that defined by meta objectsand, therefore, that derived from the data set descriptive records.
1.4 Rules for specific applications
1.4.1 Product specifications
This Standard is intended to support all hydrographic applications. However, different applications havedifferent requirements for data transfer. To establish effective data transfer, additional rules may bedefined for specific applications or products. These sets of rules are called product specifications.
All product specifications which have been officially approved by the IHO are included in Appendix B andform an integral part of this standard. The product specification used for a given exchange must bespecified in either the PRSP subfield or the PSDN subfield of the DSID field (see clause 7.3.1.1).
All data within an exchange set must be based on the same product specification.
1.4.2 Application profiles
A basic part of a product specification is the definition of a subset of the data structure defined in chapter7. The mechanism used to define this subset is called an “Application Profile”. It is strongly recommendedthat this mechanism is used in all product specifications. It ensures an easy and efficient decoding of data.For example, a product specification might define two possible application profiles, one for the initialsupply data and one for updates.
At present, three application profiles have been defined:
EN {1} digital data comprising the basic Electronic Navigational Charts (ENC), used to populate theSENC
ER {2} digital data revising the SENC
DD {3} digital data comprising a machine readable version of the IHO Object Catalogue
Note: The abbreviations (ASCII, e.g. EN) and the numbers between parentheses (binary, e.g. {1}) arepossible values for the PROF subfield of the DSID field (see clause 7.3.1.1).

Data Structure
Edition 3.1 November 2000 S-57 Part 3
3.6
Other application profiles may be established in the future as additional categories of data transfer areidentified. Values for new or non-conforming application profiles can be defined by an appropriate productspecification.
The encoder of a conforming exchange set must pay particular attention to its content to ensure that it isconsistent with the stated application profile.Records, fields and subfields not marked in an application profile are optional (unless otherwise specifiedin the product specification). However, when less than the full field contents are required, any omittedsubfields must be accounted for in the data records (see clause 2.1).

Data Structure
S-57 Part 3 November 2000 Edition 3.1
3.7
2. General coding conventions
The conventions listed in this chapter are a set of rules according to which conforming exchange setsmust be encoded. These conventions must always be followed by an encoder.
2.1 Omitted constructs
For a given application profile, the inclusion of certain records, fields and subfields in an exchange set maybe optional (see Appendix B – Application Profiles). The encoder may, therefore, choose to omit theseconstructs from the exchange set. The omission of any optional constructs from an exchange set mustbe interpreted as follows:
Missing record: The content of the omitted record is not meaningful for the intended use asdetermined by the producer.No specific measures are needed to account for the missing record in theexchange set.
Missing field: The content of the omitted field is not meaningful for the intended use asdetermined by the producer.No specific measures are needed to account for the missing field in theexchange set.
Missing subfield value: The omitted subfield value is either not known or is not meaningful for theintended purpose as determined by the producer. The exact interpretationmust be defined by the relevant product specification.In S-57, the data description used for each field is independent of theapplication profile employed (i.e. subfields can not be omitted). Therefore,each missing subfield value must be accounted for in the exchange set. Theway this is done depends on the type of subfield (see table 2.1).
Subfield type ASCII data format (see 7.2.2.1) Binary data format (see 7.2.2.1)
Fixed length The space normally occupied by the subfieldmust be filled with blanks
The binary value with all bits set to 1 must beused.
Variable length Only the subfield delimiter must be encoded Not applicable
table 2.1
Note :Fields and subfields values marked as mandatory for a given application profile (as documentedin Appendix B – Product Specifications) must not be omitted.
2.2 Record identifier
The record identifier is the basic identifier in the data structure and is used to maintain topologicalrelationships and to address information contained in update messages. Every record in an exchange setbased on S-57 must have an identifier. For this purpose the “Record Name” [RCNM] and the “RecordIdentification Number” [RCID] subfields are used. These subfields must be encoded in the first field ofevery record.
The concatenation of these subfields forms the identification (key) of a record and is known as the “Name”[NAME]. This subfield is used as a foreign pointer. In the binary implementation, NAME is a bit string witha length of 40 bits (i.e. the “binary” concatenation of the RCNM and RCID subfields). Retrieval of theindividual subfield values from the bit string must be resolved by the decoder.
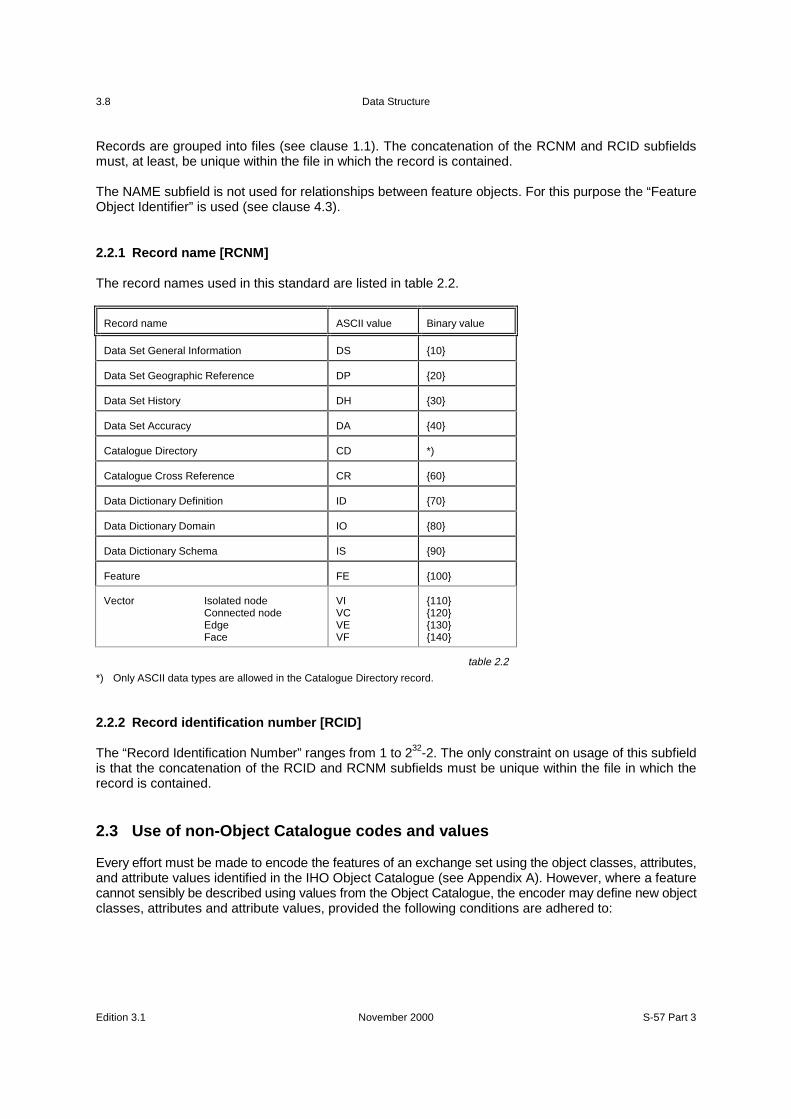
Data Structure
Edition 3.1 November 2000 S-57 Part 3
3.8
Records are grouped into files (see clause 1.1). The concatenation of the RCNM and RCID subfieldsmust, at least, be unique within the file in which the record is contained.
The NAME subfield is not used for relationships between feature objects. For this purpose the “FeatureObject Identifier” is used (see clause 4.3).
2.2.1 Record name [RCNM]
The record names used in this standard are listed in table 2.2.
Record name ASCII value Binary value
Data Set General Information DS {10}
Data Set Geographic Reference DP {20}
Data Set History DH {30}
Data Set Accuracy DA {40}
Catalogue Directory CD *)
Catalogue Cross Reference CR {60}
Data Dictionary Definition ID {70}
Data Dictionary Domain IO {80}
Data Dictionary Schema IS {90}
Feature FE {100}
Vector Isolated nodeConnected nodeEdgeFace
VIVCVEVF
{110}{120}{130}{140}
table 2.2
*) Only ASCII data types are allowed in the Catalogue Directory record.
2.2.2 Record identification number [RCID]
The “Record Identification Number” ranges from 1 to 232-2. The only constraint on usage of this subfieldis that the concatenation of the RCID and RCNM subfields must be unique within the file in which therecord is contained.
2.3 Use of non-Object Catalogue codes and values
Every effort must be made to encode the features of an exchange set using the object classes, attributes,and attribute values identified in the IHO Object Catalogue (see Appendix A). However, where a featurecannot sensibly be described using values from the Object Catalogue, the encoder may define new objectclasses, attributes and attribute values, provided the following conditions are adhered to:

Data Structure
S-57 Part 3 November 2000 Edition 3.1
3.9
• none of the definitions associated with the object classes or attributes in the IHO Object Catalogue issatisfactory for use;
• the label/code and acronym used are clearly distinguishable from the labels/codes and acronymsreserved by the IHO Object Catalogue for both objects and attributes;
• All non-standard object and attributes labels/codes must be in the range 16388 to 65534;
• All non-standard object and attribute acronyms must be lowercase ISO/IEC 646 IRV characters;
• the non-standard usage is fully documented within the Data Dictionary Definition, Domain and Schemarecords (see clause 7.5).
All labels/codes and acronyms currently defined in the Object Catalogue are reserved by this Standard.The labels/codes 8193 to 16387 are reserved for further standardization.
Extensions to usage are permitted, however, redefinition or contradictory use of reserved labels/codesor acronyms is not permitted.
The use of non-Object Catalogue names and values may be further constrained by a productspecification.
In all cases where this standard refers to the IHO Object catalogue, other data schema (catalogues) maybe used instead, provided that the rules of this clause are adhered to.
2.4 Use of character sets
The default character set which must be used for all non-binary data elements (e.g. numbers, dates, textstrings etc.) is that defined by ISO/IEC 8211 (i.e. ASCII, IRV of ISO/IEC 646). Some text string subfieldsmay be encoded using an alternate character set. For this purpose two text string domain types aredefined. These are “Basic Text” (used to encode alphanumeric identifiers, etc.) and “General Text” tohandle certain attribute values (e.g. place names including accents and special characters).
Three lexical levels are defined for the encoding of these text string domains.
Level 0 ASCII text, IRV of ISO/IEC 646
Level 1 ISO 8859 part 1, Latin alphabet 1 repertoire (i.e. Western European Latin alphabet based languages.
Level 2 Universal Character Set repertoire UCS-2 implementation level 1 (no combining characters), Base Multilingualplane of ISO/IEC 10646 (i.e. including Latin alphabet, Greek, Cyrillic, Arabic, Chinese, Japanese etc.)
table 2.3
Basic text must always be encoded at lexical level 0. General text may be encoded at lexical level 0,1 or2 depending on the type of field which holds the text string. Only the character-type subfields in the“Feature Record Attribute” [ATTF] and “Feature Record National Attribute” [NATF] fields may be encodedas general text. All other character-type subfields must be encoded as basic text.
General text in the ATTF field may be of level 0 or 1. All three levels can be used for the NATF field. Inboth cases a product specification may restrict the use of certain lexical levels. The lexical level used forthese fields must be explicitly coded in the “ATTF Lexical Level” [AALL] and “NATF Lexical Level” [NALL]subfields of the “Data Set Structure Information” [DSSI] field. The default value for both subfields is zero.A thorough explanation of how the different levels are implemented is given in Annex B of part 3.
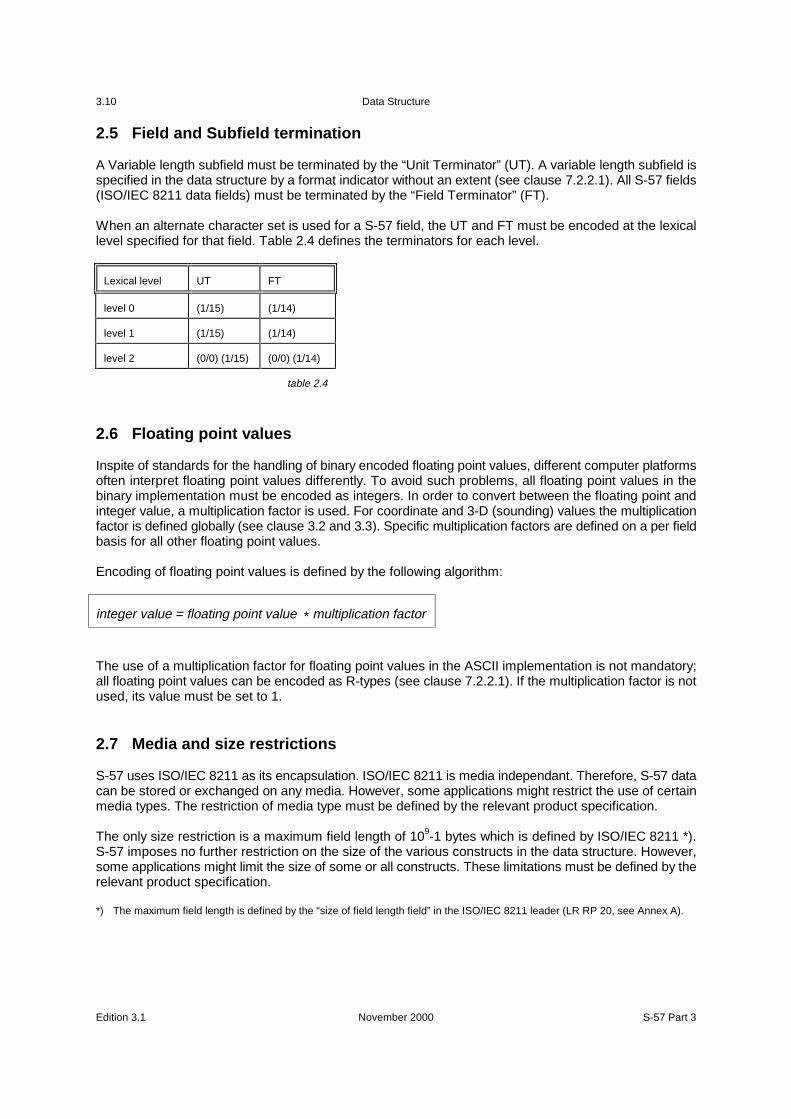
Data Structure
Edition 3.1 November 2000 S-57 Part 3
3.10
2.5 Field and Subfield termination
A Variable length subfield must be terminated by the “Unit Terminator” (UT). A variable length subfield isspecified in the data structure by a format indicator without an extent (see clause 7.2.2.1). All S-57 fields(ISO/IEC 8211 data fields) must be terminated by the “Field Terminator” (FT).
When an alternate character set is used for a S-57 field, the UT and FT must be encoded at the lexicallevel specified for that field. Table 2.4 defines the terminators for each level.
Lexical level UT FT
level 0 (1/15) (1/14)
level 1 (1/15) (1/14)
level 2 (0/0) (1/15) (0/0) (1/14)
table 2.4
2.6 Floating point values
Inspite of standards for the handling of binary encoded floating point values, different computer platformsoften interpret floating point values differently. To avoid such problems, all floating point values in thebinary implementation must be encoded as integers. In order to convert between the floating point andinteger value, a multiplication factor is used. For coordinate and 3-D (sounding) values the multiplicationfactor is defined globally (see clause 3.2 and 3.3). Specific multiplication factors are defined on a per fieldbasis for all other floating point values.
Encoding of floating point values is defined by the following algorithm:
integer value = floating point value * multiplication factor
The use of a multiplication factor for floating point values in the ASCII implementation is not mandatory;all floating point values can be encoded as R-types (see clause 7.2.2.1). If the multiplication factor is notused, its value must be set to 1.
2.7 Media and size restrictions
S-57 uses ISO/IEC 8211 as its encapsulation. ISO/IEC 8211 is media independant. Therefore, S-57 datacan be stored or exchanged on any media. However, some applications might restrict the use of certainmedia types. The restriction of media type must be defined by the relevant product specification.
The only size restriction is a maximum field length of 109-1 bytes which is defined by ISO/IEC 8211 *).S-57 imposes no further restriction on the size of the various constructs in the data structure. However,some applications might limit the size of some or all constructs. These limitations must be defined by therelevant product specification.
*) The maximum field length is defined by the “size of field length field” in the ISO/IEC 8211 leader (LR RP 20, see Annex A).
Data Structure
S-57 Part 3 November 2000 Edition 3.1
3.11
2.8 Data quality
Data quality comprises the following:
• source of data;• accuracy of data;• up-to-dateness of data.
Data quality is considered to be meta information. As such, it can be encoded at three different levels (seeclause 1.3). Data quality information is considered to be application specific. Therefore, rules for encodingdata quality must be defined by the relevant product specification.
Data Structure
Edition 3.1 November 2000 S-57 Part 3
3.12
3. Meta record coding conventions
Meta data can be hierarchically encoded at three different levels (see clause 1.3). At the highest level inthe hierarchy meta data is encoded by means of data set descriptive (meta) records. The following metarecords are defined by S-57:
• Data Set General Information record• Data Set Geographic Reference record• Data Set History record• Data set Accuracy record• Catalogue Directory record
The use of these records within a data set must be specified in a product specification. However, thefollowing clauses give some general guidelines which must be followed by the encoder.
3.1 Topology
Part 2 of this standard (Theoretical Data Model) defines, for vector data, the various levels of topologicalrelationship. These levels are implemented as vector data structures.
Only one vector data structure may be used within a data set. The data structure used must be explicitlyencoded in the “Data Structure” [DSTR] subfield of the “Data Set Structure Information” [DSSI] field. Thisfield is part of the “Data Set General Information” record (see clause 7.3.1).The options are:
CS {1} Cartographic spaghetti (see part 2, clause 2.2.1.1)
CN {2} Chain-node (see part 2, clause 2.2.1.2)
PG {3} Planar graph (see part 2, clause 2.2.1.3)
FT {4} Full topology (see part 2, clause 2.2.1.4)
NO {255} Topology is not relevant
If the data structure defined in the DSTR subfield is “Cartographic spaghetti” (CS), only vector records oftype “isolated node” and “edge” may be present in the data set. The vector record type “connected node”is only permissible where the data structure has been defined as “Chain-node” (CN), "Planar graph" (PG)or “Full topology” (FT). The vector record type “face” is only permissible where the data structure has beendefined as “Full topology” (FT).
3.2 Coordinate system, units and projection
This standard is intended to support the exchange of digital hydrographic data. As explained in part 2(Theoretical Data Model), hydrographic data has both descriptive and spatial components. To facilitatethe transfer of the spatial component (geometry), a coordinate system must be defined.
The “Data Set Geographic Reference” record (see clause 7.3.2) is used to exchange details about thecoordinate system employed. These details contain two basic components:
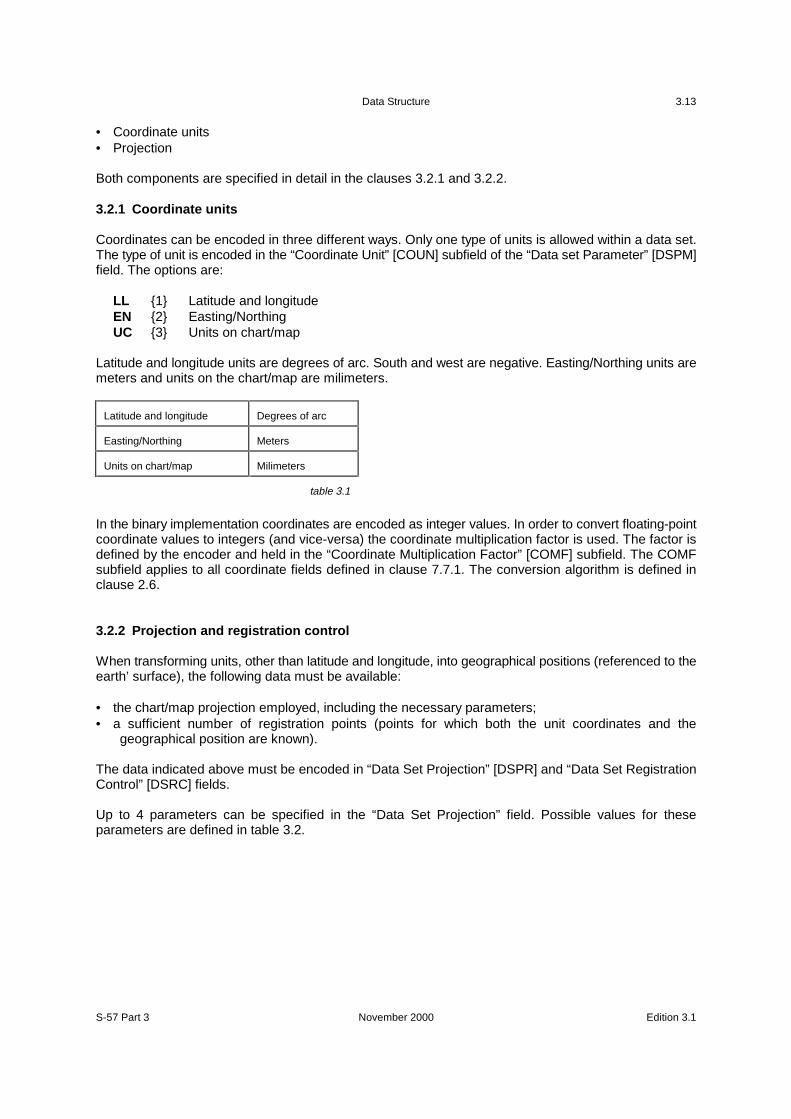
Data Structure
S-57 Part 3 November 2000 Edition 3.1
3.13
• Coordinate units• Projection
Both components are specified in detail in the clauses 3.2.1 and 3.2.2.
3.2.1 Coordinate units
Coordinates can be encoded in three different ways. Only one type of units is allowed within a data set.The type of unit is encoded in the “Coordinate Unit” [COUN] subfield of the “Data set Parameter” [DSPM]field. The options are:
LL {1} Latitude and longitudeEN {2} Easting/NorthingUC {3} Units on chart/map
Latitude and longitude units are degrees of arc. South and west are negative. Easting/Northing units aremeters and units on the chart/map are milimeters.
Latitude and longitude Degrees of arc
Easting/Northing Meters
Units on chart/map Milimeters
table 3.1
In the binary implementation coordinates are encoded as integer values. In order to convert floating-pointcoordinate values to integers (and vice-versa) the coordinate multiplication factor is used. The factor isdefined by the encoder and held in the “Coordinate Multiplication Factor” [COMF] subfield. The COMFsubfield applies to all coordinate fields defined in clause 7.7.1. The conversion algorithm is defined inclause 2.6.
3.2.2 Projection and registration control
When transforming units, other than latitude and longitude, into geographical positions (referenced to theearth’ surface), the following data must be available:
• the chart/map projection employed, including the necessary parameters;• a sufficient number of registration points (points for which both the unit coordinates and the
geographical position are known).
The data indicated above must be encoded in “Data Set Projection” [DSPR] and “Data Set RegistrationControl” [DSRC] fields.
Up to 4 parameters can be specified in the “Data Set Projection” field. Possible values for theseparameters are defined in table 3.2.
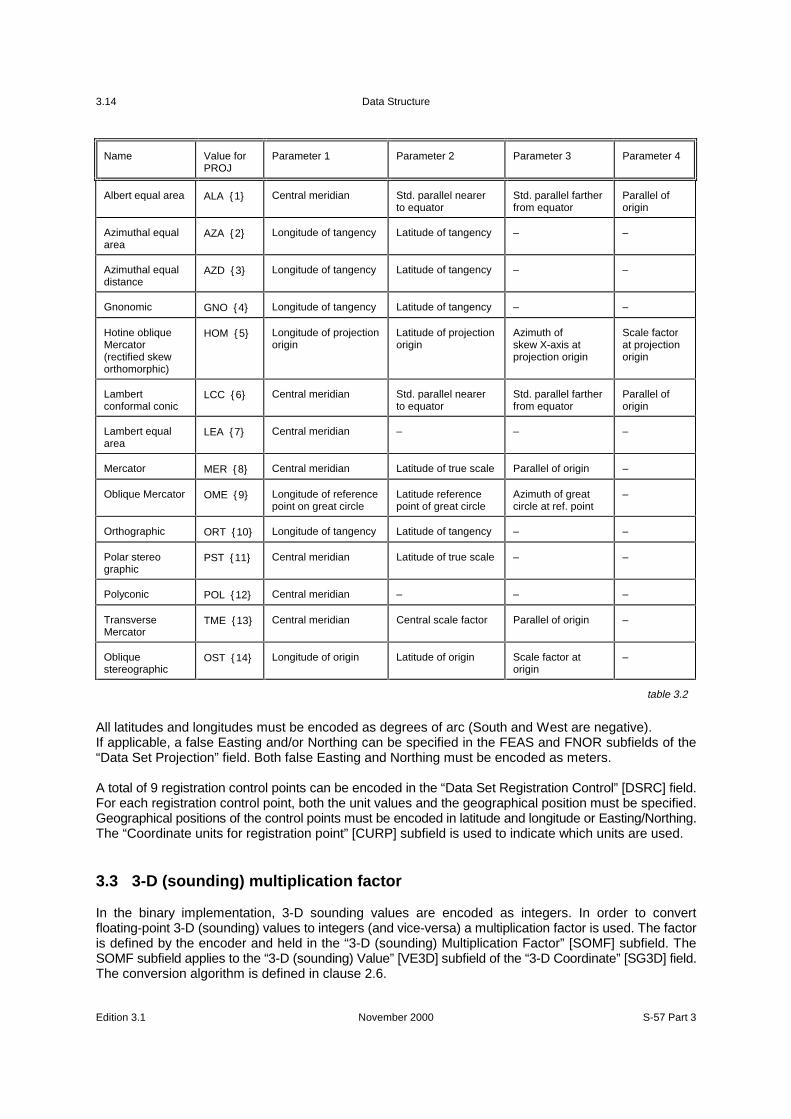
Data Structure
Edition 3.1 November 2000 S-57 Part 3
3.14
Name Value forPROJ
Parameter 1 Parameter 2 Parameter 3 Parameter 4
Albert equal area ALA {1} Central meridian Std. parallel nearerto equator
Std. parallel fartherfrom equator
Parallel oforigin
Azimuthal equalarea
AZA {2} Longitude of tangency Latitude of tangency – –
Azimuthal equaldistance
AZD {3} Longitude of tangency Latitude of tangency – –
Gnonomic GNO {4} Longitude of tangency Latitude of tangency – –
Hotine obliqueMercator(rectified skeworthomorphic)
HOM {5} Longitude of projectionorigin
Latitude of projectionorigin
Azimuth ofskew X-axis atprojection origin
Scale factorat projectionorigin
Lambertconformal conic
LCC {6} Central meridian Std. parallel nearerto equator
Std. parallel fartherfrom equator
Parallel oforigin
Lambert equalarea
LEA {7} Central meridian – – –
Mercator MER {8} Central meridian Latitude of true scale Parallel of origin –
Oblique Mercator OME {9} Longitude of referencepoint on great circle
Latitude referencepoint of great circle
Azimuth of greatcircle at ref. point
–
Orthographic ORT {10} Longitude of tangency Latitude of tangency – –
Polar stereographic
PST {11} Central meridian Latitude of true scale – –
Polyconic POL {12} Central meridian – – –
TransverseMercator
TME {13} Central meridian Central scale factor Parallel of origin –
Obliquestereographic
OST {14} Longitude of origin Latitude of origin Scale factor atorigin
–
table 3.2
All latitudes and longitudes must be encoded as degrees of arc (South and West are negative).If applicable, a false Easting and/or Northing can be specified in the FEAS and FNOR subfields of the“Data Set Projection” field. Both false Easting and Northing must be encoded as meters.
A total of 9 registration control points can be encoded in the “Data Set Registration Control” [DSRC] field.For each registration control point, both the unit values and the geographical position must be specified.Geographical positions of the control points must be encoded in latitude and longitude or Easting/Northing.The “Coordinate units for registration point” [CURP] subfield is used to indicate which units are used.
3.3 3-D (sounding) multiplication factor
In the binary implementation, 3-D sounding values are encoded as integers. In order to convertfloating-point 3-D (sounding) values to integers (and vice-versa) a multiplication factor is used. The factoris defined by the encoder and held in the “3-D (sounding) Multiplication Factor” [SOMF] subfield. TheSOMF subfield applies to the “3-D (sounding) Value” [VE3D] subfield of the “3-D Coordinate” [SG3D] field.The conversion algorithm is defined in clause 2.6.

Data Structure
S-57 Part 3 November 2000 Edition 3.1
3.15
3.4 Checksums
A “Cyclic Redundancy Check” (CRC) algorithm can be used to ensure that the data has not beencorrupted during the exchange process. Different CRC algorithms can be used for different applications.The algorithm used is, therefore, described in the relevant product specification (see Appendix B –Product Specifications).A CRC value for every file in an exchange set can be encoded in the “Catalogue Directory” [CATD] field,CRCS subfield.

Data Structure
Edition 3.1 November 2000 S-57 Part 3
3.16
4. Feature record coding conventions
4.1 General
An instance of a feature object class is implemented in the data structure as a feature record. Featureobject classes are listed in Appendix A, IHO Object Catalogue. For each object class the IHO ObjectCatalogue defines permissible attributes.The IHO Object Catalogue identifies 4 categories of object class:
• meta;• cartographic;• geo;• collection.
Each category is implemented in the structure as a feature record and encoded in the same manner.
Feature records consist of the following fields:
• record identifier field;• object identifier field;• attribute fields;• pointer control fields;• pointer fields.
The “Pointer Control” fields are only used for updating. These fields are explained in chapter 8 (Updating).The other fields are discussed in the clauses 4.2 to 4.7.
In general, each instance of a feature object class requires one feature record. However, soundings areregarded as a special case in hydrography. In the interests of efficiency, soundings may be grouped intoone feature record, provided that all the feature attributes and attribute values, except depth, are commonto that group (see also clause 5.1.4.1).
4.2 Feature record identifier field
The identifier field consists of the following (groups of) subfields:
• record identifier [RCNM, RCID];• object geometric primitive [PRIM];• group [GRUP];• object label/code [OBJL];• record version [RVER];• record update instruction [RUIN].
The record identifier is the basic identifier for the feature record and is defined in clause 2.2. The “RecordVersion” [RVER] and “Record Update Instruction” [RUIN] are used for updating. The mechanism forupdating is explained in chapter 8. The other subfields are explained below.

Data Structure
S-57 Part 3 November 2000 Edition 3.1
3.17
4.2.1 Object geometric primitive [PRIM] subfield
The “Object Geometric Primitive” [PRIM] subfield is used to specify the geometric primitive of the encodedobject. Permissible values are:
P {1} PointL {2} LineA {3} AreaN {255} Object does not directly reference any geometry
Allowable geometric primitives for object classes must be defined by the relevant product specification.
The PRIM subfield must be used to ensure the correct interpretation of the spatial record(s) to which thefeature record refers. The “N” value is used for feature records which do not reference any spatial records(e.g. collection feature records).
The geometric primitive for all soundings (including grouped soundings) must be “P” (point).
4.2.2 Group [GRUP] subfield
The “Group” [GRUP] subfield is used to separate feature objects into groups. The definition of groups isdependent on the product specification (see Appendix B – Product Specifications). If a feature object doesnot belong to a group, the subfield must be left empty (see clause 2.1).
4.2.3 Object label/code [OBJL] subfield
The numeric object label/code of the object class from the IHO Object Catalogue is encoded in the “ObjectLabel/Code” [OBJL] subfield.
4.3 Feature object identifier field
The feature object identifier field consists of the following subfields:
• producing agency [AGEN];• feature Identification number [FIDN];• feature Identification subdivision [FIDS].
The AGEN, FIDN and FIDS subfields are used as the identification (key) of a feature object (feature objectidentifier). The feature object identifier is also known as the “Long Name” [LNAM]. The LNAM subfield isused as a foreign pointer in the encoding of relationships between feature records (see chapter 6). Otherapplications for the feature object identifier, such as unique world-wide identification of feature objects,may be specified in the relevant product specification.
In the ASCII implementation, LNAM is a string of 17 characters (i.e. the concatenation of the AGEN, FIDNand FIDS subfields). The FIDN and FIDS subfields must be left filled with zeros (see clause 7.2.2.2).In the binary implementation, LNAM is a bit string with a length of 64 bits (i.e. the “binary” concatenationof the AGEN, FIDN and FIDS subfields). Retrieval from the bit string of the individual subfield values mustbe resolved by the decoder.

Data Structure
Edition 3.1 November 2000 S-57 Part 3
3.18
4.3.1 Producing agency [AGEN] subfield
The allowable values for the “Producing Agency” [AGEN] subfield are defined in the IHO ObjectCatalogue. The IHO Object Catalogue contains a 2-character acronym and a corresponding integer valuefor each agency. If the producing agency is not listed, the AGEN subfield must be encoded as a missingsubfield value (see clause 2.1).
4.3.2 Feature Object identification number and subdivision [FIDN, FIDS] subfield
The “Feature Object Identification Number” ranges from 1 to 232-2. The “Feature Object IdentificationSubdivision” ranges from 1 to 216-2. Both subfields are used to create an unique key for a feature objectproduced by the agency encoded in the AGEN subfield. The usage of the FIDN and FIDS subfields is notconstrained and must be defined by the encoder.
4.4 Feature record attribute field
Attributes of feature objects must be encoded in the “Feature Record Attribute” [ATTF] field (see clause7.6.3). The numeric attribute label/code of the attribute from the IHO Object Catalogue is encoded in the“Attribute Label/Code” [ATTL] subfield. In both the ASCII and binary implementations, the “Attribute Value”subfield [ATVL] must be a string of characters terminated by the subfield terminator (1/15). Lexical level0 or 1 may be used for the general text in the ATTF field (see clause 2.4).
The IHO Object Catalogue (Appendix A) defines the valid attributes. For each attribute the IHO ObjectCatalogue defines the permissible attribute values.
An attribute is not allowed to repeat within one feature record.
4.5 Feature record national attribute field
National attributes of feature objects must be encoded in the “Feature Record National Attribute” [NATF]field (see clause 7.6.4). The numeric attribute label/code of the national attribute from the IHO ObjectCatalogue is encoded in the “Attribute Label/Code” [ATTL] subfield. In both the ASCII and binaryimplementations, the “Attribute Value” subfield [ATVL] must be a string of characters terminated by theappropriate subfield terminator (see clause 2.5). All lexical levels may be used for the general text in theNATF field (see clause 2.4).
The IHO Object Catalogue (Appendix A) defines the valid national attributes. For each national attributethe IHO Object Catalogue defines the permissible attribute values.
A national attribute is not allowed to repeat within one feature record.
4.6 Feature record to feature object pointer field
The “Feature Record to Feature Object Pointer” [FFPT] field is used to establish a relationship betweenfeature objects. Relationships between feature objects are discussed in detail in chapter 6.
The main element of the pointer field is the LNAM subfield (see clause 4.3). The LNAM subfield containsthe key of the feature object being referenced (foreign key). The “Relationship Indicator” [RIND] subfieldcan be used to qualify a relationship (e.g. master or slave relationship) or to add a stacking order to arelationship.

Data Structure
S-57 Part 3 November 2000 Edition 3.1
3.19
4.7 Feature record to spatial record pointer field
The “Feature Record to Spatial Record Pointer” [FSPT] field is used to link a feature record to itsgeometry.
The main element of the pointer field is the NAME subfield (see clause 2.2). The NAME subfield containsthe key of the spatial record being referenced. The “Orientation” [ORNT] subfield, the “Usage Indicator”[USAG] subfield and the “Masking Indicator” [MASK] subfield are necessary for a correct interpretationof the spatial records being referenced.
The geometric primitive of a feature record determines the use of the pointer field. Geo, cartographic andmeta feature records can be of geometric primitive point, line or area. The use of the pointers for thesegeometric primitives is specified in clauses 4.7.1 to 4.7.3. Feature records of geometric type point, lineand area can only reference spatial records of type vector.
4.7.1 Feature record to spatial record pointer field — use by point features
In the chain-node, planar graph and full topology data structures, a point feature may reference isolatednodes or connected nodes. In the cartographic spaghetti data structure a point feature may only referenceisolated nodes.In general, feature records of type point can only reference one vector record. Multiple pointers to vectorrecords are not allowed. An exception to this rule is a sounding feature record. Soundings are regardedas point features but are encoded in a special way (see clause 5.1.4.1).
The ORNT, USAG and MASK subfields must be set to “N” {255}.
4.7.2 Feature record to spatial record pointer field — use by line features
In order to facilitate the decoding of linear features comprising multiple edges, the vector records makingup the linear feature must be referenced sequentially.
The direction in which an edge is to be interpreted for a particular linear feature may be important (e.g. forthe symbolization of non-symmetric line styles). In such cases the direction of interpretation is indicatedin the ORNT subfield (see figure 4.1). Permissible values are:
F {1} Forward.R {2} Reverse.N {255} Direction is not relevant.
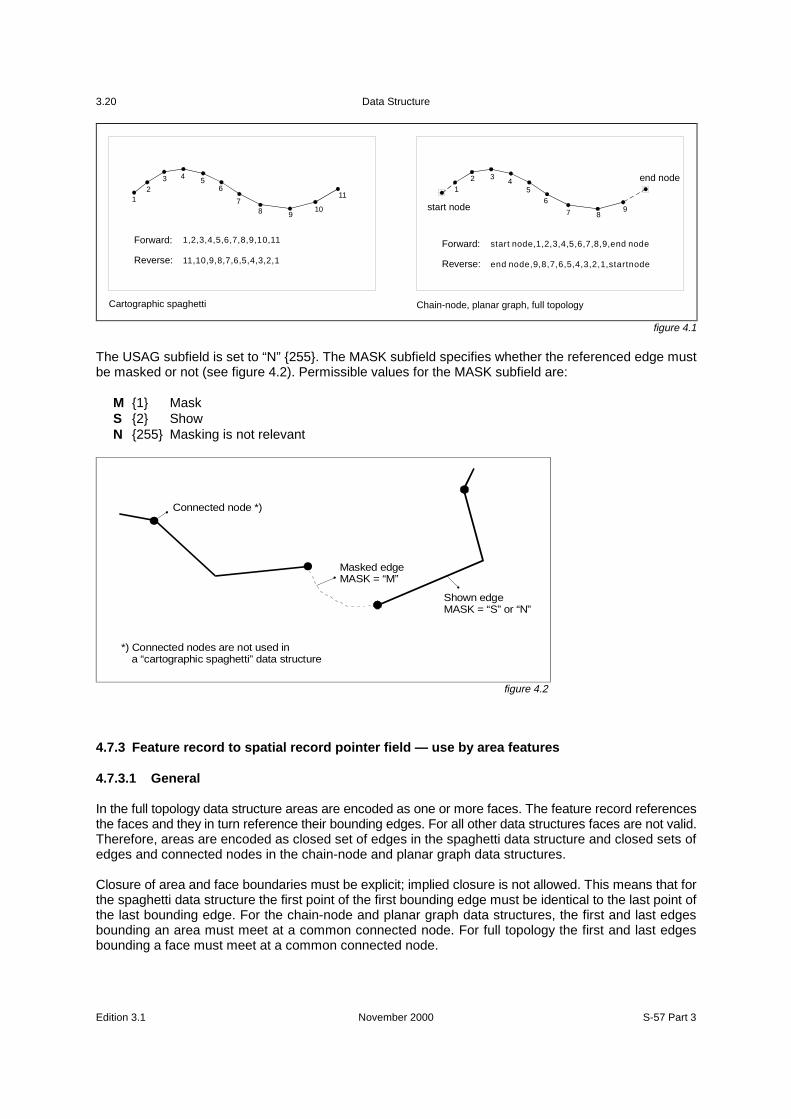
Data Structure
Edition 3.1 November 2000 S-57 Part 3
3.20
12
3 4 56
78 9
10
11
Cartographic spaghetti
Forward:
Reverse:
1,2,3,4,5,6,7,8,9,10,11
11,10,9,8,7,6,5,4,3,2,1
12 3
45
6
7 89start node
end node
Chain-node, planar graph, full topology
Forward:
Reverse:
start node,1,2,3,4,5,6,7,8,9,end node
end node,9,8,7,6,5,4,3,2,1,startnode
figure 4.1
The USAG subfield is set to “N” {255}. The MASK subfield specifies whether the referenced edge mustbe masked or not (see figure 4.2). Permissible values for the MASK subfield are:
M {1} MaskS {2} ShowN {255} Masking is not relevant
Connected node *)
Masked edgeMASK = “M”
Shown edgeMASK = “S” or “N”
*) Connected nodes are not used ina “cartographic spaghetti” data structure
figure 4.2
4.7.3 Feature record to spatial record pointer field — use by area features
4.7.3.1 General
In the full topology data structure areas are encoded as one or more faces. The feature record referencesthe faces and they in turn reference their bounding edges. For all other data structures faces are not valid.Therefore, areas are encoded as closed set of edges in the spaghetti data structure and closed sets ofedges and connected nodes in the chain-node and planar graph data structures.
Closure of area and face boundaries must be explicit; implied closure is not allowed. This means that forthe spaghetti data structure the first point of the first bounding edge must be identical to the last point ofthe last bounding edge. For the chain-node and planar graph data structures, the first and last edgesbounding an area must meet at a common connected node. For full topology the first and last edgesbounding a face must meet at a common connected node.
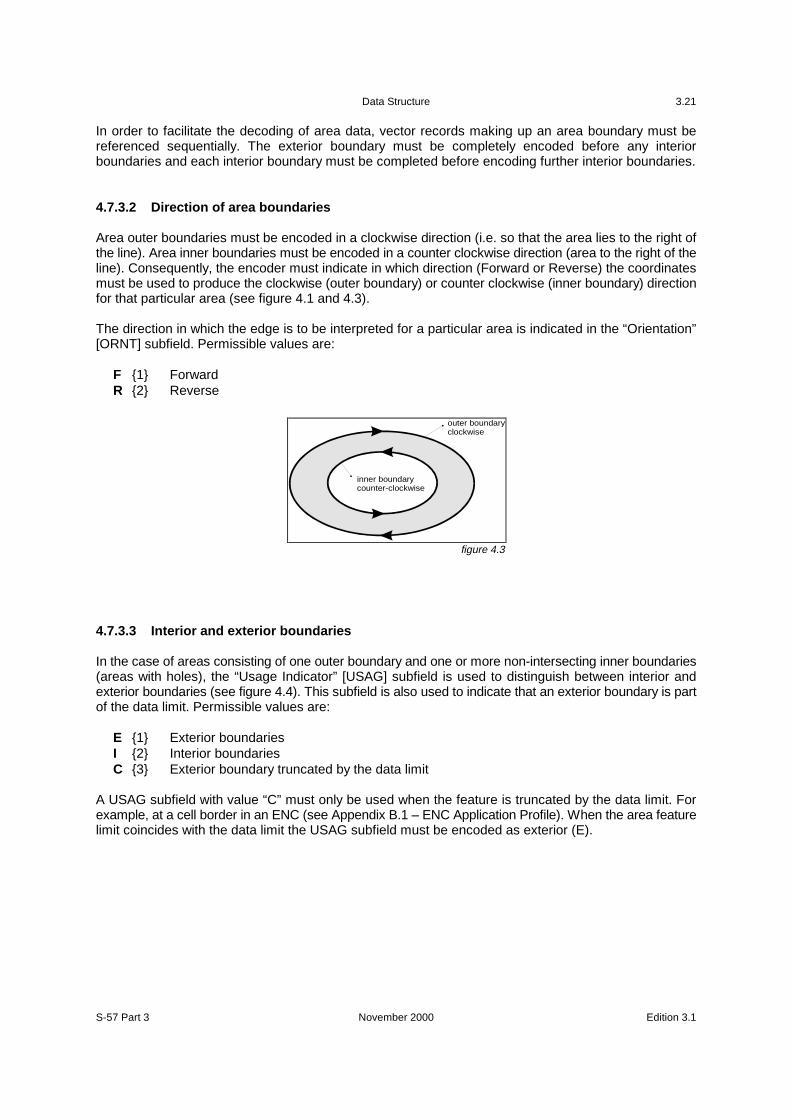
Data Structure
S-57 Part 3 November 2000 Edition 3.1
3.21
In order to facilitate the decoding of area data, vector records making up an area boundary must bereferenced sequentially. The exterior boundary must be completely encoded before any interiorboundaries and each interior boundary must be completed before encoding further interior boundaries.
4.7.3.2 Direction of area boundaries
Area outer boundaries must be encoded in a clockwise direction (i.e. so that the area lies to the right ofthe line). Area inner boundaries must be encoded in a counter clockwise direction (area to the right of theline). Consequently, the encoder must indicate in which direction (Forward or Reverse) the coordinatesmust be used to produce the clockwise (outer boundary) or counter clockwise (inner boundary) directionfor that particular area (see figure 4.1 and 4.3).
The direction in which the edge is to be interpreted for a particular area is indicated in the “Orientation”[ORNT] subfield. Permissible values are:
F {1} ForwardR {2} Reverse
4.7.3.3 Interior and exterior boundaries
In the case of areas consisting of one outer boundary and one or more non-intersecting inner boundaries(areas with holes), the “Usage Indicator” [USAG] subfield is used to distinguish between interior andexterior boundaries (see figure 4.4). This subfield is also used to indicate that an exterior boundary is partof the data limit. Permissible values are:
E {1} Exterior boundariesI {2} Interior boundariesC {3} Exterior boundary truncated by the data limit
A USAG subfield with value “C” must only be used when the feature is truncated by the data limit. Forexample, at a cell border in an ENC (see Appendix B.1 – ENC Application Profile). When the area featurelimit coincides with the data limit the USAG subfield must be encoded as exterior (E).
inner boundarycounter-clockwise
outer boundaryclockwise
figure 4.3
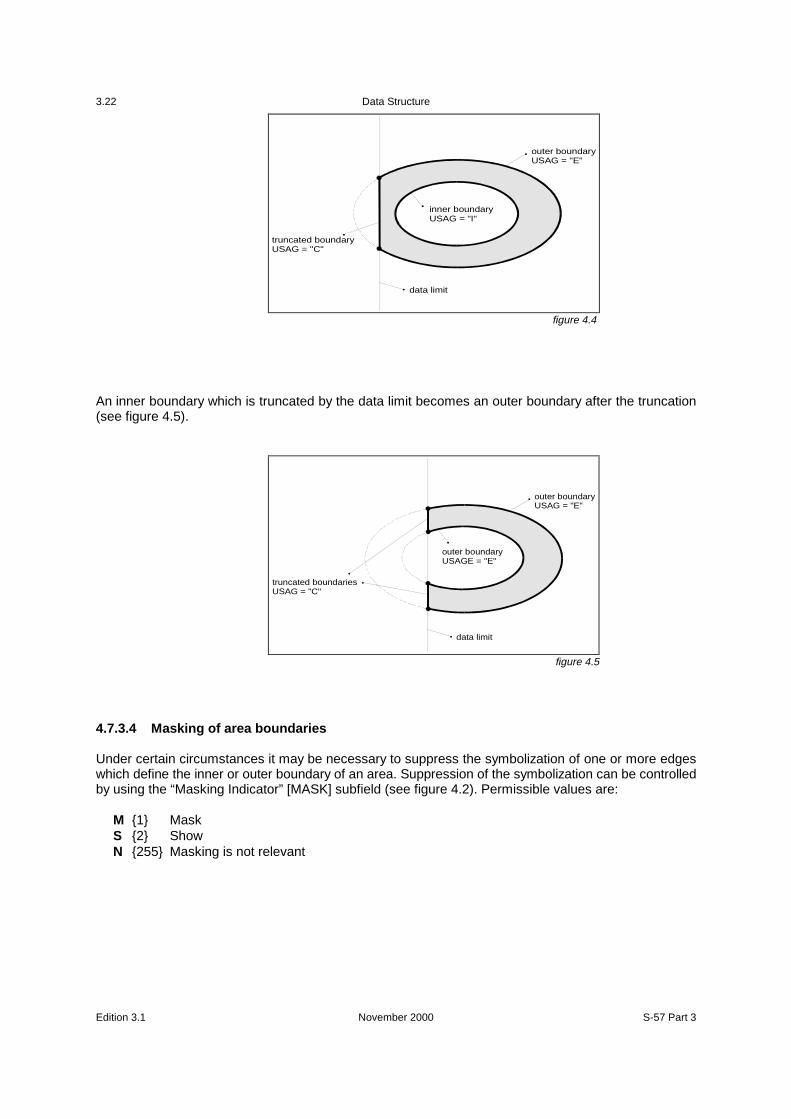
Data Structure
Edition 3.1 November 2000 S-57 Part 3
3.22
An inner boundary which is truncated by the data limit becomes an outer boundary after the truncation(see figure 4.5).
4.7.3.4 Masking of area boundaries
Under certain circumstances it may be necessary to suppress the symbolization of one or more edgeswhich define the inner or outer boundary of an area. Suppression of the symbolization can be controlledby using the “Masking Indicator” [MASK] subfield (see figure 4.2). Permissible values are:
M {1} MaskS {2} ShowN {255} Masking is not relevant
data limit
outer boundaryUSAG = "E"
truncated boundaryUSAG = "C"
inner boundaryUSAG = "I"
figure 4.4
outer boundaryUSAGE = "E"
data limit
outer boundaryUSAG = "E"
truncated boundariesUSAG = "C"
figure 4.5

Data Structure
S-57 Part 3 November 2000 Edition 3.1
3.23
5. Spatial record coding conventions
This Standard defines three types of spatial record. These are vector, raster and matrix. The spatial recordtypes are further defined in the clauses 5.1 to 5.3.
5.1 Vector records
A vector record can be of type isolated node, connected node, edge or face. The geometry of soundingsis considered to be a special case of an isolated node (see clause 5.1.4.1).Vector records consist of the following fields:
• record identifier field;• attribute field;• pointer control field;• pointer field;• coordinate control field;• coordinate fields *)
*) This standard defines different types of coordinate fields which are mutually exclusive within one vector record (see clause 5.1.4).
The “Pointer Control” field and the “Coordinate Control” field are only used for updating. The mechanismfor updating is explained in chapter 8. The other fields are discussed below.
A detailed structure description of the vector record is given in clause 7.7.1.
5.1.1 Vector record identifier field
The vector record identifier field holds the record identifier (key) for that vector record (see clause 2.2).It is also used to differentiate between the various types of vector records. For this purpose the “RecordName” [RCNM] subfield is used. Depending on the type of vector record, the RCNM subfield can take thefollowing values:
VI {110} Isolated nodeVC {120} Connected nodeVE {130} EdgeVF {140} Face
5.1.2 Vector record attribute field
Attributes of vector records must be encoded in the “Vector Record Attribute” [ATTV] field (seeclause 7.7.1.2). The numeric attribute label/code of the attribute from the IHO Object Catalogue isencoded in the “Attribute Label/Code” [ATTL] subfield. In both the ASCII and binary implementations, the“Attribute Value” subfield [ATVL] must be a string of characters terminated by the subfield terminator(1/15).
The IHO Object Catalogue (Appendix A) defines the valid attributes for vector objects. For each attributethe IHO Object Catalogue defines the permissible attribute values.
An attribute is not allowed to repeat within one vector record.

Data Structure
Edition 3.1 November 2000 S-57 Part 3
3.24
5.1.3 Vector record pointer field
The “Vector Record Pointer” [VRPT] field is used to maintain the correct topological relationships withinthe data.This field must be used in the chain-node, planar graph and full topology data structures for the edgevector records. This field must also be used in the full topology data structure for the isolated node andface vector records. It must not be used for the connected node vector record.In the spaghetti data structure this field is meaningless and, therefore, must not be used.
The use of this field for the isolated node, edge and face vector records is explained in the clauses 5.1.3.1to 5.1.3.3.
5.1.3.1 Vector record pointer field — use by isolated nodes
In the full topology data structure an isolated node may reference the face in which it is contained(i.e. pointer from isolated node to face). For this purpose the “Topology Indicator” [TOPI] subfield is used.The following value must be used:
F {5} Containing face
The ORNT, USAG and MASK subfields must be set to “N” {255}.
5.1.3.2 Vector record pointer field — use by edges
In the chain-node, planar graph and full topology data structures the beginning and end of an edge areexplicitly coded as connected nodes. The connected nodes are referenced by the edge (i.e. pointer fromedge to connected node). Edges which close on themselves (loop feature) must reference the sameconnected node twice.In the full topology data structure edges must also reference the faces to their left and right.
All references are mandatory. Omission of these references results in a corruption of the topologicalstructure.
The pointer type is identified by the value of the “Topology Indicator” [TOPI] subfield. The following valuesare permitted for an edge vector record:
B {1} Beginning nodeE {2} End nodeS {3} Left faceD {4} Right face
All values are relative to the coding direction (see figure 5.1). References must be made in the sequenceindicated above (beginning node, end node, left face, right face).
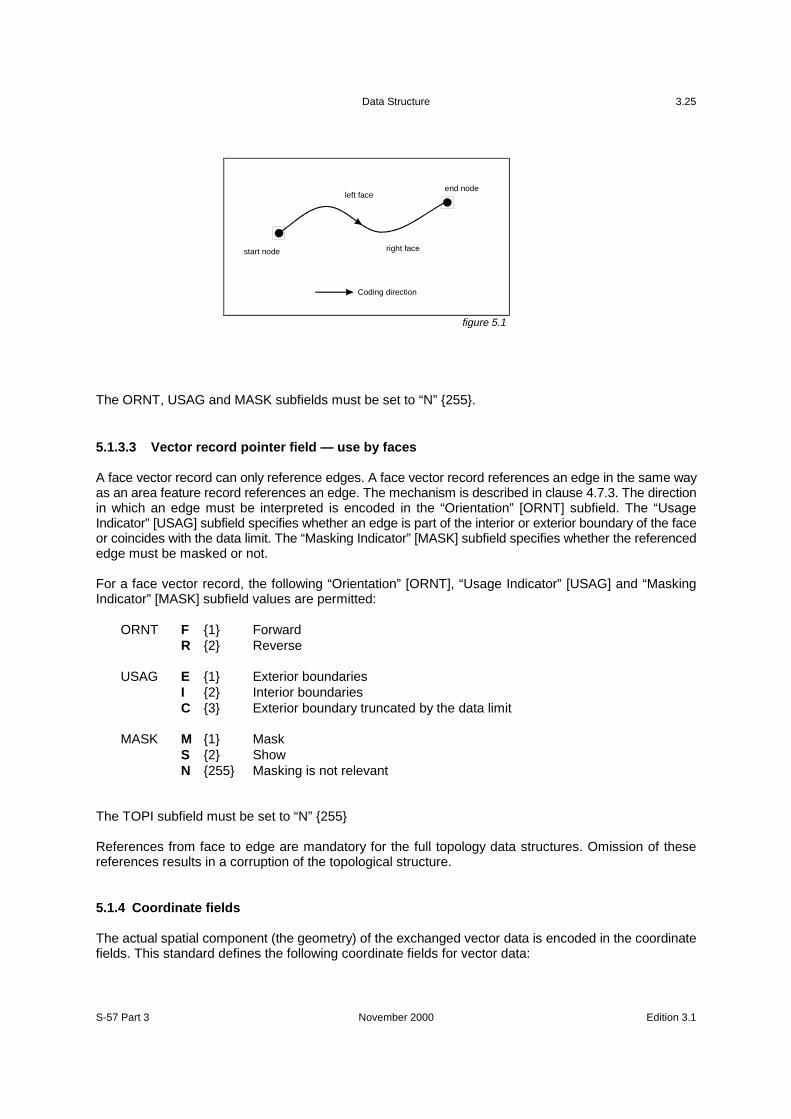
Data Structure
S-57 Part 3 November 2000 Edition 3.1
3.25
The ORNT, USAG and MASK subfields must be set to “N” {255}.
5.1.3.3 Vector record pointer field — use by faces
A face vector record can only reference edges. A face vector record references an edge in the same wayas an area feature record references an edge. The mechanism is described in clause 4.7.3. The directionin which an edge must be interpreted is encoded in the “Orientation” [ORNT] subfield. The “UsageIndicator” [USAG] subfield specifies whether an edge is part of the interior or exterior boundary of the faceor coincides with the data limit. The “Masking Indicator” [MASK] subfield specifies whether the referencededge must be masked or not.
For a face vector record, the following “Orientation” [ORNT], “Usage Indicator” [USAG] and “MaskingIndicator” [MASK] subfield values are permitted:
ORNT F {1} ForwardR {2} Reverse
USAG E {1} Exterior boundariesI {2} Interior boundariesC {3} Exterior boundary truncated by the data limit
MASK M {1} MaskS {2} ShowN {255} Masking is not relevant
The TOPI subfield must be set to “N” {255}
References from face to edge are mandatory for the full topology data structures. Omission of thesereferences results in a corruption of the topological structure.
5.1.4 Coordinate fields
The actual spatial component (the geometry) of the exchanged vector data is encoded in the coordinatefields. This standard defines the following coordinate fields for vector data:
Coding direction
end node
start node
left face
right face
figure 5.1
Data Structure
Edition 3.1 November 2000 S-57 Part 3
3.26
• 2-D coordinate field;• 3-D coordinate field (sounding array);• Arc/Curve coordinate fields.
The coordinate fields above are mutually exclusive within one vector record. The use of these fieldsdepends on the type of vector record in which they are encoded. An explanation of the sounding, isolatednode, connected node and edge vector records is given in clauses 5.1.4.1 to 5.1.4.4.
Soundings are not explicitly defined by this standard as a separate vector record type. They areconsidered to be a special case of isolated nodes. However, they are encoded differently and are,therefore, discussed separately.
A face vector record does not contain coordinate fields. It only references edge vector records (see clause5.1.3.3).
This Standard allows for coordinates to be stored using a number of different units. Refer to clause 3.2for details on how to encode coordinates.
5.1.4.1 Coordinate fields — use by soundings
In the interests of efficiency, soundings may be grouped into one vector record, provided that all spatialattributes and attribute values are common to that group (see also clause 4.1). A special construct for theencoding of soundings is provided, called a 3-D Coordinate or sounding array field, with the tag SG3D.Within this field the sounding value is held as the third component of repeating Y-coordinate, X-coordinateand depth triplets.
5.1.4.2 Coordinate fields — use by isolated nodes
Coordinates of isolated nodes must be encoded in the “2-D Coordinate” [SG2D] field and will comprisea single coordinate pair (see clause 7.7.1.6).
5.1.4.3 Coordinate fields — use by connected nodes
Coordinates of connected nodes must be encoded in the “2-D Coordinate” [SG2D] field and will comprisea single coordinate pair (see clause 7.7.1.6).
5.1.4.4 Coordinate fields — use by edges
Coordinates of edges may be encoded using either the “2-D Coordinate” [SG2D] field or the “Arc CurveDefinition” [ARCC] field. The SG2D field holds repeating pairs of coordinates implicitly joined by straightlines. The ARCC field provides the means for defining mathematically derivable arcs and curves of fourtypes. The SG2D and ARCC fields are mutually exclusive.
In chain-node, planar graph and full topology data structures the beginning and end of an edge areexplicitly coded as connected nodes. The geometry of the connected node is not part of the edge. Edgesdirectly reference their beginning and end nodes via the vector record pointer (see clause 5.1.3.2). Thefirst and last points in the edge coordinate field are connected to the connected nodes by implied straightlines. A straight line between two connected nodes must be encoded as an edge with a reference to bothconnected nodes (VRPT) but no coordinate geometry (i.e. no SG2D or ARCC coordinate fields).The type of interpolation used for an arc/curve representation is indicated in the “Arc/Curve Type” [ATYP]subfield (see clause 7.7.1.8). The options are:
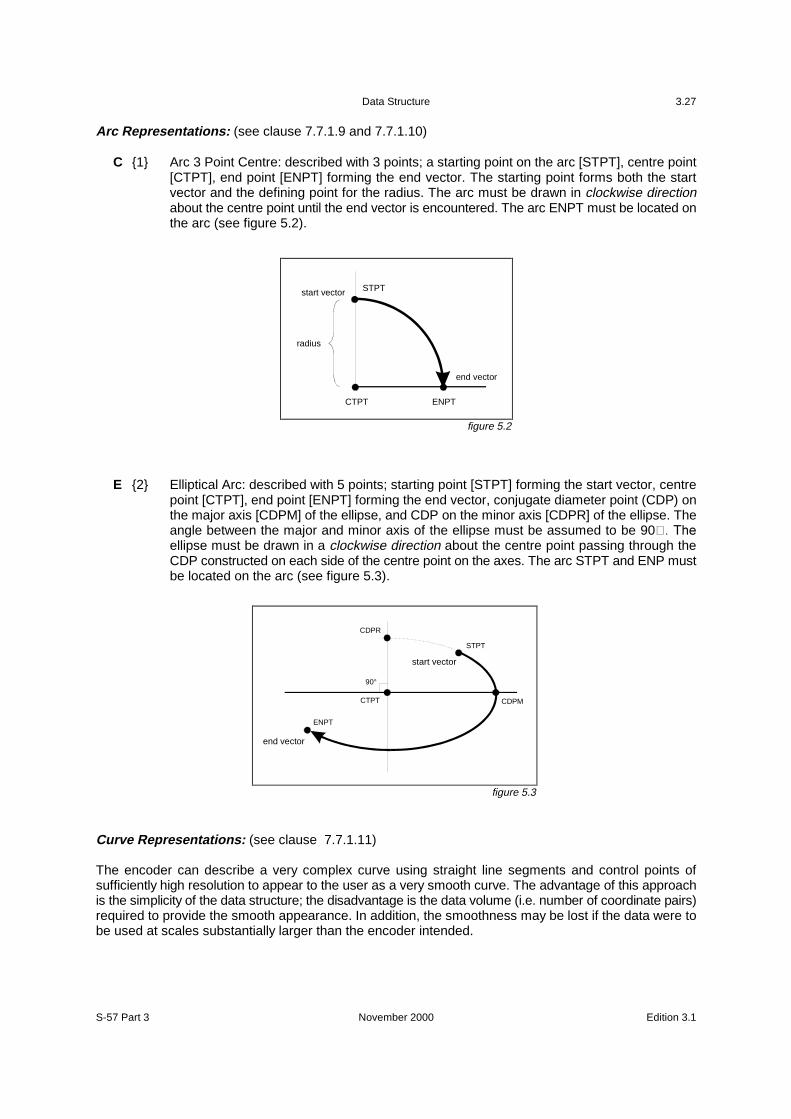
Data Structure
S-57 Part 3 November 2000 Edition 3.1
3.27
Arc Representations: (see clause 7.7.1.9 and 7.7.1.10)
C {1} Arc 3 Point Centre: described with 3 points; a starting point on the arc [STPT], centre point[CTPT], end point [ENPT] forming the end vector. The starting point forms both the startvector and the defining point for the radius. The arc must be drawn in clockwise directionabout the centre point until the end vector is encountered. The arc ENPT must be located onthe arc (see figure 5.2).
E {2} Elliptical Arc: described with 5 points; starting point [STPT] forming the start vector, centrepoint [CTPT], end point [ENPT] forming the end vector, conjugate diameter point (CDP) onthe major axis [CDPM] of the ellipse, and CDP on the minor axis [CDPR] of the ellipse. Theangle between the major and minor axis of the ellipse must be assumed to be 90���7KHellipse must be drawn in a clockwise direction about the centre point passing through theCDP constructed on each side of the centre point on the axes. The arc STPT and ENP mustbe located on the arc (see figure 5.3).
Curve Representations: (see clause 7.7.1.11)
The encoder can describe a very complex curve using straight line segments and control points ofsufficiently high resolution to appear to the user as a very smooth curve. The advantage of this approachis the simplicity of the data structure; the disadvantage is the data volume (i.e. number of coordinate pairs)required to provide the smooth appearance. In addition, the smoothness may be lost if the data were tobe used at scales substantially larger than the encoder intended.
radius
start vector
end vector
CTPT
STPT
ENPT
figure 5.2
STPT
ENPT
end vector
start vector
CTPT CDPM
CDPR
90°
figure 5.3
Data Structure
Edition 3.1 November 2000 S-57 Part 3
3.28
Conversely, the encoder can describe a very complex curve using a specific polynomial description which,if accurately regenerated, will appear to the user as a very smooth curve. The advantage of this approachis the lower data volume relative to the method desribed above; the disadvantage is that the user may notbe capable of regenerating the curve as intended.
Clause 7.7.1.8 does not describe the underlying polynomials as the implementation may vary significantlyamongst various vendor systems. The information required to adequately describe the polynomialcharacteristics is provided in a structured form. Thus, when specifying to the user that a polynomial basedregeneration is desired, the ARCC field must be used in conjunction with the CT2D field for control points.Within the ARCC field, the ATYP (Arc/Curve Type), SURF (Construction Surface), ORDR (Curve Order),and RESO (Point Resolution) subfields must be used to accurately describe the characteristics that theencoder intends to be applied to the control points of CT2D.
If the user applies these characteristics in any way other than that intended by the encoder, the values ofthe associated attributes (e.g. quality attributes) may not apply.
A more thorough understanding of the underlying mathematics may be found in any of a number of textson computer graphics or by consulting any of the several computer graphics drawing standards. A morethorough understanding of a particular vendor implementation may be sought from the specific vendor.
The three implemented curve types have the following implementation details:
U {3} Uniform B-Spline
a) use one ARCC field to describe characteristics with one or more CT2D fields to describe allcontrol points.
B {4} Piecewise Bezier
a) use one ARCC field to describe characteristics with one or more CT2D fields to describe allcontrol points.
N {5} Non-Uniform Rational B-Spline
a) use one ARCC field to describe the characteristics of each set of polynomials with one or moreCT2D fields to describe the control points for the specified set, and
b) use multiple pointers to edge vector records in the FSPT field to group the sets into a completerepresentation.
5.2 Raster record coding conventions
To be defined.
5.3 Matrix record coding conventions
To be defined.
Data Structure
S-57 Part 3 November 2000 Edition 3.1
3.29
6. Relationship coding
Relationships between records can be encoded in three ways:
• by using a “Catalogue Cross Reference” record;• by using a collection feature record;• by defining a nominated “master” feature record.
These methods are described in clause 6.1 to 6.3 respectively. Additional rules for relationship coding maybe defined by the relevant product specification.
6.1 Catalogue Cross Reference record
The Catalogue Cross Reference record can be used to link records of any type within an exchange set.The two records are identified by foreign pointers (see clause 2.2) held in the NAM1 and NAM2 subfields.The exact nature of the relationship can only be indicated by use of the “Comment” [COMT] subfield.
Only one relationship can be encoded in one Catalogue Cross Reference field.
6.2 Collection feature record
A collection feature record is the data structure implementation of a collection object. A collection featurerecord is formed in the same way as other feature records (see chapter 4).
The collection object classes are defined in the IHO Object Catalogue (Appendix A).
A collection feature record may only reference feature objects. It must not reference any spatial records.The “Object geometric primitive” [PRIM] subfield must, therefore, be “N” {255}.
The relationship is encoded using the feature record to feature object pointer field. This field holds theLNAM foreign pointer (see clause 4.3) of one feature object. A collection feature record must referenceat least two other feature objects and must not reference itself. Collection feature records may referenceother collection feature objects.
The “Relationship indicator” [RIND] subfield is used to indicate the nature of the relationship. It may haveone of the following values:
M {1} masterS {2} slaveP {3} peer
Additional values may be defined by the relevant product specification.
There can be only one master (M) relationship per collection feature record. All remaining relationshipsfrom that collection feature record must be slave (S). If one relationship is defined as peer (P) all otherrelationships from that collection feature record must also be defined as peer (P).
All feature objects referenced by a collection feature record are related in the same way (i.e. that definedby the collection object class).
A collection object may have attributes. The allowable attributes for each collection object class aredefined in the Object Catalogue. The use and meaning of these attributes must be defined by theappropriate product specification.

Data Structure
Edition 3.1 November 2000 S-57 Part 3
3.30
6.3 Nominated “master” feature record
In order to facilitate efficient coding, hierarchical relationships (i.e. master to slave) may be encoded bynominating one feature record as the “master” of the relationship (for example, a buoy might beconsidered the master and the topmark, light and fog signal might be considered its slaves). This masterfeature record must carry a feature record to feature object pointer field for each related slave object. Thisfield holds the LNAM foreign pointer (see clause 4.3) of one feature object.
In all other respects the master feature record is the same as other feature records, it may have attributesand must reference at least one spatial record (see chapter 4).
This relationship is always master to slave; the RIND subfield must contain the value “S” {2}. Thismechanism cannot be used for encoding peer to peer relationships.
Master feature records may reference other master feature objects but must not reference themselves.
Data Structure
S-57 Part 3 November 2000 Edition 3.1
3.31
7. Structure implementation
7.1 Introduction
This chapter specifies the structure of an exchange set at the record and field levels. It further specifiesthe contents of the physical constructs required for their implementation as ISO/IEC 8211 data records,fields, and subfields. The grouping of records into ISO/IEC 8211 files is considered application specificand is, therefore, described in the relevant product specification (see Appendix B – ProductSpecifications).
7.2 Notations used in this clause
The specification of the structure is given as a tree structure diagram which comprises the names,linkages and repetition factors of the physical constructs. The detailed specifications of fields and subfieldsare given in tabular form.
7.2.1 Tree structure diagrams
The structure of a record is an ordered rooted tree, represented as follows:
Where A is the root node and parent of node B and node C. Node B isthe root of a sub-tree and the parent of nodes D and E. Nodes arealso referred to as the offspring of their parents. E.g. node B is theoffspring of node A.
The tree structure diagrams must be interpreted in a preorderedtraversal sequence (top down, left branch first).
For ease of annotation these diagrams are presented vertically in this standard using ASCII characters.In this notation the above diagram becomes:
Where: <r> is a sub-tree repetition factor (if missing, r=1) <R> implies indefinite repetition
* implies either sub-tree D or E but not both.
In this way the preorder traversal sequence becomes “top down”.
figure 7.2
figure 7.1
A| |--<r>---- B| || *---D| || *---E||--<R>--- C

Data Structure
Edition 3.1 November 2000 S-57 Part 3
3.32
The tree structure diagram specifies for each field: the ISO/IEC 8211 field tag, an indication of the fieldstructure and a field name, i.e.
[field tag] [structure] [field name]
where [structure] has the values: <n> implies an n-tuple (1-D array) containing non-repeatingsubfields
<m*n> implies an m by n array with m rows and n colums<*n> implies a n-column table with indefinitely repeating rows
The tree structure diagrams define which fields are allowed to repeat. However, within a record, thedegree of repetition of fields will depend on the data that is being encoded. In some cases a particular fieldmay not be required and so will be absent (see clause 2.1). However, in all cases, the pre-order traversalsequence of a data record will be the same as shown in the generic tree structure diagram for that recordtype.
N.B. The notation of the tree structure diagrams is described in detail in ISO/IEC 8211:1994 Annex B.1
7.2.2 Field tables
Each table is preceeded by a row in bold outline indicating the field name and field tag. The body of thetable specifies the subfield names and labels as well as both the ASCII and binary (Bin) alternateISO 8211 formats and the S-57 ASCII domain (Dom). The subfield specification may include a requiredvalue or range constraint. The following is an example of a field table based on the Data Set Identificationfield (not all subfields are displayed, refer to 7.3.1.1 for the complete description)
Field Tag: DSID [Upd] *) Field Name: Data Set Identification
Subfield name Label FormatASCII Bin
Dom Subfield content and specification
Record Name RCNM A(2) b11 an "DS" {10} **)
Record Identification Number RCID I(10) b14 dg Range: 1 to 232-2
Exchange Purpose EXPP A(1) b11 an "N" {1} - Data set is New"R" {2} - Data set is a revision to an existing
one
Intended usage INTU I(1) ***) bt A numeric value indicating the intended usage forwhich the data has been compiled (see AppendixB - Product Specifications)
Data set name DSNM A( ) ***) bt A String indicating the data set name (seeAppendix B - Product Specifications)
Edition number EDTN A( ) ***) bt A string indicating the edition number (seeAppendix B - Product Specifications)
...
table 7.1
*) [Upd] indicates that the field is only used for updating (for the DSID field this is used as an example)**) Required ASCII values are enclosed in double quotes and the values to be encoded in binary are enclosed in {...}***) When a binary format is not specified the ASCII format applies.
Where: - Label is the ISO/IEC 8211 subfield label, present only in the data descriptive record andrequired to identify the subfields within a field. A label preceded by “*” signifies that thesubfield and the subsequent ones, repeat within the field. This, therefore, indicates thepresence of a 2-D array or table for which the subfield labels provide the column headings(the vector labels of a cartesian label).
Data Structure
S-57 Part 3 November 2000 Edition 3.1
3.33
- Format is the ISO/IEC 8211 ASCII or binary subfield data format (see table 7.2)
- Dom is the S-57 ASCII domain (see table 7.3)
7.2.2.1 Data format
Subfield data formats are specified by ISO/IEC 8211. The allowable data formats are as follows:
Format Precision = w Data type
A *) Character data
I *) Implicit point representation
R *) Explicit point representation
B **) Bit string
@ subfield label is a row heading for a2-D array or table of known length
b1w 1,2,4 ***) unsigned integer
b2w 1,2,4 ***) signed integer
table 7.2
*) An extent of X(n) indicates a fixed length subfield of length n (in bytes). An extent of X( ) indicates a variable length subfieldterminated by the appropriate delimiter (see clause 2.5).
**) The width of a fixed length bit subfield must be specified in bits. If necessary, the last byte of a fixed length bit subfield mustbe filled on the right with binary zero’s.
***) In the binary form, numerical data forms are constrained by the precision of the ISO/IEC 8211 binary format.
Where: Precision is the width of the data items in bytesw is a permitted value of precisionunsigned integer is a binary integersigned integer is a two’s complement binary integer
Binary values and multi-byte character codes (see clause 2.4 and Annex B) must be stored in the “leastsignificant byte first” (LSBF or “little-endian”) order. LSBF is an ordering of bytes in which the leastsignificant byte is placed closest to the beginning of a file.
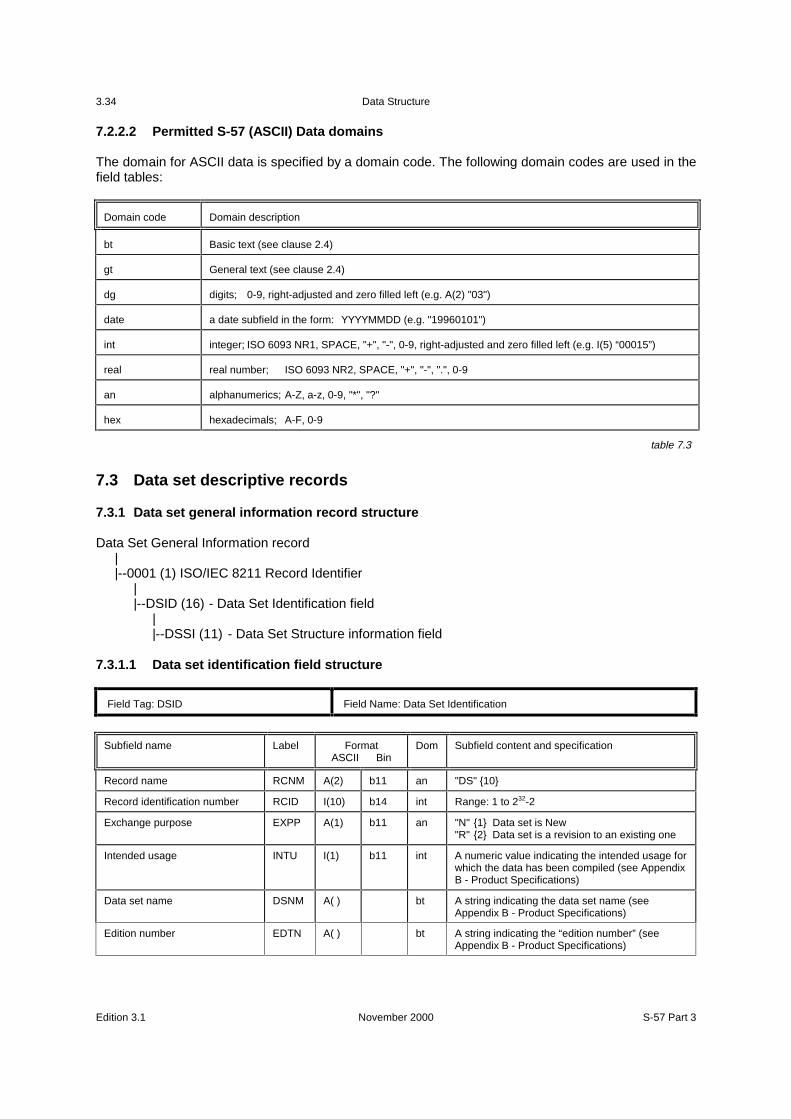
Data Structure
Edition 3.1 November 2000 S-57 Part 3
3.34
7.2.2.2 Permitted S-57 (ASCII) Data domains
The domain for ASCII data is specified by a domain code. The following domain codes are used in thefield tables:
Domain code Domain description
bt Basic text (see clause 2.4)
gt General text (see clause 2.4)
dg digits; 0-9, right-adjusted and zero filled left (e.g. A(2) "03")
date a date subfield in the form: YYYYMMDD (e.g. "19960101")
int integer; ISO 6093 NR1, SPACE, "+", "-", 0-9, right-adjusted and zero filled left (e.g. I(5) “00015”)
real real number; ISO 6093 NR2, SPACE, "+", "-", ".", 0-9
an alphanumerics; A-Z, a-z, 0-9, "*", "?"
hex hexadecimals; A-F, 0-9
table 7.3
7.3 Data set descriptive records
7.3.1 Data set general information record structure
Data Set General Information record||--0001 (1) ISO/IEC 8211 Record Identifier
||--DSID (16) - Data Set Identification field
||--DSSI (11) - Data Set Structure information field
7.3.1.1 Data set identification field structure
Field Tag: DSID Field Name: Data Set Identification
Subfield name Label FormatASCII Bin
Dom Subfield content and specification
Record name RCNM A(2) b11 an "DS" {10}
Record identification number RCID I(10) b14 int Range: 1 to 232-2
Exchange purpose EXPP A(1) b11 an "N" {1} Data set is New"R" {2} Data set is a revision to an existing one
Intended usage INTU I(1) b11 int A numeric value indicating the intended usage forwhich the data has been compiled (see AppendixB - Product Specifications)
Data set name DSNM A( ) bt A string indicating the data set name (seeAppendix B - Product Specifications)
Edition number EDTN A( ) bt A string indicating the “edition number” (seeAppendix B - Product Specifications)
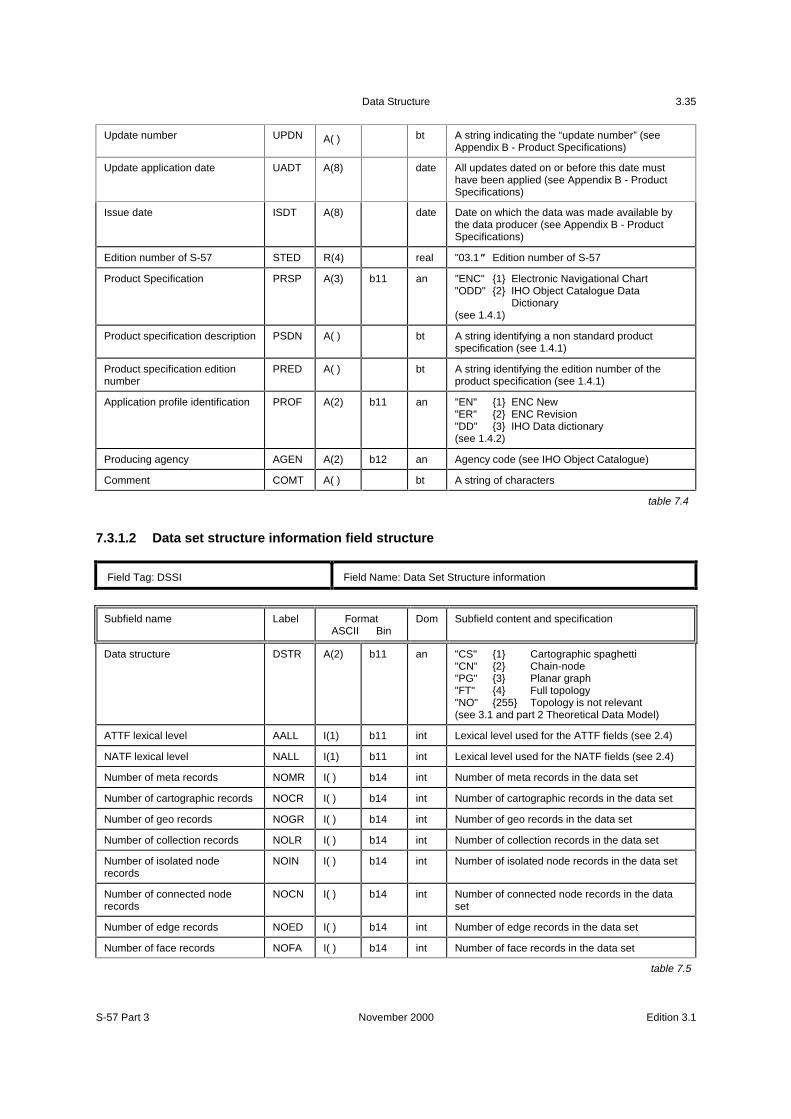
Data Structure
S-57 Part 3 November 2000 Edition 3.1
3.35
Update number UPDN A( ) bt A string indicating the “update number” (seeAppendix B - Product Specifications)
Update application date UADT A(8) date All updates dated on or before this date musthave been applied (see Appendix B - ProductSpecifications)
Issue date ISDT A(8) date Date on which the data was made available bythe data producer (see Appendix B - ProductSpecifications)
Edition number of S-57 STED R(4) real "03.1" Edition number of S-57
Product Specification PRSP A(3) b11 an "ENC" {1} Electronic Navigational Chart"ODD" {2} IHO Object Catalogue Data
Dictionary(see 1.4.1)
Product specification description PSDN A( ) bt A string identifying a non standard productspecification (see 1.4.1)
Product specification editionnumber
PRED A( ) bt A string identifying the edition number of theproduct specification (see 1.4.1)
Application profile identification PROF A(2) b11 an "EN" {1} ENC New"ER" {2} ENC Revision"DD" {3} IHO Data dictionary(see 1.4.2)
Producing agency AGEN A(2) b12 an Agency code (see IHO Object Catalogue)
Comment COMT A( ) bt A string of characters
table 7.4
7.3.1.2 Data set structure information field structure
Field Tag: DSSI Field Name: Data Set Structure information
Subfield name Label FormatASCII Bin
Dom Subfield content and specification
Data structure DSTR A(2) b11 an "CS" {1} Cartographic spaghetti"CN" {2} Chain-node"PG" {3} Planar graph"FT" {4} Full topology"NO" {255} Topology is not relevant(see 3.1 and part 2 Theoretical Data Model)
ATTF lexical level AALL I(1) b11 int Lexical level used for the ATTF fields (see 2.4)
NATF lexical level NALL I(1) b11 int Lexical level used for the NATF fields (see 2.4)
Number of meta records NOMR I( ) b14 int Number of meta records in the data set
Number of cartographic records NOCR I( ) b14 int Number of cartographic records in the data set
Number of geo records NOGR I( ) b14 int Number of geo records in the data set
Number of collection records NOLR I( ) b14 int Number of collection records in the data set
Number of isolated noderecords
NOIN I( ) b14 int Number of isolated node records in the data set
Number of connected noderecords
NOCN I( ) b14 int Number of connected node records in the dataset
Number of edge records NOED I( ) b14 int Number of edge records in the data set
Number of face records NOFA I( ) b14 int Number of face records in the data set
table 7.5
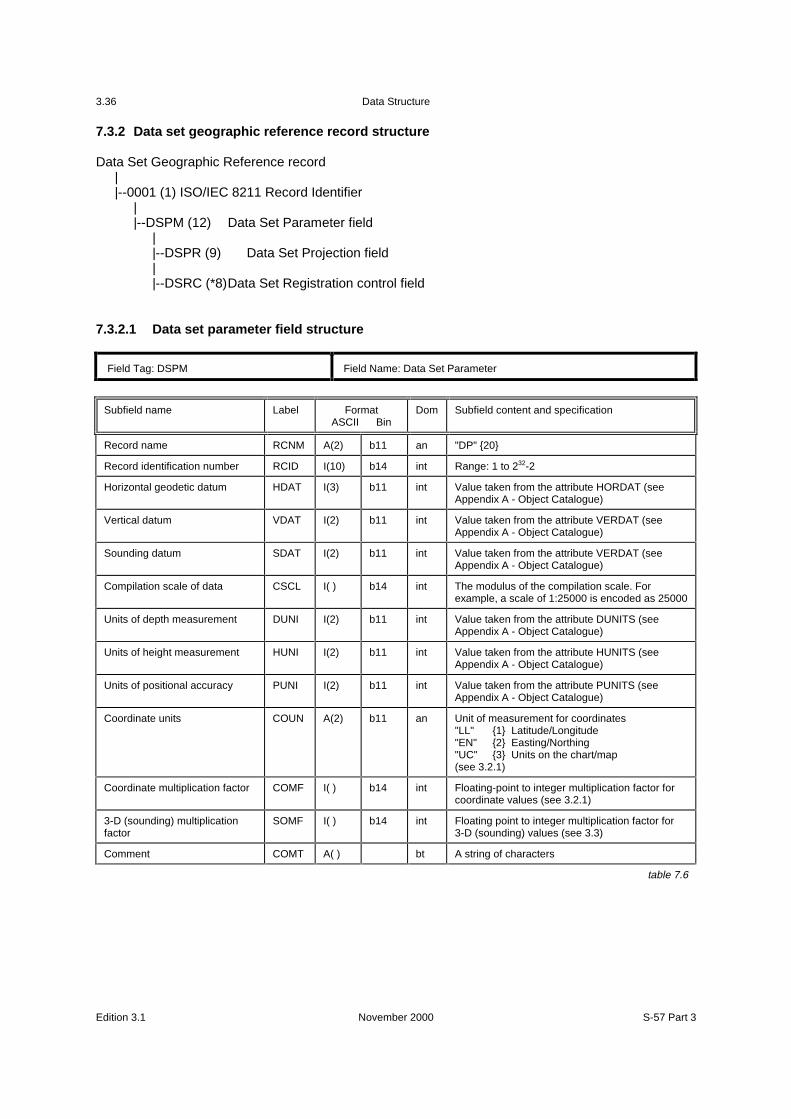
Data Structure
Edition 3.1 November 2000 S-57 Part 3
3.36
7.3.2 Data set geographic reference record structure
Data Set Geographic Reference record||--0001 (1) ISO/IEC 8211 Record Identifier
||--DSPM (12) Data Set Parameter field
||--DSPR (9) Data Set Projection field||--DSRC (*8)Data Set Registration control field
7.3.2.1 Data set parameter field structure
Field Tag: DSPM Field Name: Data Set Parameter
Subfield name Label FormatASCII Bin
Dom Subfield content and specification
Record name RCNM A(2) b11 an "DP" {20}
Record identification number RCID I(10) b14 int Range: 1 to 232-2
Horizontal geodetic datum HDAT I(3) b11 int Value taken from the attribute HORDAT (seeAppendix A - Object Catalogue)
Vertical datum VDAT I(2) b11 int Value taken from the attribute VERDAT (seeAppendix A - Object Catalogue)
Sounding datum SDAT I(2) b11 int Value taken from the attribute VERDAT (seeAppendix A - Object Catalogue)
Compilation scale of data CSCL I( ) b14 int The modulus of the compilation scale. Forexample, a scale of 1:25000 is encoded as 25000
Units of depth measurement DUNI I(2) b11 int Value taken from the attribute DUNITS (seeAppendix A - Object Catalogue)
Units of height measurement HUNI I(2) b11 int Value taken from the attribute HUNITS (seeAppendix A - Object Catalogue)
Units of positional accuracy PUNI I(2) b11 int Value taken from the attribute PUNITS (seeAppendix A - Object Catalogue)
Coordinate units COUN A(2) b11 an Unit of measurement for coordinates"LL" {1} Latitude/Longitude"EN" {2} Easting/Northing"UC" {3} Units on the chart/map(see 3.2.1)
Coordinate multiplication factor COMF I( ) b14 int Floating-point to integer multiplication factor forcoordinate values (see 3.2.1)
3-D (sounding) multiplicationfactor
SOMF I( ) b14 int Floating point to integer multiplication factor for3-D (sounding) values (see 3.3)
Comment COMT A( ) bt A string of characters
table 7.6
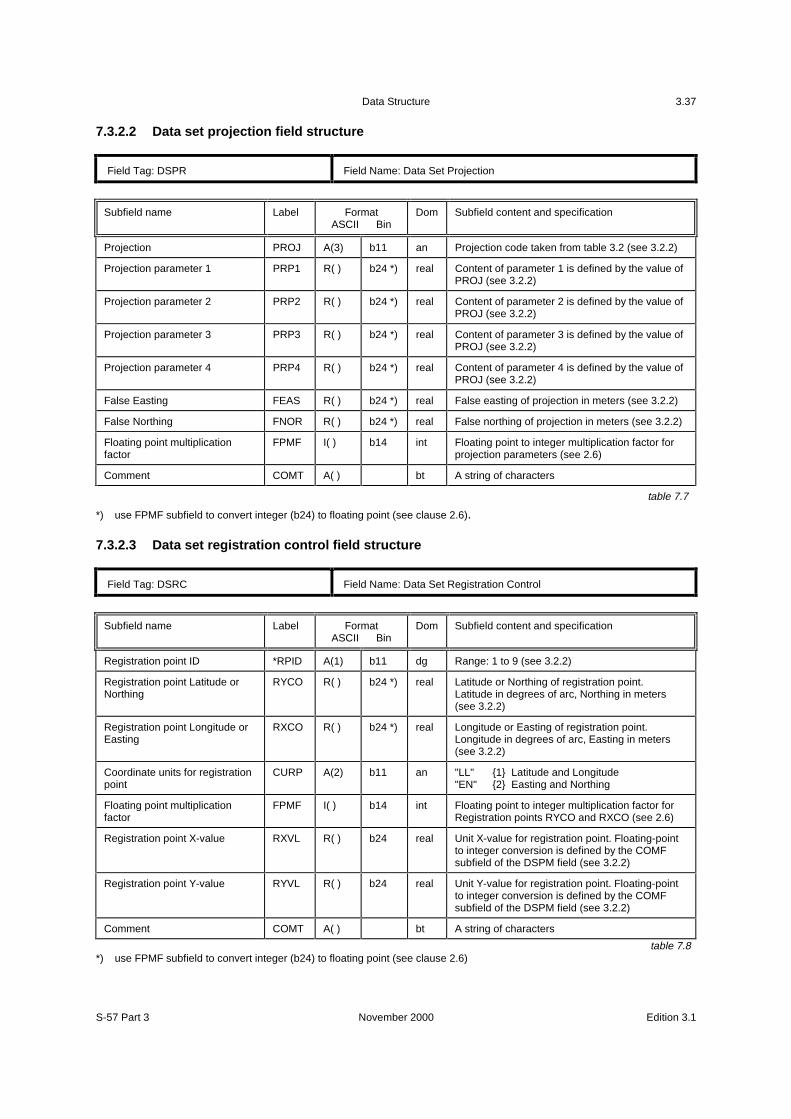
Data Structure
S-57 Part 3 November 2000 Edition 3.1
3.37
7.3.2.2 Data set projection field structure
Field Tag: DSPR Field Name: Data Set Projection
Subfield name Label FormatASCII Bin
Dom Subfield content and specification
Projection PROJ A(3) b11 an Projection code taken from table 3.2 (see 3.2.2)
Projection parameter 1 PRP1 R( ) b24 *) real Content of parameter 1 is defined by the value ofPROJ (see 3.2.2)
Projection parameter 2 PRP2 R( ) b24 *) real Content of parameter 2 is defined by the value ofPROJ (see 3.2.2)
Projection parameter 3 PRP3 R( ) b24 *) real Content of parameter 3 is defined by the value ofPROJ (see 3.2.2)
Projection parameter 4 PRP4 R( ) b24 *) real Content of parameter 4 is defined by the value ofPROJ (see 3.2.2)
False Easting FEAS R( ) b24 *) real False easting of projection in meters (see 3.2.2)
False Northing FNOR R( ) b24 *) real False northing of projection in meters (see 3.2.2)
Floating point multiplicationfactor
FPMF I( ) b14 int Floating point to integer multiplication factor forprojection parameters (see 2.6)
Comment COMT A( ) bt A string of characters
table 7.7
*) use FPMF subfield to convert integer (b24) to floating point (see clause 2.6).
7.3.2.3 Data set registration control field structure
Field Tag: DSRC Field Name: Data Set Registration Control
Subfield name Label FormatASCII Bin
Dom Subfield content and specification
Registration point ID *RPID A(1) b11 dg Range: 1 to 9 (see 3.2.2)
Registration point Latitude orNorthing
RYCO R( ) b24 *) real Latitude or Northing of registration point.Latitude in degrees of arc, Northing in meters(see 3.2.2)
Registration point Longitude orEasting
RXCO R( ) b24 *) real Longitude or Easting of registration point.Longitude in degrees of arc, Easting in meters(see 3.2.2)
Coordinate units for registrationpoint
CURP A(2) b11 an "LL" {1} Latitude and Longitude"EN" {2} Easting and Northing
Floating point multiplicationfactor
FPMF I( ) b14 int Floating point to integer multiplication factor forRegistration points RYCO and RXCO (see 2.6)
Registration point X-value RXVL R( ) b24 real Unit X-value for registration point. Floating-pointto integer conversion is defined by the COMFsubfield of the DSPM field (see 3.2.2)
Registration point Y-value RYVL R( ) b24 real Unit Y-value for registration point. Floating-pointto integer conversion is defined by the COMFsubfield of the DSPM field (see 3.2.2)
Comment COMT A( ) bt A string of characters
table 7.8*) use FPMF subfield to convert integer (b24) to floating point (see clause 2.6)
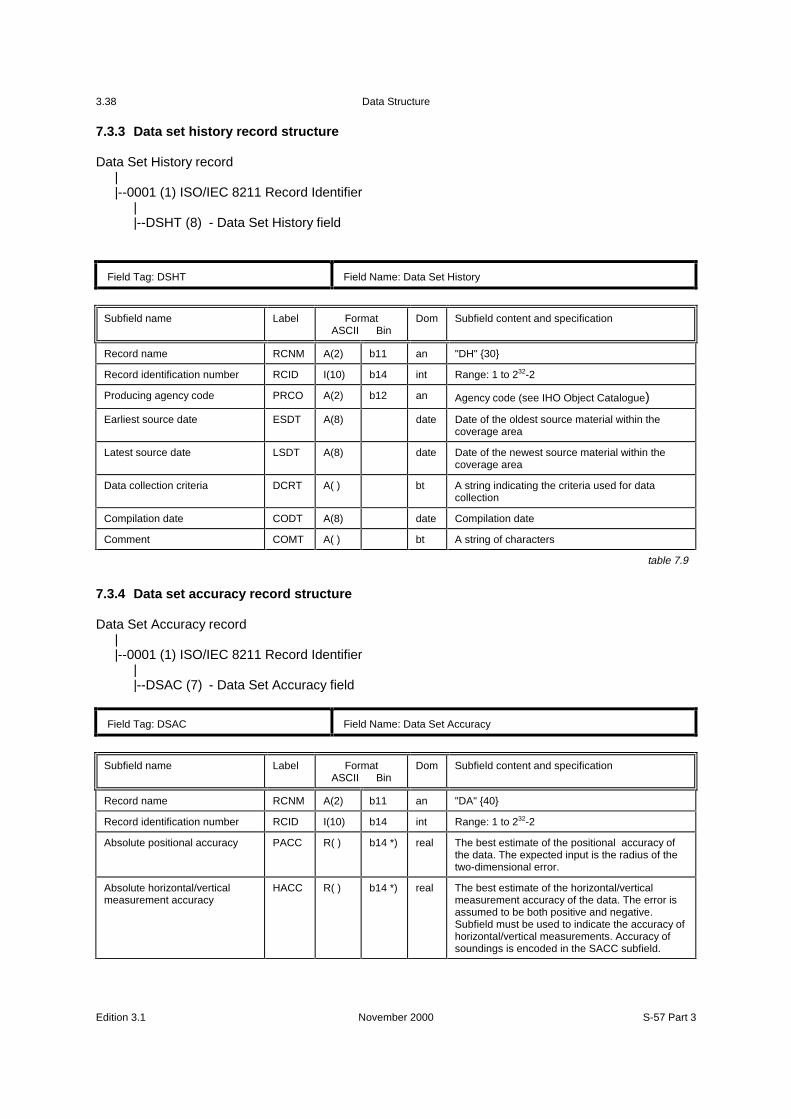
Data Structure
Edition 3.1 November 2000 S-57 Part 3
3.38
7.3.3 Data set history record structure
Data Set History record||--0001 (1) ISO/IEC 8211 Record Identifier
||--DSHT (8) - Data Set History field
Field Tag: DSHT Field Name: Data Set History
Subfield name Label FormatASCII Bin
Dom Subfield content and specification
Record name RCNM A(2) b11 an "DH" {30}
Record identification number RCID I(10) b14 int Range: 1 to 232-2
Producing agency code PRCO A(2) b12 an Agency code (see IHO Object Catalogue)
Earliest source date ESDT A(8) date Date of the oldest source material within thecoverage area
Latest source date LSDT A(8) date Date of the newest source material within thecoverage area
Data collection criteria DCRT A( ) bt A string indicating the criteria used for datacollection
Compilation date CODT A(8) date Compilation date
Comment COMT A( ) bt A string of characters
table 7.9
7.3.4 Data set accuracy record structure
Data Set Accuracy record||--0001 (1) ISO/IEC 8211 Record Identifier
||--DSAC (7) - Data Set Accuracy field
Field Tag: DSAC Field Name: Data Set Accuracy
Subfield name Label FormatASCII Bin
Dom Subfield content and specification
Record name RCNM A(2) b11 an "DA" {40}
Record identification number RCID I(10) b14 int Range: 1 to 232-2
Absolute positional accuracy PACC R( ) b14 *) real The best estimate of the positional accuracy ofthe data. The expected input is the radius of thetwo-dimensional error.
Absolute horizontal/verticalmeasurement accuracy
HACC R( ) b14 *) real The best estimate of the horizontal/verticalmeasurement accuracy of the data. The error isassumed to be both positive and negative.Subfield must be used to indicate the accuracy ofhorizontal/vertical measurements. Accuracy ofsoundings is encoded in the SACC subfield.
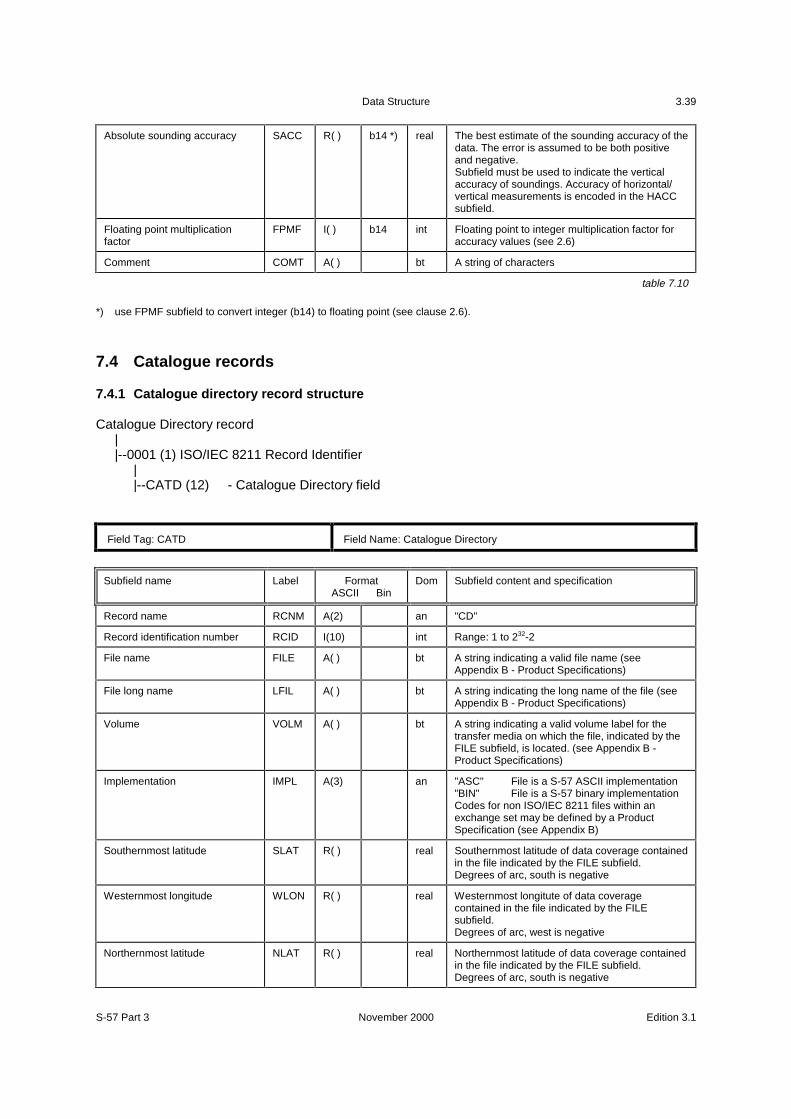
Data Structure
S-57 Part 3 November 2000 Edition 3.1
3.39
Absolute sounding accuracy SACC R( ) b14 *) real The best estimate of the sounding accuracy of thedata. The error is assumed to be both positiveand negative.Subfield must be used to indicate the verticalaccuracy of soundings. Accuracy of horizontal/vertical measurements is encoded in the HACCsubfield.
Floating point multiplicationfactor
FPMF I( ) b14 int Floating point to integer multiplication factor foraccuracy values (see 2.6)
Comment COMT A( ) bt A string of characters
table 7.10
*) use FPMF subfield to convert integer (b14) to floating point (see clause 2.6).
7.4 Catalogue records
7.4.1 Catalogue directory record structure
Catalogue Directory record||--0001 (1) ISO/IEC 8211 Record Identifier
||--CATD (12) - Catalogue Directory field
Field Tag: CATD Field Name: Catalogue Directory
Subfield name Label FormatASCII Bin
Dom Subfield content and specification
Record name RCNM A(2) an "CD"
Record identification number RCID I(10) int Range: 1 to 232-2
File name FILE A( ) bt A string indicating a valid file name (seeAppendix B - Product Specifications)
File long name LFIL A( ) bt A string indicating the long name of the file (seeAppendix B - Product Specifications)
Volume VOLM A( ) bt A string indicating a valid volume label for thetransfer media on which the file, indicated by theFILE subfield, is located. (see Appendix B -Product Specifications)
Implementation IMPL A(3) an "ASC" File is a S-57 ASCII implementation"BIN" File is a S-57 binary implementationCodes for non ISO/IEC 8211 files within anexchange set may be defined by a ProductSpecification (see Appendix B)
Southernmost latitude SLAT R( ) real Southernmost latitude of data coverage containedin the file indicated by the FILE subfield.Degrees of arc, south is negative
Westernmost longitude WLON R( ) real Westernmost longitute of data coveragecontained in the file indicated by the FILEsubfield.Degrees of arc, west is negative
Northernmost latitude NLAT R( ) real Northernmost latitude of data coverage containedin the file indicated by the FILE subfield.Degrees of arc, south is negative
Data Structure
Edition 3.1 November 2000 S-57 Part 3
3.40
Easternmost Longitude ELON R( ) real Easternmost longitude of data coveragecontained in the file indicated by the FILEsubfield.Degrees of arc, west is negative
CRC CRCS A( ) hex The Cyclic Redundancy Checksum for the fileindicated by the FILE subfield (see 3.4)
Comment COMT A( ) bt A string of characters
table 7.11
7.4.2 Catalogue cross reference record structure
Catalogue Cross Reference record||--0001 (1) ISO/IEC 8211 Record Identifier
||--<R>--CATX (*5) - Catalogue Cross Reference field
Field Tag: CATX Field Name: Catalogue Cross Reference
Subfield name Label FormatASCII Bin
Dom Subfield content and specification
Record name *RCNM
A(2) b11 an "CR" {60}
Record identification number RCID I(10) b14 int Range: 1 to 232-2
Name 1 NAM1 A(12) B(40) an Foreign pointer (see 2.2)
Name 2 NAM2 A(12) B(40) an Foreign pointer (see 2.2)
Comment COMT A( ) bt A string of characters
table 7.12
7.5 Data dictionary records
7.5.1 Data dictionary definition record structure
Data Dictionary Definition record||--0001 (1) ISO/IEC 8211 Record Identifier
||--DDDF (10) - Data Dictionary Definition field
||--DDDR (*2) - Data Dictionary Definition Reference field
Data Structure
S-57 Part 3 November 2000 Edition 3.1
3.41
7.5.1.1 Data dictionary definition field structure
Field Tag: DDDF Field Name: Data Dictionary Definition
Subfield name Label FormatASCII Bin
Dom Subfield content and specification
Record name RCNM A(2) b11 an "ID" {70}
Record identification number RCID I(10) b14 int Range: 1 to 232-2
Object or attribute OORA A(1) b11 an "A" {1} The content of OAAC/OACO is anattribute
"O" {2} The content of OAAC/OACO is anobject
Object or attribute acronym OAAC A(6) bt A string containing an object or attribute acronym
Object or attribute label/code OACO I(5) b12 int Object or attribute label/code1 to 8192 (IHO Object Catalogue)8193 to 16387 (Reserved)16388 to 65534 (General use)
Object or attribute long label OALL A( ) bt A string indicating the long label of the object orattribute
Type of object or attribute OATY A(1) b11 an "M" {1} Meta object"$" {2} Cartographic object"G" {3} Geo object"C" {4} Collection object"F" {5} Feature attribute"N" {6} Feature national attribute"S" {7} Spatial attribute
Definition DEFN A( ) bt A string providing a definition of the object orattribute
Authorizing agency AUTH A(2) b12 an Agency code (see IHO Object Catalogue)
Comment COMT A( ) bt A string of characters
table 7.13
7.5.1.2 Data dictionary definition reference field structure
Field Tag: DDDR Field Name: Data Dictionary Definition Reference
Subfield name Label FormatASCII Bin
Dom Subfield content and specification
Reference type *RFTP A(2) b11 an "I1" {1} INT 1 International chart 1, Symbols,Abbreviations, Terms used oncharts
"M4" {2} M-4 Chart specifications of the IHOand Regulations of the IHO forinternational (INT) charts
Reference value RFVL A( ) bt A string containg the reference value of the typespecified in the RFTP subfield
table 7.14
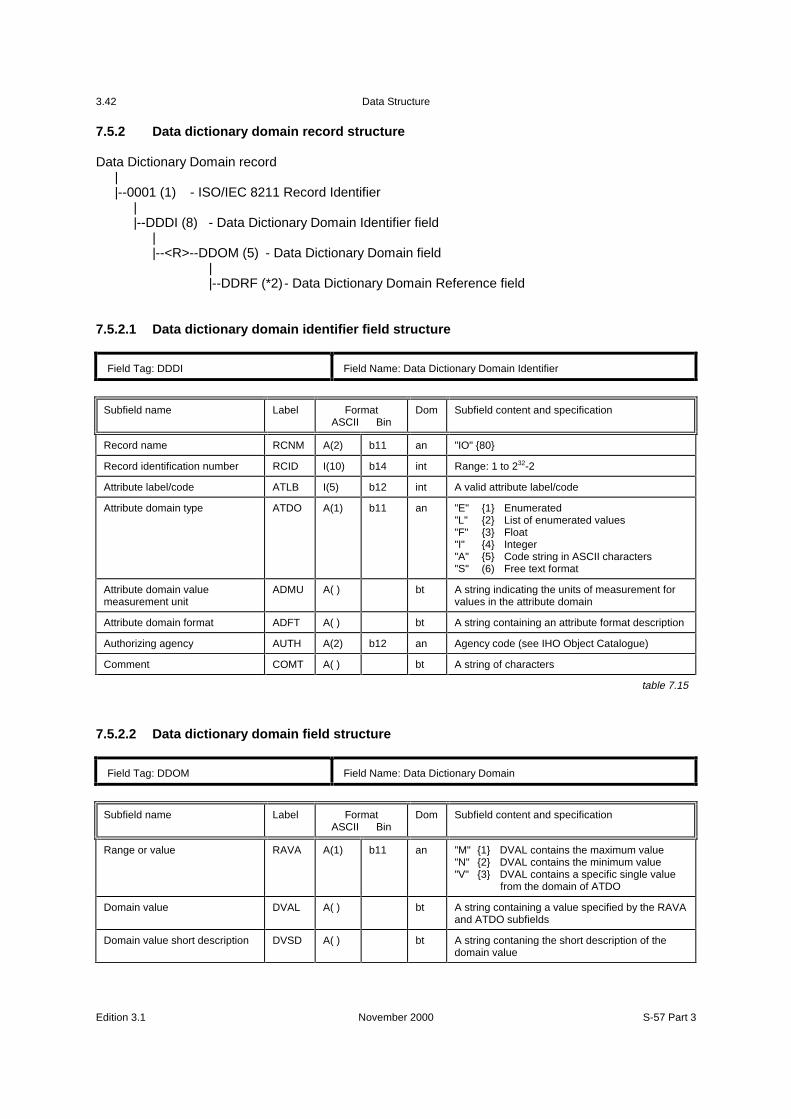
Data Structure
Edition 3.1 November 2000 S-57 Part 3
3.42
7.5.2 Data dictionary domain record structure
Data Dictionary Domain record||--0001 (1) - ISO/IEC 8211 Record Identifier
||--DDDI (8) - Data Dictionary Domain Identifier field
||--<R>--DDOM (5) - Data Dictionary Domain field
||--DDRF (*2) - Data Dictionary Domain Reference field
7.5.2.1 Data dictionary domain identifier field structure
Field Tag: DDDI Field Name: Data Dictionary Domain Identifier
Subfield name Label FormatASCII Bin
Dom Subfield content and specification
Record name RCNM A(2) b11 an "IO" {80}
Record identification number RCID I(10) b14 int Range: 1 to 232-2
Attribute label/code ATLB I(5) b12 int A valid attribute label/code
Attribute domain type ATDO A(1) b11 an "E" {1} Enumerated"L" {2} List of enumerated values"F" {3} Float"I" {4} Integer"A" {5} Code string in ASCII characters"S" (6) Free text format
Attribute domain valuemeasurement unit
ADMU A( ) bt A string indicating the units of measurement forvalues in the attribute domain
Attribute domain format ADFT A( ) bt A string containing an attribute format description
Authorizing agency AUTH A(2) b12 an Agency code (see IHO Object Catalogue)
Comment COMT A( ) bt A string of characters
table 7.15
7.5.2.2 Data dictionary domain field structure
Field Tag: DDOM Field Name: Data Dictionary Domain
Subfield name Label FormatASCII Bin
Dom Subfield content and specification
Range or value RAVA A(1) b11 an "M" {1} DVAL contains the maximum value"N" {2} DVAL contains the minimum value"V" {3} DVAL contains a specific single value
from the domain of ATDO
Domain value DVAL A( ) bt A string containing a value specified by the RAVAand ATDO subfields
Domain value short description DVSD A( ) bt A string contaning the short description of thedomain value
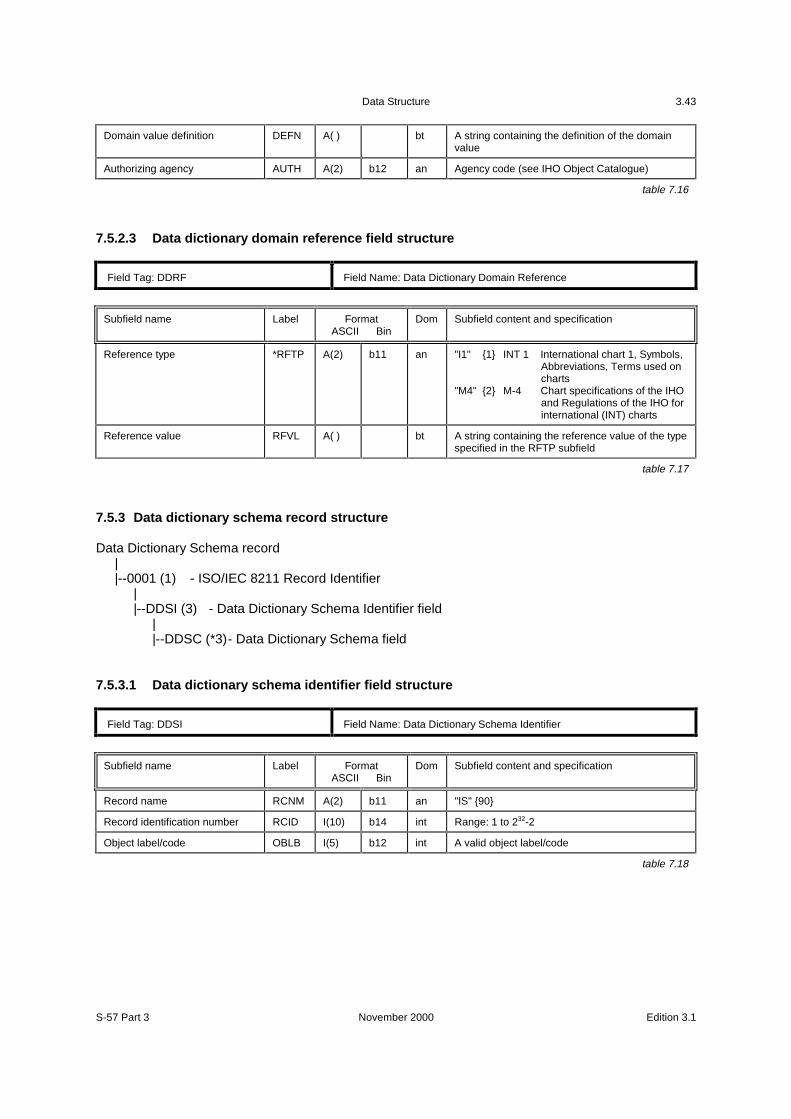
Data Structure
S-57 Part 3 November 2000 Edition 3.1
3.43
Domain value definition DEFN A( ) bt A string containing the definition of the domainvalue
Authorizing agency AUTH A(2) b12 an Agency code (see IHO Object Catalogue)
table 7.16
7.5.2.3 Data dictionary domain reference field structure
Field Tag: DDRF Field Name: Data Dictionary Domain Reference
Subfield name Label FormatASCII Bin
Dom Subfield content and specification
Reference type *RFTP A(2) b11 an "I1" {1} INT 1 International chart 1, Symbols,Abbreviations, Terms used oncharts
"M4" {2} M-4 Chart specifications of the IHOand Regulations of the IHO forinternational (INT) charts
Reference value RFVL A( ) bt A string containing the reference value of the typespecified in the RFTP subfield
table 7.17
7.5.3 Data dictionary schema record structure
Data Dictionary Schema record||--0001 (1) - ISO/IEC 8211 Record Identifier
||--DDSI (3) - Data Dictionary Schema Identifier field
||--DDSC (*3)- Data Dictionary Schema field
7.5.3.1 Data dictionary schema identifier field structure
Field Tag: DDSI Field Name: Data Dictionary Schema Identifier
Subfield name Label FormatASCII Bin
Dom Subfield content and specification
Record name RCNM A(2) b11 an "IS" {90}
Record identification number RCID I(10) b14 int Range: 1 to 232-2
Object label/code OBLB I(5) b12 int A valid object label/code
table 7.18
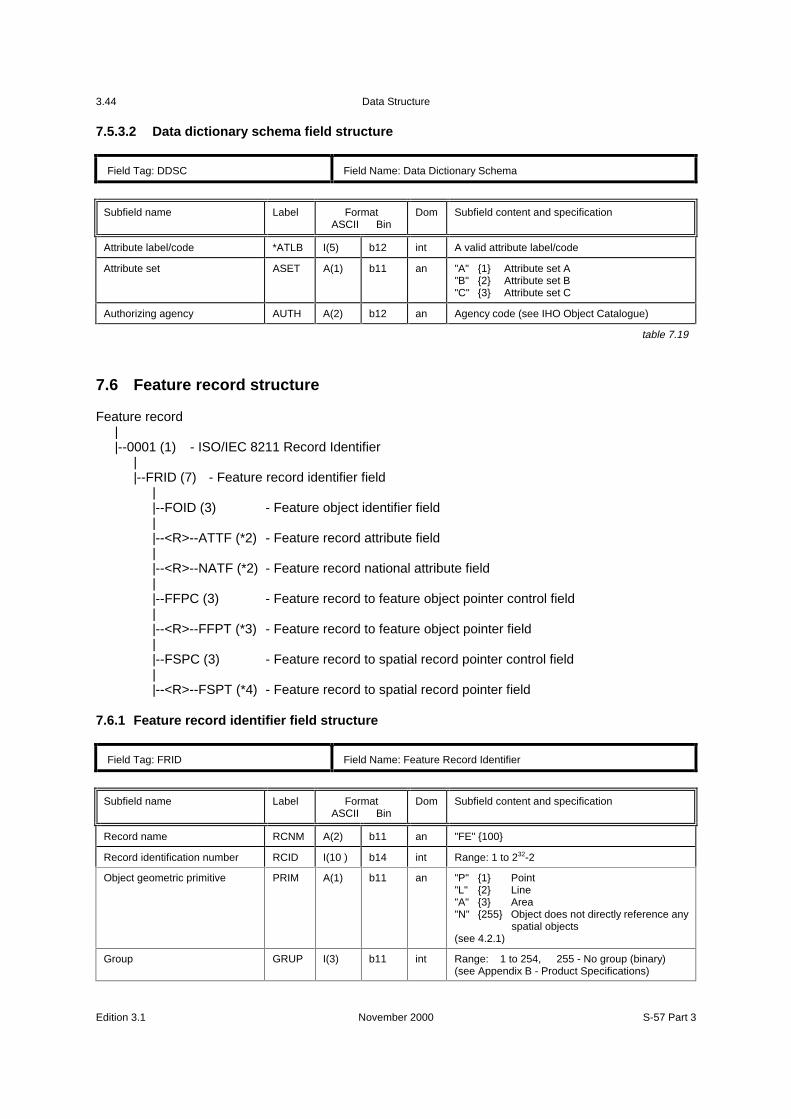
Data Structure
Edition 3.1 November 2000 S-57 Part 3
3.44
7.5.3.2 Data dictionary schema field structure
Field Tag: DDSC Field Name: Data Dictionary Schema
Subfield name Label FormatASCII Bin
Dom Subfield content and specification
Attribute label/code *ATLB I(5) b12 int A valid attribute label/code
Attribute set ASET A(1) b11 an "A" {1} Attribute set A"B" {2} Attribute set B"C" {3} Attribute set C
Authorizing agency AUTH A(2) b12 an Agency code (see IHO Object Catalogue)
table 7.19
7.6 Feature record structure
Feature record||--0001 (1) - ISO/IEC 8211 Record Identifier
||--FRID (7) - Feature record identifier field
||--FOID (3) - Feature object identifier field||--<R>--ATTF (*2) - Feature record attribute field||--<R>--NATF (*2) - Feature record national attribute field||--FFPC (3) - Feature record to feature object pointer control field||--<R>--FFPT (*3) - Feature record to feature object pointer field||--FSPC (3) - Feature record to spatial record pointer control field||--<R>--FSPT (*4) - Feature record to spatial record pointer field
7.6.1 Feature record identifier field structure
Field Tag: FRID Field Name: Feature Record Identifier
Subfield name Label FormatASCII Bin
Dom Subfield content and specification
Record name RCNM A(2) b11 an "FE" {100}
Record identification number RCID I(10 ) b14 int Range: 1 to 232-2
Object geometric primitive PRIM A(1) b11 an "P" {1} Point"L" {2} Line"A" {3} Area"N" {255} Object does not directly reference any
spatial objects(see 4.2.1)
Group GRUP I(3) b11 int Range: 1 to 254, 255 - No group (binary)(see Appendix B - Product Specifications)
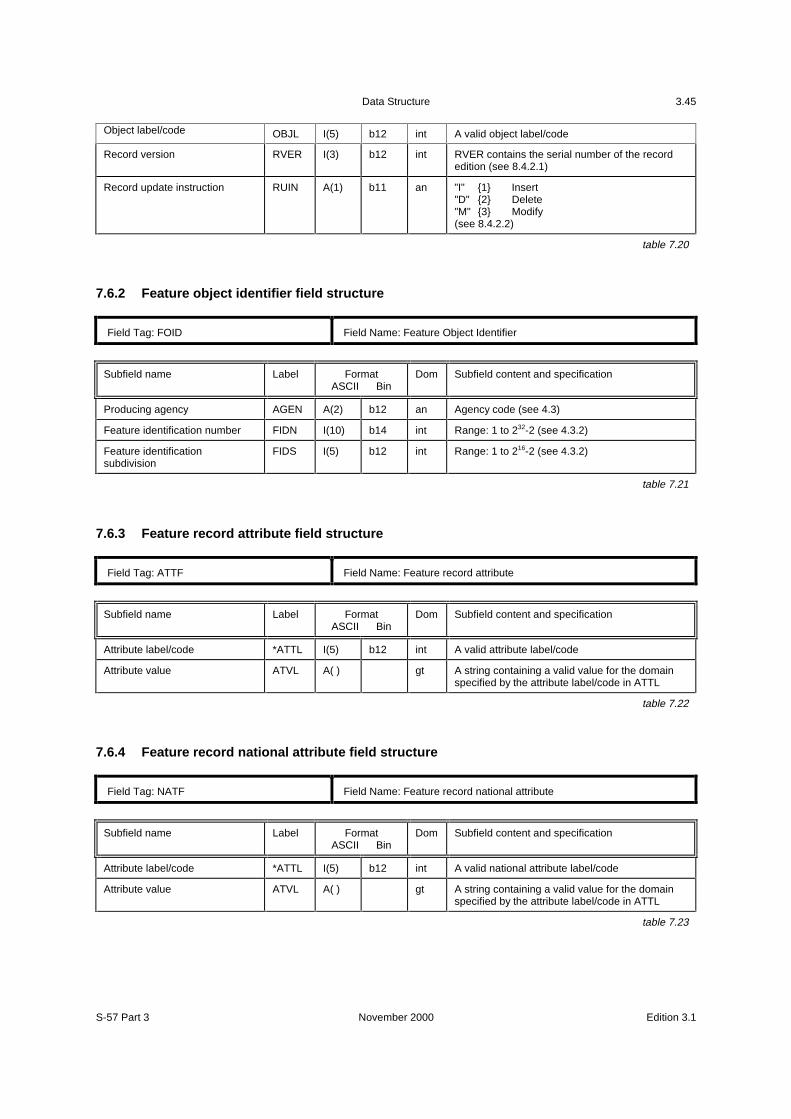
Data Structure
S-57 Part 3 November 2000 Edition 3.1
3.45
Object label/code OBJL I(5) b12 int A valid object label/code
Record version RVER I(3) b12 int RVER contains the serial number of the recordedition (see 8.4.2.1)
Record update instruction RUIN A(1) b11 an "I" {1} Insert"D" {2} Delete"M" {3} Modify(see 8.4.2.2)
table 7.20
7.6.2 Feature object identifier field structure
Field Tag: FOID Field Name: Feature Object Identifier
Subfield name Label FormatASCII Bin
Dom Subfield content and specification
Producing agency AGEN A(2) b12 an Agency code (see 4.3)
Feature identification number FIDN I(10) b14 int Range: 1 to 232-2 (see 4.3.2)
Feature identificationsubdivision
FIDS I(5) b12 int Range: 1 to 216-2 (see 4.3.2)
table 7.21
7.6.3 Feature record attribute field structure
Field Tag: ATTF Field Name: Feature record attribute
Subfield name Label FormatASCII Bin
Dom Subfield content and specification
Attribute label/code *ATTL I(5) b12 int A valid attribute label/code
Attribute value ATVL A( ) gt A string containing a valid value for the domainspecified by the attribute label/code in ATTL
table 7.22
7.6.4 Feature record national attribute field structure
Field Tag: NATF Field Name: Feature record national attribute
Subfield name Label FormatASCII Bin
Dom Subfield content and specification
Attribute label/code *ATTL I(5) b12 int A valid national attribute label/code
Attribute value ATVL A( ) gt A string containing a valid value for the domainspecified by the attribute label/code in ATTL
table 7.23
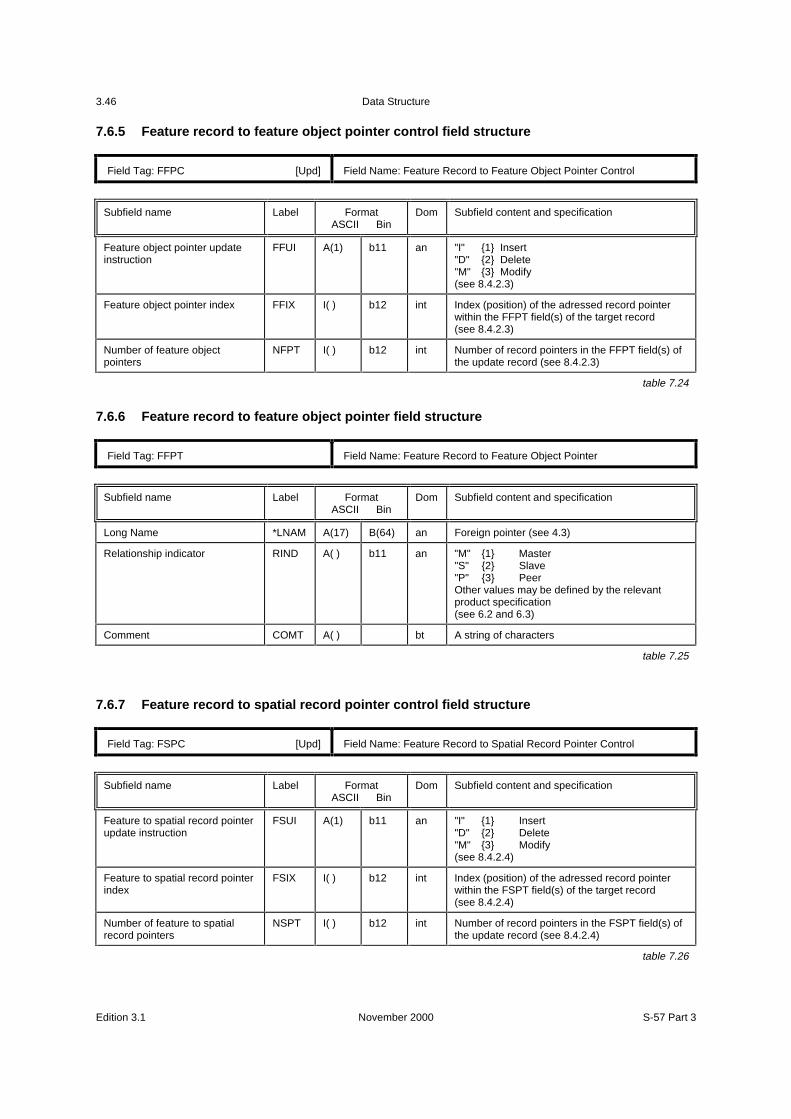
Data Structure
Edition 3.1 November 2000 S-57 Part 3
3.46
7.6.5 Feature record to feature object pointer control field structure
Field Tag: FFPC [Upd] Field Name: Feature Record to Feature Object Pointer Control
Subfield name Label FormatASCII Bin
Dom Subfield content and specification
Feature object pointer updateinstruction
FFUI A(1) b11 an "I" {1} Insert"D" {2} Delete"M" {3} Modify(see 8.4.2.3)
Feature object pointer index FFIX I( ) b12 int Index (position) of the adressed record pointerwithin the FFPT field(s) of the target record(see 8.4.2.3)
Number of feature objectpointers
NFPT I( ) b12 int Number of record pointers in the FFPT field(s) ofthe update record (see 8.4.2.3)
table 7.24
7.6.6 Feature record to feature object pointer field structure
Field Tag: FFPT Field Name: Feature Record to Feature Object Pointer
Subfield name Label FormatASCII Bin
Dom Subfield content and specification
Long Name *LNAM A(17) B(64) an Foreign pointer (see 4.3)
Relationship indicator RIND A( ) b11 an "M" {1} Master"S" {2} Slave"P" {3} PeerOther values may be defined by the relevantproduct specification(see 6.2 and 6.3)
Comment COMT A( ) bt A string of characters
table 7.25
7.6.7 Feature record to spatial record pointer control field structure
Field Tag: FSPC [Upd] Field Name: Feature Record to Spatial Record Pointer Control
Subfield name Label FormatASCII Bin
Dom Subfield content and specification
Feature to spatial record pointerupdate instruction
FSUI A(1) b11 an "I" {1} Insert"D" {2} Delete"M" {3} Modify(see 8.4.2.4)
Feature to spatial record pointerindex
FSIX I( ) b12 int Index (position) of the adressed record pointerwithin the FSPT field(s) of the target record(see 8.4.2.4)
Number of feature to spatialrecord pointers
NSPT I( ) b12 int Number of record pointers in the FSPT field(s) ofthe update record (see 8.4.2.4)
table 7.26
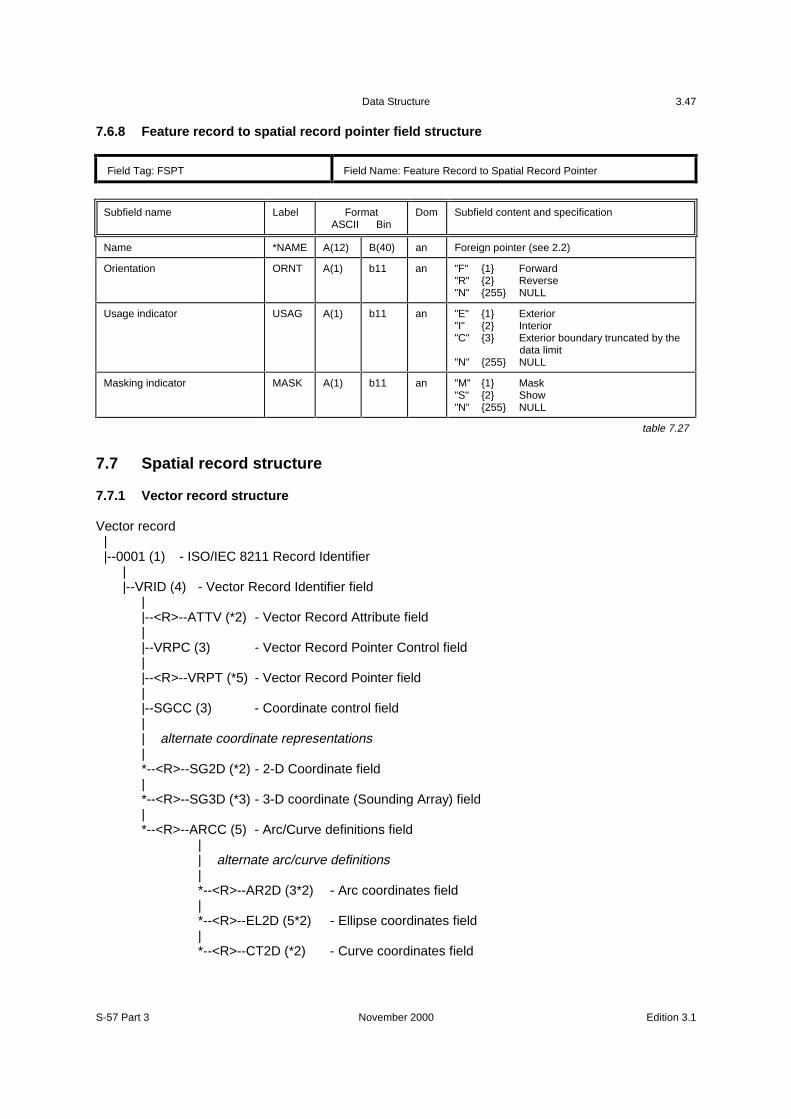
Data Structure
S-57 Part 3 November 2000 Edition 3.1
3.47
7.6.8 Feature record to spatial record pointer field structure
Field Tag: FSPT Field Name: Feature Record to Spatial Record Pointer
Subfield name Label FormatASCII Bin
Dom Subfield content and specification
Name *NAME A(12) B(40) an Foreign pointer (see 2.2)
Orientation ORNT A(1) b11 an "F" {1} Forward"R" {2} Reverse"N" {255} NULL
Usage indicator USAG A(1) b11 an "E" {1} Exterior"I" {2} Interior"C" {3} Exterior boundary truncated by the
data limit"N" {255} NULL
Masking indicator MASK A(1) b11 an "M" {1} Mask"S" {2} Show"N" {255} NULL
table 7.27
7.7 Spatial record structure
7.7.1 Vector record structure
Vector record||--0001 (1) - ISO/IEC 8211 Record Identifier
||--VRID (4) - Vector Record Identifier field
||--<R>--ATTV (*2) - Vector Record Attribute field||--VRPC (3) - Vector Record Pointer Control field||--<R>--VRPT (*5) - Vector Record Pointer field||--SGCC (3) - Coordinate control field|| alternate coordinate representations|*--<R>--SG2D (*2) - 2-D Coordinate field|*--<R>--SG3D (*3) - 3-D coordinate (Sounding Array) field|*--<R>--ARCC (5) - Arc/Curve definitions field
|| alternate arc/curve definitions|*--<R>--AR2D (3*2) - Arc coordinates field|*--<R>--EL2D (5*2) - Ellipse coordinates field|*--<R>--CT2D (*2) - Curve coordinates field
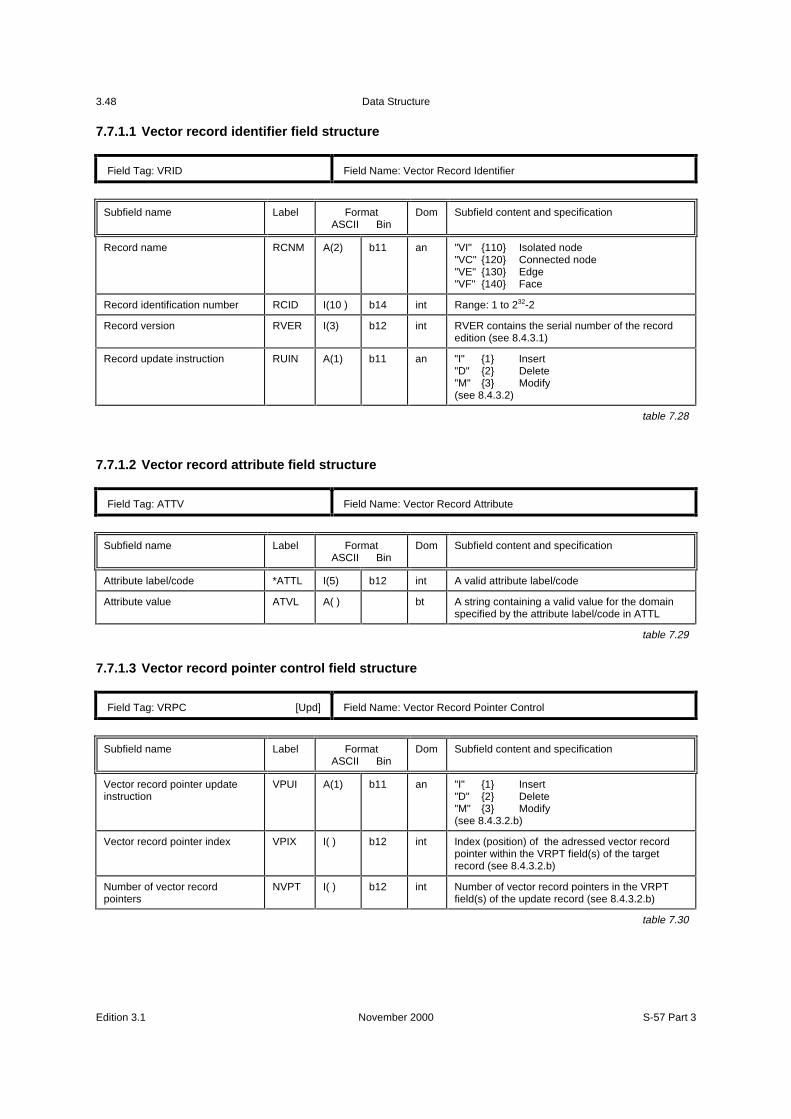
Data Structure
Edition 3.1 November 2000 S-57 Part 3
3.48
7.7.1.1 Vector record identifier field structure
Field Tag: VRID Field Name: Vector Record Identifier
Subfield name Label FormatASCII Bin
Dom Subfield content and specification
Record name RCNM A(2) b11 an "VI" {110} Isolated node"VC" {120} Connected node"VE" {130} Edge"VF" {140} Face
Record identification number RCID I(10 ) b14 int Range: 1 to 232-2
Record version RVER I(3) b12 int RVER contains the serial number of the recordedition (see 8.4.3.1)
Record update instruction RUIN A(1) b11 an "I" {1} Insert"D" {2} Delete"M" {3} Modify(see 8.4.3.2)
table 7.28
7.7.1.2 Vector record attribute field structure
Field Tag: ATTV Field Name: Vector Record Attribute
Subfield name Label FormatASCII Bin
Dom Subfield content and specification
Attribute label/code *ATTL I(5) b12 int A valid attribute label/code
Attribute value ATVL A( ) bt A string containing a valid value for the domainspecified by the attribute label/code in ATTL
table 7.29
7.7.1.3 Vector record pointer control field structure
Field Tag: VRPC [Upd] Field Name: Vector Record Pointer Control
Subfield name Label FormatASCII Bin
Dom Subfield content and specification
Vector record pointer updateinstruction
VPUI A(1) b11 an "I" {1} Insert"D" {2} Delete"M" {3} Modify(see 8.4.3.2.b)
Vector record pointer index VPIX I( ) b12 int Index (position) of the adressed vector recordpointer within the VRPT field(s) of the targetrecord (see 8.4.3.2.b)
Number of vector recordpointers
NVPT I( ) b12 int Number of vector record pointers in the VRPTfield(s) of the update record (see 8.4.3.2.b)
table 7.30
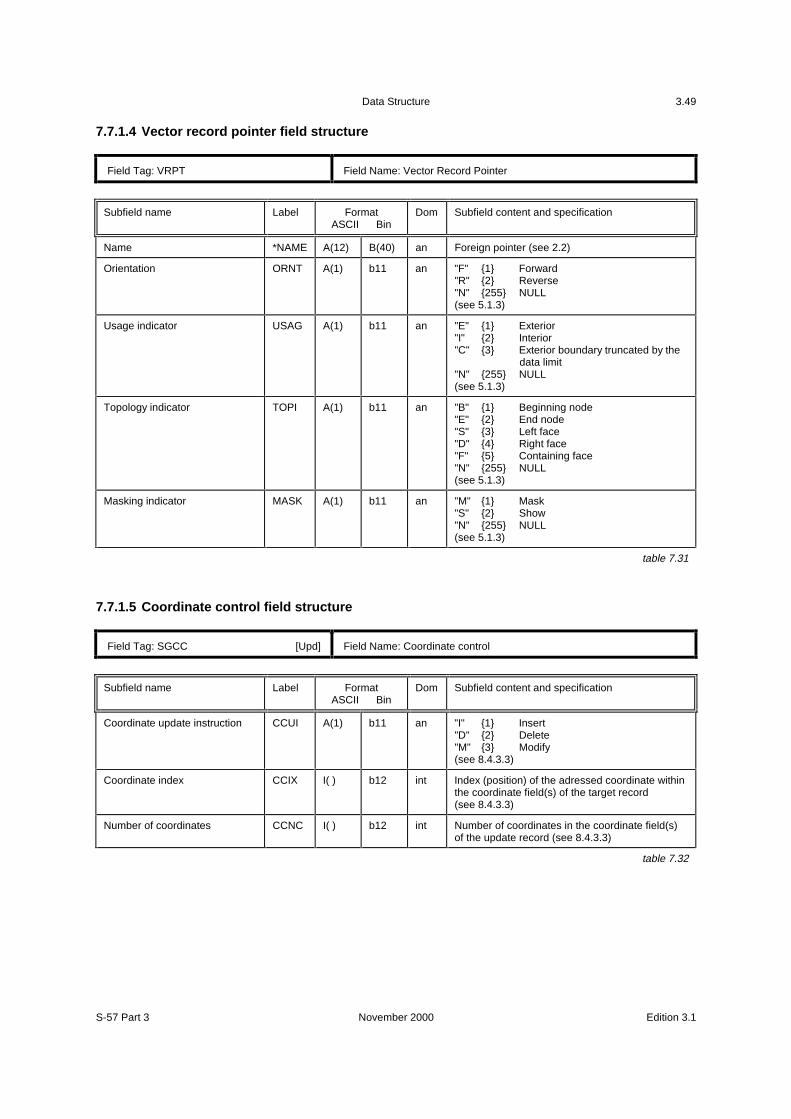
Data Structure
S-57 Part 3 November 2000 Edition 3.1
3.49
7.7.1.4 Vector record pointer field structure
Field Tag: VRPT Field Name: Vector Record Pointer
Subfield name Label FormatASCII Bin
Dom Subfield content and specification
Name *NAME A(12) B(40) an Foreign pointer (see 2.2)
Orientation ORNT A(1) b11 an "F" {1} Forward"R" {2} Reverse"N" {255} NULL(see 5.1.3)
Usage indicator USAG A(1) b11 an "E" {1} Exterior"I" {2} Interior"C" {3} Exterior boundary truncated by the
data limit"N" {255} NULL(see 5.1.3)
Topology indicator TOPI A(1) b11 an "B" {1} Beginning node"E" {2} End node"S" {3} Left face"D" {4} Right face"F" {5} Containing face"N" {255} NULL(see 5.1.3)
Masking indicator MASK A(1) b11 an "M" {1} Mask"S" {2} Show"N" {255} NULL(see 5.1.3)
table 7.31
7.7.1.5 Coordinate control field structure
Field Tag: SGCC [Upd] Field Name: Coordinate control
Subfield name Label FormatASCII Bin
Dom Subfield content and specification
Coordinate update instruction CCUI A(1) b11 an "I" {1} Insert"D" {2} Delete"M" {3} Modify(see 8.4.3.3)
Coordinate index CCIX I( ) b12 int Index (position) of the adressed coordinate withinthe coordinate field(s) of the target record(see 8.4.3.3)
Number of coordinates CCNC I( ) b12 int Number of coordinates in the coordinate field(s)of the update record (see 8.4.3.3)
table 7.32
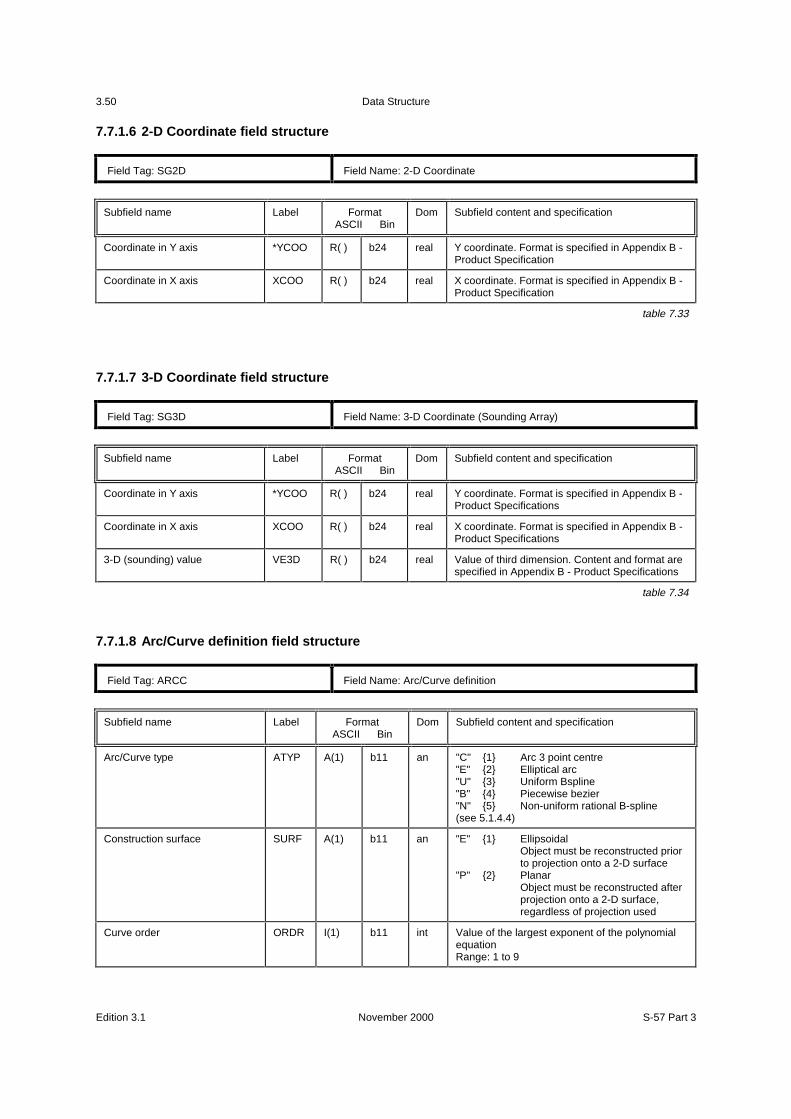
Data Structure
Edition 3.1 November 2000 S-57 Part 3
3.50
7.7.1.6 2-D Coordinate field structure
Field Tag: SG2D Field Name: 2-D Coordinate
Subfield name Label FormatASCII Bin
Dom Subfield content and specification
Coordinate in Y axis *YCOO R( ) b24 real Y coordinate. Format is specified in Appendix B -Product Specification
Coordinate in X axis XCOO R( ) b24 real X coordinate. Format is specified in Appendix B -Product Specification
table 7.33
7.7.1.7 3-D Coordinate field structure
Field Tag: SG3D Field Name: 3-D Coordinate (Sounding Array)
Subfield name Label FormatASCII Bin
Dom Subfield content and specification
Coordinate in Y axis *YCOO R( ) b24 real Y coordinate. Format is specified in Appendix B -Product Specifications
Coordinate in X axis XCOO R( ) b24 real X coordinate. Format is specified in Appendix B -Product Specifications
3-D (sounding) value VE3D R( ) b24 real Value of third dimension. Content and format arespecified in Appendix B - Product Specifications
table 7.34
7.7.1.8 Arc/Curve definition field structure
Field Tag: ARCC Field Name: Arc/Curve definition
Subfield name Label FormatASCII Bin
Dom Subfield content and specification
Arc/Curve type ATYP A(1) b11 an "C" {1} Arc 3 point centre"E" {2} Elliptical arc"U" {3} Uniform Bspline"B" {4} Piecewise bezier"N" {5} Non-uniform rational B-spline(see 5.1.4.4)
Construction surface SURF A(1) b11 an "E" {1} EllipsoidalObject must be reconstructed priorto projection onto a 2-D surface
"P" {2} PlanarObject must be reconstructed afterprojection onto a 2-D surface,regardless of projection used
Curve order ORDR I(1) b11 int Value of the largest exponent of the polynomialequationRange: 1 to 9

Data Structure
S-57 Part 3 November 2000 Edition 3.1
3.51
Interpolated point resolution RESO R( ) b14 *) real Spacing along line path between interpolatedpoints. Value in map units (millimeters)
Floating point multiplicationfactor
FPMF I( ) b14 int Floating point to integer multiplication factor forinterpolated point resolution value (see 2.6)
table 7.35
*)use FPMF subfield to convert integer (b14) to floating point (see clause 2.6).
7.7.1.9 Arc coordinates field structure
Field Tag: AR2D Field Name: Arc coordinate
Subfield name Label FormatASCII Bin
Dom Subfield content and specification
Start point STPT @ ISO/IEC 8211 Cartesian label
Centre point CTPT @ ISO/IEC 8211 Cartesian label
End point ENPT @ ISO/IEC 8211 Cartesian label
Coordinate in Y axis *YCOO R( ) b24 real Y coordinate. Format is specified in Appendix B -Product Specifications
Coordinate in X axis XCOO R( ) b24 real X coordinate. Format is specified in Appendix B -Product Specifications
table 7.36
7.7.1.10 Ellipse coordinates field structure
Field Tag: EL2D Field Name: Ellipse coordinates
Subfield name Label FormatASCII Bin
Dom Subfield content and specification
Start point STPT @ ISO/IEC 8211 Cartesian label
Centre point CTPT @ ISO/IEC 8211 Cartesian label
End point ENPT @ ISO/IEC 8211 Cartesian label
Conjugate diameter pointmajor axis
CDPM @ ISO/IEC 8211 Cartesian label
Conjugate diameter pointminor axis
CDPR @ ISO/IEC 8211 Cartesian label
Coordinate in Y axis *YCOO R( ) b24 real Y coordinate. Format is specified in Appendix B -Product Specifications
Coordinate in X axis XCOO R( ) b24 real X coordinate. Format is specified in Appendix B -Product Specifications
table 7.37
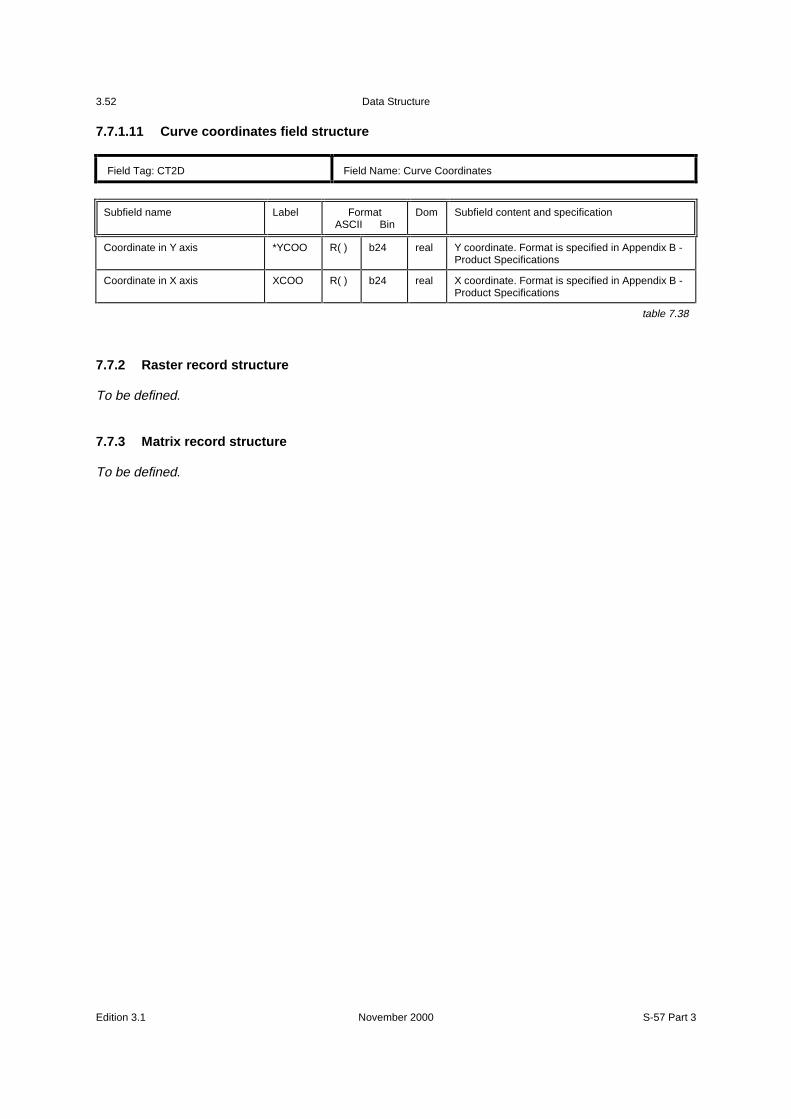
Data Structure
Edition 3.1 November 2000 S-57 Part 3
3.52
7.7.1.11 Curve coordinates field structure
Field Tag: CT2D Field Name: Curve Coordinates
Subfield name Label FormatASCII Bin
Dom Subfield content and specification
Coordinate in Y axis *YCOO R( ) b24 real Y coordinate. Format is specified in Appendix B -Product Specifications
Coordinate in X axis XCOO R( ) b24 real X coordinate. Format is specified in Appendix B -Product Specifications
table 7.38
7.7.2 Raster record structure
To be defined.
7.7.3 Matrix record structure
To be defined.
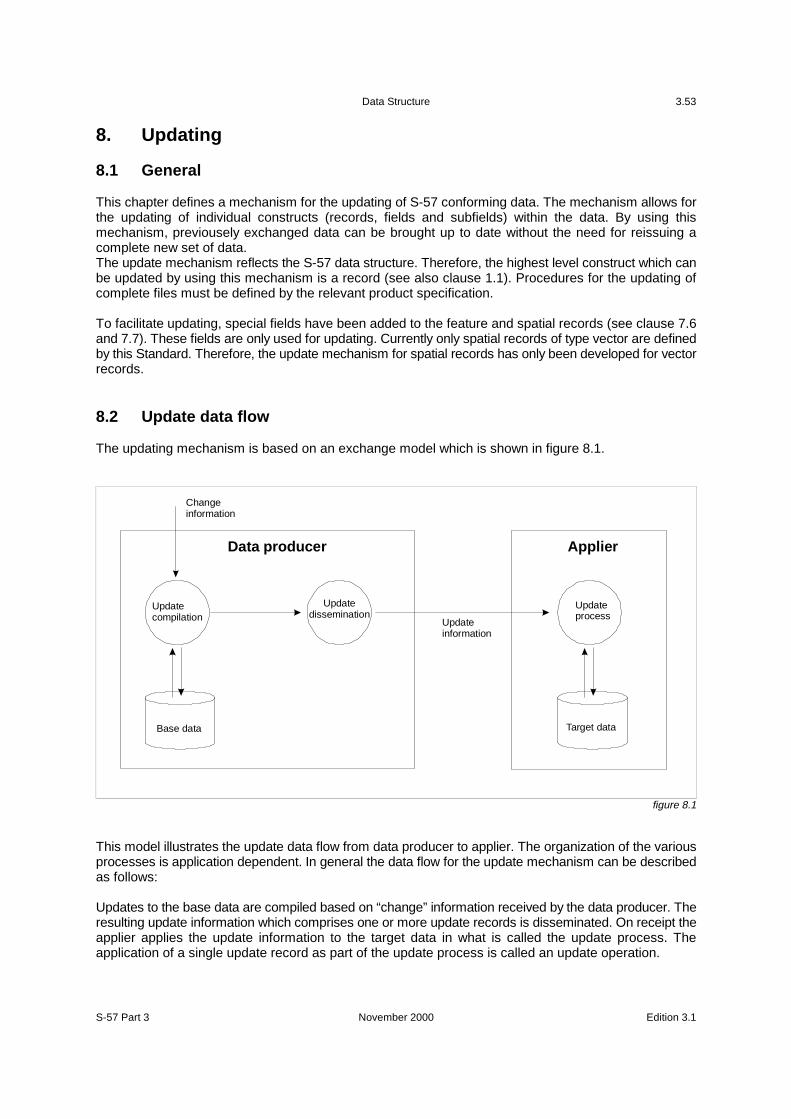
Data Structure
S-57 Part 3 November 2000 Edition 3.1
3.53
8. Updating
8.1 General
This chapter defines a mechanism for the updating of S-57 conforming data. The mechanism allows forthe updating of individual constructs (records, fields and subfields) within the data. By using thismechanism, previousely exchanged data can be brought up to date without the need for reissuing acomplete new set of data.The update mechanism reflects the S-57 data structure. Therefore, the highest level construct which canbe updated by using this mechanism is a record (see also clause 1.1). Procedures for the updating ofcomplete files must be defined by the relevant product specification.
To facilitate updating, special fields have been added to the feature and spatial records (see clause 7.6and 7.7). These fields are only used for updating. Currently only spatial records of type vector are definedby this Standard. Therefore, the update mechanism for spatial records has only been developed for vectorrecords.
8.2 Update data flow
The updating mechanism is based on an exchange model which is shown in figure 8.1.
Data producer
Updatecompilation
Updatedissemination
Updateinformation
Updateprocess
Changeinformation
Target dataBase data
Applier
figure 8.1
This model illustrates the update data flow from data producer to applier. The organization of the variousprocesses is application dependent. In general the data flow for the update mechanism can be describedas follows:
Updates to the base data are compiled based on “change” information received by the data producer. Theresulting update information which comprises one or more update records is disseminated. On receipt theapplier applies the update information to the target data in what is called the update process. Theapplication of a single update record as part of the update process is called an update operation.
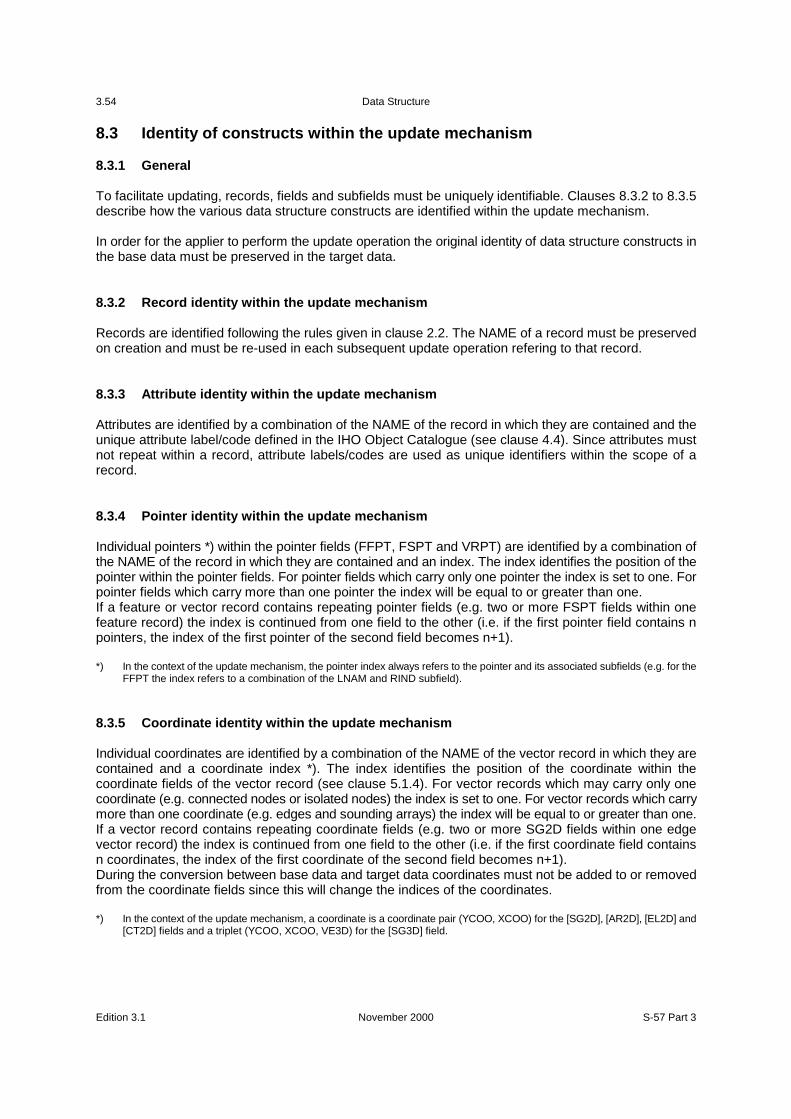
Data Structure
Edition 3.1 November 2000 S-57 Part 3
3.54
8.3 Identity of constructs within the update mechanism
8.3.1 General
To facilitate updating, records, fields and subfields must be uniquely identifiable. Clauses 8.3.2 to 8.3.5describe how the various data structure constructs are identified within the update mechanism.
In order for the applier to perform the update operation the original identity of data structure constructs inthe base data must be preserved in the target data.
8.3.2 Record identity within the update mechanism
Records are identified following the rules given in clause 2.2. The NAME of a record must be preservedon creation and must be re-used in each subsequent update operation refering to that record.
8.3.3 Attribute identity within the update mechanism
Attributes are identified by a combination of the NAME of the record in which they are contained and theunique attribute label/code defined in the IHO Object Catalogue (see clause 4.4). Since attributes mustnot repeat within a record, attribute labels/codes are used as unique identifiers within the scope of arecord.
8.3.4 Pointer identity within the update mechanism
Individual pointers *) within the pointer fields (FFPT, FSPT and VRPT) are identified by a combination ofthe NAME of the record in which they are contained and an index. The index identifies the position of thepointer within the pointer fields. For pointer fields which carry only one pointer the index is set to one. Forpointer fields which carry more than one pointer the index will be equal to or greater than one.If a feature or vector record contains repeating pointer fields (e.g. two or more FSPT fields within onefeature record) the index is continued from one field to the other (i.e. if the first pointer field contains npointers, the index of the first pointer of the second field becomes n+1).
*) In the context of the update mechanism, the pointer index always refers to the pointer and its associated subfields (e.g. for theFFPT the index refers to a combination of the LNAM and RIND subfield).
8.3.5 Coordinate identity within the update mechanism
Individual coordinates are identified by a combination of the NAME of the vector record in which they arecontained and a coordinate index *). The index identifies the position of the coordinate within thecoordinate fields of the vector record (see clause 5.1.4). For vector records which may carry only onecoordinate (e.g. connected nodes or isolated nodes) the index is set to one. For vector records which carrymore than one coordinate (e.g. edges and sounding arrays) the index will be equal to or greater than one.If a vector record contains repeating coordinate fields (e.g. two or more SG2D fields within one edgevector record) the index is continued from one field to the other (i.e. if the first coordinate field containsn coordinates, the index of the first coordinate of the second field becomes n+1).During the conversion between base data and target data coordinates must not be added to or removedfrom the coordinate fields since this will change the indices of the coordinates.
*) In the context of the update mechanism, a coordinate is a coordinate pair (YCOO, XCOO) for the [SG2D], [AR2D], [EL2D] and[CT2D] fields and a triplet (YCOO, XCOO, VE3D) for the [SG3D] field.
Data Structure
S-57 Part 3 November 2000 Edition 3.1
3.55
8.4 Update record
8.4.1 General
Updating of data is achieved by applying update records to the target data. An update record is a genericterm for a feature or vector record that contains a delete or modify indicator in its “Record Updateinstruction” [RUIN] subfield. An update record may also contain additional fields. A feature record maycontain the following additional (update instruction) fields:
FFPC - Feature Record to Feature Record Pointer Control fieldFSPC - Feature Record to Spatial Record Pointer Control field
A vector record may contain the following additional (update instruction) fields:
VRPC- Vector Record Pointer Control fieldSGCC - Coordinate Control field
The structure of the update fields is given in the clauses 7.6 and 7.7.1. An explanation of their use is givenin the clauses 8.4.2 and 8.4.3.
8.4.2 Constructs for updating the feature record
8.4.2.1 Record version subfield — use for feature record
The “Record Version” [RVER] subfield carries the version number for the record in which it is contained.The version number of the update record must be one higher than the version number of the target recordto which the update record applies. On completion of the update operation the version number of thetarget record must be made equal to the version number of the update record applied to it.
8.4.2.2 Record update instruction subfield — use for feature record
The “Record Update Instruction” [RUIN] subfield defines which update operation must be performed onthe target record. This subfield may carry one of the following values:
I {1} INSERT - Feature record must be inserted. The RVER subfield must contain “1".
D {2} DELETE - Feature record must be deleted. This record must not contain further fields; onlyFRID is used.
M {3} MODIFY - Feature record must be modified. This record must contain further fieldsconveying the details of this update message. The “M” value indicates that oneor more fields of the target record will be affected by the update operation. Therules for modifying these fields are given below.
Data Structure
Edition 3.1 November 2000 S-57 Part 3
3.56
a. Modification of the ATTF and NATF fields
When an update record contains an ATTF and/or NATF field it must be interpreted in the following way.If the attribute does not occur in the target record, the attribute must be treated as an insertion. If anattribute already exist in the target record its value must be replaced by the value of the correspondingattribute held in the update record. An attribute is removed from an object by sending the attribute in theupdate record with its value set to the delete character. Table 8.1 defines the delete character for eachlexical level.
Lexical level Delete
Level 0 (7/15)
Level 1 (7/15)
Level 2 (0/0) (7/15)
table 8.1
The lexical level used for the ATTF and NATF fields in the update record must correspond with the lexicallevel used for the ATTF and NATF fields in the target record (see clause 2.4).
b. Modification of the FFPT and FSPT fields
The modification of the pointer fields (FFPT and FSPT) is controlled by the pointer control fields. TheFFPC and FSPC pointer control fields are specified in clause 8.4.2.3 and 8.4.2.4 respectively.
8.4.2.3 Feature record to feature object pointer control field
The “Feature Record to Feature Object Pointer Control” [FFPC] field controls the updating of the “FeatureRecord to Feature Object Pointer” [FFPT] field(s). The FFPC field contains three subfields:
FFUI - Feature Object Pointer Update Instruction subfieldFFIX - Feature Object Pointer Index subfieldNFPT - Number of Feature Object Pointers subfield
The “Feature Object Pointer Update Instruction” [FFUI] subfield may carry one of the following values:
I {1} INSERT - Feature record to feature object pointer(s) encoded in the FFPT field(s) of theupdate record must be inserted in the FFPT field(s) of the target record. Theinsertion must start at the position one before the index specified by the FFIXsubfield. The number of pointers to be inserted is given in the NFPT subfield.
D {2} DELETE - Feature record to feature object pointer(s) must be deleted from the FFPT field(s)of the target record. The deletion must start at the index specified in the FFIXsubfield. The number of pointers to be removed is given in the NFPT subfield.
M {3} MODIFY - Feature record to feature object pointer(s) encoded in the FFPT field(s) of theupdate record must replace the adressed pointer(s) in FFPT field(s) of the targetrecord. The replacement must start at the index given in the FFIX subfield. Thenumber of pointers to be replaced is given in the NFPT subfield.

Data Structure
S-57 Part 3 November 2000 Edition 3.1
3.57
The "Feature Object Pointer Index" [FFIX] subfield gives the position of the addressed “feature record tofeature object pointer” within the FFPT field(s) of the target record (see clause 8.3.4).
The "Number of Feature Object Pointers" [NFPT] subfield gives the number of “feature record to featureobject pointers” in the FFPT field(s) in the update record.
The FFPC field is not allowed to repeat within an update record. An update to non-consecutive pointers(e.g. the first and the last pointer in a FFPT field containing many pointers) can be handled by multipleupdate records or by replacement of all feature record to feature object pointers in the target record.
8.4.2.4 Feature record to spatial record pointer control field
The “Feature Record to Spatial Record Pointer Control” [FSPC] field controls the updating of the “FeatureRecord to Spatial Record Pointer” [FSPT] field(s). The FSPC field contains three subfields:
FSUI - Feature to Spatial Record Pointer Update Instruction subfieldFSIX - Feature to Spatial Record Pointer Index subfieldNSPT - Number of Feature to Spatial Record Pointers subfield
The "Feature to Spatial Record Pointer Update Instruction" [FSUI] subfield may carry one of the followingvalues:
I {1} INSERT - Feature to spatial record pointer(s) encoded in the FSPT field(s) of the updaterecord must be inserted in the FSPT field(s) of the target record. The insertionmust start at the position one before the index specified by the FSIX subfield. Thenumber of pointers to be inserted is given in the NSPT subfield.
D {2} DELETE - Feature to spatial record pointer(s) must be deleted from the FSPT field(s) of thetarget record. The deletion must start at the index specified in the FSIX subfield.The number of pointers to be removed is given in the NSPT subfield.
M {3} MODIFY - Feature to spatial record pointer(s) encoded in the FSPT field(s) of the updaterecord must replace the addressed pointer(s) in FSPT field(s) of the targetrecord. The replacement must start at the index given in the FSIX subfield. Thenumber of pointers to be replaced is given in the NSPT subfield.
The "Feature to Spatial Record Pointer Index" [FSIX] subfield gives the position of the addressed “Featureto Spatial Record Pointer” within the FSPT field(s) of the target record (see clause 8.3.4).
The "Number of Feature to Spatial Record Pointers" [NSPT] subfield gives the number of “Feature toSpatial Record Pointers” in the FSPT field(s) in the update record.
The FSPC field is not allowed to repeat within an update record. An update to non-consecutive pointers(e.g. the first and the last pointer in a FSPT field containing many pointers) can be handled by multipleupdate records or by replacement of all feature to spatial record pointers in the target record.

Data Structure
Edition 3.1 November 2000 S-57 Part 3
3.58
8.4.3 Constructs for updating the vector record
8.4.3.1 Record version subfield — use for vector record
The “Record Version” [RVER] subfield carries the version number for the record in which it is contained.The version number of the update record must be one higher than the version number of the target recordto which the update record applies. On completion of the update operation the version number of thetarget record must be made equal to the version number of the update record applied to it.
8.4.3.2 Record update instruction subfield — use for vector record
The “Record Update Instruction” [RUIN] subfield defines which update operation must be performed onthe target record. This subfield may carry one of the following values:
I {1} INSERT - Vector record must be inserted. The RVER subfield must contain “1".
D {2} DELETE - Vector record must be deleted. This record must not contain further fields; onlyVRID is used.
M {3} MODIFY - Vector record must be modified. This record must contain further fields conveyingthe details of this update message. The “M” value indicates that one or morefields of the target record will be affected by the update operation. The rules formodifying these fields are given below.
a. Modification of the ATTV field
When an update record contains an ATTV field it must be interpreted in the following way. If the attributedoes not occur in the target record, the attribute must be treated as an insertion. If an attribute alreadyexist in the target record its value must be replaced by the value of the corresponding attribute held in theupdate record. An attribute is removed from an object by sending the attribute in the update record withits value set to the delete character (7/15).
b. Modification of the VRPT field
The “Vector Record Pointer Control” [VRPC] field controls the updating of the “Vector Record Pointer”[VRPT] field(s). The VRPC field contains three subfields:
VPUI - Vector Record Pointer Update Instruction subfieldVPIX - Vector Record Pointer Index subfieldNVPT - Number of Vector Record Pointers subfield
The "Vector Record Pointer Update Instruction" [VPUI] subfield may carry one of the following values:
I {1} INSERT - Vector record pointer(s) encoded in the VRPT field(s) of the update record mustbe inserted in the VRPT field(s) of the target record. The insertion must start atthe position one before the index specified by the VPIX subfield. The number ofpointers to be inserted is given in the NVPT subfield.

Data Structure
S-57 Part 3 November 2000 Edition 3.1
3.59
D {2} DELETE - Vector record pointer(s) must be deleted from the VRPT field(s) of the targetrecord. The deletion must start at the index specified in the VPIX subfield. Thenumber of pointers to be removed is given in the NVPT subfield.
M {3} MODIFY - Vector record pointer(s) encoded in the VRPT field(s) of the update record mustreplace the addressed pointer(s) in VRPT field(s) of the target record. Thereplacement must start at the index given in the VPIX subfield. The number ofpointers to be replaced is given in the NVPT subfield.
The "Vector Record Pointer Index" [VPIX] subfield gives the position of the addressed “Vector RecordPointer” within the VRPT field(s) of the target record (see clause 8.3.4).
The "Number of Vector Record Pointers" [NVPT] subfield gives the number of “Vector Record Pointers”in the VRPT field(s) in the update record.
The VRPC field is not allowed to repeat within an update record. An update to non-consecutive pointers(e.g. the first and the last pointer in a VRPT field containing many pointers) can be handled by multipleupdate records or by replacement of all spatial record pointers in the target record.
c. Modification of the SG2D, SG3D, AR2D and EL2D fields
The modification of coordinate fields (see clause 5.1.4) is controlled by the “Coordinate Control” [SGCC]field. The SGCC field is specified in clause 8.4.3.3.
8.4.3.3 Coordinate control field
The “Coordinate Control” [SGCC] field controls the updating of coordinates fields of a vector record(chapter 5). The SGCC field contains three subfields:
CCUI - Coordinate Update Instruction subfieldCCIX - Coordinate Index subfieldCCNC - Number of Coordinates subfield
The “Coordinate Update Instruction” [CCUI] subfield may carry one of the following values:
I {1} INSERT - Coordinate(s) encoded in the coordinate field(s) of the update record must beinserted in the coordinate field(s) of the target record. The insertion must start atthe position one before the index specified by the CCIX subfield. The number ofcoordinates to be inserted is given in the CCNC subfield.
D {2} DELETE - Coordinate(s) must be deleted from the coordinate field(s) of the target record.The deletion must start at the index specified in the CCIX subfield. The numberof coordinates to be removed is given in the CCNC subfield.
M {3} MODIFY - Coordinate(s) encoded in the coordinate field(s) of the update record must replacethe addressed coordinate(s) in coordinate field(s) of the target record. Thereplacement must start at the index given in the CCIX subfield. The number ofcoordinates to be replaced is given in the CCNC subfield.
The “Coordinate Index” [CCIX] subfield gives the position of the addressed coordinate within thecoordinate field(s) of the target record (see clause 8.3.5).
The “Number of Coordinates” [CCNC] subfield gives the number of coordinates in the coordinate field(s)in the update record.

Data Structure
Edition 3.1 November 2000 S-57 Part 3
3.60
The SGCC field is not allowed to repeat within an update record. An update to non-consecutivecoordinates (e.g. the first and the last coordinate in a SG2D field which contains many coordinates) canbe handled by multiple update records or by replacement of all coordinates in the target record.
In the case of inserting one or more coordinates into a target record representing a straight line (i.e. anedge which only references its connecting nodes, see clause 5.1.4.4), an update record must not containa SGCC field and the coordinate fields of the update record must be added to the target record withoutfurther modification.

S-57 Part 3Annex A - ISO/IEC 8211 summary and examples
Edition 3.1

ISO/IEC 8211 summary and examples
Edition 3.1 November 2000 S-57 Part 3 - Annex A
Important notice
All “Clarifications” in the latest edition of theMaintenance Document must be taken into accountbefore making use of this document.
Page intentionally left blank
S-57 Part 3 - Annex A November 2000 Edition 3.1
3.A.1
A. ISO/IEC 8211 summary and examples
S-57 uses ISO/IEC 8211:1994 as its encapsulation standard. ISO/IEC 8211 specifies an interchangeformat to facilitate the exchange of data between computer systems. The intention of this annex is to givea short overview of ISO/IEC 8211 by explaining those parts of the encapsulation structure which are ofrelevance to S-57. The explanation is illustrated by a simple example comprising one buoy at a givenlocation (i.e. a geo feature record and a vector spatial record).
This annex does not replace ISO/IEC 8211 nor does it give a comprehensive overview of ISO/IEC 8211.The reader is referred to ISO/IEC 8211:1994 for a complete description and explanation.
A.1 Relationship between the data structure and the encapsulation
Clause 1.1 of Part 3 of S-57 explains how the various constructs from the theoretical data model (Part 2of S-57) are translated into the S-57 data structure. The relationship between the structure andISO/IEC 8211 encapsulation constructs is shown below.
S-57 Data Structure Encapsulation
Record ............................................Logical Record (LR) containing a group of fieldsField................................................FieldSubfield...........................................Subfield
The grouping of fields into a LR is defined in the S-57 data structure by means of the tree structurediagrams. Each tree structure diagram in chapter 7 of Part 3 of S-57defines a S-57 record.
The S-57 data structure does not specify a file structure. The grouping of records into files is productspecific and, therefore, defined by the relevant product specification.
A.2 ISO/IEC 8211 interchange file structure
A.2.1 Logical records
ISO/IEC 8211 is a file based exchange format. The basic component of anISO/IEC 8211 file is a logical record (LR). The first LR of an ISO/IEC 8211 file iscalled the "Data Descriptive Record" (DDR) and contains the description andlogical structure of the actual data contained in the file. For a S-57 file, the DDRcontains the information given in the tree structure diagrams and tables whichare specified in chapter 7 of Part 3 of S-57. All other records in the ISO/IEC 8211files are called "Data Records" and contain the actual data to be exchanged. Thebasic file structure (one DDR and one or more DR’s) is shown in figure A.1.
Each logical record (both DDR and DR) contains three basic elements:
• Leader• Directory• Field area
DDR
DR
DR
DR
figure A.1
ISO/IEC 8211 summary and examples
Edition 3.1 November 2000 S-57 Part 3 - Annex A
3.A.2
A.2.2 Leader
The leader of a logical record contains the parameters necessary to read records and to disaggregate thedirectory (see clause A.2.3) into its entries. In addition, the DDR leader contains a few data descriptiveparameters applicable to the entire file.
A.2.2.1 DDR leader
The structure of the DDR leader is shown in table A.1.
RP Len Entry name Content
0 5 Record length number of bytes in record
5 1 Interchange level "3"
6 1 Leader identifier "L"
7 1 In line code extension indicator "E"
8 1 Version number "1"
9 1 Application indicator SPACE
10 2 Field control length "09"
12 5 Base address of field area Start address of field area (number of bytes inleader and directory)
17 3 Extended character set indicator " ! " (SPACE,!,SPACE)
20 4 Entry map (see table A.2)
table A.1
Entry map of DDR leader
RP Sub-entry name Len Content
20 Size of field length field 1 Variable 1-9 (defined by encoder)
21 Size of field position field 1 Variable 1-9 (defined by encoder)
22 Reserved 1 "0"
23 Size of field tag field 1 "4"
table A.2
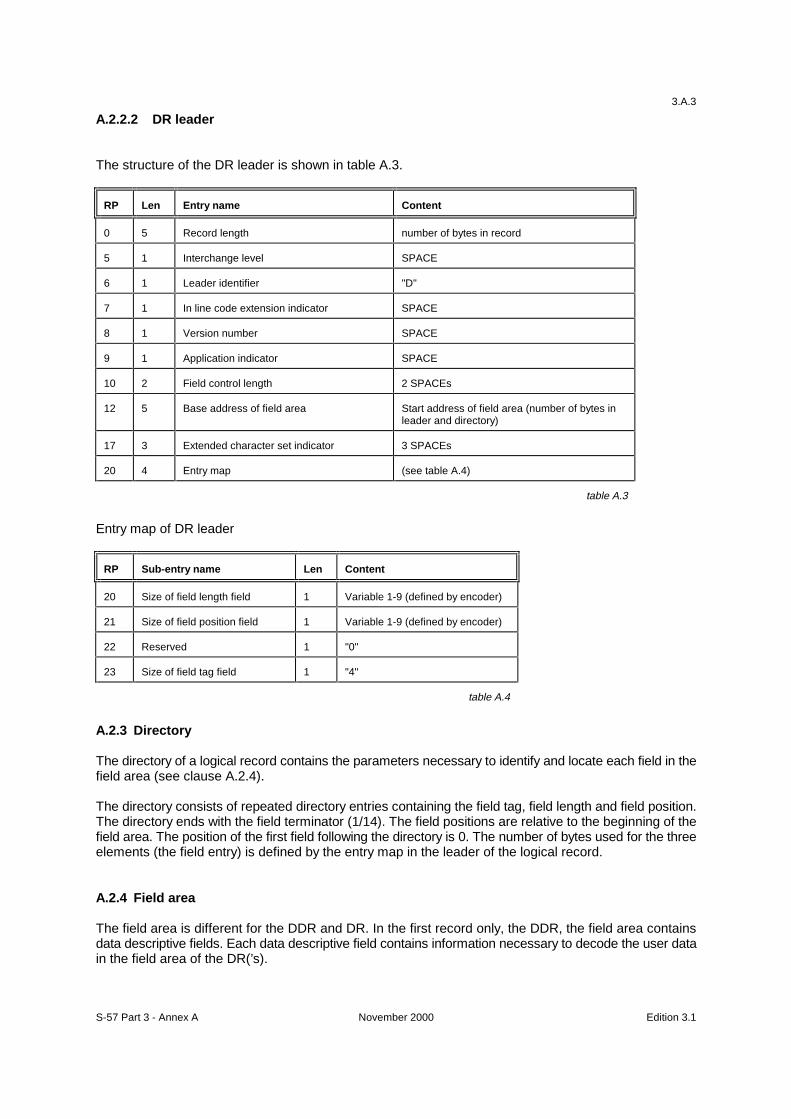
S-57 Part 3 - Annex A November 2000 Edition 3.1
3.A.3
A.2.2.2 DR leader
The structure of the DR leader is shown in table A.3.
RP Len Entry name Content
0 5 Record length number of bytes in record
5 1 Interchange level SPACE
6 1 Leader identifier "D"
7 1 In line code extension indicator SPACE
8 1 Version number SPACE
9 1 Application indicator SPACE
10 2 Field control length 2 SPACEs
12 5 Base address of field area Start address of field area (number of bytes inleader and directory)
17 3 Extended character set indicator 3 SPACEs
20 4 Entry map (see table A.4)
table A.3
Entry map of DR leader
RP Sub-entry name Len Content
20 Size of field length field 1 Variable 1-9 (defined by encoder)
21 Size of field position field 1 Variable 1-9 (defined by encoder)
22 Reserved 1 "0"
23 Size of field tag field 1 "4"
table A.4
A.2.3 Directory
The directory of a logical record contains the parameters necessary to identify and locate each field in thefield area (see clause A.2.4).
The directory consists of repeated directory entries containing the field tag, field length and field position.The directory ends with the field terminator (1/14). The field positions are relative to the beginning of thefield area. The position of the first field following the directory is 0. The number of bytes used for the threeelements (the field entry) is defined by the entry map in the leader of the logical record.
A.2.4 Field area
The field area is different for the DDR and DR. In the first record only, the DDR, the field area containsdata descriptive fields. Each data descriptive field contains information necessary to decode the user datain the field area of the DR(’s).
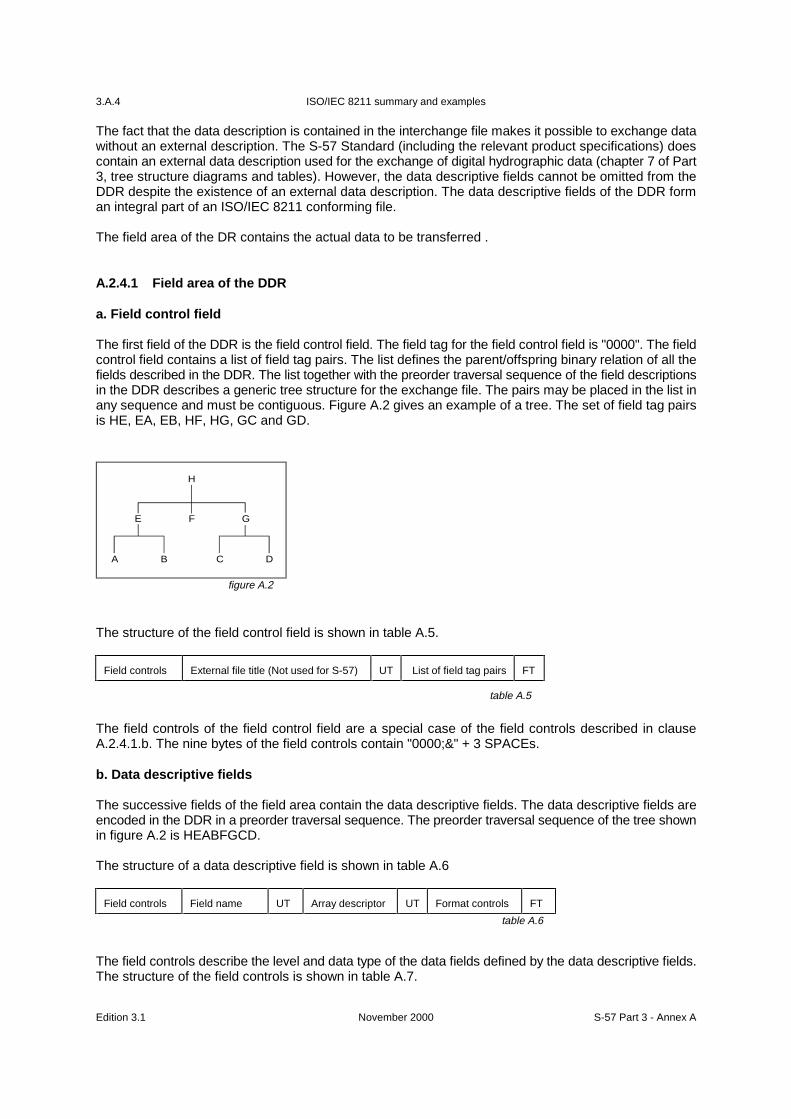
ISO/IEC 8211 summary and examples
Edition 3.1 November 2000 S-57 Part 3 - Annex A
3.A.4
The fact that the data description is contained in the interchange file makes it possible to exchange datawithout an external description. The S-57 Standard (including the relevant product specifications) doescontain an external data description used for the exchange of digital hydrographic data (chapter 7 of Part3, tree structure diagrams and tables). However, the data descriptive fields cannot be omitted from theDDR despite the existence of an external data description. The data descriptive fields of the DDR forman integral part of an ISO/IEC 8211 conforming file.
The field area of the DR contains the actual data to be transferred .
A.2.4.1 Field area of the DDR
a. Field control field
The first field of the DDR is the field control field. The field tag for the field control field is "0000". The fieldcontrol field contains a list of field tag pairs. The list defines the parent/offspring binary relation of all thefields described in the DDR. The list together with the preorder traversal sequence of the field descriptionsin the DDR describes a generic tree structure for the exchange file. The pairs may be placed in the list inany sequence and must be contiguous. Figure A.2 gives an example of a tree. The set of field tag pairsis HE, EA, EB, HF, HG, GC and GD.
The structure of the field control field is shown in table A.5.
Field controls External file title (Not used for S-57) UT List of field tag pairs FT
table A.5
The field controls of the field control field are a special case of the field controls described in clauseA.2.4.1.b. The nine bytes of the field controls contain "0000;&" + 3 SPACEs.
b. Data descriptive fields
The successive fields of the field area contain the data descriptive fields. The data descriptive fields areencoded in the DDR in a preorder traversal sequence. The preorder traversal sequence of the tree shownin figure A.2 is HEABFGCD.
The structure of a data descriptive field is shown in table A.6
Field controls Field name UT Array descriptor UT Format controls FT
table A.6
The field controls describe the level and data type of the data fields defined by the data descriptive fields.The structure of the field controls is shown in table A.7.
H
F
A B C D
E G
figure A.2
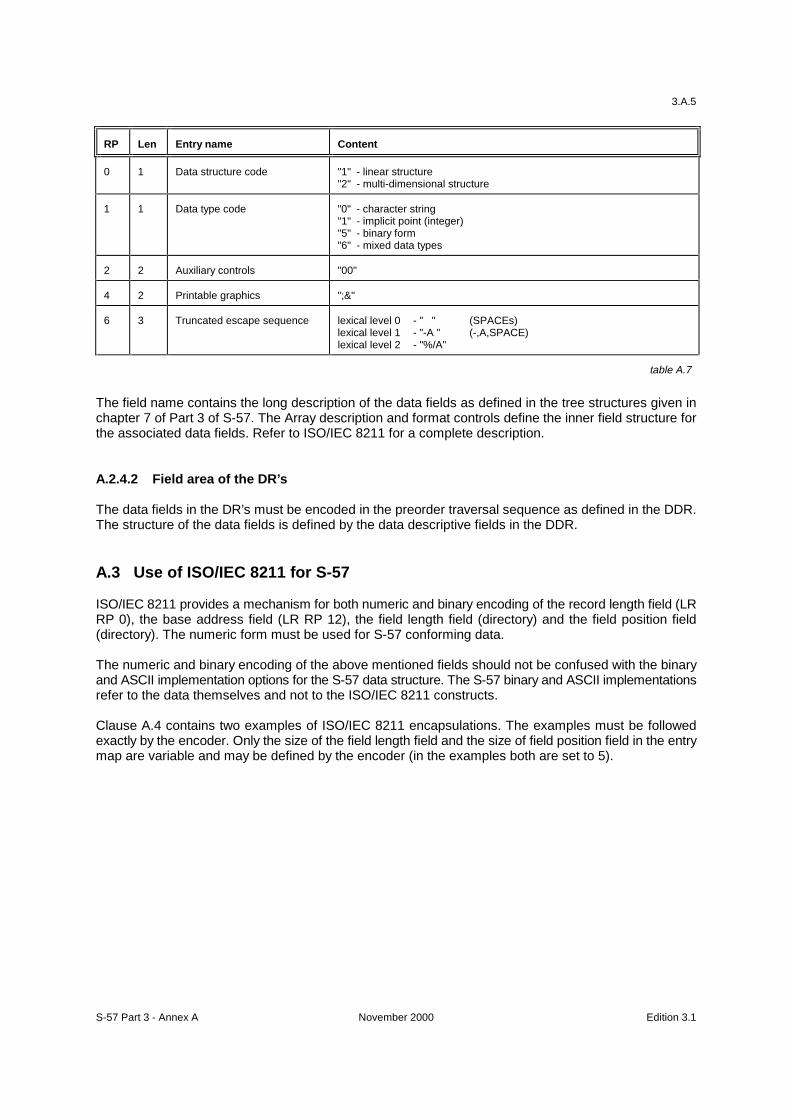
S-57 Part 3 - Annex A November 2000 Edition 3.1
3.A.5
RP Len Entry name Content
0 1 Data structure code "1" - linear structure"2" - multi-dimensional structure
1 1 Data type code "0" - character string"1" - implicit point (integer)"5" - binary form"6" - mixed data types
2 2 Auxiliary controls "00"
4 2 Printable graphics ";&"
6 3 Truncated escape sequence lexical level 0 - " " (SPACEs)lexical level 1 - "-A " (-,A,SPACE)lexical level 2 - "%/A"
table A.7
The field name contains the long description of the data fields as defined in the tree structures given inchapter 7 of Part 3 of S-57. The Array description and format controls define the inner field structure forthe associated data fields. Refer to ISO/IEC 8211 for a complete description.
A.2.4.2 Field area of the DR’s
The data fields in the DR’s must be encoded in the preorder traversal sequence as defined in the DDR.The structure of the data fields is defined by the data descriptive fields in the DDR.
A.3 Use of ISO/IEC 8211 for S-57
ISO/IEC 8211 provides a mechanism for both numeric and binary encoding of the record length field (LRRP 0), the base address field (LR RP 12), the field length field (directory) and the field position field(directory). The numeric form must be used for S-57 conforming data.
The numeric and binary encoding of the above mentioned fields should not be confused with the binaryand ASCII implementation options for the S-57 data structure. The S-57 binary and ASCII implementationsrefer to the data themselves and not to the ISO/IEC 8211 constructs.
Clause A.4 contains two examples of ISO/IEC 8211 encapsulations. The examples must be followedexactly by the encoder. Only the size of the field length field and the size of field position field in the entrymap are variable and may be defined by the encoder (in the examples both are set to 5).
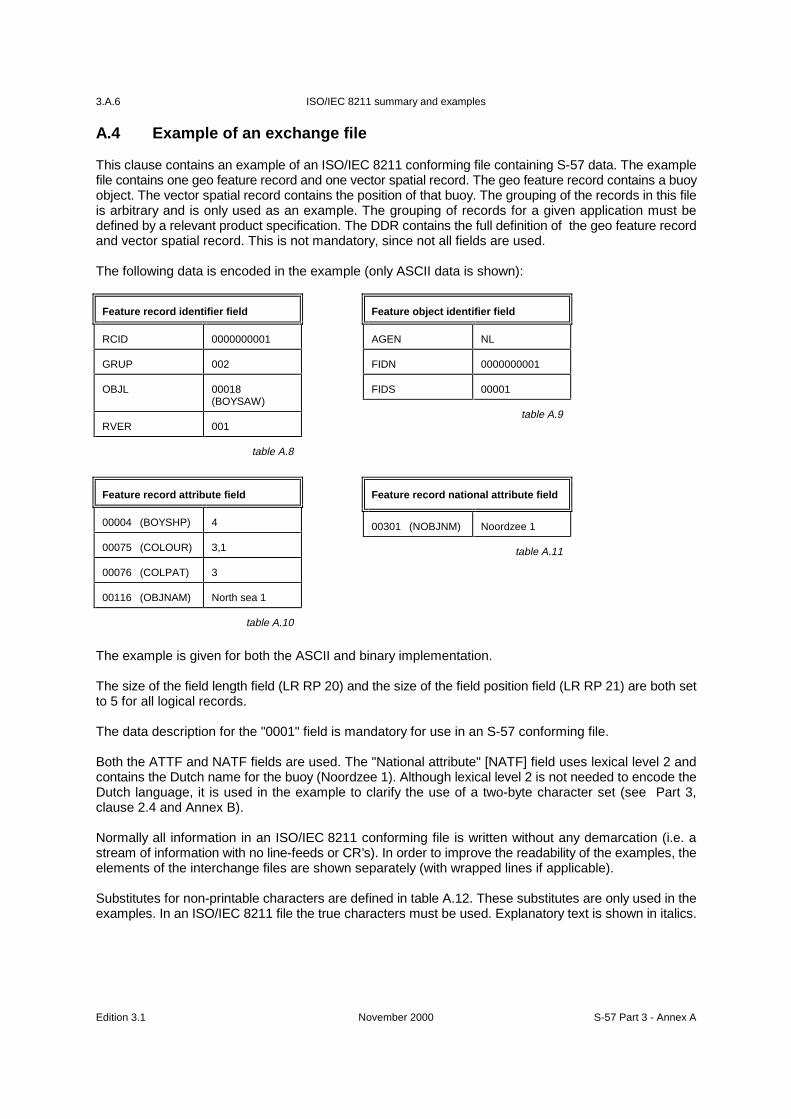
ISO/IEC 8211 summary and examples
Edition 3.1 November 2000 S-57 Part 3 - Annex A
3.A.6
A.4 Example of an exchange file
This clause contains an example of an ISO/IEC 8211 conforming file containing S-57 data. The examplefile contains one geo feature record and one vector spatial record. The geo feature record contains a buoyobject. The vector spatial record contains the position of that buoy. The grouping of the records in this fileis arbitrary and is only used as an example. The grouping of records for a given application must bedefined by a relevant product specification. The DDR contains the full definition of the geo feature recordand vector spatial record. This is not mandatory, since not all fields are used.
The following data is encoded in the example (only ASCII data is shown):
Feature record identifier field
RCID 0000000001
GRUP 002
OBJL 00018(BOYSAW)
RVER 001
table A.8
Feature object identifier field
AGEN NL
FIDN 0000000001
FIDS 00001
table A.9
Feature record attribute field
00004 (BOYSHP) 4
00075 (COLOUR) 3,1
00076 (COLPAT) 3
00116 (OBJNAM) North sea 1
table A.10
Feature record national attribute field
00301 (NOBJNM) Noordzee 1
table A.11
The example is given for both the ASCII and binary implementation.
The size of the field length field (LR RP 20) and the size of the field position field (LR RP 21) are both setto 5 for all logical records.
The data description for the "0001" field is mandatory for use in an S-57 conforming file.
Both the ATTF and NATF fields are used. The "National attribute" [NATF] field uses lexical level 2 andcontains the Dutch name for the buoy (Noordzee 1). Although lexical level 2 is not needed to encode theDutch language, it is used in the example to clarify the use of a two-byte character set (see Part 3,clause 2.4 and Annex B).
Normally all information in an ISO/IEC 8211 conforming file is written without any demarcation (i.e. astream of information with no line-feeds or CR’s). In order to improve the readability of the examples, theelements of the interchange files are shown separately (with wrapped lines if applicable).
Substitutes for non-printable characters are defined in table A.12. These substitutes are only used in theexamples. In an ISO/IEC 8211 file the true characters must be used. Explanatory text is shown in italics.
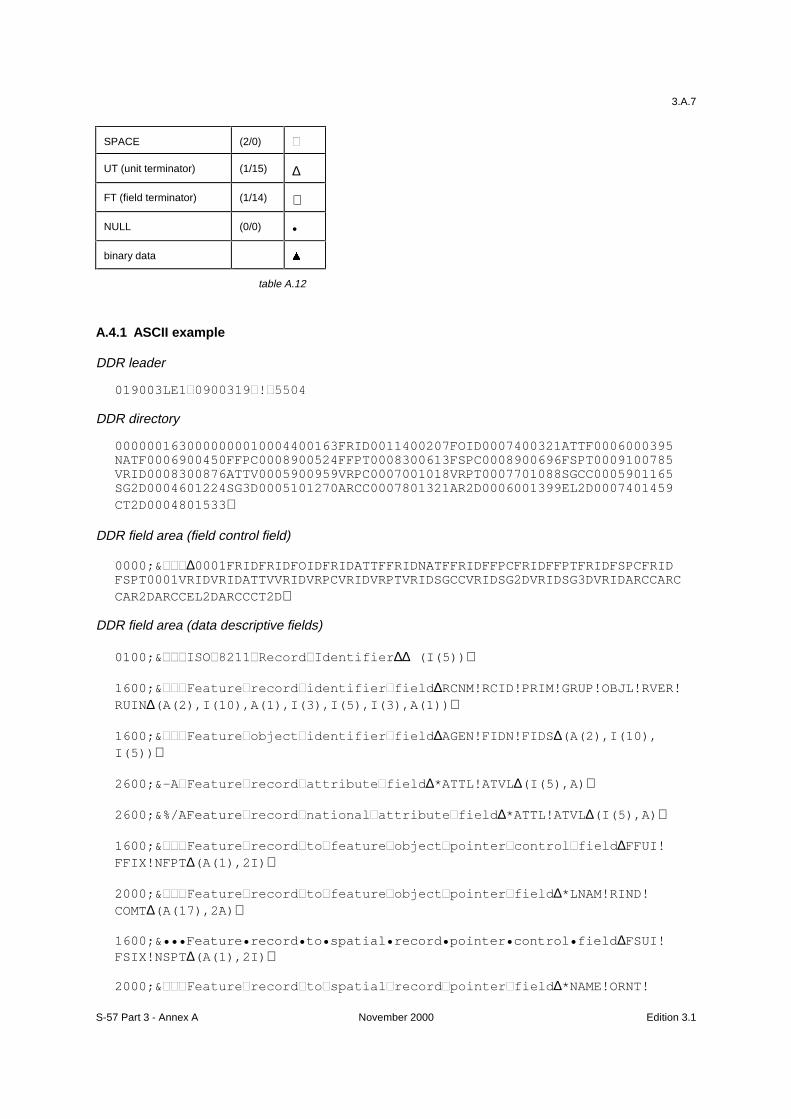
S-57 Part 3 - Annex A November 2000 Edition 3.1
3.A.7
SPACE (2/0) �
UT (unit terminator) (1/15) ∆
FT (field terminator) (1/14) ∇
NULL (0/0) •
binary data
table A.12
A.4.1 ASCII example
DDR leader
019003LE1���������������
DDR directory
0000001630000000010004400163FRID0011400207FOID0007400321ATTF0006000395NATF0006900450FFPC0008900524FFPT0008300613FSPC0008900696FSPT0009100785VRID0008300876ATTV0005900959VRPC0007001018VRPT0007701088SGCC0005901165SG2D0004601224SG3D0005101270ARCC0007801321AR2D0006001399EL2D0007401459CT2D0004801533∇
DDR field area (field control field)
0000;&���∆0001FRIDFRIDFOIDFRIDATTFFRIDNATFFRIDFFPCFRIDFFPTFRIDFSPCFRIDFSPT0001VRIDVRIDATTVVRIDVRPCVRIDVRPTVRIDSGCCVRIDSG2DVRIDSG3DVRIDARCCARCCAR2DARCCEL2DARCCCT2D∇
DDR field area (data descriptive fields)
0100;&���,62������5HFRUG�,GHQWLILHU∆∆ (I(5))∇
1600;&���)HDWXUH�UHFRUG�LGHQWLILHU�ILHOG∆RCNM!RCID!PRIM!GRUP!OBJL!RVER!RUIN∆(A(2),I(10),A(1),I(3),I(5),I(3),A(1))∇
1600;&���)HDWXUH�REMHFW�LGHQWLILHU�ILHOG∆AGEN!FIDN!FIDS∆(A(2),I(10),I(5))∇
2600;&-A�)HDWXUH�UHFRUG�DWWULEXWH�ILHOG∆*ATTL!ATVL∆(I(5),A)∇
2600;&%/AFeature�UHFRUG�QDWLRQDO�DWWULEXWH�ILHOG∆*ATTL!ATVL∆(I(5),A)∇
1600;&���)HDWXUH�UHFRUG�WR�IHDWXUH�REMHFW�SRLQWHU�FRQWURO�ILHOG∆FFUI!FFIX!NFPT∆(A(1),2I)∇
2000;&���)HDWXUH�UHFRUG�WR�IHDWXUH�REMHFW�SRLQWHU�ILHOG∆*LNAM!RIND!COMT∆(A(17),2A)∇
1600;&•••Feature•record•to•spatial•record•pointer•control•field ∆FSUI!FSIX!NSPT ∆(A(1),2I) ∇
2000;&���)HDWXUH�UHFRUG�WR�VSDWLDO�UHFRUG�SRLQWHU�ILHOG∆*NAME!ORNT!
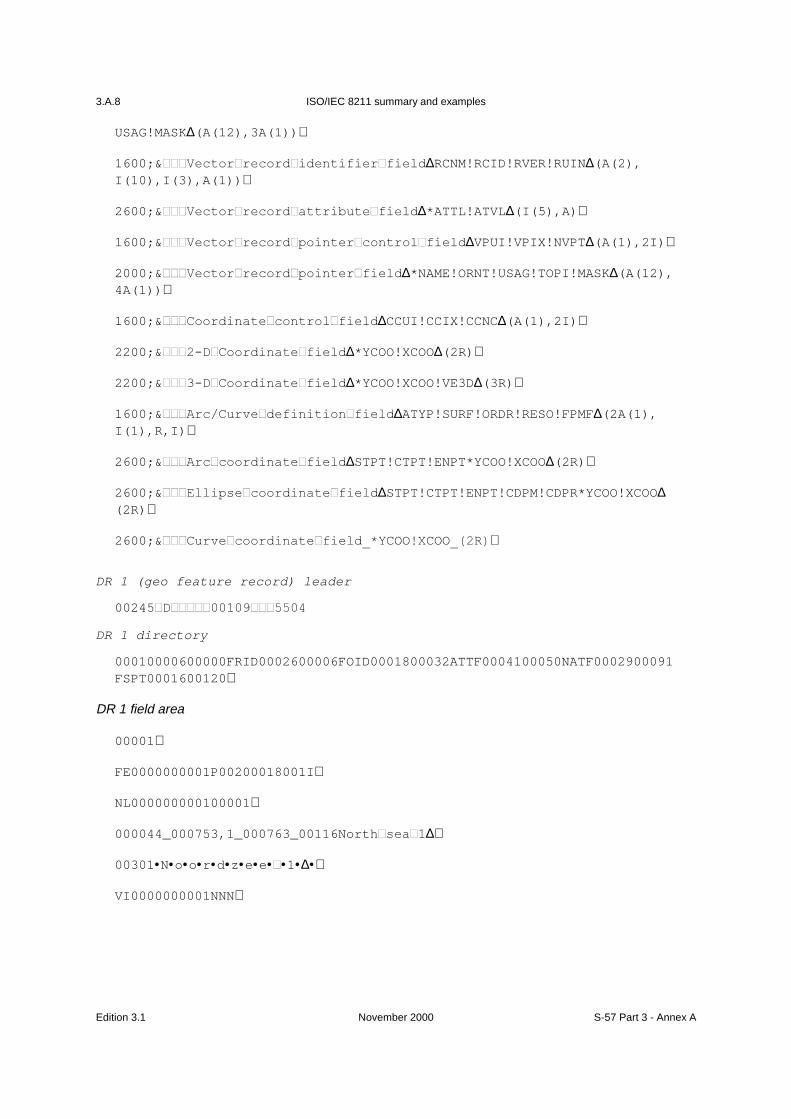
ISO/IEC 8211 summary and examples
Edition 3.1 November 2000 S-57 Part 3 - Annex A
3.A.8
USAG!MASK∆(A(12),3A(1))∇
1600;&���9HFWRU�UHFRUG�LGHQWLILHU�ILHOG∆RCNM!RCID!RVER!RUIN∆(A(2),I(10),I(3),A(1))∇
2600;&���9HFWRU�UHFRUG�DWWULEXWH�ILHOG∆*ATTL!ATVL∆(I(5),A)∇
1600;&���9HFWRU�UHFRUG�SRLQWHU�FRQWURO�ILHOG∆VPUI!VPIX!NVPT∆(A(1),2I)∇
2000;&���9HFWRU�UHFRUG�SRLQWHU�ILHOG∆*NAME!ORNT!USAG!TOPI!MASK∆(A(12),4A(1))∇
1600;&���&RRUGLQDWH�FRQWURO�ILHOG∆CCUI!CCIX!CCNC∆(A(1),2I)∇
2200;&�����'�&RRUGLQDWH�ILHOG∆*YCOO!XCOO∆(2R)∇
2200;&�����'�&RRUGLQDWH�ILHOG∆*YCOO!XCOO!VE3D∆(3R)∇
1600;&���$UF�&XUYH�GHILQLWLRQ�ILHOG∆ATYP!SURF!ORDR!RESO!FPMF∆(2A(1),I(1),R,I)∇
2600;&���$UF�FRRUGLQDWH�ILHOG∆STPT!CTPT!ENPT*YCOO!XCOO∆(2R)∇
2600;&���(OOLSVH�FRRUGLQDWH�ILHOG∆STPT!CTPT!ENPT!CDPM!CDPR*YCOO!XCOO∆(2R)∇
2600;&���&XUYH�FRRUGLQDWH�ILHOGB <&22�;&22B��5�∇
DR 1 (geo feature record) leader
00245�'�����������������
DR 1 directory
00010000600000FRID0002600006FOID0001800032ATTF0004100050NATF0002900091FSPT0001600120∇
DR 1 field area
00001∇
FE0000000001P00200018001I∇
NL000000000100001∇
000044_000753,1_000763_00116North�VHD��∆∇
00301•N•o•o•r•d•z•e•e•�•1•∆•∇
VI0000000001NNN∇
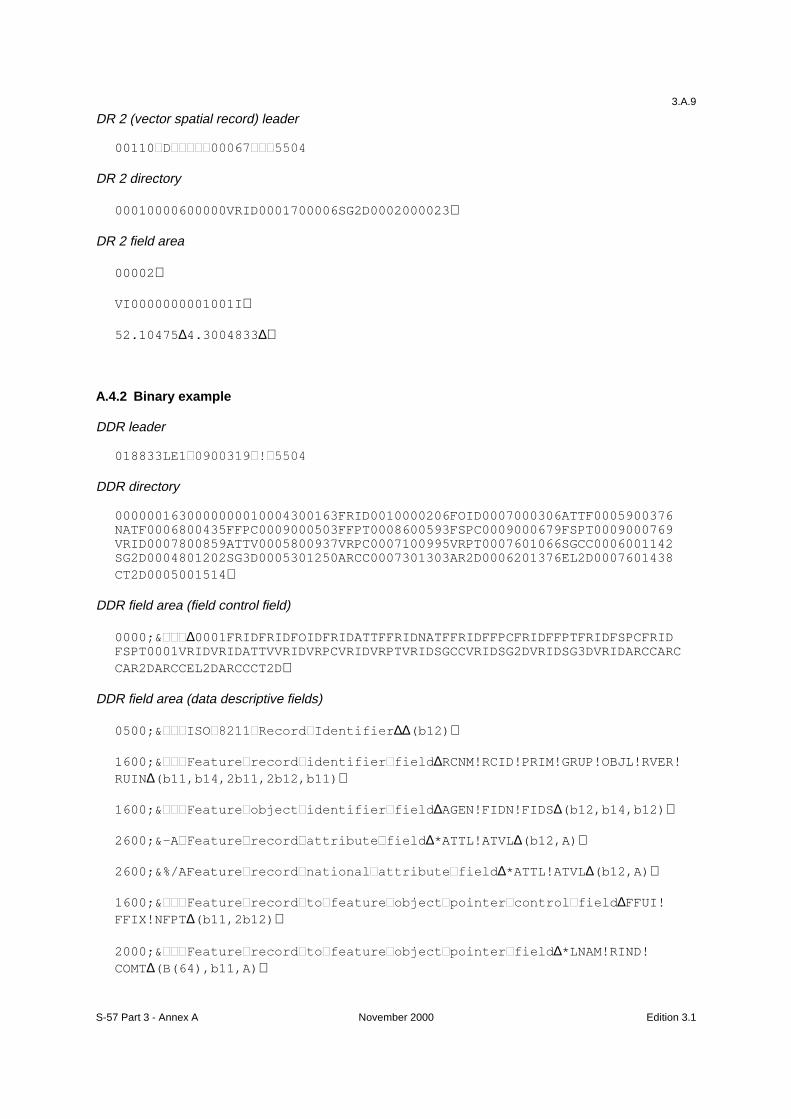
S-57 Part 3 - Annex A November 2000 Edition 3.1
3.A.9
DR 2 (vector spatial record) leader
00110�'�����������������
DR 2 directory
00010000600000VRID0001700006SG2D0002000023∇
DR 2 field area
00002∇
VI0000000001001I∇
52.10475∆4.3004833∆∇
A.4.2 Binary example
DDR leader
018833LE1���������������
DDR directory
0000001630000000010004300163FRID0010000206FOID0007000306ATTF0005900376NATF0006800435FFPC0009000503FFPT0008600593FSPC0009000679FSPT0009000769VRID0007800859ATTV0005800937VRPC0007100995VRPT0007601066SGCC0006001142SG2D0004801202SG3D0005301250ARCC0007301303AR2D0006201376EL2D0007601438CT2D0005001514∇
DDR field area (field control field)
0000;&���∆0001FRIDFRIDFOIDFRIDATTFFRIDNATFFRIDFFPCFRIDFFPTFRIDFSPCFRIDFSPT0001VRIDVRIDATTVVRIDVRPCVRIDVRPTVRIDSGCCVRIDSG2DVRIDSG3DVRIDARCCARCCAR2DARCCEL2DARCCCT2D∇
DDR field area (data descriptive fields)
0500;&���,62������5HFRUG�,GHQWLILHU∆∆(b12)∇
1600;&���)HDWXUH�UHFRUG�LGHQWLILHU�ILHOG∆RCNM!RCID!PRIM!GRUP!OBJL!RVER!RUIN∆(b11,b14,2b11,2b12,b11)∇
1600;&���)HDWXUH�REMHFW�LGHQWLILHU�ILHOG∆AGEN!FIDN!FIDS∆(b12,b14,b12)∇
2600;&-A�)HDWXUH�UHFRUG�DWWULEXWH�ILHOG∆*ATTL!ATVL∆(b12,A)∇
2600;&%/AFeature�UHFRUG�QDWLRQDO�DWWULEXWH�ILHOG∆*ATTL!ATVL∆(b12,A)∇
1600;&���)HDWXUH�UHFRUG�WR�IHDWXUH�REMHFW�SRLQWHU�FRQWURO�ILHOG∆FFUI!FFIX!NFPT∆(b11,2b12)∇
2000;&���)HDWXUH�UHFRUG�WR�IHDWXUH�REMHFW�SRLQWHU�ILHOG∆*LNAM!RIND!COMT∆(B(64),b11,A)∇
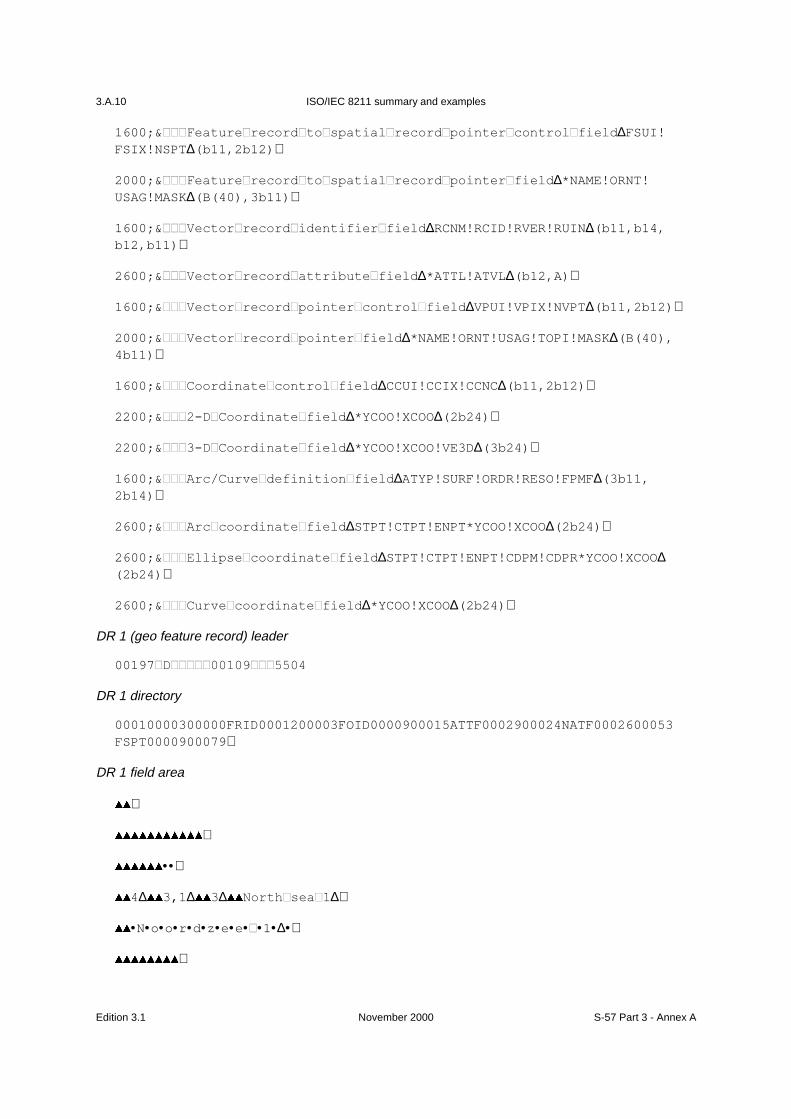
ISO/IEC 8211 summary and examples
Edition 3.1 November 2000 S-57 Part 3 - Annex A
3.A.10
1600;&���)HDWXUH�UHFRUG�WR�VSDWLDO�UHFRUG�SRLQWHU�FRQWURO�ILHOG∆FSUI!FSIX!NSPT∆(b11,2b12)∇
2000;&���)HDWXUH�UHFRUG�WR�VSDWLDO�UHFRUG�SRLQWHU�ILHOG∆*NAME!ORNT!USAG!MASK∆(B(40),3b11)∇
1600;&���9HFWRU�UHFRUG�LGHQWLILHU�ILHOG∆RCNM!RCID!RVER!RUIN∆(b11,b14,b12,b11)∇
2600;&���9HFWRU�UHFRUG�DWWULEXWH�ILHOG∆*ATTL!ATVL∆(b12,A)∇
1600;&���9HFWRU�UHFRUG�SRLQWHU�FRQWURO�ILHOG∆VPUI!VPIX!NVPT∆(b11,2b12)∇
2000;&���9HFWRU�UHFRUG�SRLQWHU�ILHOG∆*NAME!ORNT!USAG!TOPI!MASK∆(B(40),4b11)∇
1600;&���&RRUGLQDWH�FRQWURO�ILHOG∆CCUI!CCIX!CCNC∆(b11,2b12)∇
2200;&�����'�&RRUGLQDWH�ILHOG∆*YCOO!XCOO∆(2b24)∇
2200;&�����'�&RRUGLQDWH�ILHOG∆*YCOO!XCOO!VE3D∆(3b24)∇
1600;&���$UF�&XUYH�GHILQLWLRQ�ILHOG∆ATYP!SURF!ORDR!RESO!FPMF∆(3b11,2b14)∇
2600;&���$UF�FRRUGLQDWH�ILHOG∆STPT!CTPT!ENPT*YCOO!XCOO∆(2b24)∇
2600;&���(OOLSVH�FRRUGLQDWH�ILHOG∆STPT!CTPT!ENPT!CDPM!CDPR*YCOO!XCOO∆(2b24)∇
2600;&���&XUYH�FRRUGLQDWH�ILHOG∆*YCOO!XCOO∆(2b24)∇
DR 1 (geo feature record) leader
00197�'�����������������
DR 1 directory
00010000300000FRID0001200003FOID0000900015ATTF0002900024NATF0002600053FSPT0000900079∇
DR 1 field area
∇
∇
••∇
�∆ ���∆ �∆ 1RUWK�VHD��∆∇
•N•o•o•r•d•z•e•e•�•1•∆•∇
∇

S-57 Part 3 - Annex A November 2000 Edition 3.1
3.A.11
DR 2 (vector spatial record) leader
00088�'�����������������
DR 2 directory
00010000300000VRID0000900003SG2D0000900012∇
DR 2 field area
∇
∇
∇

ISO/IEC 8211 summary and examples
Edition 3.1 November 2000 S-57 Part 3 - Annex A
3.A.12
Page intentionally left blank

S-57 Part 3Annex B - Alternate character sets
Edition 3.1

Alternate character sets
Edition 3.1 November 2000 S-57 Part 3 - Annex B
Important notice
All “Clarifications” in the latest edition of theMaintenance Document must be taken into accountbefore making use of this document.
Page intentionally left blank
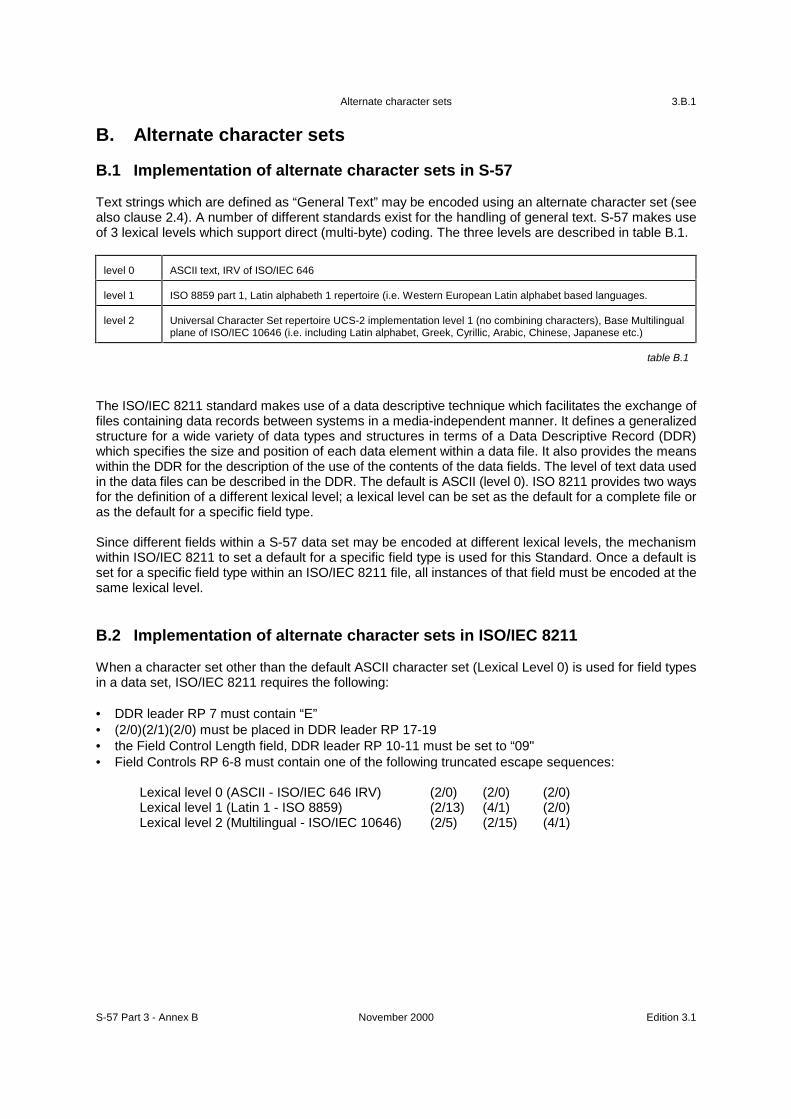
Alternate character sets
S-57 Part 3 - Annex B November 2000 Edition 3.1
3.B.1
B. Alternate character sets
B.1 Implementation of alternate character sets in S-57
Text strings which are defined as “General Text” may be encoded using an alternate character set (seealso clause 2.4). A number of different standards exist for the handling of general text. S-57 makes useof 3 lexical levels which support direct (multi-byte) coding. The three levels are described in table B.1.
level 0 ASCII text, IRV of ISO/IEC 646
level 1 ISO 8859 part 1, Latin alphabeth 1 repertoire (i.e. Western European Latin alphabet based languages.
level 2 Universal Character Set repertoire UCS-2 implementation level 1 (no combining characters), Base Multilingualplane of ISO/IEC 10646 (i.e. including Latin alphabet, Greek, Cyrillic, Arabic, Chinese, Japanese etc.)
table B.1
The ISO/IEC 8211 standard makes use of a data descriptive technique which facilitates the exchange offiles containing data records between systems in a media-independent manner. It defines a generalizedstructure for a wide variety of data types and structures in terms of a Data Descriptive Record (DDR)which specifies the size and position of each data element within a data file. It also provides the meanswithin the DDR for the description of the use of the contents of the data fields. The level of text data usedin the data files can be described in the DDR. The default is ASCII (level 0). ISO 8211 provides two waysfor the definition of a different lexical level; a lexical level can be set as the default for a complete file oras the default for a specific field type.
Since different fields within a S-57 data set may be encoded at different lexical levels, the mechanismwithin ISO/IEC 8211 to set a default for a specific field type is used for this Standard. Once a default isset for a specific field type within an ISO/IEC 8211 file, all instances of that field must be encoded at thesame lexical level.
B.2 Implementation of alternate character sets in ISO/IEC 8211
When a character set other than the default ASCII character set (Lexical Level 0) is used for field typesin a data set, ISO/IEC 8211 requires the following:
• DDR leader RP 7 must contain “E”• (2/0)(2/1)(2/0) must be placed in DDR leader RP 17-19• the Field Control Length field, DDR leader RP 10-11 must be set to “09"• Field Controls RP 6-8 must contain one of the following truncated escape sequences:
Lexical level 0 (ASCII - ISO/IEC 646 IRV) (2/0) (2/0) (2/0)Lexical level 1 (Latin 1 - ISO 8859) (2/13) (4/1) (2/0)Lexical level 2 (Multilingual - ISO/IEC 10646) (2/5) (2/15) (4/1)

Alternate character sets
Edition 3.1 November 2000 S-57 Part 3 - Annex B
3.B.2
• The unit terminator (UT) used to separate the subfields and the field terminator (FT) must be encodedin the character set used for the field in which they occur. Table B.2 defines the terminators for eachlevel.
Lexical level UT FT
level 0 (1/15) (1/14)
level 1 (1/15) (1/14)
level 2 (0/0) (1/15) (0/0) (1/14)
table B.2
level 2
B.3 Code tables
B.3.1 General
All text is defined in terms of character set code tables. Particular character codes are identified by a codetable arranged into rows and columns in which 94 (or 96) character codes are assigned. A number ofdifferent character code tables has been in use internationally and these code tables are registered withISO under ISO Standard 2375. ISO/IEC 10646 provides a comprehensive multilingual character set, whicheliminates the need to select individual alphabets from the ISO registry. ISO/IEC 10646 contains as itsbase page the ISO 8859 part 1 Latin alphabet 1, which itself contains as its base the InternationalReference Version (IRV) alphabet ISO/IEC 646. ISO/IEC 646 (IRV) is equivalent to ASCII (AmericanStandard Code for Information Interchange ANSI X3.4).
The alphabetic part of the ISO/IEC 646 (IRV) and ISO 8859 code tables is termed the Graphic or “G” set.Another specialized code table, the Control or “C0” set, is also defined. In addition to the G and C sets,two special characters are defined. These are ‘space’ and ‘delete’. Some of the C0 control characters arereserved for specialized use, such as transmission control in an asynchronous communications systemor application level delimiting such as is used by ISO/IEC 8211. The only format effecting C0 charactersrequired by S-57 are: Carriage Return (CR), Line Feed (LF), Back Space (BS), Horizontal Tab (HT),Vertical Tab (VT) and Form Feed (FF). Since S-57 operates in an 8-bit coding environment with threedefined character repertoires corresponding to ISO standards, there is no need for the code extensioncharacters Escape (ESC), Shift In (SI), or Shift Out (SO). All other C0 characters have a null meaning.The use of C0 characters may be further restricted by a relevant product specification.
The ASCII (ISO/IEC 646 IRV) code table caters largely to the needs of the English language. It defines94 characters within a single 7-bit code table (with bit 8 zero in an 8-bit implementation). For other Latinlanguages where accented letters are used extensively, and for other alphabets, the InternationalOrganization for Standardization (ISO) has defined other standards. There are several different standardsdefined by ISO dependent on the size of the repertoire of characters which must be addressed.
The ISO 8859 standard uses bit 8 of an 8-bit character field to switch between two code tables, the ASCIIcode table on the left and a supplementary code table on the right containing 94 additional characters.Each character has a single code.

Alternate character sets
S-57 Part 3 - Annex B November 2000 Edition 3.1
3.B.3
The ISO/IEC 10646 standard defines a “Universal Character Set” for virtually all languages in the world.To do this it must use 16-bits or more to identify each character. S-57 makes use of the Base Multilingualplane of ISO/IEC 10646 which uses 16-bits per character, handling ASCII, virtually all Latin alphabetlanguages, Greek, Hebrew, Cyrillic, Arabic, Chinese (Han - including Japanese Kanji and Korean Hangul),Japanese Katakana, etc. Virtually every modern alphabet is specified. Excluded are such character setsas ancient Egyptian hieroglyphics which require 32 bits per character.
The specific characters available under a given character set standard are called the repertoire of thatstandard. The defined repertoire of available characters is what is of principle importance for compatibility.Three levels of repertoire are defined for S-57 ranging from ASCII text to the support of any alphabetregistered nationally or internationally. This range is broken into two broad levels: Basic Text and GeneralText.
Basic text (Level 0) is simply ASCII data and is used throughout this Standard for various purposes. Therepertoire is simply the 94 characters defined in the ASCII character set plus the SPACE character plusspecific C0 control characters (Carriage Return (CR) and Line Feed (LF), etc.). Other C0 characters arenot used in basic text.
General text is used for the attribute fields (ATTF and NATF). Two levels of general text repertoire aredefined. These levels have been defined to be efficient in various encodings and at different levels ofusage. For example Level 1 general text makes use of the Latin Alphabet 1 repertoire (commonly called8-bit ASCII) which is directly compatible with virtually all computer systems. Level 1 general text addressesthe needs of Western European languages. Level 2 general text addresses the needs of almost all worldlanguages, but it is less efficient in coding.
S-57 may be extended to a fourth level of general text which addresses the needs of all languages usingthe full capabilities of ISO/IEC 10646 UCS-4 requiring 4 bytes per character. However this approach canbe very complex and inefficient and is reserved for further study at this time.
B.3.2 Level 0 Text Repertoire
The basic alphabet used in S-57 is the International Reference Version alphabet of ISO Standard 646,which is equivalent to ASCII. Table B.3 presents the Level 0 text repertoire, the Latin Alphabet PrimaryCode Table (ASCII). Both the G0 graphic and C0 control code tables are shown as well as the ‘space’ and‘delete’ characters. Only the C0 format effecting characters are illustrated. All other C0 control codes arenot used. The code extension characters from the C0 set (ESC, SI, and SO) are not used. The 7-bit codetable is shown. Bit 8 in an 8-bit field is set to 0.The delete character is only used in the update mechanism (see clause 8.4.2.2.a and 8.4.3.2.a).
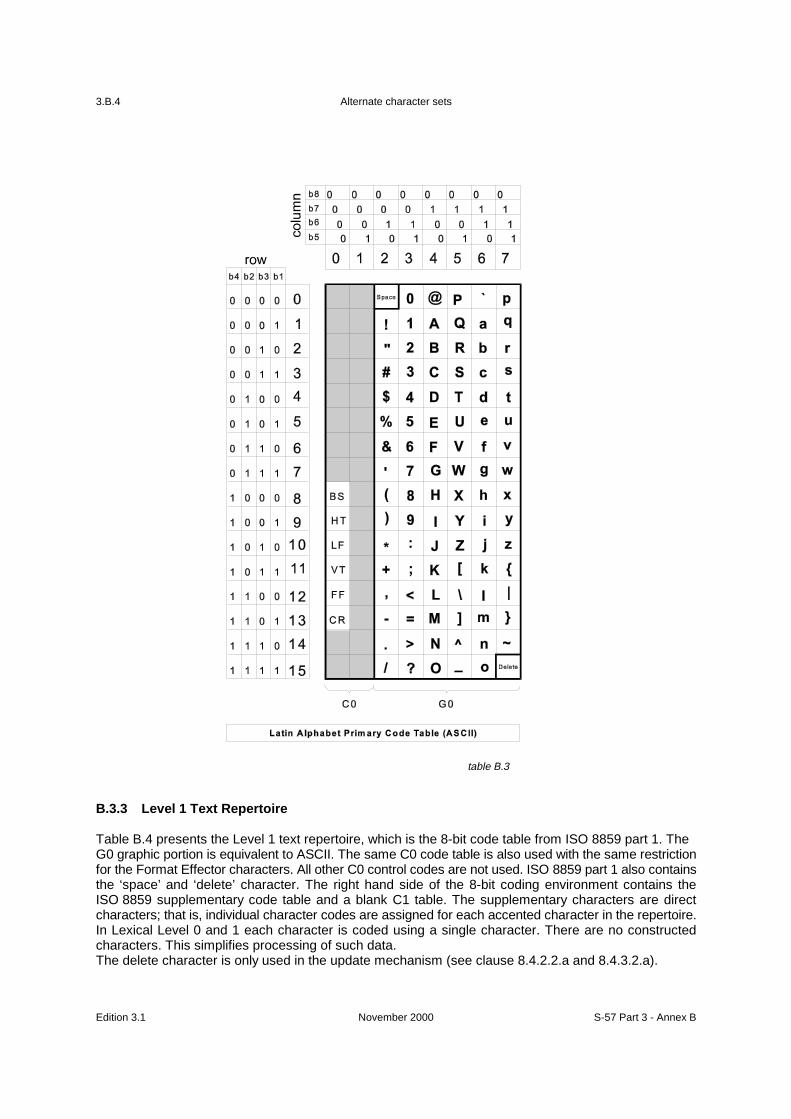
Alternate character sets
Edition 3.1 November 2000 S-57 Part 3 - Annex B
3.B.4
B.3.3 Level 1 Text Repertoire
Table B.4 presents the Level 1 text repertoire, which is the 8-bit code table from ISO 8859 part 1. TheG0 graphic portion is equivalent to ASCII. The same C0 code table is also used with the same restrictionfor the Format Effector characters. All other C0 control codes are not used. ISO 8859 part 1 also containsthe ‘space’ and ‘delete’ character. The right hand side of the 8-bit coding environment contains theISO 8859 supplementary code table and a blank C1 table. The supplementary characters are directcharacters; that is, individual character codes are assigned for each accented character in the repertoire.In Lexical Level 0 and 1 each character is coded using a single character. There are no constructedcharacters. This simplifies processing of such data.The delete character is only used in the update mechanism (see clause 8.4.2.2.a and 8.4.3.2.a).
table B.3
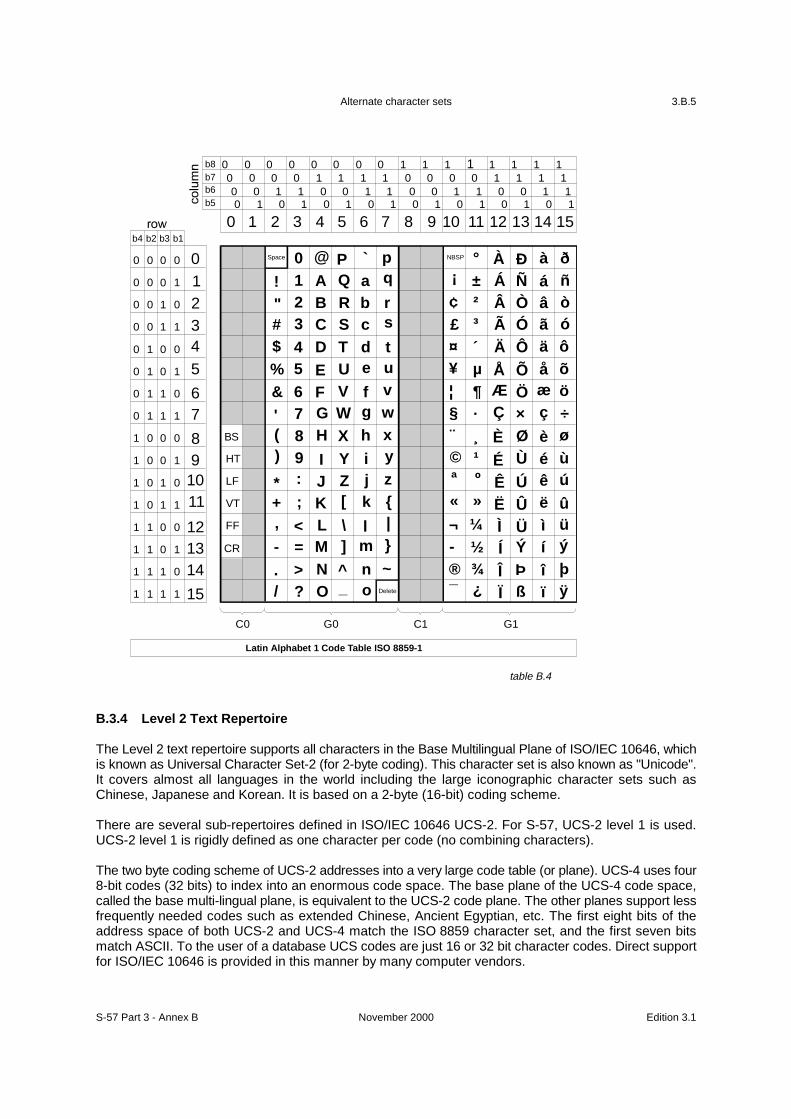
Alternate character sets
S-57 Part 3 - Annex B November 2000 Edition 3.1
3.B.5
B.3.4 Level 2 Text Repertoire
The Level 2 text repertoire supports all characters in the Base Multilingual Plane of ISO/IEC 10646, whichis known as Universal Character Set-2 (for 2-byte coding). This character set is also known as "Unicode".It covers almost all languages in the world including the large iconographic character sets such asChinese, Japanese and Korean. It is based on a 2-byte (16-bit) coding scheme.
There are several sub-repertoires defined in ISO/IEC 10646 UCS-2. For S-57, UCS-2 level 1 is used.UCS-2 level 1 is rigidly defined as one character per code (no combining characters).
The two byte coding scheme of UCS-2 addresses into a very large code table (or plane). UCS-4 uses four8-bit codes (32 bits) to index into an enormous code space. The base plane of the UCS-4 code space,called the base multi-lingual plane, is equivalent to the UCS-2 code plane. The other planes support lessfrequently needed codes such as extended Chinese, Ancient Egyptian, etc. The first eight bits of theaddress space of both UCS-2 and UCS-4 match the ISO 8859 character set, and the first seven bitsmatch ASCII. To the user of a database UCS codes are just 16 or 32 bit character codes. Direct supportfor ISO/IEC 10646 is provided in this manner by many computer vendors.
0
0 0 0 0 0 0 0 0 1 1 1 1 1 1 1 10 0 0 0 1 1 1 1 0 0 0 0 1 1 1 10 0 1 1 0 0 1 1 0 0 1 1 0 0 1 10 1 0 1 0 1 0 1 0 1 0 1 0 1 0 1
b8b7b6b5
1 2 4 6 7 9 10 11 12 13 14 15853
00
0
b4
0
0
0
0
0
0
1
1
1
1
1
1
1
1
0
0
b2
0
1
0
1
1
1
0
0
0
0
1
1
1
1
0
0
b3
1
0
1
0
1
1
0
0
1
1
0
0
1
1
1
0
b1
0
0
1
1
0
1
0
1
0
1
0
1
0
1
12
4
67
91011
121314
15
8
5
3
C0 G0 C1 G1
Space
Delete
NBSP
!
0 ° Ð à ð@ P ` p1 ¡ ± Á
ÀÑ á ñA Q a q
" 2 ² Â Ò â òB R b r# 3 £
¢³ Ã Ó ã óC S c s
$ 4 ¤ ´ Ä Ô ä ôD T d t% 5 ¥ µ Å Õ å õE U e u
&
BS
HT
LF
VT
FF
CR
6 ¦ ¶ Æ Ö æ öF V f v
' 7 § · Ç × ç ÷G W g w( 8 ¨ ¸ È Ø è øH X h x) 9 © ¹ É Ù é ùI Y i y
* : ª º Ê Ú ê úJ Z j z
+ ; « » Ë Û ë ûK [ k {, < ¬ ¼ Ì Ü ì üL \ l |
- = - ½ Í Ý í ýM ] m }
. > ® ¾ Î Þ î þN ^ n ~/ ? ¯ ¿ Ï ß ï ÿO _ o
Latin Alphabet 1 Code Table ISO 8859-1
table B.4
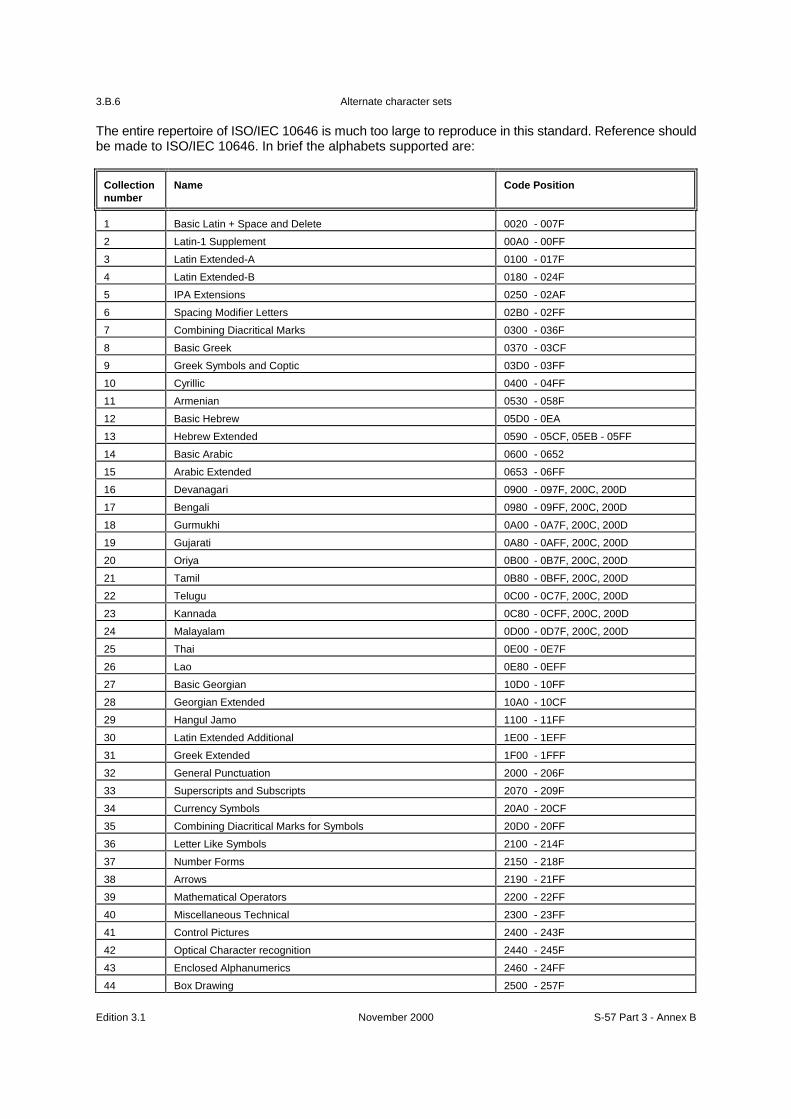
Alternate character sets
Edition 3.1 November 2000 S-57 Part 3 - Annex B
3.B.6
The entire repertoire of ISO/IEC 10646 is much too large to reproduce in this standard. Reference shouldbe made to ISO/IEC 10646. In brief the alphabets supported are:
Collectionnumber
Name Code Position
1 Basic Latin + Space and Delete 0020 - 007F
2 Latin-1 Supplement 00A0 - 00FF
3 Latin Extended-A 0100 - 017F
4 Latin Extended-B 0180 - 024F
5 IPA Extensions 0250 - 02AF
6 Spacing Modifier Letters 02B0 - 02FF
7 Combining Diacritical Marks 0300 - 036F
8 Basic Greek 0370 - 03CF
9 Greek Symbols and Coptic 03D0 - 03FF
10 Cyrillic 0400 - 04FF
11 Armenian 0530 - 058F
12 Basic Hebrew 05D0 - 0EA
13 Hebrew Extended 0590 - 05CF, 05EB - 05FF
14 Basic Arabic 0600 - 0652
15 Arabic Extended 0653 - 06FF
16 Devanagari 0900 - 097F, 200C, 200D
17 Bengali 0980 - 09FF, 200C, 200D
18 Gurmukhi 0A00 - 0A7F, 200C, 200D
19 Gujarati 0A80 - 0AFF, 200C, 200D
20 Oriya 0B00 - 0B7F, 200C, 200D
21 Tamil 0B80 - 0BFF, 200C, 200D
22 Telugu 0C00 - 0C7F, 200C, 200D
23 Kannada 0C80 - 0CFF, 200C, 200D
24 Malayalam 0D00 - 0D7F, 200C, 200D
25 Thai 0E00 - 0E7F
26 Lao 0E80 - 0EFF
27 Basic Georgian 10D0 - 10FF
28 Georgian Extended 10A0 - 10CF
29 Hangul Jamo 1100 - 11FF
30 Latin Extended Additional 1E00 - 1EFF
31 Greek Extended 1F00 - 1FFF
32 General Punctuation 2000 - 206F
33 Superscripts and Subscripts 2070 - 209F
34 Currency Symbols 20A0 - 20CF
35 Combining Diacritical Marks for Symbols 20D0 - 20FF
36 Letter Like Symbols 2100 - 214F
37 Number Forms 2150 - 218F
38 Arrows 2190 - 21FF
39 Mathematical Operators 2200 - 22FF
40 Miscellaneous Technical 2300 - 23FF
41 Control Pictures 2400 - 243F
42 Optical Character recognition 2440 - 245F
43 Enclosed Alphanumerics 2460 - 24FF
44 Box Drawing 2500 - 257F
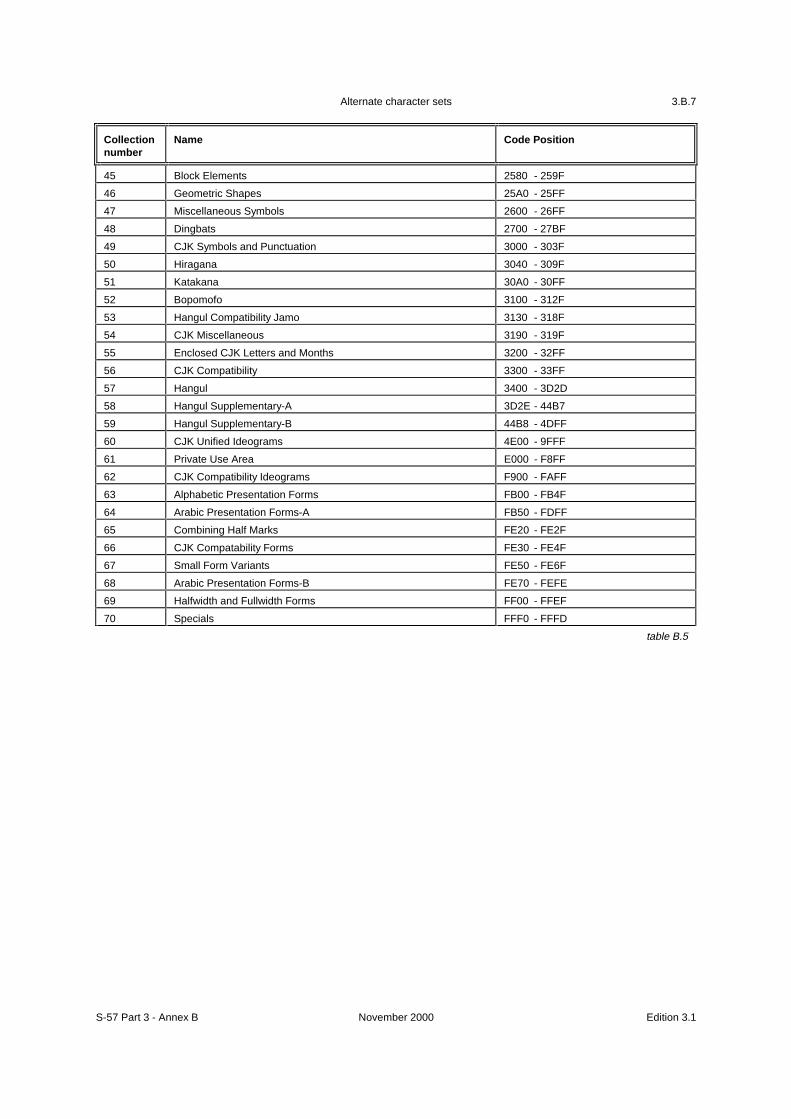
Alternate character sets
S-57 Part 3 - Annex B November 2000 Edition 3.1
3.B.7
Collectionnumber
Name Code Position
45 Block Elements 2580 - 259F
46 Geometric Shapes 25A0 - 25FF
47 Miscellaneous Symbols 2600 - 26FF
48 Dingbats 2700 - 27BF
49 CJK Symbols and Punctuation 3000 - 303F
50 Hiragana 3040 - 309F
51 Katakana 30A0 - 30FF
52 Bopomofo 3100 - 312F
53 Hangul Compatibility Jamo 3130 - 318F
54 CJK Miscellaneous 3190 - 319F
55 Enclosed CJK Letters and Months 3200 - 32FF
56 CJK Compatibility 3300 - 33FF
57 Hangul 3400 - 3D2D
58 Hangul Supplementary-A 3D2E - 44B7
59 Hangul Supplementary-B 44B8 - 4DFF
60 CJK Unified Ideograms 4E00 - 9FFF
61 Private Use Area E000 - F8FF
62 CJK Compatibility Ideograms F900 - FAFF
63 Alphabetic Presentation Forms FB00 - FB4F
64 Arabic Presentation Forms-A FB50 - FDFF
65 Combining Half Marks FE20 - FE2F
66 CJK Compatability Forms FE30 - FE4F
67 Small Form Variants FE50 - FE6F
68 Arabic Presentation Forms-B FE70 - FEFE
69 Halfwidth and Fullwidth Forms FF00 - FFEF
70 Specials FFF0 - FFFD
table B.5

Alternate character sets
Edition 3.1 November 2000 S-57 Part 3 - Annex B
3.B.8
Page intentionally left blank
INTERNATIONAL HYDROGRAPHIC ORGANIZATION
PRODUCT SPECIFICATIONfor
RASTER NAVIGATIONAL CHARTS (RNC)
1st Edition, January 1999
Special Publication No. 61
published by theInternational Hydrographic Bureau
MONACO
S-61
INTERNATIONAL HYDROGRAPHIC ORGANIZATION
PRODUCT SPECIFICATIONfor
RASTER NAVIGATIONAL CHARTS (RNC)
1st Edition, January 1999
Special Publication No. 61
published by theInternational Hydrographic Bureau
4, Quai Antoine 1erB.P. 445 - MC 98011 MONACO Cedex
Principauté de MonacoTelefax: (377) 93 10 81 40
E-mail: [email protected]: www.iho.shom.fr

Page intentionally left blank


i
FOREWORD
In December 1998, the International Maritime Organization's Maritime Safety Committee adoptedan amendment [IMO resolution MSC.86 (70)] to the then-current Performance Standards for ElectronicChart Display and Information Systems (ECDIS), adopted by IMO resolution A.817 (19), as amended byIMO resolution MSC.64 (67), which are also annexed to IHO Publication S-52.
IMO resolution MSC.86 (70) permits ECDIS equipment to operate in a Raster Chart DisplaySystem (RCDS) mode in the absence of Electronic Navigational Charts (ENC). When operating in theRCDS mode, ECDIS should be used together with an appropriate folio of up-to-date paper charts.
The RCDS mode of operation is described in a new Appendix 7 to the IMO PerformanceStandards for ECDIS. For convenience it is annexed to this publication, with the kind permission of theIMO. A key component of the RCDS mode is the Raster Navigational Chart (RNC). Section 4.1 ofAppendix 7 states that the RNC must conform to IHO standards. The necessary RNC Product Specificationwas developed by the IHO's Transfer Standard Maintenance and Application Development Working Group(TSMAD) during 1997 and 1998 and was adopted by the IHO's Committee on HydrographicRequirements and Information Systems (CHRIS) in October 1998.
__________

ii
Page intentionally left blank
iii
TABLE OF CONTENTS
1. Introduction … … … … … … … … … … … … … … … … … … … … … … … … … … … … … … … …1
2. Definitions … … … … … … … … … … … … … … … … … … … … … … … … … … … … … … … … …1
3. RNC Requirements … … … … … … … … … … … … … … … … … … … … … … … … … … … … …13.3 Image Files … … … … … … … … … … … … … … … … … … … … … … … … … … … … … .13.4 Meta-Data … … … … … … … … … … … … … … … … … … … … … … … … … … … … … ...23.5 Updates … … … … … … … … … … … … … … … … … … … … … … … … … … … … … … …3
Annex A - RCDS Mode of Operation (Appendix 7 to IMO Performance Standardsfor ECDIS)… … … … … … … … … … … … … … … … … … … … … … … … … … … … … ..
A-1

iv
Page intentionally left blank
1
1 INTRODUCTION
1.1 The elements of this product specification define the minimum requirements a RasterNavigational Chart (RNC) must have to satisfy the draft performance standard for a RasterChart Display System (RCDS).
1.2 This product specification does not define underlying raster data structures of a rasternavigational chart. The national hydrographic office producing the raster navigational chartshould select that data structure.
2 DEFINITIONS
2.1 For the purpose of this product specification:
2.1.1 Raster Chart Display System (RCDS) means a navigation information system displayingRNCs with positional information from navigation sensors to assist the mariner in routeplanning and route monitoring, and if required, display additional navigation-relatedinformation.
2.1.2 Raster Navigational Chart (RNC) means a digital facsimile of a paper nautical chart,produced by or distributed on the authority of a government authorized hydrographicoffice. RNC is used in these specifications to mean either a single chart or a collectionof charts.
2.1.3 Notice to Mariners (NtM) means a published change to an RNC produced by ordistributed under the authority of a government authorized hydrographic office.
3 RNC REQUIREMENTS
3.1 An RNC should contain an image file, which is a digital facsimile of an existing, officialpaper chart. It should also contain meta-data describing the RNC as stated in this productspecification.
3.2 The arrangement of the image data and the meta-data into one or more digital files shouldbe determined by the national hydrographic offices originating the RNC.
3.3 Image Files
3.3.1 The digital format of the image file should be determined by the national hydrographic officeproducing the RNC.
3.3.2 The resolution of the digital image (pixels-per-inch) and any method used to compress orprocess that image file should be sufficient to display clearly all information that wascontained on the original paper nautical chart. In particular, methods such as antialiasingshould be employed to achieve maximum contrast and fidelity of displayed chartinformation compared to the printed chart.
2
3.3.3 The accuracy of the digital image file, as measured by the ability to determine the correctgeographic coordinates of an individual pixel when the image file is used together with theRNC meta-data, should allow a ship’s position to be displayed at least as accurately as whenusing the original paper chart.
3.4 Meta-Data
3.4.1 The digital format of the meta-data should be determined by the national hydrographic officeoriginating the RNC.
3.4.2 The following meta-data should be included for each RNC. Where an image file containsmore than one discrete chart image, e.g. chart insets, in addition to the main panel of thechart the meta-data should be included for each such discrete chart image.
3.4.2.1 Producing agency identifier specified using the producing agency codes listed in Annex Ato Appendix A of IHO publication S-57.
3.4.2.2 RNC number.
3.4.2.3 Chart identifier (e.g. chart number) if different from the RNC.
3.4.2.4 RNC edition date.
3.4.2.5 Chart edition date and/or chart edition number.
3.4.2.6 Last update or Notice to Mariners applied.
3.4.2.7 Previous updates or Notice to Mariners applied.
3.4.2.8 Chart scale.
3.4.2.9 Orientation of north (where appropriate for the chart projection in use).
3.4.2.10Projection and associated projection parameters.
3.4.2.11Horizontal datum.
3.4.2.12 Horizontal datum shift to WGS84 or PE-90 if the chart datum is not one of those twodatums.
3.4.2.13Vertical datums.
3.4.2.14Depth and height units.
3.4.2.15Pixel resolution of the image file as measured in pixels-per-millimeter or pixels-per-inch.
3.4.2.16A mechanism, such as parameters and an algorithm, to allow geographical positions to be convertedto RNC (pixel) coordinates and vice-versa.
3
3.4.2.17Colour palettes for daytime, nighttime and dusk.
3.4.2.17.1 Colours used for daytime viewing should be those used on the paper versions of the samecharts.
3.4.2.17.2 Colours for dusk and nighttime should follow as closely as practicable the Colours andSymbols Standards specified in IHO Special Publication S-52, Appendix 2.
3.4.2.18Sufficient information which will allow each note, diagram, item of marginalia or other chart subareaof special interest to be found and displayed clearly, simply and quickly even though thatsubarea may not be located on the portion of the chart currently being displayed.
3.4.2.19Sufficient information to allow any source diagram, which provides information about data quality,to be displayed clearly, simply and quickly even though the source diagram may not belocated on the portion of the chart currently being displayed.
3.5 Updates
3.5.1 The following meta-data should be included for each RNC update. Where an RNC imagefile contains one or more discrete chart image, e.g. chart insets, in addition to the main panelof the chart, the meta-data should be sufficient to identify to which the update applies.
3.5.1.1 Producing agency identifier specified using the producing agency codes listed in Annex Ato Appendix A of the IHO publication S-57.
3.5.1.2 Update number.
3.5.1.3 Update date.
3.5.1.4 RNC to which the update applies.
3.5.1.5.1 Chart edition date to which the update applies.
3.5.1.6 Any changes to the meta-data of the RNC being updated (e.g. if a chart note changes, therelevant changes in RNC meta-data need to be included in the update).
3.5.1.7 Sufficient information to allow the update to be applied automatically to the RNC and forthe update to be displayed.
__________

4
Page intentionally left blank

A-1
ANNEX A
RCDS MODE OF OPERATION(Appendix 7 to the IMO Performance Standards for ECDIS)
Notes: 1) The RCDS Mode of Operation, adopted by IMO resolution MSC.86 (70) in December1998, is reproduced in this publication for convenience, with the kind permission of theInternational Maritime Organization, London.
2) This should be read in conjunction with the IMO Performance Standards for ECDIS,which have been reproduced in Annex B to Publication S-52, 5th Edition.
Whenever in this appendix reference is made to provisions of the Annex related to ECDIS, ECDIS shouldbe substituted by RCDS, SENC by SRNC and ENC by RNC, as appropriate.
All paragraphs of the Annex related to ECDIS are indicated as to whether they apply to RCDS, do notapply to RCDS, or are modified in order to apply to RCDS. These paragraphs are followed by additionalrequirements for ECDIS equipment in the RCDS mode.
1. INTRODUCTION
1.1 Paragraph applies to RCDS.
1.2 When operating in the RCDS mode, ECDIS equipment should be used together with anappropriate folio of up-to-date paper charts.
1.3 - 1.7 Paragraphs apply to RCDS.
1.8 RCDS should provide appropriate alarms or indications with respect to the informationdisplayed or malfunction of the equipment (see Table 1 of this Appendix).
2. DEFINITIONS
2.1 Raster Chart Display System (RCDS) means a navigation information system displayingRNCs with positional information from navigation sensors to assist the mariner in routeplanning and route monitoring, and if required, display additional navigation-relatedinformation.
2.2 Raster Nautical Chart (RNC) means a facsimile of a paper chart originated by, ordistributed on the authority of, a government-authorized hydrographic office. RNC isused in these standards to mean either a single chart or a collection of charts.
2.3 System Raster Nautical Chart Database (SRNC) means a database resulting from thetransformation of the RNC by the RCDS to include updates to the RNC by appropriatemeans.
2.4-2.5 Paragraphs do not apply to RCDS.

A-22.6 Paragraph applies to RCDS.
3. DISPLAY OF SRNC INFORMATION
3.1 Paragraph applies to RCDS.
3.2 SRNC information available for display during route planning and route monitoringshould be subdivided into two categories:
.1 the RCDS standard display consisting of RNC and its updates, including its scale,the scale at which it is displayed, its horizontal datum, and its units of depths andheights; and
.2 any other information such as mariner's notes.
3.3 Paragraph applies to RCDS.
3.4 When a RNC is displayed on the RCDS, it should provide an indication advising themariner if a more detailed (larger scale) RNC is available for the displayed area.
3.5 It should be easy to add to, or remove from, the RCDS display any information additionalto the RNC data, such as mariner's notes. It should not be possible to remove anyinformation from the RNC.
3.6 - 3.7 Paragraphs do not apply to RCDS.
3.8-3.10 Paragraphs apply to RCDS.
3.11 There should always be an indication if the ECDIS equipment is operating in the RCDSmode.
4. PROVISION AND UPDATING OF CHART INFORMATION
4.1 The RNC used in RCDS should be the latest edition of that originated by, or distributedon the authority of, a government authorized hydrographic office and conform to IHOstandards. RNCs not on WGS-84 or PE-90 should carry meta-data (i.e., additional data)to allow geo-referenced positional data to be displayed in the correct relationship toSRNC data.
4.2 The contents of the SRNC should be adequate and up-to-date for that part of the intendedvoyage not covered by ENC.
4.3- 4.8 All paragraphs apply to RCDS.
5. SCALE
This section applies to RCDS.

A-3
6. DISPLAY OF OTHER NAVIGATIONAL INFORMATION
6.1-6.3 All paragraphs apply to RCDS.
7. DISPLAY MODE AND GENERATION OF THE NEIGHBOURING AREA
7.1 It should always be possible to display the SRNC in "chart-up" orientation. Otherorientations are permitted.
7.2-7.4 All paragraphs apply to RCDS.
8. COLOURS AND SYMBOLS
8.1 IHO recommended colours and symbols should be used to represent SRNC information.
8.2 Paragraph applies to RCDS.
8.3 Paragraph does not apply to RCDS.
8.4 Paragraph applies to RCDS.
9. DISPLAY REQUIREMENTS
9.1-9.2 Paragraphs apply to RCDS.
9.3 Paragraph does not apply to RCDS.
9.4 Paragraph applies to RCDS.
9.5 RCDS should be capable of displaying, simply and quickly, chart notes which are notlocated on the portion of the chart currently being displayed.
10. ROUTE PLANNING, MONITORING AND VOYAGE RECORDING
10.1-10.2 Paragraphs apply to RCDS.
10.3 Paragraph does not apply to RCDS.
10.4 Route Planning
10.4.1-.10.4.3 Paragraphs apply to RCDS.
10.4.4-.10.4.5 Paragraphs do not apply to RCDS.
10.4.6 Paragraph applies to RCDS.
10.4.7 It should be possible for the mariner to enter points, lines and areas which activate anautomatic alarm. The display of these features should not degrade the SRNC informationand it should be clearly distinguishable from the SRNC information.

A-4
10.5 Route monitoring
10.5.1 Paragraph applies to RCDS.
10.5.2 It should be possible to display a sea area that does not have the ship on the display (e.g. for look ahead, route planning), while route monitoring. If this is done on the displayused for route monitoring, the automatic route monitoring functions in 10.4.6 and 10.4.7should be continuous. It should be possible to return to the route monitoring displaycovering own ship's position immediately by single operator action.
10.5.3-10.5.4 Paragraphs do not apply to RCDS.
10.5.5-10.5.8 Paragraphs apply to RCDS.
10.5.9 The RCDS should only accept data referenced to the WGS-84 or PE-90 geodetic datum.RCDS should give an alarm if the positional data is not referenced to one of these datums.
10.5.10-10.5.13 Paragraphs apply to RCDS.
10.5.14 RCDS should allow the user to manually align the SRNC with positional data. This canbe necessary, for example, to compensate for local charting errors.
10.5.15 It should be possible to activate an automatic alarm when the ship crosses a point, line,or is within the boundary of a mariner-entered feature within a specified time or distance.
10.6 Voyage recording 10.6.1-10.6.4 All paragraphs apply to RCDS.
11. ACCURACY
11.1-11.2 All paragraphs apply to RCDS.
12. CONNECTIONS WITH OTHER EQUIPMENT
12.1-12.2 All paragraphs apply to RCDS.
13. PERFORMANCE TESTS, MALFUNCTION ALARMS AND INDICATIONS
13.1-13.2 All paragraphs apply to RCDS.
14. BACK-UP ARRANGEMENTS
All paragraphs apply to RCDS.
15. POWER SUPPLY
15.1-15.2 All paragraphs apply to RCDS.
Table 1
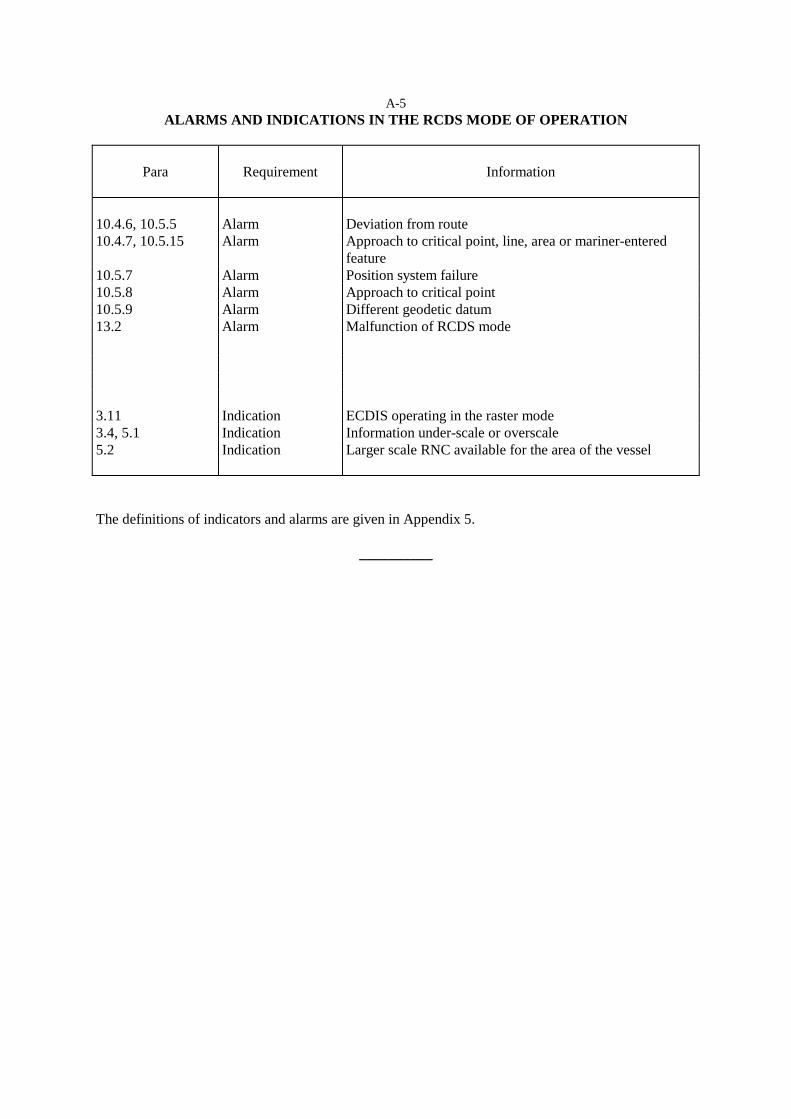
A-5ALARMS AND INDICATIONS IN THE RCDS MODE OF OPERATION
Para Requirement Information
10.4.6, 10.5.5 Alarm Deviation from route10.4.7, 10.5.15 Alarm Approach to critical point, line, area or mariner-entered
feature10.5.7 Alarm Position system failure10.5.8 Alarm Approach to critical point10.5.9 Alarm Different geodetic datum13.2 Alarm Malfunction of RCDS mode
3.11 Indication ECDIS operating in the raster mode3.4, 5.1 Indication Information under-scale or overscale5.2 Indication Larger scale RNC available for the area of the vessel
The definitions of indicators and alarms are given in Appendix 5.
__________

A-6
Page intentionally left blank
S-63 Edition 1.1 i
INTERNATIONAL HYDROGRAPHIC ORGANISATION
IHO DATA PROTECTION SCHEME
Edition 1.1 – March 2008
Special Publication No. 63
Published by the International Hydrographic Bureau
MONACO

S-63 Edition 1.1 ii
Page intentionally left blank
S-63 Edition 1.1 iii
INTERNATIONAL HYDROGRAPHIC ORGANISATION
IHO DATA PROTECTION SCHEME
Edition 1.1 – March 2008
Special Publication S-63
Published by the International Hydrographic Bureau
4, Quai Antoine 1er B.P 445 - MC 98011 MONACO Cedex
Principality of Monaco Tel: +(377) 93 10 81 00
Telefax: +(377) 93 10 81 40 E-mail: [email protected]
Web: www.iho.int

S-63 Edition 1.1 iv
Page intentionally left blank

IHO S-63 Data Protection Scheme
S-63 Edition 1.1 v
PREFACE Copyright infringement and data piracy are pervasive problems of the digital era. Electronic Navigational Charts (ENC) are not exempt from these issues. As well as the economic impact, the unofficial distribution of nautical information also gives rise to significant safety concerns. As a result, the publishers of official nautical information have sought to protect their data and provide the mariner with a certificate of authenticity through the adoption of a security schema. In September 2000, IHO Member States were polled on their views on developing a single IHO Recommended Security Scheme (RSS) (see: IHB Circular Letter 38/2000). Responses indicated that a large majority of the Member States wished to have their ENC data encrypted and agreed that the IHO should adopt a single RSS (see: IHB CL 15/2001 Rev.1). A majority of the Member States responding also supported the adoption of the Primar Security Scheme as the IHO RSS, as it was at the time the de facto standard for ENC protection and the majority of ECDIS manufacturers had already developed the necessary decryption facilities in their systems. The IHO Committee on Hydrographic Requirements for Information Systems (CHRIS), at its 13th meeting (Athens, Greece, September 2001), revisited the issue of a RSS and agreed that a small advisory expert group investigate the implications of IHB becoming the security scheme administrator for a RSS and assuming responsibility for the maintenance of a RSS. The Data Protection Scheme Advisory Group (DPSWG) reported back to the IHB in January 2002 that there were no technical implications to the IHB becoming the security scheme administrator and that the level of effort to administer the security scheme would be limited and within the IHB resources. The DPSWG further provided a plan to develop an IHO RSS Version 1, based on the Primar Security Scheme. This Report was endorsed by CHRIS Members in February 2002 and the DPSWG was tasked to develop Version 1 of an IHO RSS. The results were presented to CHRIS, at its 14th meeting (Shanghai, China, August 2002), which recommended that the ENC Security Scheme, as developed by the DPSWG, be submitted to IHO Member States for adoption as an IHO RSS, and that the role as Security Scheme Administrator be transferred to the IHB. These proposals (see: IHB CL 44/2002) were approved by a majority of Member States (see: IHB CL 66/2002). As a result, Edition 1.0 of the IHO Data Protection Scheme was issued in October 2003 as Publication S-63. The 18th CHRIS meeting (Cairns, Australia, September 2006) tasked the DPSWG to develop a revised edition of S-63 with the following guidance:
• There would be no introduction of new features; changes would be kept to a minimum. • Published S-63 guidelines would be included in the standard. • S-63 would be reorganized to group issues specific to the IHB as Scheme Administrator, Data
Servers, and OEMs. • There would be a more precise description of the correct implementation of the IHO standard.
Accordingly, a draft Edition 1.1 of S-63 was prepared by DPSWG and endorsed by CHRIS at its 19th meeting (Rotterdam, Netherlands, November 2007). This was subsequently endorsed by Member States. Edition 1.1 therefore supersedes the previous edition. This new edition includes supporting documentation, test data and a method to supply ENCs using “Large Media Support”. Changes to this Standard, as well as any further developments, will be coordinated by the DPSWG under CHRIS Guidance. The IHB Directing Committee thanks all the contributors to this new edition of the IHO Data Protection Scheme; especially from DPSWG members, the Electronic Chart Centre of Norway, and the United Kingdom Hydrographic Office.
Captain Robert WARD Director, IHB

IHO S-63 Data Protection Scheme
S-63 Edition 1.1 vi
Page intentionally left blank
IHO S-63 Data Protection Scheme
S-63 Edition 1.1 vii
TABLE OF CONTENTS
GLOSSARY........................................................................................................................................................1 1 INTRODUCTION.........................................................................................................................................3
1.1 GENERAL DESCRIPTION..........................................................................................................................3 1.2 PARTICIPANTS IN THE SCHEME................................................................................................................3
1.2.1 Scheme Administrator...................................................................................................................4 1.2.2 Data Servers .................................................................................................................................4 1.2.3 Data Clients ..................................................................................................................................4 1.2.4 Original Equipment Manufacturers (OEM)....................................................................................4 1.2.5 S-63 Participant Relationships......................................................................................................4
1.3 REFERENCES .........................................................................................................................................5 1.4 COMPATIBILITY WITH PREVIOUS VERSIONS ..............................................................................................5 1.5 DOCUMENT STRUCTURE .........................................................................................................................6 1.6 MAINTENANCE........................................................................................................................................6 1.7 SUPPORT ...............................................................................................................................................6
2 DATA COMPRESSION ..............................................................................................................................7 2.1 OVERVIEW .............................................................................................................................................7 2.2 COMPRESSION ALGORITHM.....................................................................................................................7 2.3 COMPRESSED FILES ...............................................................................................................................7
3 DATA ENCRYPTION..................................................................................................................................9 3.1 WHAT DATA IS ENCRYPTED? ...................................................................................................................9 3.2 HOW IS IT ENCRYPTED? ..........................................................................................................................9
3.2.1 Encryption of ENC Information .....................................................................................................9 3.2.2 Encryption of Other Protection Scheme Information ....................................................................9 3.2.3 Encryption Algorithm – Blowfish ...................................................................................................9
4 DATA LICENCING................................................................................................................................... 11 4.1 INTRODUCTION .................................................................................................................................... 11 4.2 THE USERPERMIT................................................................................................................................ 11
4.2.1 Definition of Userpermit ............................................................................................................. 12 4.2.2 HW_ID Format ........................................................................................................................... 12 4.2.3 Check Sum (CRC) Format......................................................................................................... 12 4.2.4 M_ID Format .............................................................................................................................. 12 4.2.5 M_KEY Format .......................................................................................................................... 13
4.3 THE CELL PERMIT ............................................................................................................................... 13 4.3.1 The Permit File (PERMIT.TXT).................................................................................................. 13 4.3.2 The Permit File - Header Formats ............................................................................................. 14 4.3.3 Permit Record Fields ................................................................................................................. 14 4.3.4 Definition of the Cell Permit ....................................................................................................... 14 4.3.5 Cell Permit Format ..................................................................................................................... 15 4.3.6 Additional Licence File (Optional) .............................................................................................. 16
5 DATA AUTHENTICATION ...................................................................................................................... 17 5.1 INTRODUCTION TO DATA AUTHENTICATION AND INTEGRITY CHECKING ................................................... 17
5.1.1 SA Verification ........................................................................................................................... 18 5.1.2 Data Integrity.............................................................................................................................. 19
5.2 DIGITAL CERTIFICATES (SA AUTHENTICATION)...................................................................................... 19 5.2.1 The SA Public Key ..................................................................................................................... 19 5.2.2 New Data Servers...................................................................................................................... 20
5.3 DIGITAL SIGNATURES (VERIFY DATA INTEGRITY) ................................................................................... 20 5.3.1 Technical Overview of Digital Signatures .................................................................................. 20 5.3.2 ENC Signature File Naming Convention ................................................................................... 20 5.3.3 Storage of the ENC Signature File ............................................................................................ 21
5.4 DATA AUTHENTICATION FILE FORMATS................................................................................................. 21 5.4.1 File Elements ............................................................................................................................. 21
5.4.1.1 Element Header and Data String Formatting ..................................................................... 22
IHO S-63 Data Protection Scheme
S-63 Edition 1.1 viii
5.4.2 Examples of File, Certificate and Signature Formats ................................................................ 22 5.4.2.1 PQG Format ....................................................................................................................... 22 5.4.2.2 The X (Private Key) Format ................................................................................................ 22 5.4.2.3 The Y (IHO or Data Server Public Key) Format ................................................................. 23 5.4.2.4 The SA Digital Certificate (X509v3) Format ....................................................................... 23 5.4.2.5 The Self Signed Key (SSK) Format.................................................................................... 23 5.4.2.6 The SA Signed DS Certificate File Format ......................................................................... 24 5.4.2.7 The ENC Signature File Format ......................................................................................... 24
6 DATA MANAGEMENT ............................................................................................................................ 25 6.1 INTRODUCTION .................................................................................................................................... 25 6.2 ENC PRODUCT LISTING (PRODUCTS.TXT) ....................................................................................... 25
6.2.1 Product List File Structure.......................................................................................................... 26 6.2.2 Product List Header ................................................................................................................... 26 6.2.3 Product List ‘ENC’ Section......................................................................................................... 27
6.2.3.1 Managing Cancelled Cells (Data Servers) ......................................................................... 28 6.2.3.2 Managing Cancelled Cells (Data Clients)........................................................................... 28 6.2.3.3 Cancelled ENC Cell Replacements.................................................................................... 29
6.2.4 Product List ‘ECS’ Section......................................................................................................... 29 6.3 SERIAL FILE (SERIAL.ENC)................................................................................................................ 29
6.3.1 SERIAL.ENC File Format .......................................................................................................... 30 6.4 THE S-57 CATALOGUE FILE (CATALOG.031)...................................................................................... 30
6.4.1 The CATD-COMT Structure and Format ................................................................................... 31 6.4.1.1 Encoding Cancelled Cells (see also sections 6.2.3 & 6.2.3.1) ........................................... 31
6.5 ENC UPDATE MANAGEMENT................................................................................................................ 31 6.5.1 STATUS.LST File ...................................................................................................................... 32
6.5.1.1 Status Header Format ........................................................................................................ 32 6.5.1.2 Status Record Format......................................................................................................... 32
6.6 THE S-57 README FILE (README.TXT) ............................................................................................ 33 7 DIRECTORY AND FILE STRUCTURE ................................................................................................... 35
7.1 INTRODUCTION .................................................................................................................................... 35 7.2 S-57 FILE MANAGEMENT ..................................................................................................................... 35 7.3 FILE STRUCTURE................................................................................................................................. 35 7.4 FOLDER AND FILE NAMING ................................................................................................................... 35 7.5 EXCHANGE SET MEDIA ........................................................................................................................ 35
7.5.1 CD-ROM .................................................................................................................................... 35 7.5.1.1 Folder Definitions................................................................................................................ 36
7.5.2 Large Media Support ................................................................................................................. 36 7.5.3 On-Line Services ....................................................................................................................... 36
8 SCHEME ADMINISTRATOR PROCESSES ........................................................................................... 37 8.1 DATA PROTECTION SCHEME ADMINISTRATOR ....................................................................................... 37 8.2 SCHEME ADMINISTRATOR PROCESSES ................................................................................................. 37 8.3 CREATE TOP LEVEL KEY PAIR.............................................................................................................. 37
8.3.1 Create PQG Parameters............................................................................................................ 37 8.3.2 Create Private Key..................................................................................................................... 38 8.3.3 Create Public Key ...................................................................................................................... 38
8.4 CREATE AND ISSUE SA DIGITAL CERTIFICATE (X509V3) ....................................................................... 38 8.4.1 Update SA X509v3 Digital Certificate (Public Key) ................................................................... 38
8.5 PROCESS APPLICATIONS FROM DATA SERVERS & OEMS...................................................................... 39 8.5.1 Process Data Server Request for Data Server Certificate ........................................................ 39
8.5.1.1 Authenticate Self Signed Key (SSK) File............................................................................ 39 8.5.1.2 Create Data Server Certificate ........................................................................................... 39 8.5.1.3 Authenticate SA signed Data Server Certificate................................................................. 39 8.5.1.4 Manage Data Server Certificates ....................................................................................... 40
8.5.2 Process OEM Application .......................................................................................................... 40 8.5.2.1 Issue and Manage S-63 Manufacturer Codes.................................................................... 40 8.5.2.2 Issue M_ID and M_KEY listings to Data Servers ............................................................... 40
8.6 S-63 TEST DATA ................................................................................................................................. 40 8.7 SCHEME ADMINISTRATOR – SECURITY QA PROCEDURES...................................................................... 41
IHO S-63 Data Protection Scheme
S-63 Edition 1.1 ix
8.7.1 Documentation........................................................................................................................... 41 8.7.2 Administration of Confidentiality Agreement.............................................................................. 41 8.7.3 Audit of Security Registers......................................................................................................... 41 8.7.4 Creation of M_IDs and M_KEYs................................................................................................ 41 8.7.5 Creation of Digital Signature Keys (Private and Public Keys) ................................................... 41 8.7.6 Acceptance of Self Signed Keys (SSK) ..................................................................................... 41 8.7.7 Creation of Data Server (DS) Certificates.................................................................................. 41 8.7.8 Creation of Random Strings....................................................................................................... 42 8.7.9 Handover of M_ID and M_KEY.................................................................................................. 42
9 DATA SERVER PROCESSES ................................................................................................................ 43 9.1 OVERVIEW .......................................................................................................................................... 43 9.2 DATA SERVER PROCESSES.................................................................................................................. 43 9.3 CERTIFICATION PROCESSES ................................................................................................................ 43
9.3.1 Produce Public/Private Key Pair ................................................................................................ 43 9.3.1.1 Create PQG Signature Parameters.................................................................................... 44 9.3.1.2 Create Private Key File....................................................................................................... 44 9.3.1.3 Create Public Key File ........................................................................................................ 44
9.3.2 Create Data Server Self Signed Key (SSK)............................................................................... 44 9.3.2.1 Sign Public Key and Generate SSK ................................................................................... 45 9.3.2.2 Authenticate/Validate Data Server SSK ............................................................................. 45 9.3.2.3 Store Self Signed Key......................................................................................................... 45
9.3.3 Validate Certificates ................................................................................................................... 45 9.3.3.1 Authenticate X509 SA Digital Certificate ............................................................................ 45 9.3.3.2 Authenticate SA signed Data Server Certificate................................................................. 45 9.3.3.3 Store SA Signed Data Server Certificate............................................................................ 46
9.4 DATA MANAGEMENT PROCESSES......................................................................................................... 46 9.5 ENCRYPTION, COMPRESSION AND ENC SIGNING PROCESSES............................................................... 46
9.5.1 Management of Encryption Cell Keys (ECK)............................................................................. 46 9.5.1.1 Cell Key Format .................................................................................................................. 47
9.5.2 Compress ENC file (base or update files) ................................................................................. 47 9.5.3 Encrypt ENC Files...................................................................................................................... 47
9.5.3.1 Base Cell File...................................................................................................................... 47 9.5.3.2 ENC Update File................................................................................................................. 48
9.5.4 Sign ENC File (Base Cell or Update)......................................................................................... 48 9.5.5 Issue S-63 Encrypted ENC Data ............................................................................................... 48
9.6 LICENSING PROCESSES ....................................................................................................................... 48 9.6.1 Decrypt User Permit................................................................................................................... 48 9.6.2 Create Cell Permit...................................................................................................................... 49 9.6.3 Issue ENC Licences................................................................................................................... 51
9.7 SECURITY QA PROCEDURES – DATA SERVER ...................................................................................... 51 9.7.1 Data Protection Scheme Information......................................................................................... 51 9.7.2 System Compliance Testing ...................................................................................................... 51 9.7.3 Storage of M_IDs and M_KEYs................................................................................................. 51 9.7.4 Acceptance and Checking of the SA Digital Certificate (and Public Key) ................................. 51 9.7.5 Creation of Digital Signature Keys (Private and Public keys).................................................... 51 9.7.6 Acceptance of the Data Server Certificate from the SA ............................................................ 51 9.7.7 Creation of Cell Keys ................................................................................................................. 51 9.7.8 Compression, Encryption and Signing S-57 data...................................................................... 51 9.7.9 Creation of Random Values....................................................................................................... 52 9.7.10 Creation of Cell Permits ............................................................................................................. 52 9.7.11 Decryption of User Permits ........................................................................................................ 52
10 OEM AND DATA CLIENT PROCESSES................................................................................................ 53 10.1 DATA CLIENTS ................................................................................................................................. 53 10.2 ORIGINAL EQUIPMENT MANUFACTURERS (OEMS)............................................................................. 53 10.3 OEM & DATA CLIENT PROCESSES ................................................................................................... 53 10.4 CREATE DATA CLIENT USERPERMIT.................................................................................................. 54 10.5 ENC CELL PERMIT INSTALLATION..................................................................................................... 54
10.5.1 Check for a Cell Permit File ....................................................................................................... 54 10.5.2 Check Cell Permit Format.......................................................................................................... 55

IHO S-63 Data Protection Scheme
S-63 Edition 1.1 x
10.5.3 Check the HW_ID ...................................................................................................................... 55 10.5.4 Check Cell Permit Check Sum................................................................................................... 55 10.5.5 Check Cell Permit Expiry Date................................................................................................... 55 10.5.6 Check Data Server ID ................................................................................................................ 56
10.6 ENC AUTHENTICATION AND INTEGRITY CHECKS................................................................................ 57 10.6.1 Authenticate/Verify SA Digital Certificate................................................................................... 57
10.6.1.1 Manual Checking of the SA Public Key .............................................................................. 57 10.6.2 Authenticate SA signed Data Server Certificate........................................................................ 58
10.6.2.1 Authentication against non-SA signed Data Server Certificate.......................................... 59 10.6.3 Authenticate ENC Cell File ........................................................................................................ 60
10.7 DECRYPT ENC BASE CELL AND UPDATE FILES ................................................................................. 60 10.7.1 Check Subscription Status of Installed Permits......................................................................... 60
10.7.1.1 Check if Subscription has expired in a Cell Permit – Required Warning ........................... 60 10.7.1.2 Check Subscription Status – Required 30 day warning ..................................................... 62
10.7.2 Decrypt the Cell Keys in a Cell Permit....................................................................................... 62 10.7.3 Decrypt ENC Base Cell or Update File...................................................................................... 62 10.7.4 Decompress ENC file (base cell or update)............................................................................... 63
10.8 DATA CLIENT PERMANENT WARNINGS .............................................................................................. 63 10.8.1 Expired ENC Permits ................................................................................................................. 64 10.8.2 Out-of Date SENC Data............................................................................................................. 64
10.9 QA PROCEDURES – DATA CLIENT .................................................................................................... 64 10.9.1 Acceptance and Checking of the SA Digital Certificate (and Public Key) ................................. 64 10.9.2 Creation of User Permit ............................................................................................................. 64 10.9.3 Verification of Data Server Certificate........................................................................................ 64 10.9.4 Validation of Cell Permits........................................................................................................... 64 10.9.5 Authentication and Decryption of ENC Information ................................................................... 65
10.10 QA PROCEDURES – MANUFACTURERS (OEMS) ................................................................................ 65 10.10.1 Confidentiality Agreement ...................................................................................................... 65 10.10.2 System Compliance Testing .................................................................................................. 65 10.10.3 Storage of M_IDs and M_KEYs ............................................................................................. 65 10.10.4 Creation of HW_IDs ............................................................................................................... 65 10.10.5 Recording of HW_IDs............................................................................................................. 65
11 S-63 ERROR CODES AND EXPLANATIONS........................................................................................ 67 S-63 ANNEX A ................................................................................................................................................ 71 1 PURPOSE................................................................................................................................................ 73 2 RESPONSIBILITY.................................................................................................................................... 73
2.1 NEED FOR DATA SERVER CERTIFICATE ................................................................................................ 73 2.2 HYDROGRAPHIC OFFICES AND RENC ORGANISATIONS......................................................................... 73 2.3 NON-HYDROGRAPHIC OFFICES AND NON-RENC ORGANISATIONS ........................................................ 73 2.4 INTERNATIONAL HYDROGRAPHIC BUREAU............................................................................................. 73
3 DEFINITIONS........................................................................................................................................... 73 3.1 REFERENCES ...................................................................................................................................... 73
4 PROCEDURE........................................................................................................................................... 73 4.1 COMPLETION OF FORMS AND ATTACHMENTS ........................................................................................ 73 4.2 NEED FOR ENDORSEMENT ................................................................................................................... 74 4.3 ENDORSING ORGANISATION................................................................................................................. 74 4.4 SUBMISSION OF REQUEST TO IHB........................................................................................................ 74 4.5 VALIDATION OF CERTIFICATE REQUEST ................................................................................................ 74 4.6 CREATION OF DATA SERVER CERTIFICATE............................................................................................ 74
5 QUALITY METRICS................................................................................................................................. 74 S-63 ANNEX B ................................................................................................................................................ 77 1 PURPOSE................................................................................................................................................ 79 2 RESPONSIBILITY.................................................................................................................................... 79
2.1 OEMS ................................................................................................................................................ 79
IHO S-63 Data Protection Scheme
S-63 Edition 1.1 xi
2.2 INTERNATIONAL HYDROGRAPHIC BUREAU............................................................................................. 79 3 DEFINITIONS........................................................................................................................................... 79
3.1 REFERENCES ...................................................................................................................................... 79 4 PROCEDURE........................................................................................................................................... 79
4.1 COMPLETION OF REQUEST FORM......................................................................................................... 79 4.2 VERIFICATION OF REQUEST FORM........................................................................................................ 80 4.3 VERIFICATION OF SIGNED CONFIDENTIALITY AGREEMENT...................................................................... 80 4.4 CONFIRM SUCCESSFUL TESTING WITH S-63 TEST DATA ........................................................................ 80 4.5 CHECK OEM HAS NO CURRENT M_ID AND M_KEY.............................................................................. 80 4.6 CREATION OF M_ID AND M_KEY......................................................................................................... 80 4.7 INFORM ABOUT NEW M_ID AND M_KEY.............................................................................................. 80 4.8 INFORM OEM ABOUT PROBLEM WITH REQUEST .................................................................................... 80
5 QUALITY METRICS................................................................................................................................. 80 S-63 APPENDIX 1 [S-63 TEST DATA SET] .................................................................................................. 83 1 INTRODUCTION...................................................................................................................................... 85 2 ORGANISATION OF THE TEST DEFINITIONS AND TEST DATA....................................................... 85
2.1 TEST DEFINITIONS ............................................................................................................................... 85 2.2 TEST DATA .......................................................................................................................................... 85 2.3 CONDITIONS OF USE FOR THE TEST DATA............................................................................................. 86
5.1.1 2.3.1 Conditions of Release....................................................................................................... 86 5.1.2 2.3.2 Disclaimer ......................................................................................................................... 86
S-63 APPENDIX 2 [LARGE MEDIA SUPPORT] ........................................................................................... 87 1 INTRODUCTION...................................................................................................................................... 89 2 MEDIA OVERVIEW.................................................................................................................................. 89
2.1 MEDIA TYPES ...................................................................................................................................... 89 2.2 MEDIA FOLDER AND FILE STRUCTURE .................................................................................................. 89
2.2.1 Additional Media File.................................................................................................................. 90 2.3 MEDIA IDENTIFICATION......................................................................................................................... 90
2.3.1 Media Labelling.......................................................................................................................... 90 3 MEDIA FILE FORMATS .......................................................................................................................... 90
3.1 PRODUCT LISTING (PRODUCTS.TXT)................................................................................................ 90 3.2 MEDIA LISTING (MEDIA.TXT).............................................................................................................. 90
3.2.1 Header Format........................................................................................................................... 91 3.2.2 Media Record Format ................................................................................................................ 91
4 MEDIA MANAGEMENT (DATA SERVERS)........................................................................................... 92 5 MEDIA MANAGEMENT (DATA CLIENTS)............................................................................................. 93
5.1 MEDIA WARNINGS ............................................................................................................................... 93

IHO S-63 Data Protection Scheme
S-63 Edition 1.1 xii
Page intentionally left blank
IHO S-63 Data Protection Scheme
S-63 Edition 1.1 Friday, 11 April 2008 1
GLOSSARY Glossary of S-63 Data Protection Scheme Terms Blowfish Encryption algorithm used by the protection scheme Cell Key Key used to produce encrypted ENC, and required to decrypt the encrypted ENC
information. Cell Permit Encrypted form of Cell key, created specifically for a particular user. Data Client Term used to represent an end-user receiving the encrypted ENC information. The Data
Client will be using a software application (e.g. ECDIS) to perform many of the operations detailed within the scheme. Typically, an ECDIS user.
Data Server Term used to represent an organisation producing encrypted ENCs or issuing Cell Permits to end-users.
M_ID The unique identifier assigned by the SA to each manufacture. Data Servers use this to identify which M_KEY to use when decrypting the Userpermit.
M_KEY ECDIS manufacturer’s unique identification key provided by the Scheme Administrator to the OEM. It is used by OEMs to encrypt the HW_ID when creating a userpermit.
HW_ID The unique identifier assigned by an OEM to each implementation of their system. This value is encrypted using the OEM’s unique M_KEY and supplied to the data client as a userpermit. This method allows data clients to purchase licences to decrypt ENC cells.
SA Scheme Administrator SHA-1 Secure Hash Algorithm [3] SSK Self Signed Key (Self Signed Certificate File) User Permit Encrypted form of HW-ID uniquely identifying the ECDIS system
Chart Related Terms ECDIS Electronic Chart Display and Information System as defined by IMO ENC Electronic Navigational Chart as defined by the ENC Product Specification [1]. S-57 Transfer standard for ENC defined by IHO SENC System-ENC (This is the internal format that OEMs convert to when importing data)
Organisations ECC Electronic Chart Centre AS (www.ecc.as) HO Hydrographic Office (e.g. Data Server) IHB International Hydrographic Bureau IHO International Hydrographic Organisation IMO International Maritime Organisation RENC Regional ENC Coordinating Centre integrating ENCs from several HOs into a single
service (e.g. Data Server) UKHO United Kingdom Hydrographic Office (www.ukho.gov.uk)
Computing Terms CRC Cyclic Redundancy Check Dongle Sometimes referred to as a hard lock device, It is a hardware device supplied by the
OEMs that has the unique system identifier (HW_ID) stored securely within. XOR Exclusive OR

IHO S-63 Data Protection Scheme
S-63 Edition 1.1 2
Page intentionally left blank
IHO S-63 Data Protection Scheme
S-63 Edition 1.1 3
1 INTRODUCTION The publication “S-63 IHO Data Protection Scheme”, later referred to as ‘the scheme’, describes the recommended standard for the protection of ENC information. It defines security constructs and operating procedures that must be followed to ensure that the data protection scheme is operated correctly and to provide specifications that allow participants to build S-63 compliant systems and distribute data in a secure and commercially viable manner. The Data Protection Scheme was prepared by the International Hydrographic Organisation's (IHO) Data Protection Scheme Advisory Group (DPSWG). The S-63 standard is based on the protection scheme developed and operated by Primar and Primar-Stavanger as part of their protected ENC service. The Electronic Chart Centre AS and United Kingdom Hydrographic Office were the original contributing organisations. The Standard was adopted as the official IHO standard, by the IHO member states in December 2002 (IHO CL 66, 2002). It defines the roles and responsibilities for protecting ENC data produced by National Hydrographic Offices and distributed to customers with ECS/ECDIS systems.
1.1 General Description This document specifies a method of securing ENC information and maintaining the integrity of an ENC service with multiple data services serving a large customer base. The purpose of data protection is threefold: 1. Piracy Protection: To prevent unauthorised use of data by encrypting the ENC information. 2. Selective Access: To restrict access to ENC information to only those cells that a customer has
been licenced for. 3. Authentication: To provide assurance that the ENC data has come from approved sources
Piracy protection and selective access are achieved by encrypting the ENC information and providing cell permits to decrypt them. Data Servers will encrypt ENC data provided by producer nations before supplying it to the Data Client. The encrypted ENC is then decrypted by the ECS/ECDIS prior to being reformatted and imported into the systems SENC. Authentication is provided by means of digital signatures within the data. The scheme does not specifically address how ENC or SENC information can be protected once it is within an end-user application. This is the responsibility of the OEMs. The scheme allows for the mass distribution of encrypted ENCs on hard media (e.g. CD-ROM or DVD) and can be accessed and used by all customers with a valid licence containing a set of permits. Selective access to individual cells is supported by providing users with a licenced set of permits containing the encrypted cell keys. This licence is created using a unique hardware identifier of the system and is unique to each Data Client. Consequently licences cannot be exchanged between individual Data Clients. The scheme uses a compression algorithm to reduce the size of the dataset. Unencrypted ENC data contains many repeating patterns of information, e.g. coordinate information. Compression is therefore always applied before the ENC information is encrypted and uncompressed after the decryption on the data client system (normally an ECS/ECDIS).
1.2 Participants in the Scheme There are several types of users of the scheme, these are as follows:
• The Scheme Administrator (SA), of which there is only one. • The Data Server (DS), of which there can be many. • The Data Client (DC), of which there are many. • The Original Equipment Manufacturer (OEM) of which there are many.
A more detailed explanation of these terms is given below.
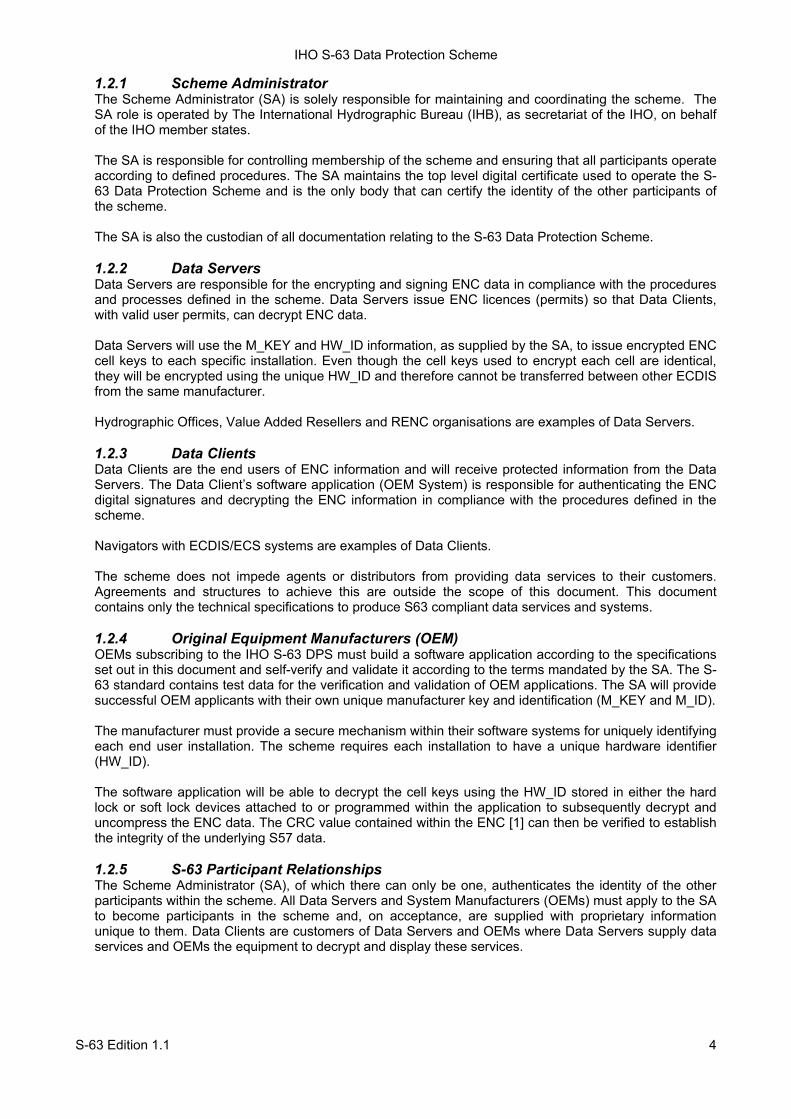
IHO S-63 Data Protection Scheme
S-63 Edition 1.1 4
1.2.1 Scheme Administrator The Scheme Administrator (SA) is solely responsible for maintaining and coordinating the scheme. The SA role is operated by The International Hydrographic Bureau (IHB), as secretariat of the IHO, on behalf of the IHO member states.
The SA is responsible for controlling membership of the scheme and ensuring that all participants operate according to defined procedures. The SA maintains the top level digital certificate used to operate the S-63 Data Protection Scheme and is the only body that can certify the identity of the other participants of the scheme.
The SA is also the custodian of all documentation relating to the S-63 Data Protection Scheme. 1.2.2 Data Servers Data Servers are responsible for the encrypting and signing ENC data in compliance with the procedures and processes defined in the scheme. Data Servers issue ENC licences (permits) so that Data Clients, with valid user permits, can decrypt ENC data. Data Servers will use the M_KEY and HW_ID information, as supplied by the SA, to issue encrypted ENC cell keys to each specific installation. Even though the cell keys used to encrypt each cell are identical, they will be encrypted using the unique HW_ID and therefore cannot be transferred between other ECDIS from the same manufacturer. Hydrographic Offices, Value Added Resellers and RENC organisations are examples of Data Servers. 1.2.3 Data Clients Data Clients are the end users of ENC information and will receive protected information from the Data Servers. The Data Client’s software application (OEM System) is responsible for authenticating the ENC digital signatures and decrypting the ENC information in compliance with the procedures defined in the scheme. Navigators with ECDIS/ECS systems are examples of Data Clients.
The scheme does not impede agents or distributors from providing data services to their customers. Agreements and structures to achieve this are outside the scope of this document. This document contains only the technical specifications to produce S63 compliant data services and systems. 1.2.4 Original Equipment Manufacturers (OEM) OEMs subscribing to the IHO S-63 DPS must build a software application according to the specifications set out in this document and self-verify and validate it according to the terms mandated by the SA. The S-63 standard contains test data for the verification and validation of OEM applications. The SA will provide successful OEM applicants with their own unique manufacturer key and identification (M_KEY and M_ID).
The manufacturer must provide a secure mechanism within their software systems for uniquely identifying each end user installation. The scheme requires each installation to have a unique hardware identifier (HW_ID).
The software application will be able to decrypt the cell keys using the HW_ID stored in either the hard lock or soft lock devices attached to or programmed within the application to subsequently decrypt and uncompress the ENC data. The CRC value contained within the ENC [1] can then be verified to establish the integrity of the underlying S57 data. 1.2.5 S-63 Participant Relationships The Scheme Administrator (SA), of which there can only be one, authenticates the identity of the other participants within the scheme. All Data Servers and System Manufacturers (OEMs) must apply to the SA to become participants in the scheme and, on acceptance, are supplied with proprietary information unique to them. Data Clients are customers of Data Servers and OEMs where Data Servers supply data services and OEMs the equipment to decrypt and display these services.
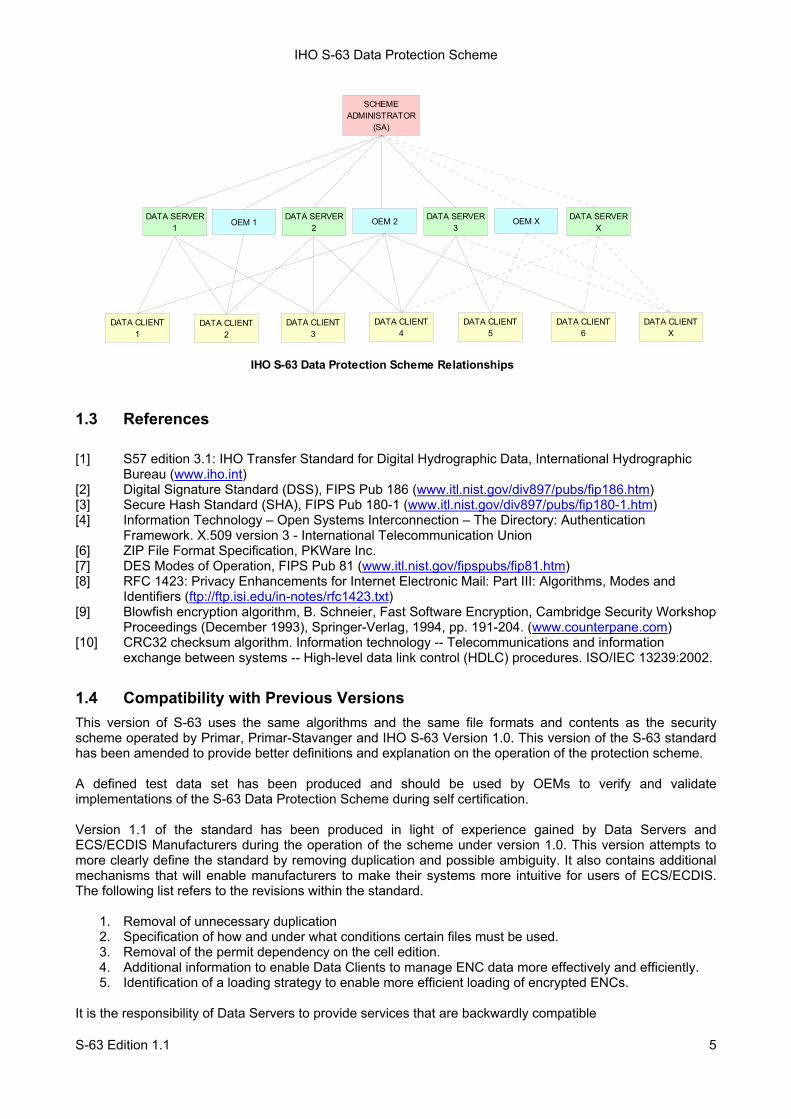
IHO S-63 Data Protection Scheme
S-63 Edition 1.1 5
1.3 References [1] S57 edition 3.1: IHO Transfer Standard for Digital Hydrographic Data, International Hydrographic
Bureau (www.iho.int) [2] Digital Signature Standard (DSS), FIPS Pub 186 (www.itl.nist.gov/div897/pubs/fip186.htm) [3] Secure Hash Standard (SHA), FIPS Pub 180-1 (www.itl.nist.gov/div897/pubs/fip180-1.htm) [4] Information Technology – Open Systems Interconnection – The Directory: Authentication
Framework. X.509 version 3 - International Telecommunication Union [6] ZIP File Format Specification, PKWare Inc. [7] DES Modes of Operation, FIPS Pub 81 (www.itl.nist.gov/fipspubs/fip81.htm) [8] RFC 1423: Privacy Enhancements for Internet Electronic Mail: Part III: Algorithms, Modes and
Identifiers (ftp://ftp.isi.edu/in-notes/rfc1423.txt) [9] Blowfish encryption algorithm, B. Schneier, Fast Software Encryption, Cambridge Security Workshop
Proceedings (December 1993), Springer-Verlag, 1994, pp. 191-204. (www.counterpane.com) [10] CRC32 checksum algorithm. Information technology -- Telecommunications and information
exchange between systems -- High-level data link control (HDLC) procedures. ISO/IEC 13239:2002.
1.4 Compatibility with Previous Versions This version of S-63 uses the same algorithms and the same file formats and contents as the security scheme operated by Primar, Primar-Stavanger and IHO S-63 Version 1.0. This version of the S-63 standard has been amended to provide better definitions and explanation on the operation of the protection scheme. A defined test data set has been produced and should be used by OEMs to verify and validate implementations of the S-63 Data Protection Scheme during self certification. Version 1.1 of the standard has been produced in light of experience gained by Data Servers and ECS/ECDIS Manufacturers during the operation of the scheme under version 1.0. This version attempts to more clearly define the standard by removing duplication and possible ambiguity. It also contains additional mechanisms that will enable manufacturers to make their systems more intuitive for users of ECS/ECDIS. The following list refers to the revisions within the standard.
1. Removal of unnecessary duplication 2. Specification of how and under what conditions certain files must be used. 3. Removal of the permit dependency on the cell edition. 4. Additional information to enable Data Clients to manage ENC data more effectively and efficiently. 5. Identification of a loading strategy to enable more efficient loading of encrypted ENCs.
It is the responsibility of Data Servers to provide services that are backwardly compatible
SCHEME ADMINISTRATOR
(SA)
DATA CLIENT2
DATA SERVER X
DATA SERVER 3
DATA SERVER 2
DATA SERVER 1
OEM X
DATA CLIENTX
DATA CLIENT4
DATA CLIENT3
OEM 2OEM 1
DATA CLIENT6
DATA CLIENT5
DATA CLIENT1
IHO S-63 Data Protection Scheme Relationships

IHO S-63 Data Protection Scheme
S-63 Edition 1.1 6
1.5 Document Structure The main body of the document can generally be broken down into four parts. The first part details the components that are fundamental to the scheme and describes their purpose and construction. The second identifies how all the components come together within an S-63 ENC Exchange Set. The third outlines the roles and responsibilities of each type of user participating in the scheme. Finally there is a section that defines the various error and warning messages that must be displayed on the data client when defined conditions occur. Main Document:
1. Scheme Components: Section 2 Data Compression Section 3 Data Encryption Section 4 Data Licensing Section 5 Data Authentication Section 6 Data Management
2. Exchange Set Format and Structure Section 7 Directory and File Structures
3. S-63 Participant Processes Section 0 Scheme Administrators Processes Section 9 Data Server Processes Section 10 OEM & Data Client Processes
4. S-63 Error and Warning Messages Section 11 S-63 Error Codes and Explanations
Additional Sections:
• S-63 Annex A: Data Server Certificate Request Procedure • S-63 Annex B: Manufacturer Information Request Procedure
Appendices:
• Appendix 1: Contains a definition of available test data which can be used to develop full compliance with all aspects of the Data Protection Scheme.
• Appendix 2: Defines how encrypted ENC exchange sets provided by Data Servers will be stored using mass storage devices such as DVD or USB memory sticks.
1.6 Maintenance Changes to this standard will conform to the “Principles and procedures for making changes to IHO standards and specifications”, as approved by the 18th CHRIS meeting (Cairns, Australia, Sept. 2006).
1.7 Support Support in using and implementing this standard is provided to users by members of the IHO DPSWG, via a security scheme discussion on the open ECDIS forum. (www.openecdis.org). In addition an inventory of frequently asked questions (FAQ) is maintained by the IHB on the ECDIS section of the IHO website (www.iho.int).
IHO S-63 Data Protection Scheme
S-63 Edition 1.1 7
2 DATA COMPRESSION
2.1 Overview An ENC file will, because of its structure, contain repeating patterns of information. Examples of this are the consecutive numbering of the feature object identifier (FOID) or small variations in the co-ordinate information within an ENC file. ENC data therefore responds well to compression with reductions in size of between 30% and 60% reducing greatly the cost of transfer of ENC data to its final destination. Only the ENC files (base and update) are compressed. The ENC files are always compressed before they are encrypted as the effectiveness of any compression algorithm relies on the existence of structured data contents.
2.2 Compression Algorithm The security scheme uses the ZIP algorithm1 [6] to compress and uncompress ENC data. It is identical to the algorithm used in many commercial applications e.g. WinZip, PKZIP. Potential Data Servers and OEMs should be aware that in the past errors have occurred when Data Servers compress data and it is interpreted by popular implementations of the ZIP algorithm as “text” data. If the data is uncompressed with incorrect parameters it can corrupt the ENC file leading to failing integrity checks. Data Servers and OEMs are advised to carefully implement compression/un-compression within their systems.
2.3 Compressed Files The security scheme compresses only the ENC base cell and update files. No other files within the S-57 Exchange Set will be compressed.
1 http://en.wikipedia.org/wiki/ZIP_%28file_format%29

IHO S-63 Data Protection Scheme
S-63 Edition 1.1 8
Page intentionally left blank
IHO S-63 Data Protection Scheme
S-63 Edition 1.1 9
3 DATA ENCRYPTION
3.1 What Data is encrypted? Only one encryption algorithm is used within the Scheme. Only the data within the ENC Base or Update Cell files inside an S-57 Exchange Set, i.e. text or image files are left unencrypted. The scheme encrypts the complete content of the ENC Base or Update data files. Other information within the Scheme that is encrypted includes the OEM System HW_ID which is encrypted and provided to the Data Client in the form of a userpermit. The cell keys used to encrypt the ENC data files are themselves encrypted by the Data Server and supplied to Data Clients as cell permits. Information about the encryption algorithm is available in section 3.2.3.
3.2 How is it encrypted? Each single ENC cell file is encrypted using a unique Cell Key. The same Cell Key is used to encrypt all updates issued for the cell. The scheme however, allows for the cell keys to be incremented and changed at the discretion of the Data Server. The Cell Keys are delivered to Data Clients in the form of cell permits.
3.2.1 Encryption of ENC Information The ENC information (base cells and updates) are encrypted using a 40-bit key. 3.2.2 Encryption of Other Protection Scheme Information The Userpermit and the Cell permit contents are encrypted using a 48-bit key. 3.2.3 Encryption Algorithm – Blowfish The scheme encrypts all information referenced in 3.1 using the Blowfish algorithm [9]. The algorithm is unpatented and available in the public domain (www.counterpane.com). Blowfish is a block cipher algorithm that operates on 64 bit (8 byte) quantities. It requires that the data sources must be padded if they are not a multiple of 8 bytes. The protection scheme uses the “DES in CBC Mode” padding algorithm defined in [8] whenever any data sources must be padded. This complies with the ECB (Electronic Code Book) mode of DES [7].

IHO S-63 Data Protection Scheme
S-63 Edition 1.1 10
Page intentionally left blank
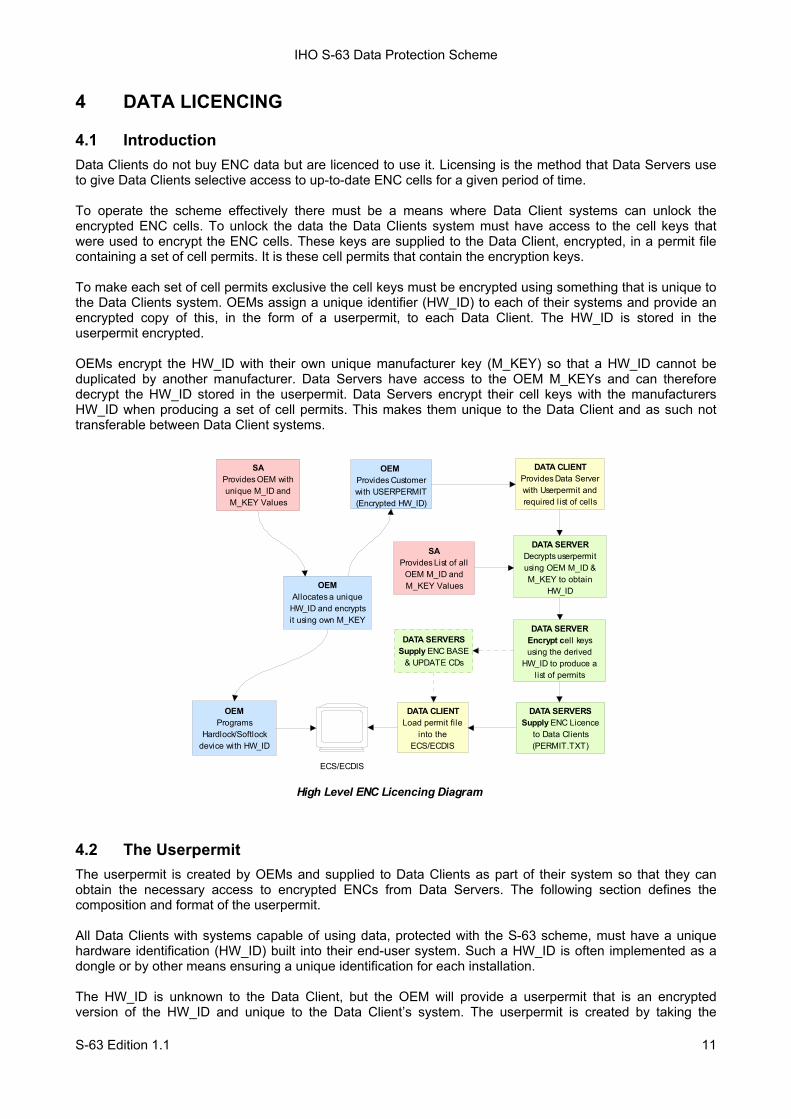
IHO S-63 Data Protection Scheme
S-63 Edition 1.1 11
4 DATA LICENCING
4.1 Introduction Data Clients do not buy ENC data but are licenced to use it. Licensing is the method that Data Servers use to give Data Clients selective access to up-to-date ENC cells for a given period of time. To operate the scheme effectively there must be a means where Data Client systems can unlock the encrypted ENC cells. To unlock the data the Data Clients system must have access to the cell keys that were used to encrypt the ENC cells. These keys are supplied to the Data Client, encrypted, in a permit file containing a set of cell permits. It is these cell permits that contain the encryption keys. To make each set of cell permits exclusive the cell keys must be encrypted using something that is unique to the Data Clients system. OEMs assign a unique identifier (HW_ID) to each of their systems and provide an encrypted copy of this, in the form of a userpermit, to each Data Client. The HW_ID is stored in the userpermit encrypted. OEMs encrypt the HW_ID with their own unique manufacturer key (M_KEY) so that a HW_ID cannot be duplicated by another manufacturer. Data Servers have access to the OEM M_KEYs and can therefore decrypt the HW_ID stored in the userpermit. Data Servers encrypt their cell keys with the manufacturers HW_ID when producing a set of cell permits. This makes them unique to the Data Client and as such not transferable between Data Client systems.
4.2 The Userpermit The userpermit is created by OEMs and supplied to Data Clients as part of their system so that they can obtain the necessary access to encrypted ENCs from Data Servers. The following section defines the composition and format of the userpermit. All Data Clients with systems capable of using data, protected with the S-63 scheme, must have a unique hardware identification (HW_ID) built into their end-user system. Such a HW_ID is often implemented as a dongle or by other means ensuring a unique identification for each installation. The HW_ID is unknown to the Data Client, but the OEM will provide a userpermit that is an encrypted version of the HW_ID and unique to the Data Client’s system. The userpermit is created by taking the
SAProvides OEM with unique M_ID and M_KEY Values
OEMAllocates a unique
HW_ID and encrypts it using own M_KEY
OEM Provides Customer with USERPERMIT(Encrypted HW_ID)
DATA CLIENTProvides Data Server with Userpermit and required list of cells
OEMPrograms
Hardlock/Softlock device with HW_ID
DATA SERVERDecrypts userpermit using OEM M_ID & M_KEY to obtain
HW_ID
High Level ENC Licencing Diagram
SAProvides List of all
OEM M_ID and M_KEY Values
DATA SERVERSSupply ENC Licence
to Data Clients(PERMIT.TXT)
DATA SERVEREncrypt cell keys using the derived
HW_ID to produce a list of permits
DATA CLIENTLoad permit file
into the ECS/ECDIS
ECS/ECDIS
DATA SERVERSSupply ENC BASE
& UPDATE CDs
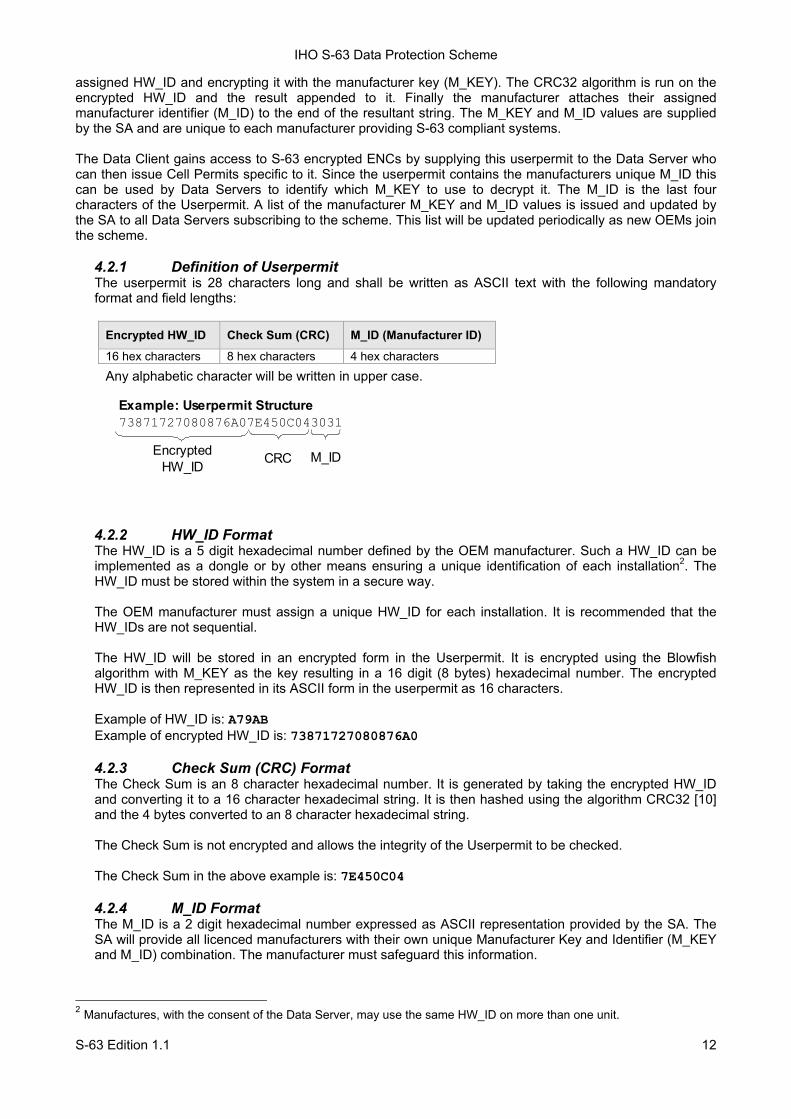
IHO S-63 Data Protection Scheme
S-63 Edition 1.1 12
assigned HW_ID and encrypting it with the manufacturer key (M_KEY). The CRC32 algorithm is run on the encrypted HW_ID and the result appended to it. Finally the manufacturer attaches their assigned manufacturer identifier (M_ID) to the end of the resultant string. The M_KEY and M_ID values are supplied by the SA and are unique to each manufacturer providing S-63 compliant systems. The Data Client gains access to S-63 encrypted ENCs by supplying this userpermit to the Data Server who can then issue Cell Permits specific to it. Since the userpermit contains the manufacturers unique M_ID this can be used by Data Servers to identify which M_KEY to use to decrypt it. The M_ID is the last four characters of the Userpermit. A list of the manufacturer M_KEY and M_ID values is issued and updated by the SA to all Data Servers subscribing to the scheme. This list will be updated periodically as new OEMs join the scheme.
4.2.1 Definition of Userpermit The userpermit is 28 characters long and shall be written as ASCII text with the following mandatory format and field lengths:
Encrypted HW_ID Check Sum (CRC) M_ID (Manufacturer ID)
16 hex characters 8 hex characters 4 hex characters
Any alphabetic character will be written in upper case.
4.2.2 HW_ID Format The HW_ID is a 5 digit hexadecimal number defined by the OEM manufacturer. Such a HW_ID can be implemented as a dongle or by other means ensuring a unique identification of each installation2. The HW_ID must be stored within the system in a secure way.
The OEM manufacturer must assign a unique HW_ID for each installation. It is recommended that the HW_IDs are not sequential.
The HW_ID will be stored in an encrypted form in the Userpermit. It is encrypted using the Blowfish algorithm with M_KEY as the key resulting in a 16 digit (8 bytes) hexadecimal number. The encrypted HW_ID is then represented in its ASCII form in the userpermit as 16 characters.
Example of HW_ID is: A79AB Example of encrypted HW_ID is: 73871727080876A0 4.2.3 Check Sum (CRC) Format The Check Sum is an 8 character hexadecimal number. It is generated by taking the encrypted HW_ID and converting it to a 16 character hexadecimal string. It is then hashed using the algorithm CRC32 [10] and the 4 bytes converted to an 8 character hexadecimal string. The Check Sum is not encrypted and allows the integrity of the Userpermit to be checked.
The Check Sum in the above example is: 7E450C04 4.2.4 M_ID Format The M_ID is a 2 digit hexadecimal number expressed as ASCII representation provided by the SA. The SA will provide all licenced manufacturers with their own unique Manufacturer Key and Identifier (M_KEY and M_ID) combination. The manufacturer must safeguard this information.
2 Manufactures, with the consent of the Data Server, may use the same HW_ID on more than one unit.
Example: Userpermit Structure73871727080876A07E450C043031
EncryptedHW_ID
M_ID
CRC
IHO S-63 Data Protection Scheme
S-63 Edition 1.1 13
The SA will provide all licenced Data Servers with a full listing of all manufacturer codes as and when new manufacturers subscribe to the scheme. This information is used by the Data Server to determine which key (M_KEY) to use to decrypt the HW_ID in the Userpermit during the creation of Data Client cell permits.
The M_ID in the above example is: 01 or 3031 (ASCII3) 4.2.5 M_KEY Format The M_KEY is a 5 digit hexadecimal number provided by the SA. The OEM uses this key to encrypt assigned HW_ID when generating userpermits. The OEM must store it securely. This key is used by the Data Server to decrypt assigned HW_IDs.
Example of M_KEY is 123AB or 3132334142 (ASCII)
4.3 The Cell Permit To decrypt an ENC cell the Data Client must have access to the encryption key (see section 3.2) used to encrypt it. Since the encryption keys are only known to the Data Server there needs to be a means of delivering this information to Data Clients in a protected manner. This information is supplied by the Data Server (e.g. RENC or VAR) to the Data Client in an encrypted form known as a cell permit. A single file is provided to deliver the cell permit and is named PERMIT.TXT (see section 4.3.1). This file may contain several cell permits based on the ENC coverage required by the Data Client. The PERMIT.TXT file will be delivered either on hard media or using online services in accordance with the Data Servers operating procedures. These procedures will be made available to Data Clients when purchasing a licence. Each cell permit record also contains additional fields that are supplied to assist OEM systems to manage the Data Clients licence and permit files from multiple Data Servers, see section 4.3.3. Data Clients can obtain a licence to access ENCs by supplying the Data Server with their unique userpermit (see section 4.2). Data Servers can then extract the HW_ID from userpermit, using the Data Client’s M_KEY, and create client specific cell permits based on this value. The format of a cell permit record is described below in sections 4.3.2 & 4.3.3. Since Cell Permits are issued for a specific HW_ID they are consequently not transferable between installations (Data Client Systems). This method of linking the permit to the installation supports the production of generically encrypted CDs which can be distributed to all Data Clients subscribing to a service. The Data Clients system decrypts the Cell Permit using the assigned HW_ID stored securely by hardware or software means. The decrypted cell keys can then be used by the system to decrypt the ENC cell. Since several Data Servers can make permit files for ENCs in their service, it is the responsibility of the Data Client system to manage permit files from several Data Servers. NOTE: Data Servers should continue to provide both types of permit files (ENC.PMT & PERMIT.TXT) as described in S-63 Edition 1.0. This should continue until such time that it can be determined that the omission of the ENC.PMT file will not compromise the safe use of older legacy systems. The timescale for this must be agreed between all stakeholders. OEMs must ensure that new implementations of their ECDIS software are able to merge permits from multiple data servers without losing permit information using only the PERMIT.TXT file.
4.3.1 The Permit File (PERMIT.TXT) The Cell Permit will always be provided in a file called PERMIT.TXT, the filename will always provided in UPPERCASE as will any alphabetic characters contained in the file. The file is completely encoded in ASCII4 and contains 3 sections as follows:
3 Note: The hex encoding may be unfamiliar to some readers. For historical reasons it has been preserved in this version of the standard. “1 2 3 4 5” is translated into “31 32 33 34 35” because the ASCII Base 16 representation of the character “1” is “31” etc. Though confusing at first this convention is used throughout the standard consistently as is standard hexadecimal and binary representations. To differentiate it is referred to as “(ASCII)”
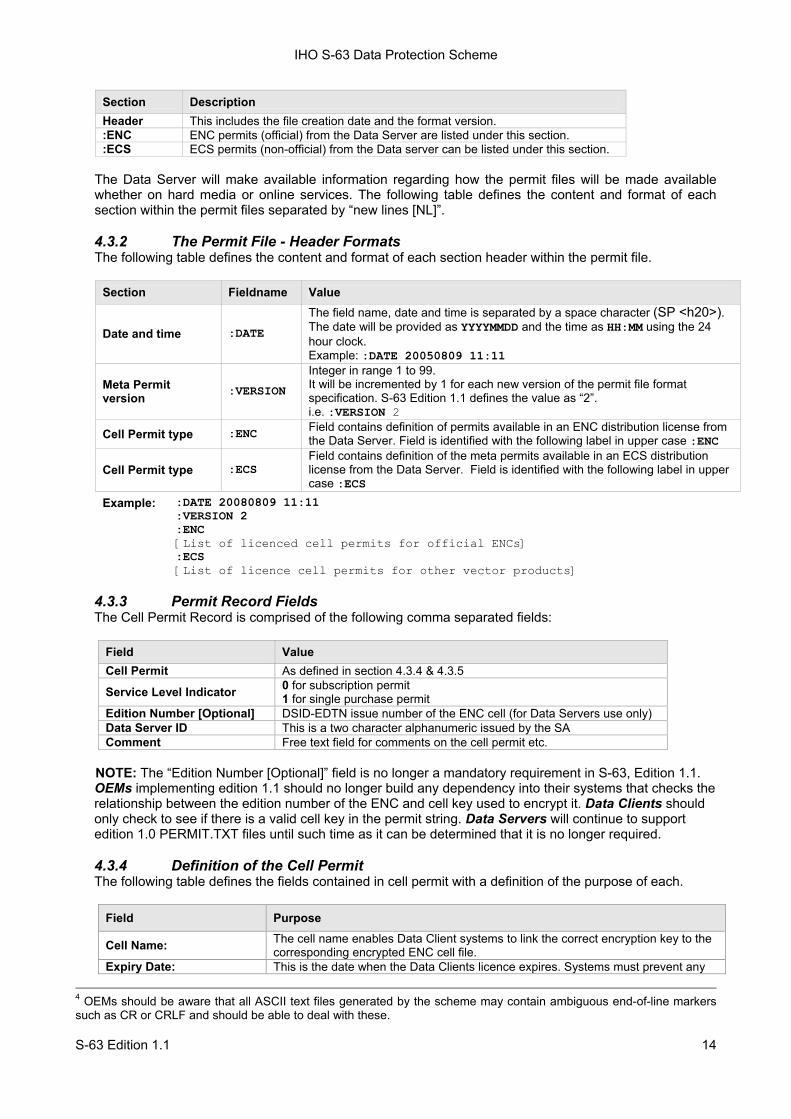
IHO S-63 Data Protection Scheme
S-63 Edition 1.1 14
Section Description Header This includes the file creation date and the format version. :ENC ENC permits (official) from the Data Server are listed under this section. :ECS ECS permits (non-official) from the Data server can be listed under this section.
The Data Server will make available information regarding how the permit files will be made available whether on hard media or online services. The following table defines the content and format of each section within the permit files separated by “new lines [NL]”. 4.3.2 The Permit File - Header Formats The following table defines the content and format of each section header within the permit file.
Section Fieldname Value
Date and time :DATE
The field name, date and time is separated by a space character (SP <h20>). The date will be provided as YYYYMMDD and the time as HH:MM using the 24 hour clock. Example: :DATE 20050809 11:11
Meta Permit version :VERSION
Integer in range 1 to 99. It will be incremented by 1 for each new version of the permit file format specification. S-63 Edition 1.1 defines the value as “2”. i.e. :VERSION 2
Cell Permit type :ENC Field contains definition of permits available in an ENC distribution license from the Data Server. Field is identified with the following label in upper case :ENC
Cell Permit type :ECS Field contains definition of the meta permits available in an ECS distribution license from the Data Server. Field is identified with the following label in upper case :ECS
Example: :DATE 20080809 11:11 :VERSION 2 :ENC [List of licenced cell permits for official ENCs] :ECS [List of licence cell permits for other vector products]
4.3.3 Permit Record Fields The Cell Permit Record is comprised of the following comma separated fields:
Field Value Cell Permit As defined in section 4.3.4 & 4.3.5
Service Level Indicator 0 for subscription permit 1 for single purchase permit
Edition Number [Optional] DSID-EDTN issue number of the ENC cell (for Data Servers use only) Data Server ID This is a two character alphanumeric issued by the SA Comment Free text field for comments on the cell permit etc.
NOTE: The “Edition Number [Optional]” field is no longer a mandatory requirement in S-63, Edition 1.1. OEMs implementing edition 1.1 should no longer build any dependency into their systems that checks the relationship between the edition number of the ENC and cell key used to encrypt it. Data Clients should only check to see if there is a valid cell key in the permit string. Data Servers will continue to support edition 1.0 PERMIT.TXT files until such time as it can be determined that it is no longer required.
4.3.4 Definition of the Cell Permit The following table defines the fields contained in cell permit with a definition of the purpose of each.
Field Purpose
Cell Name: The cell name enables Data Client systems to link the correct encryption key to the corresponding encrypted ENC cell file.
Expiry Date: This is the date when the Data Clients licence expires. Systems must prevent any
4 OEMs should be aware that all ASCII text files generated by the scheme may contain ambiguous end-of-line markers such as CR or CRLF and should be able to deal with these.
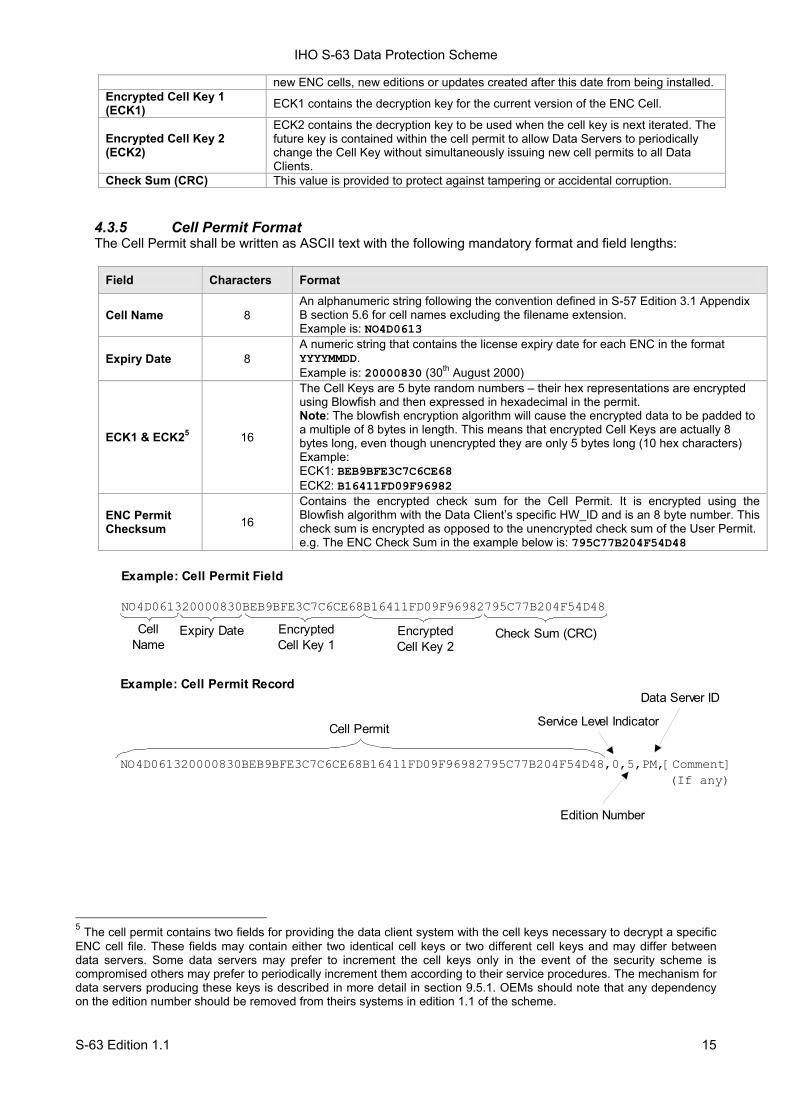
IHO S-63 Data Protection Scheme
S-63 Edition 1.1 15
new ENC cells, new editions or updates created after this date from being installed. Encrypted Cell Key 1 (ECK1) ECK1 contains the decryption key for the current version of the ENC Cell.
Encrypted Cell Key 2 (ECK2)
ECK2 contains the decryption key to be used when the cell key is next iterated. The future key is contained within the cell permit to allow Data Servers to periodically change the Cell Key without simultaneously issuing new cell permits to all Data Clients.
Check Sum (CRC) This value is provided to protect against tampering or accidental corruption.
4.3.5 Cell Permit Format The Cell Permit shall be written as ASCII text with the following mandatory format and field lengths:
Field Characters Format
Cell Name 8 An alphanumeric string following the convention defined in S-57 Edition 3.1 Appendix B section 5.6 for cell names excluding the filename extension. Example is: NO4D0613
Expiry Date 8 A numeric string that contains the license expiry date for each ENC in the format YYYYMMDD. Example is: 20000830 (30th August 2000)
ECK1 & ECK25 16
The Cell Keys are 5 byte random numbers – their hex representations are encrypted using Blowfish and then expressed in hexadecimal in the permit. Note: The blowfish encryption algorithm will cause the encrypted data to be padded to a multiple of 8 bytes in length. This means that encrypted Cell Keys are actually 8 bytes long, even though unencrypted they are only 5 bytes long (10 hex characters) Example: ECK1: BEB9BFE3C7C6CE68 ECK2: B16411FD09F96982
ENC Permit Checksum 16
Contains the encrypted check sum for the Cell Permit. It is encrypted using the Blowfish algorithm with the Data Client’s specific HW_ID and is an 8 byte number. This check sum is encrypted as opposed to the unencrypted check sum of the User Permit. e.g. The ENC Check Sum in the example below is: 795C77B204F54D48
5 The cell permit contains two fields for providing the data client system with the cell keys necessary to decrypt a specific ENC cell file. These fields may contain either two identical cell keys or two different cell keys and may differ between data servers. Some data servers may prefer to increment the cell keys only in the event of the security scheme is compromised others may prefer to periodically increment them according to their service procedures. The mechanism for data servers producing these keys is described in more detail in section 9.5.1. OEMs should note that any dependency on the edition number should be removed from theirs systems in edition 1.1 of the scheme.
Example: Cell Permit Record
NO4D061320000830BEB9BFE3C7C6CE68B16411FD09F96982795C77B204F54D48,0,5,PM,[Comment]
Service Level Indicator
Edition Number
Data Server ID
Cell Permit
(If any)
Example: Cell Permit Field
NO4D061320000830BEB9BFE3C7C6CE68B16411FD09F96982795C77B204F54D48 Cell
NameExpiry Date Encrypted
Cell Key 1Check Sum (CRC)Encrypted
Cell Key 2
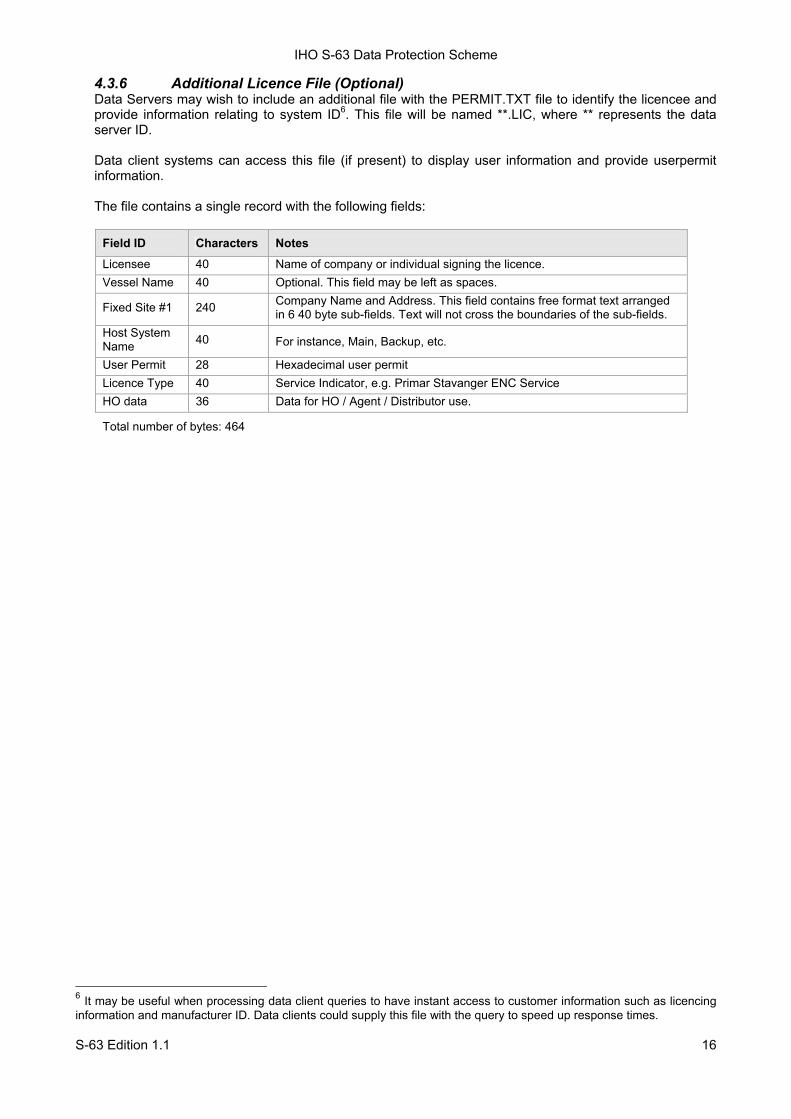
IHO S-63 Data Protection Scheme
S-63 Edition 1.1 16
4.3.6 Additional Licence File (Optional) Data Servers may wish to include an additional file with the PERMIT.TXT file to identify the licencee and provide information relating to system ID6. This file will be named **.LIC, where ** represents the data server ID. Data client systems can access this file (if present) to display user information and provide userpermit information.
The file contains a single record with the following fields:
Field ID Characters Notes
Licensee 40 Name of company or individual signing the licence. Vessel Name 40 Optional. This field may be left as spaces.
Fixed Site #1 240 Company Name and Address. This field contains free format text arranged in 6 40 byte sub-fields. Text will not cross the boundaries of the sub-fields.
Host System Name 40 For instance, Main, Backup, etc.
User Permit 28 Hexadecimal user permit Licence Type 40 Service Indicator, e.g. Primar Stavanger ENC Service HO data 36 Data for HO / Agent / Distributor use.
Total number of bytes: 464
6 It may be useful when processing data client queries to have instant access to customer information such as licencing information and manufacturer ID. Data clients could supply this file with the query to speed up response times.
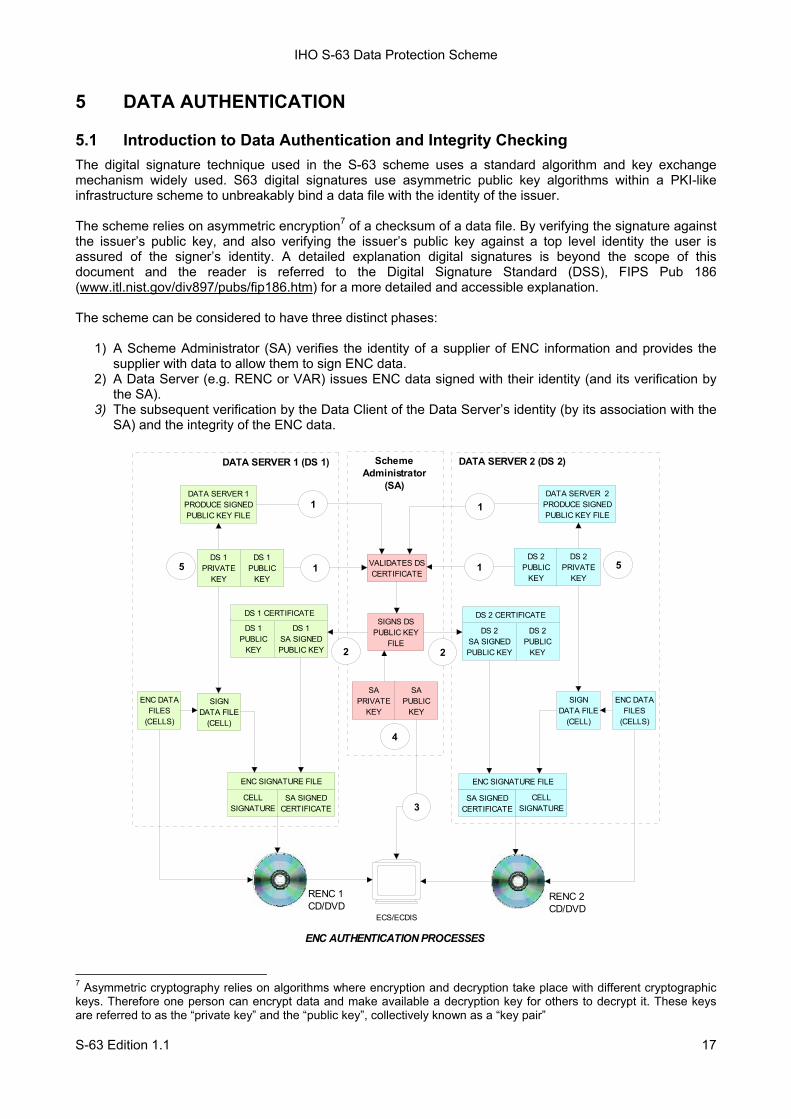
IHO S-63 Data Protection Scheme
S-63 Edition 1.1 17
5 DATA AUTHENTICATION
5.1 Introduction to Data Authentication and Integrity Checking The digital signature technique used in the S-63 scheme uses a standard algorithm and key exchange mechanism widely used. S63 digital signatures use asymmetric public key algorithms within a PKI-like infrastructure scheme to unbreakably bind a data file with the identity of the issuer. The scheme relies on asymmetric encryption7 of a checksum of a data file. By verifying the signature against the issuer’s public key, and also verifying the issuer’s public key against a top level identity the user is assured of the signer’s identity. A detailed explanation digital signatures is beyond the scope of this document and the reader is referred to the Digital Signature Standard (DSS), FIPS Pub 186 (www.itl.nist.gov/div897/pubs/fip186.htm) for a more detailed and accessible explanation. The scheme can be considered to have three distinct phases:
1) A Scheme Administrator (SA) verifies the identity of a supplier of ENC information and provides the supplier with data to allow them to sign ENC data.
2) A Data Server (e.g. RENC or VAR) issues ENC data signed with their identity (and its verification by the SA).
3) The subsequent verification by the Data Client of the Data Server’s identity (by its association with the SA) and the integrity of the ENC data.
7 Asymmetric cryptography relies on algorithms where encryption and decryption take place with different cryptographic keys. Therefore one person can encrypt data and make available a decryption key for others to decrypt it. These keys are referred to as the “private key” and the “public key”, collectively known as a “key pair”
DS 1PRIVATE
KEY
DS 1PUBLIC
KEY
SIGNS DS PUBLIC KEY
FILE
DS 2PUBLIC
KEY
DS 2PRIVATE
KEY
SAPRIVATE
KEY
SAPUBLIC
KEY
VALIDATES DS CERTIFICATE
DS 1PUBLIC
KEY
DS 1SA SIGNED PUBLIC KEY
DS 1 CERTIFICATE
DS 2PUBLIC
KEY
DS 2SA SIGNED PUBLIC KEY
DS 2 CERTIFICATE
ECS/ECDIS
ENC DATA FILES
(CELLS)
SIGN DATA FILE
(CELL)
CELL SIGNATURE
ENC SIGNATURE FILE
SA SIGNEDCERTIFICATE
ENC DATA FILES
(CELLS)
SIGN DATA FILE
(CELL)
CELL SIGNATURE
ENC SIGNATURE FILE
SA SIGNEDCERTIFICATE
1
3
5
SchemeAdministrator
(SA)
5
4
DATA SERVER 1PRODUCE SIGNED PUBLIC KEY FILE
DATA SERVER 2PRODUCE SIGNED PUBLIC KEY FILE
1
DATA SERVER 1 (DS 1) DATA SERVER 2 (DS 2)
ENC AUTHENTICATION PROCESSES
2 2
RENC 1CD/DVD
RENC 2CD/DVD
1 1
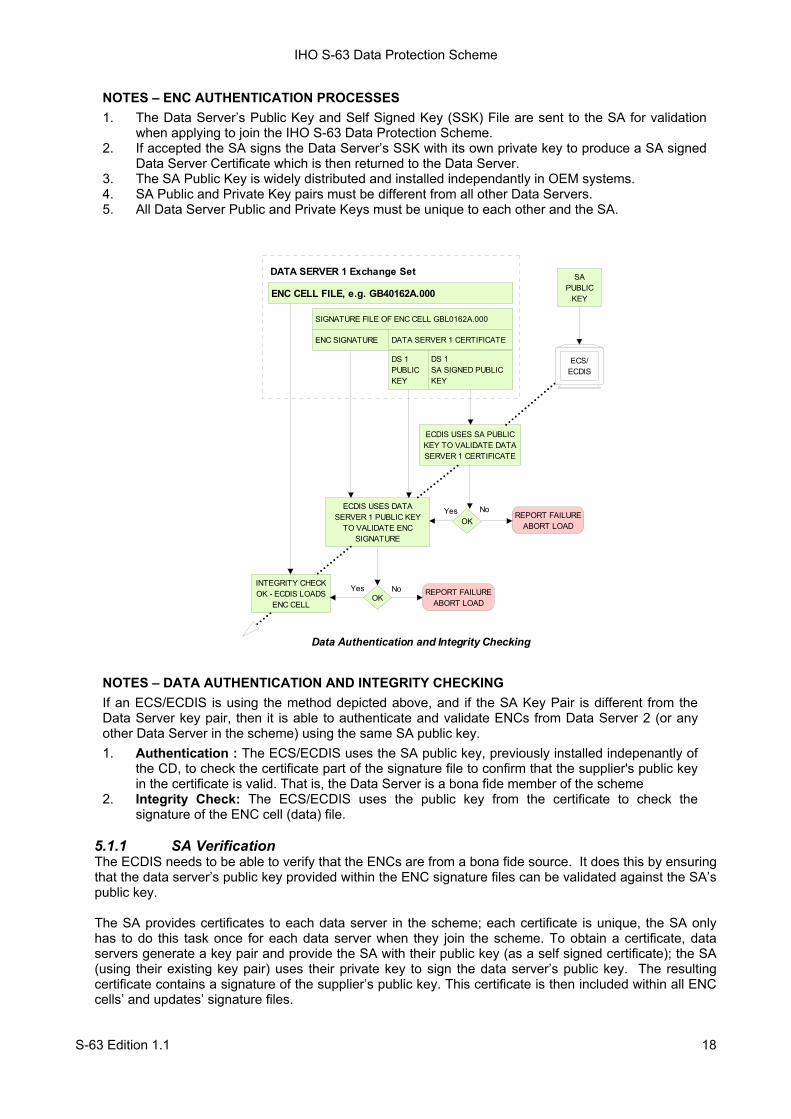
IHO S-63 Data Protection Scheme
S-63 Edition 1.1 18
NOTES – ENC AUTHENTICATION PROCESSES
1. The Data Server’s Public Key and Self Signed Key (SSK) File are sent to the SA for validation when applying to join the IHO S-63 Data Protection Scheme.
2. If accepted the SA signs the Data Server’s SSK with its own private key to produce a SA signed Data Server Certificate which is then returned to the Data Server.
3. The SA Public Key is widely distributed and installed independantly in OEM systems. 4. SA Public and Private Key pairs must be different from all other Data Servers. 5. All Data Server Public and Private Keys must be unique to each other and the SA.
NOTES – DATA AUTHENTICATION AND INTEGRITY CHECKING
If an ECS/ECDIS is using the method depicted above, and if the SA Key Pair is different from the Data Server key pair, then it is able to authenticate and validate ENCs from Data Server 2 (or any other Data Server in the scheme) using the same SA public key.
1. Authentication : The ECS/ECDIS uses the SA public key, previously installed indepenantly of the CD, to check the certificate part of the signature file to confirm that the supplier's public key in the certificate is valid. That is, the Data Server is a bona fide member of the scheme
2. Integrity Check: The ECS/ECDIS uses the public key from the certificate to check the signature of the ENC cell (data) file.
5.1.1 SA Verification The ECDIS needs to be able to verify that the ENCs are from a bona fide source. It does this by ensuring that the data server’s public key provided within the ENC signature files can be validated against the SA’s public key.
The SA provides certificates to each data server in the scheme; each certificate is unique, the SA only has to do this task once for each data server when they join the scheme. To obtain a certificate, data servers generate a key pair and provide the SA with their public key (as a self signed certificate); the SA (using their existing key pair) uses their private key to sign the data server’s public key. The resulting certificate contains a signature of the supplier’s public key. This certificate is then included within all ENC cells’ and updates’ signature files.
ECS/ECDIS
SAPUBLIC
KEYENC CELL FILE, e.g. GB40162A.000
ENC SIGNATURE
SIGNATURE FILE OF ENC CELL GBL0162A.000
DATA SERVER 1 CERTIFICATE
DS 1 PUBLICKEY
DS 1SA SIGNED PUBLIC KEY
ECDIS USES SA PUBLIC KEY TO VALIDATE DATA SERVER 1 CERTIFICATE
OK
ECDIS USES DATA SERVER 1 PUBLIC KEY
TO VALIDATE ENC SIGNATURE
Yes
INTEGRITY CHECK OK - ECDIS LOADS
ENC CELLOK
Yes
DATA SERVER 1 Exchange Set
Data Authentication and Integrity Checking
REPORT FAILUREABORT LOAD
REPORT FAILUREABORT LOAD
No
No
IHO S-63 Data Protection Scheme
S-63 Edition 1.1 19
The SA makes their own public key widely known to the ECDIS community and OEMs should provide a means for the user to load this independently of the data. 5.1.2 Data Integrity After the source of the ENC exchange set has been authenticated the ECDIS then checks data integrity by validating the signature file provided for each ENC by the data server.
The data server creates a signature file for each cell which consists of the following two parts: • The signature of the dataset [which is created using the data server’s private key, half of the data
server key pair (in essence this is an encrypted checksum of the data) and is different for each cell] • Their Data Server certificate (which remains constant).
The ECDIS uses the data server’s public key that is included in the certificate to validate the data file signature (it decodes this data file signature and compares the checksum against the ENC cell). If this validation check is successful then it proves that the ENC has not been corrupted in any way and that the identity of the Data Server within the cell signatures is validated by the SA.
5.2 Digital Certificates (SA Authentication) Certificates are digital files issued by a certification authority. They bind a specific public key together with other information to an individual or organisation. Certificates help prevent someone from using a fake public key to impersonate someone else. The scheme uses a chain of certificates, each one certifying the previous one until all parties are confident as to the identities in question. The SA certificate used by the IHO will be a self signed certificate8 and is the root certificate for the scheme. The SA will issue a digital certificate to all approved Data Servers by signing the Data Server’s verified public key file. The following list of high level operations is performed in the issuing of digital certificates. Scheme Creation • SA creates a unique top level public and private key pair.
Establishment of a Data Server • Data Server creates a unique public and private key pair. • Data Server creates a Self Signed Key (SSK) by signing own public key file with own private key. • Data Server supplies the SSK to the SA by a trusted means. • SA verifies the Data Server’s SSK using the Data Server’s pubic key. • SA signs the verified Data Server public key file using the SA private key. • SA supplies the Data Server with its own unique SA signed Data Server Certificate.
Creation of Signed Data Sets • Data Server verifies the resultant certificate with the SA public key (supplied separately). • Data Server stores verified certificate and uses it in the creation of ENC signature files.
The format of the various files, certificates and signatures are described in more detail in section 5.4. NOTE: the SA public key is made widely available to all interested parties, e.g. Data Servers, Data Clients and OEMs, in a number of ways, e.g. web, e-mail, etc.
5.2.1 The SA Public Key The scheme requires that the SA public key is installed on the Data Client’s systems independently of the ENC exchange set. This can be pre-installed by the OEM. However, the Data Client system must have a method of installing a new public key9 on the system in the case where a new one is issued by the SA.
8 The SA public key signed using the SA private key. 9 It is envisaged that data servers will supply this independently of the exchange set to coincide with data that authenticates against the new public key.
IHO S-63 Data Protection Scheme
S-63 Edition 1.1 20
If the user installs a new SA certificate or public key the system must confirm that a new one has been installed. If installing a new SA certificate (IHO.CRT) the system must inform the user as follows: “A new SA certificate (public key) has been installed this is valid to [enter expiry date] or unless the SA issues a new one for security reasons.” If installing a new SA public key (IHO.PUB) the system must inform the user as follows: “A new SA public key has been installed this is valid until the SA routinely issues a new one or unless one is issued for security reasons.” Should the system report an authentication error during the loading process it should alert the user to the possibility that the SA may have changed the public key. Therefore a warning message must be displayed explaining the reason for this as follows: “SSE 06 – The SA Certificate/Public Key is invalid. The SA may have issued a new public key or the ENC may originate from another service. A new SA public key can be obtained from the IHO website or from your distributor.” 5.2.2 New Data Servers The IHO, in conjunction with the DPSWG, will establish the identity of any organisation or commercial company wishing to join the protection scheme as a Data Server. If the SA revokes a Data Server Certificate, it will inform all Data Servers and Manufacturers about the change.
5.3 Digital Signatures (Verify Data Integrity) A digital signature is an electronic signature that can be used to authenticate the identity of the sender of a message or the signer of a document, and to ensure that the original content of the sent message is unchanged. Digital signatures are portable, easily verified and cannot be forged. It is also acceptable for Hydrographic offices or other Data Server organisations (e.g. RENC/VAR) to use digital signatures to maintain provenance and data integrity between them in the delivery of ENC information. Each ENC file (both base and update files) will always have a single unique signature file associated with it. No other files in an encrypted ENC exchange set have a digital signature. NOTE: An exchange set may contain signatures issued by different data servers and therefore each ENC file must be authenticated individually.
5.3.1 Technical Overview of Digital Signatures Data authentication is provided using a digital signature compliant with the Digital Signature Standard (DSS) [2]. The DSS uses the Secure Hash Algorithm (SHA-1) [3] to create a message digest (hash). The message digest is then input to the Digital Signature Algorithm (DSA) [2] to generate the digital signature for the message using an asymmetric encryption algorithm and the ‘private key’ of a key pair. Asymmetric algorithms have the property that data encrypted using the ‘private key’ of the key pair can only be decrypted using the ‘public key’ of the key pair.
A consequence of encrypting the message digest with the private key is that anyone who has the public key (which as its name suggests can be made public) can decrypt and verify the message digest. Further information on Digital Signatures and their use may be obtained from the IHO website (http://www.iho.int). 5.3.2 ENC Signature File Naming Convention The digital signature file will match the cell file name except that the navigational purpose codes, digits 1–6, will be replaced by the characters I – N. In general: ENC file: CC[1-6]XXXXX.EEE (see S-57 Appendix B1) Signature file: CC[I-N]XXXXX.EEE
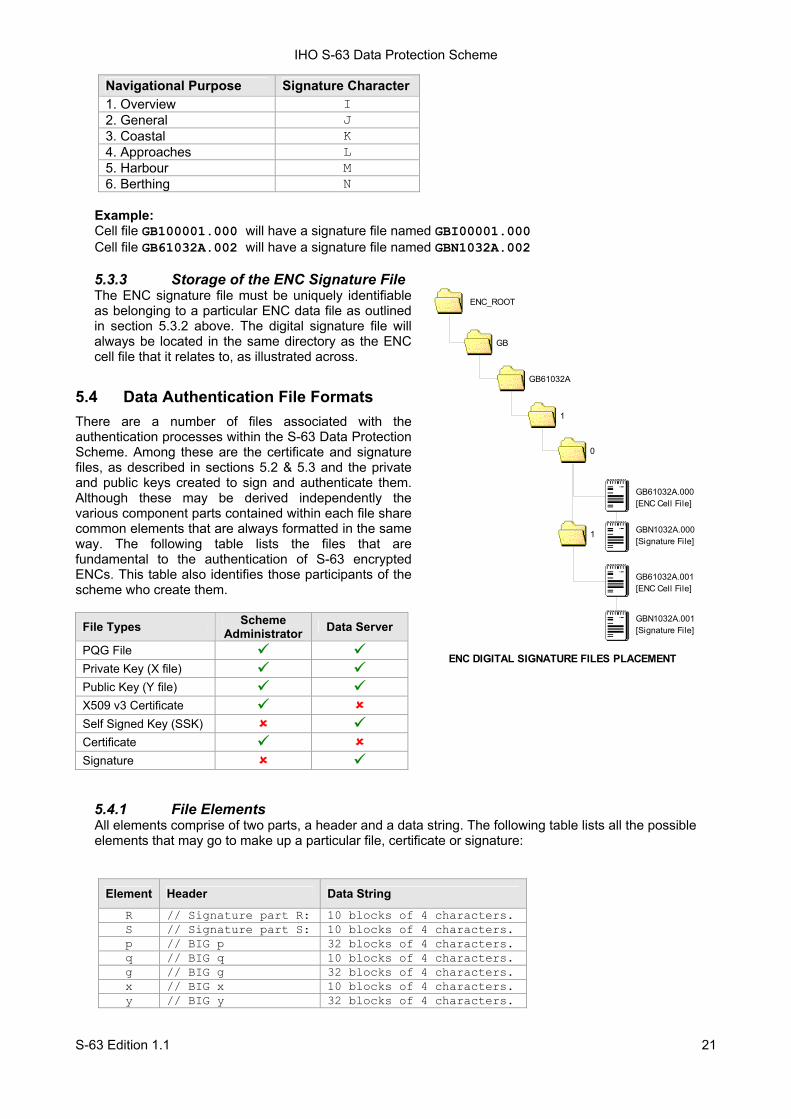
IHO S-63 Data Protection Scheme
S-63 Edition 1.1 21
Navigational Purpose Signature Character 1. Overview I 2. General J 3. Coastal K 4. Approaches L 5. Harbour M 6. Berthing N
Example: Cell file GB100001.000 will have a signature file named GBI00001.000 Cell file GB61032A.002 will have a signature file named GBN1032A.002 5.3.3 Storage of the ENC Signature File The ENC signature file must be uniquely identifiable as belonging to a particular ENC data file as outlined in section 5.3.2 above. The digital signature file will always be located in the same directory as the ENC cell file that it relates to, as illustrated across.
5.4 Data Authentication File Formats There are a number of files associated with the authentication processes within the S-63 Data Protection Scheme. Among these are the certificate and signature files, as described in sections 5.2 & 5.3 and the private and public keys created to sign and authenticate them. Although these may be derived independently the various component parts contained within each file share common elements that are always formatted in the same way. The following table lists the files that are fundamental to the authentication of S-63 encrypted ENCs. This table also identifies those participants of the scheme who create them.
File Types Scheme Administrator Data Server
PQG File Private Key (X file) Public Key (Y file) X509 v3 Certificate Self Signed Key (SSK) Certificate Signature
5.4.1 File Elements All elements comprise of two parts, a header and a data string. The following table lists all the possible elements that may go to make up a particular file, certificate or signature:
Element Header Data String
R // Signature part R: 10 blocks of 4 characters. S // Signature part S: 10 blocks of 4 characters. p // BIG p 32 blocks of 4 characters. q // BIG q 10 blocks of 4 characters. g // BIG g 32 blocks of 4 characters. x // BIG x 10 blocks of 4 characters. y // BIG y 32 blocks of 4 characters.
GB61032A
GB
1
GB61032A.000[ENC Cell File]
GBN1032A.000[Signature File]
ENC_ROOT
0
1
GB61032A.001[ENC Cell File]
GBN1032A.001[Signature File]
ENC DIGITAL SIGNATURE FILES PLACEMENT
IHO S-63 Data Protection Scheme
S-63 Edition 1.1 22
5.4.1.1 Element Header and Data String Formatting Each data string:
• Is preceded by a single header line. Header lines are indicated by two forward slashes (// ASCII -
0x2F2F) at the start followed by a space (SP ASCII 0x20) and the header characters in ASCII text as per the format descriptions below..
• Is expressed in ASCII text hexadecimal digits (0-9, A-F). Any alphabetic character will be in upper case.
• Is terminated by a full stop (. ASCII 0x2E). • Has a space (ASCII SP 0x20) separating each group of 4 characters. • Has a Carriage Return (ASCII CR 0x0D) and New Line (ASCII LF 0x0A) at the end of each data
string.
5.4.2 Examples of File, Certificate and Signature Formats The following section includes a set of examples of all the various files associated with this aspect of the S-63 Data Protection Scheme. A detailed explanation of how these files are created is outlined later in this document.
5.4.2.1 PQG Format The PQG parameters are produced from a random string and are used in the creation of the X and Y private/public key pairs. After these have been made, the PQG parameters will be contained within the X and Y private/public key pairs. P, Q and G are numerical parameters used in the Digital Signature Algorithm as input to the key creation process. Each data server can use a different set of P, Q and G or use an existing set to generate random key pairs. The Digital Signature Standard [2] describes their derivation and use. Example of PQG Format:
5.4.2.2 The X (Private Key) Format The X file must be written as ASCII text in the following format:
// BIG pD0A0 2D76 D210 58DA 4D91 BBC7 30AC 9186 5CB4 036C CDA4 6B49 4650 16BB 6931 2F12DF14 A0CC F38E B77C AD84 E6A1 2F2A A0D0 441A 734B 1D2B E944 5D10 BA87 609B 75E3.// BIG q8E00 82E3 C046 DFE6 C422 F44C C111 DBF6 ADEE 9467.// BIG gB08D 786D 0ED3 4E39 7C6B 3ACF 8843 C3BF BAB1 A44D 0846 BB2A C3EE D432 B270 E710E083 B239 AF0E A5B8 693B F2FC A03B 6A73 E289 84FF 8623 1394 996F 6263 0845 AA94.
// BIG pD0A0 2D76 D210 58DA 4D91 BBC7 30AC 9186 5CB4 036C CDA4 6B49 4650 16BB 6931 2F12DF14 A0CC F38E B77C AD84 E6A1 2F2A A0D0 441A 734B 1D2B E944 5D10 BA87 609B 75E3.// BIG q8E00 82E3 C046 DFE6 C422 F44C C111 DBF6 ADEE 9467.// BIG gB08D 786D 0ED3 4E39 7C6B 3ACF 8843 C3BF BAB1 A44D 0846 BB2A C3EE D432 B270 E710E083 B239 AF0E A5B8 693B F2FC A03B 6A73 E289 84FF 8623 1394 996F 6263 0845 AA94.// BIG xEBAF 2948 1485 7E7C 2F48 C7B2 9334 2F09 DA1A EB04.
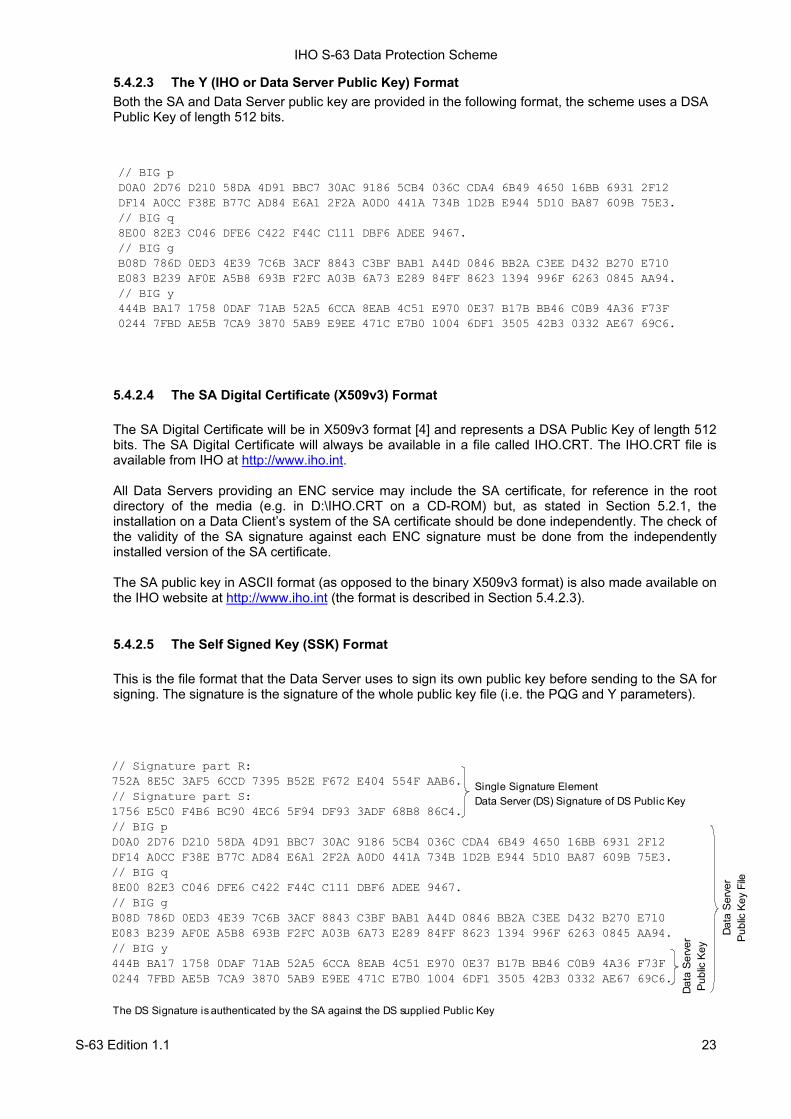
IHO S-63 Data Protection Scheme
S-63 Edition 1.1 23
5.4.2.3 The Y (IHO or Data Server Public Key) Format Both the SA and Data Server public key are provided in the following format, the scheme uses a DSA Public Key of length 512 bits.
5.4.2.4 The SA Digital Certificate (X509v3) Format
The SA Digital Certificate will be in X509v3 format [4] and represents a DSA Public Key of length 512 bits. The SA Digital Certificate will always be available in a file called IHO.CRT. The IHO.CRT file is available from IHO at http://www.iho.int.
All Data Servers providing an ENC service may include the SA certificate, for reference in the root directory of the media (e.g. in D:\IHO.CRT on a CD-ROM) but, as stated in Section 5.2.1, the installation on a Data Client’s system of the SA certificate should be done independently. The check of the validity of the SA signature against each ENC signature must be done from the independently installed version of the SA certificate.
The SA public key in ASCII format (as opposed to the binary X509v3 format) is also made available on the IHO website at http://www.iho.int (the format is described in Section 5.4.2.3).
5.4.2.5 The Self Signed Key (SSK) Format
This is the file format that the Data Server uses to sign its own public key before sending to the SA for signing. The signature is the signature of the whole public key file (i.e. the PQG and Y parameters).
// Signature part R:752A 8E5C 3AF5 6CCD 7395 B52E F672 E404 554F AAB6.// Signature part S:1756 E5C0 F4B6 BC90 4EC6 5F94 DF93 3ADF 68B8 86C4.// BIG pD0A0 2D76 D210 58DA 4D91 BBC7 30AC 9186 5CB4 036C CDA4 6B49 4650 16BB 6931 2F12DF14 A0CC F38E B77C AD84 E6A1 2F2A A0D0 441A 734B 1D2B E944 5D10 BA87 609B 75E3.// BIG q8E00 82E3 C046 DFE6 C422 F44C C111 DBF6 ADEE 9467.// BIG gB08D 786D 0ED3 4E39 7C6B 3ACF 8843 C3BF BAB1 A44D 0846 BB2A C3EE D432 B270 E710E083 B239 AF0E A5B8 693B F2FC A03B 6A73 E289 84FF 8623 1394 996F 6263 0845 AA94.// BIG y444B BA17 1758 0DAF 71AB 52A5 6CCA 8EAB 4C51 E970 0E37 B17B BB46 C0B9 4A36 F73F0244 7FBD AE5B 7CA9 3870 5AB9 E9EE 471C E7B0 1004 6DF1 3505 42B3 0332 AE67 69C6.
Single Signature ElementData Server (DS) Signature of DS Public Key
Data
Ser
ver
Publ
ic Ke
y Fi
le
Data
Ser
ver
Publ
ic Ke
y
The DS Signature is authenticated by the SA against the DS supplied Public Key
// BIG pD0A0 2D76 D210 58DA 4D91 BBC7 30AC 9186 5CB4 036C CDA4 6B49 4650 16BB 6931 2F12DF14 A0CC F38E B77C AD84 E6A1 2F2A A0D0 441A 734B 1D2B E944 5D10 BA87 609B 75E3.// BIG q8E00 82E3 C046 DFE6 C422 F44C C111 DBF6 ADEE 9467.// BIG gB08D 786D 0ED3 4E39 7C6B 3ACF 8843 C3BF BAB1 A44D 0846 BB2A C3EE D432 B270 E710E083 B239 AF0E A5B8 693B F2FC A03B 6A73 E289 84FF 8623 1394 996F 6263 0845 AA94.// BIG y444B BA17 1758 0DAF 71AB 52A5 6CCA 8EAB 4C51 E970 0E37 B17B BB46 C0B9 4A36 F73F0244 7FBD AE5B 7CA9 3870 5AB9 E9EE 471C E7B0 1004 6DF1 3505 42B3 0332 AE67 69C6.
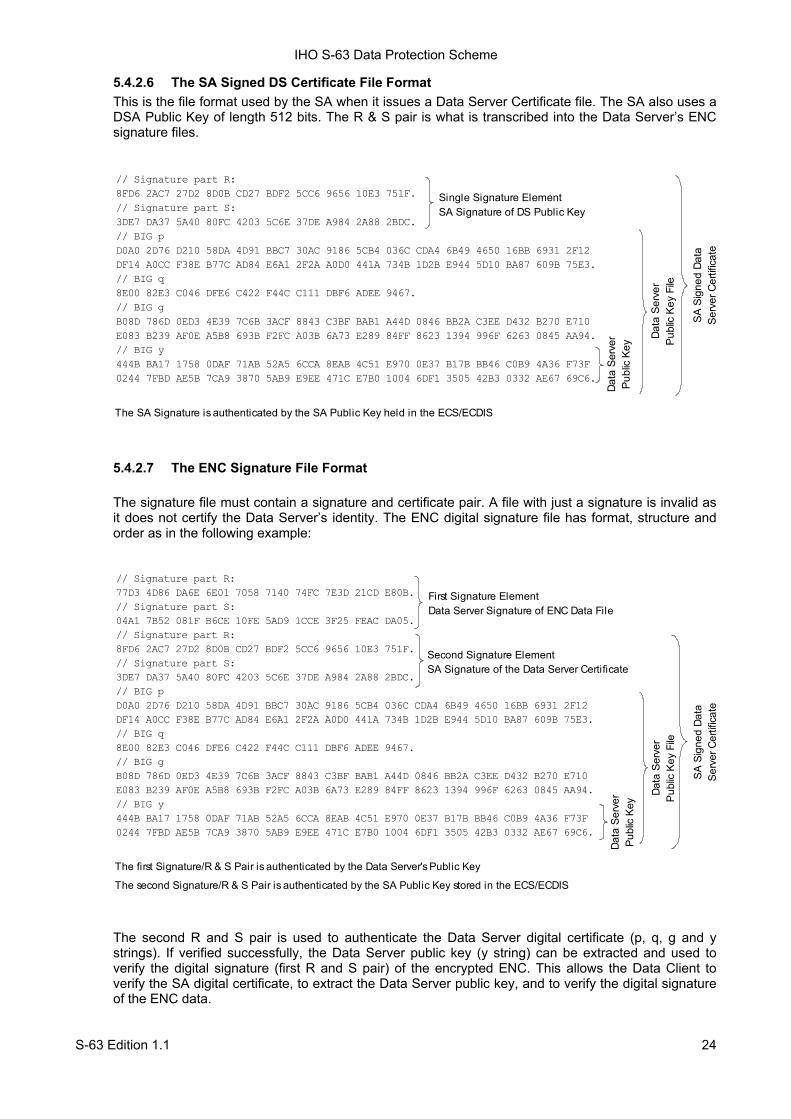
IHO S-63 Data Protection Scheme
S-63 Edition 1.1 24
5.4.2.6 The SA Signed DS Certificate File Format This is the file format used by the SA when it issues a Data Server Certificate file. The SA also uses a DSA Public Key of length 512 bits. The R & S pair is what is transcribed into the Data Server’s ENC signature files.
5.4.2.7 The ENC Signature File Format
The signature file must contain a signature and certificate pair. A file with just a signature is invalid as it does not certify the Data Server’s identity. The ENC digital signature file has format, structure and order as in the following example:
The second R and S pair is used to authenticate the Data Server digital certificate (p, q, g and y strings). If verified successfully, the Data Server public key (y string) can be extracted and used to verify the digital signature (first R and S pair) of the encrypted ENC. This allows the Data Client to verify the SA digital certificate, to extract the Data Server public key, and to verify the digital signature of the ENC data.
Single Signature ElementSA Signature of DS Public Key
Data
Ser
ver
Publ
ic Ke
y Fi
le
SA S
igne
d Da
taSe
rver
Cer
tifica
te
Data
Ser
ver
Publ
ic Ke
y
The SA Signature is authenticated by the SA Public Key held in the ECS/ECDIS
// Signature part R:8FD6 2AC7 27D2 8D0B CD27 BDF2 5CC6 9656 10E3 751F.// Signature part S:3DE7 DA37 5A40 80FC 4203 5C6E 37DE A984 2A88 2BDC.// BIG pD0A0 2D76 D210 58DA 4D91 BBC7 30AC 9186 5CB4 036C CDA4 6B49 4650 16BB 6931 2F12DF14 A0CC F38E B77C AD84 E6A1 2F2A A0D0 441A 734B 1D2B E944 5D10 BA87 609B 75E3.// BIG q8E00 82E3 C046 DFE6 C422 F44C C111 DBF6 ADEE 9467.// BIG gB08D 786D 0ED3 4E39 7C6B 3ACF 8843 C3BF BAB1 A44D 0846 BB2A C3EE D432 B270 E710E083 B239 AF0E A5B8 693B F2FC A03B 6A73 E289 84FF 8623 1394 996F 6263 0845 AA94.// BIG y444B BA17 1758 0DAF 71AB 52A5 6CCA 8EAB 4C51 E970 0E37 B17B BB46 C0B9 4A36 F73F0244 7FBD AE5B 7CA9 3870 5AB9 E9EE 471C E7B0 1004 6DF1 3505 42B3 0332 AE67 69C6.
First Signature ElementData Server Signature of ENC Data File
Second Signature ElementSA Signature of the Data Server Certificate
Data
Ser
ver
Publ
ic Ke
y Fi
le
SA S
igne
d Da
taSe
rver
Cer
tifica
te
Data
Ser
ver
Publ
ic Ke
y
The first Signature/R & S Pair is authenticated by the Data Server's Public Key The second Signature/R & S Pair is authenticated by the SA Public Key stored in the ECS/ECDIS
// Signature part R:77D3 4D86 DA6E 6E01 7058 7140 74FC 7E3D 21CD E80B.// Signature part S:04A1 7B52 081F B6CE 10FE 5AD9 1CCE 3F25 FEAC DA05.// Signature part R:8FD6 2AC7 27D2 8D0B CD27 BDF2 5CC6 9656 10E3 751F.// Signature part S:3DE7 DA37 5A40 80FC 4203 5C6E 37DE A984 2A88 2BDC.// BIG pD0A0 2D76 D210 58DA 4D91 BBC7 30AC 9186 5CB4 036C CDA4 6B49 4650 16BB 6931 2F12DF14 A0CC F38E B77C AD84 E6A1 2F2A A0D0 441A 734B 1D2B E944 5D10 BA87 609B 75E3.// BIG q8E00 82E3 C046 DFE6 C422 F44C C111 DBF6 ADEE 9467.// BIG gB08D 786D 0ED3 4E39 7C6B 3ACF 8843 C3BF BAB1 A44D 0846 BB2A C3EE D432 B270 E710E083 B239 AF0E A5B8 693B F2FC A03B 6A73 E289 84FF 8623 1394 996F 6263 0845 AA94.// BIG y444B BA17 1758 0DAF 71AB 52A5 6CCA 8EAB 4C51 E970 0E37 B17B BB46 C0B9 4A36 F73F0244 7FBD AE5B 7CA9 3870 5AB9 E9EE 471C E7B0 1004 6DF1 3505 42B3 0332 AE67 69C6.
IHO S-63 Data Protection Scheme
S-63 Edition 1.1 25
6 DATA MANAGEMENT
6.1 Introduction The loading and import of ENCs to an ECS/ECDIS must be carefully managed; this is especially true in a multiple Data Server environment. Since the scheme encrypts the entire contents of an ENC cell file (base and update), this restricts access to certain subfields in an ENC cell file required by OEM systems to manage the import of ENCs to the ECS/ECDIS SENC. As a consequence additional S-63 files are necessary to supplement this inaccessible data as well as modification to an existing S-57 file, i.e. the CATALOG.031 file. It has also been identified that the import of large numbers of ENCs has rendered some aspects of S-57 impractical to implement, e.g. a single exchange set split across multiple media volumes. For this reason it has been necessary to modify the loading strategy and utilise the additional S-63 files to better manage the installation and loading of ENCs across multiple exchange sets. As mentioned previously S-63 is designed to operate in a multiple data supplier environment. S-57 does not have a mechanism to discriminate between ENC exchange sets supplied by different data servers and therefore it has been necessary to cater for this in version 1.1 of this standard. The additional S-63 files contain important information that, if used correctly, can make the S-57 import process more efficient and intuitive for the Data Client. These are outlined in more detail below in this section. The loading/import method can be broken down into the following processes:
• Manage the import of Data Server specific ENC exchange sets using the Data Server ID. • Manage a Data Server’s service if extended across multiple exchange sets. • Manage the import of licenced ENC cells in a contiguous manner, ensuring all ENC base cells and
corresponding update files, if any, are imported correctly and sequentially. • Manage the import of text and picture files by maintaining a relationship between them and the cell file
they are associated with. The following table lists the additional S-63 files and file modifications together with their main purpose within S-63. These files and their associated formats are described in more detail at section 6.2, 6.3 & 6.4. File/Field Primary Management Function PRODUCTS.TXT Required to provide the following information:
1. The Issue Date of the Products File being installed. 2. A catalogue of all available cells in a Data Server’s service. 3. The coverage of all available cells in a service. 4. The latest Issue Date of all available cells in a service (including cancelled
cells). 5. The destination exchange set (base or update) where the ENC base cell file
(EN Application Profile) resides. This may be a base cell, new edition or re-issue.
SERIAL.ENC Required to provide the following information: 1. The Data Server ID. 2. The Exchange Set week number and date of issue. 3. Type of Exchange Set (base or update) 4. The Exchange Set number in a multiple series.
CATALOG.031 [CATD-COMT]
Required to provide information originally contained in the DSID field of the cell file to import the complete, sequential content of an exchange set.
6.2 ENC Product Listing (PRODUCTS.TXT) The file named ‘PRODUCTS.TXT’ will be supplied with each encrypted exchange set and will be stored in a folder named ‘INFO’ held in root directory. It is the mechanism for managing data within an ENC Service and exchanging it with data already held in the Data Client’s system SENC. The structure and format of this file is described in more detail in sections 6.2.1, 6.2.2, 6.2.3 & 6.2.4.
IHO S-63 Data Protection Scheme
S-63 Edition 1.1 26
There are two types of PRODUCTS.TXT file, “PARTIAL” and “FULL”. A partial products listing contains the current status of all ENCs contained in a single exchange set. A full product listing contains the current status of ALL cells in a Data Server’s service, that is, all exchange sets. Although procedures may vary between Data Servers a full product listing will always be provided with the weekly update exchange set. In instances where a Data Server issues a complete set of new base media (no weekly update), each base media must contain a full product list of all ENCs in a service NOTE: OEMs should ensure that their systems are able to handle “FULL” and “PARTIAL” product listings (section 6.2.2 refers). Base CDs may contain a partial listing with only the contents of the CD included. The Update will always carry a full product listing of all available ENCs in a Data Server’s Service. Licence and ENC information from different Data Server’s must be stored independently on the manufacturer’s system. The SERIAL.ENC file (see section 6.3) contains the Data Server ID and should be used in conjunction with the associated product listing to identify the source of the service. The latest product listing contains the current status of ENC cell data in a service. This file is used to compare available ENC cell data in the exchange set with information already stored in the OEMs SENC. The OEM system can then determine what new data is available for import. It is recommended that OEMs maintain a copy of the latest product listing on their systems to reflect the current status of a particular service. To manage both “FULL” and “PARTIAL” product listings it is essential that new information is merged with existing stored data and not overwritten.
6.2.1 Product List File Structure The content of the product list will be divided into sections. The Product List file is completely encoded in ASCII and contains 3 sections as follows:
Section Description
Header Contains general information about the nature of the Product List, e.g. the time of creation, version number.
:ENC Contains the current status of all ENC cells/updates provided by the data server. :ECS Contains information about other digital chart information provided by the data server.
6.2.2 Product List Header The Product List will always start with one Header Section. The Header Section will consist of several records. Each record will start at a new line and be terminated with ASCII CR/LF characters as within the signature files.
The Header will consist of the information fields defined in the example and table below. All the fields are mandatory and will always be defined in the same order.
Field Fieldname Value Date and Time :DATE YYYYMMDD HH:MM
The field name, date and time will be separated by a <space> character. The date will be provided as 20060627 and the time as 09:00:00 using the 24 hour clock. Example: :DATE 20061019 09:00:00
Product List Version :VERSION Integer in range 1 to 99. It will be incremented by 1 for each new version of the PRODUCTS.TXT file specification. S-63 Edition 1.1 defines the value as “2”. i.e. :VERSION 2
Content :CONTENT “FULL” Full copy of Product List “PARTIAL” Partial copy of Product List Code used to indicate if the Product List file contains a full or partial copy of the complete Product List. Example: :CONTENT FULL
Example:
:DATE 20061019 09:00:00 :VERSION 1 :CONTENT FULL
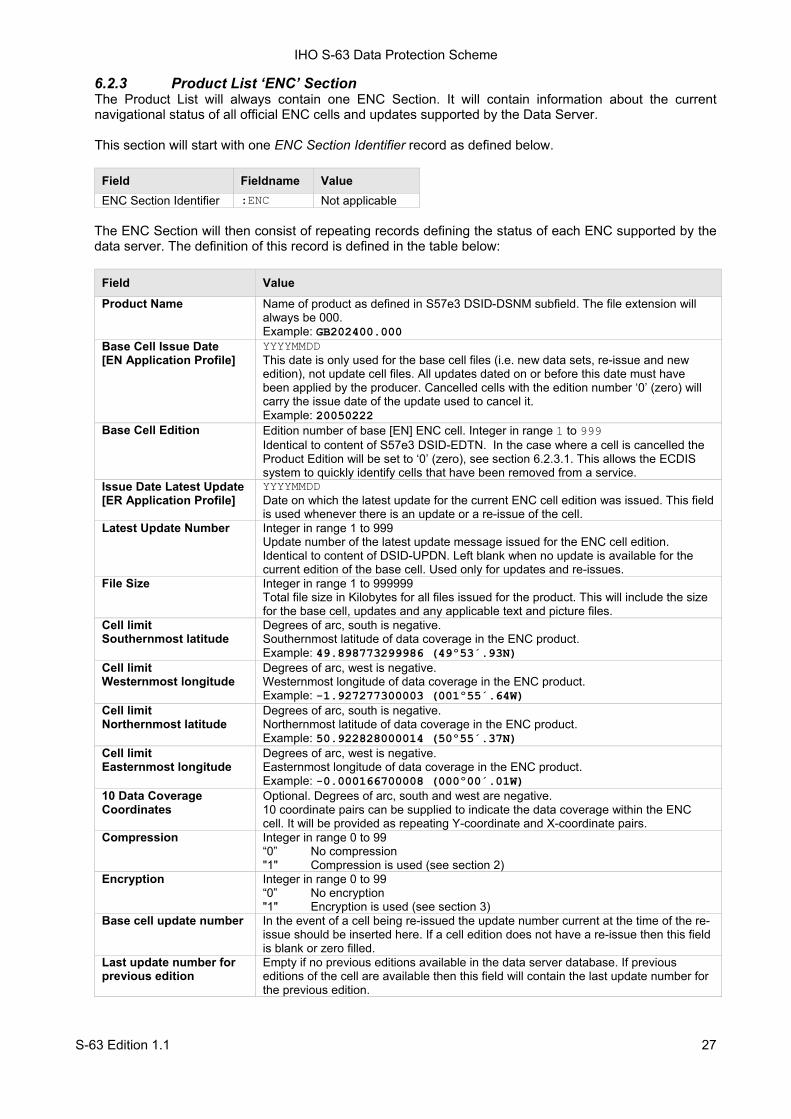
IHO S-63 Data Protection Scheme
S-63 Edition 1.1 27
6.2.3 Product List ‘ENC’ Section The Product List will always contain one ENC Section. It will contain information about the current navigational status of all official ENC cells and updates supported by the Data Server.
This section will start with one ENC Section Identifier record as defined below.
Field Fieldname Value ENC Section Identifier :ENC Not applicable
The ENC Section will then consist of repeating records defining the status of each ENC supported by the data server. The definition of this record is defined in the table below: Field Value
Product Name Name of product as defined in S57e3 DSID-DSNM subfield. The file extension will always be 000. Example: GB202400.000
Base Cell Issue Date [EN Application Profile]
YYYYMMDD This date is only used for the base cell files (i.e. new data sets, re-issue and new edition), not update cell files. All updates dated on or before this date must have been applied by the producer. Cancelled cells with the edition number ‘0’ (zero) will carry the issue date of the update used to cancel it. Example: 20050222
Base Cell Edition Edition number of base [EN] ENC cell. Integer in range 1 to 999 Identical to content of S57e3 DSID-EDTN. In the case where a cell is cancelled the Product Edition will be set to ‘0’ (zero), see section 6.2.3.1. This allows the ECDIS system to quickly identify cells that have been removed from a service.
Issue Date Latest Update [ER Application Profile]
YYYYMMDD Date on which the latest update for the current ENC cell edition was issued. This field is used whenever there is an update or a re-issue of the cell.
Latest Update Number Integer in range 1 to 999 Update number of the latest update message issued for the ENC cell edition. Identical to content of DSID-UPDN. Left blank when no update is available for the current edition of the base cell. Used only for updates and re-issues.
File Size Integer in range 1 to 999999 Total file size in Kilobytes for all files issued for the product. This will include the size for the base cell, updates and any applicable text and picture files.
Cell limit Southernmost latitude
Degrees of arc, south is negative. Southernmost latitude of data coverage in the ENC product. Example: 49.898773299986 (49º53´.93N)
Cell limit Westernmost longitude
Degrees of arc, west is negative. Westernmost longitude of data coverage in the ENC product. Example: -1.927277300003 (001º55´.64W)
Cell limit Northernmost latitude
Degrees of arc, south is negative. Northernmost latitude of data coverage in the ENC product. Example: 50.922828000014 (50º55´.37N)
Cell limit Easternmost longitude
Degrees of arc, west is negative. Easternmost longitude of data coverage in the ENC product. Example: -0.000166700008 (000º00´.01W)
10 Data Coverage Coordinates
Optional. Degrees of arc, south and west are negative. 10 coordinate pairs can be supplied to indicate the data coverage within the ENC cell. It will be provided as repeating Y-coordinate and X-coordinate pairs.
Compression Integer in range 0 to 99 “0” No compression "1" Compression is used (see section 2)
Encryption Integer in range 0 to 99 “0” No encryption "1" Encryption is used (see section 3)
Base cell update number In the event of a cell being re-issued the update number current at the time of the re-issue should be inserted here. If a cell edition does not have a re-issue then this field is blank or zero filled.
Last update number for previous edition
Empty if no previous editions available in the data server database. If previous editions of the cell are available then this field will contain the last update number for the previous edition.
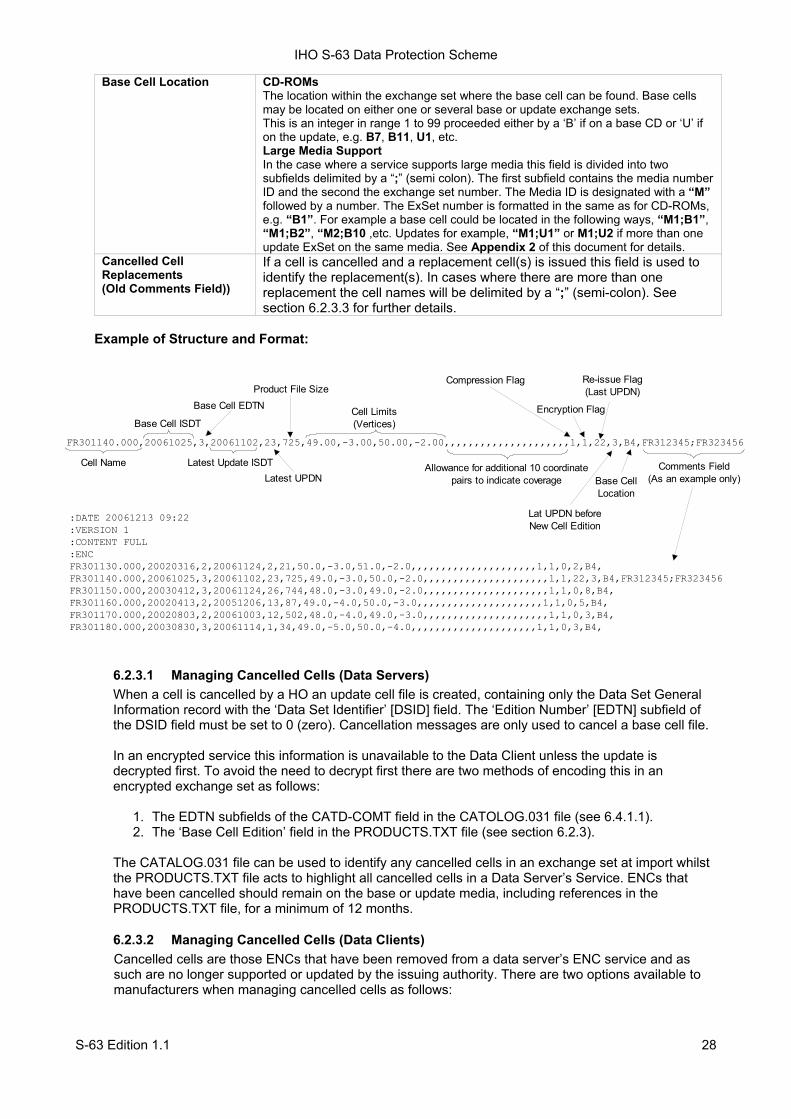
IHO S-63 Data Protection Scheme
S-63 Edition 1.1 28
Base Cell Location CD-ROMs The location within the exchange set where the base cell can be found. Base cells may be located on either one or several base or update exchange sets. This is an integer in range 1 to 99 proceeded either by a ‘B’ if on a base CD or ‘U’ if on the update, e.g. B7, B11, U1, etc. Large Media Support In the case where a service supports large media this field is divided into two subfields delimited by a “;” (semi colon). The first subfield contains the media number ID and the second the exchange set number. The Media ID is designated with a “M” followed by a number. The ExSet number is formatted in the same as for CD-ROMs, e.g. “B1”. For example a base cell could be located in the following ways, “M1;B1”, “M1;B2”, “M2;B10 ,etc. Updates for example, “M1;U1” or M1;U2 if more than one update ExSet on the same media. See Appendix 2 of this document for details.
Cancelled Cell Replacements (Old Comments Field))
If a cell is cancelled and a replacement cell(s) is issued this field is used to identify the replacement(s). In cases where there are more than one replacement the cell names will be delimited by a “;” (semi-colon). See section 6.2.3.3 for further details.
Example of Structure and Format:
6.2.3.1 Managing Cancelled Cells (Data Servers) When a cell is cancelled by a HO an update cell file is created, containing only the Data Set General Information record with the ‘Data Set Identifier’ [DSID] field. The ‘Edition Number’ [EDTN] subfield of the DSID field must be set to 0 (zero). Cancellation messages are only used to cancel a base cell file. In an encrypted service this information is unavailable to the Data Client unless the update is decrypted first. To avoid the need to decrypt first there are two methods of encoding this in an encrypted exchange set as follows:
1. The EDTN subfields of the CATD-COMT field in the CATOLOG.031 file (see 6.4.1.1). 2. The ‘Base Cell Edition’ field in the PRODUCTS.TXT file (see section 6.2.3).
The CATALOG.031 file can be used to identify any cancelled cells in an exchange set at import whilst the PRODUCTS.TXT file acts to highlight all cancelled cells in a Data Server’s Service. ENCs that have been cancelled should remain on the base or update media, including references in the PRODUCTS.TXT file, for a minimum of 12 months.
6.2.3.2 Managing Cancelled Cells (Data Clients) Cancelled cells are those ENCs that have been removed from a data server’s ENC service and as such are no longer supported or updated by the issuing authority. There are two options available to manufacturers when managing cancelled cells as follows:
:DATE 20061213 09:22:VERSION 1:CONTENT FULL:ENCFR301130.000,20020316,2,20061124,2,21,50.0,-3.0,51.0,-2.0,,,,,,,,,,,,,,,,,,,,,1,1,0,2,B4,FR301140.000,20061025,3,20061102,23,725,49.0,-3.0,50.0,-2.0,,,,,,,,,,,,,,,,,,,,,1,1,22,3,B4,FR312345;FR323456FR301150.000,20030412,3,20061124,26,744,48.0,-3.0,49.0,-2.0,,,,,,,,,,,,,,,,,,,,,1,1,0,8,B4,FR301160.000,20020413,2,20051206,13,87,49.0,-4.0,50.0,-3.0,,,,,,,,,,,,,,,,,,,,,1,1,0,5,B4,FR301170.000,20020803,2,20061003,12,502,48.0,-4.0,49.0,-3.0,,,,,,,,,,,,,,,,,,,,,1,1,0,3,B4,FR301180.000,20030830,3,20061114,1,34,49.0,-5.0,50.0,-4.0,,,,,,,,,,,,,,,,,,,,,1,1,0,3,B4,
FR301140.000,20061025,3,20061102,23,725,49.00,-3.00,50.00,-2.00,,,,,,,,,,,,,,,,,,,,,1,1,22,3,B4,FR312345;FR323456
Cell Name
Base Cell ISDT
Latest Update ISDT
Base Cell EDTN
Latest UPDN
Product File Size
Cell Limits(Vertices)
Allowance for additional 10 coordinate pairs to indicate coverage
Compression Flag
Encryption Flag
Re-issue Flag(Last UPDN)
Lat UPDN before New Cell Edition
Base Cell Location
Comments Field(As an example only)
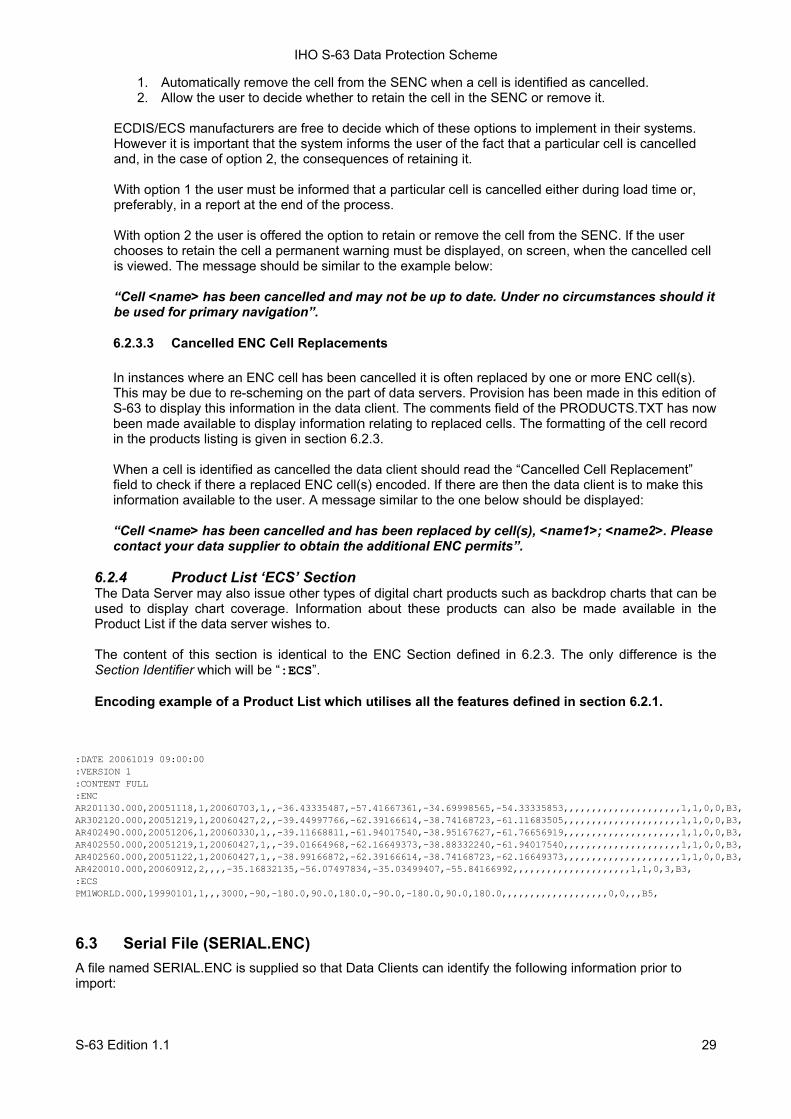
IHO S-63 Data Protection Scheme
S-63 Edition 1.1 29
1. Automatically remove the cell from the SENC when a cell is identified as cancelled. 2. Allow the user to decide whether to retain the cell in the SENC or remove it.
ECDIS/ECS manufacturers are free to decide which of these options to implement in their systems. However it is important that the system informs the user of the fact that a particular cell is cancelled and, in the case of option 2, the consequences of retaining it. With option 1 the user must be informed that a particular cell is cancelled either during load time or, preferably, in a report at the end of the process. With option 2 the user is offered the option to retain or remove the cell from the SENC. If the user chooses to retain the cell a permanent warning must be displayed, on screen, when the cancelled cell is viewed. The message should be similar to the example below: “Cell <name> has been cancelled and may not be up to date. Under no circumstances should it be used for primary navigation”.
6.2.3.3 Cancelled ENC Cell Replacements
In instances where an ENC cell has been cancelled it is often replaced by one or more ENC cell(s). This may be due to re-scheming on the part of data servers. Provision has been made in this edition of S-63 to display this information in the data client. The comments field of the PRODUCTS.TXT has now been made available to display information relating to replaced cells. The formatting of the cell record in the products listing is given in section 6.2.3. When a cell is identified as cancelled the data client should read the “Cancelled Cell Replacement” field to check if there a replaced ENC cell(s) encoded. If there are then the data client is to make this information available to the user. A message similar to the one below should be displayed: “Cell <name> has been cancelled and has been replaced by cell(s), <name1>; <name2>. Please contact your data supplier to obtain the additional ENC permits”.
6.2.4 Product List ‘ECS’ Section The Data Server may also issue other types of digital chart products such as backdrop charts that can be used to display chart coverage. Information about these products can also be made available in the Product List if the data server wishes to.
The content of this section is identical to the ENC Section defined in 6.2.3. The only difference is the Section Identifier which will be “:ECS”. Encoding example of a Product List which utilises all the features defined in section 6.2.1.
6.3 Serial File (SERIAL.ENC) A file named SERIAL.ENC is supplied so that Data Clients can identify the following information prior to import:
:DATE 20061019 09:00:00:VERSION 1:CONTENT FULL:ENCAR201130.000,20051118,1,20060703,1,,-36.43335487,-57.41667361,-34.69998565,-54.33335853,,,,,,,,,,,,,,,,,,,,,1,1,0,0,B3,AR302120.000,20051219,1,20060427,2,,-39.44997766,-62.39166614,-38.74168723,-61.11683505,,,,,,,,,,,,,,,,,,,,,1,1,0,0,B3,AR402490.000,20051206,1,20060330,1,,-39.11668811,-61.94017540,-38.95167627,-61.76656919,,,,,,,,,,,,,,,,,,,,,1,1,0,0,B3,AR402550.000,20051219,1,20060427,1,,-39.01664968,-62.16649373,-38.88332240,-61.94017540,,,,,,,,,,,,,,,,,,,,,1,1,0,0,B3,AR402560.000,20051122,1,20060427,1,,-38.99166872,-62.39166614,-38.74168723,-62.16649373,,,,,,,,,,,,,,,,,,,,,1,1,0,0,B3,AR420010.000,20060912,2,,,,-35.16832135,-56.07497834,-35.03499407,-55.84166992,,,,,,,,,,,,,,,,,,,,,1,1,0,3,B3,:ECSPM1WORLD.000,19990101,1,,,3000,-90,-180.0,90.0,180.0,-90.0,-180.0,90.0,180.0,,,,,,,,,,,,,,,,,,,0,0,,,B5,
IHO S-63 Data Protection Scheme
S-63 Edition 1.1 30
• Data Server ID (registered with the SA) • Week of Issue • Date of Issue • CD Type (Base or Update) • Format Version • Exchange Set Number (of a series of exchange sets)
6.3.1 SERIAL.ENC File Format The SERIAL.ENC file is provided to assist Data Client’s systems manage the import ENC CDs supplied by a specific Data Servers across multiple exchange sets. It should be the first file that is read from the exchange set as it contains important information about the IHO assigned Data Server’s ID, the CD Publication Date, type of CD, number of CDs in that particular Data Server’s service, etc.
The contents of this file can be cross referenced with the installed permits to check the status of the Data Client’s subscription status.
Field ID Domain Bytes Range Notes
(see below) Data Server ID character 2 Any two alphanumeric 1 Week of Issue character 10 Any ASCII characters 2 Date of publication date 8 YYYYMMDD 3 CD Type character 10 BASE or UPDATE 4 Format version decimal 5 01.00 – 99.99 5 Exchange Set Number character 6 B01-99X01-99 or U01-99X01-99 6 End of record delimiter hexadecimal 3 0x0B0D0A 7
Notes Explanation and Description
1 Data Server ID should be registered with the IHO; where the data server is also an HO the Agency code for the organisation is obtained from S-62 – IHO Codes for Producing Agencies.
2 The week of issue specifies the week and year that the CD is distributed, e.g., WK12-99, WK45-99, WK23-00, etc.
3 Date of publication is in the regular date format, YYYYMMDD, e.g., 19990414, 20000102, 20061102, etc. 4 The CD can be issued in two different types:
BASE: The format should be defined as BASE, the CD contains all ENs and any additional ERs. UPDATE: The format should be defined as UPDATE, contains any new ENs and all ERs issued since the issue of the last relevant Base CD.
5 Format version describes the version of the SERIAL.ENC file. The version that relates to edition 1.1 of S-63 is 02.00
6 This field must be used to show the exchange set number of a series, e.g. B02X03, which equates to Base CD 2 of a total of 3 Base CDs, U01X01 which equates to Update CD 1 of a total of 1.
7 The end of the record delimiter consists of binary characters, and therefore care should be taken when attempting to edit the file – it cannot be edited in Windows Notepad! This is the reason why the SERIAL.ENC file must always be edited in an ASCII/Hexadecimal editor. The delimiter does not normally need to be changed. The delimiter used is 0x0B0D0A.
The SERIAL.ENC file should be stored directly under the media root file, i.e. on the same level as the ENC_ROOT and INFO directories.
Example of SERIAL.ENC files PRWK15-99 19990414BASE 02.00B02X030x0B0D0A PRWK20-99 19990601UPDATE 02.00U01X010x0B0D0A (Where 0x0B0D0A is the end of record delimeter converted to hex)
6.4 The S-57 Catalogue File (CATALOG.031) The “Data Set Identification” [DSID] field is used by ECS/ECDIS to ensure that base cells and update files are imported to the SENC in the correct sequence and without omission. Since the complete ENC Cell file is encrypted, information in the DSID field of each cell file is not available to OEM systems, unless it is decrypted first.
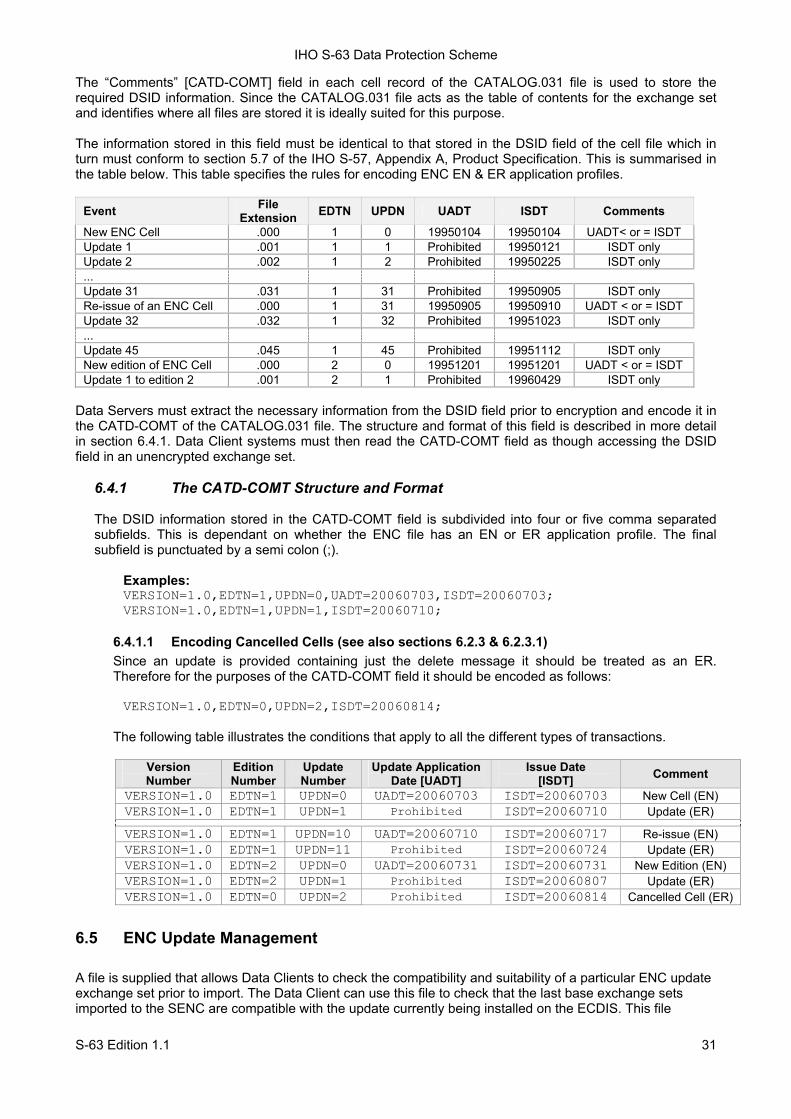
IHO S-63 Data Protection Scheme
S-63 Edition 1.1 31
The “Comments” [CATD-COMT] field in each cell record of the CATALOG.031 file is used to store the required DSID information. Since the CATALOG.031 file acts as the table of contents for the exchange set and identifies where all files are stored it is ideally suited for this purpose. The information stored in this field must be identical to that stored in the DSID field of the cell file which in turn must conform to section 5.7 of the IHO S-57, Appendix A, Product Specification. This is summarised in the table below. This table specifies the rules for encoding ENC EN & ER application profiles.
Event File Extension EDTN UPDN UADT ISDT Comments
New ENC Cell .000 1 0 19950104 19950104 UADT< or = ISDT Update 1 .001 1 1 Prohibited 19950121 ISDT only Update 2 .002 1 2 Prohibited 19950225 ISDT only ... Update 31 .031 1 31 Prohibited 19950905 ISDT only Re-issue of an ENC Cell .000 1 31 19950905 19950910 UADT < or = ISDT Update 32 .032 1 32 Prohibited 19951023 ISDT only ... Update 45 .045 1 45 Prohibited 19951112 ISDT only New edition of ENC Cell .000 2 0 19951201 19951201 UADT < or = ISDT Update 1 to edition 2 .001 2 1 Prohibited 19960429 ISDT only
Data Servers must extract the necessary information from the DSID field prior to encryption and encode it in the CATD-COMT of the CATALOG.031 file. The structure and format of this field is described in more detail in section 6.4.1. Data Client systems must then read the CATD-COMT field as though accessing the DSID field in an unencrypted exchange set.
6.4.1 The CATD-COMT Structure and Format
The DSID information stored in the CATD-COMT field is subdivided into four or five comma separated subfields. This is dependant on whether the ENC file has an EN or ER application profile. The final subfield is punctuated by a semi colon (;).
Examples:
VERSION=1.0,EDTN=1,UPDN=0,UADT=20060703,ISDT=20060703; VERSION=1.0,EDTN=1,UPDN=1,ISDT=20060710;
6.4.1.1 Encoding Cancelled Cells (see also sections 6.2.3 & 6.2.3.1) Since an update is provided containing just the delete message it should be treated as an ER. Therefore for the purposes of the CATD-COMT field it should be encoded as follows: VERSION=1.0,EDTN=0,UPDN=2,ISDT=20060814;
The following table illustrates the conditions that apply to all the different types of transactions.
Version Number
Edition Number
Update Number
Update Application Date [UADT]
Issue Date [ISDT] Comment
VERSION=1.0 EDTN=1 UPDN=0 UADT=20060703 ISDT=20060703 New Cell (EN) VERSION=1.0 EDTN=1 UPDN=1 Prohibited ISDT=20060710 Update (ER)
VERSION=1.0 EDTN=1 UPDN=10 UADT=20060710 ISDT=20060717 Re-issue (EN) VERSION=1.0 EDTN=1 UPDN=11 Prohibited ISDT=20060724 Update (ER) VERSION=1.0 EDTN=2 UPDN=0 UADT=20060731 ISDT=20060731 New Edition (EN) VERSION=1.0 EDTN=2 UPDN=1 Prohibited ISDT=20060807 Update (ER) VERSION=1.0 EDTN=0 UPDN=2 Prohibited ISDT=20060814 Cancelled Cell (ER)
6.5 ENC Update Management A file is supplied that allows Data Clients to check the compatibility and suitability of a particular ENC update exchange set prior to import. The Data Client can use this file to check that the last base exchange sets imported to the SENC are compatible with the update currently being installed on the ECDIS. This file
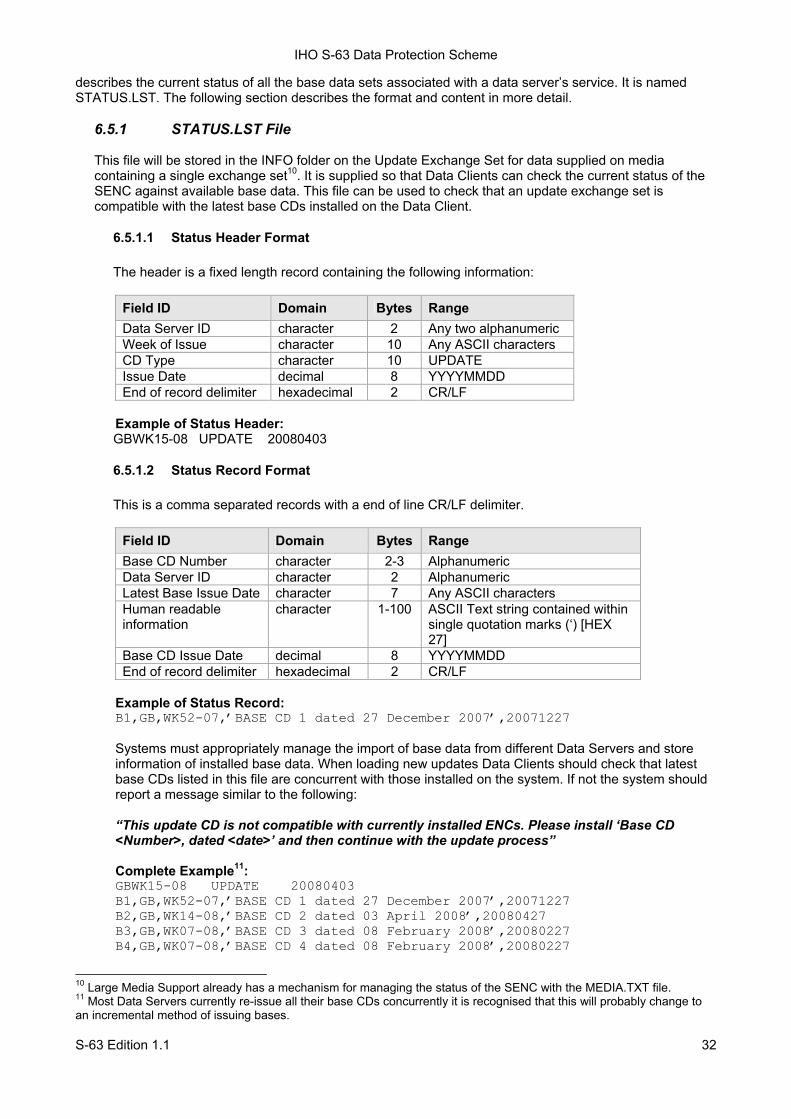
IHO S-63 Data Protection Scheme
S-63 Edition 1.1 32
describes the current status of all the base data sets associated with a data server’s service. It is named STATUS.LST. The following section describes the format and content in more detail.
6.5.1 STATUS.LST File
This file will be stored in the INFO folder on the Update Exchange Set for data supplied on media containing a single exchange set10. It is supplied so that Data Clients can check the current status of the SENC against available base data. This file can be used to check that an update exchange set is compatible with the latest base CDs installed on the Data Client.
6.5.1.1 Status Header Format
The header is a fixed length record containing the following information:
Field ID Domain Bytes Range Data Server ID character 2 Any two alphanumeric Week of Issue character 10 Any ASCII characters CD Type character 10 UPDATE Issue Date decimal 8 YYYYMMDD End of record delimiter hexadecimal 2 CR/LF
Example of Status Header: GBWK15-08 UPDATE 20080403
6.5.1.2 Status Record Format
This is a comma separated records with a end of line CR/LF delimiter.
Field ID Domain Bytes Range Base CD Number character 2-3 Alphanumeric Data Server ID character 2 Alphanumeric Latest Base Issue Date character 7 Any ASCII characters Human readable information
character 1-100 ASCII Text string contained within single quotation marks (‘) [HEX 27]
Base CD Issue Date decimal 8 YYYYMMDD End of record delimiter hexadecimal 2 CR/LF
Example of Status Record: B1,GB,WK52-07,’BASE CD 1 dated 27 December 2007’,20071227
Systems must appropriately manage the import of base data from different Data Servers and store information of installed base data. When loading new updates Data Clients should check that latest base CDs listed in this file are concurrent with those installed on the system. If not the system should report a message similar to the following:
“This update CD is not compatible with currently installed ENCs. Please install ‘Base CD <Number>, dated <date>’ and then continue with the update process”
Complete Example11: GBWK15-08 UPDATE 20080403 B1,GB,WK52-07,’BASE CD 1 dated 27 December 2007’,20071227 B2,GB,WK14-08,’BASE CD 2 dated 03 April 2008’,20080427
B3,GB,WK07-08,’BASE CD 3 dated 08 February 2008’,20080227 B4,GB,WK07-08,’BASE CD 4 dated 08 February 2008’,20080227
10 Large Media Support already has a mechanism for managing the status of the SENC with the MEDIA.TXT file. 11 Most Data Servers currently re-issue all their base CDs concurrently it is recognised that this will probably change to an incremental method of issuing bases.

IHO S-63 Data Protection Scheme
S-63 Edition 1.1 33
6.6 The S-57 Readme File (README.TXT) Data Servers currently use the README.TXT to encode important information that relates to their services. This information can include the following: 1. General service information provided by the Data Server. 2. Specific information provided by RENCs and individual ENC producers concerning their ENC data. 3. Any cautionary information about specific ENC data, such as overlapping ENC coverage or known issues
with specific cells. Although the inclusion of the README.TXT file is not mandated in the S-57 Product Specification it has become an important source of information in all commercial ENC services, especially given the increasing amount of ENCs available from many different producer nations. With this in mind it is strongly recommended that Data Client systems are able to display this file on demand. Since this file is relatively unknown to users it would be useful for the Data Client system to display when installing ENC data to forcibly bring it to their attention.

IHO S-63 Data Protection Scheme
S-63 Edition 1.1 34
Page intentionally left blank
IHO S-63 Data Protection Scheme
S-63 Edition 1.1 35
7 DIRECTORY and FILE STRUCTURE
7.1 Introduction The scheme does not mandate the use of a particular directory or file structure. However, because the entire ENC data file is encrypted it is difficult to maintain some vital file associations, e.g. text and picture files with the relevant ENC cell file (base or update). The directory structure that has been adopted by existing Data Servers is given in an example below in section at 7.5.1.1. This structure enables text and picture files to be safely managed by maintaining a direct relationship between them and the corresponding ENC data file.
7.2 S-57 File Management The directory structure is not mandated and may vary between Data Servers. The location of all S-57 files in an encrypted exchange set is defined in the CATALOG.031 file. That is, the path to all files in the exchange set is specified in each file record.
7.3 File Structure As well as the exchange set [ENC_ROOT] the root directory contains a folder named ‘INFO’ that contains the PRODUCTS.TXT file (see section 6.2), STATUS.LST (see section 6.5) and any additional, or extra, yet to be defined, files as specified by individual Data Servers. The root directory also contains the SERIAL.ENC file (see section 6.3). Each ENC Cell file in the exchange set under ENC_ROOT has a corresponding signature file (see section 5.3). Data Servers currently supply the authentication certificate (.CRT) with an S-63 encrypted exchange set to support S-63 edition 1.0 implementations. This certificate file is contained in the root directory. Edition 1.1 does not support the supply of this file with S-63 exchange sets. Data Servers will continue to support this for a limited period after which it will be withdrawn from their services. OEMs can program their systems to automatically detect an exchange set or a group of exchange sets however; this should not be hard coded into the system. If the media contains an unexpected format the system should default to a browse facility so that users can manually specify the location of the ENC_ROOT directory of a required exchange set. An S-63 exchange set must always contain a folder named ENC_ROOT which must contain a single CATALOG.031 file and at least one data set file.
7.4 Folder and File Naming All folders and files must be named according to the conventions set out in the IHO S-57 Product Specification and this document. All folders and files in an S-63 encrypted exchange set must be in UPPER CASE.
7.5 Exchange Set Media Data Servers may supply exchange sets to Data Client’s using several different methods, for example:
1. CD-ROM 2. Large Media Support 3. On-line Services
7.5.1 CD-ROM Encrypted exchange sets delivered by this method will be given the volume ID consistent with the IHO S-57 Data Protection Scheme, i.e. V01X03, V01X02, etc. S-63 can be delivered as a single exchange set across multiple CD-ROMs but experience gained by existing Data Servers has shown this to be inadvisable. The method currently operated by certain Data Servers is to issue single exchanges sets across multiple CDs.
IHO S-63 Data Protection Scheme
S-63 Edition 1.1 36
7.5.1.1 Folder Definitions Although the example below is based on a Base CD the Update CD is very similar, the only difference being that the update does not necessarily hold all the base cell data. However the update must contain data that is consistent and sequential for the Base CD to which it applies.
7.5.2 Large Media Support Large Media Support is defined as devices capable of storing much larger volumes of data than a standard CD-ROM. Details relating to the storage of S-63 encrypted ENCs on such devices is given at Appendix 2. 7.5.3 On-Line Services Data Clients can download exchange sets from RENC/VAR as defined by the service provider. The download is then copied to a hard media and depending on the media the RENC/VAR will advise on the volume ID to assign to the media. It must be re-iterated that any copied exchange sets [ENC_ROOT] must at all time conform to section 5.4 of the IHO S-57 Appendix B, Product Specifications.
ENC_ROOT
GB0224GA.TIF
IHO.CRT
GB004_17.TXT
EXCHANGE SET
GB100004
INFO
SERIAL.ENC
NO
DE
GB
COUN
TRY
FOLD
ERS
PRODUCTS.TXT
GB100002
GB100001GR
GB61032A
4 [Current Edition of ENC]
SE
0 [Base Cell Folder]
XX
3
2
1 GB100004.000[ENC Cell File]
GB001_12.TXT
GBI00004.000[Signature File]
ENC
SEQ
UENT
IAL
UPDA
TES BASE CELL O
R UPDATE SPECIFICTEXT AND PICTURE FILES
AN EXAMPLE OF THE DIRECTORY AND FILE STRUCTURECURRENTLY USED BY SOME EXISTING DATA SERVERS
NOTE: This is only an example and therefore should not behard coded into manufacturer equipment as it may be subjectchange or vary between Data Servers.
CATALOG.031
README.TXT
NOTE: The location of all files in the exchange set [ENC_ROOT] can be read from the CATALOG.031 file
STATUS.LST
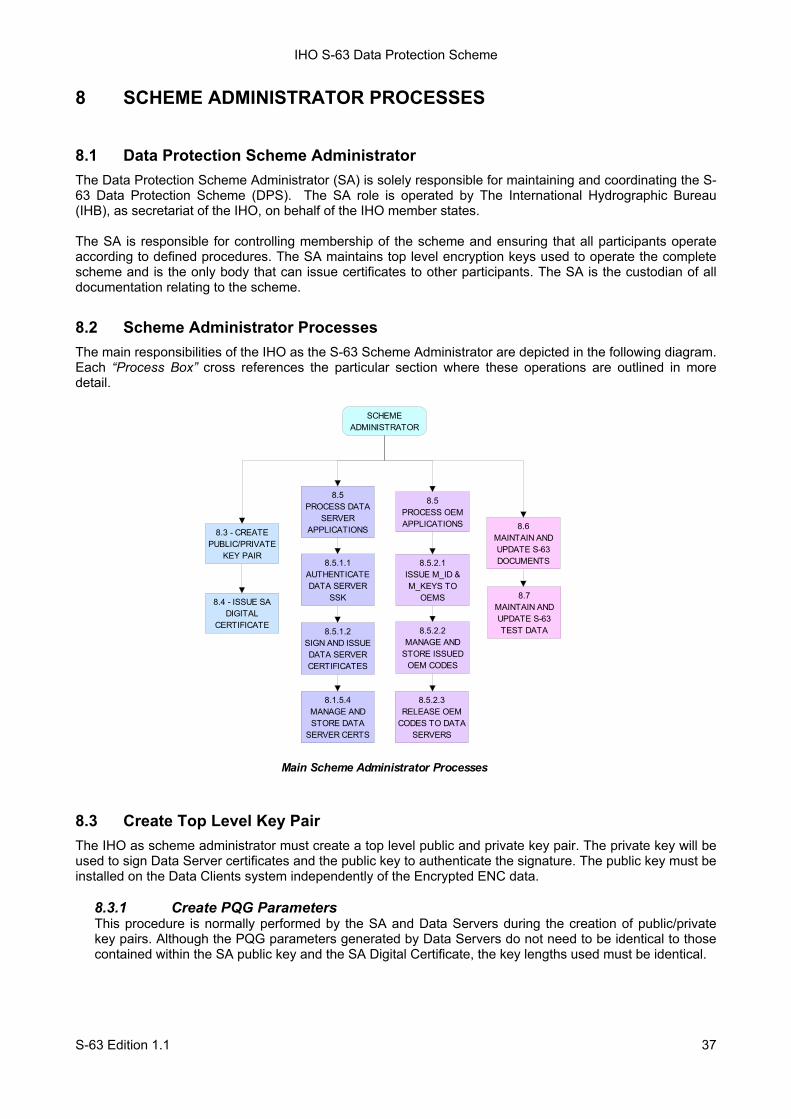
IHO S-63 Data Protection Scheme
S-63 Edition 1.1 37
8 SCHEME ADMINISTRATOR PROCESSES
8.1 Data Protection Scheme Administrator The Data Protection Scheme Administrator (SA) is solely responsible for maintaining and coordinating the S-63 Data Protection Scheme (DPS). The SA role is operated by The International Hydrographic Bureau (IHB), as secretariat of the IHO, on behalf of the IHO member states. The SA is responsible for controlling membership of the scheme and ensuring that all participants operate according to defined procedures. The SA maintains top level encryption keys used to operate the complete scheme and is the only body that can issue certificates to other participants. The SA is the custodian of all documentation relating to the scheme.
8.2 Scheme Administrator Processes The main responsibilities of the IHO as the S-63 Scheme Administrator are depicted in the following diagram. Each “Process Box” cross references the particular section where these operations are outlined in more detail.
8.3 Create Top Level Key Pair The IHO as scheme administrator must create a top level public and private key pair. The private key will be used to sign Data Server certificates and the public key to authenticate the signature. The public key must be installed on the Data Clients system independently of the Encrypted ENC data.
8.3.1 Create PQG Parameters This procedure is normally performed by the SA and Data Servers during the creation of public/private key pairs. Although the PQG parameters generated by Data Servers do not need to be identical to those contained within the SA public key and the SA Digital Certificate, the key lengths used must be identical.
Main Scheme Administrator Processes
8.3 - CREATEPUBLIC/PRIVATE
KEY PAIR
8.4 - ISSUE SA DIGITAL
CERTIFICATE
8.5PROCESS DATA
SERVER APPLICATIONS
8.5.1.1AUTHENTICATE DATA SERVER
SSK
8.5.1.2SIGN AND ISSUE DATA SERVER CERTIFICATES
8.1.5.4MANAGE AND STORE DATA
SERVER CERTS
8.5PROCESS OEM APPLICATIONS
8.5.2.1ISSUE M_ID & M_KEYS TO
OEMS
8.5.2.2MANAGE AND
STORE ISSUED OEM CODES
8.5.2.3RELEASE OEM
CODES TO DATA SERVERS
8.6MAINTAIN AND UPDATE S-63 DOCUMENTS
8.7MAINTAIN AND UPDATE S-63 TEST DATA
SCHEME ADMINISTRATOR
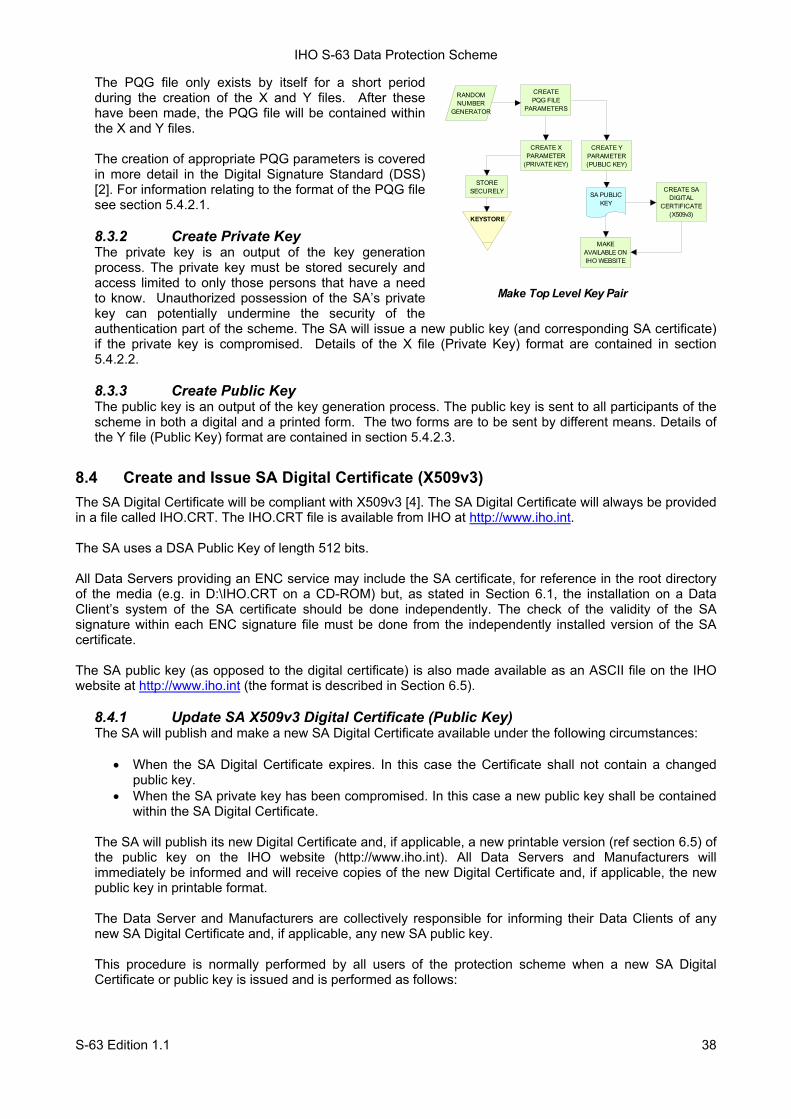
IHO S-63 Data Protection Scheme
S-63 Edition 1.1 38
The PQG file only exists by itself for a short period during the creation of the X and Y files. After these have been made, the PQG file will be contained within the X and Y files. The creation of appropriate PQG parameters is covered in more detail in the Digital Signature Standard (DSS) [2]. For information relating to the format of the PQG file see section 5.4.2.1. 8.3.2 Create Private Key The private key is an output of the key generation process. The private key must be stored securely and access limited to only those persons that have a need to know. Unauthorized possession of the SA’s private key can potentially undermine the security of the authentication part of the scheme. The SA will issue a new public key (and corresponding SA certificate) if the private key is compromised. Details of the X file (Private Key) format are contained in section 5.4.2.2. 8.3.3 Create Public Key The public key is an output of the key generation process. The public key is sent to all participants of the scheme in both a digital and a printed form. The two forms are to be sent by different means. Details of the Y file (Public Key) format are contained in section 5.4.2.3.
8.4 Create and Issue SA Digital Certificate (X509v3) The SA Digital Certificate will be compliant with X509v3 [4]. The SA Digital Certificate will always be provided in a file called IHO.CRT. The IHO.CRT file is available from IHO at http://www.iho.int. The SA uses a DSA Public Key of length 512 bits. All Data Servers providing an ENC service may include the SA certificate, for reference in the root directory of the media (e.g. in D:\IHO.CRT on a CD-ROM) but, as stated in Section 6.1, the installation on a Data Client’s system of the SA certificate should be done independently. The check of the validity of the SA signature within each ENC signature file must be done from the independently installed version of the SA certificate. The SA public key (as opposed to the digital certificate) is also made available as an ASCII file on the IHO website at http://www.iho.int (the format is described in Section 6.5).
8.4.1 Update SA X509v3 Digital Certificate (Public Key) The SA will publish and make a new SA Digital Certificate available under the following circumstances:
• When the SA Digital Certificate expires. In this case the Certificate shall not contain a changed
public key. • When the SA private key has been compromised. In this case a new public key shall be contained
within the SA Digital Certificate.
The SA will publish its new Digital Certificate and, if applicable, a new printable version (ref section 6.5) of the public key on the IHO website (http://www.iho.int). All Data Servers and Manufacturers will immediately be informed and will receive copies of the new Digital Certificate and, if applicable, the new public key in printable format.
The Data Server and Manufacturers are collectively responsible for informing their Data Clients of any new SA Digital Certificate and, if applicable, any new SA public key.
This procedure is normally performed by all users of the protection scheme when a new SA Digital Certificate or public key is issued and is performed as follows:
CREATE X PARAMETER
(PRIVATE KEY)
CREATEPQG FILE
PARAMETERS
STORESECURELY
KEYSTORE
CREATE Y PARAMETER(PUBLIC KEY)
Make Top Level Key Pair
SA PUBLIC KEY
MAKE AVAILABLE ON IHO WEBSITE
RANDOM NUMBER
GENERATOR
CREATE SA DIGITAL
CERTIFICATE(X509v3)
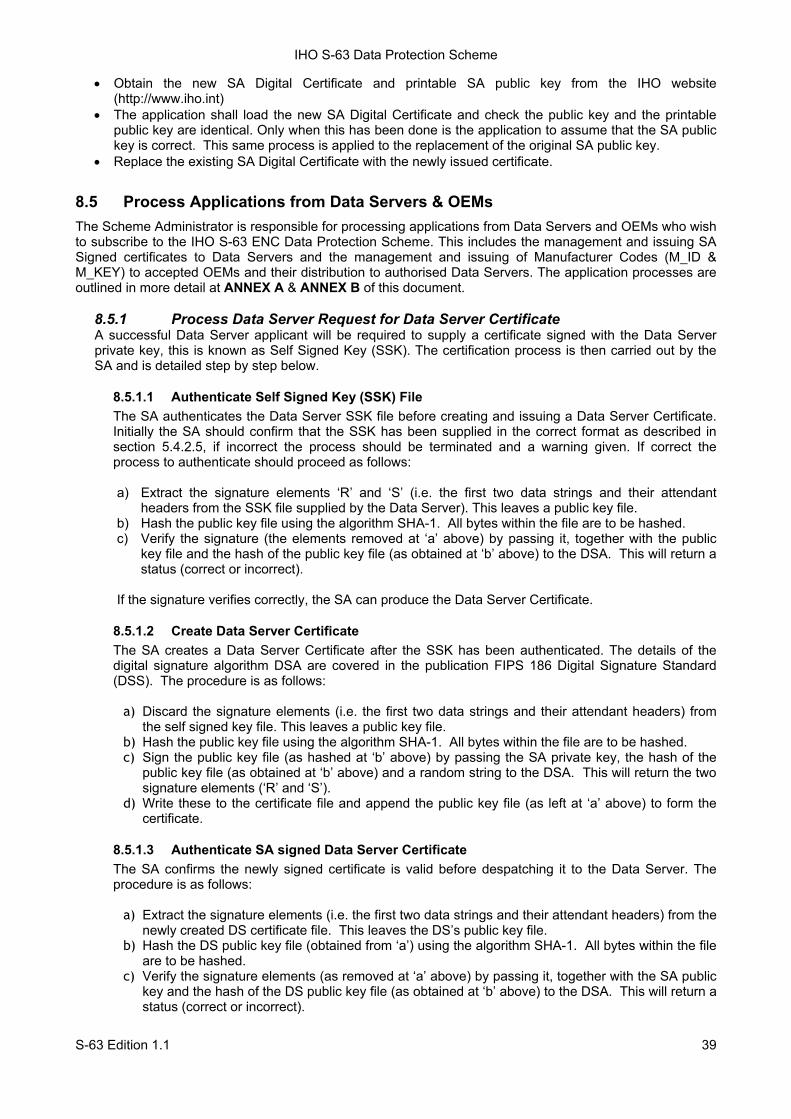
IHO S-63 Data Protection Scheme
S-63 Edition 1.1 39
• Obtain the new SA Digital Certificate and printable SA public key from the IHO website (http://www.iho.int)
• The application shall load the new SA Digital Certificate and check the public key and the printable public key are identical. Only when this has been done is the application to assume that the SA public key is correct. This same process is applied to the replacement of the original SA public key.
• Replace the existing SA Digital Certificate with the newly issued certificate.
8.5 Process Applications from Data Servers & OEMs The Scheme Administrator is responsible for processing applications from Data Servers and OEMs who wish to subscribe to the IHO S-63 ENC Data Protection Scheme. This includes the management and issuing SA Signed certificates to Data Servers and the management and issuing of Manufacturer Codes (M_ID & M_KEY) to accepted OEMs and their distribution to authorised Data Servers. The application processes are outlined in more detail at ANNEX A & ANNEX B of this document.
8.5.1 Process Data Server Request for Data Server Certificate A successful Data Server applicant will be required to supply a certificate signed with the Data Server private key, this is known as Self Signed Key (SSK). The certification process is then carried out by the SA and is detailed step by step below.
8.5.1.1 Authenticate Self Signed Key (SSK) File The SA authenticates the Data Server SSK file before creating and issuing a Data Server Certificate. Initially the SA should confirm that the SSK has been supplied in the correct format as described in section 5.4.2.5, if incorrect the process should be terminated and a warning given. If correct the process to authenticate should proceed as follows:
a) Extract the signature elements ‘R’ and ‘S’ (i.e. the first two data strings and their attendant
headers from the SSK file supplied by the Data Server). This leaves a public key file. b) Hash the public key file using the algorithm SHA-1. All bytes within the file are to be hashed. c) Verify the signature (the elements removed at ‘a’ above) by passing it, together with the public
key file and the hash of the public key file (as obtained at ‘b’ above) to the DSA. This will return a status (correct or incorrect).
If the signature verifies correctly, the SA can produce the Data Server Certificate.
8.5.1.2 Create Data Server Certificate The SA creates a Data Server Certificate after the SSK has been authenticated. The details of the digital signature algorithm DSA are covered in the publication FIPS 186 Digital Signature Standard (DSS). The procedure is as follows:
a) Discard the signature elements (i.e. the first two data strings and their attendant headers) from
the self signed key file. This leaves a public key file. b) Hash the public key file using the algorithm SHA-1. All bytes within the file are to be hashed. c) Sign the public key file (as hashed at ‘b’ above) by passing the SA private key, the hash of the
public key file (as obtained at ‘b’ above) and a random string to the DSA. This will return the two signature elements (‘R’ and ‘S’).
d) Write these to the certificate file and append the public key file (as left at ‘a’ above) to form the certificate.
8.5.1.3 Authenticate SA signed Data Server Certificate The SA confirms the newly signed certificate is valid before despatching it to the Data Server. The procedure is as follows:
a) Extract the signature elements (i.e. the first two data strings and their attendant headers) from the
newly created DS certificate file. This leaves the DS’s public key file. b) Hash the DS public key file (obtained from ‘a’) using the algorithm SHA-1. All bytes within the file
are to be hashed. c) Verify the signature elements (as removed at ‘a’ above) by passing it, together with the SA public
key and the hash of the DS public key file (as obtained at ‘b’ above) to the DSA. This will return a status (correct or incorrect).
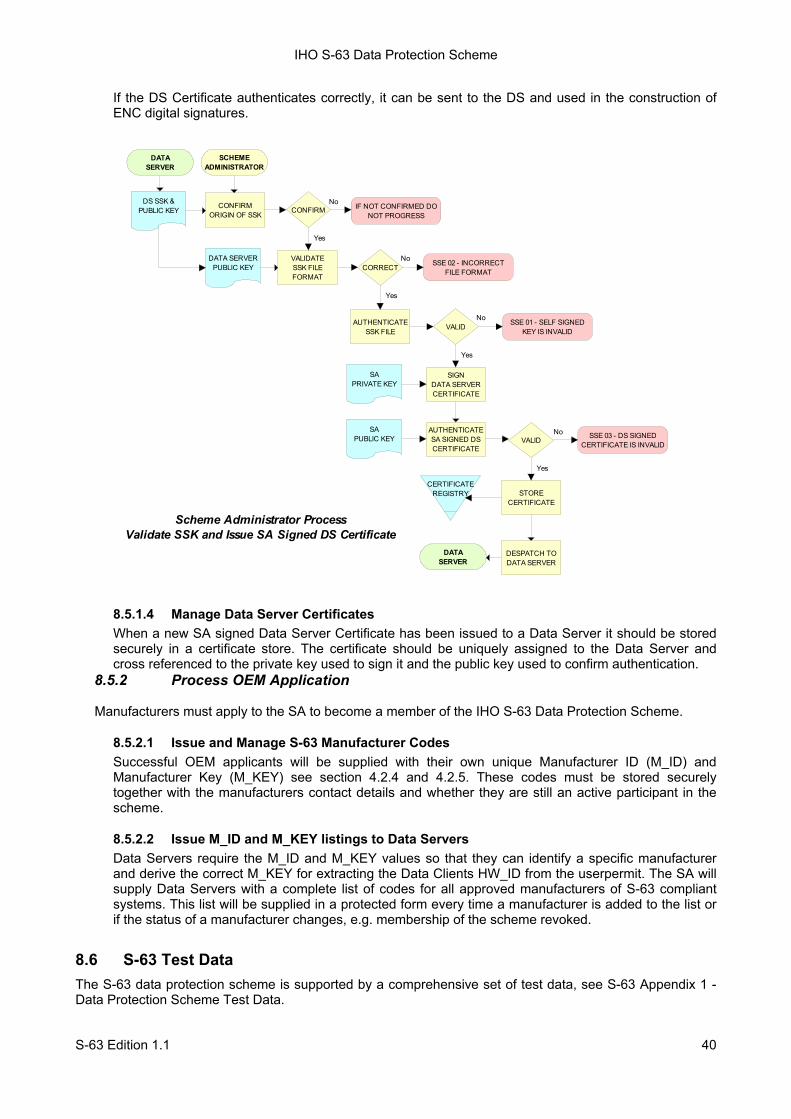
IHO S-63 Data Protection Scheme
S-63 Edition 1.1 40
If the DS Certificate authenticates correctly, it can be sent to the DS and used in the construction of ENC digital signatures.
8.5.1.4 Manage Data Server Certificates When a new SA signed Data Server Certificate has been issued to a Data Server it should be stored securely in a certificate store. The certificate should be uniquely assigned to the Data Server and cross referenced to the private key used to sign it and the public key used to confirm authentication.
8.5.2 Process OEM Application
Manufacturers must apply to the SA to become a member of the IHO S-63 Data Protection Scheme.
8.5.2.1 Issue and Manage S-63 Manufacturer Codes Successful OEM applicants will be supplied with their own unique Manufacturer ID (M_ID) and Manufacturer Key (M_KEY) see section 4.2.4 and 4.2.5. These codes must be stored securely together with the manufacturers contact details and whether they are still an active participant in the scheme.
8.5.2.2 Issue M_ID and M_KEY listings to Data Servers Data Servers require the M_ID and M_KEY values so that they can identify a specific manufacturer and derive the correct M_KEY for extracting the Data Clients HW_ID from the userpermit. The SA will supply Data Servers with a complete list of codes for all approved manufacturers of S-63 compliant systems. This list will be supplied in a protected form every time a manufacturer is added to the list or if the status of a manufacturer changes, e.g. membership of the scheme revoked.
8.6 S-63 Test Data The S-63 data protection scheme is supported by a comprehensive set of test data, see S-63 Appendix 1 - Data Protection Scheme Test Data.
CONFIRMORIGIN OF SSK
VALIDATESSK FILE FORMAT
IF NOT CONFIRMED DO NOT PROGRESS
SIGNDATA SERVERCERTIFICATE
AUTHENTICATESSK FILE
SSE 02 - INCORRECT FILE FORMAT
CONFIRM
CORRECT
VALID SSE 01 - SELF SIGNED KEY IS INVALID
DATA SERVERPUBLIC KEY
DS SSK & PUBLIC KEY
SCHEME ADMINISTRATOR
DATASERVER
SAPRIVATE KEY
AUTHENTICATESA SIGNED DS CERTIFICATE
VALIDSA
PUBLIC KEY SSE 03 - DS SIGNED CERTIFICATE IS INVALID
STORECERTIFICATE
DESPATCH TO DATA SERVER
CERTIFICATEREGISTRY
DATASERVER
Scheme Administrator ProcessValidate SSK and Issue SA Signed DS Certificate
No
Yes
No
Yes
No
Yes
No
Yes

IHO S-63 Data Protection Scheme
S-63 Edition 1.1 41
8.7 Scheme Administrator – Security QA Procedures 8.7.1 Documentation The SA shall hold the documentation for the Data Protection Scheme. This shall be held under change control procedure and the SA shall inform all participants (Data Servers and developers of Data Client applications) of the Data Protection Scheme, of changes to the standard.
Test data for the Data Protection Scheme and a software kernel are also available for system manufacturers to test their implementation for full compliance. The test data and software kernel are described in Appendix A and B and obtainable from the IHO website (http://www.iho.int). 8.7.2 Administration of Confidentiality Agreement All details required to operate the security scheme and all proprietary information (e.g. M_KEY) will be provided to interested parties under cover of a Confidentiality Agreement. The SA shall be responsible for administering this agreement. The Confidentiality Agreement will limit the possibilities for participants to breach the Data Protection Scheme. 8.7.3 Audit of Security Registers The SA shall have the ability to audit all security registers maintained by the participants of the Data Protection Scheme. The content of these registers are defined in Sections 9.3.2.3, 9.3.3.3, 9.7.3 and 10.10.3. The SA shall audit these registers to confirm that they are complete and up-to-date. Any problems must be corrected immediately or the participant shall become non-compliant and optionally may be withdrawn from the protection scheme. 8.7.4 Creation of M_IDs and M_KEYs The SA shall be responsible for creating and issuing the M_ID and M_KEY values used within the Data Protection Scheme. The SA shall record, in a M_ID / M_KEY Register all M_ID/M_KEY values and which organisations have received which values. The SA will ensure that no duplicate values are created.
The SA will provide information to all Data Servers in the protection scheme on amendments to M_ID and M_KEY values. 8.7.5 Creation of Digital Signature Keys (Private and Public Keys) The SA shall have the ability to create a private and public key pair. The private key is used in the certificate signing process and the public key in the signature authentication process.
The private key must be stored securely and access to it limited to only those persons that have a “need to know”. The SA will issue a new public key (and corresponding SA certificate) if the current private key is compromised.
The SA public key should be made available to all participants of the S-63 Data Protection Scheme in both digital and printed forms, e.g. fax and downloadable from a website. The two formats are to be sent or made available by different methods. 8.7.6 Acceptance of Self Signed Keys (SSK) The SA shall confirm that any self signed key provided by a Data Server is bona-fide by contacting the originating organisation. This can be done either by phone, fax or mail but the origins must be confirmed to the Scheme Administrator’s satisfaction before the DS certificate is signed by the SA using the self signed key. The SA is to record all SSKs received in a SSK Register. 8.7.7 Creation of Data Server (DS) Certificates The SA shall be able to create SA signed DS Certificates from the self signed keys provided by a DS and the SA private key. The signed certificate should be authenticated against the DS public key before being sent to the DS. The SA shall keep a record of all DS certificates in a DS Certificate Register.
The DS will be required to sign a Confidentiality Agreement before the SA will issue the DS Certificate. The SA will provide information to all participants of the protection scheme on any revoked Data Server Certificates.
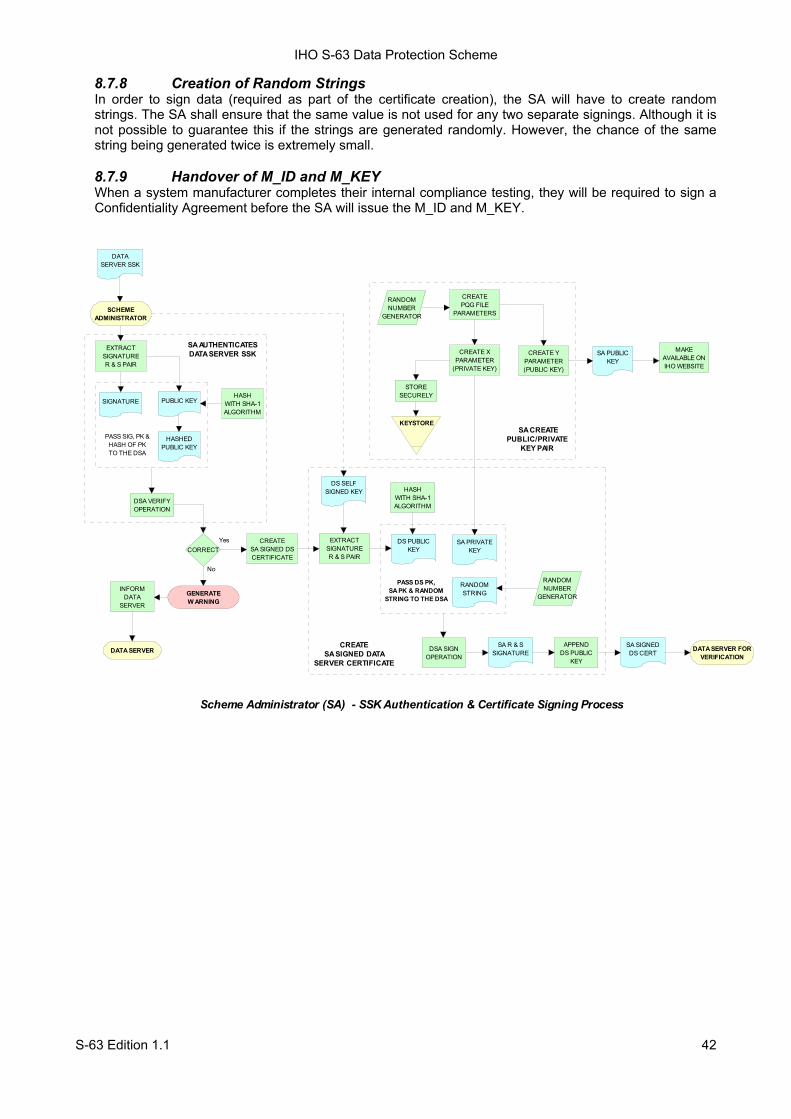
IHO S-63 Data Protection Scheme
S-63 Edition 1.1 42
8.7.8 Creation of Random Strings In order to sign data (required as part of the certificate creation), the SA will have to create random strings. The SA shall ensure that the same value is not used for any two separate signings. Although it is not possible to guarantee this if the strings are generated randomly. However, the chance of the same string being generated twice is extremely small. 8.7.9 Handover of M_ID and M_KEY When a system manufacturer completes their internal compliance testing, they will be required to sign a Confidentiality Agreement before the SA will issue the M_ID and M_KEY.
DSA VERIFY OPERATION
CORRECT
EXTRACTSIGNATURER & S PAIR
HASHWITH SHA-1ALGORITHM
SIGNATURE
HASHEDPUBLIC KEY
PUBLIC KEY
GENERATEW ARNING
DATA SERVER SSK
CREATESA SIGNED DS CERTIFICATE
SA AUTHENTICATESDATA SERVER SSK CREATE X
PARAMETER(PRIVATE KEY)
CREATEPQG FILE
PARAMETERS
STORESECURELY
KEYSTORE
CREATE Y PARAMETER(PUBLIC KEY)
SA CREATEPUBLIC/PRIVATE
KEY PAIR
CREATESA SIGNED DATA
SERVER CERTIFICATE
EXTRACTSIGNATURER & S PAIR
DS PUBLIC KEY
DS SELF SIGNED KEY HASH
WITH SHA-1ALGORITHM
SA PRIVATE KEY
RANDOM STRING
SCHEME ADMINISTRATOR
No
DSA SIGN OPERATION
APPENDDS PUBLIC
KEY
SA SIGNED DS CERT
DATA SERVER FOR VERIFICATION
SA PUBLIC KEY
MAKE AVAILABLE ON IHO WEBSITE
PASS DS PK,SA PK & RANDOM
STRING TO THE DSA
PASS SIG, PK &HASH OF PKTO THE DSA
RANDOM NUMBER
GENERATOR
RANDOM NUMBER
GENERATOR
Yes
DATA SERVER
INFORM DATA
SERVER
Scheme Administrator (SA) - SSK Authentication & Certificate Signing Process
SA R & S SIGNATURE
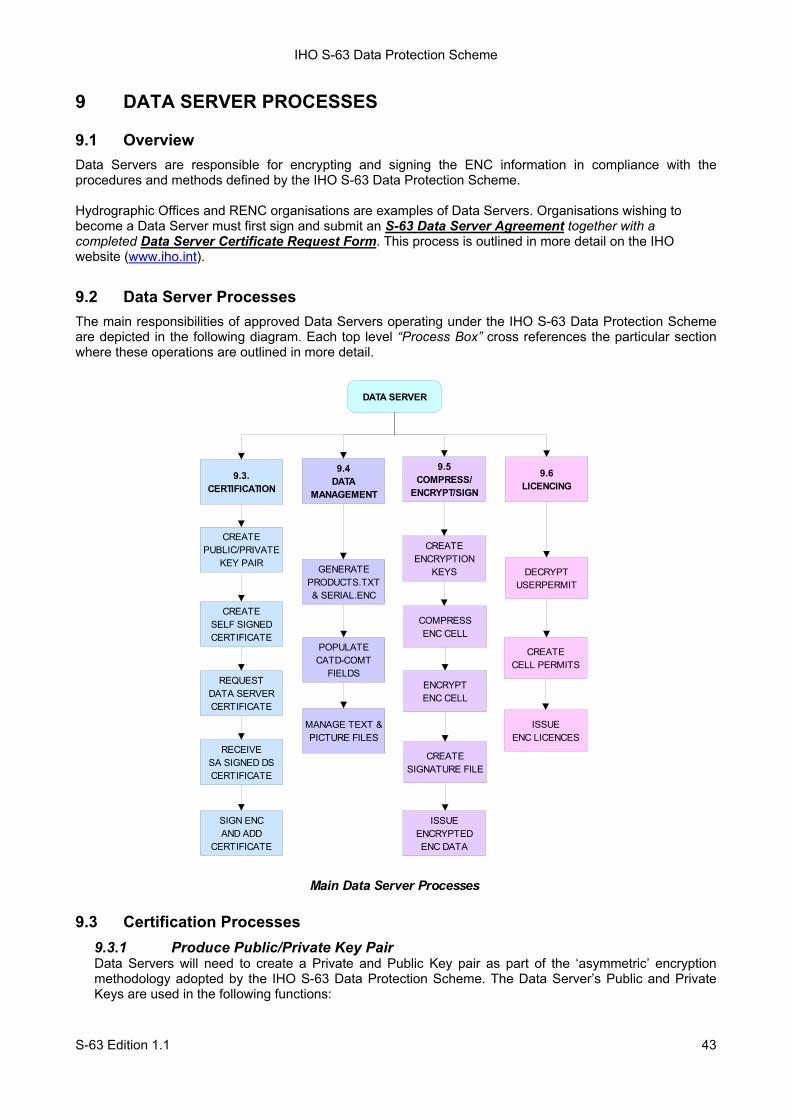
IHO S-63 Data Protection Scheme
S-63 Edition 1.1 43
9 DATA SERVER PROCESSES
9.1 Overview Data Servers are responsible for encrypting and signing the ENC information in compliance with the procedures and methods defined by the IHO S-63 Data Protection Scheme. Hydrographic Offices and RENC organisations are examples of Data Servers. Organisations wishing to become a Data Server must first sign and submit an S-63 Data Server Agreement together with a completed Data Server Certificate Request Form. This process is outlined in more detail on the IHO website (www.iho.int).
9.2 Data Server Processes The main responsibilities of approved Data Servers operating under the IHO S-63 Data Protection Scheme are depicted in the following diagram. Each top level “Process Box” cross references the particular section where these operations are outlined in more detail.
9.3 Certification Processes 9.3.1 Produce Public/Private Key Pair Data Servers will need to create a Private and Public Key pair as part of the ‘asymmetric’ encryption methodology adopted by the IHO S-63 Data Protection Scheme. The Data Server’s Public and Private Keys are used in the following functions:
CREATEPUBLIC/PRIVATE
KEY PAIR
REQUESTDATA SERVER CERTIFICATE
CREATESELF SIGNED CERTIFICATE
RECEIVESA SIGNED DS CERTIFICATE
CREATEENCRYPTION
KEYS
SIGN ENCAND ADD
CERTIFICATE
ENCRYPTENC CELL
COMPRESSENC CELL
DECRYPTUSERPERMIT
CREATECELL PERMITS
CREATESIGNATURE FILE
Main Data Server Processes
ISSUE ENCRYPTED ENC DATA
DATA SERVER
ISSUEENC LICENCES
POPULATE CATD-COMT
FIELDS
GENERATEPRODUCTS.TXT & SERIAL.ENC
MANAGE TEXT & PICTURE FILES
9.3. CERTIFICATION
9.4DATA
MANAGEMENT
9.5COMPRESS/
ENCRYPT/SIGN
9.6LICENCING
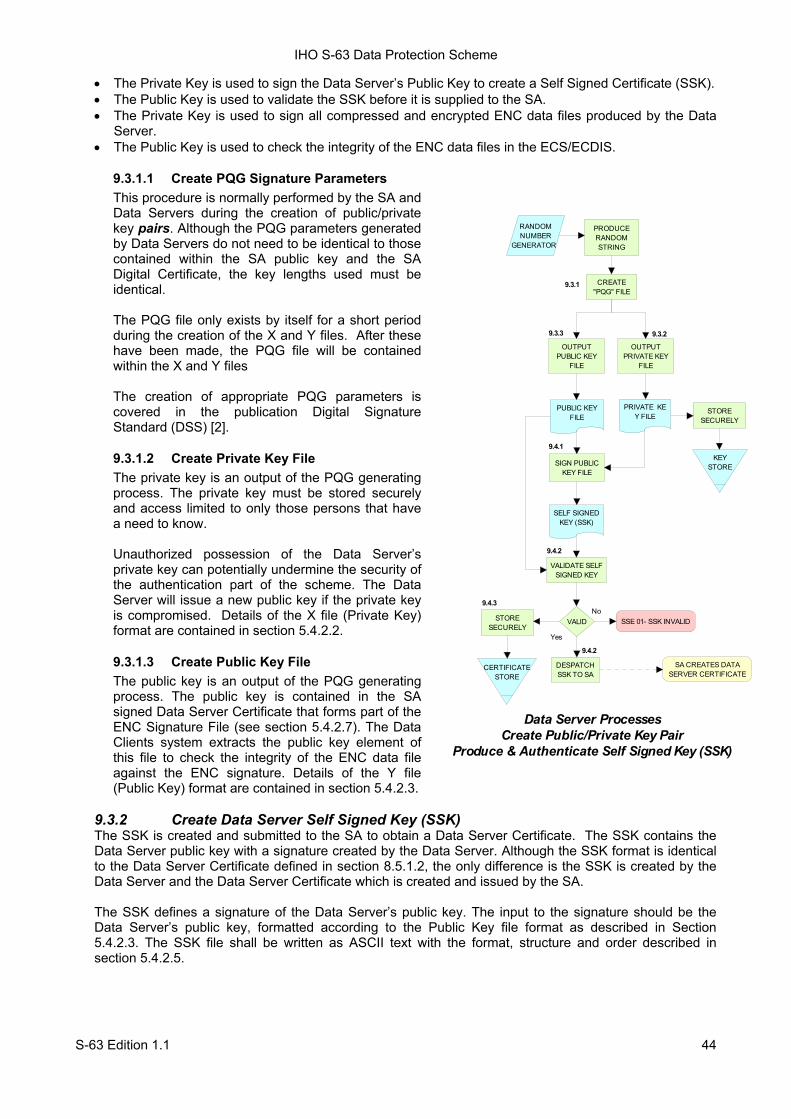
IHO S-63 Data Protection Scheme
S-63 Edition 1.1 44
• The Private Key is used to sign the Data Server’s Public Key to create a Self Signed Certificate (SSK). • The Public Key is used to validate the SSK before it is supplied to the SA. • The Private Key is used to sign all compressed and encrypted ENC data files produced by the Data
Server. • The Public Key is used to check the integrity of the ENC data files in the ECS/ECDIS.
9.3.1.1 Create PQG Signature Parameters This procedure is normally performed by the SA and Data Servers during the creation of public/private key pairs. Although the PQG parameters generated by Data Servers do not need to be identical to those contained within the SA public key and the SA Digital Certificate, the key lengths used must be identical.
The PQG file only exists by itself for a short period during the creation of the X and Y files. After these have been made, the PQG file will be contained within the X and Y files
The creation of appropriate PQG parameters is covered in the publication Digital Signature Standard (DSS) [2].
9.3.1.2 Create Private Key File The private key is an output of the PQG generating process. The private key must be stored securely and access limited to only those persons that have a need to know.
Unauthorized possession of the Data Server’s private key can potentially undermine the security of the authentication part of the scheme. The Data Server will issue a new public key if the private key is compromised. Details of the X file (Private Key) format are contained in section 5.4.2.2.
9.3.1.3 Create Public Key File The public key is an output of the PQG generating process. The public key is contained in the SA signed Data Server Certificate that forms part of the ENC Signature File (see section 5.4.2.7). The Data Clients system extracts the public key element of this file to check the integrity of the ENC data file against the ENC signature. Details of the Y file (Public Key) format are contained in section 5.4.2.3.
9.3.2 Create Data Server Self Signed Key (SSK) The SSK is created and submitted to the SA to obtain a Data Server Certificate. The SSK contains the Data Server public key with a signature created by the Data Server. Although the SSK format is identical to the Data Server Certificate defined in section 8.5.1.2, the only difference is the SSK is created by the Data Server and the Data Server Certificate which is created and issued by the SA.
The SSK defines a signature of the Data Server’s public key. The input to the signature should be the Data Server’s public key, formatted according to the Public Key file format as described in Section 5.4.2.3. The SSK file shall be written as ASCII text with the format, structure and order described in section 5.4.2.5.
RANDOM NUMBER
GENERATOR
PRODUCE RANDOM STRING
CREATE "PQG" FILE
OUTPUT PRIVATE KEY
FILE
OUTPUT PUBLIC KEY
FILE
STORE SECURELY
KEYSTORE
PUBLIC KEY FILE
SIGN PUBLIC KEY FILE
VALIDATE SELF SIGNED KEY
SELF SIGNED KEY (SSK)
VALID SSE 01- SSK INVALIDNo
DESPATCHSSK TO SA
Yes
Data Server ProcessesCreate Public/Private Key Pair
Produce & Authenticate Self Signed Key (SSK)
PRIVATE KEY FILE
SA CREATES DATA SERVER CERTIFICATE
9.3.1
9.3.3 9.3.2
9.4.1
9.4.2
CERTIFICATESTORE
STORE SECURELY
9.4.3
9.4.2
IHO S-63 Data Protection Scheme
S-63 Edition 1.1 45
9.3.2.1 Sign Public Key and Generate SSK This procedure is normally performed once by a Data Server to create its self signed key (SSK) which is then sent to the SA who will use it to create a Data Server Certificate. The details of the digital signature algorithm DSA are covered in the publication FIPS 186 Digital Signature Standard (DSS) [2]. The procedure is as follows:
a) Hash the public key file using the algorithm SHA-1 [3]. All bytes within the file are to be hashed. b) Sign the public key file (as hashed at ‘b’ above) by passing the private key file, the hash of the
public key file (as obtained at ‘b’ above) and a random string through the DSA algorithm [2]. This will return the two signature elements (‘R’ and ‘S’).
c) Write these to the self signed key file in the format defined in Section 5.4.2.5 and append the public key file to form the self signed key file.
9.3.2.2 Authenticate/Validate Data Server SSK Data Servers must authenticate the SSK against the Data Server public key to confirm that a valid SSK has been produced.
a) Extract the signature elements ‘R’ and ‘S’ (i.e. the first two data strings and their attendant
headers from the SSK file supplied by the Data Server). This leaves a public key file. b) Hash the public key file using the algorithm SHA-1. All bytes within the file are to be hashed. c) Verify the signature (the elements removed at ‘a’ above) by passing it, together with the public
key file and the hash of the public key file (as obtained at ‘b’ above) to the DSA. This will return a status valid or invalid.
If the SSK is valid then it can be supplied to the SA with a copy of the Data Server’s public key.
9.3.2.3 Store Self Signed Key Any SSK produced by the Data Server must be stored securely in a Certificate Register and cross referenced with the associated Public/Private Key pair.
9.3.3 Validate Certificates
9.3.3.1 Authenticate X509 SA Digital Certificate This procedure is performed by:
a) Data Servers as part of verifying the SA public key required to authenticate the Data Server
Certificate b) Data Clients to verify the SA public key to be used to authenticate the digital signatures supplied
with the ENC data
The Data Server procedure is as follows:
Manually compare the SA public key contained within the SA Digital Certificate with a copy of the printable public key available from the IHO website (http://www.iho.int). If the above check fails, the Data Server shall not accept the SA Digital Certificate. Otherwise, the SA Digital Certificate is valid and the SA public key it contains can be used in the production of ENC signature files.
9.3.3.2 Authenticate SA signed Data Server Certificate This procedure is performed by Data Servers to authenticate the certificate obtained from the SA before it is used. If Data Servers use an automated means of authentication then the software employed should first check the following:
a) There is a certificate available to authenticate b) If available, is it in the correct format as per section 5.4.2.6
If a failure is reported in either of these two options the process is to be terminated and an appropriate warning given. Otherwise the process to authenticate should proceed as follows:
a) Obtain the SA public key from the IHO website http://www.iho.int.
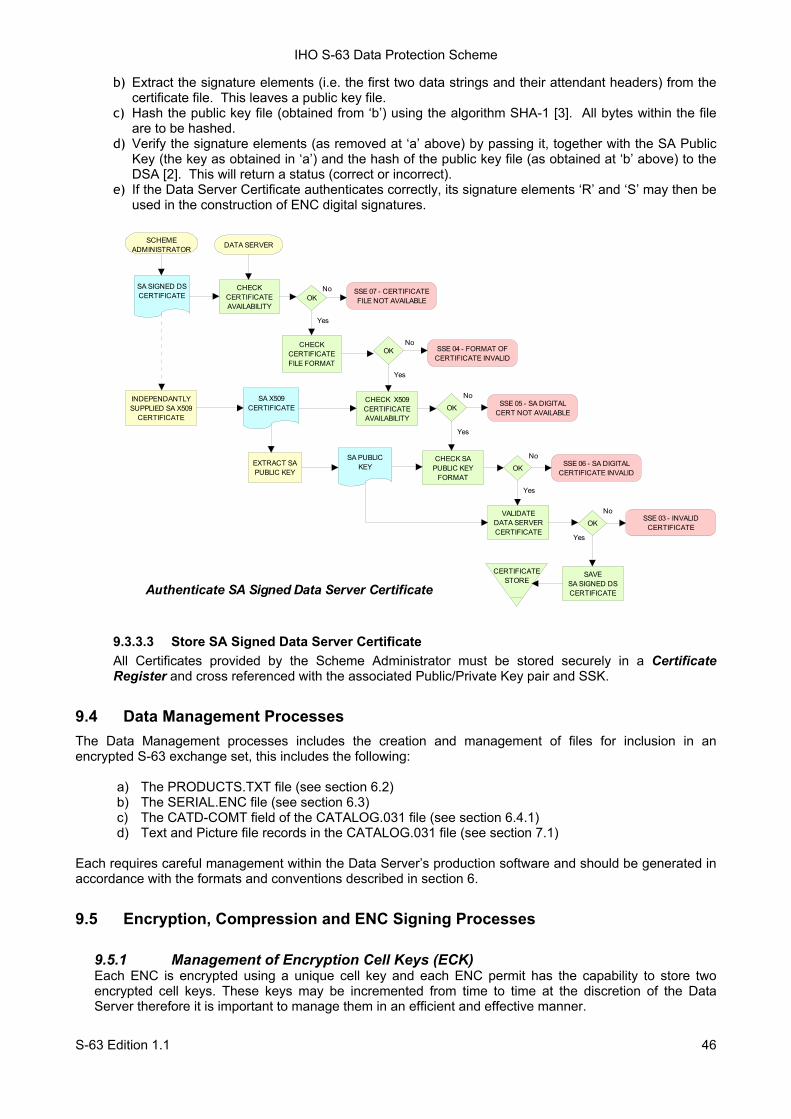
IHO S-63 Data Protection Scheme
S-63 Edition 1.1 46
b) Extract the signature elements (i.e. the first two data strings and their attendant headers) from the certificate file. This leaves a public key file.
c) Hash the public key file (obtained from ‘b’) using the algorithm SHA-1 [3]. All bytes within the file are to be hashed.
d) Verify the signature elements (as removed at ‘a’ above) by passing it, together with the SA Public Key (the key as obtained in ‘a’) and the hash of the public key file (as obtained at ‘b’ above) to the DSA [2]. This will return a status (correct or incorrect).
e) If the Data Server Certificate authenticates correctly, its signature elements ‘R’ and ‘S’ may then be used in the construction of ENC digital signatures.
9.3.3.3 Store SA Signed Data Server Certificate All Certificates provided by the Scheme Administrator must be stored securely in a Certificate Register and cross referenced with the associated Public/Private Key pair and SSK.
9.4 Data Management Processes The Data Management processes includes the creation and management of files for inclusion in an encrypted S-63 exchange set, this includes the following:
a) The PRODUCTS.TXT file (see section 6.2) b) The SERIAL.ENC file (see section 6.3) c) The CATD-COMT field of the CATALOG.031 file (see section 6.4.1) d) Text and Picture file records in the CATALOG.031 file (see section 7.1)
Each requires careful management within the Data Server’s production software and should be generated in accordance with the formats and conventions described in section 6.
9.5 Encryption, Compression and ENC Signing Processes
9.5.1 Management of Encryption Cell Keys (ECK) Each ENC is encrypted using a unique cell key and each ENC permit has the capability to store two encrypted cell keys. These keys may be incremented from time to time at the discretion of the Data Server therefore it is important to manage them in an efficient and effective manner.
SA SIGNED DS CERTIFICATE
SCHEME ADMINISTRATOR
CHECKCERTIFICATE AVAILABILITY
OK
CHECKCERTIFICATE FILE FORMAT
OK
CHECK X509 CERTIFICATE AVAILABILITY
OKSA X509
CERTIFICATE
SA PUBLIC KEYEXTRACT SA
PUBLIC KEY
CHECK SA PUBLIC KEY
FORMATOK
VALIDATEDATA SERVER CERTIFICATE
OK
SAVESA SIGNED DS CERTIFICATE
CERTIFICATESTORE
Authenticate SA Signed Data Server Certificate
DATA SERVER
Yes
SSE 07 - CERTIFICATE FILE NOT AVAILABLE
SSE 03 - INVALID CERTIFICATE
SSE 06 - SA DIGITAL CERTIFICATE INVALID
SSE 05 - SA DIGITAL CERT NOT AVAILABLE
SSE 04 - FORMAT OF CERTIFICATE INVALID
No
No
No
No
Yes
No
Yes
Yes
Yes
INDEPENDANTLYSUPPLIED SA X509
CERTIFICATE
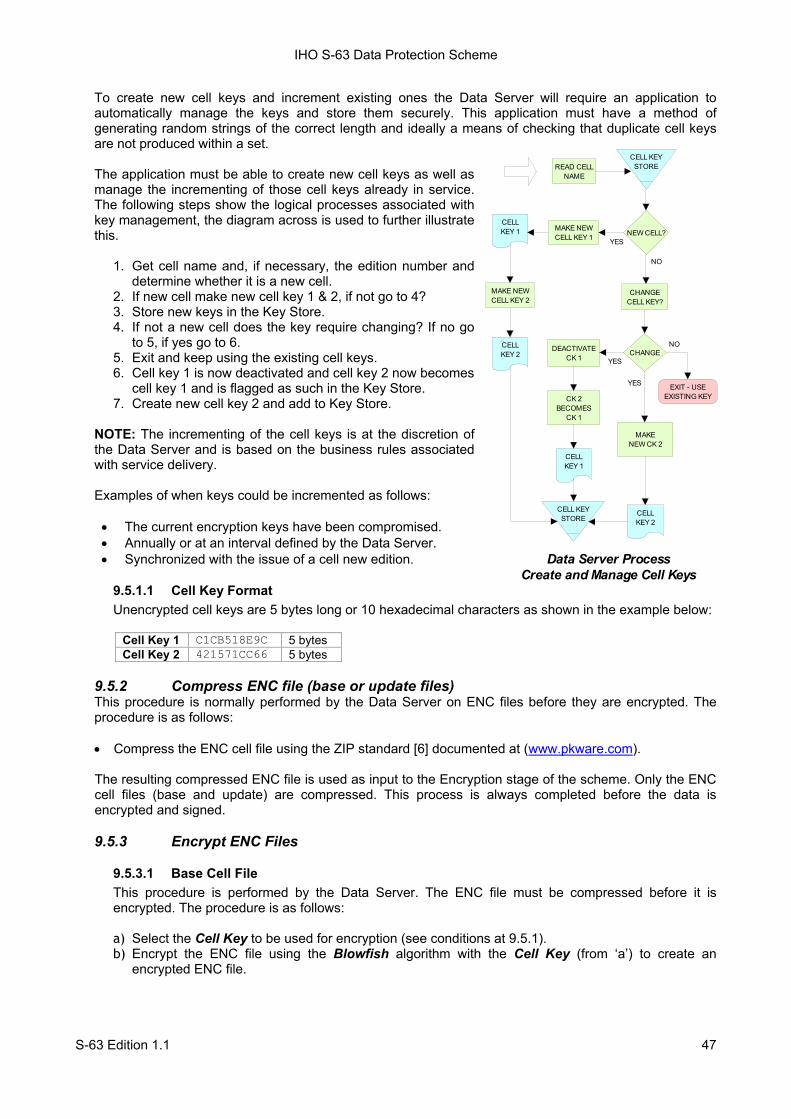
IHO S-63 Data Protection Scheme
S-63 Edition 1.1 47
To create new cell keys and increment existing ones the Data Server will require an application to automatically manage the keys and store them securely. This application must have a method of generating random strings of the correct length and ideally a means of checking that duplicate cell keys are not produced within a set.
The application must be able to create new cell keys as well as manage the incrementing of those cell keys already in service. The following steps show the logical processes associated with key management, the diagram across is used to further illustrate this.
1. Get cell name and, if necessary, the edition number and
determine whether it is a new cell. 2. If new cell make new cell key 1 & 2, if not go to 4? 3. Store new keys in the Key Store. 4. If not a new cell does the key require changing? If no go
to 5, if yes go to 6. 5. Exit and keep using the existing cell keys. 6. Cell key 1 is now deactivated and cell key 2 now becomes
cell key 1 and is flagged as such in the Key Store. 7. Create new cell key 2 and add to Key Store.
NOTE: The incrementing of the cell keys is at the discretion of the Data Server and is based on the business rules associated with service delivery.
Examples of when keys could be incremented as follows:
• The current encryption keys have been compromised. • Annually or at an interval defined by the Data Server. • Synchronized with the issue of a cell new edition.
9.5.1.1 Cell Key Format Unencrypted cell keys are 5 bytes long or 10 hexadecimal characters as shown in the example below:
Cell Key 1 C1CB518E9C 5 bytes Cell Key 2 421571CC66 5 bytes
9.5.2 Compress ENC file (base or update files) This procedure is normally performed by the Data Server on ENC files before they are encrypted. The procedure is as follows:
• Compress the ENC cell file using the ZIP standard [6] documented at (www.pkware.com).
The resulting compressed ENC file is used as input to the Encryption stage of the scheme. Only the ENC cell files (base and update) are compressed. This process is always completed before the data is encrypted and signed. 9.5.3 Encrypt ENC Files
9.5.3.1 Base Cell File This procedure is performed by the Data Server. The ENC file must be compressed before it is encrypted. The procedure is as follows:
a) Select the Cell Key to be used for encryption (see conditions at 9.5.1). b) Encrypt the ENC file using the Blowfish algorithm with the Cell Key (from ‘a’) to create an
encrypted ENC file.
READ CELL NAME
NEW CELL?
CHANGECELL KEY?
CELL KEYSTORE
MAKE NEW CELL KEY 1
MAKENEW CK 2
CK 2 BECOMES
CK 1
CHANGE
CELL KEY 1
CELL KEY 2
MAKE NEW CELL KEY 2
CELL KEY 2
DEACTIVATE CK 1
CELL KEY 1
Data Server ProcessCreate and Manage Cell Keys
EXIT - USE EXISTING KEY
CELL KEYSTORE
YES
YES
YES
NO
NO
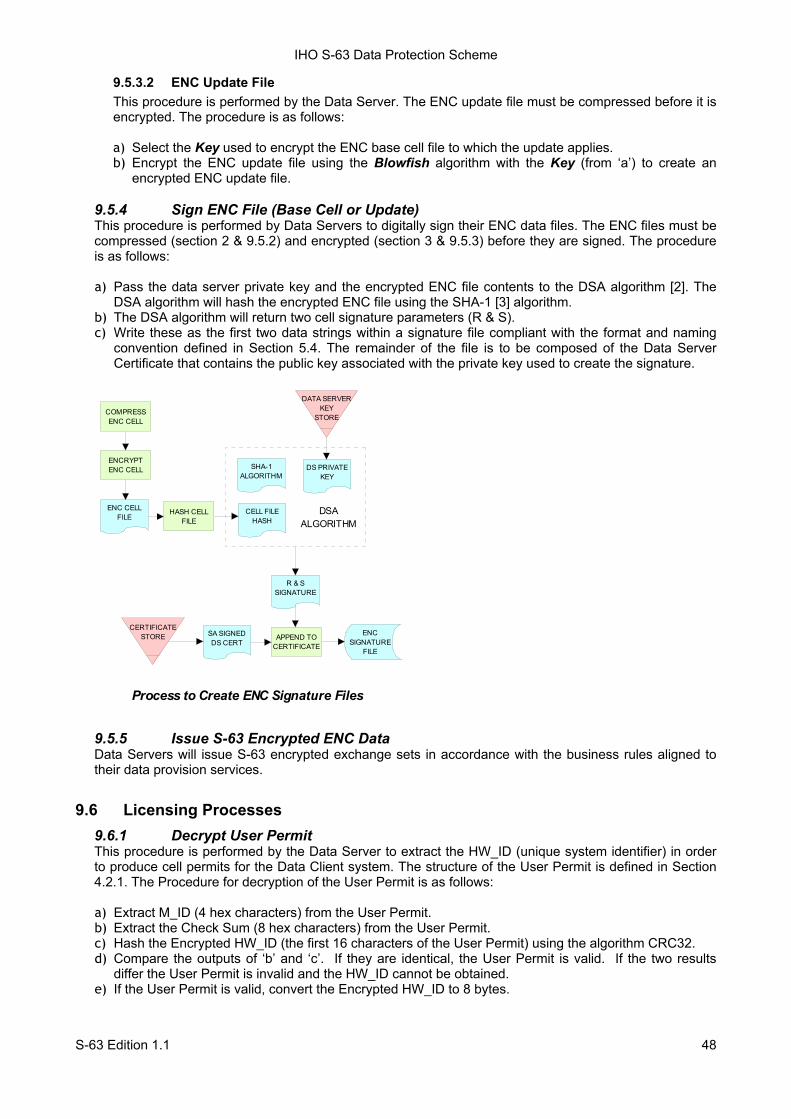
IHO S-63 Data Protection Scheme
S-63 Edition 1.1 48
9.5.3.2 ENC Update File This procedure is performed by the Data Server. The ENC update file must be compressed before it is encrypted. The procedure is as follows:
a) Select the Key used to encrypt the ENC base cell file to which the update applies. b) Encrypt the ENC update file using the Blowfish algorithm with the Key (from ‘a’) to create an
encrypted ENC update file.
9.5.4 Sign ENC File (Base Cell or Update) This procedure is performed by Data Servers to digitally sign their ENC data files. The ENC files must be compressed (section 2 & 9.5.2) and encrypted (section 3 & 9.5.3) before they are signed. The procedure is as follows:
a) Pass the data server private key and the encrypted ENC file contents to the DSA algorithm [2]. The
DSA algorithm will hash the encrypted ENC file using the SHA-1 [3] algorithm. b) The DSA algorithm will return two cell signature parameters (R & S). c) Write these as the first two data strings within a signature file compliant with the format and naming
convention defined in Section 5.4. The remainder of the file is to be composed of the Data Server Certificate that contains the public key associated with the private key used to create the signature.
9.5.5 Issue S-63 Encrypted ENC Data Data Servers will issue S-63 encrypted exchange sets in accordance with the business rules aligned to their data provision services.
9.6 Licensing Processes 9.6.1 Decrypt User Permit This procedure is performed by the Data Server to extract the HW_ID (unique system identifier) in order to produce cell permits for the Data Client system. The structure of the User Permit is defined in Section 4.2.1. The Procedure for decryption of the User Permit is as follows:
a) Extract M_ID (4 hex characters) from the User Permit. b) Extract the Check Sum (8 hex characters) from the User Permit. c) Hash the Encrypted HW_ID (the first 16 characters of the User Permit) using the algorithm CRC32. d) Compare the outputs of ‘b’ and ‘c’. If they are identical, the User Permit is valid. If the two results
differ the User Permit is invalid and the HW_ID cannot be obtained. e) If the User Permit is valid, convert the Encrypted HW_ID to 8 bytes.
ENC CELL FILE
ENCRYPT ENC CELL
COMPRESSENC CELL
CELL FILE HASH
DS PRIVATE KEY
R & S SIGNATURE
SHA-1 ALGORITHM
APPEND TOCERTIFICATE
SA SIGNED DS CERT
CERTIFICATE STORE
Process to Create ENC Signature Files
DATA SERVERKEY
STORE
ENC SIGNATURE
FILE
HASH CELL FILE
DSAALGORITHM
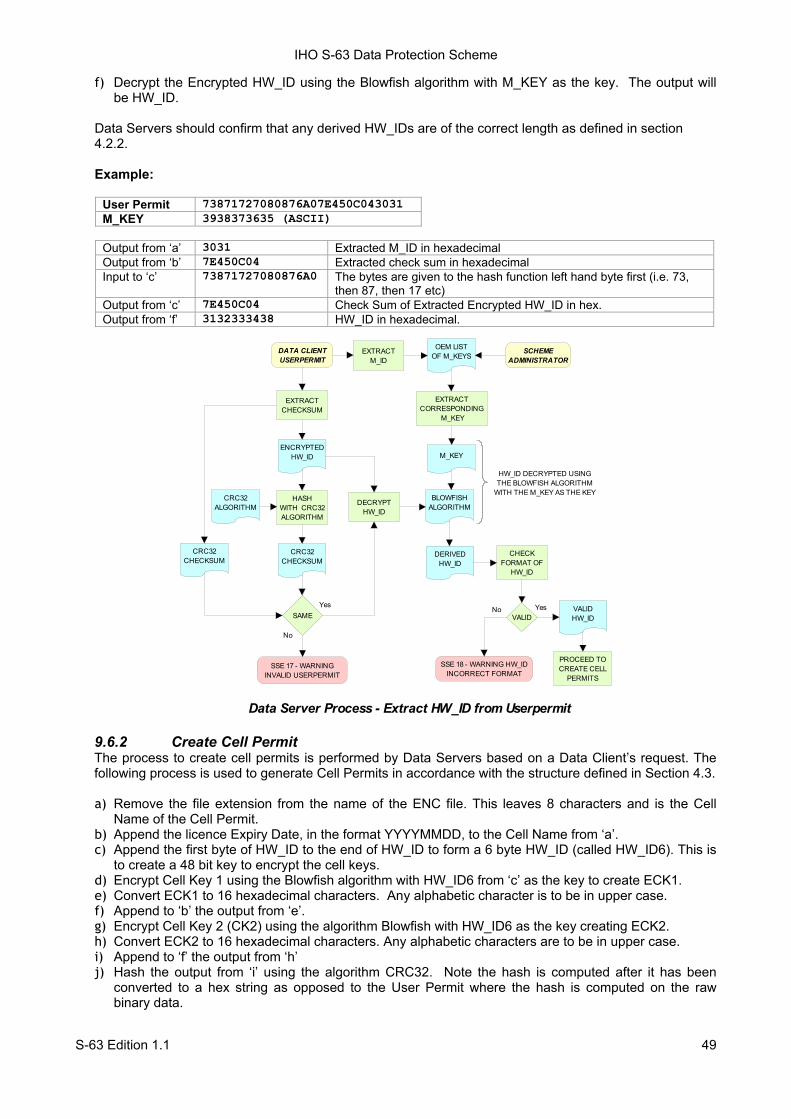
IHO S-63 Data Protection Scheme
S-63 Edition 1.1 49
f) Decrypt the Encrypted HW_ID using the Blowfish algorithm with M_KEY as the key. The output will be HW_ID.
Data Servers should confirm that any derived HW_IDs are of the correct length as defined in section 4.2.2. Example:
User Permit 73871727080876A07E450C043031 M_KEY 3938373635 (ASCII)
Output from ‘a’ 3031 Extracted M_ID in hexadecimal Output from ‘b’ 7E450C04 Extracted check sum in hexadecimal Input to ‘c’ 73871727080876A0 The bytes are given to the hash function left hand byte first (i.e. 73,
then 87, then 17 etc) Output from ‘c’ 7E450C04 Check Sum of Extracted Encrypted HW_ID in hex. Output from ‘f’ 3132333438 HW_ID in hexadecimal.
9.6.2 Create Cell Permit The process to create cell permits is performed by Data Servers based on a Data Client’s request. The following process is used to generate Cell Permits in accordance with the structure defined in Section 4.3.
a) Remove the file extension from the name of the ENC file. This leaves 8 characters and is the Cell
Name of the Cell Permit. b) Append the licence Expiry Date, in the format YYYYMMDD, to the Cell Name from ‘a’. c) Append the first byte of HW_ID to the end of HW_ID to form a 6 byte HW_ID (called HW_ID6). This is
to create a 48 bit key to encrypt the cell keys. d) Encrypt Cell Key 1 using the Blowfish algorithm with HW_ID6 from ‘c’ as the key to create ECK1. e) Convert ECK1 to 16 hexadecimal characters. Any alphabetic character is to be in upper case. f) Append to ‘b’ the output from ‘e’. g) Encrypt Cell Key 2 (CK2) using the algorithm Blowfish with HW_ID6 as the key creating ECK2. h) Convert ECK2 to 16 hexadecimal characters. Any alphabetic characters are to be in upper case. i) Append to ‘f’ the output from ‘h’ j) Hash the output from ‘i’ using the algorithm CRC32. Note the hash is computed after it has been
converted to a hex string as opposed to the User Permit where the hash is computed on the raw binary data.
EXTRACT M_ID
OEM LIST OF M_KEYS
EXTRACT CORRESPONDING
M_KEY
EXTRACT CHECKSUM
CRC32 ALGORITHM
CRC32 CHECKSUM
ENCRYPTED HW_ID
HASHWITH CRC32 ALGORITHM
SAME
CRC32 CHECKSUM
SSE 17 - WARNING INVALID USERPERMIT
No
BLOWFISH ALGORITHM
M_KEY
DECRYPT HW_ID
Yes
HW_ID DECRYPTED USINGTHE BLOWFISH ALGORITHM
WITH THE M_KEY AS THE KEY
Data Server Process - Extract HW_ID from Userpermit
DATA CLIENT USERPERMIT
SCHEME ADMINISTRATOR
PROCEED TO CREATE CELL
PERMITS
CHECK FORMAT OF
HW_ID
SSE 18 - WARNING HW_ID INCORRECT FORMAT
VALIDVALID HW_ID
DERIVEDHW_ID
No Yes
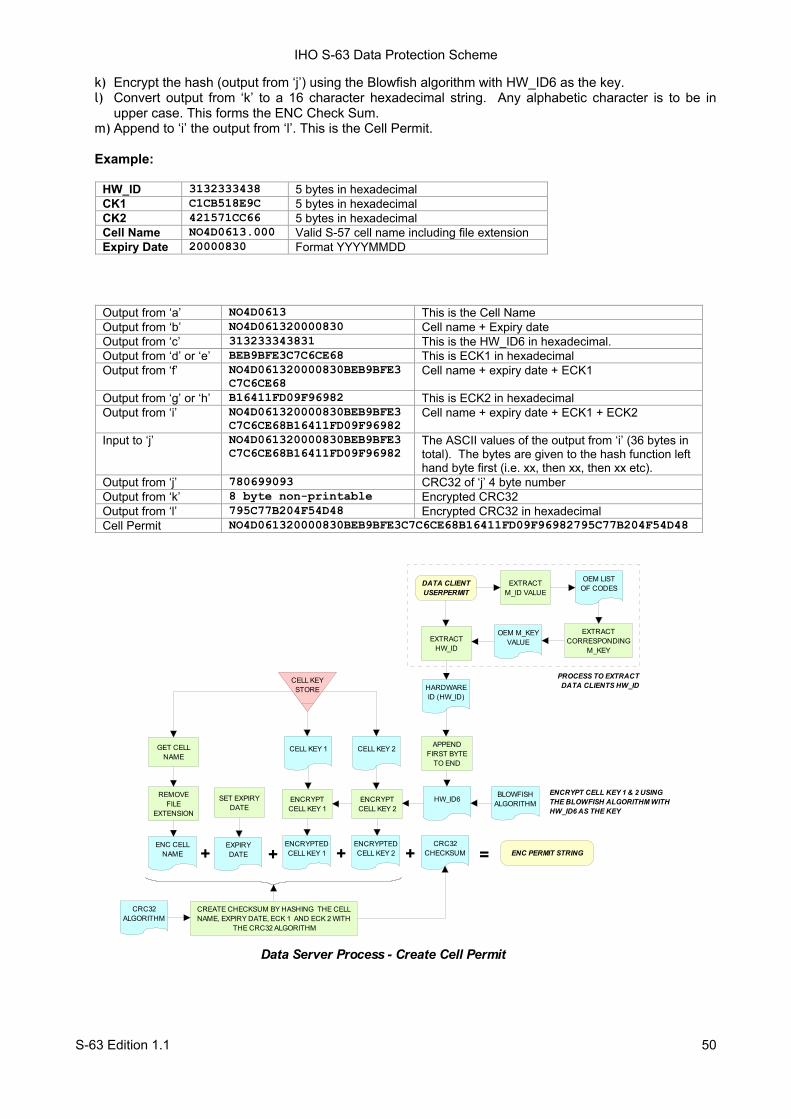
IHO S-63 Data Protection Scheme
S-63 Edition 1.1 50
k) Encrypt the hash (output from ‘j’) using the Blowfish algorithm with HW_ID6 as the key. l) Convert output from ‘k’ to a 16 character hexadecimal string. Any alphabetic character is to be in
upper case. This forms the ENC Check Sum. m) Append to ‘i’ the output from ‘l’. This is the Cell Permit. Example:
HW_ID 3132333438 5 bytes in hexadecimal CK1 C1CB518E9C 5 bytes in hexadecimal CK2 421571CC66 5 bytes in hexadecimal Cell Name NO4D0613.000 Valid S-57 cell name including file extension Expiry Date 20000830 Format YYYYMMDD
Output from ‘a’ NO4D0613 This is the Cell Name Output from ‘b’ NO4D061320000830 Cell name + Expiry date Output from ‘c’ 313233343831 This is the HW_ID6 in hexadecimal. Output from ‘d’ or ‘e’ BEB9BFE3C7C6CE68 This is ECK1 in hexadecimal Output from ‘f’ NO4D061320000830BEB9BFE3
C7C6CE68 Cell name + expiry date + ECK1
Output from ‘g’ or ‘h’ B16411FD09F96982 This is ECK2 in hexadecimal Output from ‘i’ NO4D061320000830BEB9BFE3
C7C6CE68B16411FD09F96982 Cell name + expiry date + ECK1 + ECK2
Input to ‘j’ NO4D061320000830BEB9BFE3C7C6CE68B16411FD09F96982
The ASCII values of the output from ‘i’ (36 bytes in total). The bytes are given to the hash function left hand byte first (i.e. xx, then xx, then xx etc).
Output from ‘j’ 780699093 CRC32 of ‘j’ 4 byte number Output from ‘k’ 8 byte non-printable Encrypted CRC32 Output from ‘l’ 795C77B204F54D48 Encrypted CRC32 in hexadecimal Cell Permit NO4D061320000830BEB9BFE3C7C6CE68B16411FD09F96982795C77B204F54D48
CRC32 ALGORITHM
CRC32 CHECKSUM
Data Server Process - Create Cell Permit
HARDWARE ID (HW_ID)
APPEND FIRST BYTE
TO END
HW_ID6BLOWFISH
ALGORITHMENCRYPT CELL KEY 1 & 2 USINGTHE BLOWFISH ALGORITHM WITHHW_ID6 AS THE KEY
EXTRACTHW_ID
OEM LIST OF CODES
OEM M_KEY VALUE
EXTRACTM_ID VALUE
EXTRACTCORRESPONDING
M_KEY
DATA CLIENT USERPERMIT
PROCESS TO EXTRACTDATA CLIENTS HW_ID
ENCRYPT CELL KEY 1
ENCRYPT CELL KEY 2
CELL KEYSTORE
CELL KEY 1 CELL KEY 2
ENCRYPTED CELL KEY 1
ENCRYPTED CELL KEY 2
SET EXPIRY DATE
EXPIRY DATE
ENC CELL NAME
GET CELL NAME
REMOVE FILE
EXTENSION
ENC PERMIT STRING+ + + + =
CREATE CHECKSUM BY HASHING THE CELLNAME, EXPIRY DATE, ECK 1 AND ECK 2 WITH
THE CRC32 ALGORITHM
IHO S-63 Data Protection Scheme
S-63 Edition 1.1 51
9.6.3 Issue ENC Licences
Data Servers will issue ENC Licences to access S-63 encrypted ENC in accordance with business rules aligned to their data provision services. Data Servers will make the details of their services available to Data Clients before licences are issued.
9.7 Security QA Procedures – Data Server
9.7.1 Data Protection Scheme Information The SA will provide copies of all information required to operate the Data Protection Scheme to a Data Server. 9.7.2 System Compliance Testing The Data Server must perform internal compliance testing of their implementation of the protection scheme, based on the descriptions provided in this document and the supplied test data. 9.7.3 Storage of M_IDs and M_KEYs When the Data Server joins the scheme, the SA shall provide the Data Server with the proprietary M_ID and M_KEY information for all participating manufacturers. The SA shall immediately inform all Data Servers about any amendments to the list of M_ID and M_KEYs as new manufacturers join the scheme.
The receipt of all M_IDs and M_KEYs by the Data Server are to be recorded securely in an M_ID / M_KEY Register. 9.7.4 Acceptance and Checking of the SA Digital Certificate (and Public Key) A Data Server will receive the SA public key in two formats, as an X.509 Digital Certificate and as a printable public key. The Data Server shall have the capability to load the SA digital certificate and manually compare the public key against the printed public key. The Data Server shall only accept the SA public key when this has been done. This process applies to the original SA public key and to any subsequent keys issued by the SA.
The Data Server shall maintain records, in a SA Public Key Register; of what SA public keys have been used. This should contain a copy of each key as well as the date on which it was issued. 9.7.5 Creation of Digital Signature Keys (Private and Public keys) The Data Server shall have the ability to create its own private and public key pair as detailed in section 9.3.
The private key must be stored securely with access limited to only those persons who have a need to know. The Data Server will create a new public/private key pair and request a new Data Server Certificate from the SA if its private key is compromised.
The Data Server shall create a self signed key (SSK) and send it to the SA for conversion into a Data Server certificate. Upon receipt, the SA will contact the sending Data Server to confirm that the delivered SSK did originate from its stated source. 9.7.6 Acceptance of the Data Server Certificate from the SA The Data Server shall verify and securely store the Certificate returned by the SA by following the process laid out in section 9.3.3.3. 9.7.7 Creation of Cell Keys The Data Server shall have the ability to create and manage Cell Keys as defined in the section 9.5.1. The Data Server is responsible for ensuring that cell keys are securely stored once created. 9.7.8 Compression, Encryption and Signing S-57 data The Data Server shall have the ability to compress, encrypt and sign ENC information as defined in sections 9.5.2, 9.5.3, and 9.5.4. Access to the signing program should be restricted to only those authorised to release data.
IHO S-63 Data Protection Scheme
S-63 Edition 1.1 52
9.7.9 Creation of Random Values In order to sign ENC information, the Data Server will create random values. The Data Server shall ensure that the same value is not be used for any two separate signatures. 9.7.10 Creation of Cell Permits The Data Server must have the ability to create a Cell Permit for a Data Client. The Data Server must issue a new Cell Permit to its Data Clients when an ENC cell is encrypted with a different cell key (e.g. when it is issued as a new edition). 9.7.11 Decryption of User Permits The Data Server must have the ability to decrypt User Permits to obtain the Data Client HW_ID. The HW_ID is required by the Data Server to create a Cell Permit.
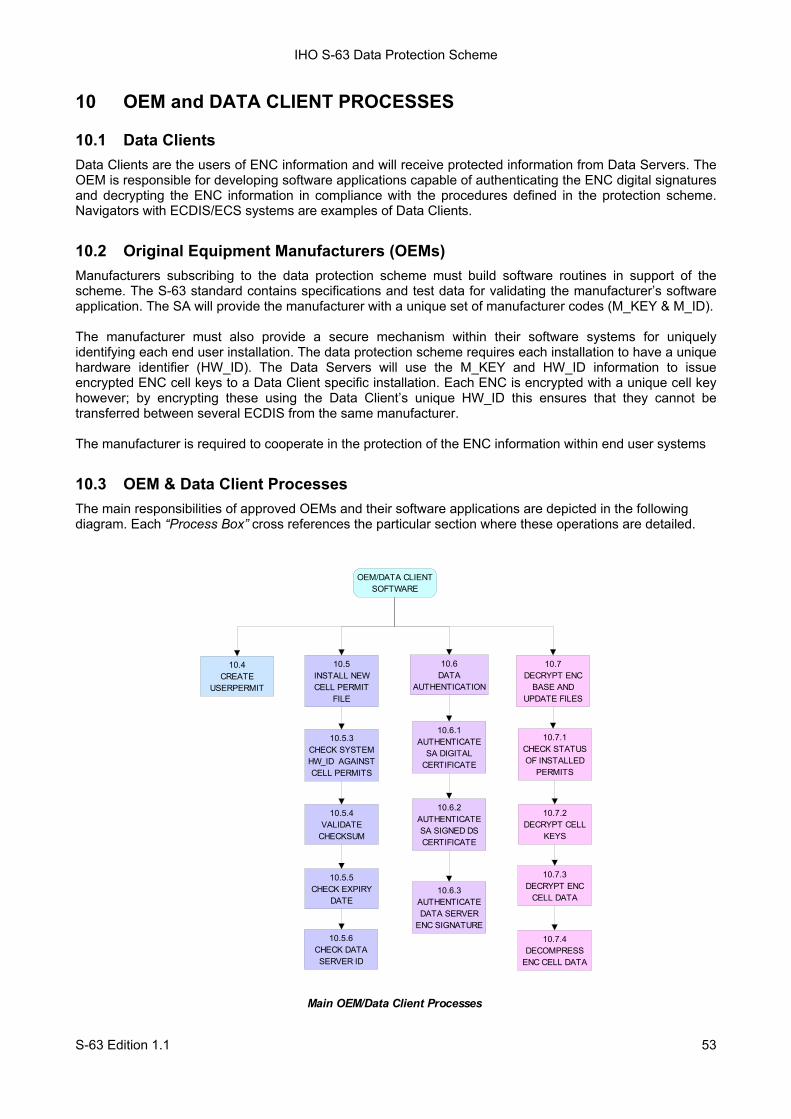
IHO S-63 Data Protection Scheme
S-63 Edition 1.1 53
10 OEM and DATA CLIENT PROCESSES
10.1 Data Clients Data Clients are the users of ENC information and will receive protected information from Data Servers. The OEM is responsible for developing software applications capable of authenticating the ENC digital signatures and decrypting the ENC information in compliance with the procedures defined in the protection scheme. Navigators with ECDIS/ECS systems are examples of Data Clients.
10.2 Original Equipment Manufacturers (OEMs) Manufacturers subscribing to the data protection scheme must build software routines in support of the scheme. The S-63 standard contains specifications and test data for validating the manufacturer’s software application. The SA will provide the manufacturer with a unique set of manufacturer codes (M_KEY & M_ID). The manufacturer must also provide a secure mechanism within their software systems for uniquely identifying each end user installation. The data protection scheme requires each installation to have a unique hardware identifier (HW_ID). The Data Servers will use the M_KEY and HW_ID information to issue encrypted ENC cell keys to a Data Client specific installation. Each ENC is encrypted with a unique cell key however; by encrypting these using the Data Client’s unique HW_ID this ensures that they cannot be transferred between several ECDIS from the same manufacturer. The manufacturer is required to cooperate in the protection of the ENC information within end user systems
10.3 OEM & Data Client Processes The main responsibilities of approved OEMs and their software applications are depicted in the following diagram. Each “Process Box” cross references the particular section where these operations are detailed.
10.4CREATE
USERPERMIT
10.5INSTALL NEW CELL PERMIT
FILE
10.5.5CHECK EXPIRY
DATE
10.5.4VALIDATE
CHECKSUM
10.7.1CHECK STATUS OF INSTALLED
PERMITS
10.7.4DECOMPRESS
ENC CELL DATA
10.7.3DECRYPT ENC
CELL DATA
10.6.2AUTHENTICATE SA SIGNED DS CERTIFICATE
10.6.1AUTHENTICATE
SA DIGITAL CERTIFICATE
10.6.3 AUTHENTICATE DATA SERVER
ENC SIGNATURE
Main OEM/Data Client Processes
10.5.3CHECK SYSTEM HW_ID AGAINST CELL PERMITS
OEM/DATA CLIENT SOFTWARE
10.6DATA
AUTHENTICATION
10.7.2DECRYPT CELL
KEYS
10.7DECRYPT ENC
BASE AND UPDATE FILES
10.5.6CHECK DATA SERVER ID
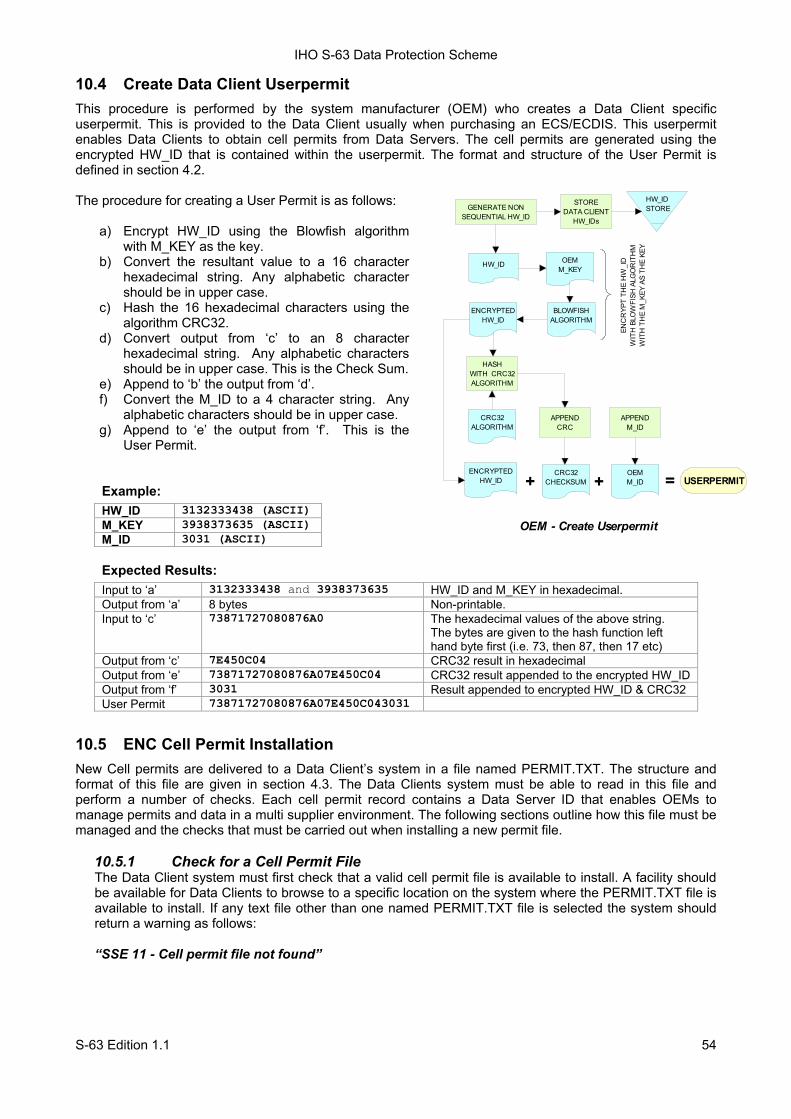
IHO S-63 Data Protection Scheme
S-63 Edition 1.1 54
10.4 Create Data Client Userpermit This procedure is performed by the system manufacturer (OEM) who creates a Data Client specific userpermit. This is provided to the Data Client usually when purchasing an ECS/ECDIS. This userpermit enables Data Clients to obtain cell permits from Data Servers. The cell permits are generated using the encrypted HW_ID that is contained within the userpermit. The format and structure of the User Permit is defined in section 4.2. The procedure for creating a User Permit is as follows:
a) Encrypt HW_ID using the Blowfish algorithm with M_KEY as the key.
b) Convert the resultant value to a 16 character hexadecimal string. Any alphabetic character should be in upper case.
c) Hash the 16 hexadecimal characters using the algorithm CRC32.
d) Convert output from ‘c’ to an 8 character hexadecimal string. Any alphabetic characters should be in upper case. This is the Check Sum.
e) Append to ‘b’ the output from ‘d’. f) Convert the M_ID to a 4 character string. Any
alphabetic characters should be in upper case. g) Append to ‘e’ the output from ‘f’. This is the
User Permit.
Example:
HW_ID 3132333438 (ASCII) M_KEY 3938373635 (ASCII) M_ID 3031 (ASCII)
Expected Results:
Input to ‘a’ 3132333438 and 3938373635 HW_ID and M_KEY in hexadecimal. Output from ‘a’ 8 bytes Non-printable. Input to ‘c’ 73871727080876A0 The hexadecimal values of the above string.
The bytes are given to the hash function left hand byte first (i.e. 73, then 87, then 17 etc)
Output from ‘c’ 7E450C04 CRC32 result in hexadecimal Output from ‘e’ 73871727080876A07E450C04 CRC32 result appended to the encrypted HW_ID Output from ‘f’ 3031 Result appended to encrypted HW_ID & CRC32 User Permit 73871727080876A07E450C043031
10.5 ENC Cell Permit Installation New Cell permits are delivered to a Data Client’s system in a file named PERMIT.TXT. The structure and format of this file are given in section 4.3. The Data Clients system must be able to read in this file and perform a number of checks. Each cell permit record contains a Data Server ID that enables OEMs to manage permits and data in a multi supplier environment. The following sections outline how this file must be managed and the checks that must be carried out when installing a new permit file.
10.5.1 Check for a Cell Permit File The Data Client system must first check that a valid cell permit file is available to install. A facility should be available for Data Clients to browse to a specific location on the system where the PERMIT.TXT file is available to install. If any text file other than one named PERMIT.TXT file is selected the system should return a warning as follows: “SSE 11 - Cell permit file not found”
HW_ID
GENERATE NON SEQUENTIAL HW_ID
OEMM_KEY
BLOWFISH ALGORITHM
ENCRYPTED HW_ID
HASHWITH CRC32 ALGORITHM
CRC32 ALGORITHM
CRC32 CHECKSUM
APPENDCRC
OEMM_ID
APPEND M_ID
USERPERMIT
ENC
RYP
T TH
E H
W_I
DW
ITH
BLO
WFI
SH A
LGO
RIT
HM
WIT
H T
HE
M_K
EY A
S TH
E KE
Y
ENCRYPTED HW_ID
OEM - Create Userpermit
HW_ID STORE
STOREDATA CLIENT
HW_IDs
++ =
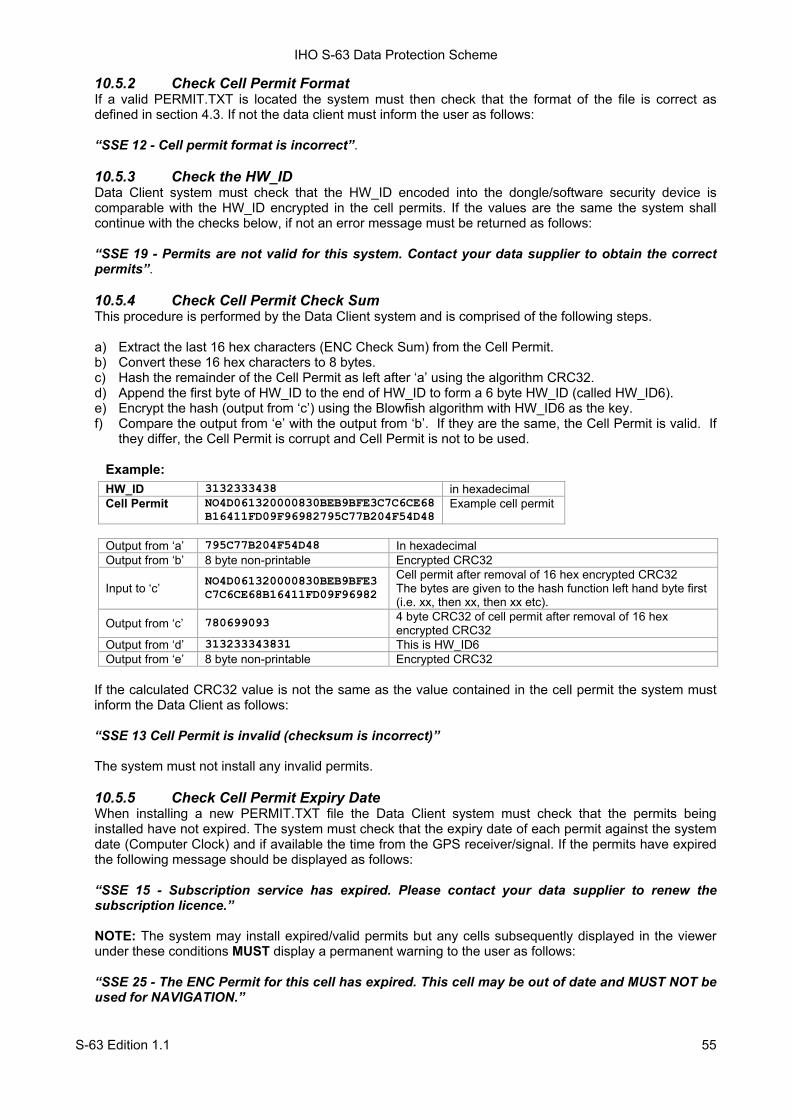
IHO S-63 Data Protection Scheme
S-63 Edition 1.1 55
10.5.2 Check Cell Permit Format If a valid PERMIT.TXT is located the system must then check that the format of the file is correct as defined in section 4.3. If not the data client must inform the user as follows: “SSE 12 - Cell permit format is incorrect”. 10.5.3 Check the HW_ID Data Client system must check that the HW_ID encoded into the dongle/software security device is comparable with the HW_ID encrypted in the cell permits. If the values are the same the system shall continue with the checks below, if not an error message must be returned as follows: “SSE 19 - Permits are not valid for this system. Contact your data supplier to obtain the correct permits”. 10.5.4 Check Cell Permit Check Sum This procedure is performed by the Data Client system and is comprised of the following steps.
a) Extract the last 16 hex characters (ENC Check Sum) from the Cell Permit. b) Convert these 16 hex characters to 8 bytes. c) Hash the remainder of the Cell Permit as left after ‘a’ using the algorithm CRC32. d) Append the first byte of HW_ID to the end of HW_ID to form a 6 byte HW_ID (called HW_ID6). e) Encrypt the hash (output from ‘c’) using the Blowfish algorithm with HW_ID6 as the key. f) Compare the output from ‘e’ with the output from ‘b’. If they are the same, the Cell Permit is valid. If
they differ, the Cell Permit is corrupt and Cell Permit is not to be used.
Example:
HW_ID 3132333438 in hexadecimal Cell Permit NO4D061320000830BEB9BFE3C7C6CE68
B16411FD09F96982795C77B204F54D48 Example cell permit
Output from ‘a’ 795C77B204F54D48 In hexadecimal Output from ‘b’ 8 byte non-printable Encrypted CRC32
Input to ‘c’ NO4D061320000830BEB9BFE3C7C6CE68B16411FD09F96982
Cell permit after removal of 16 hex encrypted CRC32 The bytes are given to the hash function left hand byte first (i.e. xx, then xx, then xx etc).
Output from ‘c’ 780699093 4 byte CRC32 of cell permit after removal of 16 hex encrypted CRC32
Output from ‘d’ 313233343831 This is HW_ID6 Output from ‘e’ 8 byte non-printable Encrypted CRC32
If the calculated CRC32 value is not the same as the value contained in the cell permit the system must inform the Data Client as follows: “SSE 13 Cell Permit is invalid (checksum is incorrect)” The system must not install any invalid permits. 10.5.5 Check Cell Permit Expiry Date When installing a new PERMIT.TXT file the Data Client system must check that the permits being installed have not expired. The system must check that the expiry date of each permit against the system date (Computer Clock) and if available the time from the GPS receiver/signal. If the permits have expired the following message should be displayed as follows: “SSE 15 - Subscription service has expired. Please contact your data supplier to renew the subscription licence.” NOTE: The system may install expired/valid permits but any cells subsequently displayed in the viewer under these conditions MUST display a permanent warning to the user as follows: “SSE 25 - The ENC Permit for this cell has expired. This cell may be out of date and MUST NOT be used for NAVIGATION.”
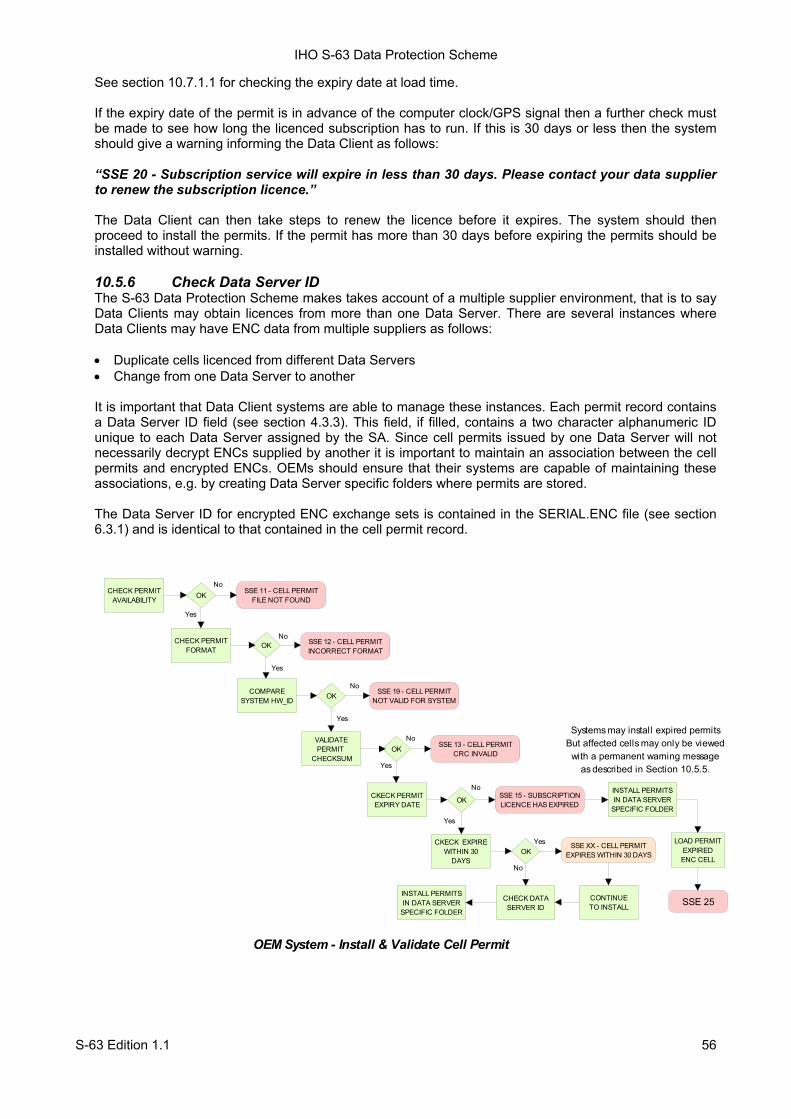
IHO S-63 Data Protection Scheme
S-63 Edition 1.1 56
See section 10.7.1.1 for checking the expiry date at load time. If the expiry date of the permit is in advance of the computer clock/GPS signal then a further check must be made to see how long the licenced subscription has to run. If this is 30 days or less then the system should give a warning informing the Data Client as follows: “SSE 20 - Subscription service will expire in less than 30 days. Please contact your data supplier to renew the subscription licence.” The Data Client can then take steps to renew the licence before it expires. The system should then proceed to install the permits. If the permit has more than 30 days before expiring the permits should be installed without warning. 10.5.6 Check Data Server ID The S-63 Data Protection Scheme makes takes account of a multiple supplier environment, that is to say Data Clients may obtain licences from more than one Data Server. There are several instances where Data Clients may have ENC data from multiple suppliers as follows: • Duplicate cells licenced from different Data Servers • Change from one Data Server to another
It is important that Data Client systems are able to manage these instances. Each permit record contains a Data Server ID field (see section 4.3.3). This field, if filled, contains a two character alphanumeric ID unique to each Data Server assigned by the SA. Since cell permits issued by one Data Server will not necessarily decrypt ENCs supplied by another it is important to maintain an association between the cell permits and encrypted ENCs. OEMs should ensure that their systems are capable of maintaining these associations, e.g. by creating Data Server specific folders where permits are stored. The Data Server ID for encrypted ENC exchange sets is contained in the SERIAL.ENC file (see section 6.3.1) and is identical to that contained in the cell permit record.
CHECK PERMIT AVAILABILITY OK SSE 11 - CELL PERMIT
FILE NOT FOUND
CHECK PERMIT FORMAT OK SSE 12 - CELL PERMIT
INCORRECT FORMAT
VALIDATEPERMIT
CHECKSUMOK SSE 13 - CELL PERMIT
CRC INVALID
CKECK PERMIT EXPIRY DATE
SSE 15 - SUBSCRIPTION LICENCE HAS EXPIREDOK
SSE XX - CELL PERMIT EXPIRES WITHIN 30 DAYS
CHECK DATA SERVER ID
INSTALL PERMITS IN DATA SERVER
SPECIFIC FOLDER
No
Yes
No
No
Yes
No
CKECK EXPIRE WITHIN 30
DAYS
Yes
OKYes
CONTINUETO INSTALL
No
OEM System - Install & Validate Cell Permit
COMPARE SYSTEM HW_ID
Yes
SSE 19 - CELL PERMIT NOT VALID FOR SYSTEMOK
No
Yes
INSTALL PERMITS IN DATA SERVER
SPECIFIC FOLDER
Systems may install expired permitsBut affected cells may only be viewed
with a permanent warning messageas described in Section 10.5.5.
LOAD PERMIT EXPIREDENC CELL
SSE 25
IHO S-63 Data Protection Scheme
S-63 Edition 1.1 57
10.6 ENC Authentication and Integrity Checks OEM systems must be capable of authenticating the source of the encrypted ENC data and validate its integrity. This is achieved in two ways as follows:
• By Authenticating the SA signature held as part of the Data Server Certificate that forms part of the ENC signature file.
• By validating the Data Server ENC signature (corresponding to the ENC Cell Data) in the ENC signature file.
OEMs and Data Clients must first of all confirm that the SA certificate (whether X509 or ASCII format) installed on the ECS/ECDIS is correct and current. This is dealt with in section 10.6.1 below.
10.6.1 Authenticate/Verify SA Digital Certificate This procedure is performed by OEMs or Data Clients to verify that the SA public key installed on the ECS/ECDIS is correct and current in respect of the IHO S-63 Data Protection Scheme. It is this SA public key that is used to authenticate the SA signed Data Server Certificate supplied by Data Servers as part of the ENC signature file. The procedure is as follows:
Manually compare the SA public key contained within the independently installed SA Digital Certificate with a copy of the printable public key available from the IHO website (http://www.iho.int). If the above check fails, the system shall not accept the SA Digital Certificate. Otherwise, the SA Digital Certificate is valid and the Data Server public key it contains can be used to authenticate SA signed Data Server Certificate held as part of the ENC signature file. NOTE: The Data Client must have means by which users can access the installed certificate from the application.
10.6.1.1 Manual Checking of the SA Public Key
The SA public key can be accessed from the IHO website as follows: www.iho.int → Home → Publications → Download List → S-63 → S-63 SA Certificate The following webpage will be displayed:
S-63 DIGITAL CERTIFICATES Digital Certificates are files that bind a specific public key together with other information to an individual or organisation. The S-63 standard uses a 2-level chain of certificates to operate the data protection scheme. The IHB operates as the Scheme Administrator and has issued the root Digital Certificate for use within the protection scheme. The SA certificate used by IHB will be a self-signed certificate. It is available both as a X-509 compliant file IHO.CRT and as a text file Scheme Administrator Public Key.txt. Both files are contained in an SA Certificate compressed file. The SA will issue Data Server Certificates to all Data Servers participating in the protection scheme. The Data Server Certificate contains the Data Server Public Key and the SA signature of this Key. Since only the SA can issue Data Server Certificates, the chain of trust can be established by authenticating the SA signature on the Data Server Public Key. The protection scheme requires the SA public key to be installed on end user systems by all users of the protection scheme. The Data Server Certificate is contained within each signature file and the Data Server Public Key can be trusted if the SA certificate is valid. The installation of the SA certificate (and the public key held within) should be carried out as a separate, independent operation and be subject to carefully controlled operating procedures.
In the second paragraph above click on “SA Certificate” link and a “File Download” dialog will be displayed which gives the user the option to “Open” or “Save” the zipped file named “S-63_SA_Certificate.zip”. This file contains two files as follows:

IHO S-63 Data Protection Scheme
S-63 Edition 1.1 58
1. IHO.CRT (The X509 Certificate)
Opening this file reveals a “Certificate” dialog, selecting the “Details” tab and highlighting “Public Key” displays the IHO public key. The example below is the IHO public at the time this document was published. Note that the first 6 characters [024100] represent the certificate parameters and can be either positive [0240] or negative [024100].
This character string (minus the certificate parameters) should be compared with the installed certificate to confirm that they are the same. If it is, then the certificate is authenticate, if not, it should be rejected.
2. Scheme Administrator Public Key.txt
Opening this file displays the following SA public key parameters.
If this file is used for authentication it should be checked against the installed certificate or public key file. If checking against an installed certificate then only the “BIG y” string should be verified to see if it is the same. If checking against SA public key file then all parameters must be verified to see if it is the same. In either case if the file is correct then the public key is authenticated, if not, it must be rejected.
10.6.2 Authenticate SA signed Data Server Certificate This procedure is performed by the Data Client’s system to authenticate the SA signed Data Server Certificate stored as part of the ENC signature file against the installed SA public key. This process is carried out before the Data Server public key is extracted to authenticate the ENC signature. Refer to section 5.3.2 for the structure of signature/certificate pairs in a signature file. Prior to the authentication process the system must first check the availability, format and status of the certificate or public key installed on the system. If there are any problems this should be reported to the data client in a meaningful way as follows:
1. The SA certificate or public key is not present on the system (SSE 05 and terminate process). 2. The format of the SA certificate or public key is incorrect (SSE 08 and terminate process). 3. The SA certificate has expired (SSE 22 and terminate process).
The authentication procedure is outlined below: a) Extract the ENC signature file. b) Discard the first signature part (i.e. the first two data strings and their attendant headers. This is the
Data Server signature of the ENC data). This leaves the SA signed Data Server Certificate. c) Extract the remaining signature part (i.e. the first two data strings and their attendant headers from
the remaining file obtained from ‘b’). This leaves a public key file.
0241 0096 3F14 E32B A537 2928 F24F 15B0 730C49D3 1B28 E5C7 6410 0256 4DB9 5995 B15C F8800ED5 4E35 4867 B82B B959 7B15 8269 E079 F0C4F492 6B17 761C C89E B77C 9B7E F8
// BIG pFCA6 82CE 8E12 CABA 26EF CCF7 110E 526D B078 B05E DECB CD1E B4A2 08F3 AE16 17AE 01F3 5B91 A47E 6DF6 3413 C5E1 2ED0 899B CD13 2ACD 50D9 9151 BDC4 3EE7 3759 2E17.// BIG q962E DDCC 369C BA8E BB26 0EE6 B6A1 26D9 346E 38C5.// BIG g6784 71B2 7A9C F44E E91A 49C5 147D B1A9 AAF2 44F0 5A43 4D64 8693 1D2D 1427 1B9E 3503 0B71 FD73 DA17 9069 B32E 2935 630E 1C20 6235 4D0D A20A 6C41 6E50 BE79 4CA4.// BIG y963F 14E3 2BA5 3729 28F2 4F15 B073 0C49 D31B 28E5 C764 1002 564D B959 95B1 5CF8 800E D54E 3548 67B8 2BB9 597B 1582 69E0 79F0 C4F4 926B 1776 1CC8 9EB7 7C9B 7EF8.
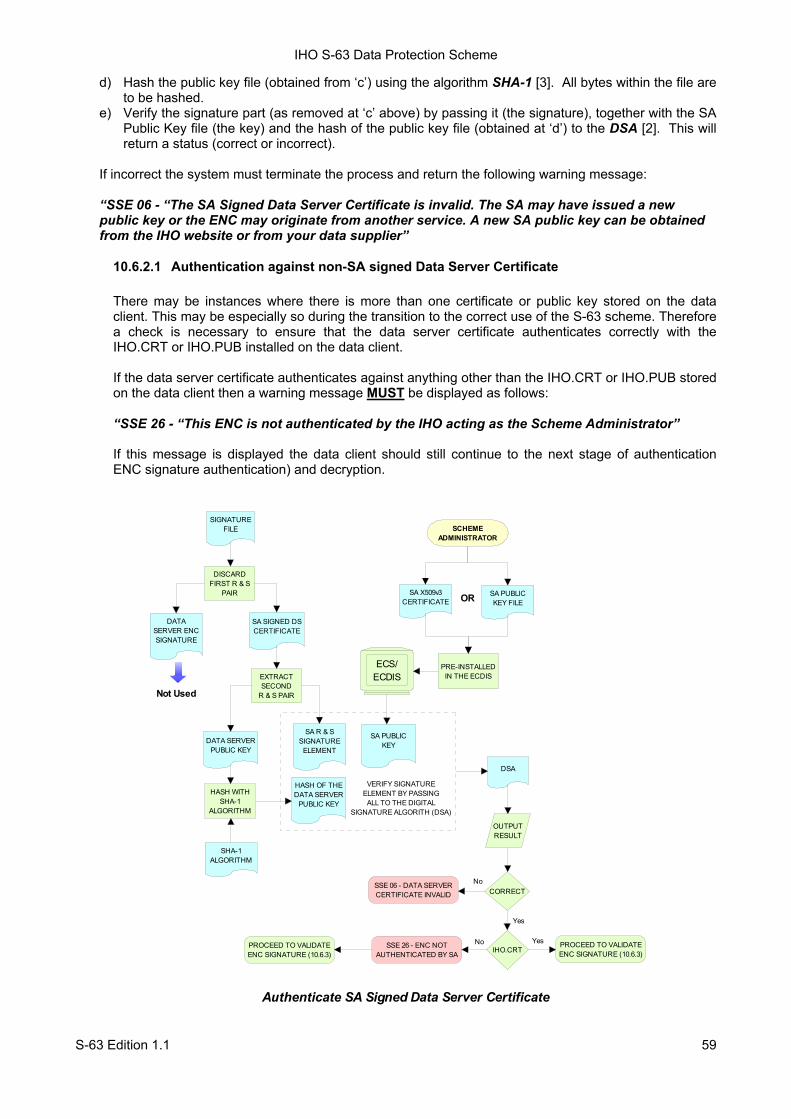
IHO S-63 Data Protection Scheme
S-63 Edition 1.1 59
d) Hash the public key file (obtained from ‘c’) using the algorithm SHA-1 [3]. All bytes within the file are to be hashed.
e) Verify the signature part (as removed at ‘c’ above) by passing it (the signature), together with the SA Public Key file (the key) and the hash of the public key file (obtained at ‘d’) to the DSA [2]. This will return a status (correct or incorrect).
If incorrect the system must terminate the process and return the following warning message: “SSE 06 - “The SA Signed Data Server Certificate is invalid. The SA may have issued a new public key or the ENC may originate from another service. A new SA public key can be obtained from the IHO website or from your data supplier”
10.6.2.1 Authentication against non-SA signed Data Server Certificate
There may be instances where there is more than one certificate or public key stored on the data client. This may be especially so during the transition to the correct use of the S-63 scheme. Therefore a check is necessary to ensure that the data server certificate authenticates correctly with the IHO.CRT or IHO.PUB installed on the data client. If the data server certificate authenticates against anything other than the IHO.CRT or IHO.PUB stored on the data client then a warning message MUST be displayed as follows: “SSE 26 - “This ENC is not authenticated by the IHO acting as the Scheme Administrator” If this message is displayed the data client should still continue to the next stage of authentication ENC signature authentication) and decryption.
Authenticate SA Signed Data Server Certificate
VERIFY SIGNATUREELEMENT BY PASSINGALL TO THE DIGITAL
SIGNATURE ALGORITH (DSA)
DISCARD FIRST R & S
PAIR
DATA SERVER ENC SIGNATURE
EXTRACTSECOND
R & S PAIR
DATA SERVERPUBLIC KEY
HASH WITH SHA-1
ALGORITHM
SHA-1 ALGORITHM
HASH OF THE DATA SERVER
PUBLIC KEY
SA PUBLIC KEY
DSA
CORRECT
SCHEME ADMINISTRATOR
SA X509v3 CERTIFICATE
ECS/ECDIS
SSE 06 - DATA SERVER CERTIFICATE INVALID
SIGNATURE FILE
SA SIGNED DS CERTIFICATE
SA R & S SIGNATURE
ELEMENT
No
PRE-INSTALLEDIN THE ECDIS
SA PUBLIC KEY FILEOR
Not Used
OUTPUT RESULT
IHO.CRTSSE 26 - ENC NOT AUTHENTICATED BY SA
No PROCEED TO VALIDATE ENC SIGNATURE (10.6.3)
Yes
YesPROCEED TO VALIDATE ENC SIGNATURE (10.6.3)
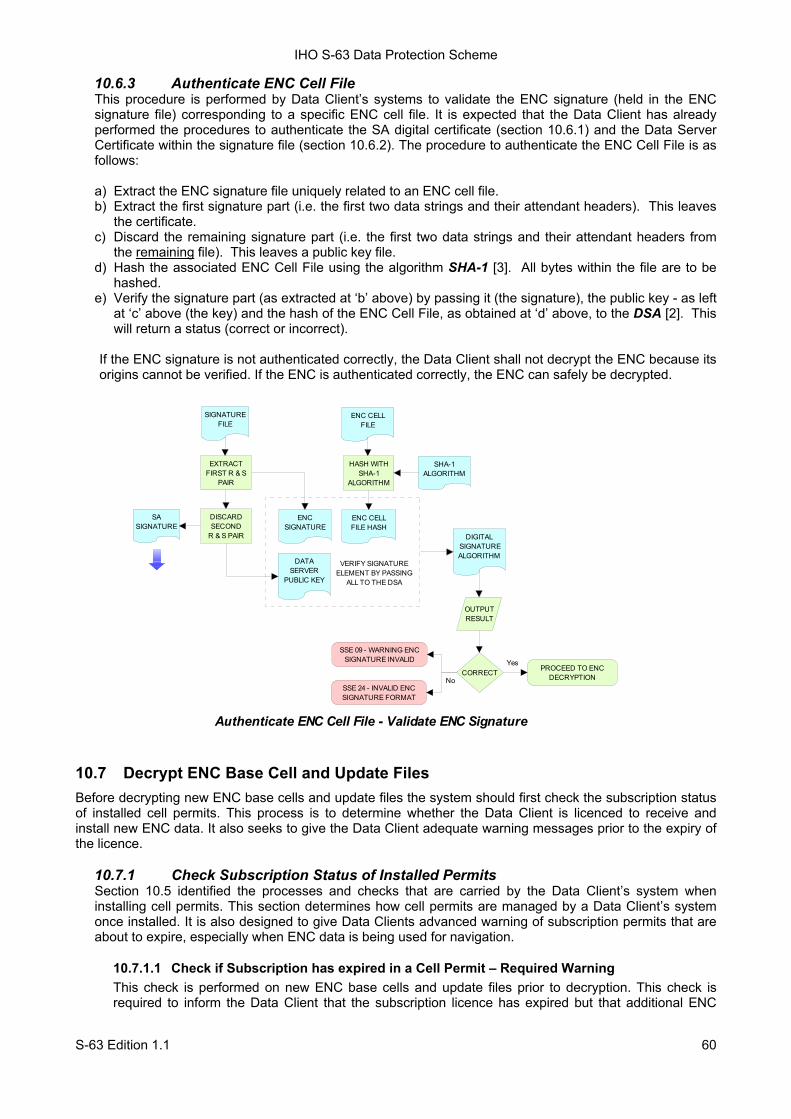
IHO S-63 Data Protection Scheme
S-63 Edition 1.1 60
10.6.3 Authenticate ENC Cell File This procedure is performed by Data Client’s systems to validate the ENC signature (held in the ENC signature file) corresponding to a specific ENC cell file. It is expected that the Data Client has already performed the procedures to authenticate the SA digital certificate (section 10.6.1) and the Data Server Certificate within the signature file (section 10.6.2). The procedure to authenticate the ENC Cell File is as follows:
a) Extract the ENC signature file uniquely related to an ENC cell file. b) Extract the first signature part (i.e. the first two data strings and their attendant headers). This leaves
the certificate. c) Discard the remaining signature part (i.e. the first two data strings and their attendant headers from
the remaining file). This leaves a public key file. d) Hash the associated ENC Cell File using the algorithm SHA-1 [3]. All bytes within the file are to be
hashed. e) Verify the signature part (as extracted at ‘b’ above) by passing it (the signature), the public key - as left
at ‘c’ above (the key) and the hash of the ENC Cell File, as obtained at ‘d’ above, to the DSA [2]. This will return a status (correct or incorrect).
If the ENC signature is not authenticated correctly, the Data Client shall not decrypt the ENC because its origins cannot be verified. If the ENC is authenticated correctly, the ENC can safely be decrypted.
10.7 Decrypt ENC Base Cell and Update Files Before decrypting new ENC base cells and update files the system should first check the subscription status of installed cell permits. This process is to determine whether the Data Client is licenced to receive and install new ENC data. It also seeks to give the Data Client adequate warning messages prior to the expiry of the licence.
10.7.1 Check Subscription Status of Installed Permits Section 10.5 identified the processes and checks that are carried by the Data Client’s system when installing cell permits. This section determines how cell permits are managed by a Data Client’s system once installed. It is also designed to give Data Clients advanced warning of subscription permits that are about to expire, especially when ENC data is being used for navigation.
10.7.1.1 Check if Subscription has expired in a Cell Permit – Required Warning This check is performed on new ENC base cells and update files prior to decryption. This check is required to inform the Data Client that the subscription licence has expired but that additional ENC
Authenticate ENC Cell File - Validate ENC Signature
DIGITAL SIGNATURE ALGORITHM
CORRECT
SSE 09 - WARNING ENC SIGNATURE INVALID
PROCEED TO ENC DECRYPTION
Yes
SIGNATURE FILE
EXTRACT FIRST R & S
PAIR
ENC SIGNATURE
ENC CELL FILE
HASH WITH SHA-1
ALGORITHM
SHA-1 ALGORITHM
ENC CELL FILE HASH
DATA SERVER
PUBLIC KEY
DISCARD SECOND
R & S PAIR
SA SIGNATURE
VERIFY SIGNATUREELEMENT BY PASSING
ALL TO THE DSA
OUTPUT RESULT
SSE 24 - INVALID ENC SIGNATURE FORMAT
No
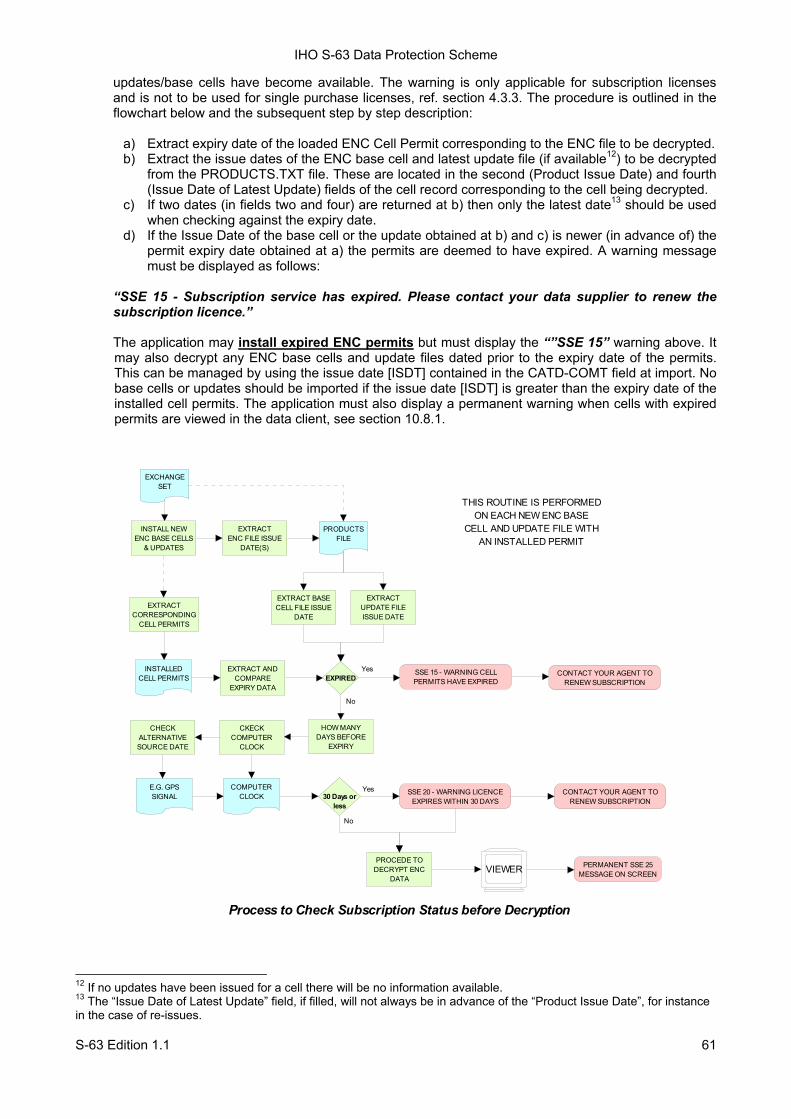
IHO S-63 Data Protection Scheme
S-63 Edition 1.1 61
updates/base cells have become available. The warning is only applicable for subscription licenses and is not to be used for single purchase licenses, ref. section 4.3.3. The procedure is outlined in the flowchart below and the subsequent step by step description:
a) Extract expiry date of the loaded ENC Cell Permit corresponding to the ENC file to be decrypted. b) Extract the issue dates of the ENC base cell and latest update file (if available12) to be decrypted
from the PRODUCTS.TXT file. These are located in the second (Product Issue Date) and fourth (Issue Date of Latest Update) fields of the cell record corresponding to the cell being decrypted.
c) If two dates (in fields two and four) are returned at b) then only the latest date13 should be used when checking against the expiry date.
d) If the Issue Date of the base cell or the update obtained at b) and c) is newer (in advance of) the permit expiry date obtained at a) the permits are deemed to have expired. A warning message must be displayed as follows:
“SSE 15 - Subscription service has expired. Please contact your data supplier to renew the subscription licence.”
The application may install expired ENC permits but must display the “”SSE 15” warning above. It may also decrypt any ENC base cells and update files dated prior to the expiry date of the permits. This can be managed by using the issue date [ISDT] contained in the CATD-COMT field at import. No base cells or updates should be imported if the issue date [ISDT] is greater than the expiry date of the installed cell permits. The application must also display a permanent warning when cells with expired permits are viewed in the data client, see section 10.8.1.
12 If no updates have been issued for a cell there will be no information available. 13 The “Issue Date of Latest Update” field, if filled, will not always be in advance of the “Product Issue Date”, for instance in the case of re-issues.
INSTALL NEW ENC BASE CELLS
& UPDATES
EXTRACT BASE CELL FILE ISSUE
DATE
CKECK COMPUTER
CLOCK
EXTRACTENC FILE ISSUE
DATE(S)
EXPIRED
PRODUCTS FILE
HOW MANY DAYS BEFORE
EXPIRY
30 Days or less
No
Process to Check Subscription Status before Decryption
THIS ROUTINE IS PERFORMED ON EACH NEW ENC BASE
CELL AND UPDATE FILE WITH AN INSTALLED PERMIT
EXTRACT AND COMPARE
EXPIRY DATA
INSTALLED CELL PERMITS
EXTRACT UPDATE FILE ISSUE DATE
EXCHANGE SET
EXTRACT CORRESPONDING
CELL PERMITS
SSE 15 - WARNING CELL PERMITS HAVE EXPIRED
PERMANENT SSE 25 MESSAGE ON SCREEN
CONTACT YOUR AGENT TO RENEW SUBSCRIPTION
Yes
SSE 20 - WARNING LICENCE EXPIRES WITHIN 30 DAYS
Yes CONTACT YOUR AGENT TO RENEW SUBSCRIPTION
COMPUTER CLOCK
PROCEDE TO DECRYPT ENC
DATA
No
CHECK ALTERNATIVE SOURCE DATE
E.G. GPS SIGNAL
VIEWER
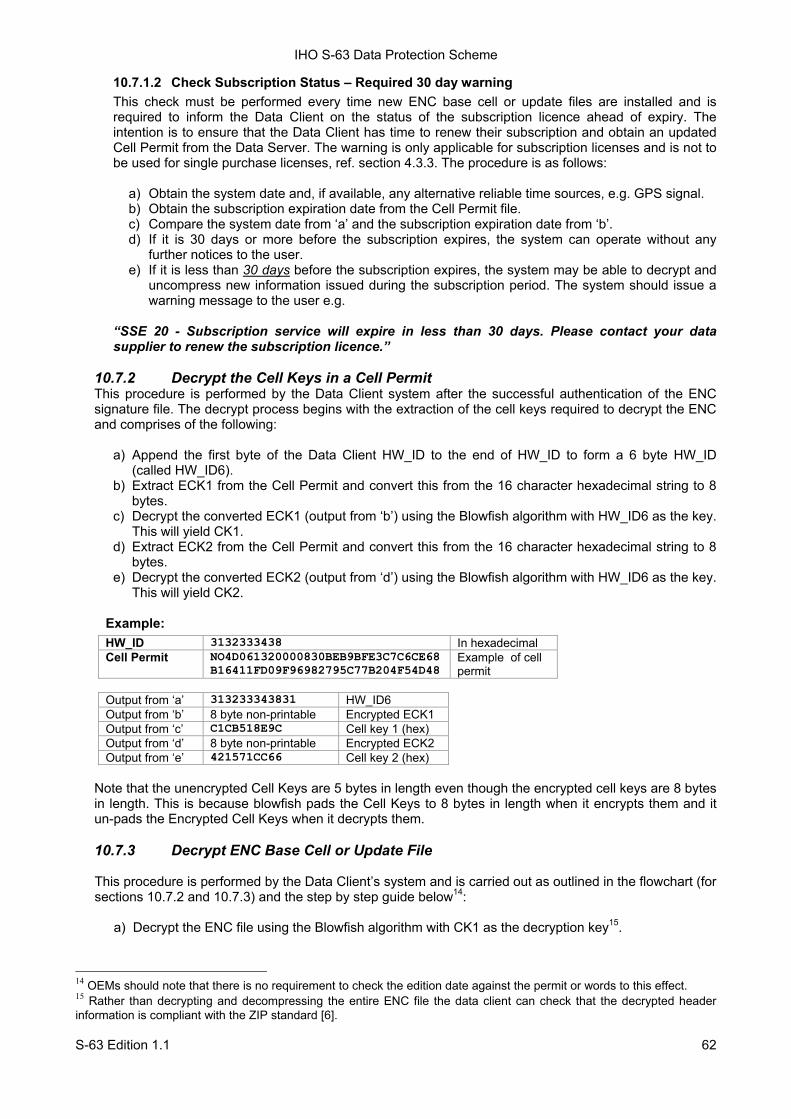
IHO S-63 Data Protection Scheme
S-63 Edition 1.1 62
10.7.1.2 Check Subscription Status – Required 30 day warning This check must be performed every time new ENC base cell or update files are installed and is required to inform the Data Client on the status of the subscription licence ahead of expiry. The intention is to ensure that the Data Client has time to renew their subscription and obtain an updated Cell Permit from the Data Server. The warning is only applicable for subscription licenses and is not to be used for single purchase licenses, ref. section 4.3.3. The procedure is as follows:
a) Obtain the system date and, if available, any alternative reliable time sources, e.g. GPS signal. b) Obtain the subscription expiration date from the Cell Permit file. c) Compare the system date from ‘a’ and the subscription expiration date from ‘b’. d) If it is 30 days or more before the subscription expires, the system can operate without any
further notices to the user. e) If it is less than 30 days before the subscription expires, the system may be able to decrypt and
uncompress new information issued during the subscription period. The system should issue a warning message to the user e.g.
“SSE 20 - Subscription service will expire in less than 30 days. Please contact your data supplier to renew the subscription licence.”
10.7.2 Decrypt the Cell Keys in a Cell Permit This procedure is performed by the Data Client system after the successful authentication of the ENC signature file. The decrypt process begins with the extraction of the cell keys required to decrypt the ENC and comprises of the following:
a) Append the first byte of the Data Client HW_ID to the end of HW_ID to form a 6 byte HW_ID
(called HW_ID6). b) Extract ECK1 from the Cell Permit and convert this from the 16 character hexadecimal string to 8
bytes. c) Decrypt the converted ECK1 (output from ‘b’) using the Blowfish algorithm with HW_ID6 as the key.
This will yield CK1. d) Extract ECK2 from the Cell Permit and convert this from the 16 character hexadecimal string to 8
bytes. e) Decrypt the converted ECK2 (output from ‘d’) using the Blowfish algorithm with HW_ID6 as the key.
This will yield CK2.
Example:
HW_ID 3132333438 In hexadecimal Cell Permit NO4D061320000830BEB9BFE3C7C6CE68
B16411FD09F96982795C77B204F54D48 Example of cell permit
Output from ‘a’ 313233343831 HW_ID6 Output from ‘b’ 8 byte non-printable Encrypted ECK1 Output from ‘c’ C1CB518E9C Cell key 1 (hex) Output from ‘d’ 8 byte non-printable Encrypted ECK2 Output from ‘e’ 421571CC66 Cell key 2 (hex)
Note that the unencrypted Cell Keys are 5 bytes in length even though the encrypted cell keys are 8 bytes in length. This is because blowfish pads the Cell Keys to 8 bytes in length when it encrypts them and it un-pads the Encrypted Cell Keys when it decrypts them. 10.7.3 Decrypt ENC Base Cell or Update File
This procedure is performed by the Data Client’s system and is carried out as outlined in the flowchart (for sections 10.7.2 and 10.7.3) and the step by step guide below14:
a) Decrypt the ENC file using the Blowfish algorithm with CK1 as the decryption key15.
14 OEMs should note that there is no requirement to check the edition date against the permit or words to this effect. 15 Rather than decrypting and decompressing the entire ENC file the data client can check that the decrypted header information is compliant with the ZIP standard [6].
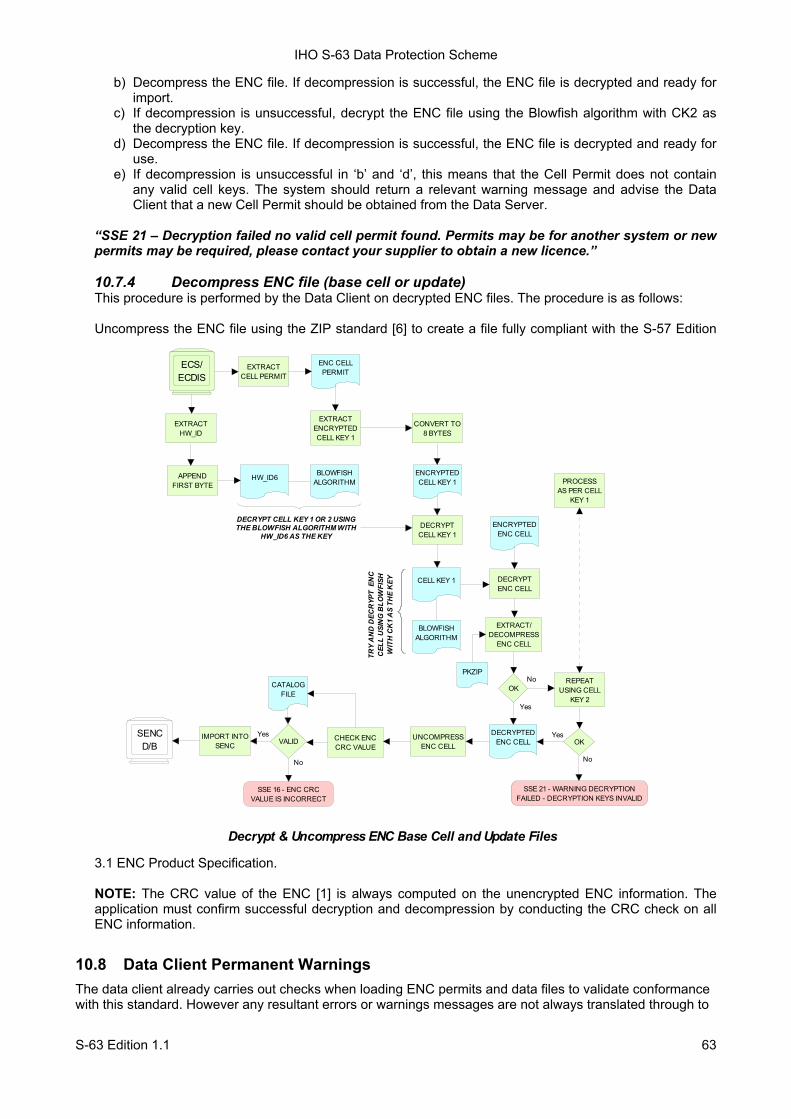
IHO S-63 Data Protection Scheme
S-63 Edition 1.1 63
b) Decompress the ENC file. If decompression is successful, the ENC file is decrypted and ready for import.
c) If decompression is unsuccessful, decrypt the ENC file using the Blowfish algorithm with CK2 as the decryption key.
d) Decompress the ENC file. If decompression is successful, the ENC file is decrypted and ready for use.
e) If decompression is unsuccessful in ‘b’ and ‘d’, this means that the Cell Permit does not contain any valid cell keys. The system should return a relevant warning message and advise the Data Client that a new Cell Permit should be obtained from the Data Server.
“SSE 21 – Decryption failed no valid cell permit found. Permits may be for another system or new permits may be required, please contact your supplier to obtain a new licence.”
10.7.4 Decompress ENC file (base cell or update) This procedure is performed by the Data Client on decrypted ENC files. The procedure is as follows:
Uncompress the ENC file using the ZIP standard [6] to create a file fully compliant with the S-57 Edition
3.1 ENC Product Specification. NOTE: The CRC value of the ENC [1] is always computed on the unencrypted ENC information. The application must confirm successful decryption and decompression by conducting the CRC check on all ENC information.
10.8 Data Client Permanent Warnings The data client already carries out checks when loading ENC permits and data files to validate conformance with this standard. However any resultant errors or warnings messages are not always translated through to
BLOWFISH ALGORITHM
IMPORT INTO SENC
ENC CELL PERMIT
EXTRACT ENCRYPTED CELL KEY 1
CONVERT TO 8 BYTES
DECRYPT CELL KEY 1
ECS/ECDIS
EXTRACTCELL PERMIT
EXTRACTHW_ID
APPEND FIRST BYTE
CELL KEY 1
HW_ID6
ENCRYPTED ENC CELL
DECRYPT ENC CELL
DECRYPTED ENC CELL
OKREPEAT
USING CELL KEY 2
No
Yes
OKYes
SSE 21 - WARNING DECRYPTION FAILED - DECRYPTION KEYS INVALID
Decrypt & Uncompress ENC Base Cell and Update Files
BLOWFISH ALGORITHM
TRY
AN
D D
ECR
YPT
EN
CC
ELL
USI
NG
BLO
WFI
SHW
ITH
CK
1 A
S TH
E K
EY
ENCRYPTED CELL KEY 1
DECRYPT CELL KEY 1 OR 2 USINGTHE BLOWFISH ALGORITHM WITH
HW_ID6 AS THE KEY
UNCOMPRESS ENC CELL
SENCD/B
CHECK ENC CRC VALUE
CATALOG FILE
VALID
No
Yes
SSE 16 - ENC CRC VALUE IS INCORRECT
No
EXTRACT/DECOMPRESS
ENC CELL
PKZIP
PROCESSAS PER CELL
KEY 1
IHO S-63 Data Protection Scheme
S-63 Edition 1.1 64
the ECDIS when it is in use, e.g. route planning or navigation. It is possible, under the current data protection scheme, to use ENCs that are out-of-date without the user being aware of it. The purpose of this section is to identify any messages that should be permanently displayed by the data client when in use. The data client must display permanent warning messages in the viewer when it can be determined that ENC information contained in the SENC is or may be out-of-date. The data client must carry out the following checks when displaying a cell in the ECDIS:
• Have the installed ENC permits expired? • Is installed SENC data out-of-date in respect to the latest installed PRODUCTS.TXT file?
10.8.1 Expired ENC Permits
The data client must check the status of the installed ENC permit when displaying a particular ENC cell. If the permit has expired the ECDIS is to display a permanent warning informing the user that this ENC cell may be out of date as follows:
“SSE 25 - The permit for ENC<cell name> has expired. This cell may be out of date and MUST NOT be used for Primary NAVIGATION”.
10.8.2 Out-of Date SENC Data
The data client must check the status of the ENC cell being displayed against the known status of that cell in a particular data server’s service. This must be carried out by comparing the current Edition [EDTN] and Update [UPDN] contained in the SENC for any given cell against the corresponding cell record listed in the latest PRODUCTS.TXT file. A permanent warning must be given when the ENC cell being displayed by the ECDIS is not updated to the latest new edition or update in service as follows: “SSE 27 - ENC<cell name> is not up to date. A New Edition, Re-issue or Update for this cell is missing and therefore MUST NOT be used for Primary NAVIGATION”.
10.9 QA Procedures – Data Client 10.9.1 Acceptance and Checking of the SA Digital Certificate (and Public Key) A Data Client will receive the SA public key in two formats, as an X.509 Digital Certificate and as a printable public key. The Data Client shall have the capability to load the SA digital certificate and manually compare the public key against the printed public key (see section 10.6.1.1). The Data Client shall only accept the SA public key when this has been done. This process applies to the original SA public key and to any subsequent public keys issued by the SA. 10.9.2 Creation of User Permit
The system/application suppliers shall be able to create their own User Permit containing the encrypted HW_ID. The User Permit will be provided to Data Servers who will then create Cell Permits for the requested ENC information. A User Permit shall only be created to request Cell Permits from a Data Server. 10.9.3 Verification of Data Server Certificate The Manufacturer application shall allow the verification of a Data Server Certificate contained within an ENC signature file using the SA public key. If the Data Server Certificate is verified successfully, the application shall then extract the Data Server public key from the Data Server Certificate and use it to verify the ENC signature.
The SA will inform the Manufacturer about revoked Data Server Certificates. 10.9.4 Validation of Cell Permits The Data Client system must have the ability to validate the integrity of a Cell Permit by checking the encrypted check sum. This shall be done by following the procedure set out in section 10.5.4 of the specification.

IHO S-63 Data Protection Scheme
S-63 Edition 1.1 65
The Data Client must be able to manage Cell Permits provided by several Data Servers. The Data Client must also be able to manage Cell Permits for the same ENC provided by multiple Data Servers.
The Data Client must have the ability to manage stored Cell Permits so that old ones can be deleted and new ones added to, or merged with, those stored.
The Data Client application should not allow the Data Client to be able to view or copy the decrypted cell keys. 10.9.5 Authentication and Decryption of ENC Information The Data Client must be able to accept a signed and encrypted ENC data set by following the procedure defined in sections 10.6 and 10.7.
10.10 QA Procedures – Manufacturers (OEMs)
10.10.1 Confidentiality Agreement The SA will provide a manufacturer with copies of all information required to operate the Data Protection Scheme within a Confidentiality Agreement. The Manufacturer shall abide by the terms and conditions of the Confidentiality Agreement and ensure that all supplied information is kept up to date. 10.10.2 System Compliance Testing The Manufacturer shall perform internal compliance testing of their implementation of the protection scheme, based on the descriptions provided in this document and the supplied test data.
The SA will only issue M_IDs and M_KEYs on successful compliance as provided by a self certification document. 10.10.3 Storage of M_IDs and M_KEYs When the Manufacturer has joined the scheme, the SA shall provide the proprietary M_ID and M_KEY information for the creation of User Permits.
The users of the Manufacturer application must not be able to view or extract the M_KEY information. 10.10.4 Creation of HW_IDs
The Manufacturer shall have the ability to create HW_IDs of the format required within the standard. These are to be random so that they will not be sequential and cannot be duplicated.
The users of the Manufacturer application must not be able to view or extract the HW_ID information from the application. 10.10.5 Recording of HW_IDs The Manufacturer must record, in an HW_ID Register, the values of each HW_ID created. These details are to be made available to the SA upon request.

IHO S-63 Data Protection Scheme
S-63 Edition 1.1 66
Page intentionally left blank
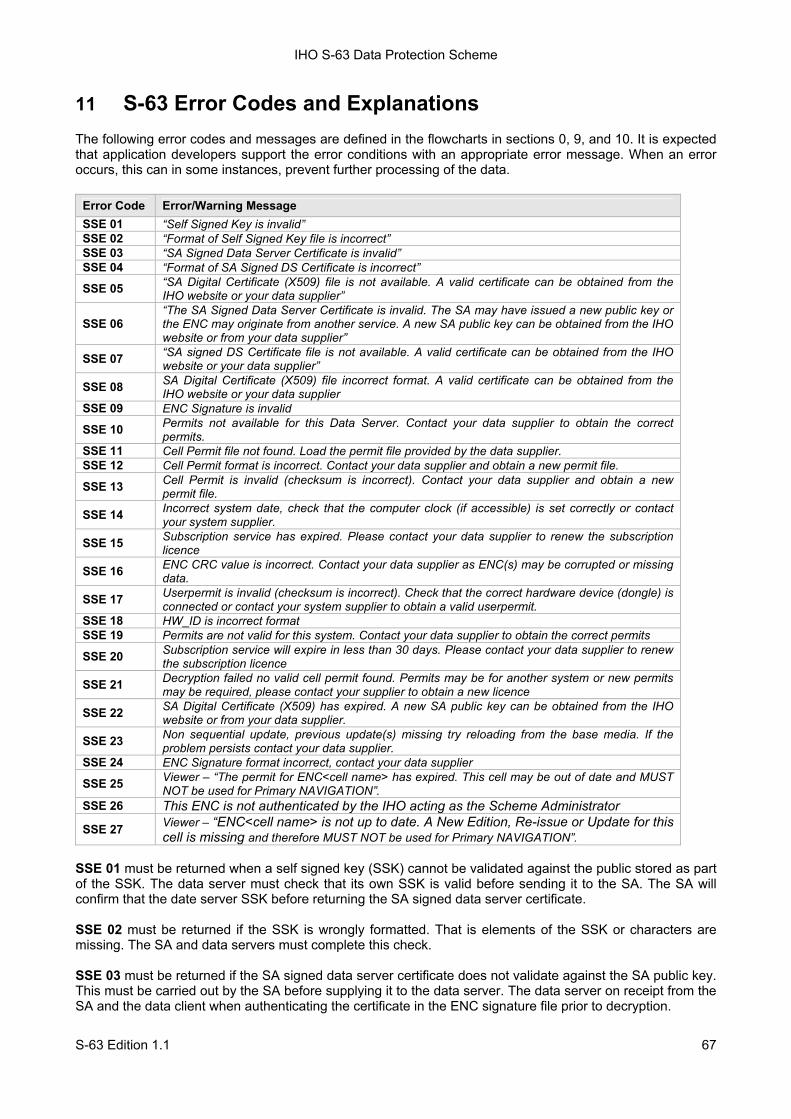
IHO S-63 Data Protection Scheme
S-63 Edition 1.1 67
11 S-63 Error Codes and Explanations The following error codes and messages are defined in the flowcharts in sections 0, 9, and 10. It is expected that application developers support the error conditions with an appropriate error message. When an error occurs, this can in some instances, prevent further processing of the data.
Error Code Error/Warning Message SSE 01 “Self Signed Key is invalid” SSE 02 “Format of Self Signed Key file is incorrect” SSE 03 “SA Signed Data Server Certificate is invalid” SSE 04 “Format of SA Signed DS Certificate is incorrect”
SSE 05 “SA Digital Certificate (X509) file is not available. A valid certificate can be obtained from the IHO website or your data supplier”
SSE 06 “The SA Signed Data Server Certificate is invalid. The SA may have issued a new public key or the ENC may originate from another service. A new SA public key can be obtained from the IHO website or from your data supplier”
SSE 07 “SA signed DS Certificate file is not available. A valid certificate can be obtained from the IHO website or your data supplier”
SSE 08 SA Digital Certificate (X509) file incorrect format. A valid certificate can be obtained from the IHO website or your data supplier
SSE 09 ENC Signature is invalid
SSE 10 Permits not available for this Data Server. Contact your data supplier to obtain the correct permits.
SSE 11 Cell Permit file not found. Load the permit file provided by the data supplier. SSE 12 Cell Permit format is incorrect. Contact your data supplier and obtain a new permit file.
SSE 13 Cell Permit is invalid (checksum is incorrect). Contact your data supplier and obtain a new permit file.
SSE 14 Incorrect system date, check that the computer clock (if accessible) is set correctly or contact your system supplier.
SSE 15 Subscription service has expired. Please contact your data supplier to renew the subscription licence
SSE 16 ENC CRC value is incorrect. Contact your data supplier as ENC(s) may be corrupted or missing data.
SSE 17 Userpermit is invalid (checksum is incorrect). Check that the correct hardware device (dongle) is connected or contact your system supplier to obtain a valid userpermit.
SSE 18 HW_ID is incorrect format SSE 19 Permits are not valid for this system. Contact your data supplier to obtain the correct permits
SSE 20 Subscription service will expire in less than 30 days. Please contact your data supplier to renew the subscription licence
SSE 21 Decryption failed no valid cell permit found. Permits may be for another system or new permits may be required, please contact your supplier to obtain a new licence
SSE 22 SA Digital Certificate (X509) has expired. A new SA public key can be obtained from the IHO website or from your data supplier.
SSE 23 Non sequential update, previous update(s) missing try reloading from the base media. If the problem persists contact your data supplier.
SSE 24 ENC Signature format incorrect, contact your data supplier
SSE 25 Viewer – “The permit for ENC<cell name> has expired. This cell may be out of date and MUST NOT be used for Primary NAVIGATION”.
SSE 26 This ENC is not authenticated by the IHO acting as the Scheme Administrator
SSE 27 Viewer – “ENC<cell name> is not up to date. A New Edition, Re-issue or Update for this cell is missing and therefore MUST NOT be used for Primary NAVIGATION”.
SSE 01 must be returned when a self signed key (SSK) cannot be validated against the public stored as part of the SSK. The data server must check that its own SSK is valid before sending it to the SA. The SA will confirm that the date server SSK before returning the SA signed data server certificate. SSE 02 must be returned if the SSK is wrongly formatted. That is elements of the SSK or characters are missing. The SA and data servers must complete this check. SSE 03 must be returned if the SA signed data server certificate does not validate against the SA public key. This must be carried out by the SA before supplying it to the data server. The data server on receipt from the SA and the data client when authenticating the certificate in the ENC signature file prior to decryption.
IHO S-63 Data Protection Scheme
S-63 Edition 1.1 68
SSE 04 must be returned if the SA signed data server certificate is wrongly formatted. This must be carried out by the data server on receipt from the SA. SSE 05 must be returned if there is no certificate installed on the data client or the path to it cannot be found. SSE 06 must be returned if the SA digital certificate (public key) does not validate against the following: SA digital certificate will not validate against the SA public key. The SA public key contained in the digital certificate will not authenticate against the signature contained in the ENC signature file. This could be a case of the certificate being invalid or an invalid or badly formatted signature. SSE 07 must be returned if the SA signed data server certificate is not available to the data server for checking or is not present in the ENC signature file when the data client attempts to authenticate it. SSE 08 must be returned if the SA public key held in the SA digital certificate is wrongly formatted or the certificate file is unreadable. SSE 09 must be returned if the ENC signature element in the ENC signature file does not authenticate against the data server public key contained in the certificate element of the ENC signature file. SSE 10 must be returned if there are no cell permits available for a particular data server corresponding to the exchange set being loaded. SSE 11 must be returned if there are no permits installed on the system. SSE 12 must be returned if the cell permits are formatted incorrectly. SSE 13 must be returned if the calculated CRC of the cell permit does not validate against the CRC held in that cell permit. [Data Clients] SSE 14 must be returned if the system date does not agree with the date obtained from any alternative, reliable date source, e.g. GPS. [Data Clients] SSE 15 must be returned if the expiry date of the cell permit has an earlier date than that obtained from the validated system date. [Data Clients] SSE 16 must be returned if the calculated CRC value of the ENC (after decryption and uncompressing) does not validate against the corresponding CRC value in the CATALOG.031 file. This also applies to the unencrypted signature, text and picture files. [Data Clients] SSE 17 must be returned if the CRC contained in the userpermit does not validate against the calculated CRC of the extracted HW_ID. [Data Servers] SSE 18 must be returned if the if the decrypted HW_ID extracted from the userpermit is incorrectly formatted. [Data servers] SSE 19 must be returned if the HW_ID stored within the hardware/software security device cannot decrypt the cell permits being loaded or already installed on the system. SSE 20 must be returned if the subscription licence is due to expire within 30 days or less. SSE 21 must be returned if a valid cell key (decryption key) cannot be obtained from the relevant cell permit to enable the system to decrypt the corresponding ENC cell. SSE 22 must be returned if the SA Digital Certificate (X509) has expired. That is if the “Valid to” date in the certificate is older than the validated system date. SSE 23 must be returned if the ENC update being imported is not sequential with the latest update already contained in the SENC for any given cell. Under these conditions the update process (for the cell) must be

IHO S-63 Data Protection Scheme
S-63 Edition 1.1 69
terminated and the ECDIS is to display a warning when the cell is displayed stating that the cell is not up to date and should not be used for navigation. SSE 24 must be returned if the ENC signature format (first R & S pair) is not compatible with the format outlined in this document. Under these conditions the import process for the cell should be terminated but the system should continue to authenticate the integrity of any remaining cells. SSE 25 must be returned if the stored ENC permit for any given cell has expired. It should be possible to view the cell but a permanent warning message must be displayed informing the user, e.g. “The permit for ENC<cell name> has expired. This cell may be out of date and MUST NOT be used for Primary NAVIGATION”. SSE 26 must be returned if the SA signed data server certificate authenticates against a certificate or public key file stored on the Data Client other than the one provided by the SA. This caters for instances where more than one certificate or public key is stored in the Data Client. SSE 27 must be returned if the status of the cell being viewed is not as up-to-date in respect of the latest PRODUCTS.TXT file loaded or maintained on the system. A permanent warning message must be displayed on screen informing the user, e.g. “ENC<cell name> is not up to date. A New Edition, Re-issue or Update for this cell is missing and therefore MUST NOT be used for Primary NAVIGATION”.

IHO S-63 Data Protection Scheme
S-63 Edition 1.1 70
Page intentionally left blank

IHO S-63 Data Protection Scheme
S-63 Edition 1.1 71
S-63 Annex A
Data Server Certificate Request Procedure

IHO S-63 Data Protection Scheme
S-63 Edition 1.1 72
Page intentionally left blank

IHO S-63 Data Protection Scheme
S-63 Edition 1.1 73
1 Purpose The purpose of this procedure is to define the process for a Data Server to obtain a SA signed Data Server Certificate from the SA as defined by the IHO S-63 Data Protection Scheme Standard.
2 Responsibility
2.1 Need for Data Server Certificate An organisation that encrypts and digitally sign ENC data as part of the IHO S-63 Data Protection Scheme will require a Data Server Certificate signed by the Scheme Administrator. Users of encrypted and digitally signed ENC data (i.e. ECDIS systems to authenticate a signature and decrypt ENC information) do not need a Data Server Certificate. Agents or Distributors who will only provide ENC services supplied by a Data Server will not require a Data Server Certificate.
2.2 Hydrographic Offices and RENC Organisations All Hydrographic Offices and RENC (Regional ENC Coordinating Centre) organisations only have to complete Part I of the attached form and include the required information to apply for a Data Server Certificate. A Data Server can only obtain one Data Server Certificate.
2.3 Non-Hydrographic Offices and Non-RENC Organisations Other commercial organisations who wish to operate as Data Servers and encrypt and digitally sign ENC information compliant with the protection scheme can apply for a Data Server Certificate. Such organisations must get a Data Server, already a member of the protection scheme, to endorse the request and complete part II of the form. It is assumed that the Data Server providing the ENC data to the commercial organisation will endorse the request.
2.4 International Hydrographic Bureau The IHB as Scheme Administrator has the sole responsibility to generate the Data Server Certificates compliant with internal procedures.
3 Definitions Data Server: This is the term used to identify an organisation producing encrypted ENC data that is
digitally signed and issuing Cell Permits to Data Clients (end-users). Certificate: Certificates are digital documents attesting to the binding of a public key to an individual or
organisation. They verify that a specific public key belongs to a specific organisation, in this case the IHO.
3.1 References [1] IHO S-63 Data Protection Scheme, International Hydrographic Organisation [2] IHO S-57 Transfer Standard for Digital Hydrographic Data, International Hydrographic Organisation
4 Procedure This chapter defines the flow of information, responsibilities and detailed work instructions.
4.1 Completion of Forms and Attachments A Data Server, who is already either a Hydrographic Office or a recognised RENC, who wishes to become a participant in the IHO S-63 Data Protection Scheme, is responsible for providing the following information to the IHB:
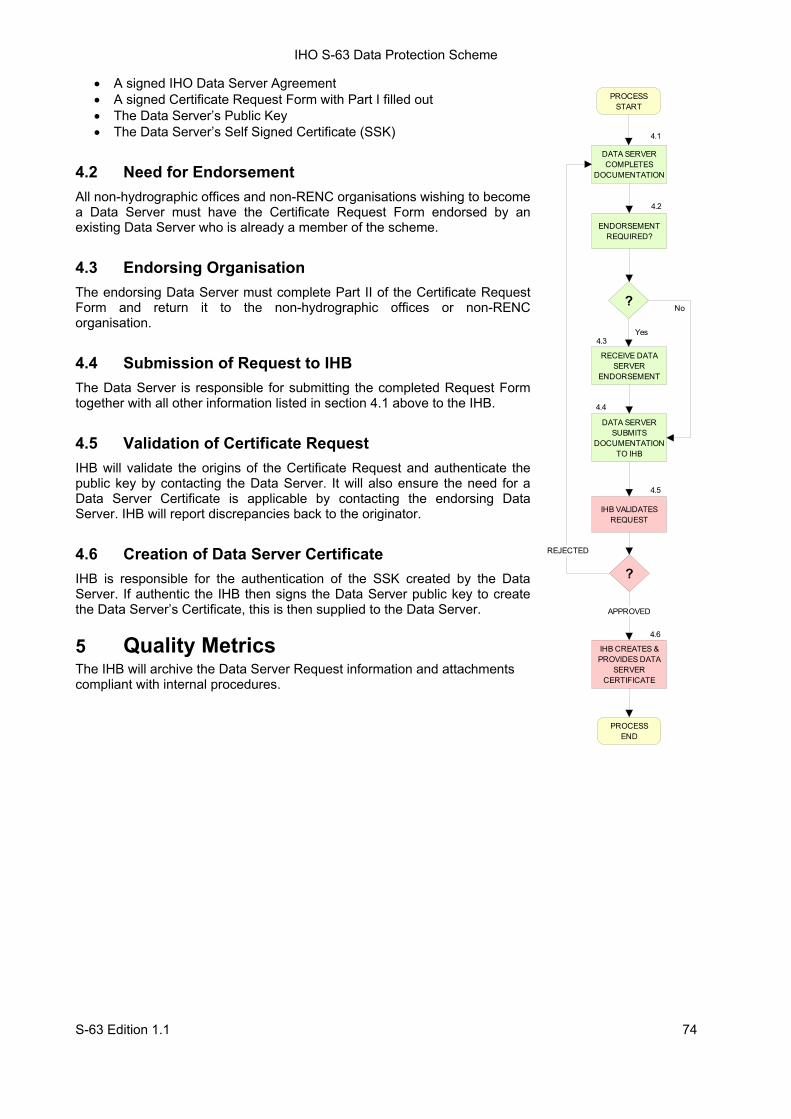
IHO S-63 Data Protection Scheme
S-63 Edition 1.1 74
• A signed IHO Data Server Agreement • A signed Certificate Request Form with Part I filled out • The Data Server’s Public Key • The Data Server’s Self Signed Certificate (SSK)
4.2 Need for Endorsement All non-hydrographic offices and non-RENC organisations wishing to become a Data Server must have the Certificate Request Form endorsed by an existing Data Server who is already a member of the scheme.
4.3 Endorsing Organisation The endorsing Data Server must complete Part II of the Certificate Request Form and return it to the non-hydrographic offices or non-RENC organisation.
4.4 Submission of Request to IHB The Data Server is responsible for submitting the completed Request Form together with all other information listed in section 4.1 above to the IHB.
4.5 Validation of Certificate Request IHB will validate the origins of the Certificate Request and authenticate the public key by contacting the Data Server. It will also ensure the need for a Data Server Certificate is applicable by contacting the endorsing Data Server. IHB will report discrepancies back to the originator.
4.6 Creation of Data Server Certificate IHB is responsible for the authentication of the SSK created by the Data Server. If authentic the IHB then signs the Data Server public key to create the Data Server’s Certificate, this is then supplied to the Data Server.
5 Quality Metrics The IHB will archive the Data Server Request information and attachments compliant with internal procedures.
PROCESSSTART
DATA SERVER COMPLETES
DOCUMENTATION
?
IHB VALIDATES REQUEST
RECEIVE DATA SERVER
ENDORSEMENT
DATA SERVER SUBMITS
DOCUMENTATIONTO IHB
No
Yes
?
IHB CREATES & PROVIDES DATA
SERVER CERTIFICATE
APPROVED
REJECTED
4.1
4.2
PROCESSEND
ENDORSEMENT REQUIRED?
4.3
4.4
4.5
4.6

IHO S-63 Data Protection Scheme
S-63 Edition 1.1 76
Page intentionally left blank

IHO S-63 Data Protection Scheme
S-63 Edition 1.1 77
S-63 Annex B
Manufacturer Information Request Procedure

IHO S-63 Data Protection Scheme
S-63 Edition 1.1 78
Page intentionally left blank
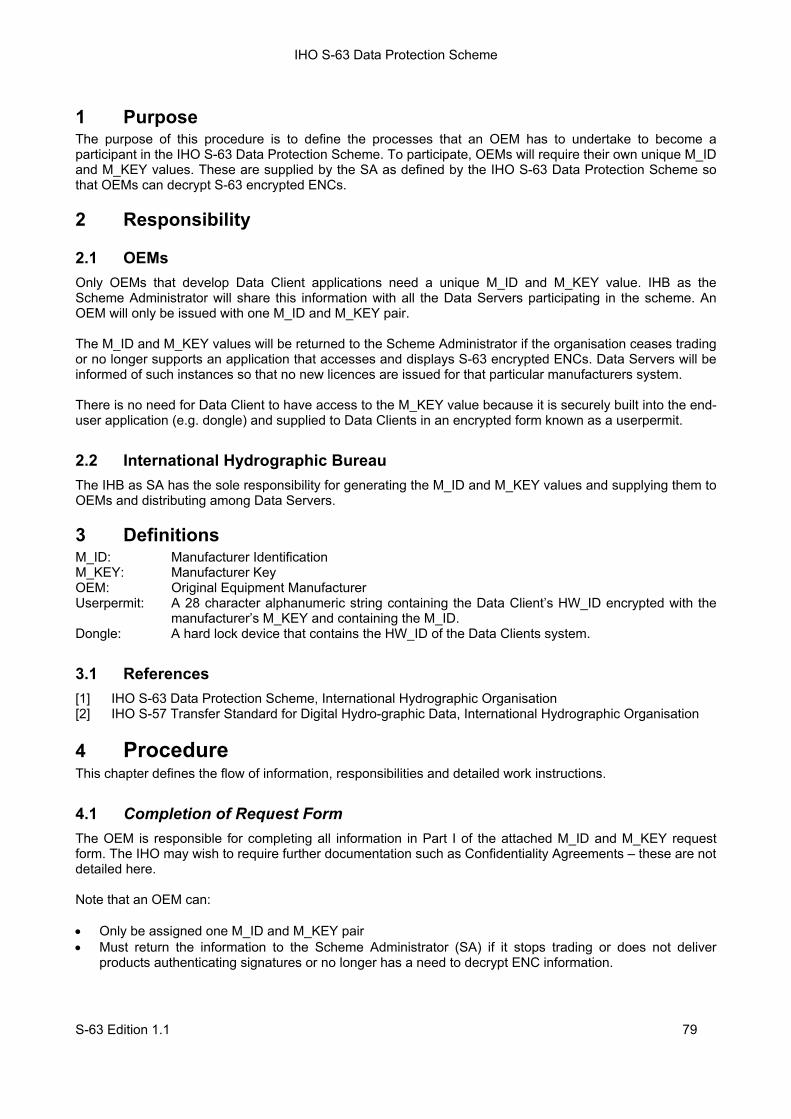
IHO S-63 Data Protection Scheme
S-63 Edition 1.1 79
1 Purpose The purpose of this procedure is to define the processes that an OEM has to undertake to become a participant in the IHO S-63 Data Protection Scheme. To participate, OEMs will require their own unique M_ID and M_KEY values. These are supplied by the SA as defined by the IHO S-63 Data Protection Scheme so that OEMs can decrypt S-63 encrypted ENCs.
2 Responsibility
2.1 OEMs Only OEMs that develop Data Client applications need a unique M_ID and M_KEY value. IHB as the Scheme Administrator will share this information with all the Data Servers participating in the scheme. An OEM will only be issued with one M_ID and M_KEY pair. The M_ID and M_KEY values will be returned to the Scheme Administrator if the organisation ceases trading or no longer supports an application that accesses and displays S-63 encrypted ENCs. Data Servers will be informed of such instances so that no new licences are issued for that particular manufacturers system. There is no need for Data Client to have access to the M_KEY value because it is securely built into the end-user application (e.g. dongle) and supplied to Data Clients in an encrypted form known as a userpermit.
2.2 International Hydrographic Bureau The IHB as SA has the sole responsibility for generating the M_ID and M_KEY values and supplying them to OEMs and distributing among Data Servers.
3 Definitions M_ID: Manufacturer Identification M_KEY: Manufacturer Key OEM: Original Equipment Manufacturer Userpermit: A 28 character alphanumeric string containing the Data Client’s HW_ID encrypted with the
manufacturer’s M_KEY and containing the M_ID. Dongle: A hard lock device that contains the HW_ID of the Data Clients system.
3.1 References [1] IHO S-63 Data Protection Scheme, International Hydrographic Organisation [2] IHO S-57 Transfer Standard for Digital Hydro-graphic Data, International Hydrographic Organisation
4 Procedure This chapter defines the flow of information, responsibilities and detailed work instructions.
4.1 Completion of Request Form The OEM is responsible for completing all information in Part I of the attached M_ID and M_KEY request form. The IHO may wish to require further documentation such as Confidentiality Agreements – these are not detailed here. Note that an OEM can: • Only be assigned one M_ID and M_KEY pair • Must return the information to the Scheme Administrator (SA) if it stops trading or does not deliver
products authenticating signatures or no longer has a need to decrypt ENC information.
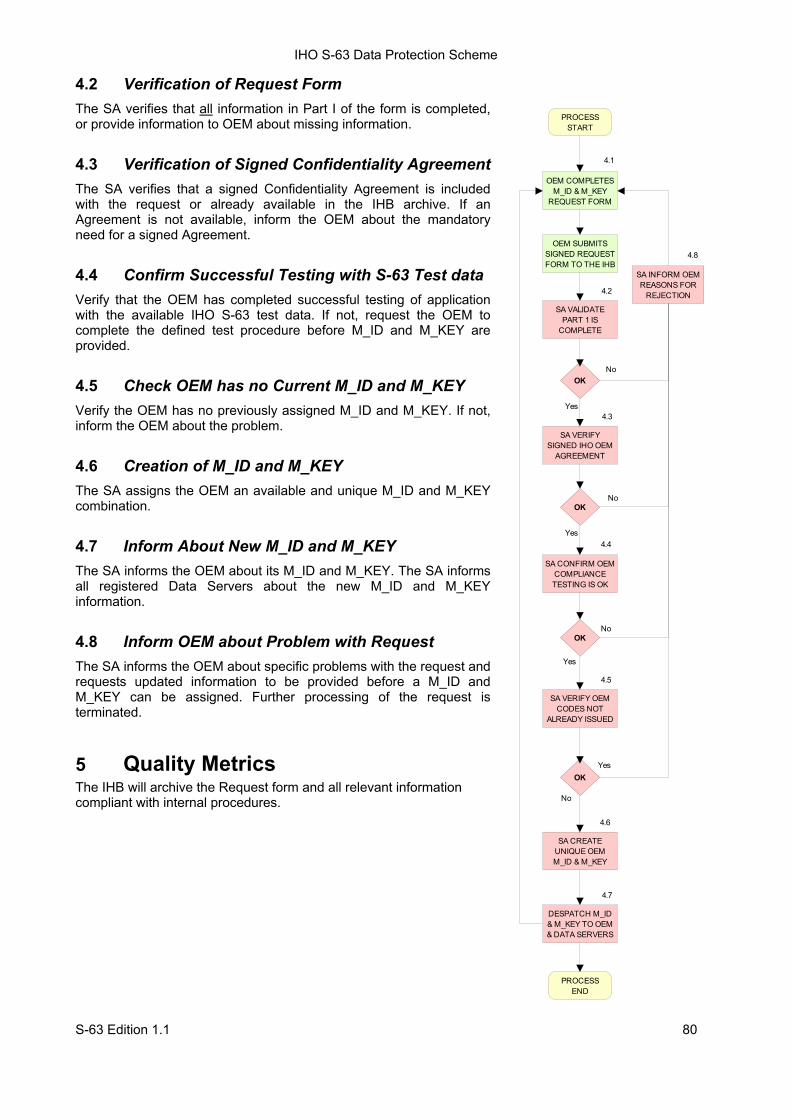
IHO S-63 Data Protection Scheme
S-63 Edition 1.1 80
4.2 Verification of Request Form The SA verifies that all information in Part I of the form is completed, or provide information to OEM about missing information.
4.3 Verification of Signed Confidentiality Agreement The SA verifies that a signed Confidentiality Agreement is included with the request or already available in the IHB archive. If an Agreement is not available, inform the OEM about the mandatory need for a signed Agreement.
4.4 Confirm Successful Testing with S-63 Test data Verify that the OEM has completed successful testing of application with the available IHO S-63 test data. If not, request the OEM to complete the defined test procedure before M_ID and M_KEY are provided.
4.5 Check OEM has no Current M_ID and M_KEY Verify the OEM has no previously assigned M_ID and M_KEY. If not, inform the OEM about the problem.
4.6 Creation of M_ID and M_KEY The SA assigns the OEM an available and unique M_ID and M_KEY combination.
4.7 Inform About New M_ID and M_KEY The SA informs the OEM about its M_ID and M_KEY. The SA informs all registered Data Servers about the new M_ID and M_KEY information.
4.8 Inform OEM about Problem with Request The SA informs the OEM about specific problems with the request and requests updated information to be provided before a M_ID and M_KEY can be assigned. Further processing of the request is terminated.
5 Quality Metrics The IHB will archive the Request form and all relevant information compliant with internal procedures.
PROCESSSTART
OEM COMPLETES M_ID & M_KEY
REQUEST FORM
OEM SUBMITS SIGNED REQUEST FORM TO THE IHB
SA VALIDATE PART 1 IS
COMPLETE
OK
SA VERIFY SIGNED IHO OEM
AGREEMENT
OK
SA INFORM OEM REASONS FOR
REJECTION
No
Yes
No
SA CONFIRM OEM COMPLIANCE TESTING IS OK
Yes
OKNo
SA VERIFY OEM CODES NOT
ALREADY ISSUED
Yes
OKYes
SA CREATE UNIQUE OEM M_ID & M_KEY
No
DESPATCH M_ID & M_KEY TO OEM & DATA SERVERS
PROCESSEND
4.1
4.2
4.3
4.4
4.5
4.6
4.7
4.8
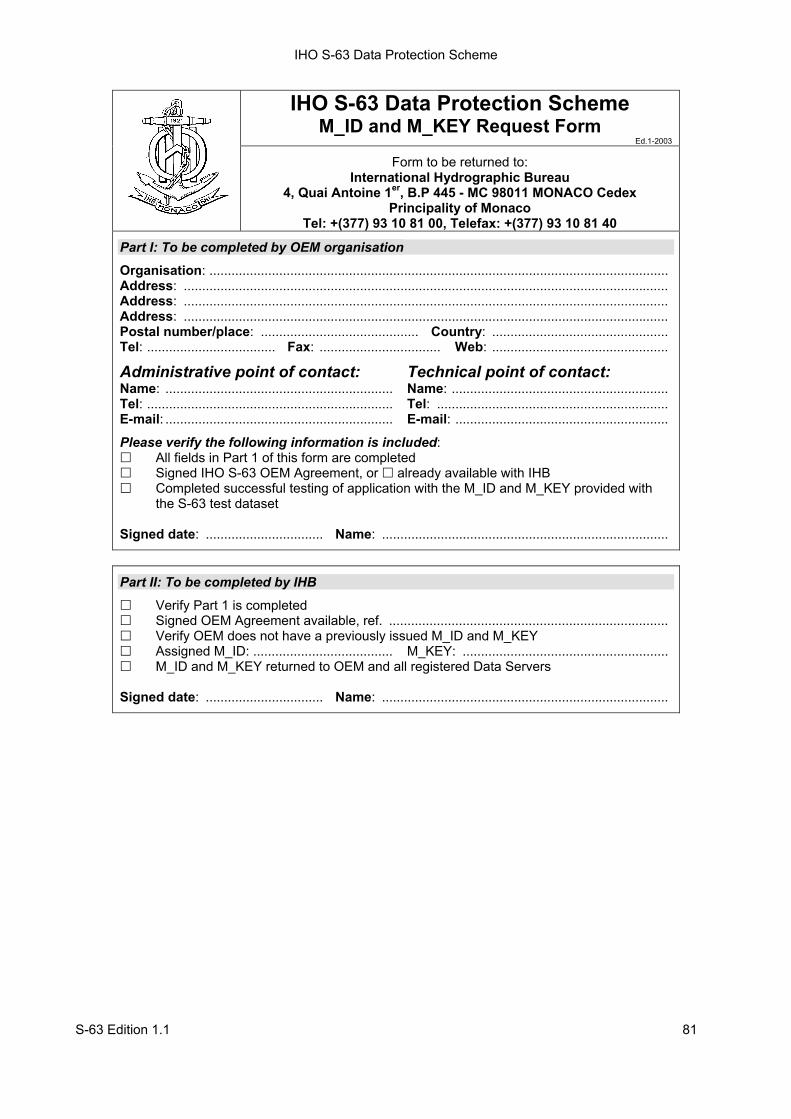
IHO S-63 Data Protection Scheme
S-63 Edition 1.1 81
IHO S-63 Data Protection Scheme M_ID and M_KEY Request Form
Ed.1-2003
Form to be returned to: International Hydrographic Bureau
4, Quai Antoine 1er, B.P 445 - MC 98011 MONACO Cedex Principality of Monaco
Tel: +(377) 93 10 81 00, Telefax: +(377) 93 10 81 40
Part I: To be completed by OEM organisation
Organisation: ............................................................................................................................. Address: .................................................................................................................................... Address: .................................................................................................................................... Address: .................................................................................................................................... Postal number/place: ........................................... Country: ................................................ Tel: ................................... Fax: ................................. Web: ................................................
Administrative point of contact: Technical point of contact: Name: .............................................................. Name: ........................................................... Tel: ................................................................... Tel: ............................................................... E-mail: .............................................................. E-mail: ..........................................................
Please verify the following information is included: All fields in Part 1 of this form are completed Signed IHO S-63 OEM Agreement, or already available with IHB Completed successful testing of application with the M_ID and M_KEY provided with
the S-63 test dataset Signed date: ................................ Name: ..............................................................................
Part II: To be completed by IHB
Verify Part 1 is completed Signed OEM Agreement available, ref. ............................................................................ Verify OEM does not have a previously issued M_ID and M_KEY Assigned M_ID: ...................................... M_KEY: ........................................................ M_ID and M_KEY returned to OEM and all registered Data Servers
Signed date: ................................ Name: ..............................................................................

IHO S-63 Data Protection Scheme
S-63 Edition 1.1 82
Page intentionally left blank

IHO S-63 Data Protection Scheme
S-63 Edition 1.1 83
S-63 Appendix 1 [S-63 Test Data Set] Data Protection Scheme Test Data

IHO S-63 Data Protection Scheme
S-63 Edition 1.1 84
Page intentionally left blank
IHO S-63 Data Protection Scheme
S-63 Edition 1.1 85
Important Notice: S-63 Appendix 1 includes test data which are provided separately as compressed (ZIP) files (see S-63 page on the IHO website – www.iho.int/ECDIS/). Embedded in the ZIP file is a document “Test Data Implementation Guide” providing instructions on how to use the test data. The text below provides a brief presentation of Appendix 1.
1 Introduction The S-63 Appendix 1 defines a recommended set of test definitions and test data which can be used by developers of Data Server and Data Client applications to understand the security constructs defined in S-63 and test if their application is compliant with the standard. It includes a “Test Data Implementation Guide” which is provided along with the test data. The S-63 Appendix 1 will be maintained by the IHO DPSWG. More test data can be included in the future based on user feedback to provide a complete test platform to verify correctness and compliance with the standard, or for end-user applications to identify erroneous situations. The current version of the document provides a complete test sample for compliance testing. The associated “Test Data Implementation Guide” will be maintained independent of the IHO S-63 main document and new versions will be published on the IHO website. Questions related to the use of the test data can be posted at the OpenEcdis Forum (www.openecdis.org).
2 Organisation of the Test Definitions and Test data 2.1 Test Definitions The test definitions offers high level functional tests which are recommended to test for compliance with all security constructs defined in S-63. It does not replace unit testing in software development, but offer structured input to functional software testing. The test definitions are organised in functional categories and defined in chapter 3 of the “Test Data Implementation Guide”. Test definitions for the Scheme Administrator functionality has not been included in the document since only the IHB will require these test scenarios. Each test definition indicates if the test is applicable for Data Server or Data Client applications. Note that a test is relevant for all applications if the type of application is omitted. There are test definitions for both good and erroneous test conditions to ensure a robust application and reflect operational conditions. Note that the IEC will be responsible for defining applicable ECDIS type approval tests which will complement this document.
2.2 Test data A range of test data has been developed to support the test definitions. The features of each test data set are defined in chapter 4 of the “Test Data Implementation Guide”. All the test data is organised in a ZIP file and will extract into a directory structure where each test data will be located in a separate directory. Note that some of the test data sets are used in multiple test definitions. Note that the test data can also be used by developers for unit testing or other test situations for their application.
IHO S-63 Data Protection Scheme
S-63 Edition 1.1 86
2.3 Conditions of Use for the Test data The ENC information (the material) included in the test data has been made available to the recipient solely for the purpose of testing their application and verifying compliance with the S-63 standard. The material is supplied under the conditions shown below. If the recipient does not agree to be bound by these conditions then the material should not be used and it should be destroyed.
5.1.1 2.3.1 Conditions of Release The material supplied is protected by the copyright of the national Hydrographic Office. No part of the supplied material may be reproduced, stored in a retrieval system or transmitted in any form or by any means, electronic, mechanical, photocopying or otherwise except as required to fulfil the purpose described above.
The material is NOT to be used for navigation.
When the material is no longer required to fulfil the purpose, it and any working copies, are to be destroyed. 5.1.2 2.3.2 Disclaimer Whilst the IHB and the Hydrographic Offices have used its best endeavours to ensure that the material is suitable to fulfil the purposes, they offer no warranty guarantee or other assurances to the effect that it will meet the requirements. The IHB and the Hydrographic Offices will accept no liability for any damage or loss of any nature rising form its use. The material supplied is used entirely at the recipient’s own risk.

IHO S-63 Data Protection Scheme
S-63 Edition 1.1 87
S-63 Appendix 2 [Large Media Support] Large Media Support

IHO S-63 Data Protection Scheme
S-63 Edition 1.1 88
Page intentionally left blank

IHO S-63 Data Protection Scheme
S-63 Edition 1.1 89
1 Introduction Until recently the majority of ECDIS/ECS only had the capability to load ENC Exchange Sets (ExSets) from CD-ROMs. However, it is becoming increasingly common for new OEM hardware to be delivered with DVD drives or other Large Media Support1 (LMS). The inclusion of this media support now offers data servers the potential to include more ENC data on a single media. Several issues have emerged during the operation of the existing S-63 encrypted ENC services using edition 1.0 of the standard. Not least of these is the fact that providing large exchange sets has resulted in unacceptable load times to the ECDIS/ECS. This is one of the principle reasons why data servers did not provide services that included single exchange sets spanning multiple CD-ROMs. To store a single ENC exchange set on a mass storage device such as a DVD or USB that was similar in size to that stored on CD-ROM, would be an inefficient use of the media and the available memory. This being the case it would make sense to store multiple exchange sets on the same media, each about the same size as those currently stored on CD-ROM. Since this method of storage is not defined in the IHO S-57 Product Specifications or Edition 1.0 of S-63 a new configuration will have to be specified. When designing the media structure the following considerations have been taken into account:
• ENC Services may be provided across multiple media sets • ENC Services may contain data from more than one Data Server • Suitable files must be provided so that manufacturer systems can manage and import S-63
encrypted ENCs in an efficient and expeditious manner and create intuitive systems which manage multiple pieces of media easily.
2 Media Overview The following section gives a high level view of how the data will be structured on the media. It also outlines how the S-63 exchange set structure has been modified for large media support; this is further supported by diagrams in Annexes A and B of this appendix. Detailed information relating to the content and format of these folders and files are provided later in this appendix. 2.1 Media Types There will be two types of media, “BASE”, containing one or more Base Exchange sets and, “UPDATE”, containing the weekly ENC updates, these may be contained in one or more exchanges sets on the update media. It was considered that because of the increased capacity which these types of media offer it could be possible to re-issue base ExSets on the update media and conversely weekly updates on the base media. 2.2 Media Folder and File Structure All exchange sets are located in the root directory of each media each within their own specific sub-directory. The configuration of all exchange sets are the same as outlined in 7.5.1 of the main document with the one notable exception. The “INFO” folder that includes the “PRODUCTS.TXT” file will no longer be stored in the root directory of the exchange set(s) but in the root directory of the media. The “INFO” will continue to be used by data servers to include additional files unique and specific to their S-63 encrypted ENC services. Note that any data server specific files stored in this folder must be named in such a way that they DO NOT conflict with the S-63 file naming convention.
1 Large Media Support can also be referred to as Mass Storage Devices.
IHO S-63 Data Protection Scheme
S-63 Edition 1.1 90
2.2.1 Additional Media File
An additional file named “MEDIA.TXT” will be included on each piece of media to assist data clients in managing multiple exchange sets on the same media and across multiple media sets. It will also enable data clients systems to prompt users to insert the relevant media by including a machine readable string in each record referring to each piece of media. A more detailed explanation of the format of the MEDIA.TXT file is provided later in section 3.
2.3 Media Identification There must be a method for differentiating between services provided on CD and those supplied using large media support. The first differentiator is the volume ID of the media (see section 2.3.1). This will identify the use of large media format and notify the data client of the expected folder and file structure. A further indication is the presence of the new MEDIA.TXT file is in the root directory of the media is a further indication that an ENC service is being provided using large media support.
2.3.1 Media Labelling
For large media support the media labelling convention will be similar to that used in the IHO S-57 product specification. Instead of “V01X01”, where “V” stands for “Volume”, the letter “M” for “Media” will be substituted.
The volume label for large media support will also indicate how many media sets there are in a service. Therefore if there are three media sets they will be labelled as follows:
M01X03 [Media set 1 of 3] M02X03 [Media set 2 of 3] M03X03 [Media set 3 of 3]
NOTE: This only identifies the number of media sets in an ENC service and does not imply that this is a single exchange set covering multiple media sets. This purpose of this naming convention is to assist data clients to identify the media where licenced cells are located.
3 Media File Formats 3.1 Product Listing (PRODUCTS.TXT) For “Base Media” the “PRODUCTS.TXT” file will contain records for all cells held on that particular media. The header as defined in section 6.2.2 of the main document will be labelled as “FULL” if there is only one media in a particular service. However if there is more than one media this will be labelled “PARTIAL”. A “FULL” products listing will always be provided on the “Update Media” with records of all cells in a data server’s service. It is important that ECDIS/ECS manufacturers manage these records carefully; “PARTIAL” product listings must be merged with the “FULL” listing stored within the system. It must be noted that the system may contain product information from more than one data server. Therefore it is important not to overwrite “FULL” listings unless they are stored independently according to data server. 3.2 Media Listing (MEDIA.TXT) This is a new file designed to manage services supplied using large media support. It is located in the root directory of the base and update media and contains information relating to all media in a data server’s service and the exchange sets contained on the media. The main purpose of this file is as follows:
IHO S-63 Data Protection Scheme
S-63 Edition 1.1 91
To provide data clients with a means to manage the import of a data server’s service that supports large media. To provide information to allow data clients to manage multiple media sets. To provide machine readable information so that data clients can make the import process more intuitive for the end user. NOTE: The latest update media will always contain the most up to date status of the base exchanges sets in a data server’s service. This can be used to check the latest base exchange set has been installed. Further details on the structure and format of this file are outlined below.
3.2.1 Header Format
The purpose of the MEDIA.TXT header is similar to that of the SERIAL.ENC file stored with the exchange set. It is used to manage the media installation by identifying the following:
• The media service provider • The media date and week of issue • The media number and media type • Machine readable media name to display to users
The header is provided in two lines each containing a single record, the first is a fixed length, and the second is comma separated. The following table defines the format in more detail:
Field ID Domain Bytes Range Data Server ID Character 2 Any pair of alphanumeric, e.g. PR Week of Issue Character 10 Any ASCII Characters, e.g. WKNN_YY Date of Issue Date 8 YYYYMMDD Media Type Character 10 BASE or UPDATE Media Label ID Character 6 M[01-99]X[01-99] End of record delimiter hexadecimal 2 CR/LF Media ID Character 2-3 For example, M1, M2 or M11. Machine Readable Media Name ‘Character’ 0-100 Text string contained within quotation marks Regional Information [Optional] ‘Character’ 0-100 Text string contained within quotation marks End of record delimiter hexadecimal 2 CR/LF
Example: GBWK27_07 20070621BASE M01X03 M1,’UKHO Week 27_07 BASE MEDIA 1’,’Europe, Africa, and Middle East’
3.2.2 Media Record Format
The “MEDIA.TXT” file also contains a list of records that identifies all exchange sets in a data server’s service and the destination media where they can be located. Its purpose is to provide data clients with a means of managing the import of encrypted ENCs across multiple media sets and provide machine readable information so that the data client can prompt end users to load the appropriate media. The “MEDIA.TXT” file stored on the UPDATE media will always contain a FULL list of media sets contained in a data server’s service. It will also carry the date when the media was last issued, this way the ECDIS/ECS can always validate whether it holds the latest information.
The “MEDIA.TXT” file stored on the BASE media will contain a list of those exchange sets stored on the media. It will NOT contain information about the other volumes in the service.
Field ID Domain Bytes Range Notes
(see below) Media/Exchange Set Location Character 5-7 M1 to M99;B1 to B99
e.g. M2;B7 [Media 2, Base ExS 7] M1 to M99;U1 to U99 e.g. M1;U2 [Media 1, Update ExS 2]
1
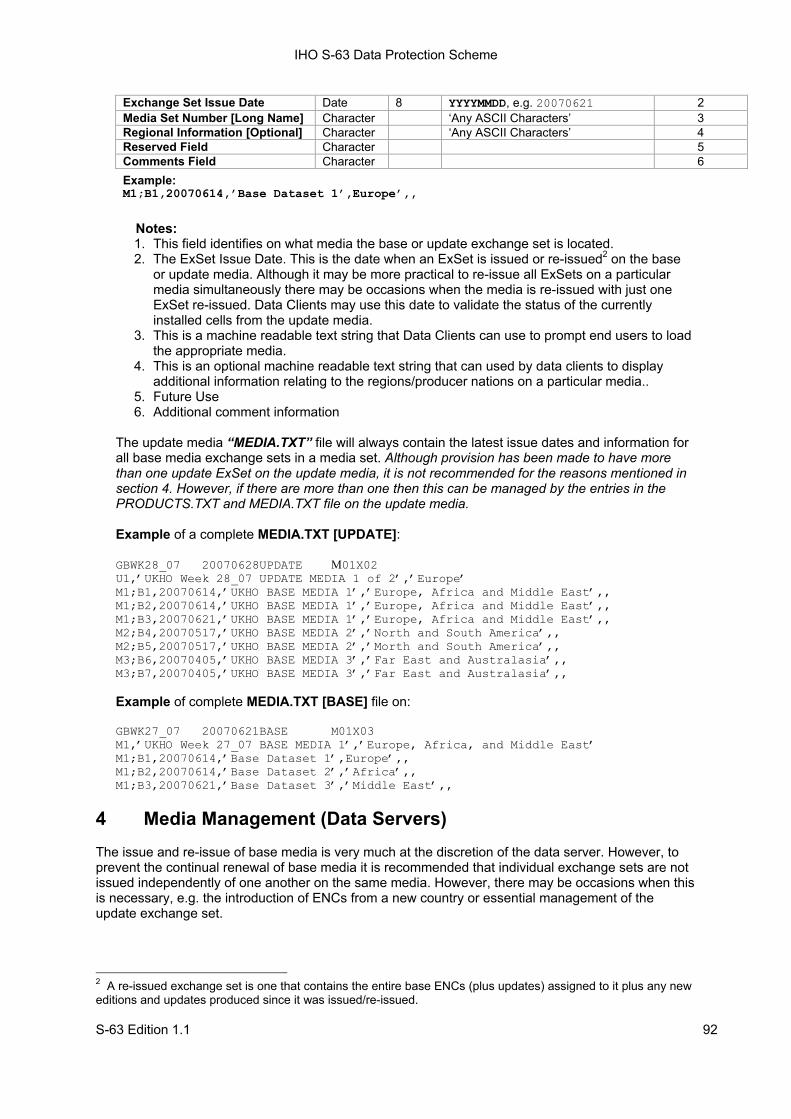
IHO S-63 Data Protection Scheme
S-63 Edition 1.1 92
Exchange Set Issue Date Date 8 YYYYMMDD, e.g. 20070621 2 Media Set Number [Long Name] Character ‘Any ASCII Characters’ 3 Regional Information [Optional] Character ‘Any ASCII Characters’ 4 Reserved Field Character 5 Comments Field Character 6
Example: M1;B1,20070614,’Base Dataset 1’,Europe’,,
Notes: 1. This field identifies on what media the base or update exchange set is located. 2. The ExSet Issue Date. This is the date when an ExSet is issued or re-issued2 on the base
or update media. Although it may be more practical to re-issue all ExSets on a particular media simultaneously there may be occasions when the media is re-issued with just one ExSet re-issued. Data Clients may use this date to validate the status of the currently installed cells from the update media.
3. This is a machine readable text string that Data Clients can use to prompt end users to load the appropriate media.
4. This is an optional machine readable text string that can used by data clients to display additional information relating to the regions/producer nations on a particular media..
5. Future Use 6. Additional comment information
The update media “MEDIA.TXT” file will always contain the latest issue dates and information for all base media exchange sets in a media set. Although provision has been made to have more than one update ExSet on the update media, it is not recommended for the reasons mentioned in section 4. However, if there are more than one then this can be managed by the entries in the PRODUCTS.TXT and MEDIA.TXT file on the update media.
Example of a complete MEDIA.TXT [UPDATE]:
GBWK28_07 20070628UPDATE M01X02 U1,’UKHO Week 28_07 UPDATE MEDIA 1 of 2’,’Europe’ M1;B1,20070614,’UKHO BASE MEDIA 1’,’Europe, Africa and Middle East’,, M1;B2,20070614,’UKHO BASE MEDIA 1’,’Europe, Africa and Middle East’,, M1;B3,20070621,’UKHO BASE MEDIA 1’,’Europe, Africa and Middle East’,, M2;B4,20070517,’UKHO BASE MEDIA 2’,’North and South America’,, M2;B5,20070517,’UKHO BASE MEDIA 2’,’Morth and South America’,, M3;B6,20070405,’UKHO BASE MEDIA 3’,’Far East and Australasia’,, M3;B7,20070405,’UKHO BASE MEDIA 3’,’Far East and Australasia’,, Example of complete MEDIA.TXT [BASE] file on:
GBWK27_07 20070621BASE M01X03 M1,’UKHO Week 27_07 BASE MEDIA 1’,’Europe, Africa, and Middle East’ M1;B1,20070614,’Base Dataset 1’,Europe’,, M1;B2,20070614,’Base Dataset 2’,’Africa’,, M1;B3,20070621,’Base Dataset 3’,’Middle East’,,
4 Media Management (Data Servers) The issue and re-issue of base media is very much at the discretion of the data server. However, to prevent the continual renewal of base media it is recommended that individual exchange sets are not issued independently of one another on the same media. However, there may be occasions when this is necessary, e.g. the introduction of ENCs from a new country or essential management of the update exchange set.
2 A re-issued exchange set is one that contains the entire base ENCs (plus updates) assigned to it plus any new editions and updates produced since it was issued/re-issued.
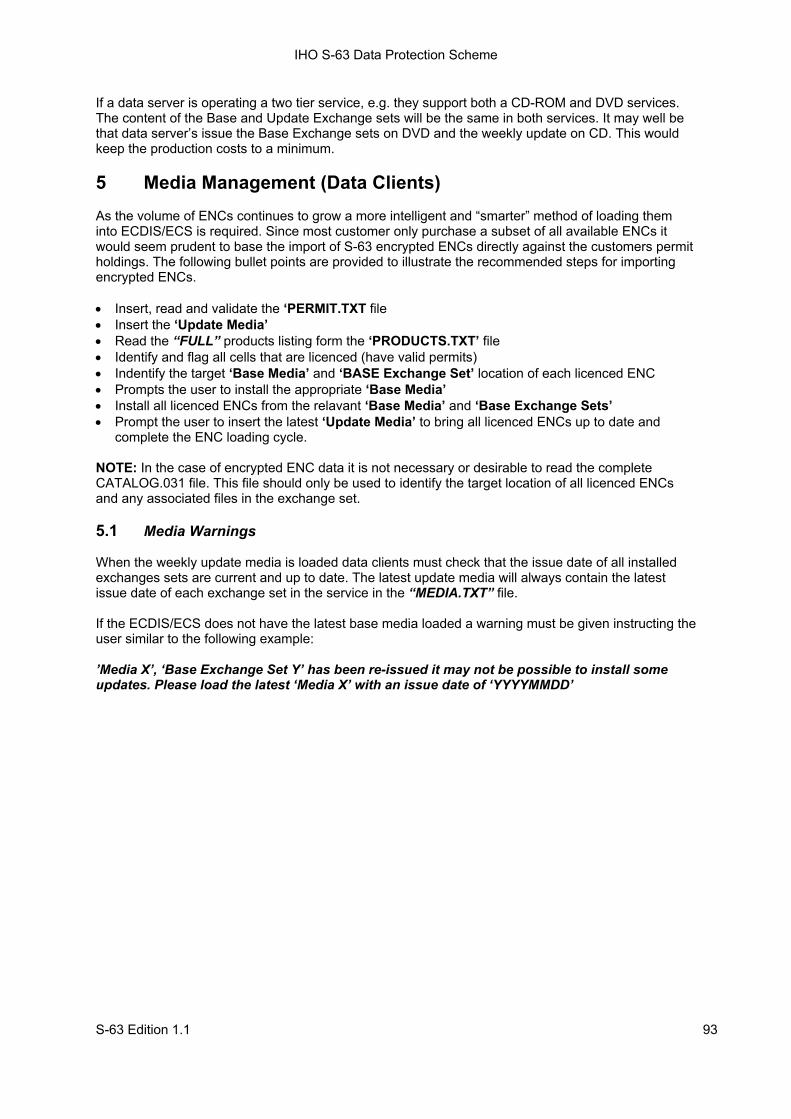
IHO S-63 Data Protection Scheme
S-63 Edition 1.1 93
If a data server is operating a two tier service, e.g. they support both a CD-ROM and DVD services. The content of the Base and Update Exchange sets will be the same in both services. It may well be that data server’s issue the Base Exchange sets on DVD and the weekly update on CD. This would keep the production costs to a minimum. 5 Media Management (Data Clients) As the volume of ENCs continues to grow a more intelligent and “smarter” method of loading them into ECDIS/ECS is required. Since most customer only purchase a subset of all available ENCs it would seem prudent to base the import of S-63 encrypted ENCs directly against the customers permit holdings. The following bullet points are provided to illustrate the recommended steps for importing encrypted ENCs. • Insert, read and validate the ‘PERMIT.TXT file • Insert the ‘Update Media’ • Read the “FULL” products listing form the ‘PRODUCTS.TXT’ file • Identify and flag all cells that are licenced (have valid permits) • Indentify the target ‘Base Media’ and ‘BASE Exchange Set’ location of each licenced ENC • Prompts the user to install the appropriate ‘Base Media’ • Install all licenced ENCs from the relavant ‘Base Media’ and ‘Base Exchange Sets’ • Prompt the user to insert the latest ‘Update Media’ to bring all licenced ENCs up to date and
complete the ENC loading cycle. NOTE: In the case of encrypted ENC data it is not necessary or desirable to read the complete CATALOG.031 file. This file should only be used to identify the target location of all licenced ENCs and any associated files in the exchange set. 5.1 Media Warnings When the weekly update media is loaded data clients must check that the issue date of all installed exchanges sets are current and up to date. The latest update media will always contain the latest issue date of each exchange set in the service in the “MEDIA.TXT” file. If the ECDIS/ECS does not have the latest base media loaded a warning must be given instructing the user similar to the following example: ’Media X’, ‘Base Exchange Set Y’ has been re-issued it may not be possible to install some updates. Please load the latest ‘Media X’ with an issue date of ‘YYYYMMDD’
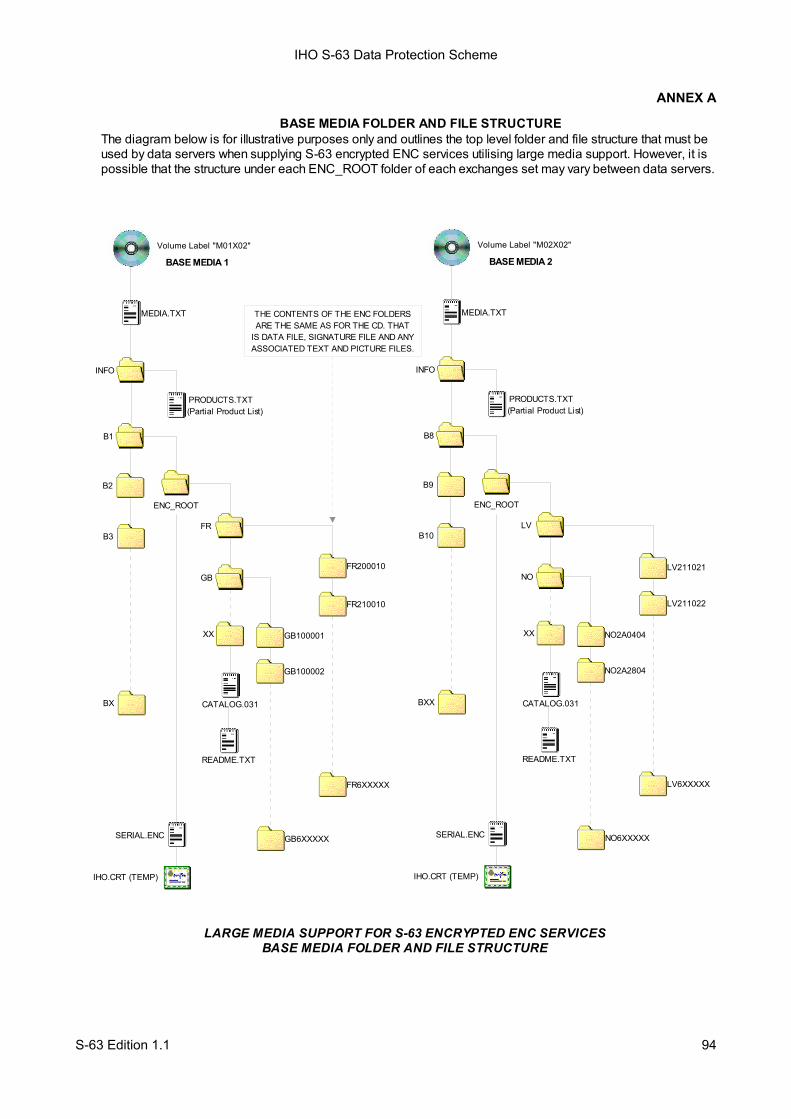
IHO S-63 Data Protection Scheme
S-63 Edition 1.1 94
ANNEX A
Volume Label "M01X02"
B1
B2
FR210010
FR200010
B3
BX
FR
GB
GB100002
GB100001
SERIAL.ENC GB6XXXXX
FR6XXXXX
LARGE MEDIA SUPPORT FOR S-63 ENCRYPTED ENC SERVICESBASE MEDIA FOLDER AND FILE STRUCTURE
THE CONTENTS OF THE ENC FOLDERSARE THE SAME AS FOR THE CD. THAT
IS DATA FILE, SIGNATURE FILE AND ANYASSOCIATED TEXT AND PICTURE FILES.
XX
IHO.CRT (TEMP)
ENC_ROOT
CATALOG.031
README.TXT
BASE MEDIA 1
PRODUCTS.TXT (Partial Product List)
MEDIA.TXT
INFO
BASE MEDIA FOLDER AND FILE STRUCTUREThe diagram below is for illustrative purposes only and outlines the top level folder and file structure that must be used by data servers when supplying S-63 encrypted ENC services utilising large media support. However, it is possible that the structure under each ENC_ROOT folder of each exchanges set may vary between data servers.
Volume Label "M02X02"
B8
B9
LV211022
LV211021
B10
BXX
LV
NO
NO2A2804
NO2A0404
SERIAL.ENC NO6XXXXX
LV6XXXXX
XX
IHO.CRT (TEMP)
ENC_ROOT
CATALOG.031
README.TXT
PRODUCTS.TXT (Partial Product List)
MEDIA.TXT
INFO
BASE MEDIA 2
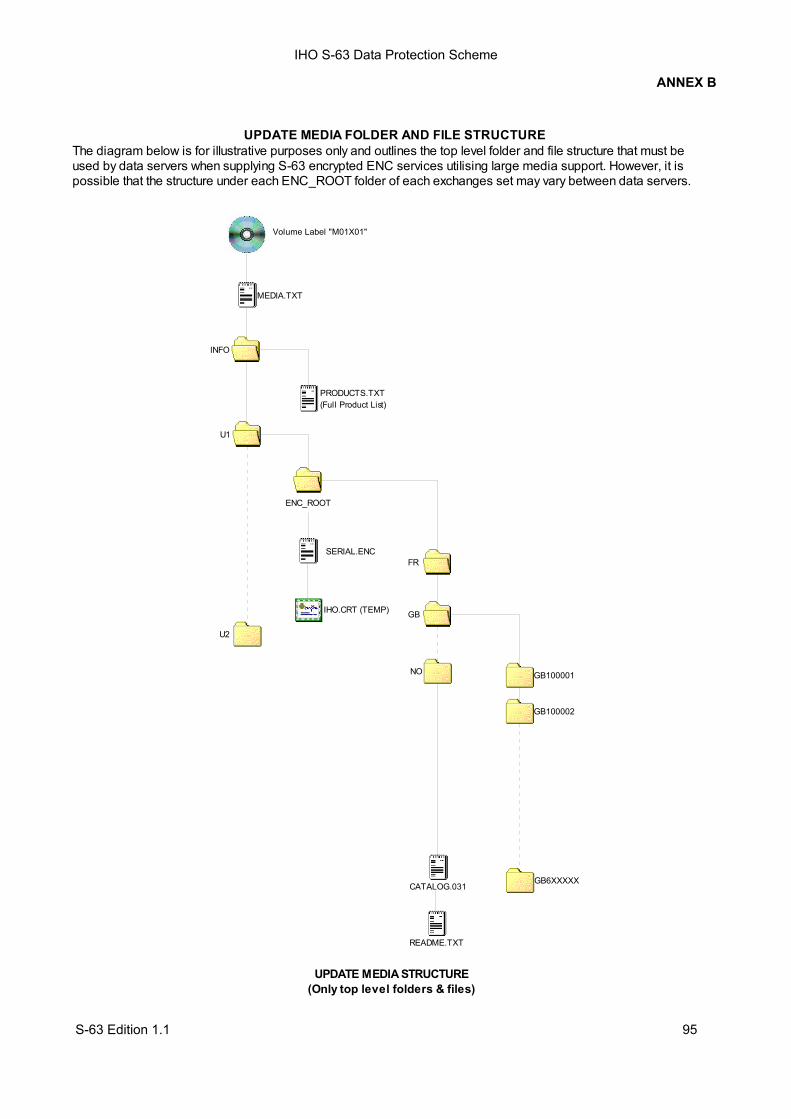
IHO S-63 Data Protection Scheme
S-63 Edition 1.1 95
ANNEX B
Volume Label "M01X01"
U2
SERIAL.ENC
IHO.CRT (TEMP)
ENC_ROOT
UPDATE MEDIA STRUCTURE(Only top level folders & files)
PRODUCTS.TXT (Full Product List)
MEDIA.TXT
INFO
U1
FR
GB
GB100002
GB100001
GB6XXXXX
NO
CATALOG.031
README.TXT
UPDATE MEDIA FOLDER AND FILE STRUCTUREThe diagram below is for illustrative purposes only and outlines the top level folder and file structure that must be used by data servers when supplying S-63 encrypted ENC services utilising large media support. However, it is possible that the structure under each ENC_ROOT folder of each exchanges set may vary between data servers.