march 26, 2012 ashok leyland (ashley) - icici...
TRANSCRIPT
ICICI Securities Ltd | Retail Equity Research
Pure CV play; re-rating in sight!!! Ashok Leyland (ALL) is one of the few pure play major commercial vehicle manufacturers in India. ALL is the second largest player across various segments with an overall market share of ~23% YTD. It has remained highly cyclical in terms of revenues/earnings (MHCV led) as it remains highly dependent on macros like GDP growth/interest rates. However, the foray into various segments including LCV segment is expected to provide lot of sustainable revenue streams. We believe ALL would witness volume growth at ~19% CAGR (FY12E-14E) as both MHCV/LCV witness higher than historical growth rates as the investment cycle starts to take precedence over consumption. On financials, we find ALL’s earnings potential on a free cash basis pretty attractive as large capex is over. On earnings, we expect revenue & profit to grow at ~14% & 28% CAGR over FY12E-14E to ~| 16,732 crore & ~| 800 crore, respectively. On valuations, we assign a higher up-cycle multiple of ~11x and initiate coverage on the stock with BUY rating. Volume growth to surprise … ALL is expected to be one of the strongest beneficiaries of the return of the up-cycle in industrial segment. In FY12E, CV demand has remained highly resilient surprising mostly bearish analysts as underlying fundamentals of freight rates, financier loans and operator profitability remained strong. We believe this is a reflection of strong inherent economic activity leading to higher road freight. Thus, we have modelled volume growth at ~19% CAGR (FY14-12E) at ~1,44,700 units as both LCV segment ramp-up and MHCV segment are expected to rebound post a sedate FY12E. Lone cyclical pure play in CV business; scarcity premium attached ALL remains one of the few pure plays in the CV segment unlike Tata Motors (luxury play) and Eicher Motors (two wheelers). We believe our change of bias is justified in terms of multiples as we believe the interest rate cut scenario would lead to a re-rating in expectations of better earnings growth in the coming periods.
Valuation We have analysed the business with both macro and stock specific features in mind. We believe that though competition has strengthened from EIM/AMW, ALL would be able to maintain a significant market share. At the CMP of | 29, the stock is trad ing at 9.6x FY14E PE. We believe the interest rate cycle is ripe for reversal and could trigger a strong multiple re-rating for ALL in earnings expectations. Thus, we have arrived at a target price of | 36. We initiate coverage on the stock with a BUY rating.
Exhibit 1: Key Financials (Year-end March) FY10 FY11 FY12E FY13E FY14ENet Sales (| crore) 7,237.1 11,107.4 12,771.9 14,539.3 16,732.2 EBITDA (| crore) 762.9 1,217.6 1,179.0 1,332.6 1,575.4 Net Profit (| crore) 423.7 631.3 489.9 601.1 800.0 EPS (|) 1.6 2.4 1.8 2.3 3.0 P/E (x) 17.9 12.0 15.5 12.6 9.5 Price / Book (x) 2.1 1.9 1.9 1.9 1.8 EV/EBITDA (x) 11.7 7.1 7.8 6.8 5.5 RoCE (%) 9.5 14.5 11.1 12.6 15.4 RoE (%) 11.5 15.9 12.3 15.1 19.3
Source: Company, ICICIdirect.com Research
Ashok Leyland (ASHLEY) | 29
Initiating Coverage
Rating Matrix Rating : Buy
Target : | 36
Target Period : 12 months
Potential Upside : 24%
YoY Growth (%)
FY11 FY12E FY13E FY14ENet Sales 84.9 15.0 13.8 15.1 EBITDA 159.4 (3.2) 13.0 18.2 Net Profit 232.3 (22.4) 22.7 33.1 EPS (Rs) 232.3 (22.4) 22.7 33.1
Current & Target Multiple (x)
FY11 FY12E FY13E FY14EP/E 12.2 15.7 12.8 9.6 Target P/E 15.0 19.4 15.8 11.9 EV / EBITDA 7.3 8.0 6.9 5.6 P/BV 1.9 1.9 1.9 1.9 RoNW 15.9 12.3 15.1 19.3 RoCE 14.5 11.1 12.6 15.4
Stock Data Bloomberg/Reuters Code AL IN / ASOK.NSSensex 17,036.6 Average volumes 6,970,000 Market Cap (| crore) 7,742.6
52 week H/L 30 / 21Equity Capital (|crore) 266.1 Promoter's Stake (%) 38.6 FII Holding (%) 15.6 DII Holding (%) 15.8
Comparable return matrix (%)
Return % 1M 3M 6M 12MAshok Leyland 3.7 23.0 11.7 8.9 Eicher Motors 10.8 32.0 19.2 56.0 Tata Motors 1.6 47.4 85.7 19.9
Price movement
15
18
21
24
27
30
Mar-12Dec-11Sep-11Jul-11Apr-113,000
3,500
4,000
4,500
5,000
5,500
6,000
6,500
Price (R.H.S) Nifty (L.H.S)
Analyst’s name
Karan Mittal [email protected] Nishant Vass [email protected] Aman Daga [email protected]
March 26, 2012
ICICI Securities Ltd | Retail Equity Research Page 2
Company Background Founded in 1948 by Raghunandan Saran as Ashok Motors, the Hinduja Group's flagship company came to be known as Ashok Leyland after entering into an agreement with Leyland Motors, UK in 1955. Headquartered in Chennai, Ashok Leyland (ALL) is the second largest manufacturer of medium and heavy commercial vehicles (M&HCV) and diesel engines in India with a market share of 28.4% YTD. The company has production facilities in India (seven manufacturing units) with two facilities in Prague (Czech Republic) and Ras-Al-Khaimah (UAE). ALL has witnessed ~50% growth in its network over the last two years with total customer touch points increasing to more than 500 spread across India. Over the past six decades, ALL has been one of the technological pioneers in India's commercial vehicle industry, moulding the country's commercial vehicle profile by introducing technologies and product ideas that went on to become industry norms. The company manufactures a wide array of products ranging from commercial vehicles (CVs) such as trucks and buses to emergency and military vehicles. ALL also builds spare parts and engines for industrial and marine applications. Passenger transportation offerings range from 19 to 80 seater double-decker buses while product offerings in the truck segment cover the entire range starting from 7.5 tonne to 49 tonne haulage vehicles. The company is the market leader in the bus segment and carries over 70 million passengers per day. Moreover, the joint venture with Nissan Motors has improved its presence in the light commercial vehicle (LCV) segment (<7.5 tonnes). ALL has benefited immensely from its global expansion strategy by entering into geographies through a series of 50:50 JVs with various global leaders like Nissan Motor Company, John Deere, Continental AG, Alteams Group, etc. The purpose of the JV with Nissan Motor (Japan) is production of LCV, with John Deere (US) for construction equipment while that with Continental AG (Germany) is for design, development and adaptation of infotronic products and services for automotive customers. The JV with the Alteams Group is for producing high press die casting extruded aluminium components for both automotive and telecommunication sectors.
Exhibit 2: Ashok Leyland timeline… s
Source: Company, ICICIdirect.com Research
Renamed as “Ashok Leyland” due to agreement with Leyland Motors, UK, for manufacturing Leyland vehicles
As a major step in developing alternate fuel for mass transportation, India’s first CNG-powered bus was handed over to the BEST
Founded by Raghunandan Saran, as “Ashok Motors”
in collaboration with Austin Motor Company, England
“Titan” - The first Indian-made double decker with 50% indigenous components was launched
Introduced India’s first 37-tonne haulage U-truck with the highest payload of up to 27 tonnes
1948
1955
1967
1970
1993
1997
2012
A specially designed vehicle “Hippo” Tipper was designed and delivered to the Indian Army
First Indian auto company to receive ISO 9002 certification followed two years later with the ISO 9001 Certification
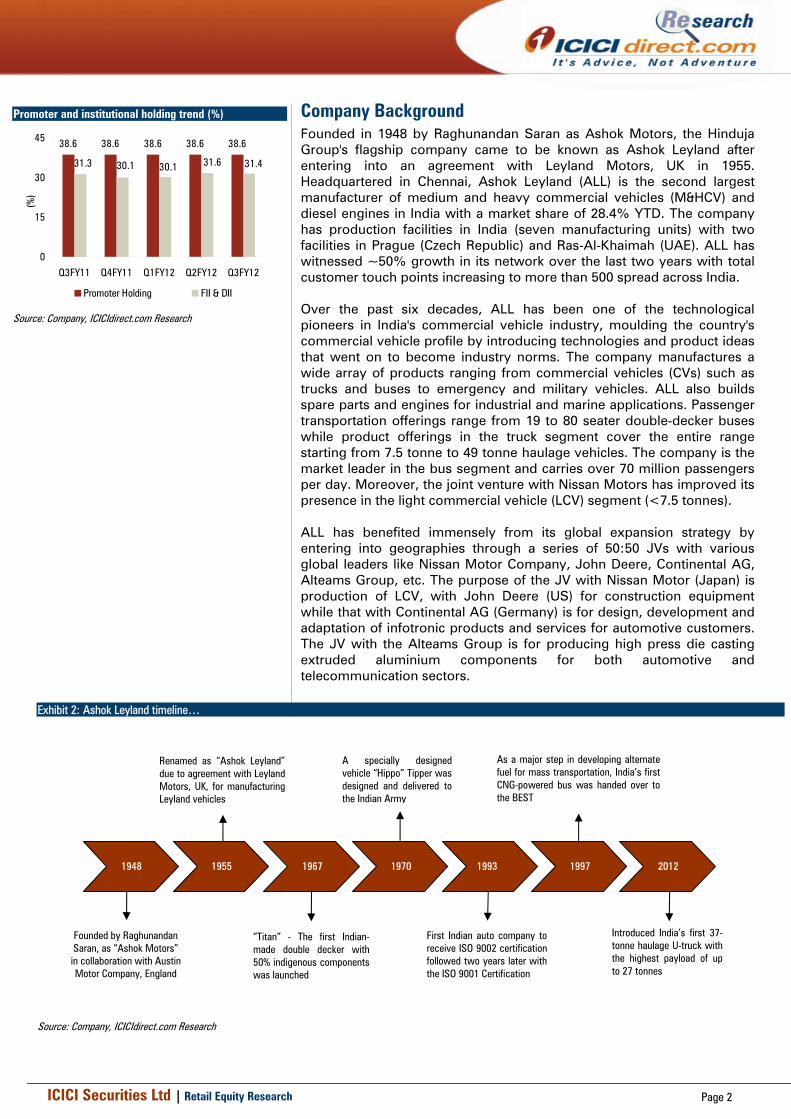
Promoter and institutional holding trend (%)
38.6 38.6 38.6 38.6 38.6
31.630.130.131.3 31.4
0
15
30
45
Q3FY11 Q4FY11 Q1FY12 Q2FY12 Q3FY12
(%)
Promoter Holding FII & DII
Source: Company, ICICIdirect.com Research
ICICI Securities Ltd | Retail Equity Research Page 3
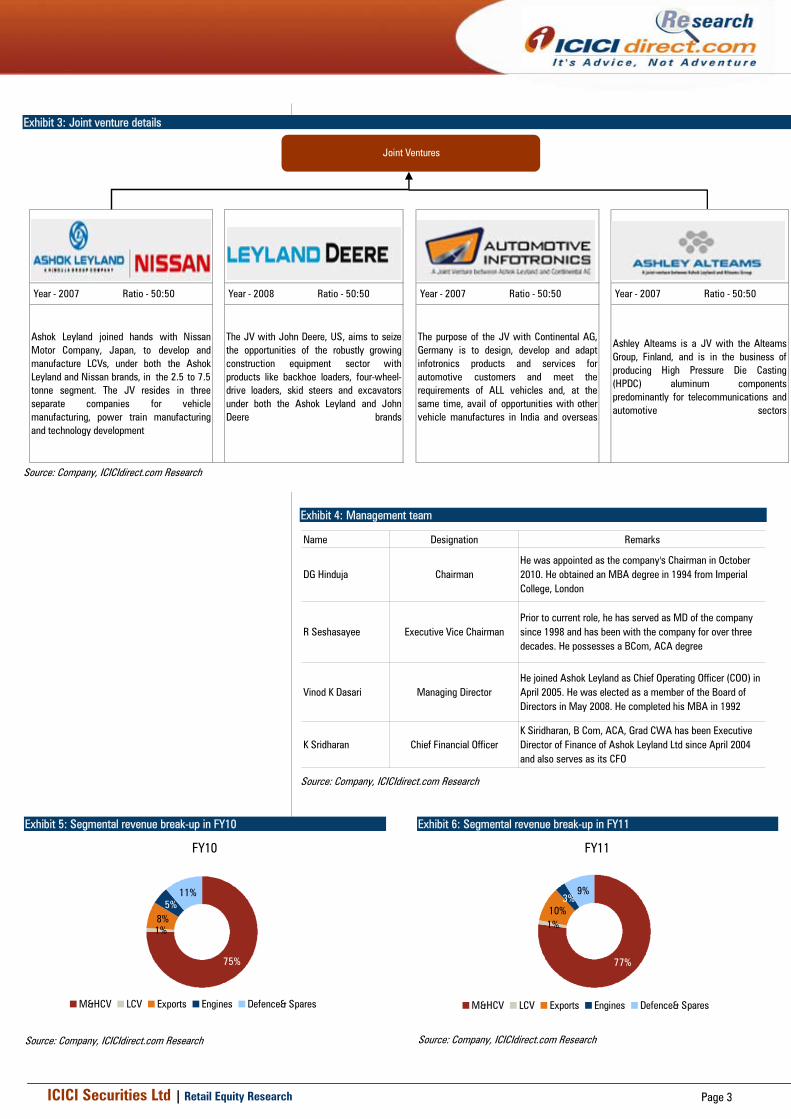
Exhibit 3: Joint venture details
Year - 2007 Ratio - 50:50 Year - 2008 Ratio - 50:50 Year - 2007 Ratio - 50:50 Year - 2007 Ratio - 50:50
Ashok Leyland joined hands with NissanMotor Company, Japan, to develop andmanufacture LCVs, under both the AshokLeyland and Nissan brands, in the 2.5 to 7.5tonne segment. The JV resides in threeseparate companies for vehiclemanufacturing, power train manufacturingand technology development
The JV with John Deere, US, aims to seizethe opportunities of the robustly growingconstruction equipment sector withproducts like backhoe loaders, four-wheel-drive loaders, skid steers and excavatorsunder both the Ashok Leyland and JohnDeere brands
The purpose of the JV with Continental AG,Germany is to design, develop and adaptinfotronics products and services forautomotive customers and meet therequirements of ALL vehicles and, at thesame time, avail of opportunities with othervehicle manufactures in India and overseas
Ashley Alteams is a JV with the AlteamsGroup, Finland, and is in the business ofproducing High Pressure Die Casting(HPDC) aluminum componentspredominantly for telecommunications andautomotive sectors
Joint Ventures
Source: Company, ICICIdirect.com Research
Exhibit 4: Management team
Name Designation Remarks
DG Hinduja ChairmanHe was appointed as the company's Chairman in October 2010. He obtained an MBA degree in 1994 from Imperial College, London
R Seshasayee Executive Vice ChairmanPrior to current role, he has served as MD of the company since 1998 and has been with the company for over three decades. He possesses a BCom, ACA degree
Vinod K Dasari Managing DirectorHe joined Ashok Leyland as Chief Operating Officer (COO) in April 2005. He was elected as a member of the Board of Directors in May 2008. He completed his MBA in 1992
K Sridharan Chief Financial OfficerK Siridharan, B Com, ACA, Grad CWA has been Executive Director of Finance of Ashok Leyland Ltd since April 2004 and also serves as its CFO
Source: Company, ICICIdirect.com Research
Exhibit 5: Segmental revenue break-up in FY10
FY10
1%8%
11%5%
75%
M&HCV LCV Exports Engines Defence& Spares
Source: Company, ICICIdirect.com Research
Exhibit 6: Segmental revenue break-up in FY11
FY11
1%10%
9%
77%
3%
M&HCV LCV Exports Engines Defence& Spares
Source: Company, ICICIdirect.com Research
ICICI Securities Ltd | Retail Equity Research Page 4
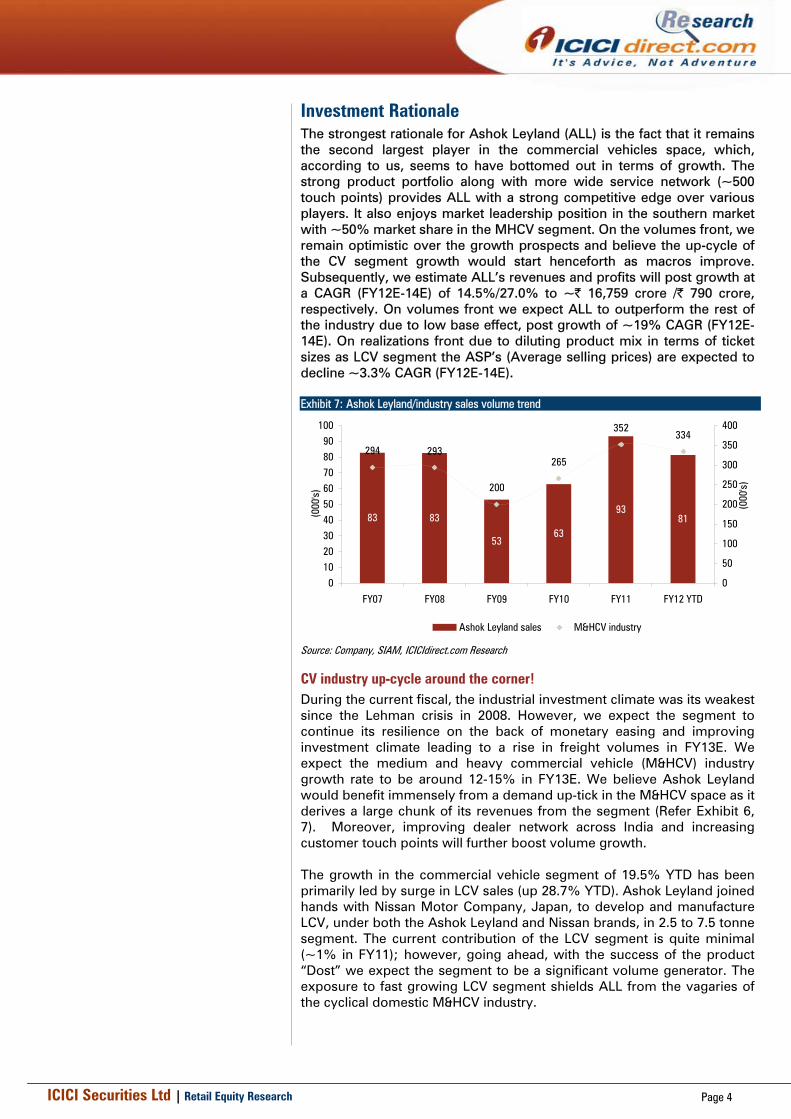
Investment Rationale The strongest rationale for Ashok Leyland (ALL) is the fact that it remains the second largest player in the commercial vehicles space, which, according to us, seems to have bottomed out in terms of growth. The strong product portfolio along with more wide service network (~500 touch points) provides ALL with a strong competitive edge over various players. It also enjoys market leadership position in the southern market with ~50% market share in the MHCV segment. On the volumes front, we remain optimistic over the growth prospects and believe the up-cycle of the CV segment growth would start henceforth as macros improve. Subsequently, we estimate ALL’s revenues and profits will post growth at a CAGR (FY12E-14E) of 14.5%/27.0% to ~| 16,759 crore /| 790 crore, respectively. On volumes front we expect ALL to outperform the rest of the industry due to low base effect, post growth of ~19% CAGR (FY12E-14E). On realizations front due to diluting product mix in terms of ticket sizes as LCV segment the ASP’s (Average selling prices) are expected to decline ~3.3% CAGR (FY12E-14E). Exhibit 7: Ashok Leyland/industry sales volume trend
83 83
5363
9381
294 293
200
265
352334
0102030405060708090
100
FY07 FY08 FY09 FY10 FY11 FY12 YTD
(000
's)
0
50
100
150
200
250
300
350
400
(000
's)
Ashok Leyland sales M&HCV industry
Source: Company, SIAM, ICICIdirect.com Research
CV industry up-cycle around the corner! During the current fiscal, the industrial investment climate was its weakest since the Lehman crisis in 2008. However, we expect the segment to continue its resilience on the back of monetary easing and improving investment climate leading to a rise in freight volumes in FY13E. We expect the medium and heavy commercial vehicle (M&HCV) industry growth rate to be around 12-15% in FY13E. We believe Ashok Leyland would benefit immensely from a demand up-tick in the M&HCV space as it derives a large chunk of its revenues from the segment (Refer Exhibit 6, 7). Moreover, improving dealer network across India and increasing customer touch points will further boost volume growth. The growth in the commercial vehicle segment of 19.5% YTD has been primarily led by surge in LCV sales (up 28.7% YTD). Ashok Leyland joined hands with Nissan Motor Company, Japan, to develop and manufacture LCV, under both the Ashok Leyland and Nissan brands, in 2.5 to 7.5 tonne segment. The current contribution of the LCV segment is quite minimal (~1% in FY11); however, going ahead, with the success of the product “Dost” we expect the segment to be a significant volume generator. The exposure to fast growing LCV segment shields ALL from the vagaries of the cyclical domestic M&HCV industry.
ICICI Securities Ltd | Retail Equity Research Page 5
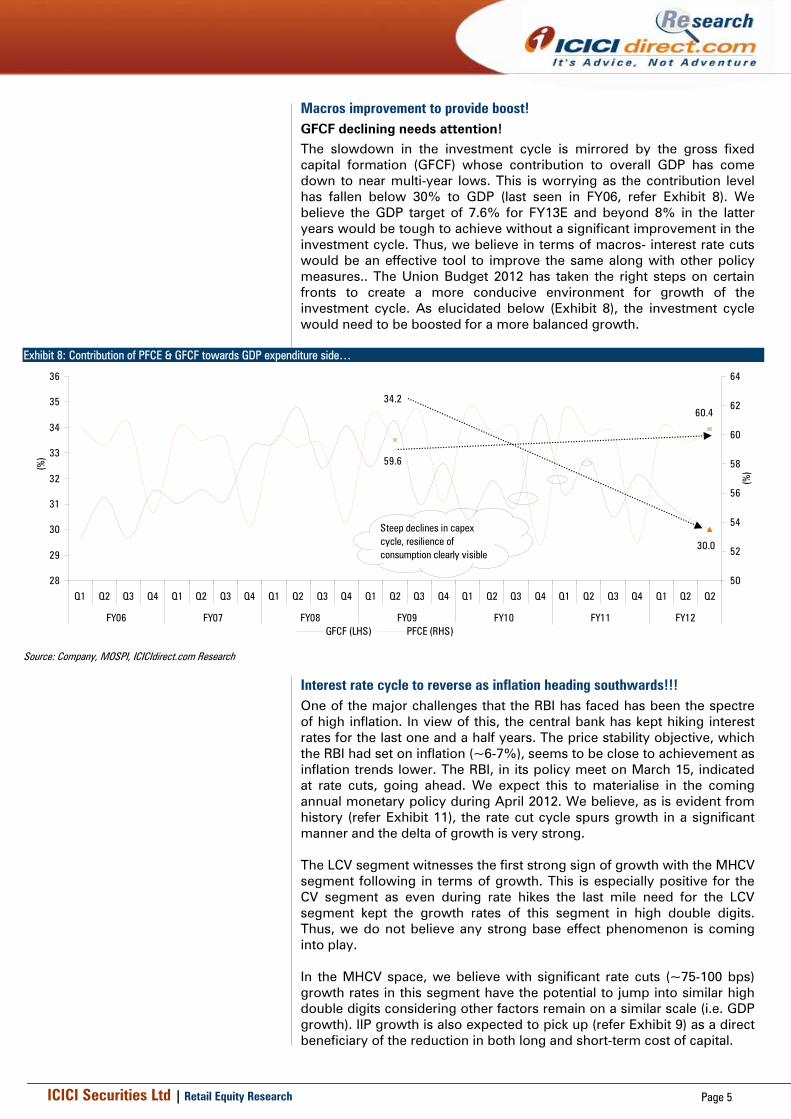
Macros improvement to provide boost! GFCF declining needs attention! The slowdown in the investment cycle is mirrored by the gross fixed capital formation (GFCF) whose contribution to overall GDP has come down to near multi-year lows. This is worrying as the contribution level has fallen below 30% to GDP (last seen in FY06, refer Exhibit 8). We believe the GDP target of 7.6% for FY13E and beyond 8% in the latter years would be tough to achieve without a significant improvement in the investment cycle. Thus, we believe in terms of macros- interest rate cuts would be an effective tool to improve the same along with other policy measures.. The Union Budget 2012 has taken the right steps on certain fronts to create a more conducive environment for growth of the investment cycle. As elucidated below (Exhibit 8), the investment cycle would need to be boosted for a more balanced growth.
Exhibit 8: Contribution of PFCE & GFCF towards GDP expenditure side…
30.0
34.260.4
59.6
28
29
30
31
32
33
34
35
36
Q1 Q2 Q3 Q4 Q1 Q2 Q3 Q4 Q1 Q2 Q3 Q4 Q1 Q2 Q3 Q4 Q1 Q2 Q3 Q4 Q1 Q2 Q3 Q4 Q1 Q2 Q2
FY06 FY07 FY08 FY09 FY10 FY11 FY12
(%)
50
52
54
56
58
60
62
64
(%)
GFCF (LHS) PFCE (RHS)
Steep declines in capex cycle, resilience of consumption clearly visible
Source: Company, MOSPI, ICICIdirect.com Research
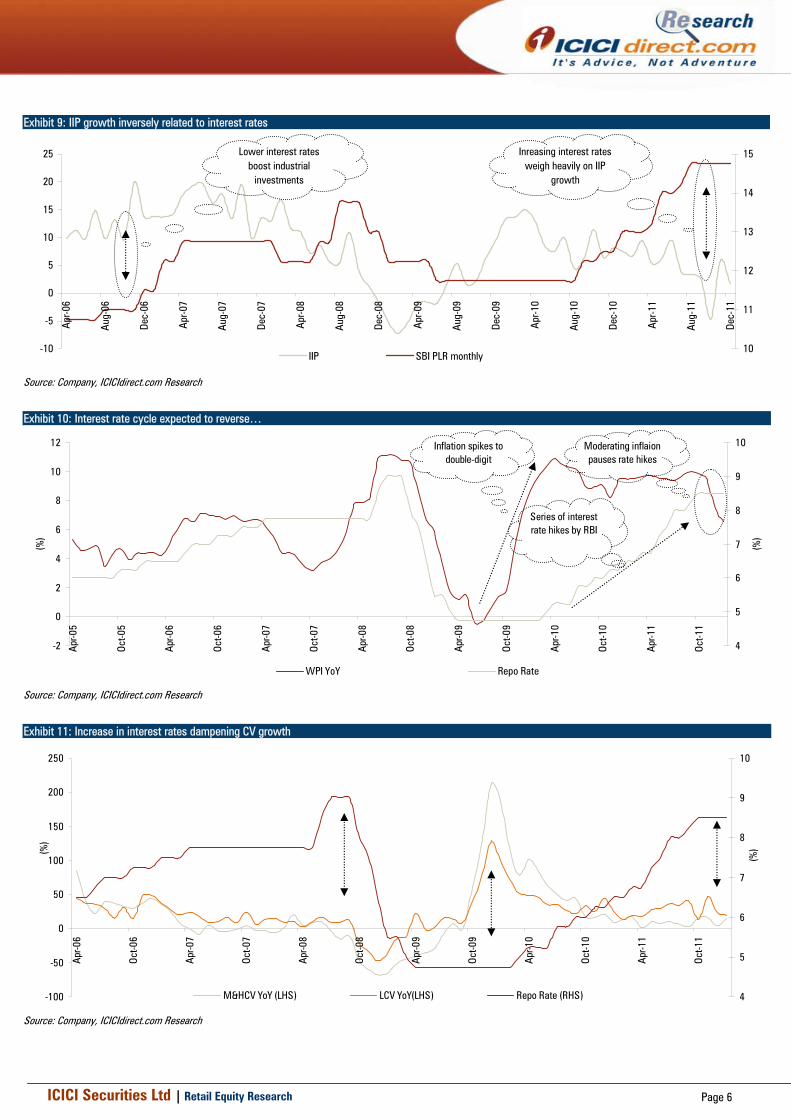
Interest rate cycle to reverse as inflation heading southwards!!! One of the major challenges that the RBI has faced has been the spectre of high inflation. In view of this, the central bank has kept hiking interest rates for the last one and a half years. The price stability objective, which the RBI had set on inflation (~6-7%), seems to be close to achievement as inflation trends lower. The RBI, in its policy meet on March 15, indicated at rate cuts, going ahead. We expect this to materialise in the coming annual monetary policy during April 2012. We believe, as is evident from history (refer Exhibit 11), the rate cut cycle spurs growth in a significant manner and the delta of growth is very strong. The LCV segment witnesses the first strong sign of growth with the MHCV segment following in terms of growth. This is especially positive for the CV segment as even during rate hikes the last mile need for the LCV segment kept the growth rates of this segment in high double digits. Thus, we do not believe any strong base effect phenomenon is coming into play. In the MHCV space, we believe with significant rate cuts (~75-100 bps) growth rates in this segment have the potential to jump into similar high double digits considering other factors remain on a similar scale (i.e. GDP growth). IIP growth is also expected to pick up (refer Exhibit 9) as a direct beneficiary of the reduction in both long and short-term cost of capital.
ICICI Securities Ltd | Retail Equity Research Page 6
Exhibit 9: IIP growth inversely related to interest rates
-10
-5
0
5
10
15
20
25
Apr-0
6
Aug-
06
Dec-
06
Apr-0
7
Aug-
07
Dec-
07
Apr-0
8
Aug-
08
Dec-
08
Apr-0
9
Aug-
09
Dec-
09
Apr-1
0
Aug-
10
Dec-
10
Apr-1
1
Aug-
11
Dec-
11
10
11
12
13
14
15
IIP SBI PLR monthly
Inreasing interest rates weigh heavily on IIP
growth
Lower interest rates boost industrial
investments
Source: Company, ICICIdirect.com Research
Exhibit 10: Interest rate cycle expected to reverse…
-2
0
2
4
6
8
10
12
Apr-0
5
Oct-0
5
Apr-0
6
Oct-0
6
Apr-0
7
Oct-0
7
Apr-0
8
Oct-0
8
Apr-0
9
Oct-0
9
Apr-1
0
Oct-1
0
Apr-1
1
Oct-1
1
(%)
4
5
6
7
8
9
10
(%)
WPI YoY Repo Rate
Inflation spikes to double-digit
Series of interest rate hikes by RBI
Moderating inflaion pauses rate hikes
Source: Company, ICICIdirect.com Research
Exhibit 11: Increase in interest rates dampening CV growth
-100
-50
0
50
100
150
200
250
Apr-0
6
Oct-0
6
Apr-0
7
Oct-0
7
Apr-0
8
Oct-0
8
Apr-0
9
Oct-0
9
Apr-1
0
Oct-1
0
Apr-1
1
Oct-1
1
(%)
4
5
6
7
8
9
10(%
)
M&HCV YoY (LHS) LCV YoY(LHS) Repo Rate (RHS)
Source: Company, ICICIdirect.com Research
ICICI Securities Ltd | Retail Equity Research Page 7
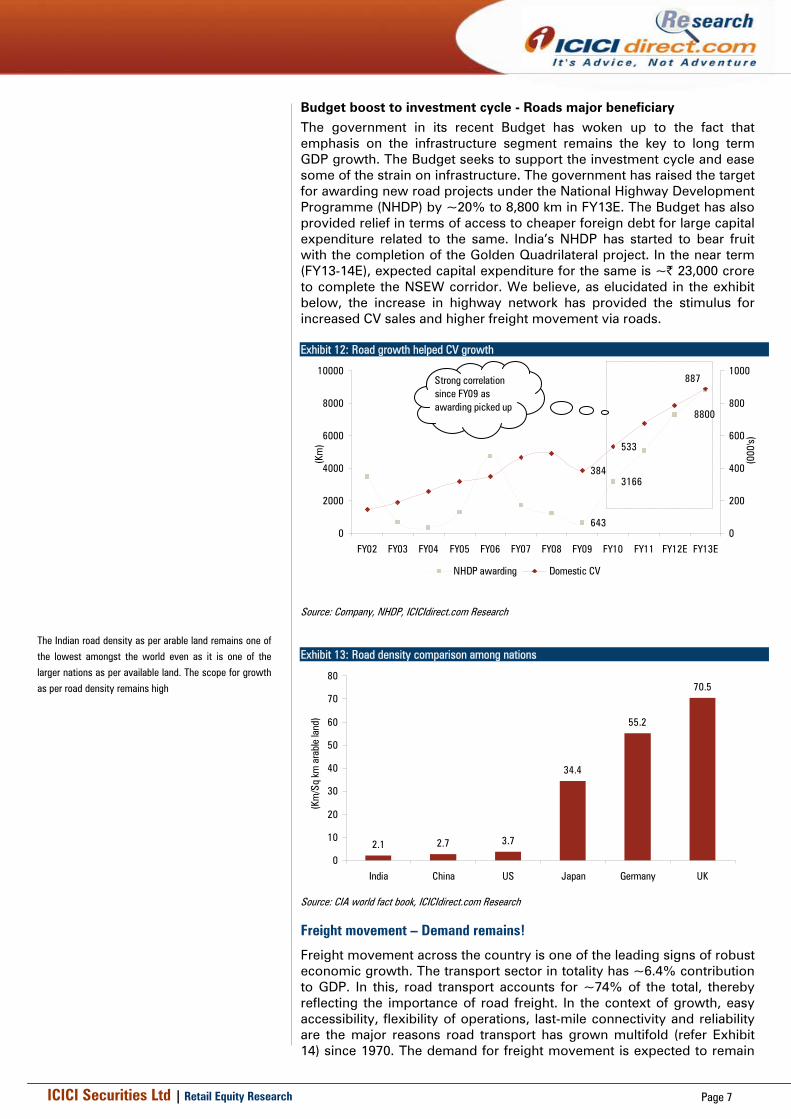
Budget boost to investment cycle - Roads major beneficiary The government in its recent Budget has woken up to the fact that emphasis on the infrastructure segment remains the key to long term GDP growth. The Budget seeks to support the investment cycle and ease some of the strain on infrastructure. The government has raised the target for awarding new road projects under the National Highway Development Programme (NHDP) by ~20% to 8,800 km in FY13E. The Budget has also provided relief in terms of access to cheaper foreign debt for large capital expenditure related to the same. India’s NHDP has started to bear fruit with the completion of the Golden Quadrilateral project. In the near term (FY13-14E), expected capital expenditure for the same is ~| 23,000 crore to complete the NSEW corridor. We believe, as elucidated in the exhibit below, the increase in highway network has provided the stimulus for increased CV sales and higher freight movement via roads. Exhibit 12: Road growth helped CV growth
8800
643
3166
887
384
533
0
2000
4000
6000
8000
10000
FY02 FY03 FY04 FY05 FY06 FY07 FY08 FY09 FY10 FY11 FY12E FY13E
(Km
)
0
200
400
600
800
1000
(000
's)
NHDP awarding Domestic CV
Strong correlation since FY09 as awarding picked up
Source: Company, NHDP, ICICIdirect.com Research
Exhibit 13: Road density comparison among nations
2.1 2.7 3.7
34.4
55.2
70.5
0
10
20
30
40
50
60
70
80
India China US Japan Germany UK
(Km
/Sq
km a
rabl
e la
nd)
Source: CIA world fact book, ICICIdirect.com Research
Freight movement – Demand remains!
Freight movement across the country is one of the leading signs of robust economic growth. The transport sector in totality has ~6.4% contribution to GDP. In this, road transport accounts for ~74% of the total, thereby reflecting the importance of road freight. In the context of growth, easy accessibility, flexibility of operations, last-mile connectivity and reliability are the major reasons road transport has grown multifold (refer Exhibit 14) since 1970. The demand for freight movement is expected to remain
The Indian road density as per arable land remains one of
the lowest amongst the world even as it is one of the
larger nations as per available land. The scope for growth
as per road density remains high
ICICI Securities Ltd | Retail Equity Research Page 8
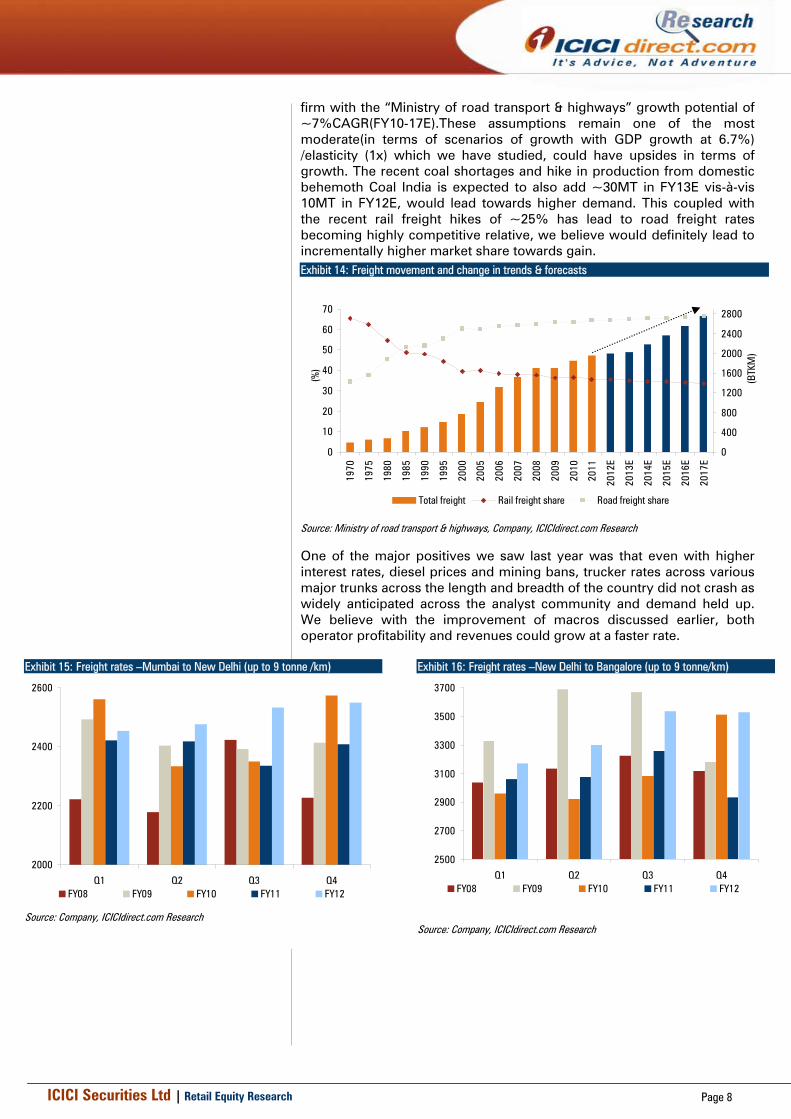
firm with the “Ministry of road transport & highways” growth potential of ~7%CAGR(FY10-17E).These assumptions remain one of the most moderate(in terms of scenarios of growth with GDP growth at 6.7%) /elasticity (1x) which we have studied, could have upsides in terms of growth. The recent coal shortages and hike in production from domestic behemoth Coal India is expected to also add ~30MT in FY13E vis-à-vis 10MT in FY12E, would lead towards higher demand. This coupled with the recent rail freight hikes of ~25% has lead to road freight rates becoming highly competitive relative, we believe would definitely lead to incrementally higher market share towards gain. Exhibit 14: Freight movement and change in trends & forecasts
0
10
20
30
40
50
60
70
1970
1975
1980
1985
1990
1995
2000
2005
2006
2007
2008
2009
2010
2011
2012
E
2013
E
2014
E
2015
E
2016
E
2017
E
(%)
0
400
800
1200
1600
2000
2400
2800
(BTK
M)
Total freight Rail freight share Road freight share
Source: Ministry of road transport & highways, Company, ICICIdirect.com Research
One of the major positives we saw last year was that even with higher interest rates, diesel prices and mining bans, trucker rates across various major trunks across the length and breadth of the country did not crash as widely anticipated across the analyst community and demand held up. We believe with the improvement of macros discussed earlier, both operator profitability and revenues could grow at a faster rate.
Exhibit 15: Freight rates –Mumbai to New Delhi (up to 9 tonne /km)
2000
2200
2400
2600
Q1 Q2 Q3 Q4FY08 FY09 FY10 FY11 FY12
Source: Company, ICICIdirect.com Research
Exhibit 16: Freight rates –New Delhi to Bangalore (up to 9 tonne/km)
2500
2700
2900
3100
3300
3500
3700
Q1 Q2 Q3 Q4FY08 FY09 FY10 FY11 FY12
Source: Company, ICICIdirect.com Research
ICICI Securities Ltd | Retail Equity Research Page 9
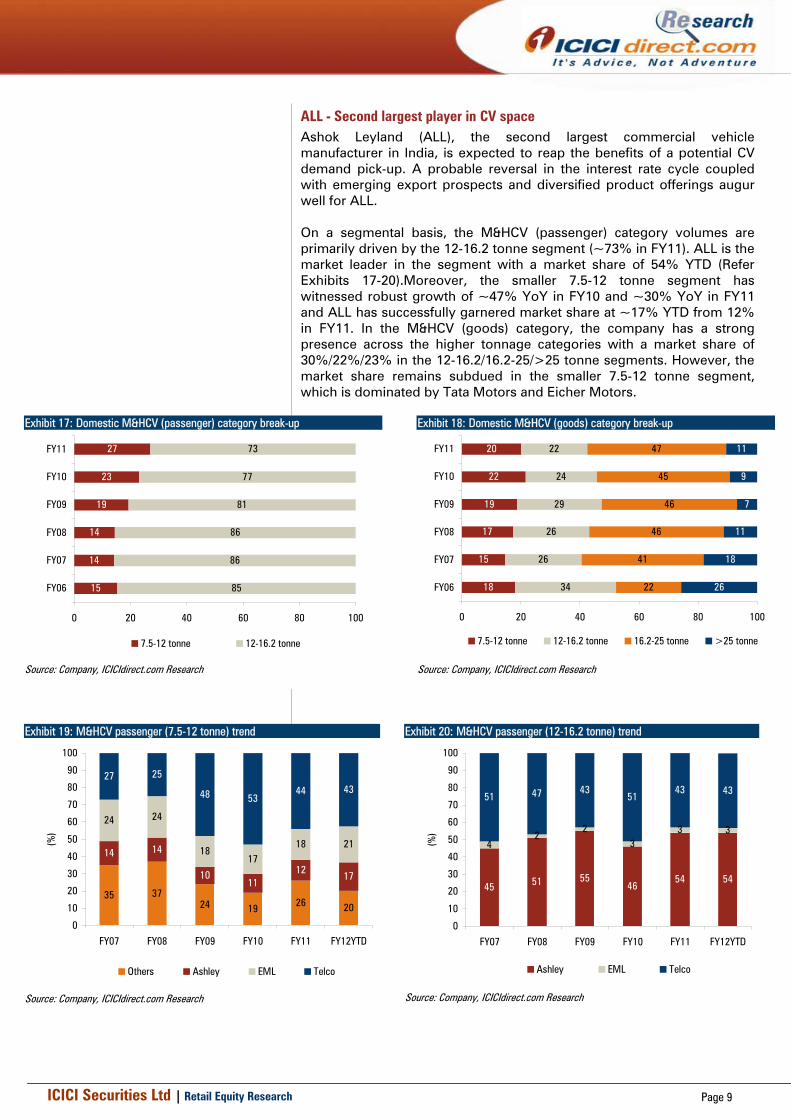
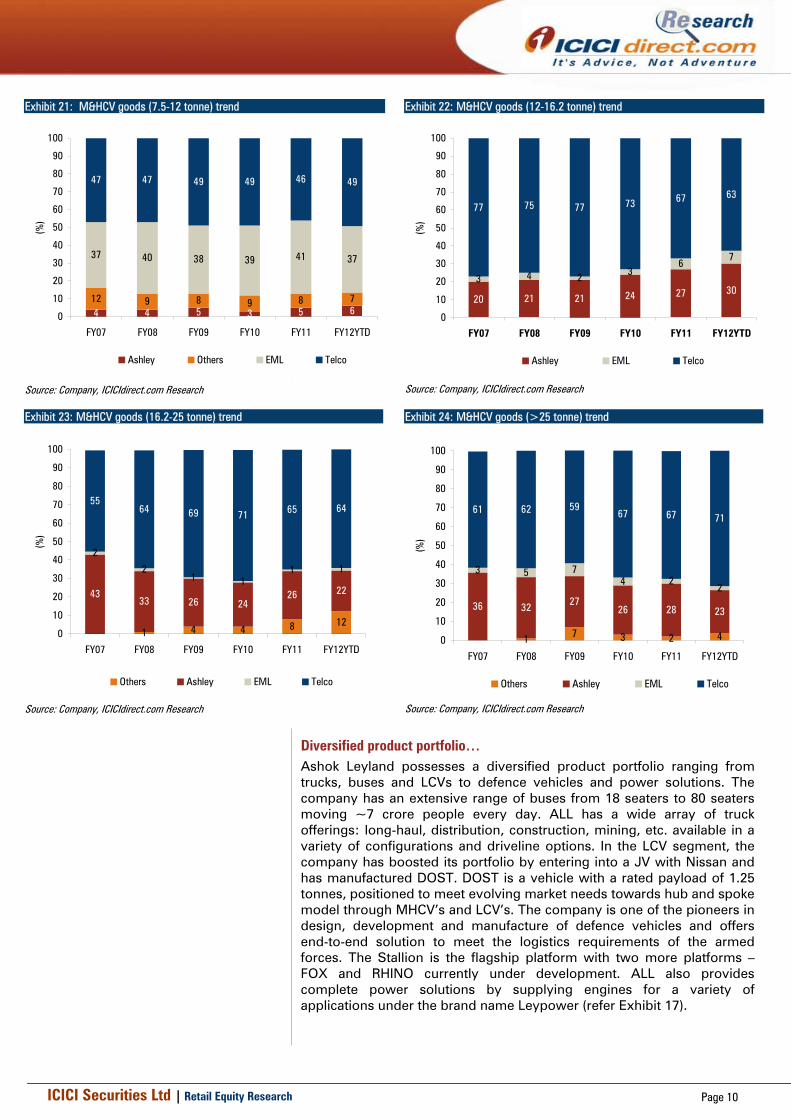
ALL - Second largest player in CV space Ashok Leyland (ALL), the second largest commercial vehicle manufacturer in India, is expected to reap the benefits of a potential CV demand pick-up. A probable reversal in the interest rate cycle coupled with emerging export prospects and diversified product offerings augur well for ALL. On a segmental basis, the M&HCV (passenger) category volumes are primarily driven by the 12-16.2 tonne segment (~73% in FY11). ALL is the market leader in the segment with a market share of 54% YTD (Refer Exhibits 17-20).Moreover, the smaller 7.5-12 tonne segment has witnessed robust growth of ~47% YoY in FY10 and ~30% YoY in FY11 and ALL has successfully garnered market share at ~17% YTD from 12% in FY11. In the M&HCV (goods) category, the company has a strong presence across the higher tonnage categories with a market share of 30%/22%/23% in the 12-16.2/16.2-25/>25 tonne segments. However, the market share remains subdued in the smaller 7.5-12 tonne segment, which is dominated by Tata Motors and Eicher Motors.
Exhibit 17: Domestic M&HCV (passenger) category break-up
15
14
14
19
23
27
85
86
86
81
77
73
0 20 40 60 80 100
FY06
FY07
FY08
FY09
FY10
FY11
7.5-12 tonne 12-16.2 tonne
Source: Company, ICICIdirect.com Research
Exhibit 18: Domestic M&HCV (goods) category break-up
18
15
17
19
22
20
34
26
26
29
24
22
22
41
46
46
45
47
26
18
11
7
9
11
0 20 40 60 80 100
FY06
FY07
FY08
FY09
FY10
FY11
(%)
7.5-12 tonne 12-16.2 tonne 16.2-25 tonne >25 tonne
Source: Company, ICICIdirect.com Research
Exhibit 19: M&HCV passenger (7.5-12 tonne) trend
35 3724 19 26 20
14 14
1011
12 17
24 24
1817
18 21
27 25
48 5344 43
0
10
20
30
40
50
60
70
80
90
100
FY07 FY08 FY09 FY10 FY11 FY12YTD
(%)
Others Ashley EML Telco
Source: Company, ICICIdirect.com Research
Exhibit 20: M&HCV passenger (12-16.2 tonne) trend
45 51 5546
54 54
42
23
3 3
51 47 4351
43 43
0
10
20
30
40
50
60
70
80
90
100
FY07 FY08 FY09 FY10 FY11 FY12YTD
(%)
Ashley EML Telco
Source: Company, ICICIdirect.com Research
ICICI Securities Ltd | Retail Equity Research Page 10
Exhibit 21: M&HCV goods (7.5-12 tonne) trend
4 4 5 3 5 612 9 8 9 8 7
37 40 38 39 41 37
47 47 49 49 46 49
0
10
20
30
40
50
60
70
80
90
100
FY07 FY08 FY09 FY10 FY11 FY12YTD
(%)
Ashley Others EML Telco
Source: Company, ICICIdirect.com Research
Exhibit 22: M&HCV goods (12-16.2 tonne) trend
20 21 21 24 27 303 4 2
36
7
77 75 77 73 67 63
0
10
20
30
40
50
60
70
80
90
100
FY07 FY08 FY09 FY10 FY11 FY12YTD
(%)
Ashley EML Telco
Source: Company, ICICIdirect.com Research
Exhibit 23: M&HCV goods (16.2-25 tonne) trend
1 4 4 8 12
4333 26 24
26 22
2
21 1
1 1
5564 69 71 65 64
0
10
20
30
40
50
60
70
80
90
100
FY07 FY08 FY09 FY10 FY11 FY12YTD
(%)
Others Ashley EML Telco
Source: Company, ICICIdirect.com Research
Exhibit 24: M&HCV goods (>25 tonne) trend
1 7 3 2 4
36 32 2726 28 23
3 5 74 2
2
61 62 5967 67 71
0
10
20
30
40
50
60
70
80
90
100
FY07 FY08 FY09 FY10 FY11 FY12YTD
(%)
Others Ashley EML Telco
Source: Company, ICICIdirect.com Research
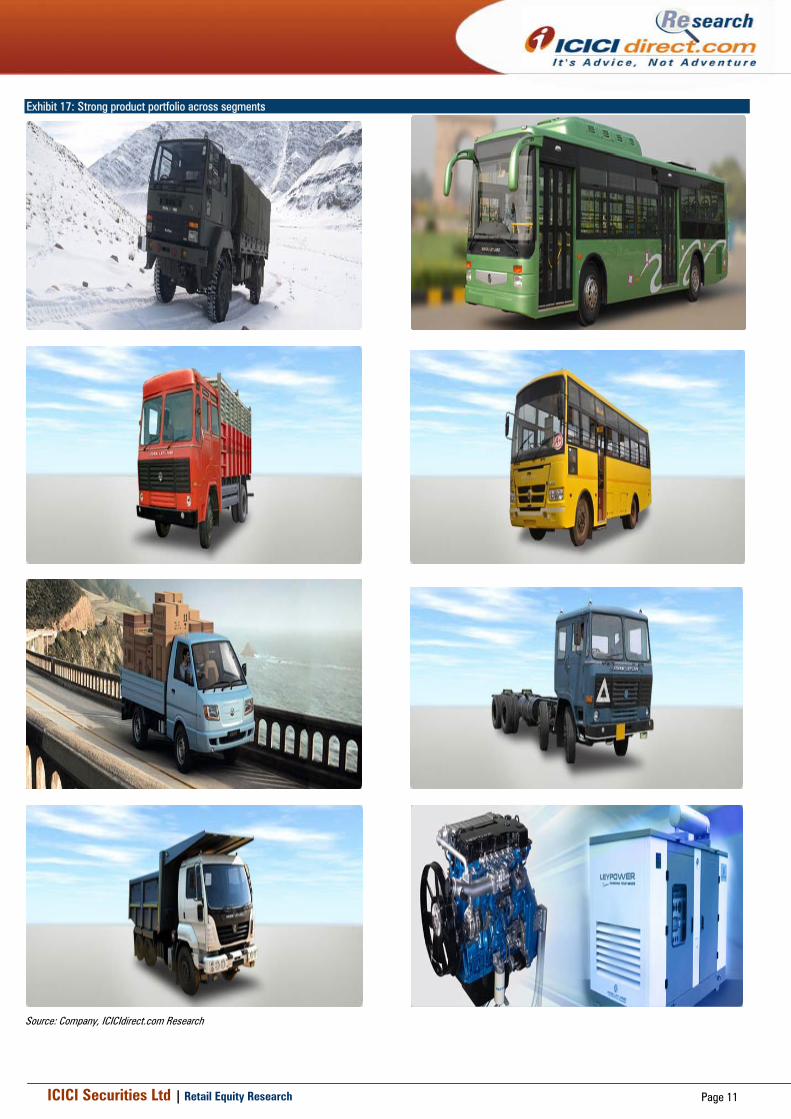
Diversified product portfolio… Ashok Leyland possesses a diversified product portfolio ranging from trucks, buses and LCVs to defence vehicles and power solutions. The company has an extensive range of buses from 18 seaters to 80 seaters moving ~7 crore people every day. ALL has a wide array of truck offerings: long-haul, distribution, construction, mining, etc. available in a variety of configurations and driveline options. In the LCV segment, the company has boosted its portfolio by entering into a JV with Nissan and has manufactured DOST. DOST is a vehicle with a rated payload of 1.25 tonnes, positioned to meet evolving market needs towards hub and spoke model through MHCV’s and LCV’s. The company is one of the pioneers in design, development and manufacture of defence vehicles and offers end-to-end solution to meet the logistics requirements of the armed forces. The Stallion is the flagship platform with two more platforms – FOX and RHINO currently under development. ALL also provides complete power solutions by supplying engines for a variety of applications under the brand name Leypower (refer Exhibit 17).
ICICI Securities Ltd | Retail Equity Research Page 11
Exhibit 17: Strong product portfolio across segments
Source: Company, ICICIdirect.com Research
ICICI Securities Ltd | Retail Equity Research Page 12
Product innovations to drive growth - Neptune series & U-Platform ALL strives to provide world-class technology that is relevant and affordable. The company’s 1000+ product development team seeks to harness and adopt technologies that provide value while addressing safety and environmental issues. ALL has forayed into the higher tonnage M&HCV segment (tippers and tractor trailers) with the U-truck platform (‘U’ stands for customer) that is a future-ready platform engineered to meet the ever-evolving needs of the M&HCV market in the 16-49-tonne segment. Along with a strong product offering, excellent fuel efficiency, superior driveability and higher reliability will lead to better operating economics and, in turn, higher demand. The Neptune Engine programme is on track and is being progressively integrated into the U-Truck range. The Neptune series engine ranges from 4-6 cylinder in line engines (160-230 HP in four cylinder engines and 270-380 HP in six cylinder engines). The engines are BS III and BS IV/Euro IV compliant and have been benchmarked for lowest operating and maintenance costs. We expect ALL to benefit from a better product mix in the form of U-truck Series and Neptune series of engines along with higher cost efficiencies on the same.
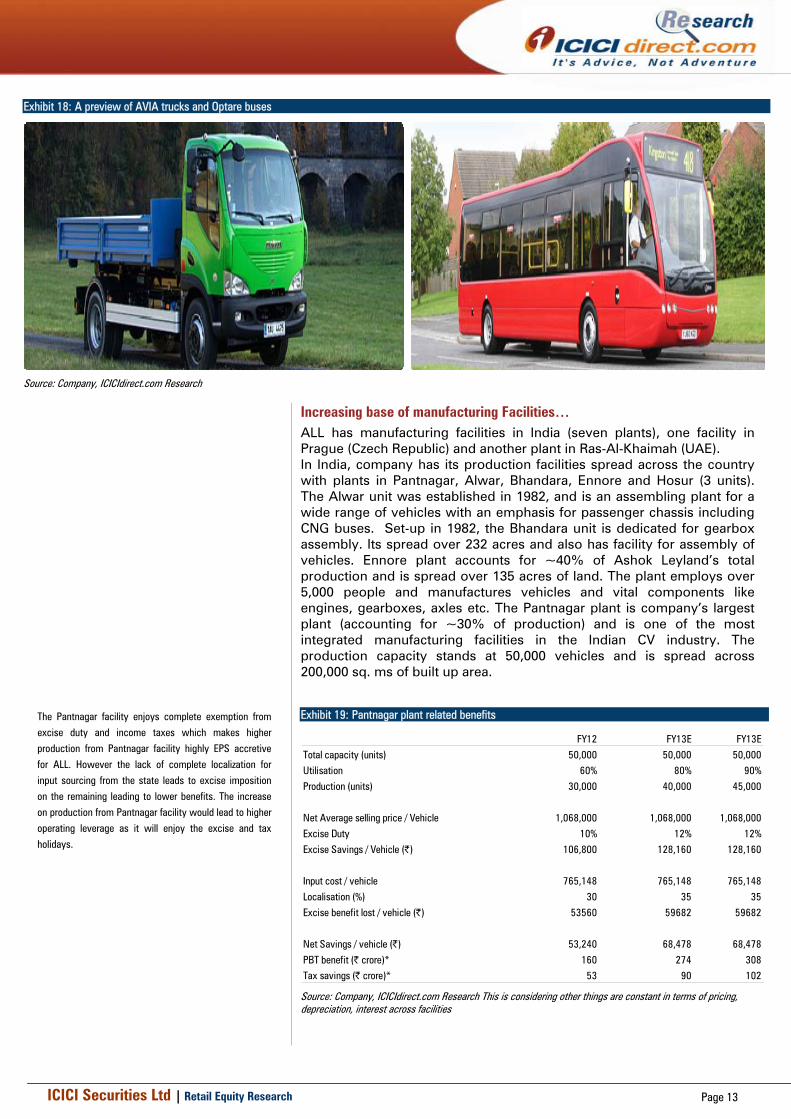
Expanding global footprint across both passenger/goods segment… ALL has successfully expanded its international footprint owing to production of vehicles ideally suited for varying foreign conditions and terrains. The company currently exports to over 30 countries worldwide and is the market leader in the bus segment of Sri Lanka, Bangladesh and Mauritius. ALL has a considerable presence in the Middle East and Africa. The company has a presence in the bus rapid transport (BRT) system in Lagos, Nigeria and is seeking to make inroads into CIS and Latin America. ALL has constantly focused on strengthening its technological capabilities and has accordingly made investments in Optare Plc and Avia. Optare Plc is a UK based firm that manufactures premium/ hybrid weight optimized low floor buses with a turnover of ~$125 mn. ALL had acquired 26.0% stake in Optare Plc in July 2010 for $7.5 mn and has subsequently increased the stake to 75.1% in December 2011 for another ~ 4mn GBP. A majority stake in the leading bus maker in the UK gives impetus to ALL’s global bus and coach strategy to accelerate technology adoption, develop new products and address new markets, would be used to produce similar products for domestic market. Avia Ashok Leyland Motors, headquartered in Prague, the Czech Republic, is famous for its D-Series trucks that are popular on the roads of Hungary, the UK, Ireland, Slovakia, Spain as well as the Czech Republic. The company follows Euro-V emission compliant standards and manufactures trucks in the 6-12 tonne GVW range, which are largely export vehicles to developed countries. ALL acquired a 48% stake in Avia in October 2006. The firm also manufactures electric trucks. ALL plans to sell Avia’s trucks in the Middle East and India.
ICICI Securities Ltd | Retail Equity Research Page 13
Exhibit 18: A preview of AVIA trucks and Optare buses
Source: Company, ICICIdirect.com Research
Increasing base of manufacturing Facilities… ALL has manufacturing facilities in India (seven plants), one facility in Prague (Czech Republic) and another plant in Ras-Al-Khaimah (UAE). In India, company has its production facilities spread across the country with plants in Pantnagar, Alwar, Bhandara, Ennore and Hosur (3 units). The Alwar unit was established in 1982, and is an assembling plant for a wide range of vehicles with an emphasis for passenger chassis including CNG buses. Set-up in 1982, the Bhandara unit is dedicated for gearbox assembly. Its spread over 232 acres and also has facility for assembly of vehicles. Ennore plant accounts for ~40% of Ashok Leyland’s total production and is spread over 135 acres of land. The plant employs over 5,000 people and manufactures vehicles and vital components like engines, gearboxes, axles etc. The Pantnagar plant is company’s largest plant (accounting for ~30% of production) and is one of the most integrated manufacturing facilities in the Indian CV industry. The production capacity stands at 50,000 vehicles and is spread across 200,000 sq. ms of built up area.
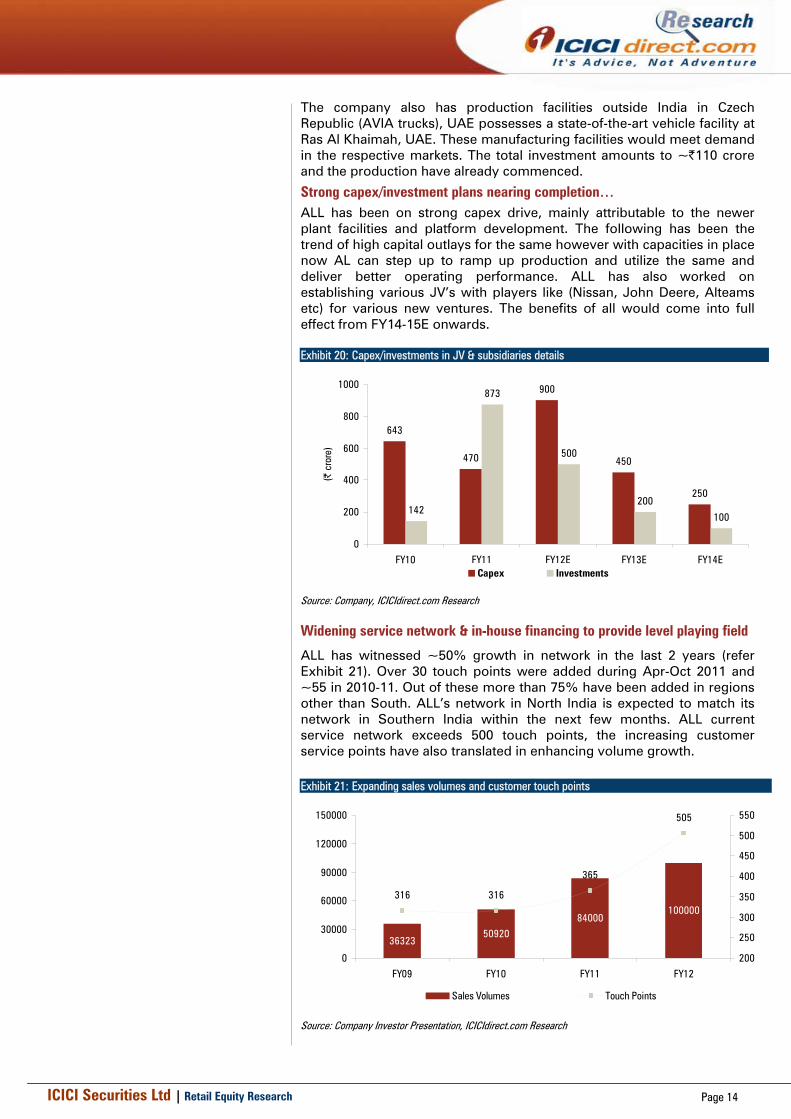
Exhibit 19: Pantnagar plant related benefits
FY12 FY13E FY13E
Total capacity (units) 50,000 50,000 50,000Utilisation 60% 80% 90%
Production (units) 30,000 40,000 45,000
Net Average selling price / Vehicle 1,068,000 1,068,000 1,068,000
Excise Duty 10% 12% 12%
Excise Savings / Vehicle (|) 106,800 128,160 128,160
Input cost / vehicle 765,148 765,148 765,148
Localisation (%) 30 35 35
Excise benefit lost / vehicle (|) 53560 59682 59682
Net Savings / vehicle (|) 53,240 68,478 68,478
PBT benefit (| crore)* 160 274 308Tax savings (| crore)* 53 90 102 Source: Company, ICICIdirect.com Research This is considering other things are constant in terms of pricing, depreciation, interest across facilities
The Pantnagar facility enjoys complete exemption from
excise duty and income taxes which makes higher
production from Pantnagar facility highly EPS accretive
for ALL. However the lack of complete localization for
input sourcing from the state leads to excise imposition
on the remaining leading to lower benefits. The increase
on production from Pantnagar facility would lead to higher
operating leverage as it will enjoy the excise and tax
holidays.
ICICI Securities Ltd | Retail Equity Research Page 14
The company also has production facilities outside India in Czech Republic (AVIA trucks), UAE possesses a state-of-the-art vehicle facility at Ras Al Khaimah, UAE. These manufacturing facilities would meet demand in the respective markets. The total investment amounts to ~|110 crore and the production have already commenced.
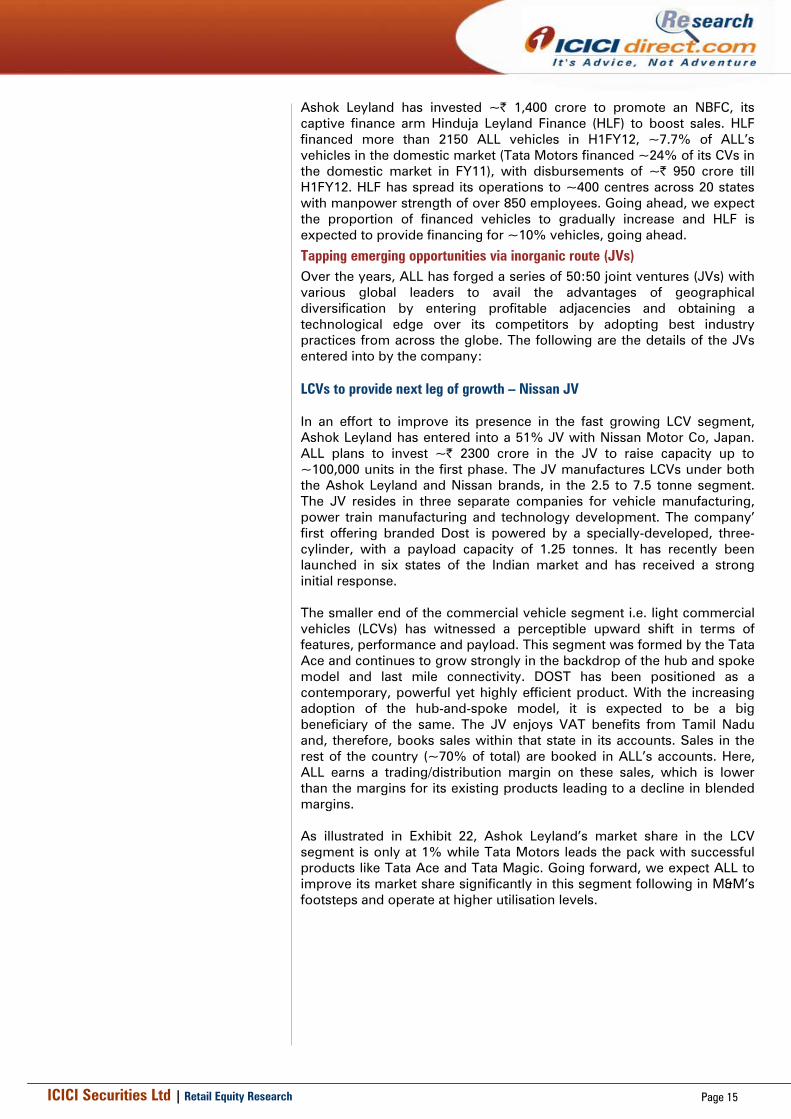
Strong capex/investment plans nearing completion… ALL has been on strong capex drive, mainly attributable to the newer plant facilities and platform development. The following has been the trend of high capital outlays for the same however with capacities in place now AL can step up to ramp up production and utilize the same and deliver better operating performance. ALL has also worked on establishing various JV’s with players like (Nissan, John Deere, Alteams etc) for various new ventures. The benefits of all would come into full effect from FY14-15E onwards. Exhibit 20: Capex/investments in JV & subsidiaries details
643
470
900
450
250
142
873
500
200
100
0
200
400
600
800
1000
FY10 FY11 FY12E FY13E FY14E
(| c
rore
)
Capex Investments
Source: Company, ICICIdirect.com Research
Widening service network & in-house financing to provide level playing field
ALL has witnessed ~50% growth in network in the last 2 years (refer Exhibit 21). Over 30 touch points were added during Apr-Oct 2011 and ~55 in 2010-11. Out of these more than 75% have been added in regions other than South. ALL’s network in North India is expected to match its network in Southern India within the next few months. ALL current service network exceeds 500 touch points, the increasing customer service points have also translated in enhancing volume growth. Exhibit 21: Expanding sales volumes and customer touch points
3632350920
84000100000
505
316316
365
0
30000
60000
90000
120000
150000
FY09 FY10 FY11 FY12200
250
300
350
400
450
500
550
Sales Volumes Touch Points
Source: Company Investor Presentation, ICICIdirect.com Research
ICICI Securities Ltd | Retail Equity Research Page 15
Ashok Leyland has invested ~| 1,400 crore to promote an NBFC, its captive finance arm Hinduja Leyland Finance (HLF) to boost sales. HLF financed more than 2150 ALL vehicles in H1FY12, ~7.7% of ALL’s vehicles in the domestic market (Tata Motors financed ~24% of its CVs in the domestic market in FY11), with disbursements of ~| 950 crore till H1FY12. HLF has spread its operations to ~400 centres across 20 states with manpower strength of over 850 employees. Going ahead, we expect the proportion of financed vehicles to gradually increase and HLF is expected to provide financing for ~10% vehicles, going ahead.
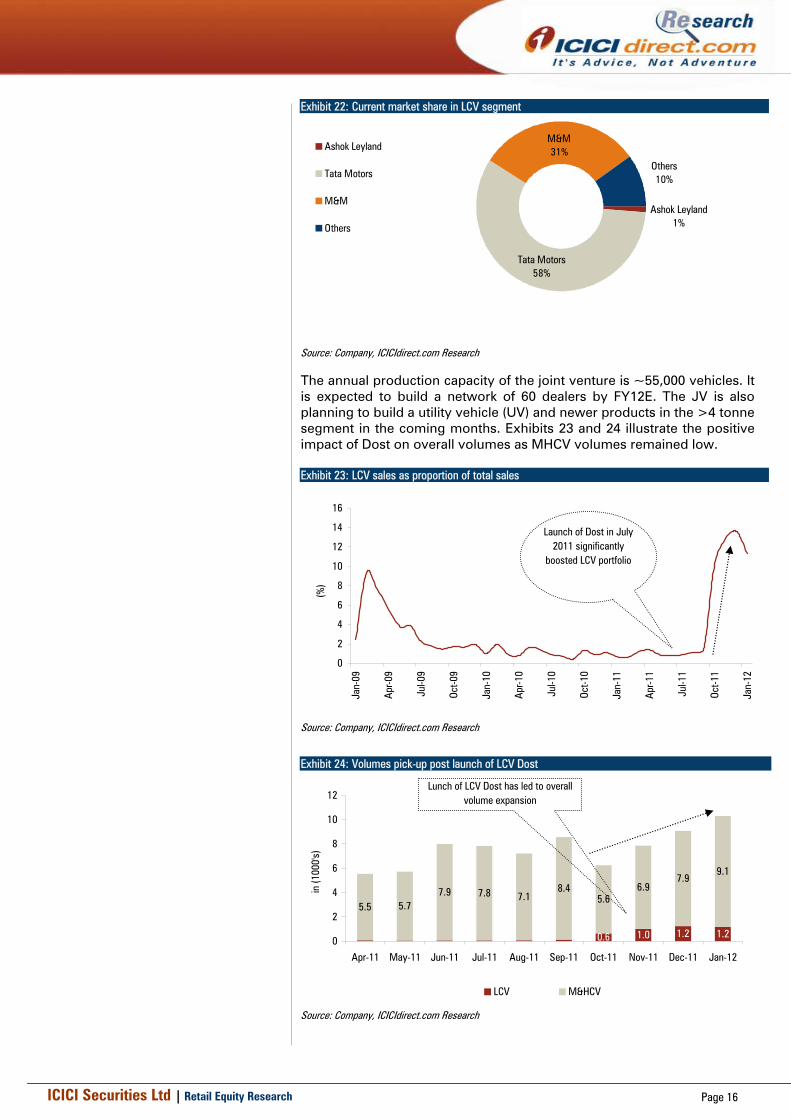
Tapping emerging opportunities via inorganic route (JVs) Over the years, ALL has forged a series of 50:50 joint ventures (JVs) with various global leaders to avail the advantages of geographical diversification by entering profitable adjacencies and obtaining a technological edge over its competitors by adopting best industry practices from across the globe. The following are the details of the JVs entered into by the company: LCVs to provide next leg of growth – Nissan JV In an effort to improve its presence in the fast growing LCV segment, Ashok Leyland has entered into a 51% JV with Nissan Motor Co, Japan. ALL plans to invest ~| 2300 crore in the JV to raise capacity up to ~100,000 units in the first phase. The JV manufactures LCVs under both the Ashok Leyland and Nissan brands, in the 2.5 to 7.5 tonne segment. The JV resides in three separate companies for vehicle manufacturing, power train manufacturing and technology development. The company’ first offering branded Dost is powered by a specially-developed, three-cylinder, with a payload capacity of 1.25 tonnes. It has recently been launched in six states of the Indian market and has received a strong initial response. The smaller end of the commercial vehicle segment i.e. light commercial vehicles (LCVs) has witnessed a perceptible upward shift in terms of features, performance and payload. This segment was formed by the Tata Ace and continues to grow strongly in the backdrop of the hub and spoke model and last mile connectivity. DOST has been positioned as a contemporary, powerful yet highly efficient product. With the increasing adoption of the hub-and-spoke model, it is expected to be a big beneficiary of the same. The JV enjoys VAT benefits from Tamil Nadu and, therefore, books sales within that state in its accounts. Sales in the rest of the country (~70% of total) are booked in ALL’s accounts. Here, ALL earns a trading/distribution margin on these sales, which is lower than the margins for its existing products leading to a decline in blended margins. As illustrated in Exhibit 22, Ashok Leyland’s market share in the LCV segment is only at 1% while Tata Motors leads the pack with successful products like Tata Ace and Tata Magic. Going forward, we expect ALL to improve its market share significantly in this segment following in M&M’s footsteps and operate at higher utilisation levels.
ICICI Securities Ltd | Retail Equity Research Page 16
Exhibit 22: Current market share in LCV segment
Tata Motors58%
M&M31%
Ashok Leyland1%
Others10%
Ashok Leyland
Tata Motors
M&M
Others
Source: Company, ICICIdirect.com Research
The annual production capacity of the joint venture is ~55,000 vehicles. It is expected to build a network of 60 dealers by FY12E. The JV is also planning to build a utility vehicle (UV) and newer products in the >4 tonne segment in the coming months. Exhibits 23 and 24 illustrate the positive impact of Dost on overall volumes as MHCV volumes remained low. Exhibit 23: LCV sales as proportion of total sales
0
2
4
6
8
10
12
14
16
Jan-
09
Apr-0
9
Jul-0
9
Oct-0
9
Jan-
10
Apr-1
0
Jul-1
0
Oct-1
0
Jan-
11
Apr-1
1
Jul-1
1
Oct-1
1
Jan-
12
(%)
Launch of Dost in July 2011 significantly
boosted LCV portfolio
Source: Company, ICICIdirect.com Research
Exhibit 24: Volumes pick-up post launch of LCV Dost
5.5 5.77.9 7.8 7.1
8.45.6
6.97.9
9.1
1.20.6 1.0 1.20
2
4
6
8
10
12
Apr-11 May-11 Jun-11 Jul-11 Aug-11 Sep-11 Oct-11 Nov-11 Dec-11 Jan-12
in (1
000'
s)
LCV M&HCV
Lunch of LCV Dost has led to overall volume expansion
Source: Company, ICICIdirect.com Research
ICICI Securities Ltd | Retail Equity Research Page 17
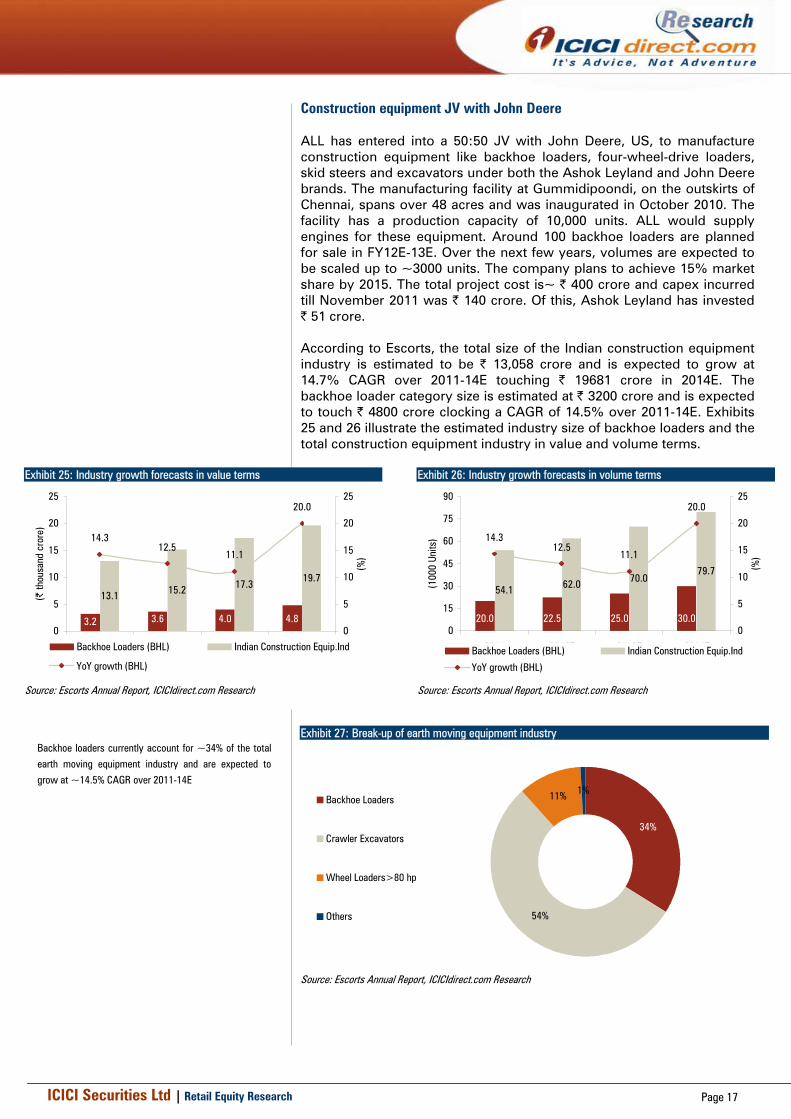
Construction equipment JV with John Deere ALL has entered into a 50:50 JV with John Deere, US, to manufacture construction equipment like backhoe loaders, four-wheel-drive loaders, skid steers and excavators under both the Ashok Leyland and John Deere brands. The manufacturing facility at Gummidipoondi, on the outskirts of Chennai, spans over 48 acres and was inaugurated in October 2010. The facility has a production capacity of 10,000 units. ALL would supply engines for these equipment. Around 100 backhoe loaders are planned for sale in FY12E-13E. Over the next few years, volumes are expected to be scaled up to ~3000 units. The company plans to achieve 15% market share by 2015. The total project cost is~ | 400 crore and capex incurred till November 2011 was | 140 crore. Of this, Ashok Leyland has invested | 51 crore. According to Escorts, the total size of the Indian construction equipment industry is estimated to be | 13,058 crore and is expected to grow at 14.7% CAGR over 2011-14E touching | 19681 crore in 2014E. The backhoe loader category size is estimated at | 3200 crore and is expected to touch | 4800 crore clocking a CAGR of 14.5% over 2011-14E. Exhibits 25 and 26 illustrate the estimated industry size of backhoe loaders and the total construction equipment industry in value and volume terms.
Exhibit 25: Industry growth forecasts in value terms
3.6 4.0 4.8
13.1 15.2 17.319.7
3.2
14.312.5
11.1
20.0
0
5
10
15
20
25
2011 2012E 2013E 2014E
(| th
ousa
nd c
rore
)
0
5
10
15
20
25
(%)
Backhoe Loaders (BHL) Indian Construction Equip.Ind
YoY growth (BHL)
Source: Escorts Annual Report, ICICIdirect.com Research
Exhibit 26: Industry growth forecasts in volume terms
20.0 22.5 25.0 30.0
54.1 62.0 70.079.7
14.312.5
11.1
20.0
0
15
30
45
60
75
90
2011 2012E 2013E 2014E
(100
0 Un
its)
0
5
10
15
20
25
(%)
Backhoe Loaders (BHL) Indian Construction Equip.Ind
YoY growth (BHL)
Source: Escorts Annual Report, ICICIdirect.com Research
Exhibit 27: Break-up of earth moving equipment industry
54%
11% 1%
34%
Backhoe Loaders
Crawler Excavators
Wheel Loaders>80 hp
Others
Source: Escorts Annual Report, ICICIdirect.com Research
Backhoe loaders currently account for ~34% of the total
earth moving equipment industry and are expected to
grow at ~14.5% CAGR over 2011-14E
ICICI Securities Ltd | Retail Equity Research Page 18
Other JVs (Alteams / Continental AG) Ashok Leyland entered into a 50:50 joint venture partnership with the Alteams Group, Finland and aspires to become a world-class aluminium die-casting manufacturer and provide innovative product solutions to its customers. The high pressure die casting technology ensures savings in material consumption by ~10%. The state-of-the-art foundry and machine shop at Cheyyar, Tamil Nadu was inaugurated in January 2010. The joint venture was established to manufacture gear box casings, case oil coolers and connection housings to meet Ashok Leyland’s demand (~65% of ALL’s requirements). The JV is fully established to meet both telecom and automobile sector requirements. The company also plans to manufacture cylinder heads and inlet manifold from the JV, going ahead. The total project cost is | 161 crore of which ALL will invest | 35 crore. Ashok Leyland Alteams possesses the advantages of European technology and has an annual installed capacity of ~7000 tonnes. Automotive Infotronics is a 50:50 joint venture partnership between Ashok Leyland and Continental AG, Germany. The JV will design, develop and adapt infotronic products and services for automotive customers and meet the requirements of ALL. At the same time, it will avail opportunities from other vehicle manufactures in India and overseas. Leveraging ALL’s market knowledge and Continental’s technology leadership, the JV aims to become an innovation centre for delivering automotive infotronic solutions at value price points.
ICICI Securities Ltd | Retail Equity Research Page 19
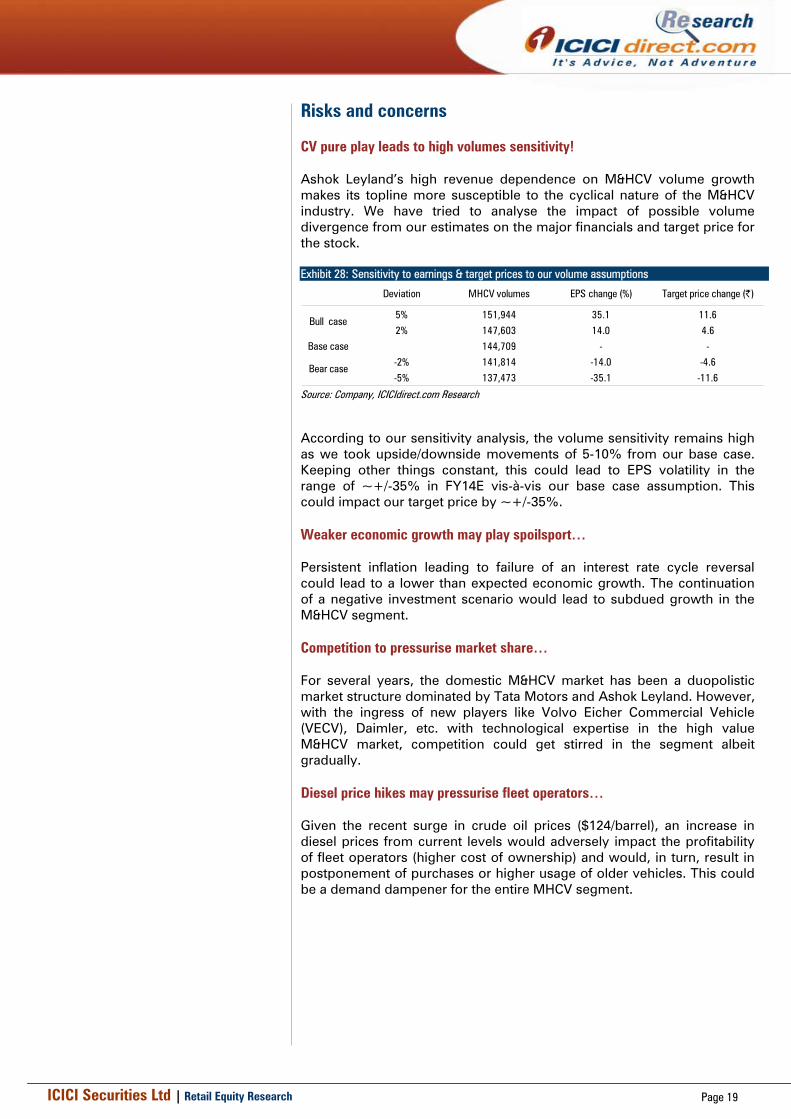
Risks and concerns CV pure play leads to high volumes sensitivity! Ashok Leyland’s high revenue dependence on M&HCV volume growth makes its topline more susceptible to the cyclical nature of the M&HCV industry. We have tried to analyse the impact of possible volume divergence from our estimates on the major financials and target price for the stock. Exhibit 28: Sensitivity to earnings & target prices to our volume assumptions
Deviation MHCV volumes EPS change (%) Target price change (|)
5% 151,944 35.1 11.6
2% 147,603 14.0 4.6Base case 144,709 - -
-2% 141,814 -14.0 -4.6
-5% 137,473 -35.1 -11.6
Bull case
Bear case
Source: Company, ICICIdirect.com Research
According to our sensitivity analysis, the volume sensitivity remains high as we took upside/downside movements of 5-10% from our base case. Keeping other things constant, this could lead to EPS volatility in the range of ~+/-35% in FY14E vis-à-vis our base case assumption. This could impact our target price by ~+/-35%. Weaker economic growth may play spoilsport… Persistent inflation leading to failure of an interest rate cycle reversal could lead to a lower than expected economic growth. The continuation of a negative investment scenario would lead to subdued growth in the M&HCV segment. Competition to pressurise market share… For several years, the domestic M&HCV market has been a duopolistic market structure dominated by Tata Motors and Ashok Leyland. However, with the ingress of new players like Volvo Eicher Commercial Vehicle (VECV), Daimler, etc. with technological expertise in the high value M&HCV market, competition could get stirred in the segment albeit gradually. Diesel price hikes may pressurise fleet operators… Given the recent surge in crude oil prices ($124/barrel), an increase in diesel prices from current levels would adversely impact the profitability of fleet operators (higher cost of ownership) and would, in turn, result in postponement of purchases or higher usage of older vehicles. This could be a demand dampener for the entire MHCV segment.
ICICI Securities Ltd | Retail Equity Research Page 20
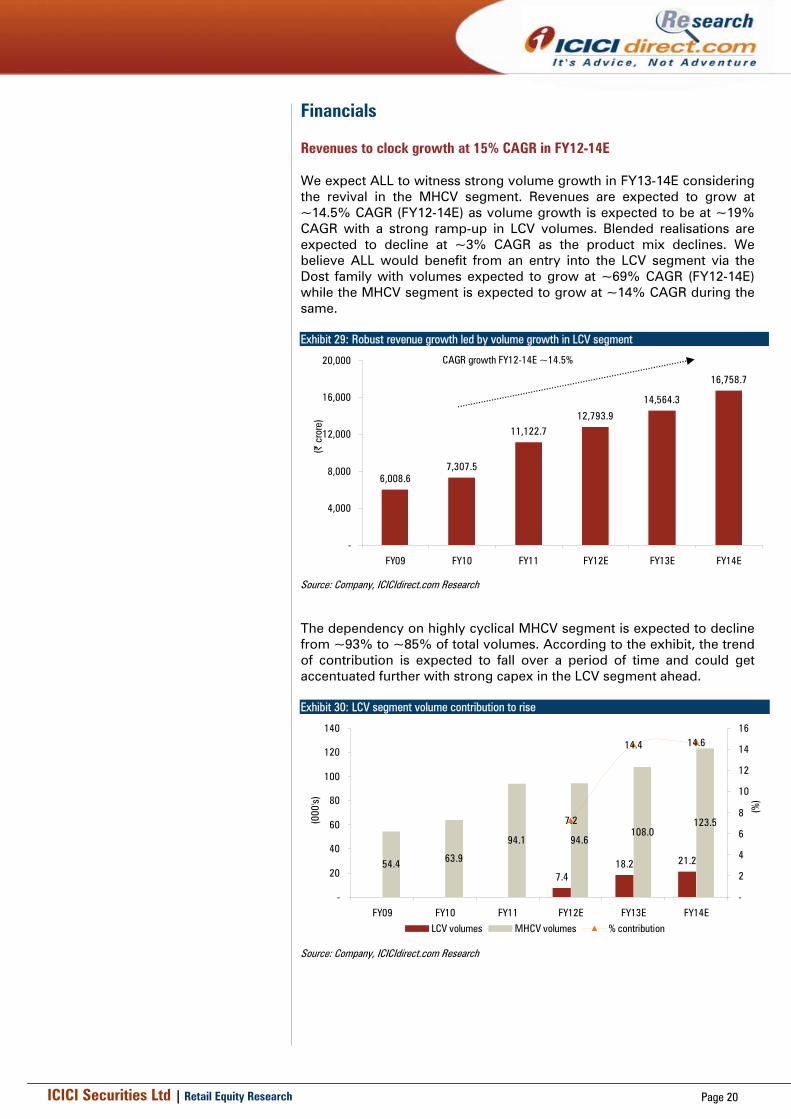
Financials Revenues to clock growth at 15% CAGR in FY12-14E We expect ALL to witness strong volume growth in FY13-14E considering the revival in the MHCV segment. Revenues are expected to grow at ~14.5% CAGR (FY12-14E) as volume growth is expected to be at ~19% CAGR with a strong ramp-up in LCV volumes. Blended realisations are expected to decline at ~3% CAGR as the product mix declines. We believe ALL would benefit from an entry into the LCV segment via the Dost family with volumes expected to grow at ~69% CAGR (FY12-14E) while the MHCV segment is expected to grow at ~14% CAGR during the same. Exhibit 29: Robust revenue growth led by volume growth in LCV segment
6,008.67,307.5
11,122.712,793.9
14,564.3
16,758.7
-
4,000
8,000
12,000
16,000
20,000
FY09 FY10 FY11 FY12E FY13E FY14E
(| c
rore
)
CAGR growth FY12-14E ~14.5%
Source: Company, ICICIdirect.com Research
The dependency on highly cyclical MHCV segment is expected to decline from ~93% to ~85% of total volumes. According to the exhibit, the trend of contribution is expected to fall over a period of time and could get accentuated further with strong capex in the LCV segment ahead. Exhibit 30: LCV segment volume contribution to rise
7.418.2 21.254.4 63.9
94.1 94.6108.0
123.57.2
14.4 14.6
-
20
40
60
80
100
120
140
FY09 FY10 FY11 FY12E FY13E FY14E
(000
's)
-
2
4
6
8
10
12
14
16
(%)
LCV volumes MHCV volumes % contribution
Source: Company, ICICIdirect.com Research
ICICI Securities Ltd | Retail Equity Research Page 21
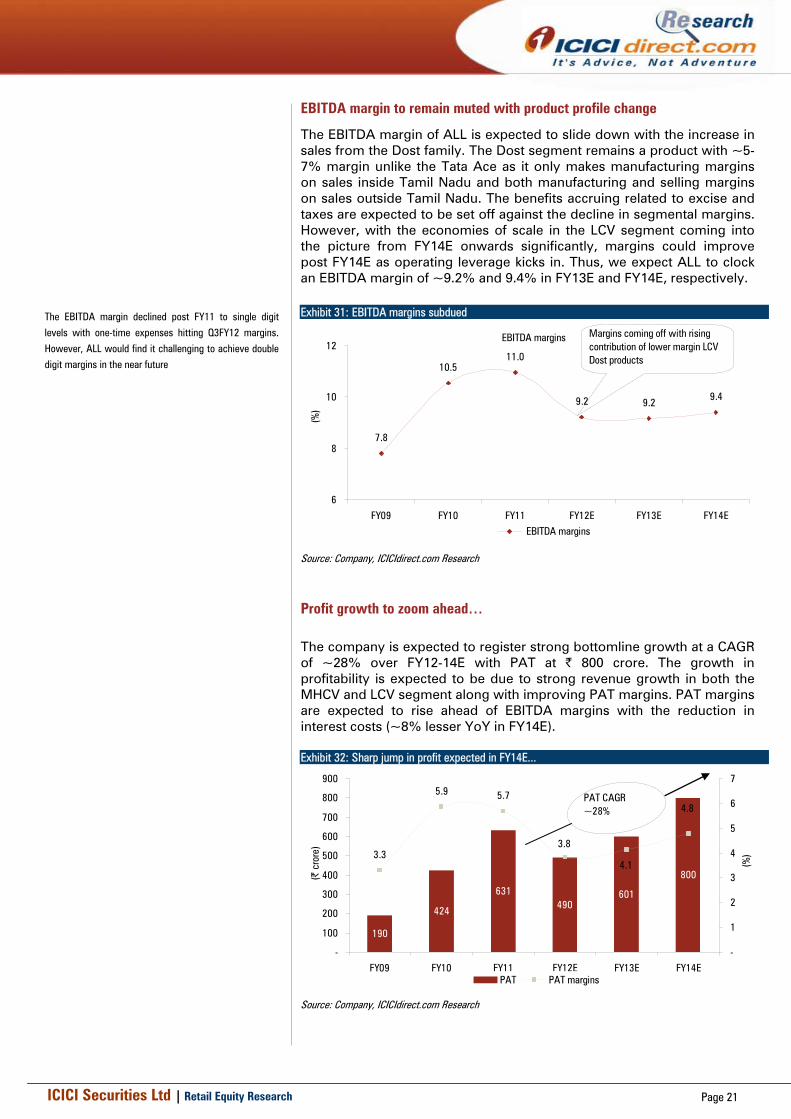
EBITDA margin to remain muted with product profile change
The EBITDA margin of ALL is expected to slide down with the increase in sales from the Dost family. The Dost segment remains a product with ~5-7% margin unlike the Tata Ace as it only makes manufacturing margins on sales inside Tamil Nadu and both manufacturing and selling margins on sales outside Tamil Nadu. The benefits accruing related to excise and taxes are expected to be set off against the decline in segmental margins. However, with the economies of scale in the LCV segment coming into the picture from FY14E onwards significantly, margins could improve post FY14E as operating leverage kicks in. Thus, we expect ALL to clock an EBITDA margin of ~9.2% and 9.4% in FY13E and FY14E, respectively.
Exhibit 31: EBITDA margins subdued
EBITDA margins
7.8
10.511.0
9.2 9.2 9.4
6
8
10
12
FY09 FY10 FY11 FY12E FY13E FY14E
(%)
EBITDA margins
Margins coming off with rising contribution of lower margin LCV Dost products
Source: Company, ICICIdirect.com Research
Profit growth to zoom ahead… The company is expected to register strong bottomline growth at a CAGR of ~28% over FY12-14E with PAT at | 800 crore. The growth in profitability is expected to be due to strong revenue growth in both the MHCV and LCV segment along with improving PAT margins. PAT margins are expected to rise ahead of EBITDA margins with the reduction in interest costs (~8% lesser YoY in FY14E). Exhibit 32: Sharp jump in profit expected in FY14E...
190
424
631490
601
800
3.3
5.9 5.7
3.8
4.1
4.8
-
100
200
300
400
500
600
700
800
900
FY09 FY10 FY11 FY12E FY13E FY14E
(| c
rore
)
-
1
2
3
4
5
6
7
(%)
PAT PAT margins
PAT CAGR ~28%
Source: Company, ICICIdirect.com Research
The EBITDA margin declined post FY11 to single digit
levels with one-time expenses hitting Q3FY12 margins.
However, ALL would find it challenging to achieve double digit margins in the near future
ICICI Securities Ltd | Retail Equity Research Page 22
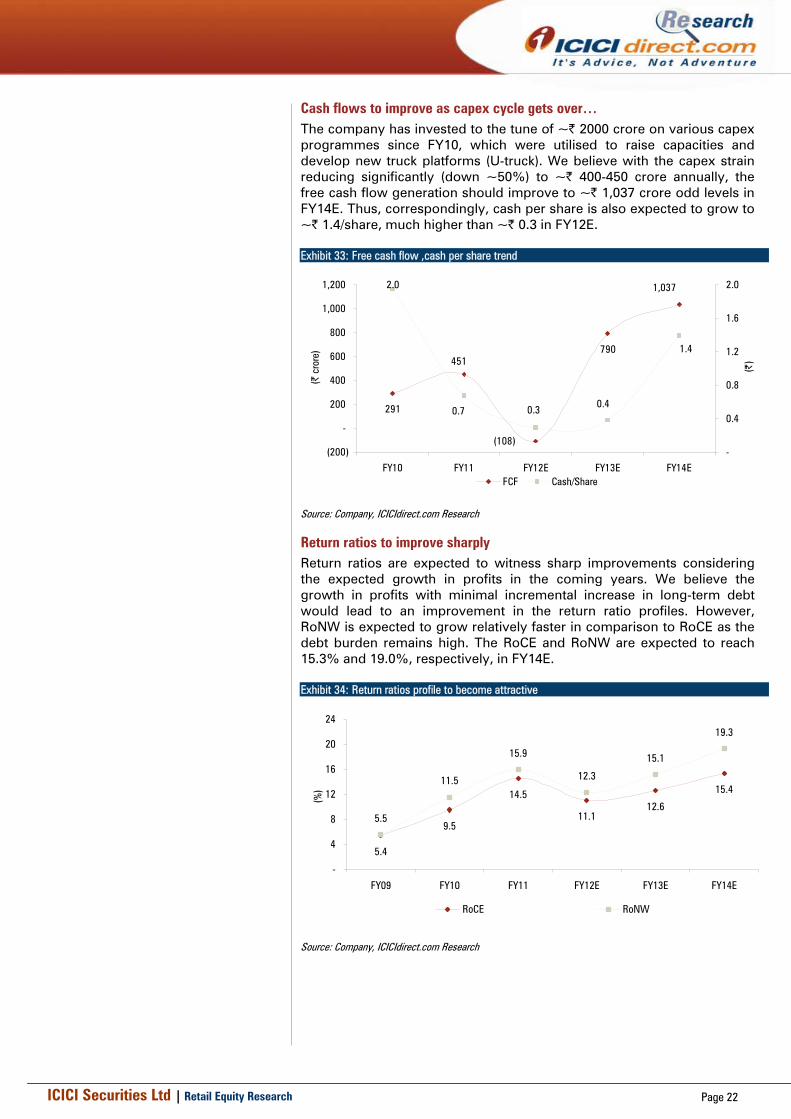
Cash flows to improve as capex cycle gets over… The company has invested to the tune of ~| 2000 crore on various capex programmes since FY10, which were utilised to raise capacities and develop new truck platforms (U-truck). We believe with the capex strain reducing significantly (down ~50%) to ~| 400-450 crore annually, the free cash flow generation should improve to ~| 1,037 crore odd levels in FY14E. Thus, correspondingly, cash per share is also expected to grow to ~| 1.4/share, much higher than ~| 0.3 in FY12E. Exhibit 33: Free cash flow ,cash per share trend
291
790
1,037
(108)
451
2.0
1.4
0.3 0.40.7
(200)
-
200
400
600
800
1,000
1,200
FY10 FY11 FY12E FY13E FY14E
(| c
rore
)
-
0.4
0.8
1.2
1.6
2.0
(|)
FCF Cash/Share
Source: Company, ICICIdirect.com Research
Return ratios to improve sharply Return ratios are expected to witness sharp improvements considering the expected growth in profits in the coming years. We believe the growth in profits with minimal incremental increase in long-term debt would lead to an improvement in the return ratio profiles. However, RoNW is expected to grow relatively faster in comparison to RoCE as the debt burden remains high. The RoCE and RoNW are expected to reach 15.3% and 19.0%, respectively, in FY14E. Exhibit 34: Return ratios profile to become attractive
5.4
9.5
14.512.6
15.4
5.5
11.5
15.9
12.3
15.1
19.3
11.1
-
4
8
12
16
20
24
FY09 FY10 FY11 FY12E FY13E FY14E
(%)
RoCE RoNW
Source: Company, ICICIdirect.com Research
ICICI Securities Ltd | Retail Equity Research Page 23
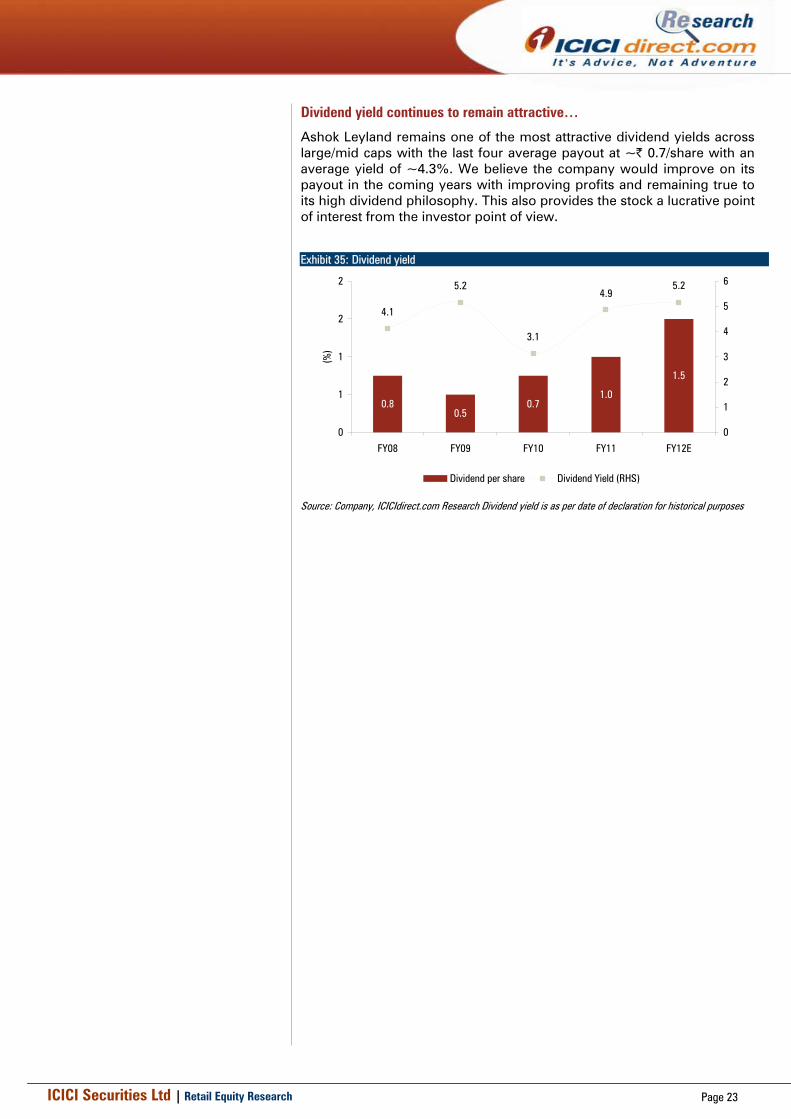
Dividend yield continues to remain attractive…
Ashok Leyland remains one of the most attractive dividend yields across large/mid caps with the last four average payout at ~| 0.7/share with an average yield of ~4.3%. We believe the company would improve on its payout in the coming years with improving profits and remaining true to its high dividend philosophy. This also provides the stock a lucrative point of interest from the investor point of view.
Exhibit 35: Dividend yield
0.80.5
0.71.0
1.5
4.1
5.2
3.1
4.95.2
0
1
1
2
2
FY08 FY09 FY10 FY11 FY12E
(%)
0
1
2
3
4
5
6
Dividend per share Dividend Yield (RHS)
Source: Company, ICICIdirect.com Research Dividend yield is as per date of declaration for historical purposes
ICICI Securities Ltd | Retail Equity Research Page 24
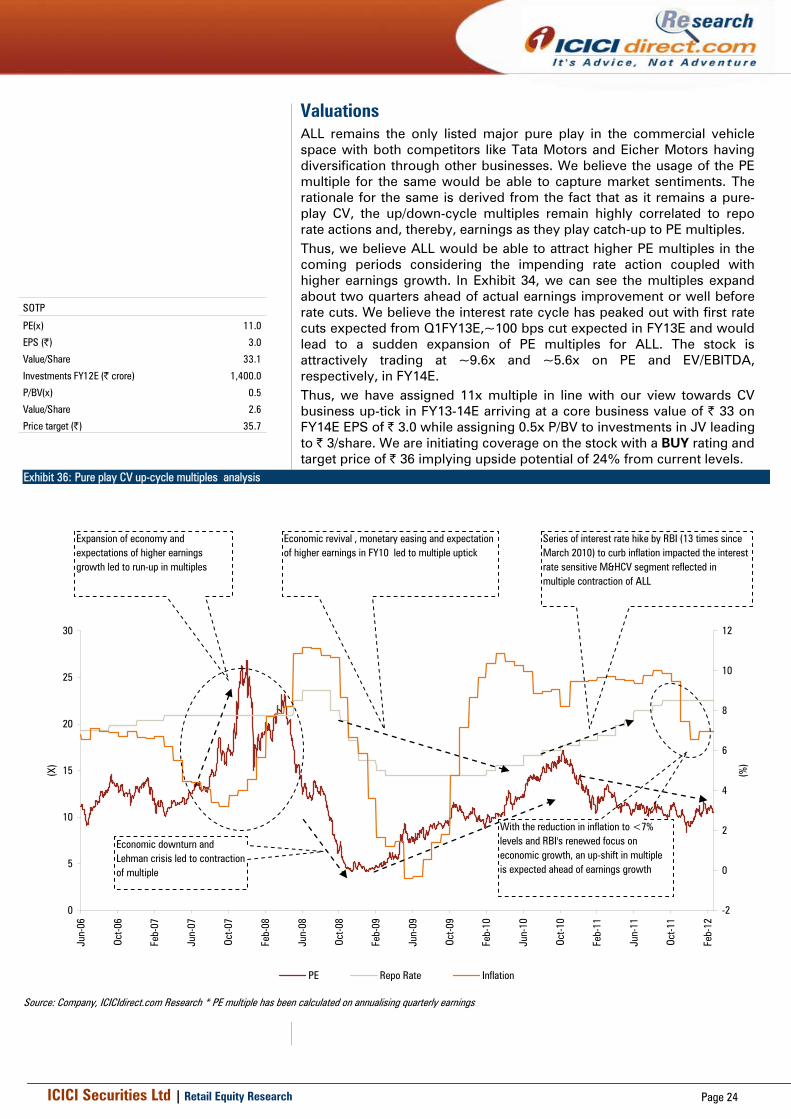
Valuations ALL remains the only listed major pure play in the commercial vehicle space with both competitors like Tata Motors and Eicher Motors having diversification through other businesses. We believe the usage of the PE multiple for the same would be able to capture market sentiments. The rationale for the same is derived from the fact that as it remains a pure-play CV, the up/down-cycle multiples remain highly correlated to repo rate actions and, thereby, earnings as they play catch-up to PE multiples.
Thus, we believe ALL would be able to attract higher PE multiples in the coming periods considering the impending rate action coupled with higher earnings growth. In Exhibit 34, we can see the multiples expand about two quarters ahead of actual earnings improvement or well before rate cuts. We believe the interest rate cycle has peaked out with first rate cuts expected from Q1FY13E,~100 bps cut expected in FY13E and would lead to a sudden expansion of PE multiples for ALL. The stock is attractively trading at ~9.6x and ~5.6x on PE and EV/EBITDA, respectively, in FY14E.
Thus, we have assigned 11x multiple in line with our view towards CV business up-tick in FY13-14E arriving at a core business value of | 33 on FY14E EPS of | 3.0 while assigning 0.5x P/BV to investments in JV leading to | 3/share. We are initiating coverage on the stock with a BUY rating and target price of | 36 implying upside potential of 24% from current levels.
Exhibit 36: Pure play CV up-cycle multiples analysis
0
5
10
15
20
25
30
Jun-
06
Oct-0
6
Feb-
07
Jun-
07
Oct-0
7
Feb-
08
Jun-
08
Oct-0
8
Feb-
09
Jun-
09
Oct-0
9
Feb-
10
Jun-
10
Oct-1
0
Feb-
11
Jun-
11
Oct-1
1
Feb-
12
(X)
-2
0
2
4
6
8
10
12
(%)
PE Repo Rate Inflation
Expansion of economy and expectations of higher earnings growth led to run-up in multiples
Economic downturn and Lehman crisis led to contraction of multiple
Economic revival , monetary easing and expectation of higher earnings in FY10 led to multiple uptick
Series of interest rate hike by RBI (13 times since March 2010) to curb inflation impacted the interest rate sensitive M&HCV segment reflected in multiple contraction of ALL
With the reduction in inflation to <7% levels and RBI's renewed focus on economic growth, an up-shift in multiple is expected ahead of earnings growth
Source: Company, ICICIdirect.com Research * PE multiple has been calculated on annualising quarterly earnings
SOTP
PE(x) 11.0
EPS (|) 3.0
Value/Share 33.1
Investments FY12E (| crore) 1,400.0
P/BV(x) 0.5
Value/Share 2.6
Price target (|) 35.7
ICICI Securities Ltd | Retail Equity Research Page 25
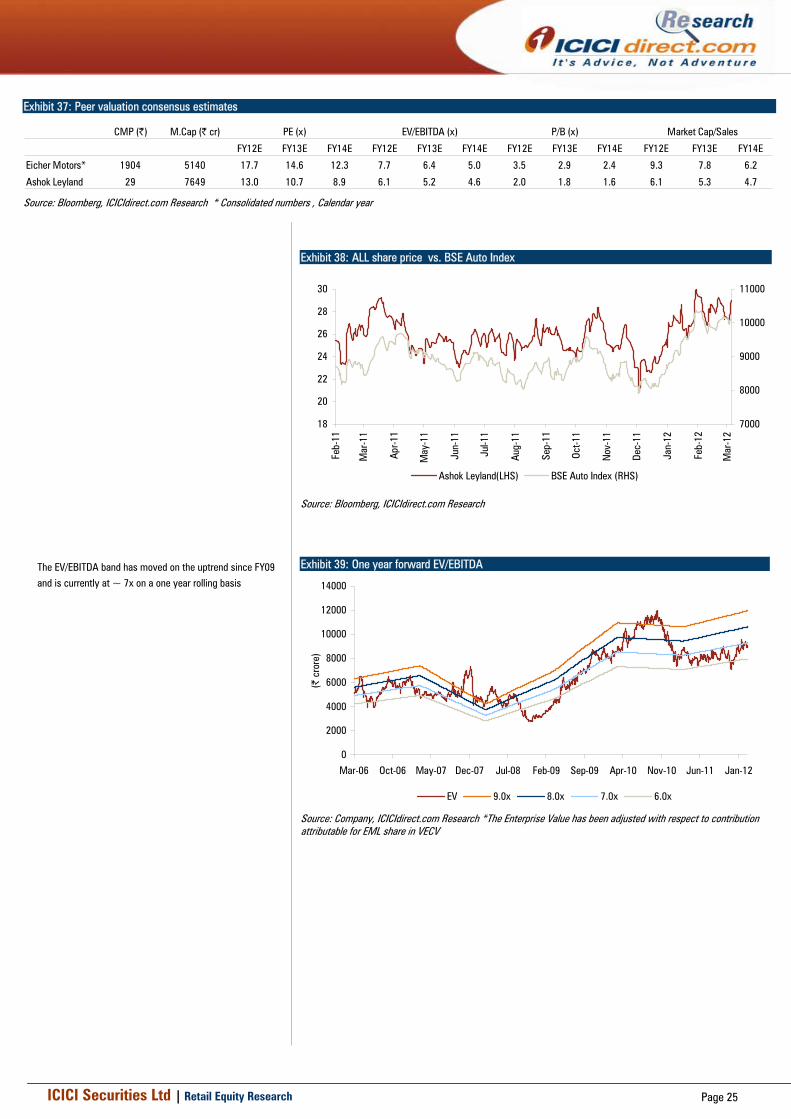
Exhibit 37: Peer valuation consensus estimates
CMP (|) M.Cap (| cr)
FY12E FY13E FY14E FY12E FY13E FY14E FY12E FY13E FY14E FY12E FY13E FY14E
Eicher Motors* 1904 5140 17.7 14.6 12.3 7.7 6.4 5.0 3.5 2.9 2.4 9.3 7.8 6.2
Ashok Leyland 29 7649 13.0 10.7 8.9 6.1 5.2 4.6 2.0 1.8 1.6 6.1 5.3 4.7
PE (x) EV/EBITDA (x) P/B (x) Market Cap/Sales
Source: Bloomberg, ICICIdirect.com Research * Consolidated numbers , Calendar year
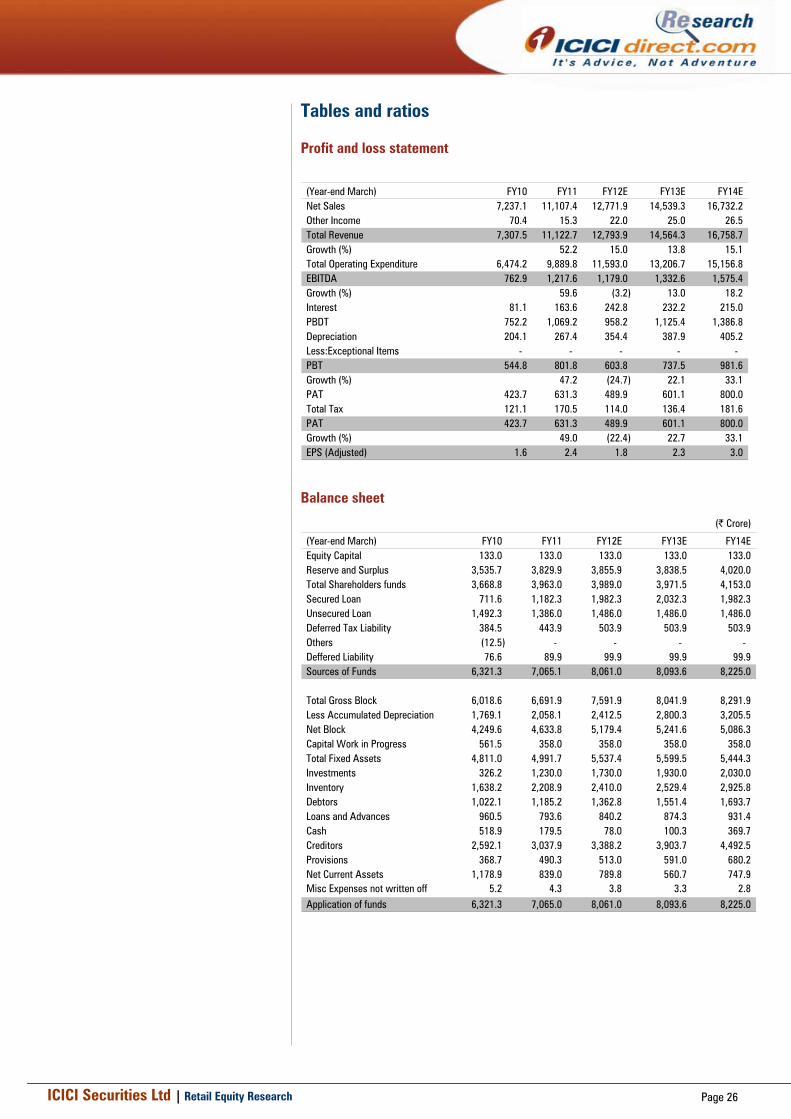
Exhibit 38: ALL share price vs. BSE Auto Index
18
20
22
24
26
28
30
Feb-
11
Mar
-11
Apr-1
1
May
-11
Jun-
11
Jul-1
1
Aug-
11
Sep-
11
Oct-1
1
Nov
-11
Dec-
11
Jan-
12
Feb-
12
Mar
-12
7000
8000
9000
10000
11000
Ashok Leyland(LHS) BSE Auto Index (RHS)
Source: Bloomberg, ICICIdirect.com Research
Exhibit 39: One year forward EV/EBITDA
0
2000
4000
6000
8000
10000
12000
14000
Mar-06 Oct-06 May-07 Dec-07 Jul-08 Feb-09 Sep-09 Apr-10 Nov-10 Jun-11 Jan-12
(| c
rore
)
EV 9.0x 8.0x 7.0x 6.0x
Source: Company, ICICIdirect.com Research *The Enterprise Value has been adjusted with respect to contribution attributable for EML share in VECV
The EV/EBITDA band has moved on the uptrend since FY09 and is currently at ~ 7x on a one year rolling basis
ICICI Securities Ltd | Retail Equity Research Page 26
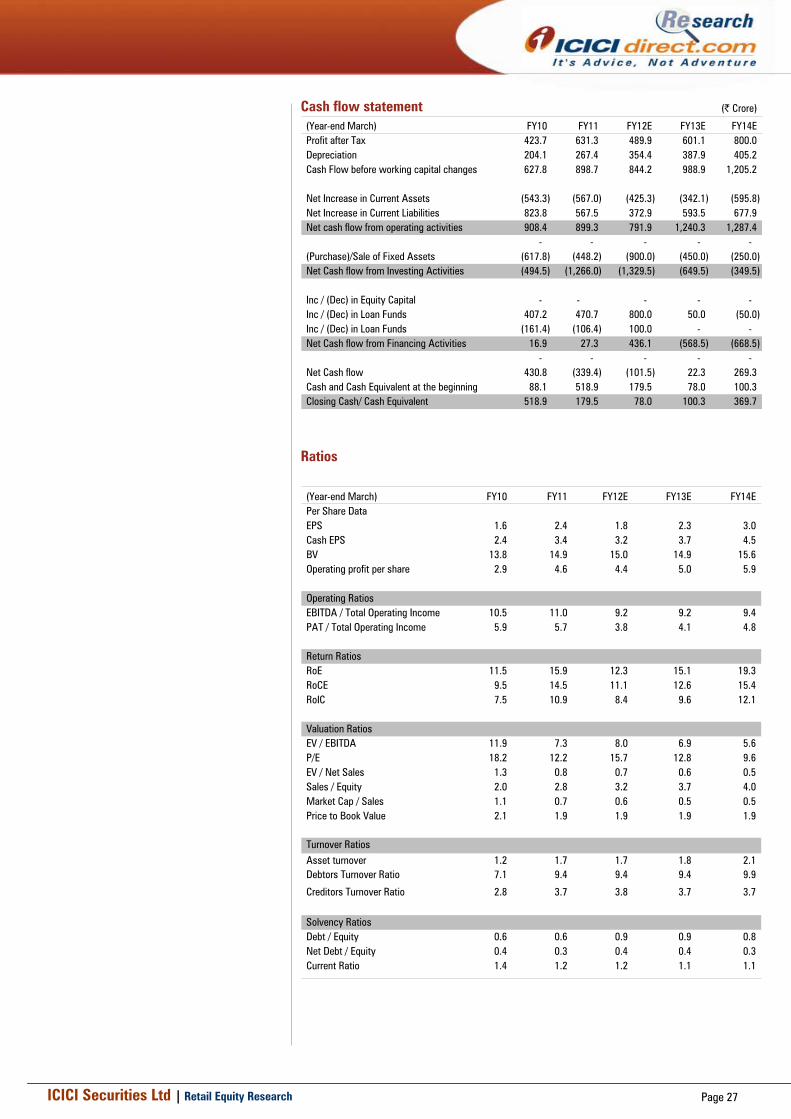
Tables and ratios Profit and loss statement
(Year-end March) FY10 FY11 FY12E FY13E FY14ENet Sales 7,237.1 11,107.4 12,771.9 14,539.3 16,732.2 Other Income 70.4 15.3 22.0 25.0 26.5 Total Revenue 7,307.5 11,122.7 12,793.9 14,564.3 16,758.7 Growth (%) 52.2 15.0 13.8 15.1 Total Operating Expenditure 6,474.2 9,889.8 11,593.0 13,206.7 15,156.8 EBITDA 762.9 1,217.6 1,179.0 1,332.6 1,575.4 Growth (%) 59.6 (3.2) 13.0 18.2 Interest 81.1 163.6 242.8 232.2 215.0 PBDT 752.2 1,069.2 958.2 1,125.4 1,386.8 Depreciation 204.1 267.4 354.4 387.9 405.2 Less:Exceptional Items - - - - - PBT 544.8 801.8 603.8 737.5 981.6 Growth (%) 47.2 (24.7) 22.1 33.1 PAT 423.7 631.3 489.9 601.1 800.0 Total Tax 121.1 170.5 114.0 136.4 181.6 PAT 423.7 631.3 489.9 601.1 800.0 Growth (%) 49.0 (22.4) 22.7 33.1 EPS (Adjusted) 1.6 2.4 1.8 2.3 3.0
Balance sheet
(| Crore)
(Year-end March) FY10 FY11 FY12E FY13E FY14EEquity Capital 133.0 133.0 133.0 133.0 133.0 Reserve and Surplus 3,535.7 3,829.9 3,855.9 3,838.5 4,020.0 Total Shareholders funds 3,668.8 3,963.0 3,989.0 3,971.5 4,153.0 Secured Loan 711.6 1,182.3 1,982.3 2,032.3 1,982.3 Unsecured Loan 1,492.3 1,386.0 1,486.0 1,486.0 1,486.0 Deferred Tax Liability 384.5 443.9 503.9 503.9 503.9 Others (12.5) - - - - Deffered Liability 76.6 89.9 99.9 99.9 99.9 Sources of Funds 6,321.3 7,065.1 8,061.0 8,093.6 8,225.0
Total Gross Block 6,018.6 6,691.9 7,591.9 8,041.9 8,291.9 Less Accumulated Depreciation 1,769.1 2,058.1 2,412.5 2,800.3 3,205.5 Net Block 4,249.6 4,633.8 5,179.4 5,241.6 5,086.3 Capital Work in Progress 561.5 358.0 358.0 358.0 358.0 Total Fixed Assets 4,811.0 4,991.7 5,537.4 5,599.5 5,444.3 Investments 326.2 1,230.0 1,730.0 1,930.0 2,030.0 Inventory 1,638.2 2,208.9 2,410.0 2,529.4 2,925.8 Debtors 1,022.1 1,185.2 1,362.8 1,551.4 1,693.7 Loans and Advances 960.5 793.6 840.2 874.3 931.4 Cash 518.9 179.5 78.0 100.3 369.7 Creditors 2,592.1 3,037.9 3,388.2 3,903.7 4,492.5 Provisions 368.7 490.3 513.0 591.0 680.2 Net Current Assets 1,178.9 839.0 789.8 560.7 747.9 Misc Expenses not written off 5.2 4.3 3.8 3.3 2.8 Application of funds 6,321.3 7,065.0 8,061.0 8,093.6 8,225.0
ICICI Securities Ltd | Retail Equity Research Page 27
(| Crore)
(Year-end March) FY10 FY11 FY12E FY13E FY14EProfit after Tax 423.7 631.3 489.9 601.1 800.0 Depreciation 204.1 267.4 354.4 387.9 405.2 Cash Flow before working capital changes 627.8 898.7 844.2 988.9 1,205.2
Net Increase in Current Assets (543.3) (567.0) (425.3) (342.1) (595.8) Net Increase in Current Liabilities 823.8 567.5 372.9 593.5 677.9 Net cash flow from operating activities 908.4 899.3 791.9 1,240.3 1,287.4
- - - - - (Purchase)/Sale of Fixed Assets (617.8) (448.2) (900.0) (450.0) (250.0) Net Cash flow from Investing Activities (494.5) (1,266.0) (1,329.5) (649.5) (349.5)
Inc / (Dec) in Equity Capital - - - - - Inc / (Dec) in Loan Funds 407.2 470.7 800.0 50.0 (50.0) Inc / (Dec) in Loan Funds (161.4) (106.4) 100.0 - - Net Cash flow from Financing Activities 16.9 27.3 436.1 (568.5) (668.5)
- - - - - Net Cash flow 430.8 (339.4) (101.5) 22.3 269.3 Cash and Cash Equivalent at the beginning 88.1 518.9 179.5 78.0 100.3 Closing Cash/ Cash Equivalent 518.9 179.5 78.0 100.3 369.7
Ratios
(Year-end March) FY10 FY11 FY12E FY13E FY14EPer Share DataEPS 1.6 2.4 1.8 2.3 3.0 Cash EPS 2.4 3.4 3.2 3.7 4.5 BV 13.8 14.9 15.0 14.9 15.6 Operating profit per share 2.9 4.6 4.4 5.0 5.9
Operating RatiosEBITDA / Total Operating Income 10.5 11.0 9.2 9.2 9.4 PAT / Total Operating Income 5.9 5.7 3.8 4.1 4.8
Return RatiosRoE 11.5 15.9 12.3 15.1 19.3 RoCE 9.5 14.5 11.1 12.6 15.4 RoIC 7.5 10.9 8.4 9.6 12.1
Valuation RatiosEV / EBITDA 11.9 7.3 8.0 6.9 5.6 P/E 18.2 12.2 15.7 12.8 9.6 EV / Net Sales 1.3 0.8 0.7 0.6 0.5 Sales / Equity 2.0 2.8 3.2 3.7 4.0 Market Cap / Sales 1.1 0.7 0.6 0.5 0.5 Price to Book Value 2.1 1.9 1.9 1.9 1.9
Turnover RatiosAsset turnover 1.2 1.7 1.7 1.8 2.1 Debtors Turnover Ratio 7.1 9.4 9.4 9.4 9.9
Creditors Turnover Ratio 2.8 3.7 3.8 3.7 3.7
Solvency RatiosDebt / Equity 0.6 0.6 0.9 0.9 0.8 Net Debt / Equity 0.4 0.3 0.4 0.4 0.3 Current Ratio 1.4 1.2 1.2 1.1 1.1
Cash flow statement
ICICI Securities Ltd | Retail Equity Research Page 28
RATING RATIONALE ICICIdirect.com endeavours to provide objective opinions and recommendations. ICICIdirect.com assigns ratings to its stocks according to their notional target price vs. current market price and then categorises them as Strong Buy, Buy, Hold and Sell. The performance horizon is two years unless specified and the notional target price is defined as the analysts' valuation for a stock. Strong Buy: >15%/20% for large caps/midcaps, respectively, with high conviction; Buy: >10%/15% for large caps/midcaps, respectively; Hold: Up to +/-10%; Sell: -10% or more;
Pankaj Pandey Head – Research [email protected]
ICICIdirect.com Research Desk, ICICI Securities Limited, 1st Floor, Akruti Trade Centre, Road No 7, MIDC, Andheri (East) Mumbai – 400 093
ANALYST CERTIFICATION We /I, Karan Mittal MBA, Nishant Vass MBA (Finance) ,Aman Daga (MBA) research analysts, authors and the names subscribed to this report, hereby certify that all of the views expressed in this research report accurately reflect our personal views about any and all of the subject issuer(s) or securities. We also certify that no part of our compensation was, is, or will be directly or indirectly related to the specific recommendation(s) or view(s) in this report. Analysts aren't registered as research analysts by FINRA and might not be an associated person of the ICICI Securities Inc.
Disclosures: ICICI Securities Limited (ICICI Securities) and its affiliates are a full-service, integrated investment banking, investment management and brokerage and financing group. We along with affiliates are leading underwriter of securities and participate in virtually all securities trading markets in India. We and our affiliates have investment banking and other business relationship with a significant percentage of companies covered by our Investment Research Department. Our research professionals provide important input into our investment banking and other business selection processes. ICICI Securities generally prohibits its analysts, persons reporting to analysts and their dependent family members from maintaining a financial interest in the securities or derivatives of any companies that the analysts cover.
The information and opinions in this report have been prepared by ICICI Securities and are subject to change without any notice. The report and information contained herein is strictly confidential and meant solely for the selected recipient and may not be altered in any way, transmitted to, copied or distributed, in part or in whole, to any other person or to the media or reproduced in any form, without prior written consent of ICICI Securities. While we would endeavour to update the information herein on reasonable basis, ICICI Securities, its > subsidiaries and associated companies, their directors and employees (“ICICI Securities and affiliates”) are under no obligation to update or keep the information current. Also, there may be regulatory, compliance or other reasons that may prevent ICICI Securities from doing so. Non-rated securities indicate that rating on a particular security has been suspended temporarily and such suspension is in compliance with applicable regulations and/or ICICI Securities policies, in circumstances where ICICI Securities is acting in an advisory capacity to this company, or in certain other circumstances.
This report is based on information obtained from public sources and sources believed to be reliable, but no independent verification has been made nor is its accuracy or completeness guaranteed. This report and information herein is solely for informational purpose and may not be used or considered as an offer document or solicitation of offer to buy or sell or subscribe for securities or other financial instruments. Though disseminated to all the customers simultaneously, not all customers may receive this report at the same time. ICICI Securities will not treat recipients as customers by virtue of their receiving this report. Nothing in this report constitutes investment, legal, accounting and tax advice or a representation that any investment or strategy is suitable or appropriate to your specific circumstances. The securities discussed and opinions expressed in this report may not be suitable for all investors, who must make their own investment decisions, based on their own investment objectives, financial positions and needs of specific recipient. This may not be taken in substitution for the exercise of independent judgment by any recipient. The recipient should independently evaluate the investment risks. The value and return of investment may vary because of changes in interest rates, foreign exchange rates or any other reason. ICICI Securities and affiliates accept no liabilities for any loss or damage of any kind arising out of the use of this report. Past performance is not necessarily a guide to future performance. Investors are advised to see Risk Disclosure Document to understand the risks associated before investing in the securities markets. Actual results may differ materially from those set forth in projections. Forward-looking statements are not predictions and may be subject to change without notice.
ICICI Securities and its affiliates might have managed or co-managed a public offering for the subject company in the preceding twelve months. ICICI Securities and affiliates might have received compensation from the companies mentioned in the report during the period preceding twelve months from the date of this report for services in respect of public offerings, corporate finance, investment banking or other advisory services in a merger or specific transaction. It is confirmed that Karan Mittal MBA, Nishant Vass MBA (Finance) ,Aman Daga (MBA) research analysts and the authors of this report have not received any compensation from the companies mentioned in the report in the preceding twelve months. Our research professionals are paid in part based on the profitability of ICICI Securities, which include earnings from Investment Banking and other business.
ICICI Securities or its subsidiaries collectively do not own 1% or more of the equity securities of the Company mentioned in the report as of the last day of the month preceding the publication of the research report.
It is confirmed that Karan Mittal MBA, Nishant Vass MBA (Finance) ,Aman Daga (MBA) research analysts and the authors of this report or any of their family members does not serve as an officer, director or advisory board member of the companies mentioned in the report.
ICICI Securities may have issued other reports that are inconsistent with and reach different conclusion from the information presented in this report. ICICI Securities and affiliates may act upon or make use of information contained in the report prior to the publication thereof.
This report is not directed or intended for distribution to, or use by, any person or entity who is a citizen or resident of or located in any locality, state, country or other jurisdiction, where such distribution, publication, availability or use would be contrary to law, regulation or which would subject ICICI Securities and affiliates to any registration or licensing requirement within such jurisdiction. The securities described herein may or may not be eligible for sale in all jurisdictions or to certain category of investors. Persons in whose possession this document may come are required to inform themselves of and to observe such restriction.