marcella j. sackett sulfur bacteria rhodospirillum ... · sulfur bacteria rhodospirillum centenum...
TRANSCRIPT
V
M. J. Sackett
Comparison of the Photoresponses of the Anoxygenic Purple Non-Sulfur Bacteria Rhodospirillum centenum and Rhodobacter sphaeroides
Marcella J. SackettMicrobial Diversity Course 1996
Marine Biological LaboratoryWoods Hole, MA 02453
*Dep.tment of Chemistry, Indiana University, Bloomington, IN 47405
Introduction
Photoresponses of bacteria were first noted in 1883 by Engelmann when the cells he was
observing “took fright” from specific regions of lower light intensity. The cells were trapped within
the lighted region by continually reversing their swimming direction back into the light at the
lightldark interface (Engelmann, 1883). This photoresponse has been termed scotophobia to refer to
the bacterium’s apparent fear of darkness. The scotophobic response does not imply that the cells
move directionally toward the light source, but rather that they preferentially stay within the lighted
area (Ragatz et al., 1995). Movement toward or away from a light source is termed positive or
negative phototaxis, respectively (Häder, D.-P., 1987).
Rhodospirillum centenum and Rhodobacter sphaeroides are two anoxygenic photosynthetic
bacteria from the purple non-sulfur bacteria group whose mechanisms of photoresponse have been
described in some detail (for overview, Armitage et al. 1995). Both of these organisms display a
photoresponse when passing through a lightldark boundary or a light intensity gradient, but have
some distinct differences in their modes of response. Liquid grown R. centenum displays a
scotophobic photoresponse by reversing its direction at the light to dark boundary by switching the
direction of its flagellar rotation from clockwise to counterclockwise so that the cells swim back into
M. J. Sackett
the region of higher light intensity (Ragatz et at., 1995) (Figure 1A). On the other hand, R.sphaeroides only rotates its flagellum unidirectionally (clockwise), so in order for the cell to changedirection upon reaching a light to dark boundary it stops rotating its flagellum, allows Brownianmotion to reorient the cell and then begins to swim forward in a new direction (Armitage and Macnab,1987) (Figure 1B). This stopping of flagellar rotation as the cells pass from a light to dark region iscalled a step-down response (Packer et al., 1996). This response occurs only when R. sphaeroidesis moving down a gradient, but does not occur when the cells move up a light intensity gradient.
Another difference in the photoresponse behavior between R. centenum and R sphaeroides isat the macroscopic level of colony movement on agar plates. Ragatz et al. (1995) noted that themacroscopic phototactic movement of R. centenum colonies is to swarm directly toward a lightsource even when the intensity of light decreased as the colony moved toward the light source(Figure 1C). Such a photoresponse to the direction of light is true phototaxis. Colonies of R.centenum are able to display both positive and negative phototactic movement depending upon thewavelength of light used (Ragatz et al., 1994). For instance, the presence of infra red light at 800-880 nm wavelength acts as an attractant so that the cells display positive phototaxis by moving enmass toward the light source. However, in the presence of visible light from 580-600 nm inwavelength, the cells display negative phototaxis and the entire colony moves away from the light.This positive and negative phototactic activity of R. centenum directly correlates with the spectrum ofits photosynthetic pigments (Ragatz et at., 1995). The positive phototactic response occurs in thewavelength region which corresponds to the light-harvesting and reaction center absorbency peaks(800 and 875 nm) while negative phototaxis is induced in the wavelengths of light equivalent to thecarotenoid peaks and the Qx bacteriochiorophyll peak (Ragatz et al., 1995).
Swarm plate grown R. sphaeroides cells do not display macroscopic photoresponse to avariety of light sources (J. P. Armitage, personal communication) (Figure 1D). One possibleexplanation for this is that lateral flagellar production is not induced in R. sphaeroides when grownon an agar surface.
2
M. J. Sackett
In this work, we demonstrate that neither R. centenum nor R. sphaeroides display truephototaxis. Both respond to a beam of light with R. centenum becoming “trapped” within the lightbeam produced by a fiber optic cable and with R. sphaeroides becoming “trapped” outside of the lightbeam.
Materials and Methods
Bacterial strains, media and growth conditions
Rhodospirillum centenum wild type strain (gift of Dr. Carl Bauer) used in this study (R.centenum strain SW; ATCC 51521) is a derivative of the original R. centenum strain isolated fromThermopolis Hot Springs, WY (Favinger et al., 1989). Liquid cultures were grownphotosynthetically in PYVS medium (0.3% peptone, 0.3% yeast extract, 0.4% soytone, 20 ng/mLvitamin B12 and 1.5 .ig/mL biotin) in a screw cap tube illuminated by a 75 W halogen bulb at 27°C-42°C (Ragatz et al., 1995). R. centenum swarm cells with lateral flagella were grown as described(Ragatz et al., 1995). Briefly, 1 mL of early stationary phase liquid culture cells was centrifuged andresuspended in 50 iL of spent medium. 8 p.L of this concentrated sample was spotted onto an 0.8%PYVS swarm plate (9 cm X 9 cm square), allowed to air dry briefly, and then incubated in the dark at42°C for approximately 4 hours or until a dense growth of cells was present at the original spot. Thecells were then induced for positive phototaxis by placing the swarm plate cultures in the light of asingle tungsten light bulb (60 W), shielding the plate from ambient light, with the temperaturemaintained at 37°C - 42°C. The cells were incubated in this fashion until phototaxis had begun andlateral flagella were evident by staining.
The R. sphaeroides WS8Nzop strain used in this analysis is a spontaneous nalidixic acid
resistant mutant of WS8 (wild-type isolate from W. Sistrom). R. sphaeroides was grown asdescribed with 5 mM sodium succinate as the carbon source (see Appendix I for medium recipe) at25°C under high light illumination (Armitage et al., 1985).
M. 3. Sackett
Flagellar Staining
Flagella were stained using Flagella Stain (Carr-Scarborough Decatur, GA) which contains0.6% crystal violet, 2 % tannic acid, 2.5% phenol, and 5.7% aluminum potassium sulfate. Theprotocol from the manufacturer was modified so that wet mounts of cells were stained. 3 j.tL ofliquid medium, sterile deionized water or liquid suspension of cells was placed on a microscope slide.If medium or sterile deionized water was used, a colony was picked and gently resuspended in theliquid. A coverslip was then placed over the sample and 2-3 pL of flagella stain was placed next tothe coverslip and allowed to move under the glass by capillary action. The cells were stained forapproximately 5 minutes (and up to 2 hours) before being visualized under 100X objective. Longerperiods of staining allow for better visualization of difficult to stain flagella such as the lateral flagellaof R. centenum cells.
Sample Preparation for Microscopic Photoresponse Assay
Approximately 150 jiL liquid grown cells were placed directly into the sample chamber.Plate grown cells were placed in the sample chamber by first resuspending the cells in approximately250 iL of sterile deionized water and then place approximately 150 LL of the suspension under themicroscope slide.
Microscopic Photoresponse Assay
The main premise of this assay utilizes the upward light scattering of the bacteria present inthe light beam path produced by a fiber optic cable to analyze the photoresponse of motile
photoheterotrophic cells, If cells entering the beam are scotophobic, they wifi become trapped in thebeam leading to an increase in the number of cells present in the beam. The increased number of cellsin the light beam is proportional to the amount of light scattered by the cells which leads to a moredetectable intensity of light. Also, if cells are attracted to the light source (as in positive phototaxis),then the amount of light scattering at the end closer to the end of the fiber optic cable will be greaterthan at the other end of the light beam. A schematic of the analytical set-up is present in Figure 2 in
ii
M. J. Sackett
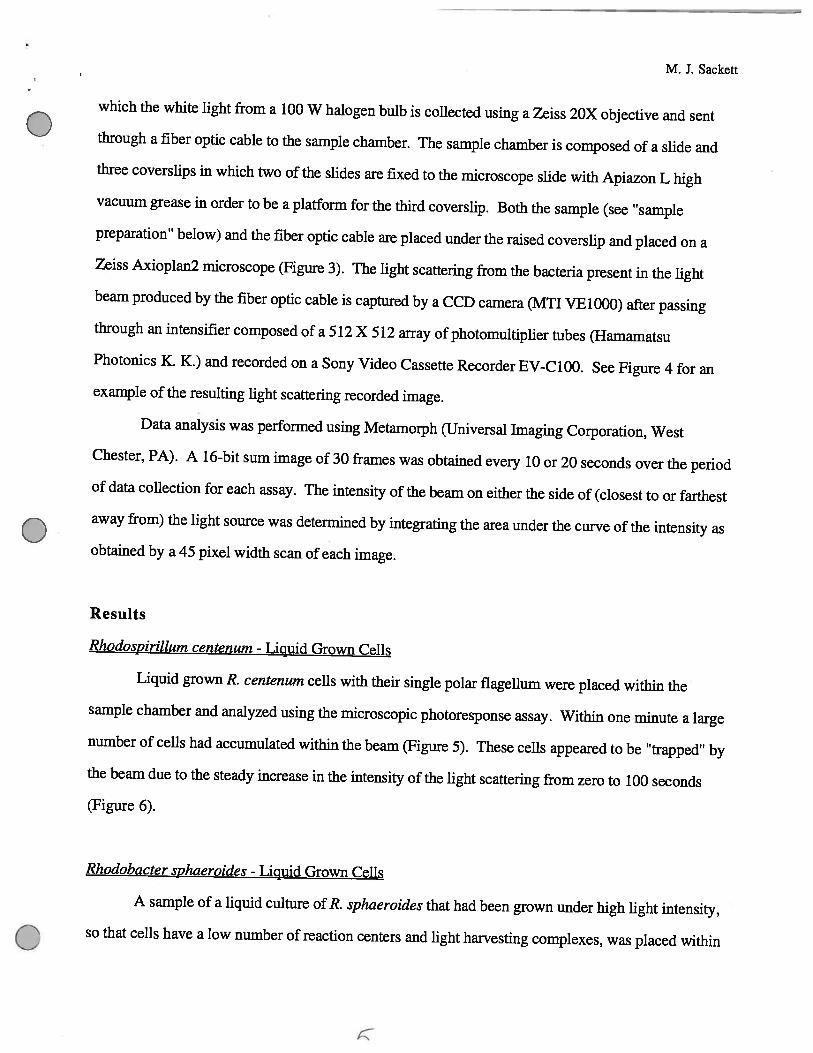
which the white light from a 100 W halogen bulb is collected using a Zeiss 20X objective and sentthrough a fiber optic cable to the sample chamber. The sample chamber is composed of a slide andthree coverslips in which two of the slides are fixed to the microscope slide with Apiazon L high
vacuum grease in order to be a platform for the third coverslip. Both the sample (see “sample
preparation” below) and the fiber optic cable are placed under the raised coverslip and placed on a
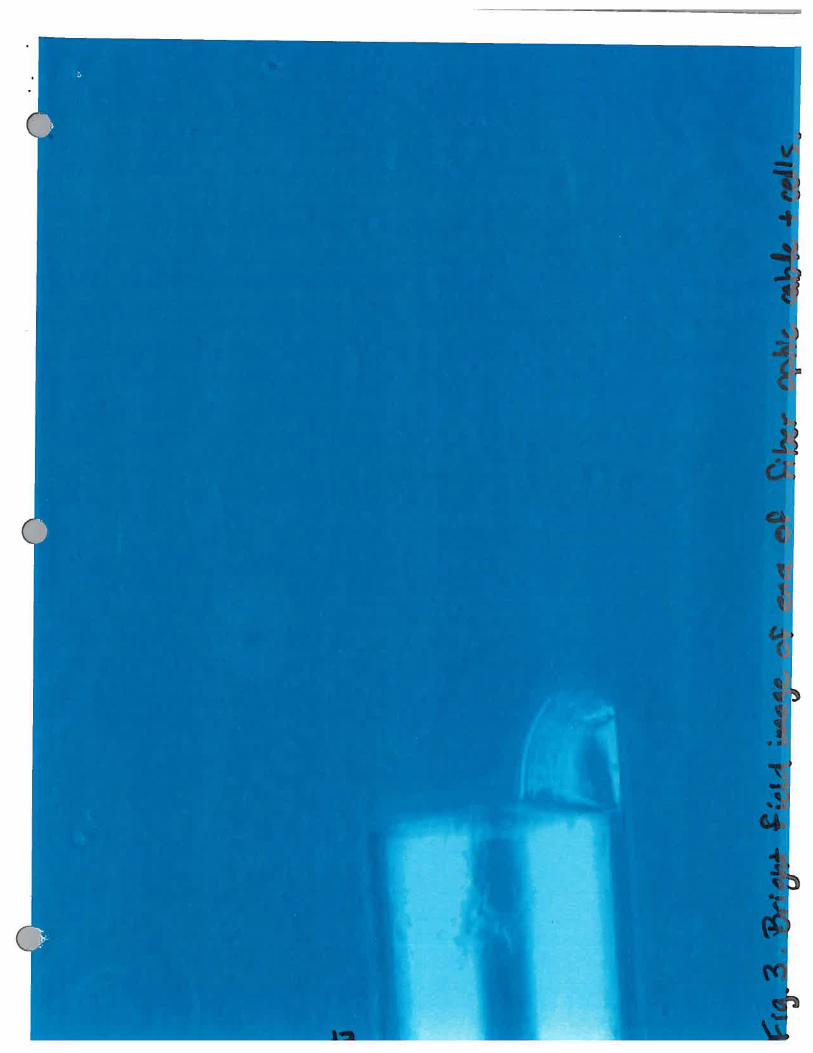
Zeiss Axioplan2 microscope (Figure 3). The light scattering from the bacteria present in the light
beam produced by the fiber optic cable is captured by a CCD camera (MTI VE1000) after passing
through an intensifier composed of a 512 X 512 array of photomultiplier tubes (Hamamatsu
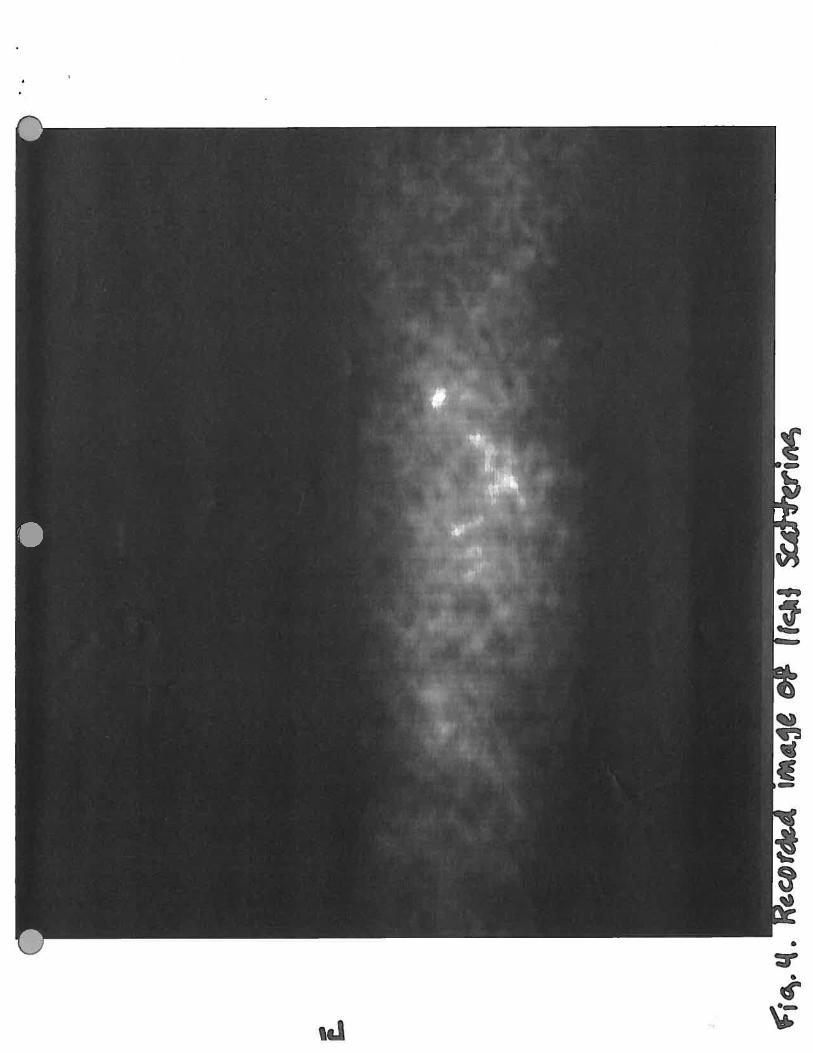
Photonics K. K.) and recorded on a Sony Video Cassette Recorder EV-C 100. See Figure 4 for an
example of the resulting light scattering recorded image.
Data analysis was performed using Metamorph (Universal Imaging Corporation, West
Chester, PA). A 16-bit sum image of 30 frames was obtained every 10 or 20 seconds over the period
of data collection for each assay. The intensity of the beam on either the side of (closest to or farthestaway from) the light source was determined by integrating the area under the curve of the intensity asobtained by a 45 pixel width scan of each image.
Results
Rhodospirillum centenum - Liquid Grown Cells
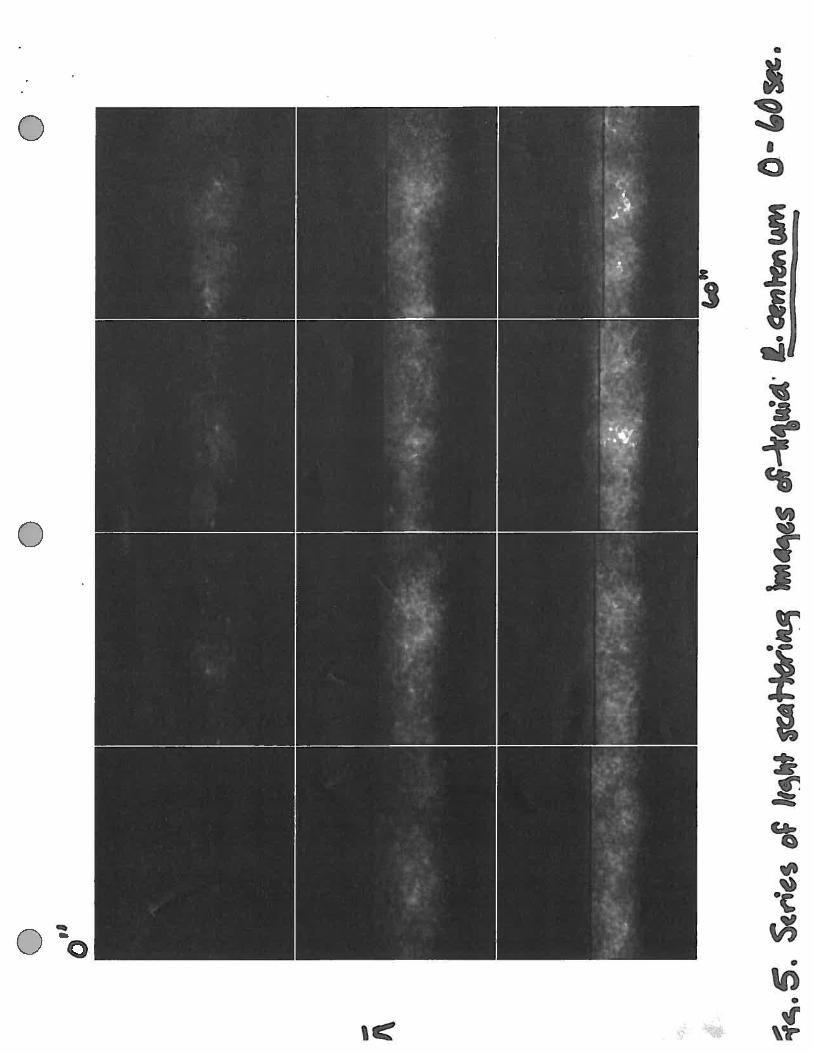
Liquid grown R. centenum cells with their single polar flagellum were placed within the
sample chamber and analyzed using the microscopic photoresponse assay. Within one minute a large
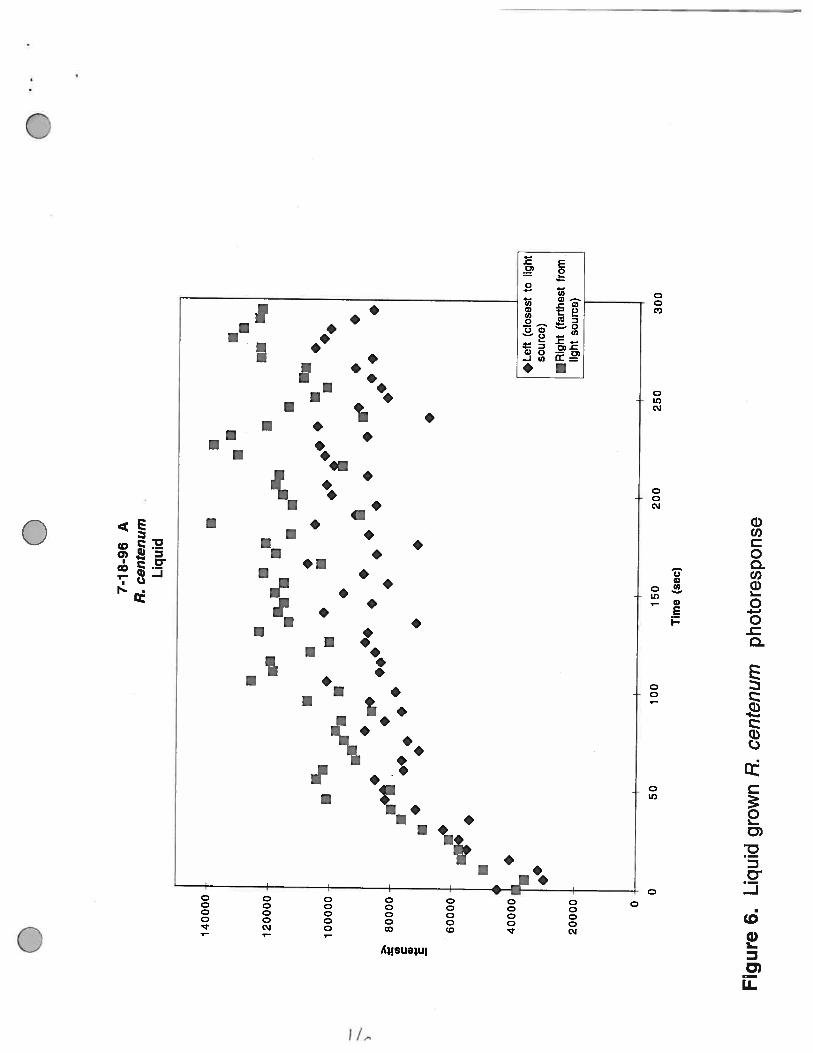
number of cells had accumulated within the beam (Figure 5). These cells appeared to be “trapped” by
the beam due to the steady increase in the intensity of the light scattering from zero to 100 seconds
(Figure 6).
Rhodobacter sphaeroides - Liquid Grown Cells
A sample of a liquid culture of R. sphaeroides that had been grown under high light intensity,
so that cells have a low number of reaction centers and light harvesting complexes, was placed within
M. 3. Sackett
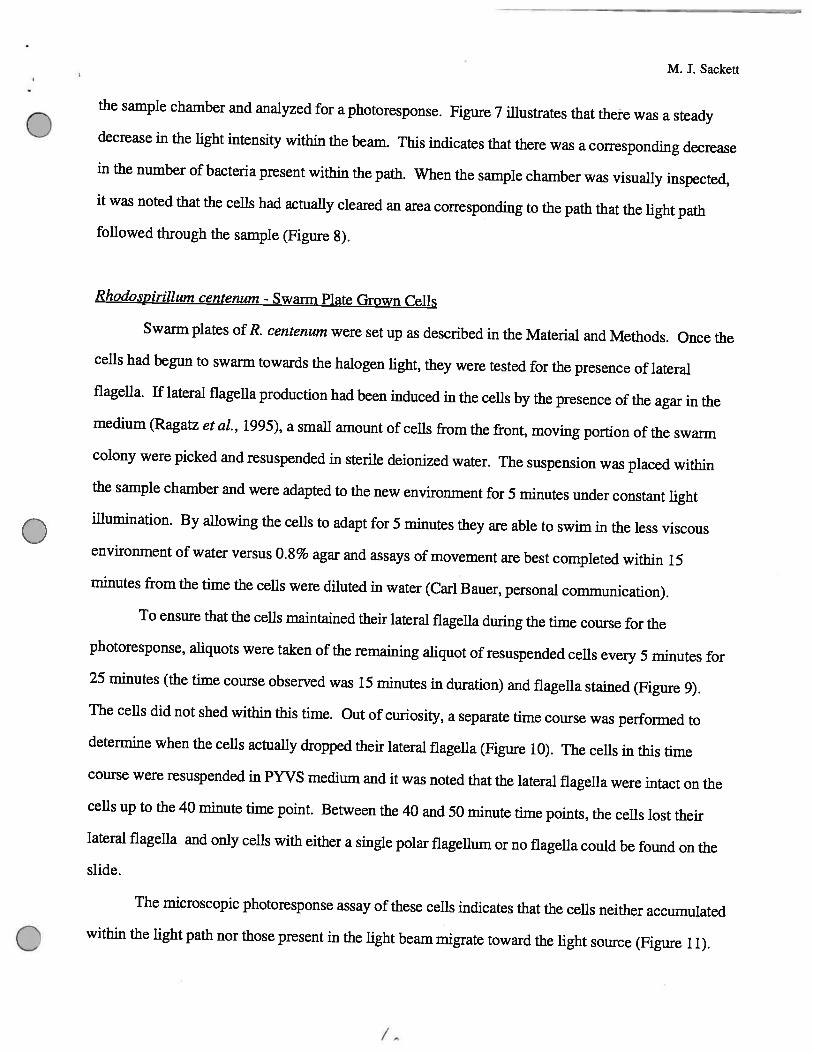
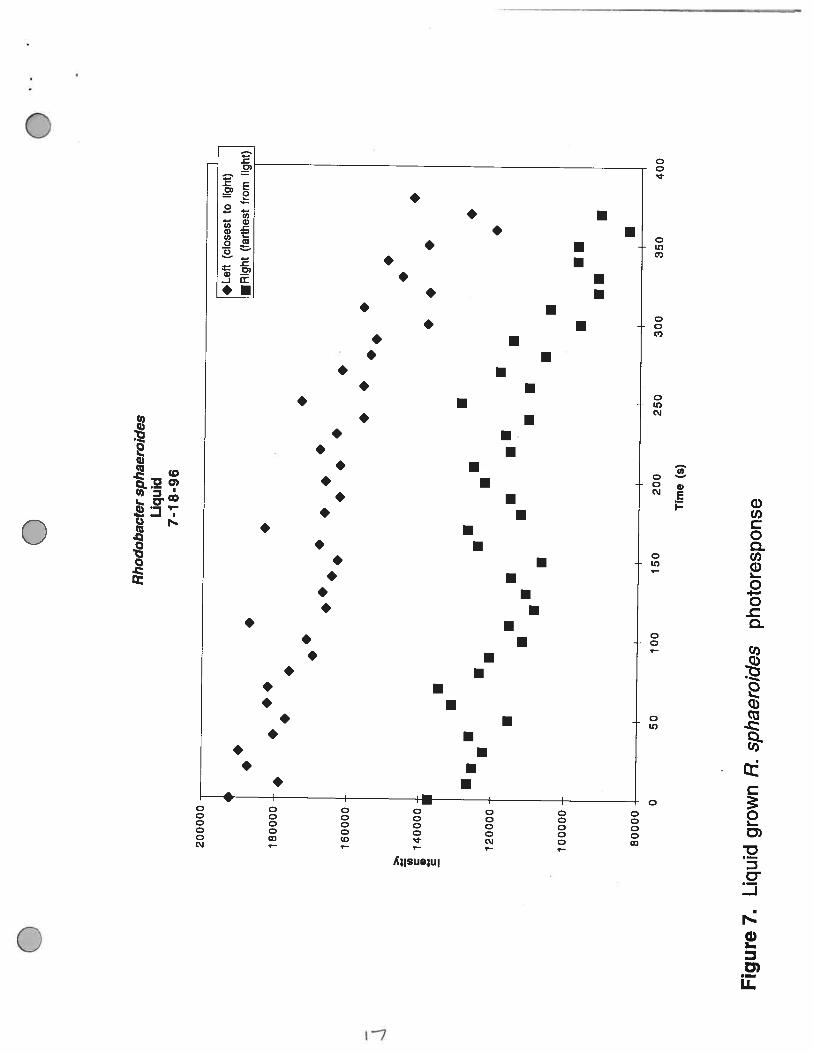
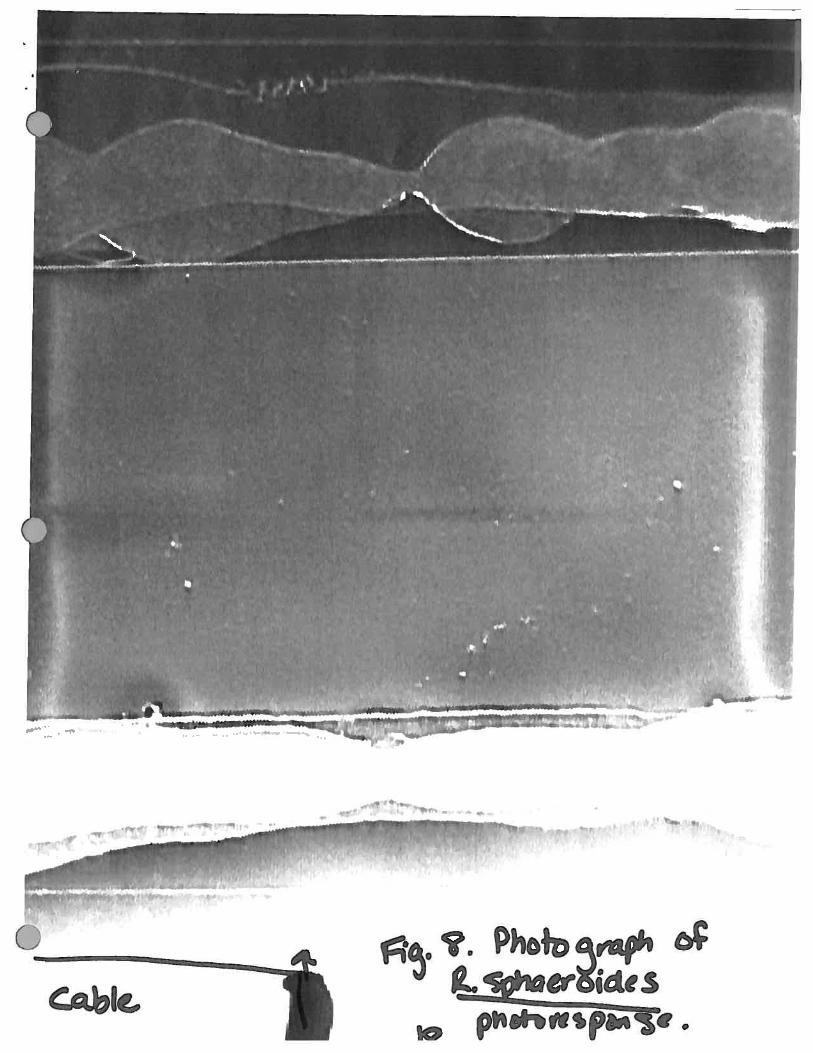
the sample chamber and analyzed for a photoresponse. Figure 7 illustrates that there was a steadydecrease in the light intensity within the beam. This indicates that there was a corresponding decreasein the number of bacteria present within the path. When the sample chamber was visually inspected,it was noted that the cells had actually cleared an area corresponding to the path that the light pathfollowed through the sample (Figure 8).
Rhodospirillum centenum - Swarm Plate Grown Cells
Swarm plates of R. centenum were set up as described in the Material and Methods. Once thecells had begun to swarm towards the halogen light, they were tested for the presence of lateral
flagella. If lateral flagella production had been induced in the cells by the presence of the agar in themedium (Ragatz et al., 1995), a small amount of cells from the front, moving portion of the swarmcolony were picked and resuspended in sterile deionized water. The suspension was placed withinthe sample chamber and were adapted to the new environment for 5 minutes under constant lightillumination. By allowing the cells to adapt for 5 minutes they are able to swim in the less viscousenvironment of water versus 0.8% agar and assays of movement are best completed within 15minutes from the time the cells were diluted in water (Carl Bauer, personal communication).
To ensure that the cells maintained their lateral flagella during the time course for the
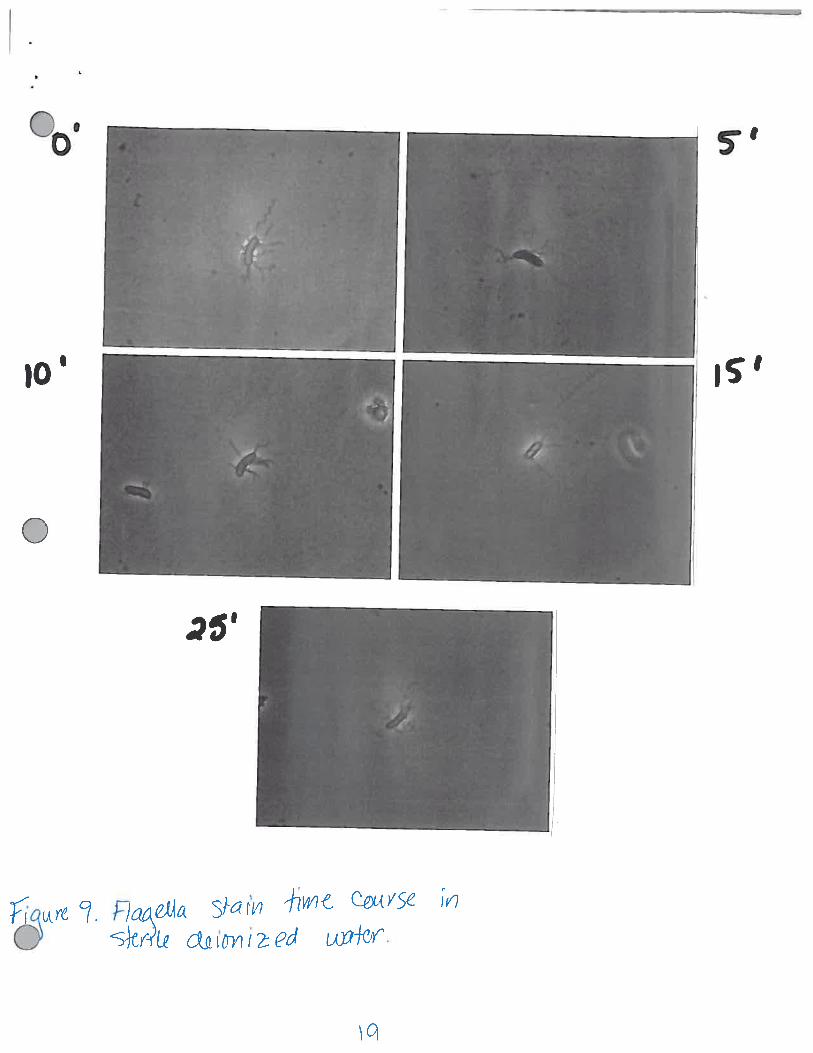
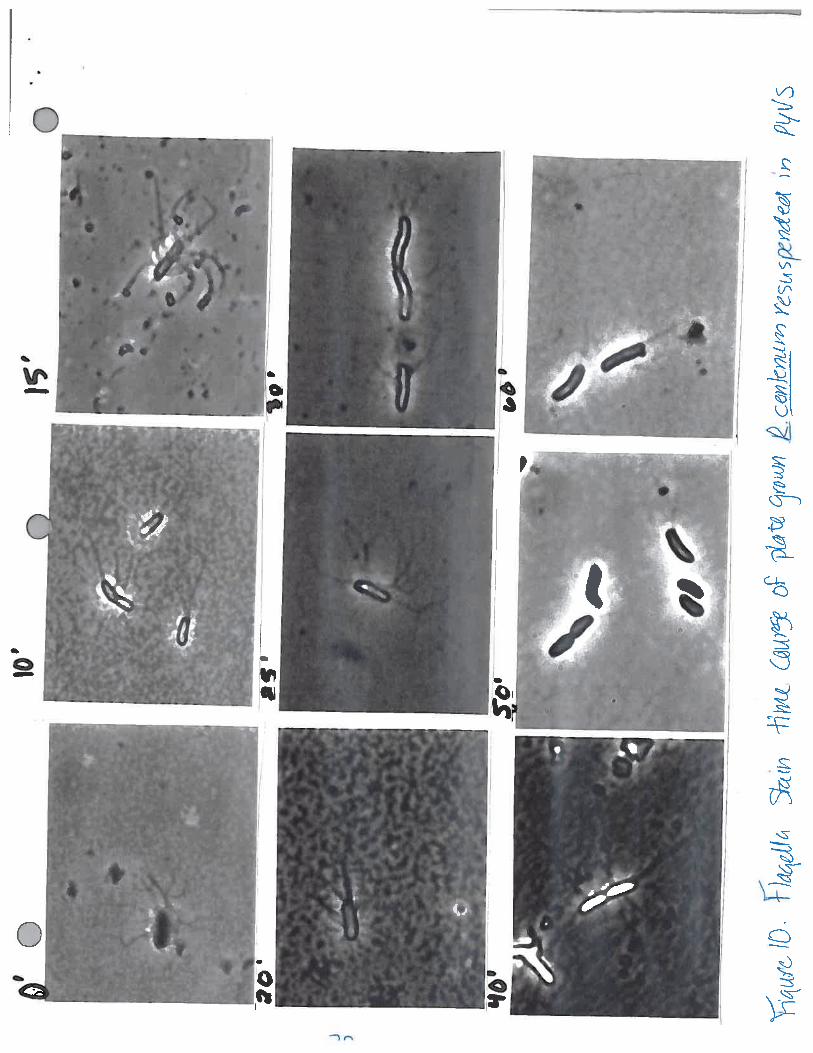
photoresponse, aliquots were taken of the remaining aliquot of resuspended cells every 5 minutes for25 minutes (the time course observed was 15 minutes in duration) and flagella stained (Figure 9).The cells did not shed within this time. Out of curiosity, a separate time course was performed todetermine when the cells actually dropped their lateral flagella (Figure 10). The cells in this time
course were resuspended in PYVS medium and it was noted that the lateral flagella were intact on thecells up to the 40 minute time point. Between the 40 and 50 minute time points, the cells lost theirlateral flagella and only cells with either a single polar flagellum or no flagella could be found on the
slide.
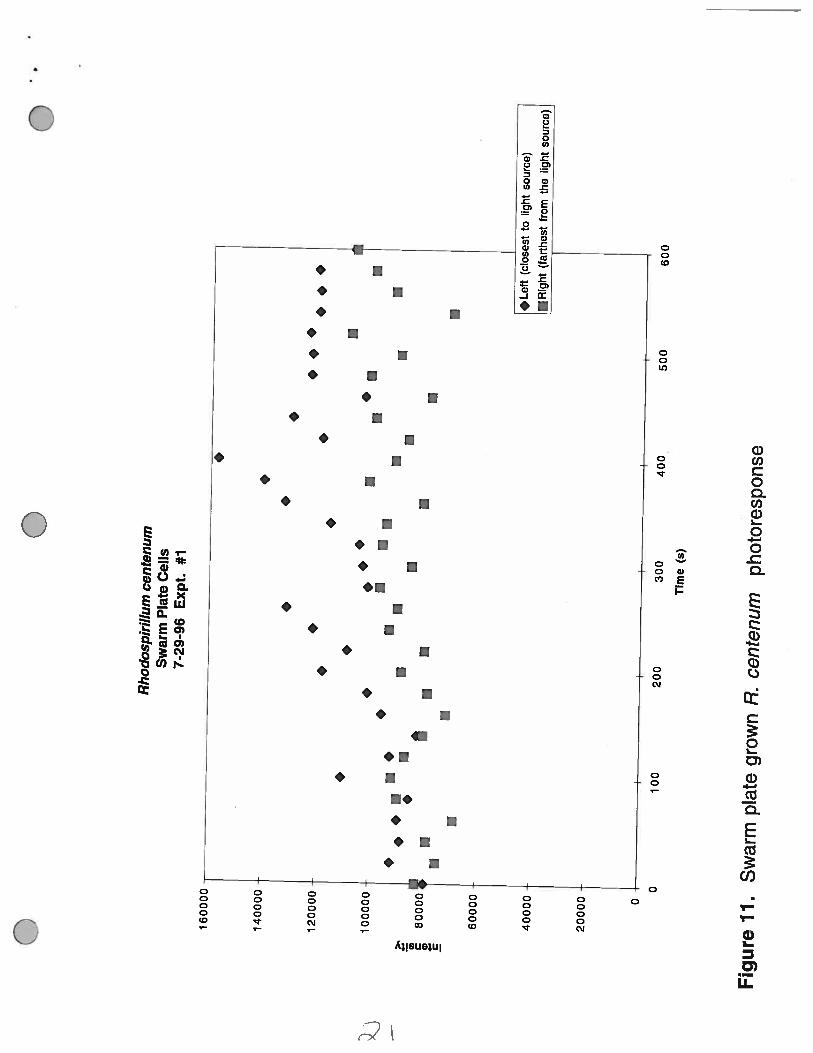
The microscopic photoresponse assay of these cells indicates that the cells neither accumulatedwithin the light path nor those present in the light beam migrate toward the light source (Figure 11).
7.’
M. J. Sackett
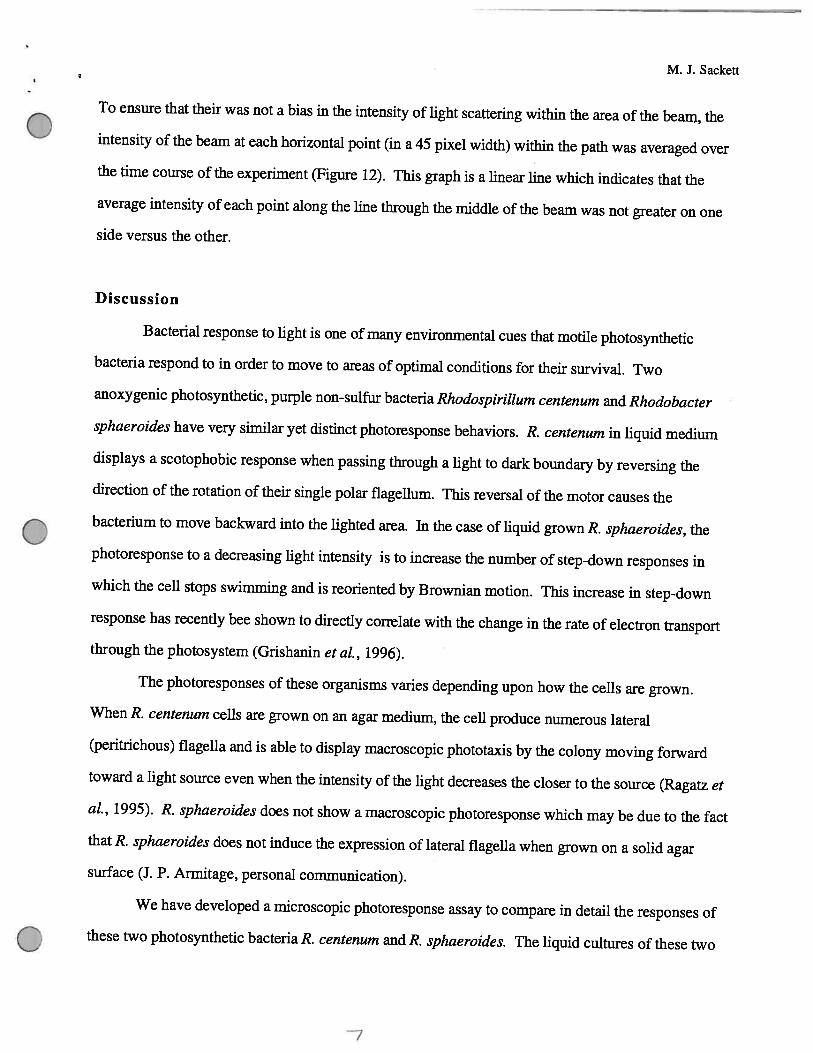
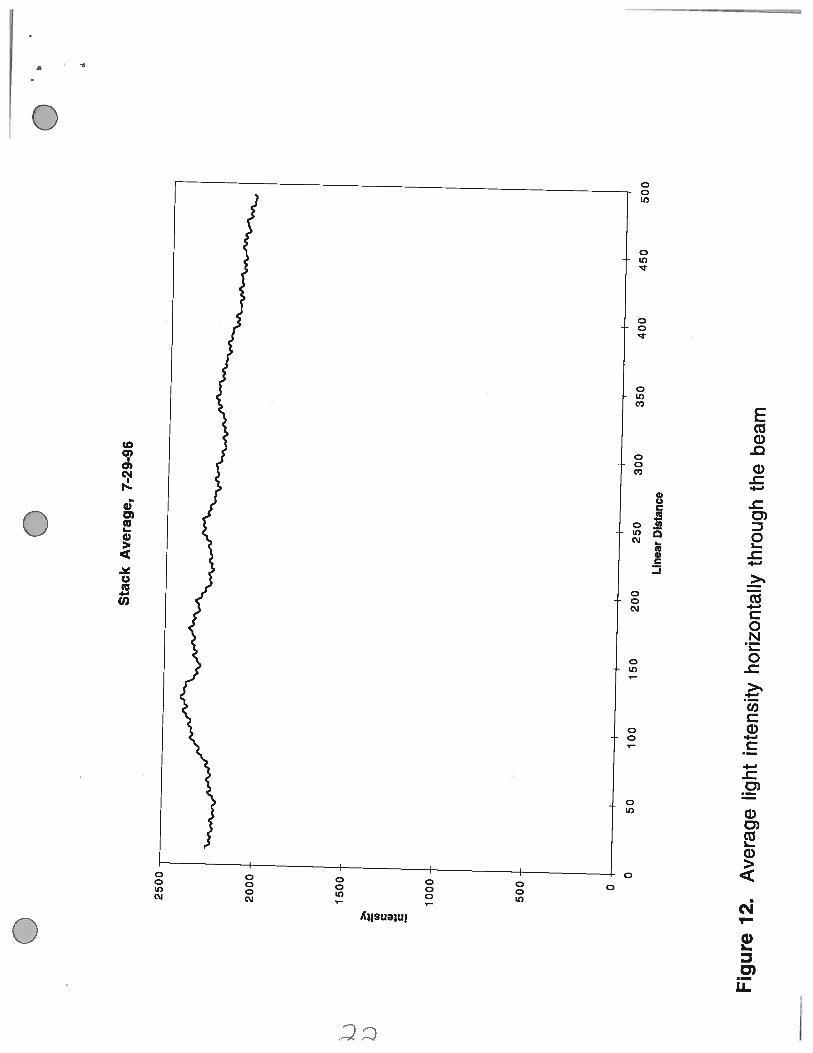
To ensure that their was not a bias in the intensity of light scattering within the area of the beam, theintensity of the beam at each horizontal point (in a 45 pixel width) within the path was averaged over
the time course of the experiment (Figure 12). This graph is a linear line which indicates that the
average intensity of each point along the line through the middle of the beam was not greater on one
side versus the other.
Discussion
Bacterial response to light is one of many environmental cues that motile photosynthetic
bacteria respond to in order to move to areas of optimal conditions for their survival. Two
anoxygenic photosynthetic, purple non-sulfur bacteria Rhodospirillum centenum and Rhodobacter
sphaeroides have very similar yet distinct photoresponse behaviors. R. centenum in liquid medium
displays a scotophobic response when passing through a light to dark boundary by reversing the
direction of the rotation of their single polar flagellum. This reversal of the motor causes the
bacterium to move backward into the lighted area. lii the case of liquid grown R. sphaeroides, the
photoresponse to a decreasing light intensity is to increase the number of step-down responses in
which the cell stops swimming and is reoriented by Brownian motion. This increase in step-down
response has recently bee shown to directly conelate with the change in the rate of electron transport
through the photosystem (Grishanin et al., 1996).
The photoresponses of these organisms varies depending upon how the cells are grown.
When R. centenum cells are grown on an agar medium, the cell produce numerous lateral
(peritrichous) flagella and is able to display macroscopic phototaxis by the colony moving forward
toward a light source even when the intensity of the light decreases the closer to the source (Ragatz et
al., 1995). R. sphaeroides does not show a macroscopic photoresponse which may be due to the fact
that R. sphaeroides does not induce the expression of lateral flagella when grown on a solid agar
surface (3. P. Annitage, personal communication).
We have developed a microscopic photoresponse assay to compare in detail the responses of
these two photosynthetic bacteria R. centenum and R. sphaeroides. The liquid cultures of these two
—7
M. J. Sackett
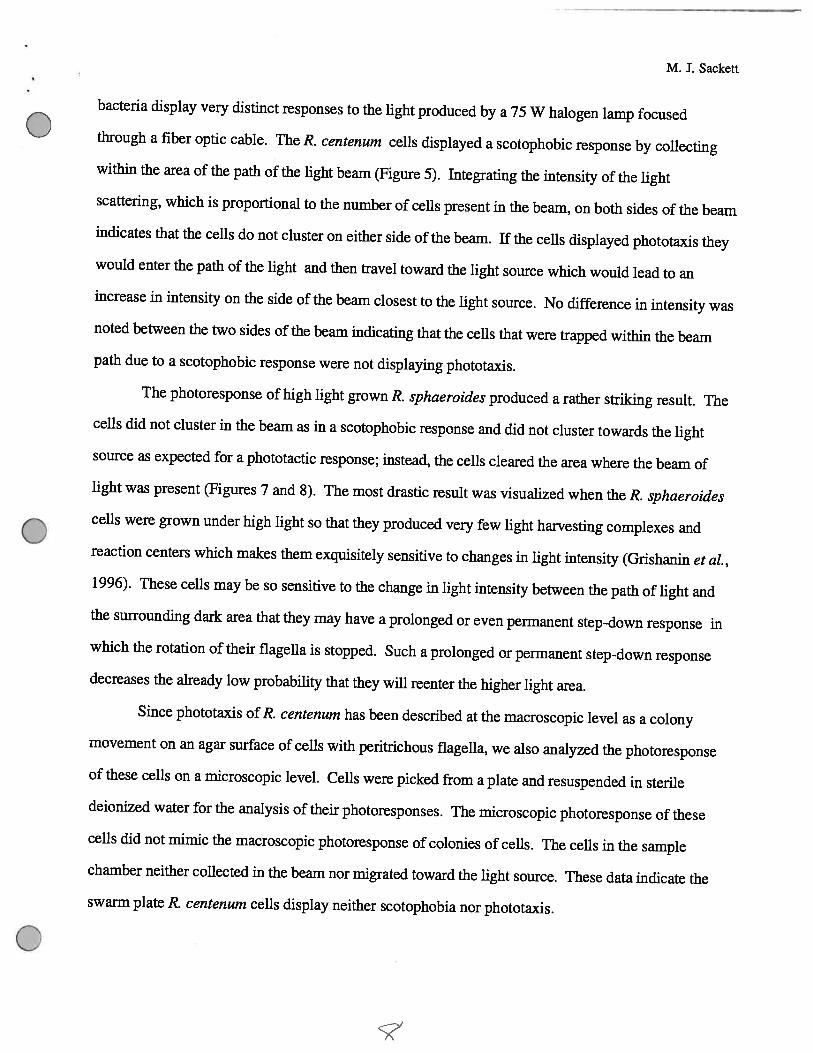
bacteria display very distinct responses to the light produced by a 75 W halogen lamp focused
through a fiber optic cable. The R. centenum cells displayed a scotophobic response by collecting
within the area of the path of the light beam (Figure 5). Integrating the intensity of the light
scattering, which is proportional to the number of cells present in the beam, on both sides of the beamindicates that the cells do not cluster on either side of the beam. If the cells displayed phototaxis they
would enter the path of the light and then travel toward the light source which would lead to an
increase in intensity on the side of the beam closest to the light source. No difference in intensity was
noted between the two sides of the beam indicating that the cells that were trapped within the beam
path due to a scotophobic response were not displaying phototaxis.
The photoresponse of high light grown R. sphaeroides produced a rather striking result. The
cells did not cluster in the beam as in a scotophobic response and did not cluster towards the light
source as expected for a phototactic response; instead, the cells cleared the area where the beam of
light was present (Figures 7 and 8). The most drastic result was visualized when the R. sphaeroides
cells were grown under high light so that they produced very few light harvesting complexes and
reaction centers which makes them exquisitely sensitive to changes in light intensity (Grishanin et aL,
1996). These cells may be so sensitive to the change in light intensity between the path of light and
the surrounding dark area that they may have a prolonged or even permanent step-down response in
which the rotation of their flagella is stopped. Such a prolonged or permanent step-down response
decreases the already low probability that they will reenter the higher light area.
Since phototaxis of R. centenum has been described at the macroscopic level as a colony
movement on an agar surface of cells with peritrichous flagella, we also analyzed the photoresponse
of these cells on a microscopic level. Cells were picked from a plate and resuspended in sterile
deionized water for the analysis of their photoresponses. The microscopic photoresponse of these
cells did not mimic the macroscopic photoresponse of colonies of cells. The cells in the sample
chamber neither collected in the beam nor migrated toward the light source. These data indicate the
swarm plate R. centenum cells display neither scotophobia nor phototaxis.
M. 3. Sackett
A flagella staining time course was performed simultaneously to the microscopic
photoresponse assay to ensure that plate grown R. centenum cells retained their lateral flagella and theloss of flagella was not the reason for the lack of a photoresponse in these cells (Figure 9). The cellsretained their lateral and poiar flagella throughout the time course of the experiment and beyond. In
order to determine at which point the cells dropped their lateral flagella, a longer time course was
performed by resuspending the cells in PYVS medium and taking aliquots and flagella staining atspecific time points from zero to 60 minutes (Figure 10). Between the 40 and 50 minute time points,
the cells shed all of their flagella except for the single polar flagellum indicating that the adaptation
period for the solid surface swimming state to the state with only the polar flagellum occurs after 40
minutes of resuspension in liquid medium. Thus, a loss of flagellum cannot be attributed to the loss
of photoresponse of plate grown cells.
Acknowledgments
I would like to thank Tom Pitta and Judith Armitage for their guidance, collaboration and
encouragement on this project. I would also like to thank Ed Leadbetter and Abigail Salyers for their
success in directing the Microbial Diversity Course. Deepest gratitude is also extended to Zeiss and
Universal Imaging Corp. for the donation of equipment for the course and for this project. M.J.S.
was funded by the Office of Naval Research (grant 3N000014-95-1-0463), Sear Crowell Fellowship
and the Department of Biology, Indiana University, Bloomington, IN.
M. 3. Sackett
Figure Legends
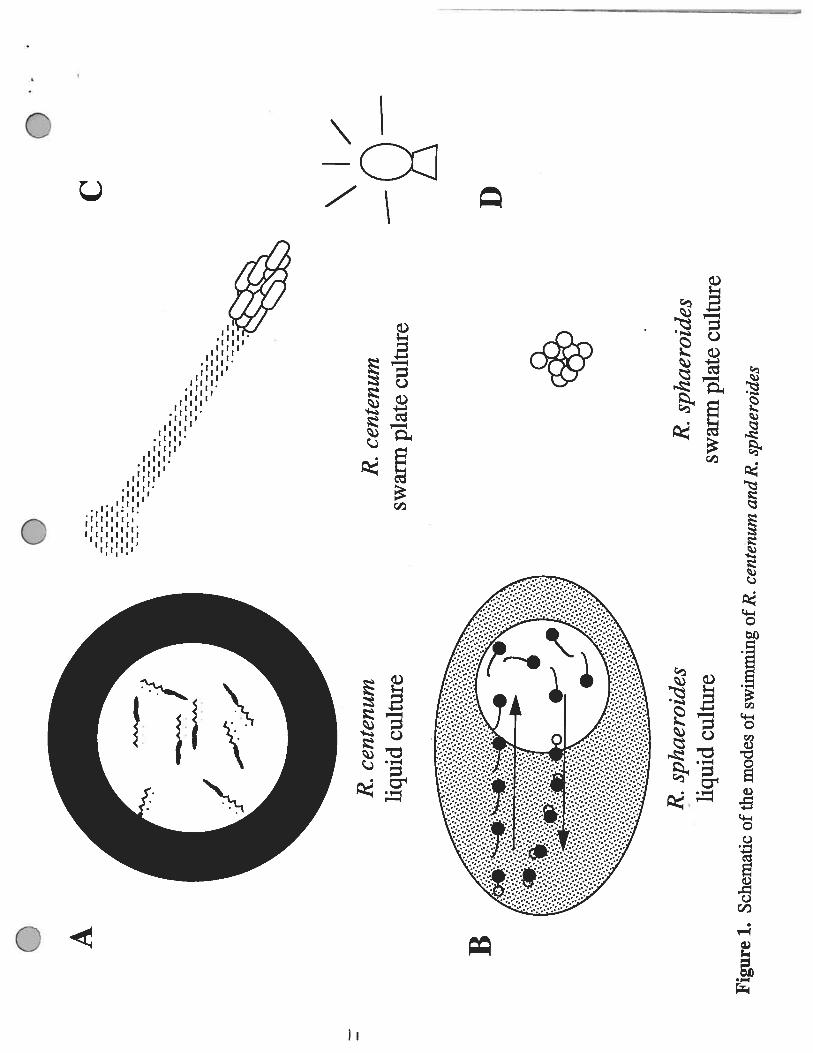
Figure 1. Schematic of the modes of swimming of R. centenum and R. sphaeroides. A) Liquidgrown R. centenum displays a scotophobic response when passing through a light to dark boundaryby reversing the rotation of its flagellum so that the cell reenters the lighted area. B) Liquid grownR. sphaeroides displays a step-down response when passing into an area of decreased light intensity.The flagellum stops rotating and curls up next to the cell. The non-swimming cell is then reorientedby Brownian motion before the flagellum begins to rotate again. C) Agar plate grown R. centenumcells induce the production of numerous lateral flagella in addition to the polar flagellum. Colonies ofthese cells are able to display phototaxis toward or away from sources of light depending upon thewavelength of light. D) Agar plate grown R. sphaeroides colonies do not respond to any type oflight source.
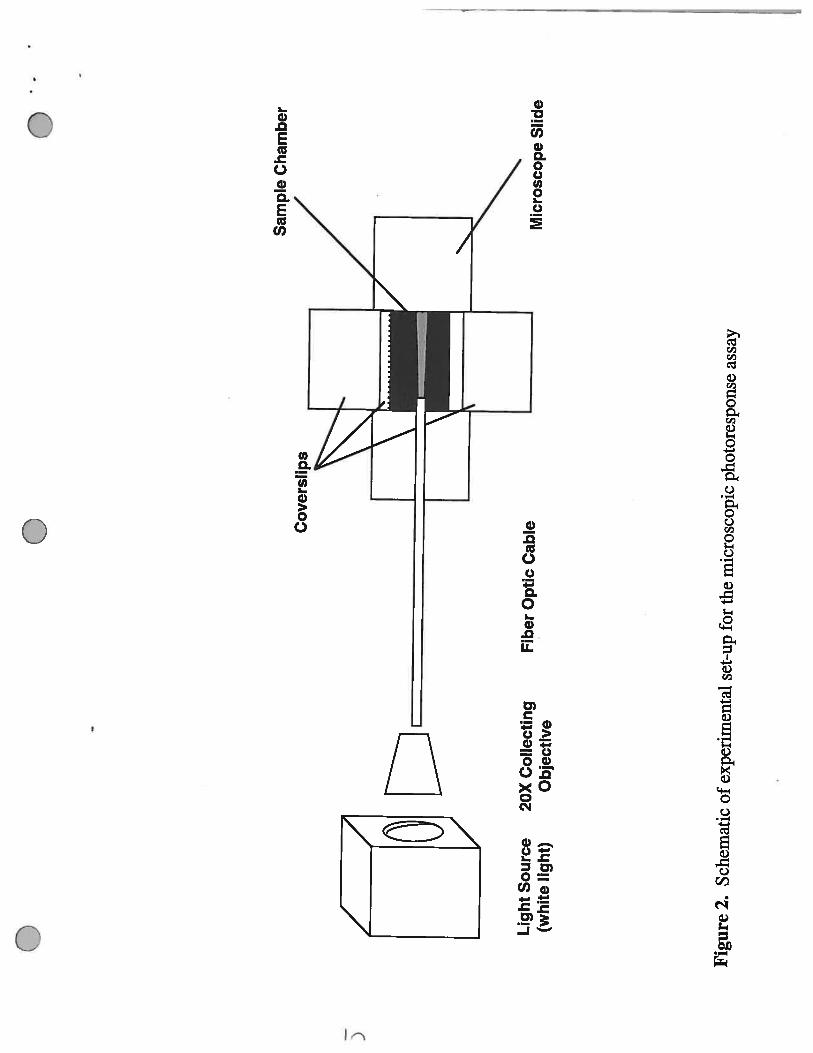
Figure 2. Schematic of the experimental set-up for the microscopic photoresponse assay. Whitelight from a 75 W halogen lamp is collected through a 20X objective prior to passing through a fiberoptic cable. The opposite end of the fiber optic cable is placed into the sample chamber where thebacteria for analysis are present. The resulting light beam is perpendicular to the intensifier and CCDcamera (not shown) which detect the light that is scattered upward by bacteria within the light beam.
Figure 3. Bright field image of the end of the fiber optic cable within the sample chamber. Thecylinder in the end of the fiber optic cable within the sample chamber that was first filled with liquidgrown R. centenum.
Figure 4. Recorded image of light scattering. Upward light scattering produced by bacteria presentwithin the horizontal beam of light as detected by CCD camera with intensifier.
Figure 5. Series of images over 1 minute of collection of R. centenum in the path of the light beam.Serial images of the average of 30 frames of 16-bit images every 5 seconds from zero to 60 seconds.
Figure 6. Liquid grown R. centenum photoresponse. The intensity of the light scattering producedby the collection of R. centenum. Intensity was calculated for each end of the beam within the fieldof the image.
Figure 7. Liquid grown R. sphaeroides photoresponse. The intensity of the light scatteringproduced by the presence of R. sphaeroides on either side of the beam within the field of the image.
Figure 8. Photograph of the photoresponse of R. sphaeroides. Photograph of the clearing of R.sphaeroides within 20 minutes from the path of the beam of light. The black mark indicates the endof the fiber optic cable with the zone of clearing immediately above it and extending nearly to the endof the sample chamber.
Figure 9. Flagella stain in sterile deionized water. Flagella were stained at 5 minutes time pointsfor 25 minutes. The lateral flagella were not shed within this time frame.
Figure 10. Flagella stain in PYVS. Time course to determine at which point the cells shed theirlateral flagella.
Figure 11. Swarm plate (0.8% agar) grown R. centenum photoresponse. The intensity of the lightscattering produced by R. centenum present within the path of the light beam.
Figure 12. Average light intensity horizontally through the beam. The intensity horizontally acrossthe beam was averaged and plotted.
C A B
C
/R
.ce
nten
umliq
uid
cultu
reR
.ce
nten
umsw
arm
plat
ecu
lture
R.
spha
eroi
des
swar
mpl
ate
cultu
re
D
R.
spha
eroi
des
liqu
idcu
lture
Fig
ure
1.Sc
hem
atic
ofth
em
odes
ofsw
imm
ing
ofR
.ce
nten
uman
dR
.sp
haer
oide
s
__/ 0 /
Lig
htS
ourc
e(w
hite
ligh
t)20
XC
olle
ctin
gO
bjec
tive
Mic
rosc
ope
Sli
de
00
0
Cover
slip
sC
ham
ber
Fib
erO
ptic
Cab
le
Fig
ure
2.Sc
hem
atic
ofex
peri
men
tal
set-
upfo
rth
em
icro
scop
icph
otor
espo
nse
assa
y
F
‘1i
F”
00
0•
I,
0
Sts
0ç114
311+
SGIH
frUU
)M4h
CS
Oc-
k$FI
;4’
km*m
O•
(.6tc
.k5.
0
7-1
8-9
6A
R.
cent
enum
Liq
uid
140000
aa .1
aIa
a1
20
00
0S1
aa
•a
•a
100000
-
s1
a•
••a
ae
•‘•
80
00
0aI
0a
a)
60
00
0
a40000
•Left
(clo
sest
tolig
htso
urc
e)
aR
ight
(far
thes
tfr
om20000
light
sour
ce)
0
050
10
0150
20
02
50
300
Tim
e(s
ec)
Fig
ure
6.L
iqui
dgr
own
A.
cent
enum
phot
ores
pons
e
0
Rhodobac
tersp
hae
roid
esL
iqui
d7-1
8-9
6
200000
•Left
(clo
sest
tolig
ht)
•Rig
ht
(far
thes
tfr
omli
ghJ
18
00
00
••
•.
•.
••
•1
60
00
0
••
•.
>,.
.14
O0
O0
ii•
••
S
•5B
120000--
BS
SS
IS
S1
00
00
0
80000
II
I0
50
10
0150
200
25
0300
350
400
Tim
e(s
)
Fig
ure
7.L
iqui
dgr
own
R.
spha
eroi
des
photo
resp
onse
0I
Q(,Rk’Q4QL(d
1.alL
q’
-
I”.”
00e ci
ic’
25’
31a cv5e 1v7
/0.
(r
a PyVs
00
0
Rhodosp
iril
lum
cente
num
Sw
arm
Pla
teC
ells
7-29
-96
Exp
t.#1
160000
140000
120000--
100000
.S
I
aa
S.
Sa
.a
a80000
Ia
a
60000
•Left
(clo
sest
toU
ght
sour
ce)
40000
5R
ight
(far
thes
tfr
omth
elig
htso
urce
)
20000 0
I0
100
200
300
400
500
600
Tim
e(s
)
Fig
ure
11.
Sw
arm
plat
egr
own
R.
cent
enum
photo
resp
onse
00
0
Sta
ckA
ver
age,
7-29
-96
2500
2000
1500
4- U,
S a) S
1000
-
500 0
II
050
100
150
200
250
300
350
400
450
500
Lin
ear
Dis
tance
Fig
ure
12.
Ave
rage
light
inte
nsit
yho
rizo
ntal
lyth
roug
hth
ebe
am
M. J. Sackett-. e
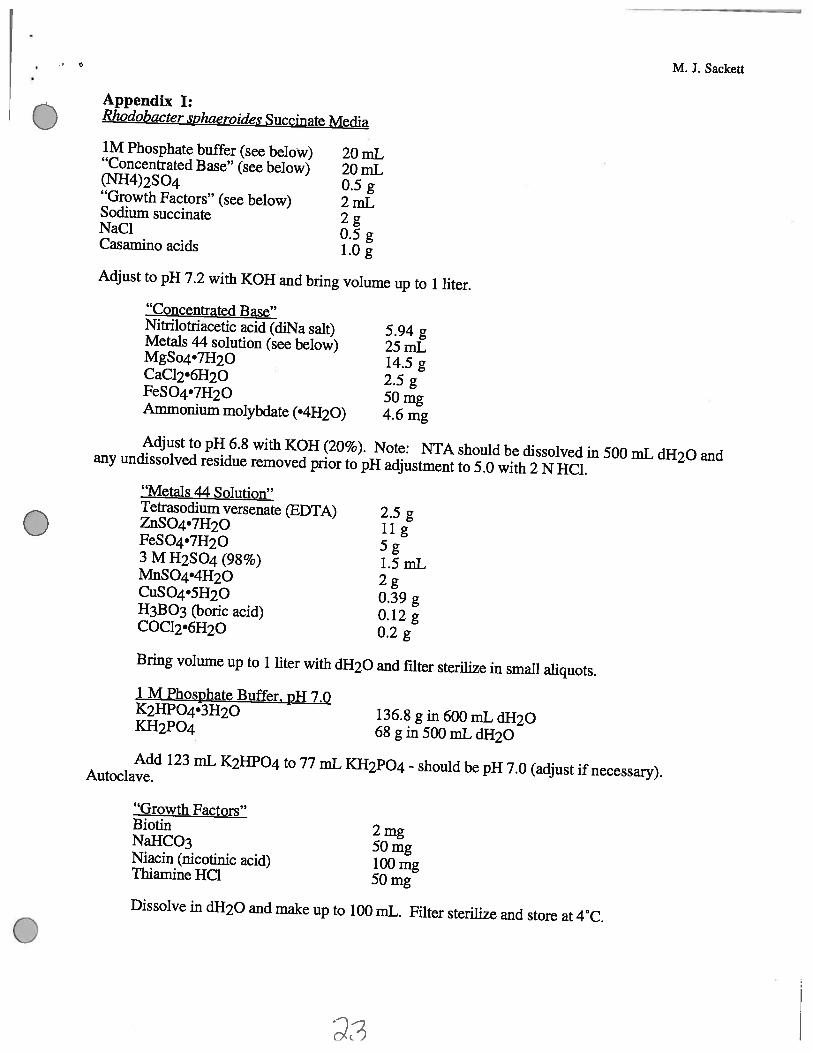
Appendix I:Rhodobacter sphaeroides Succinate Media
1M Phosphate buffer (see below) 20 mL“Concentrated Base” (see below) 20 mL(NH4)2S04 0.5 g“Growth Factors” (see below) 2 mLSodium succinate 2 gNaC1 0.5 gCasamino acids 1.0 g
Adjust to pH 7.2 with KOH and bring volume up to 1 liter.
“Concentrated Base”Nitrilotriacetic acid (diNa salt) 5.94 gMetals 44 solution (see below) 25 mLMgSo4’7H20 14.5 gCaC12•6H20 2.5 gFeSO4•7H20 50 mgAmmonium molybdate (•4H20) 4.6 mg
Adjust to pH 6.8 with KOH (20%). Note: NTA should be dissolved in 500 mL dH2O andany undissolved residue removed prior to pH adjustment to 5.0 with 2 N HC1.“Metals 44 Solution”Tetrasodium versenate (EDTA) 2.5 gZnSO4•7H20 11 gFeSO4•7H20 5 g3MH2S04(98%) l.5mLMnSO4•4H20 2 gCuSO4•5H20 0.39 gH3B03 (boric acid) 0.12 gCOC12•6H20 0.2 g
Bring volume up to 1 liter with dH2O and filter sterilize in small aliquots.
1 M Phosphate Buffer. pH 7.0K2HPO4•3H20 136.8 g in 600 mL dH2OKH2PO4 68 g in 500 mL dH2O
Add 123 mL K2HPO4 to 77 mL KH2PO4 - should be pH 7.0 (adjust if necessary).Autoclave.
“Growth Factors”Biotin 2mgNaHCO3 50 mgNiacin (nicotinic acid) 100 mgThiamine HCJ 50 mg
Dissolve in dH2O and make up to 100 mL. Filter sterilize and store at 4°C.

M. J. Sackett
Literature Cited
Armitage, J.P., Ingham, C. and M. C. W. Evans (1985). Role of Proton Motive Force inPhototactic and Aerotactic Responses of Rhodopseudomonas sphaeroides. J. Bacteriol. 161: 967-972.
Armitage, I. P., Kelly, D. J. and R. E. Sockett (1995). Flagellate Motility, Behavioral Responsesand Active Transport in Purple Non-Sulfur Bacteria, pp. 1005-1028, In Blankenship, R. B.,Madigan, M. T. and C. E. Bauer (eds.): Anoxygenic Photosynthetic Bacteria. Kluwer AcademicPublishers, The Netherlands.
Armitage, J. P. and R. M. Macnab (1987). Unidirectional Intermittent Rotation of the Flagellum ofRhodobacter sphaeroides. J. Bacteriol. 169: 5 14-518.Engelmann, T. W. (1883). Bacterium photometricum. Bin Beitrag zur vergleichenden Physiologiedes Licht- und Farbensinnes. Arch. Gesam. Physiol. Mensch Tiere 30: 95-124.Favinger, 3., Stadtwald, R. and H. Gest (1989). Rhodospirillum centenum, sp. nov., aThermotolerant Cyst-Forming Anoxygenic Photosynthetic Bacterium. Antonie van Leeuwenhoek55: 29 1-296.
Grishanin, R., Gauden, D. M. and 3. P. Armitage (1996). Role of Electron Transport in thePhotoresponse of Rhodobacter sphaeroides. J. Bacteriol., in press.Häder, D.-P. (1987). Photosensory Behavior in Procaryotes. Microbiol. Rev. 51: 1-21.Packer, H. L., Gauden, D. E. and 3. P. Armitage. (1996). The Behavioural Response of AnaerobicRhodobacter sphaeroides to Temporal Stimuli. Microbiology 142: 593-599.Ragatz, L., Jiang, Z.-Y., Bauer, C. and H. Gest (1994). Phototactic Purple Bacteria. Nature 370:104.
Ragatz, L., Jiang, Z.-Y., Bauer, C. and H. Gest (1995). Macroscopic Phototactic Behavior of thePurple Photosynthetic Bacterium Rhodospirillum centenum. Arch Microbiol. 163: 1-6.
cJ