mapping of the microrelief structures using topographic...
TRANSCRIPT
Acta Geobalcanica, 4-1, 2018, 25-31
25
MAPPING OF THE MICRORELIEF STRUCTURES USING
TOPOGRAPHIC DATA
DOI: https://doi.org/10.18509/AGB.2018.03
UDK: 528.93.06(470)
Evgeny Panidi1, Lubov Trofimetz
2, Julia Sokolova
1, Elena Kunaeva
1, 3
1 Saint Petersburg State University, Russia;
2 Orel State University, Russia
3 Pushkin Leningrad State University, Russia
Corresponding author: [email protected], [email protected]
Submitted: January 2017, Accepted: May 2017, Published: October 2017
Abstract
The paper describes case study, which we conducted using test area located in Central European Russia
(Orel region, Suhaya Orlitsa river basin). The archived topographic (cartographic) data, data of topo-
graphic survey and satellite imagery were used as study materials. We have estimated the accuracies
and limits of microrelief interpretation basing on the cartographic and survey materials. Derivative
geomorphometric maps were used as enabling tool for interpretation of the microrelief strictures. Very
high resolution space satellite imagery were used as reference data.
Key words: Microrelief Mapping, Accuracy Estimation, Geomorphometry, Very High Resolution
Space Satellite Imagery
Introduction
Our study is devoted to the investigation
of techniques applicable for mapping mi-
crorelief structures (structures with the
transverse size up to the first tens of me-
ters), which are most hardly interpretable
and most changeable in time/space. Mi-
crorelief mapping is demanded in such
domains as precision agriculture, meliora-
tion and recultivation, ecological hazard
assessment, etc. However, the task of in-
terpretation of the microrelief structures
remains time consuming and difficult for
automation.
Direct allocation and survey of such small
landforms is effective but inconvenient on
large areas. Remote sensing techniques
and data (e.g., very high resolution satel-
lite imagery, aerial photography, laser
scanning) being highly automated remains
hardly suitable for vegetated areas. Also,
the general purpose large-scale topog-
raphic data (topographic maps and survey
materials) being unspecialized microrelief
data sources produce some specific inter-
pretation errors and need to be processed
and utilized correctly. In this paper, we
describe some results of erosional struc-
tures interpretation and mapping using
topographic (cartographic) data and topog-
raphic survey.
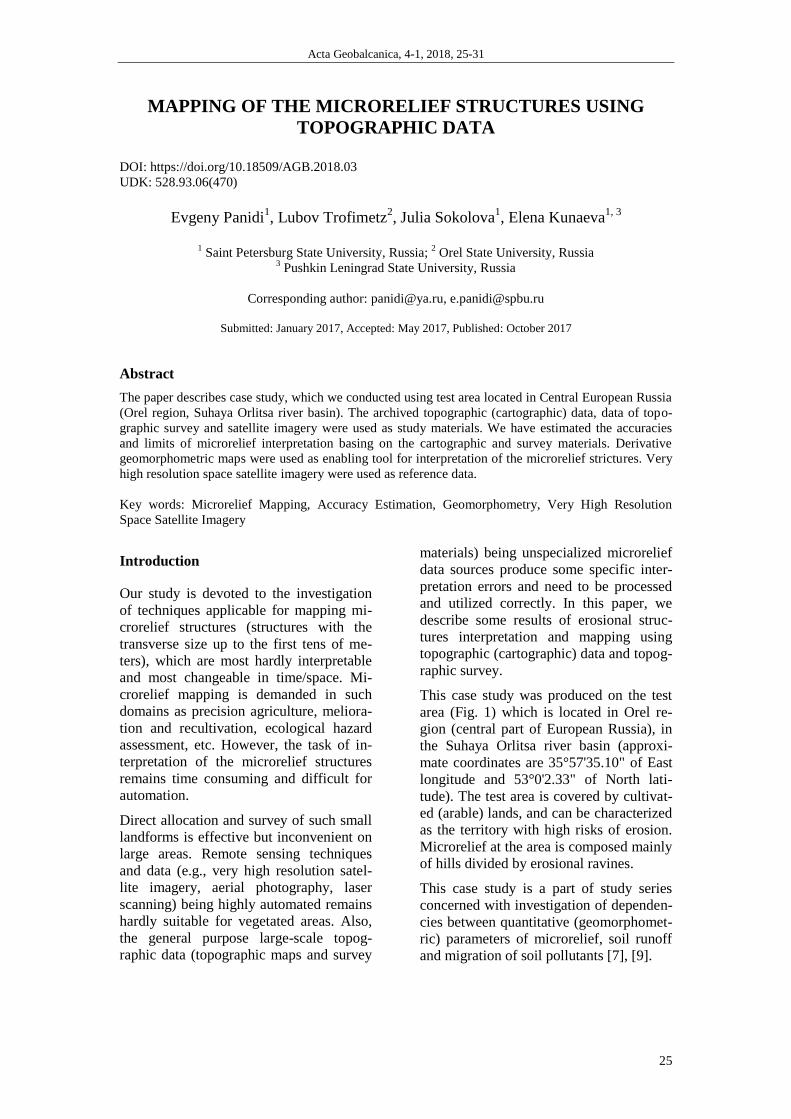
This case study was produced on the test
area (Fig. 1) which is located in Orel re-
gion (central part of European Russia), in
the Suhaya Orlitsa river basin (approxi-
mate coordinates are 35°57'35.10" of East
longitude and 53°0'2.33" of North lati-
tude). The test area is covered by cultivat-
ed (arable) lands, and can be characterized
as the territory with high risks of erosion.
Microrelief at the area is composed mainly
of hills divided by erosional ravines.
This case study is a part of study series
concerned with investigation of dependen-
cies between quantitative (geomorphomet-
ric) parameters of microrelief, soil runoff
and migration of soil pollutants [7], [9].
Evgeny Panidi, Lubov Trofimetz, Julia Sokolova, Elena Kunaeva, Mapping of the microrelief structures using……
26
Figure 1: Satellite image of the test area collected on May 19, 2012,
image courtesy of the DigitalGlobe Foundation
Used approach and data
Most models of soil runoff and redistribu-
tion use relief data to estimate impact of
erosional network [7], [8], [9]. At the
microrelief scale, erosional network is
composed of ancient ravines (eroded land-
forms, which are easily interpreted on
maps) and modern streams (young ero-
sional landforms, which are hard for inter-
pretation because of absence of the eroded
ravine) [7], [9]. While modern streams
produce significant erosional impact [9],
the issue of interpretation of these erosion-
al structures has great value when model-
ing at large scale.
In many cases, ancient ravines appear
“continued” by modern streams in upper
parts (Fig. 2). These upper parts are hardly
interpretable on topographic maps of
1:10000 scale, which are widely used in
land management. The catchment area [1]
maps are used to estimate locations of
modern streams. However, modern
streams are not coincide with the thalwegs
of ancient ravines in many cases. It leads
to the incorrect representation of the
streams on catchment area maps at large
scale, which is amplified by the errors in
relief representation on initial topographic
maps.

Acta Geobalcanica, 4-1, 2018, 25-31
27
Figure 2: Modern stream can be allocated visually in different seasons, in the autumn (left image) and
in the summer (right image) during the active vegetation growth
All mentioned features lead to the need of
ground control and estimation of correct-
ness and accuracy of the erosional network
representation on large-scale catchment
area maps. Such a ground control can be
provided through the field survey or
through the use of highly detailed remote
sensing data (aerial photography or satel-
lite imagery). Also, the comparison of
topographic data produced at different
scales can be helpful for estimation of
scale impact onto the completeness of ero-
sional network interpretation.
Initial Data: We used two topographic
datasets to estimate interpretability of the
modern streams and its relative accuracy.
The first dataset is the topographic map of
1:10000 scale, and the second is the topo-
graphic survey data of 1:500 scale. Both
datasets were used to extract Digital Ele-
vation Models (DEMs) and to produce
derivative geomorphometric maps (name-
ly, catchment area maps are discussed in
this paper). Additionally, we apply the
WorldView-1 very high resolution (0.5
m/pix) satellite image of our test area (Fig.
1) as a referential dataset, to ensure visual
interpretation and verification of the mod-
ern stream positions. As we recognized
before, very high resolution satellite im-
agery collected in the spring (before the
active vegetation growth) can show clearly
the erosional network composed of mod-
ern streams [5], [6].
Software: We used the ESRI ArcGIS and
SAGA software. The ArcGIS was used
mostly as the data preparation and data
aggregation tool, DEMs were extracted in
ArcGIS also. SAGA was used to extract
geomorphometric maps.
DEM extraction parameters. As the test
area has the hilly plain relief, the Spline
tool was applied to interpolate DEMs in
ArcGIS, despite the presence more com-
plex Topo to Raster tool that needs more
parametrization for correct modeling [3].
The tool was parametrized to use spline
with tension [4] in the computations, and
the weight parameter was appointed as 0
to ensure Thin Plate Spline interpolation
[2].
Catchment area maps extraction: The
DEMON algorithm [1] was used to pro-
duce catchment area maps from the DEM
data in SAGA.
Interpretation techniques: We used
manual (visual) technique to interpret ero-
sional microrelief structures. The interpre-
tation was conducted separately using
1:10000 topography data, 1:10000 and
1:500 catchment area maps, and satellite
image. This technique made it possible to
provide comparative estimation of ero-
sional structures interpretability.
Results
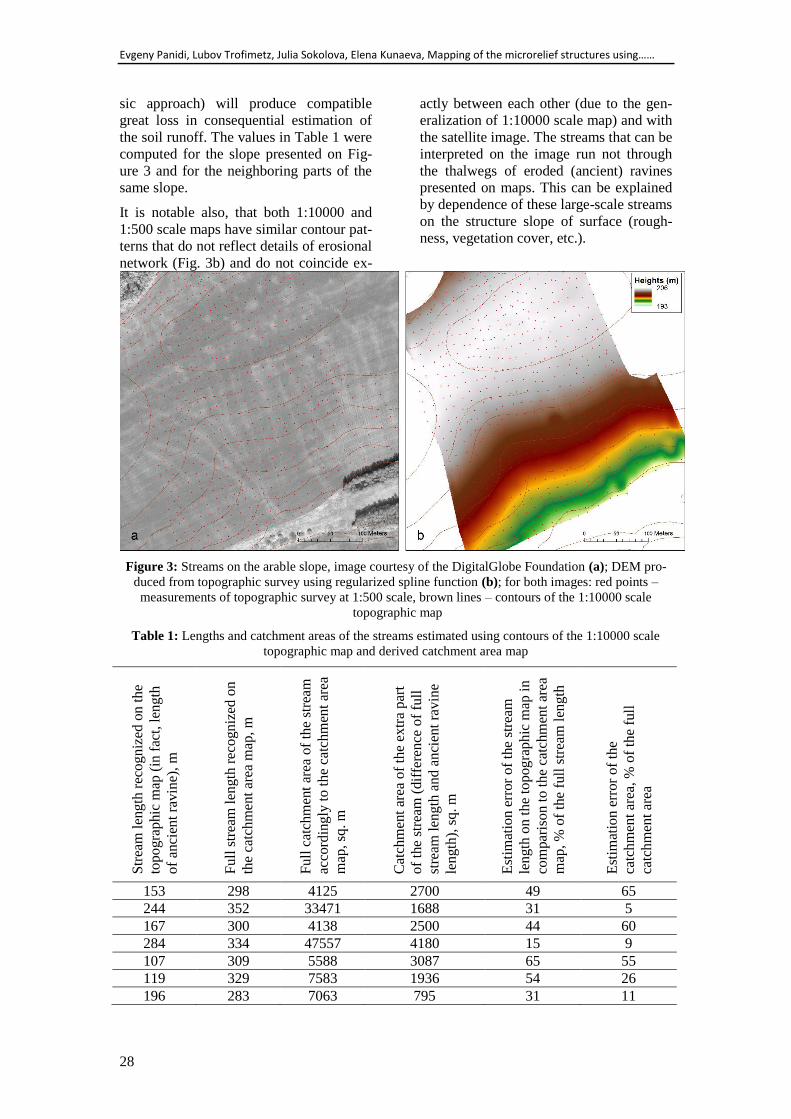
Comparison of used datasets show clearly
that use of topographic map contours at
different scales and satellite image pro-
duce different results of visual interpreta-
tion of the streams (streamlines) (Fig. 3).
Topographic contours itself allow to inter-
pret only main streamlines with great loss
in lengths and catchment areas (Table 1).
Loss in catchment area estimation based
on the topographic contours (that is a clas-
Evgeny Panidi, Lubov Trofimetz, Julia Sokolova, Elena Kunaeva, Mapping of the microrelief structures using……
28
sic approach) will produce compatible
great loss in consequential estimation of
the soil runoff. The values in Table 1 were
computed for the slope presented on Fig-
ure 3 and for the neighboring parts of the
same slope.
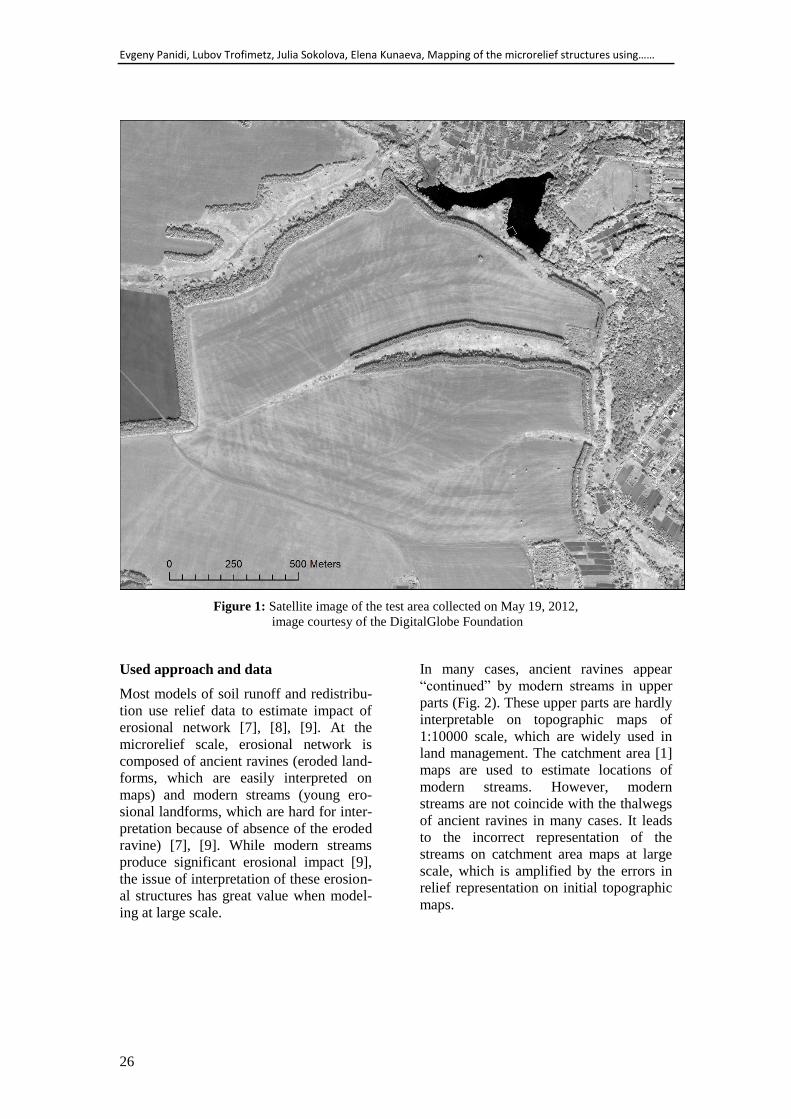
It is notable also, that both 1:10000 and
1:500 scale maps have similar contour pat-
terns that do not reflect details of erosional
network (Fig. 3b) and do not coincide ex-
actly between each other (due to the gen-
eralization of 1:10000 scale map) and with
the satellite image. The streams that can be
interpreted on the image run not through
the thalwegs of eroded (ancient) ravines
presented on maps. This can be explained
by dependence of these large-scale streams
on the structure slope of surface (rough-
ness, vegetation cover, etc.).
Figure 3: Streams on the arable slope, image courtesy of the DigitalGlobe Foundation (a); DEM pro-
duced from topographic survey using regularized spline function (b); for both images: red points –
measurements of topographic survey at 1:500 scale, brown lines – contours of the 1:10000 scale
topographic map
Table 1: Lengths and catchment areas of the streams estimated using contours of the 1:10000 scale
topographic map and derived catchment area map
Str
eam
len
gth
rec
ogniz
ed o
n t
he
top
ogra
phic
map
(in
fac
t, l
ength
of
anci
ent
ravin
e),
m
Fu
ll s
trea
m l
ength
rec
ogniz
ed o
n
the
catc
hm
ent
area
map
, m
Fu
ll c
atch
men
t ar
ea o
f th
e st
ream
acco
rdin
gly
to
the
catc
hm
ent
area
map
, sq
. m
Cat
chm
ent
area
of
the
extr
a par
t
of
the
stre
am (
dif
fere
nce
of
full
stre
am l
eng
th a
nd a
nci
ent
ravin
e
len
gth
), s
q. m
Est
imat
ion
err
or
of
the
stre
am
len
gth
on
th
e to
pogra
phic
map
in
com
par
iso
n t
o t
he
catc
hm
ent
area
map
, %
of
the
full
str
eam
len
gth
Est
imat
ion
err
or
of
the
catc
hm
ent
area
, %
of
the
full
catc
hm
ent
area
153 298 4125 2700 49 65
244 352 33471 1688 31 5
167 300 4138 2500 44 60
284 334 47557 4180 15 9
107 309 5588 3087 65 55
119 329 7583 1936 54 26
196 283 7063 795 31 11
Acta Geobalcanica, 4-1, 2018, 25-31
29
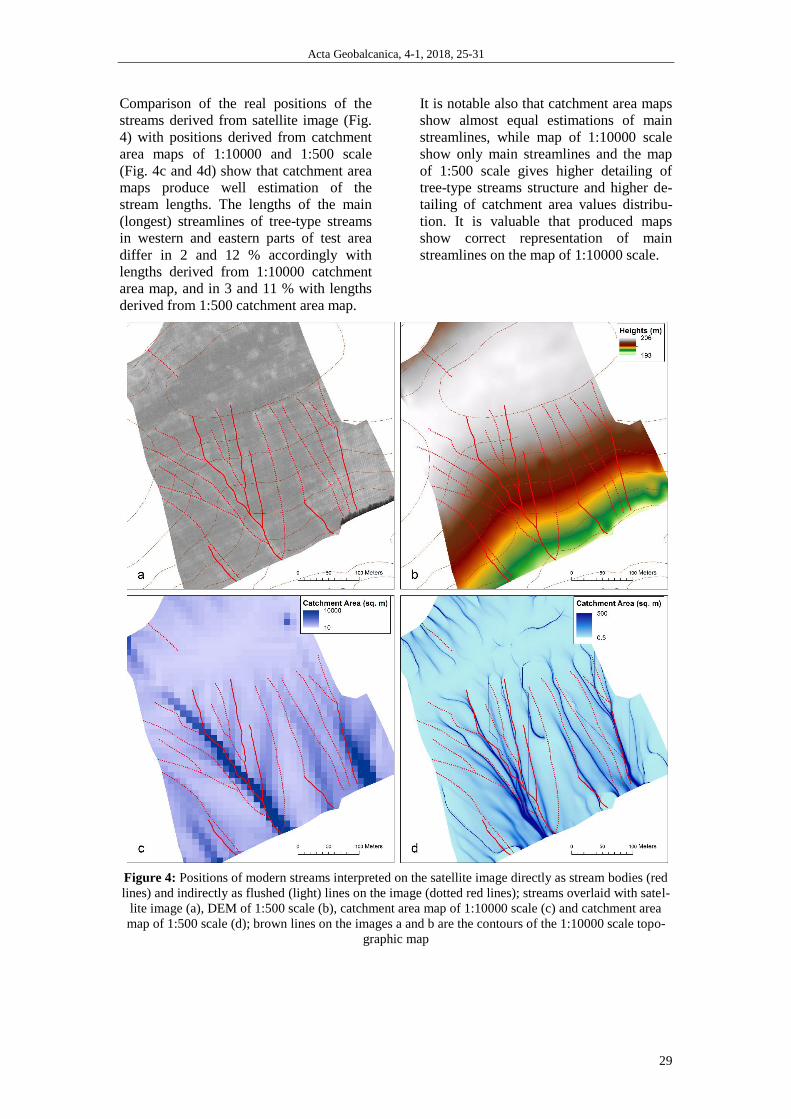
Comparison of the real positions of the
streams derived from satellite image (Fig.
4) with positions derived from catchment
area maps of 1:10000 and 1:500 scale
(Fig. 4c and 4d) show that catchment area
maps produce well estimation of the
stream lengths. The lengths of the main
(longest) streamlines of tree-type streams
in western and eastern parts of test area
differ in 2 and 12 % accordingly with
lengths derived from 1:10000 catchment
area map, and in 3 and 11 % with lengths
derived from 1:500 catchment area map.
It is notable also that catchment area maps
show almost equal estimations of main
streamlines, while map of 1:10000 scale
show only main streamlines and the map
of 1:500 scale gives higher detailing of
tree-type streams structure and higher de-
tailing of catchment area values distribu-
tion. It is valuable that produced maps
show correct representation of main
streamlines on the map of 1:10000 scale.
Figure 4: Positions of modern streams interpreted on the satellite image directly as stream bodies (red
lines) and indirectly as flushed (light) lines on the image (dotted red lines); streams overlaid with satel-
lite image (a), DEM of 1:500 scale (b), catchment area map of 1:10000 scale (c) and catchment area
map of 1:500 scale (d); brown lines on the images a and b are the contours of the 1:10000 scale topo-
graphic map

Evgeny Panidi, Lubov Trofimetz, Julia Sokolova, Elena Kunaeva, Mapping of the microrelief structures using……
30
Another one notable feature is the differ-
ences in real positions of the streams and
positions estimated basing on map of larg-
er (1:500) scale. These differences are ex-
plained by the nature of modern streams,
which take position depending not only of
ancient relief structures, but also in corre-
spondence with cover of slope surface. In
case of arable areas, even the direction of
the ploughing and presence of agricultural
machinery tracks can be valuable factors
of stream pattern formation. Therefore,
mapping of the streamlines in higher
scales can be recognized only as approxi-
mation, while the real positions of the
streams will differ from the mapped posi-
tions.
Finally, despite the smoothness of the re-
lief surface presented on the topographic
maps of test area (i.e., inability of interpre-
tation of the secondary streams and higher
parts of main streams), the derivative
catchment area maps give correct estima-
tion of stream lengths and correct picture
of overall structure of the modern stream
network. Higher scale of the map produces
highly detailed structure.
Conclusions
Our investigations showed that classic ap-
proach to the allocation of stream lengths
basing on the contours of topographic map
produce loss in the length estimation up to
the 50% and more. On the other hand, the
catchment area maps derived from the
same topographic data allow to estimate
stream lengths with higher accuracy, and
to interpret structure of streams. It makes
possible to use catchment area maps for
typification of the modern streams.
Catchment area maps produced from to-
pographic maps of 1:10000 and 1:500 can
allow compatible accuracy when estimat-
ing stream lengths of main streams that
correspond with the ancient ravines. Due
to this, the catchment area maps of 1:500 –
1:10000 scales can be used for accurate
measurement of stream lengths (however,
more statistics are needed to prove this
preliminary conclusion).
Acknowledgements
The study was partially supported by Rus-
sian Foundation for Basic Research
(RFBR) research project No. 15-05-07463
A. Used Space Satellite Imagery is Cour-
tesy of the DigitalGlobe Foundation.
References
[1] Costa-Cabral M.C., Burges S.J. Digital Elevation Model Networks (DEMON): A
model of flow over hillslopes for computation of contributing and dispersal areas.
Water Resources Research, Vol. 30, Issue 6, pp. 1681–1692, 1994.
doi:10.1029/93WR03512
[2] Duchon J. Interpolation des fonctions de deux variables suivant le principe de la flex-
ion des plaques minces. Revue Française d'Automatique, Informatique et Recherche
Opérationnelle. Analyse numérique, Vol. 10, n° 2, p. 5-12, 1976 (in French)
[3] Hutchinson M.F., Xu T. Stein J.A. Recent Progress in the ANUDEM Elevation Grid-
ding Procedure. In: Hengel T., Evans I.S., Wilson J.P., Gould M. (eds.)
Geomorphometry, Redlands, California, USA, pp. 19–22, 2011. Accessible at:
http://geomorphometry.org/HutchinsonXu2011
[4] Mitáš L., Mitášová H. General variational approach to the interpolation problem.
Computers & Mathematics with Applications, Vol. 16, Issue 12, pp. 983-992, 1988.
doi:10.1016/0898-1221(88)90255-6
[5] Panidi E., Sokolova J., Trofimetz L., Kunaeva E. Mapping of the microrelief struc-
tures using multitemporal very high resolution space imagery. Acta Geobalcanica ,
Vol. 2, Issue 2, pp. 103-109, 2016. doi:10.18509/AGB.2016.11

Acta Geobalcanica, 4-1, 2018, 25-31
31
[6] Panidi E., Sokolova J., Trofimetz L., Kunaeva E. Satellite imagery applied to map-
ping of the erosion microrelief structures. SGEM2016 Conference Proceedings, Book
2, Vol. 3, pp. 415-422, 2016. doi:10.5593/SGEM2016/B23/S11.053
[7] Panidi E., Trofimetz L., Sokolova J. Application of phyto-indication and radiocesium
indicative methods for microrelief mapping. IOP Conference Series: Earth and Envi-
ronmental Science, Vol. 34, Paper ID: 012024, 6 p., 2016. doi:10.1088/1755-
1315/34/1/012024
[8] Saavedra C., Mannaerts C.M. Erosion estimation in an Andean catchment combining
coarse and fine resolution satellite imagery. Proceedings of the 31st International
Symposium on Remote Sensing of Environment, paper 1017, 4 p. Accessible at:
http://www.isprs.org/proceedings/2005/isrse/html/papers/1017.pdf
[9] Trofimets L.N., Panidi E.A. Study of soil loss quantity on the arable territories using
estimations of soil pollutants migration and geomorphometric parameters of the
microrelief. SGEM2015 Conference Proceedings, Book 3, Vol. 2, pp. 341-348, 2015.
doi:10.5593/SGEM2015/B32/S13.046