maple seminar provided by: mathematics faculty computing facility presented by: marcus shea
TRANSCRIPT

Maple
Seminar provided by: Mathematics Faculty Computing Facility
Presented by: Marcus Shea
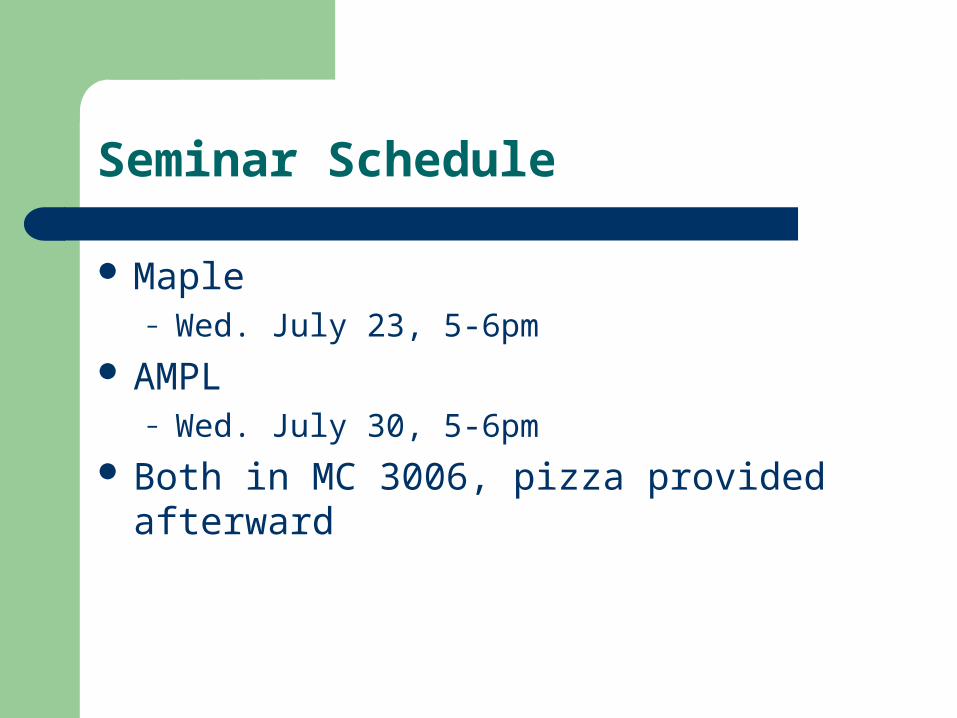
Seminar Schedule
Maple– Wed. July 23, 5-6pm
AMPL– Wed. July 30, 5-6pm
Both in MC 3006, pizza provided afterward
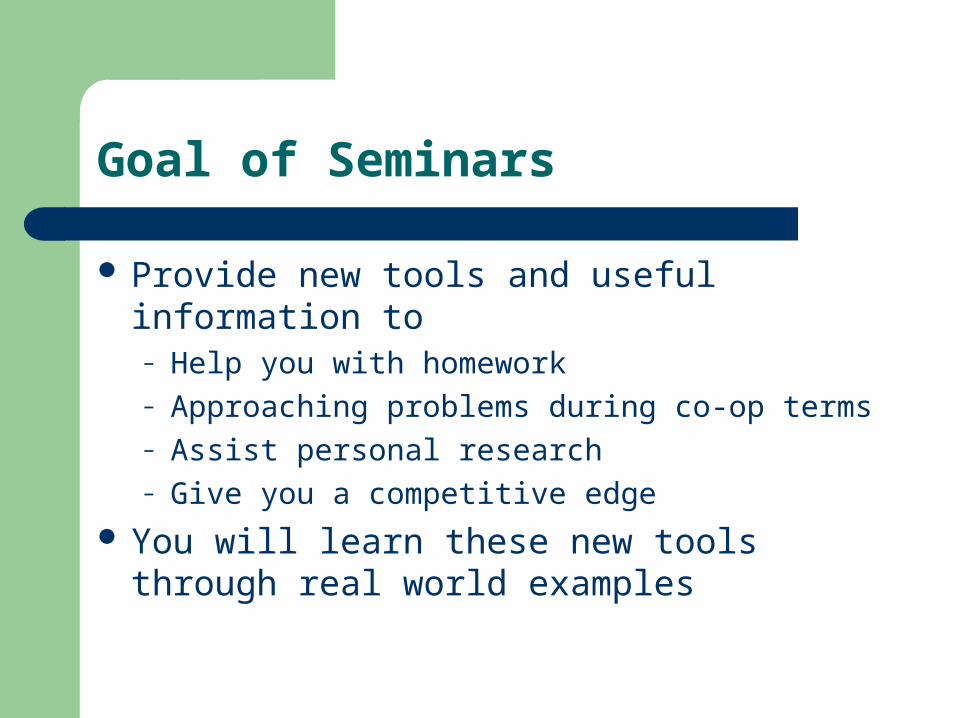
Goal of Seminars
Provide new tools and useful information to– Help you with homework– Approaching problems during co-op terms– Assist personal research– Give you a competitive edge
You will learn these new tools through real world examples

Maple in the Real World
Maple plays a vital role in 3-D biomechanical modeling and stability analysis of bipedal motion
Maple aids in the development of new aerospace manufacturing technologies
Maplesoft technology speeds up concept vehicle prototyping over 10,000 times
Maple used for single-cylinder engine design to help EMAK achieve high efficiency
Maple contributes to revolutionary advancements in medical robotic technology
Maple helps advance Maglev train technology Use of Maple optimizes financial modeling at Mitsubishi UFJ Securities
International Maple helps Ford Motor Company with analytical predictions of chain
drive system resonances

Overview
Generating a curve– Plot Builder
Prime Functions– Cryptography Problem
Planning a Road Trip– Finding Shortest Paths
Basic Statistical Analysis– Google Stock Data

Generating a Curve
There are many different ways to specify a function in Maple We can define the function explicitly
Then display your function
You can then right click the function to perform many operations including integration, differentiation and solving at a point.
This can be very helpful when you need to check simple calculations involved in homework
Generating a Curve
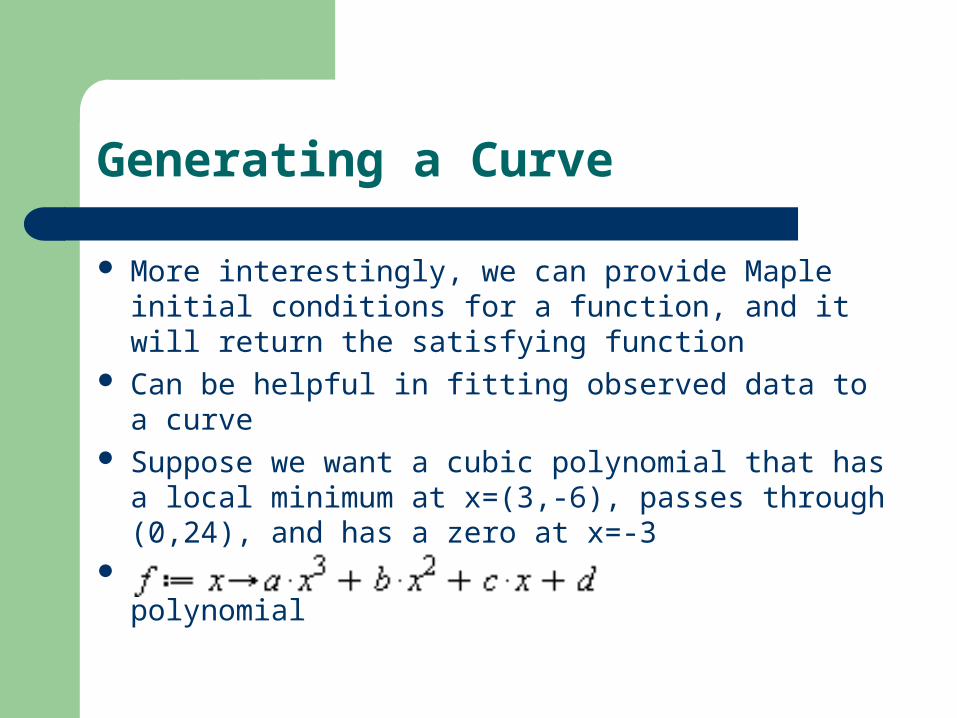
More interestingly, we can provide Maple initial conditions for a function, and it will return the satisfying function
Can be helpful in fitting observed data to a curve Suppose we want a cubic polynomial that has a local
minimum at x=(3,-6), passes through (0,24), and has a zero at x=-3
Specify the general formula for a cubic polynomial

Generating a Curve
Provide Maple the initial conditions
The equations that our function must satisfy are then displayed
We can right-click these equations and click Solve > Solve

Generating a Curve
Maple outputs the coefficients for our polynomial
We can get the cubic that we want and store it to g(x) as follows
– Instead of the ??, press ctrl+L and enter the equation number for the solution of our coefficients
Plot Builder
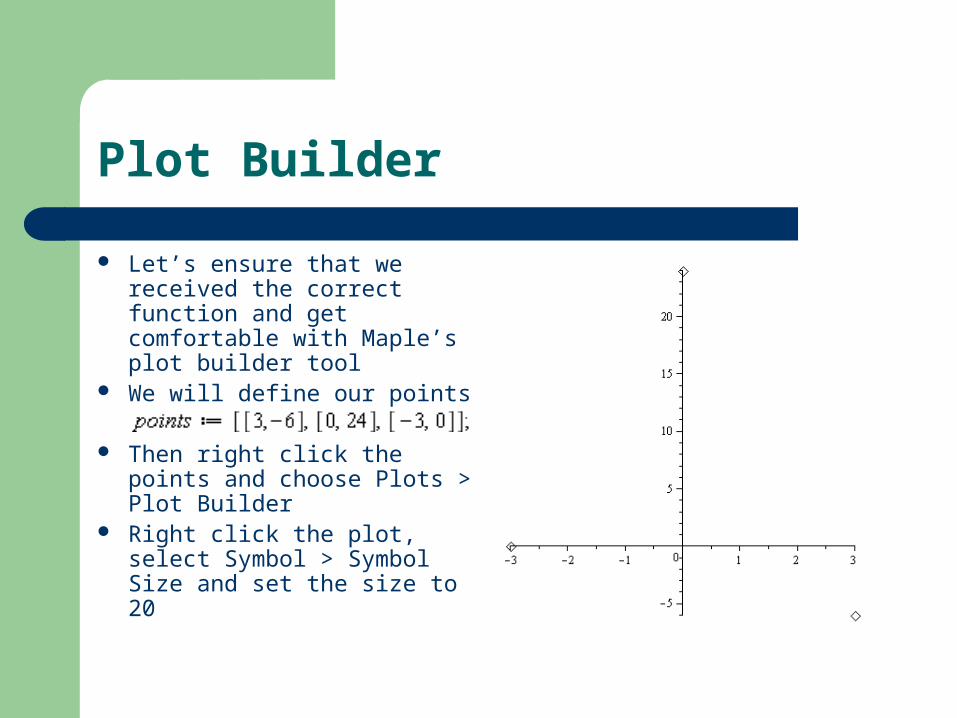
Let’s ensure that we received the correct function and get comfortable with Maple’s plot builder tool
We will define our points
Then right click the points and choose Plots > Plot Builder
Right click the plot, select Symbol > Symbol Size and set the size to 20
Plot Builder
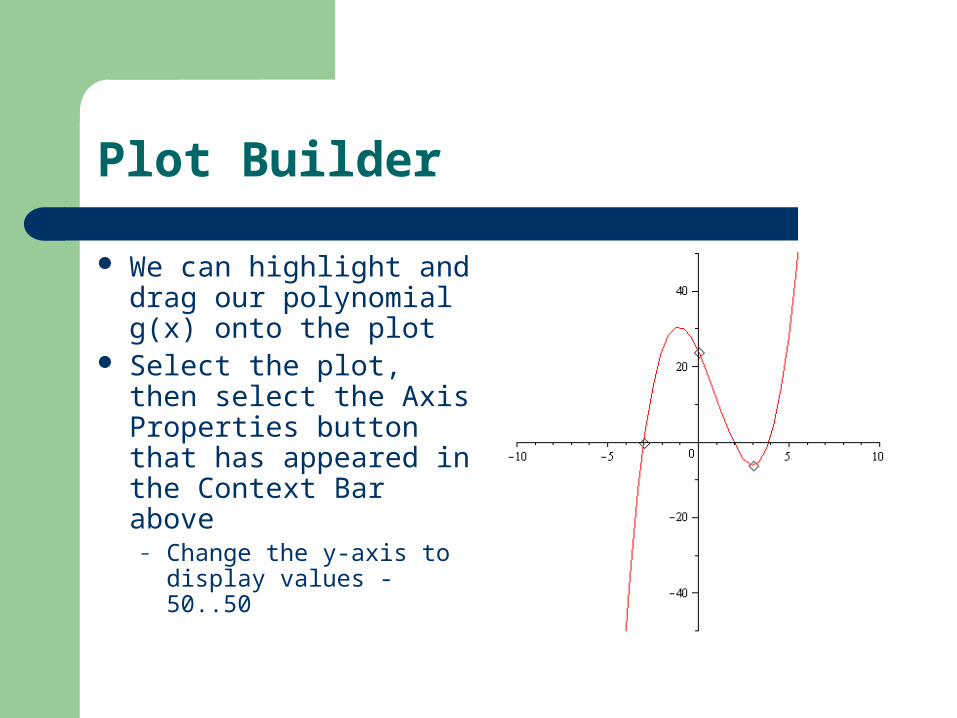
We can highlight and drag our polynomial g(x) onto the plot
Select the plot, then select the Axis Properties button that has appeared in the Context Bar above
– Change the y-axis to display values -50..50
Plot Builder
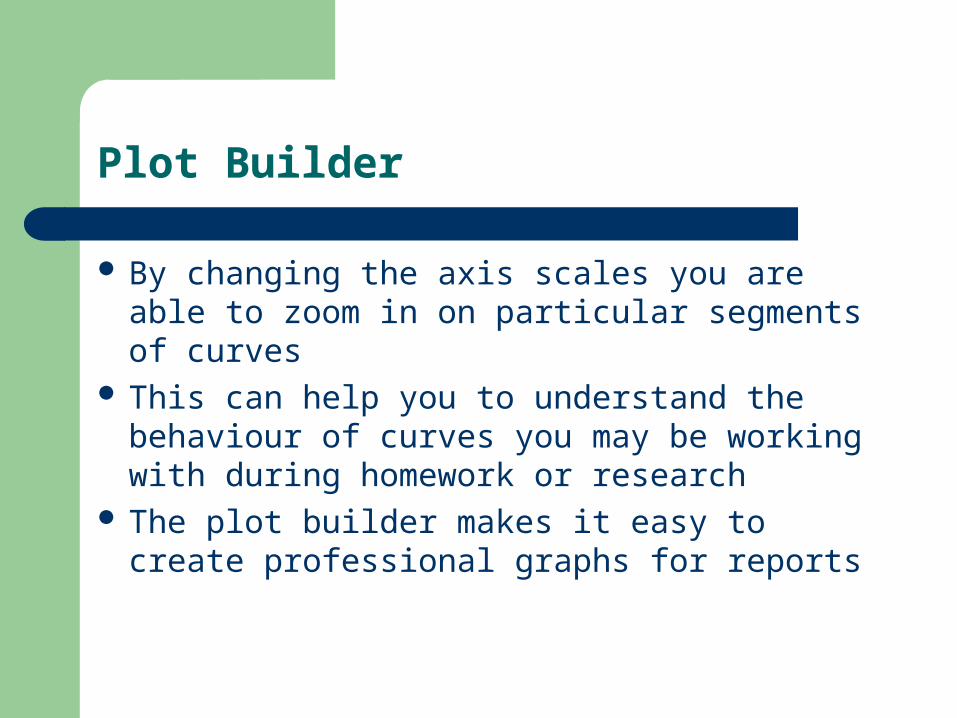
By changing the axis scales you are able to zoom in on particular segments of curves
This can help you to understand the behaviour of curves you may be working with during homework or research
The plot builder makes it easy to create professional graphs for reports
Using Prime Functions
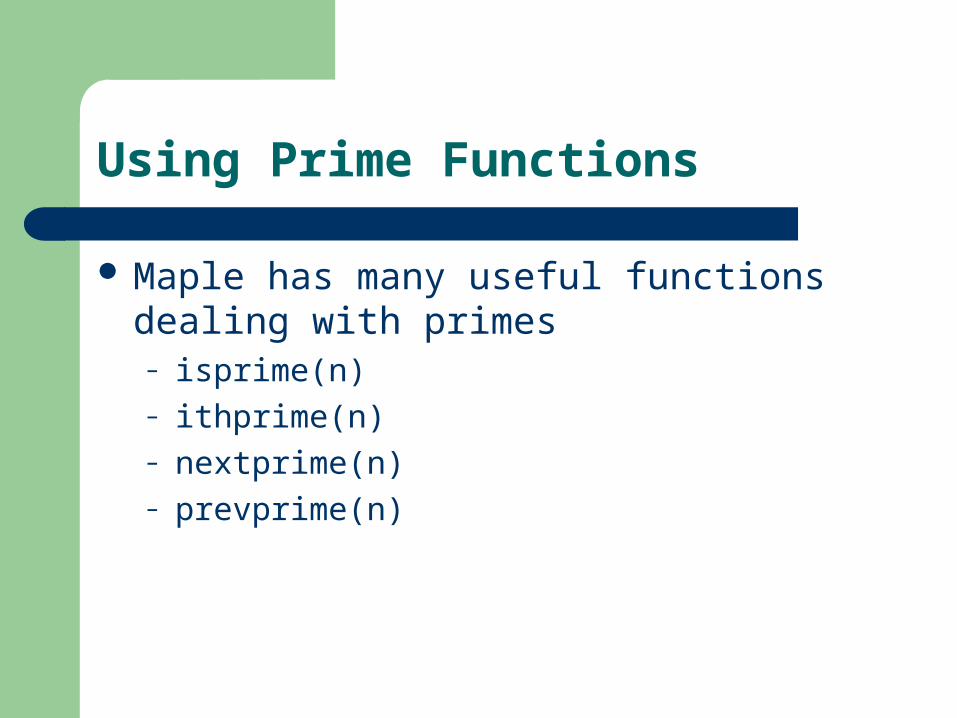
Maple has many useful functions dealing with primes– isprime(n)– ithprime(n)– nextprime(n)– prevprime(n)

Cryptography Problem
Suppose you work for a software company which has just designed a fast new encryption algorithm that relies critically on two secret primes p and q
The value n = p*q is publicly available The prime choosing algorithm is also publicly
available We need to determine if this algorithm is secure –
that is, we need to find out if one could determine p and q given n
Cryptography Problem
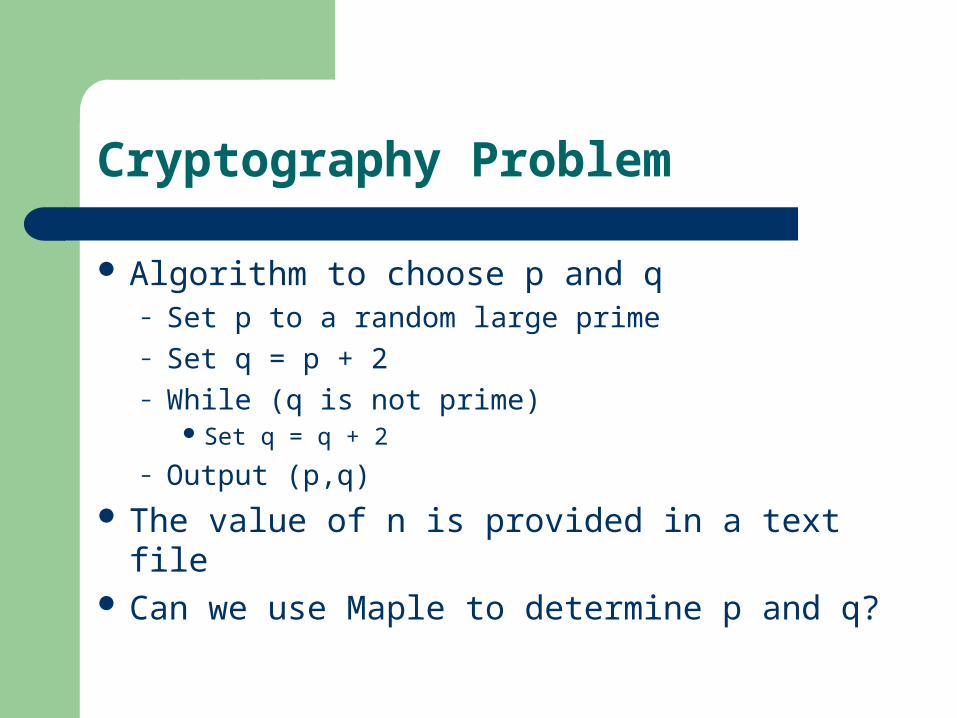
Algorithm to choose p and q– Set p to a random large prime– Set q = p + 2– While (q is not prime)
Set q = q + 2
– Output (p,q)
The value of n is provided in a text file Can we use Maple to determine p and q?

Cryptography Problem
Hints– Note that p and q are consecutive primes– Also, note that p < sqrt(n) < q– Will probably need the evalf[precision](number)
command

Solution
This will reveal the p and qsn = evalf[100](sqrt(n));z = floor(sn);p = prevprime(z);q = nextprime(p);
Cryptography Problem
As we have seen, the computational power of Maple allows us to perform mathematical calculations that would be infeasible by hand
Maple is widely used in the analysis of algorithms
This could be helpful during co-op terms or personal research
Planning a Road Trip
Say we are planning a road trip to Los Angeles, California
To break up the trip, we want to pass through some major cities along the way
We list all the cities between Waterloo and Los Angeles that interest us
We want to get to Los Angeles quickly
Planning a Road Trip
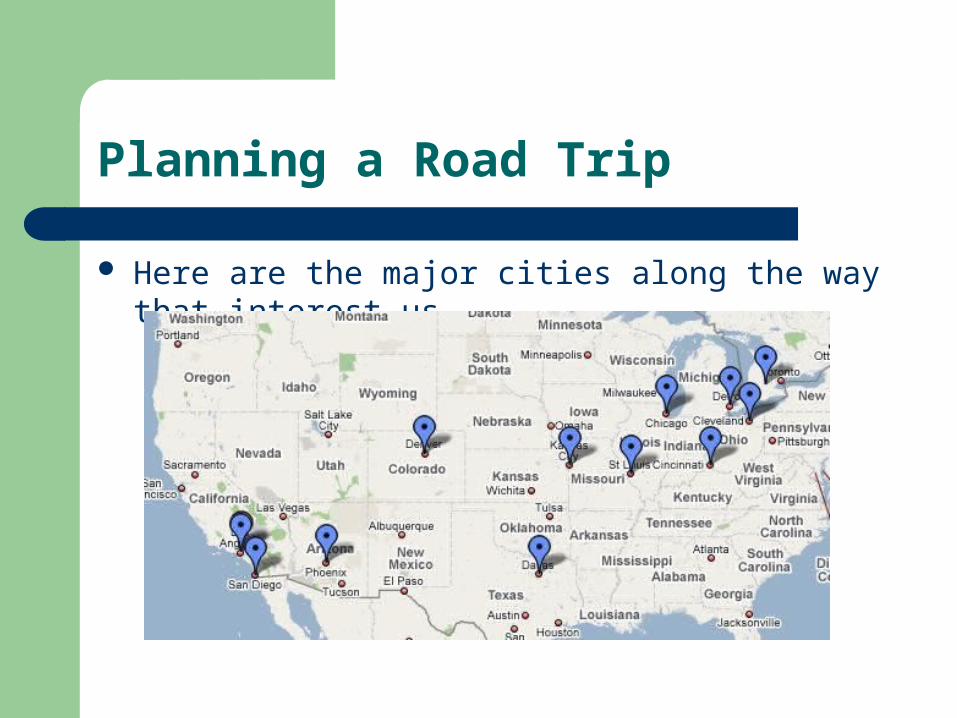
Here are the major cities along the way that interest us

Planning a Road Trip
Cities with distances (in hours)

Planning a Road Trip
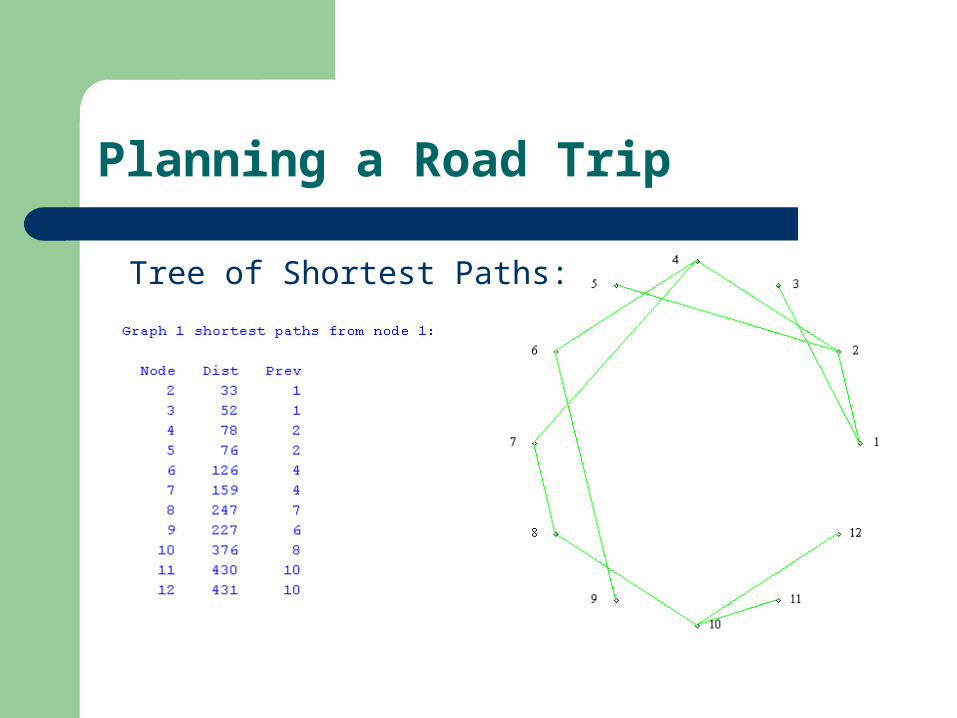
We create a graph where cities are nodes (numbered 1,2,…,12) and edges between cities are the distances
We then want to find the shortest path from Waterloo (node 1) to Los Angeles (node 12)
We can use code from the Maple Application Center to find the shortest path – Uses Djikstra’s Algorithm (CO351)

Planning a Road Trip
Algorithm takes an input text file– Line 1: #START– Line 2: numNodes numEdges startNode– Subsequent lines each define an edge:
tail head distance [no decimals in distance]
– Last line: #END

Planning a Road Trip
With the input file created and saved in a file called trip.txt, you can determine the solution by running the following commands:Dijkstras_Algorithm("trip.txt", true);
draw(G);
Planning a Road Trip
Tree of Shortest Paths:

Planning a Road Trip
We can use the tree of shortest paths to determine the optimal route to any one of the 11 destinations
For Los Angeles, our schedule would be: Waterloo (1) to Detroit (2) to Chicago (4) to
Kansas City (7) to Denver (8) to Phoenix (9) to Los Angeles (12)– Total travel time: 43.1 hours

Planning a Road Trip
The analysis we have seen can be applied to a variety of situations
The shortest path problem can be used to model:– Web mapping (Mapquest, Google Maps)– Telecommunication networks– Scheduling problems (CO351)– Many other Operations Research problems
Basic Statistical Analysis
We know that gas prices have been steadily rising lately
Let’s take a look at the stock prices of an American independent oil and gas company, Apache Corporation (APA:NYSE)
We will be working with the closing prices over the past year
Historical data taken from Yahoo Finance You are provided with a file that will read in the data
– Variable prices holds daily prices– Variable data holds (day,price) points
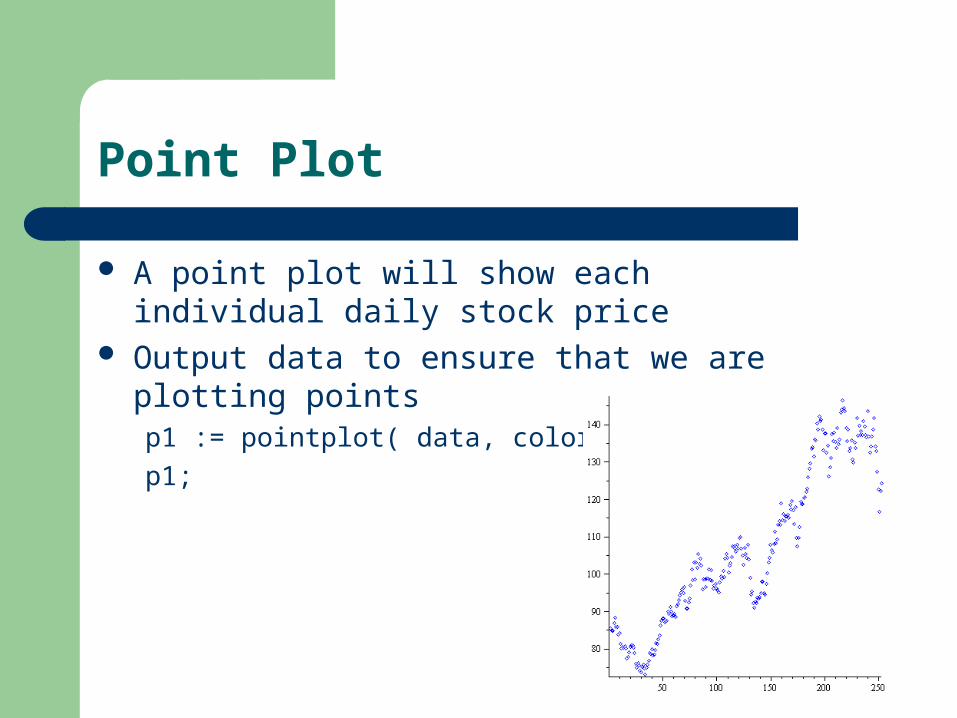
Point Plot
A point plot will show each individual daily stock price
Output data to ensure that we are plotting pointsp1 := pointplot( data, color=blue ):
p1;
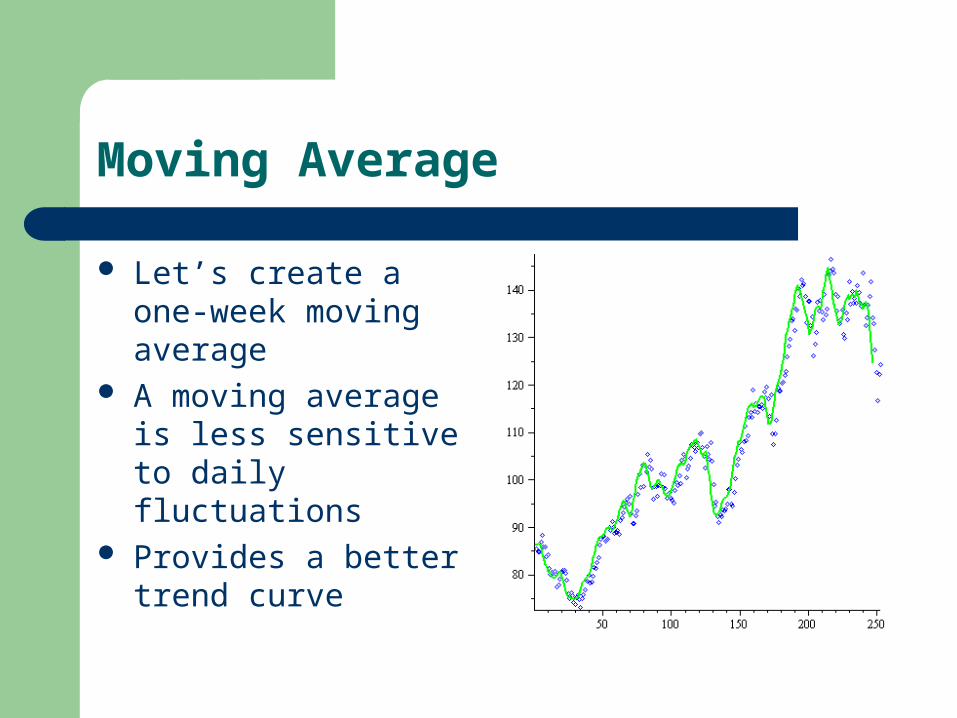
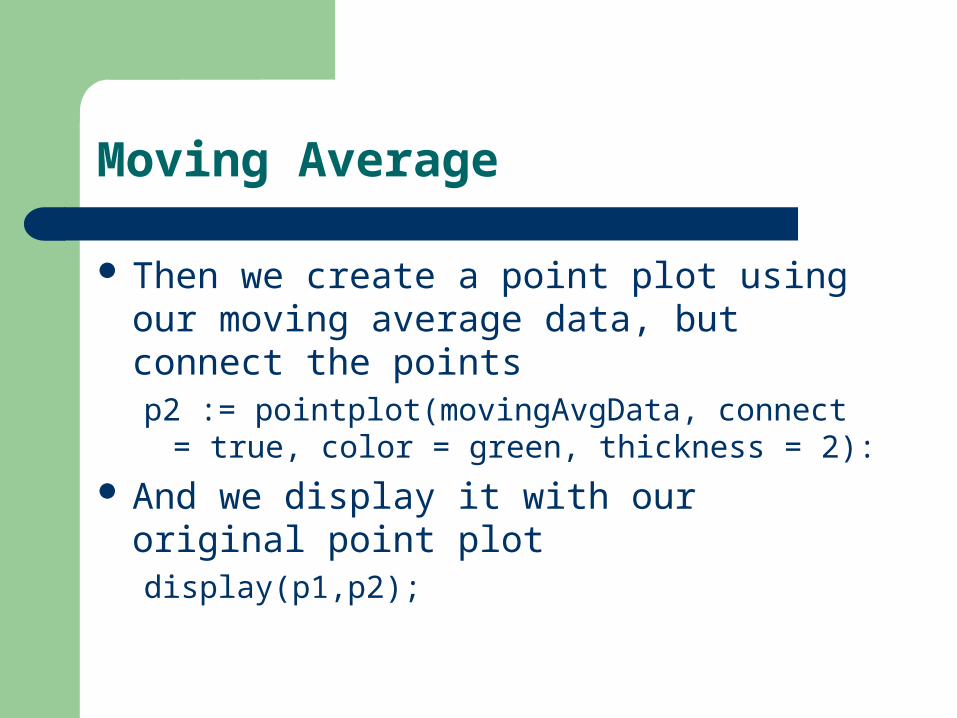
Moving Average
Let’s create a one-week moving average
A moving average is less sensitive to daily fluctuations
Provides a better trend curve
Moving Average
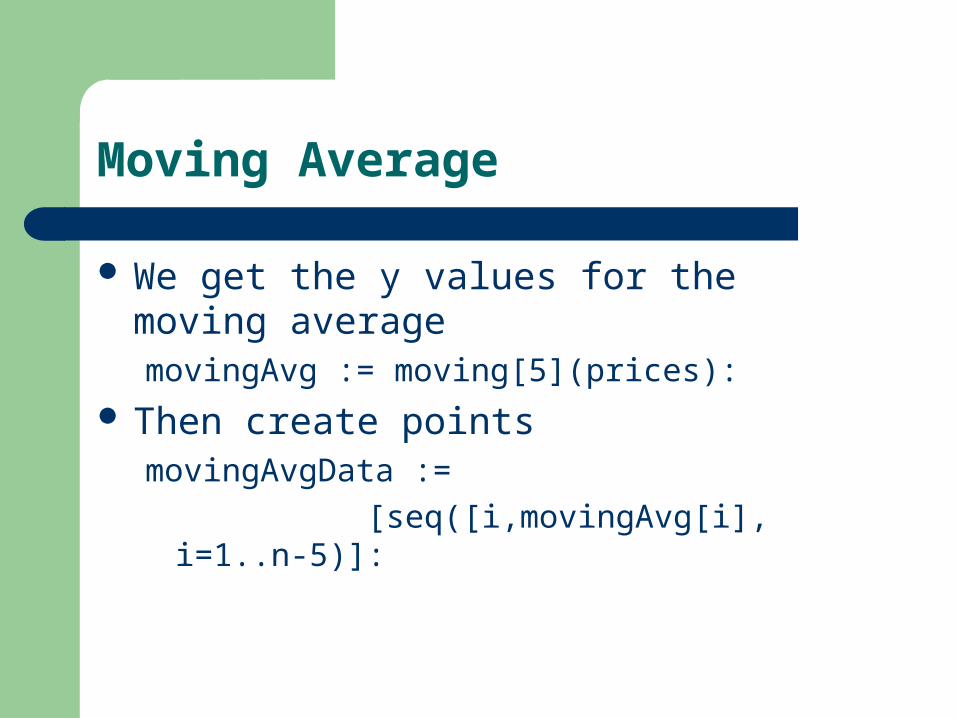
We get the y values for the moving averagemovingAvg := moving[5](prices):
Then create pointsmovingAvgData :=
[seq([i,movingAvg[i], i=1..n-5)]:
Moving Average
Then we create a point plot using our moving average data, but connect the pointsp2 := pointplot(movingAvgData, connect = true,
color = green, thickness = 2):
And we display it with our original point plotdisplay(p1,p2);
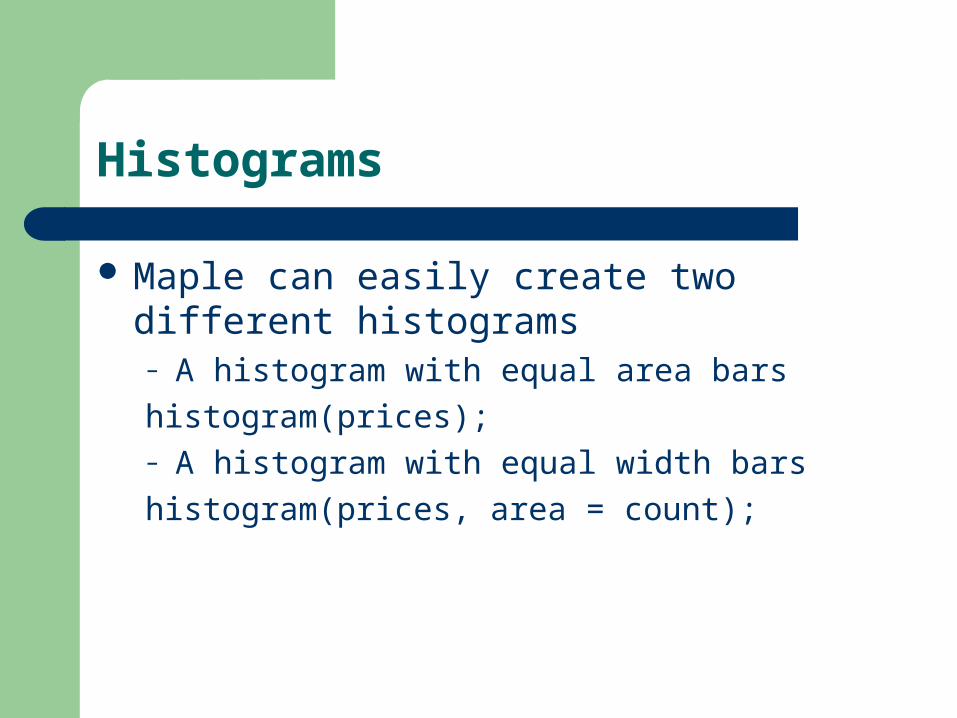
Histograms
Maple can easily create two different histograms– A histogram with equal area bars
histogram(prices);– A histogram with equal width bars
histogram(prices, area = count);
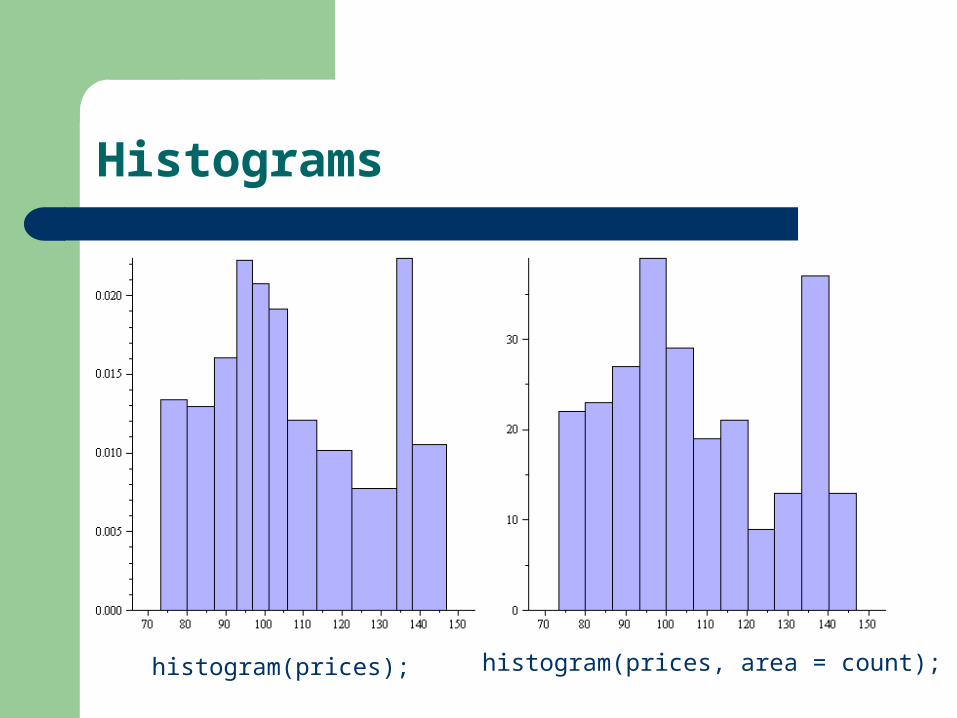
Histograms
histogram(prices); histogram(prices, area = count);
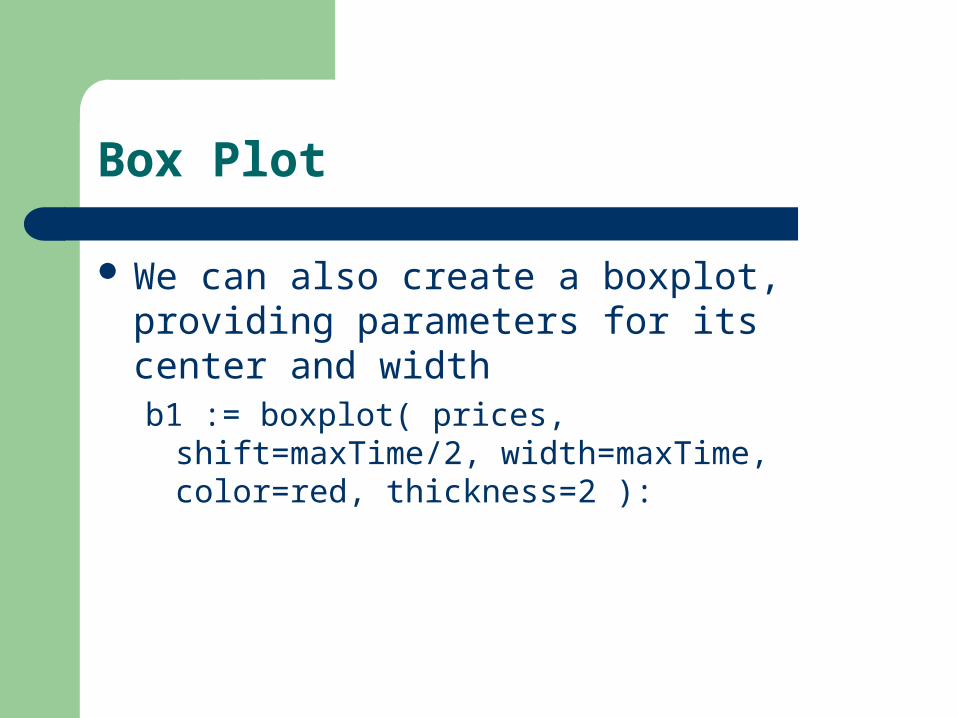
Box Plot
We can also create a boxplot, providing parameters for its center and widthb1 := boxplot( prices, shift=maxTime/2,
width=maxTime, color=red, thickness=2 ):
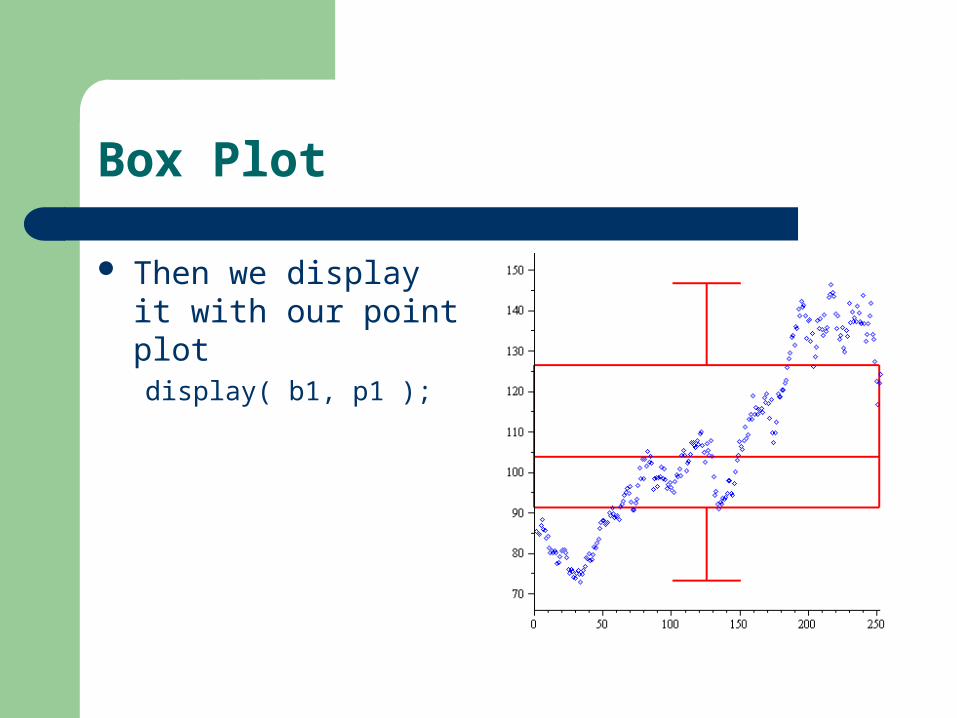
Box Plot
Then we display it with our point plotdisplay( b1, p1 );
Statistical Analysis
You can use Maple to generate informative plots for reports, personal, and business research
Maple is very useful for Financial Analysis, and there is a good library available at the Maplesoft Application Center

Maplesoft Application Center
Free Maple Applications
http://www.maplesoft.com/applications/