manuscript under review for journal atmos. chem. phys ... · pdf filereactions and local...
TRANSCRIPT
1
Spatio-temporal variability and light absorption property of carbonaceous
aerosol in a typical glacierization region of the Tibetan Plateau
Hewen Niua, Shichang Kang
a,c,*, Hailong Wang
b,*, Rudong Zhang
d,b, Xixi Lu
e, Yun Qian
b, Shijin
Wanga, Rukumesh Paudyal
a, Xiaofei Shi
f and Xingguo Yan
g 5
a State Key Laboratory of Cryospheric Science, Northwest Institute of Eco-Environment and
Resources, Chinese Academy of Sciences, Lanzhou 730000, China.
b Atmospheric Sciences and Global Change Division, Pacific Northwest National Laboratory
(PNNL), Richland, WA 99352, USA 10
c CAS Center for Excellence in Tibetan Plateau Earth Sciences, Beijing 100101, China.
d Institute for Climate and Global Change Research, School of Atmospheric Sciences, Nanjing
University, Nanjing, China; Collaborative Innovation Center of Climate Change, Jiangsu Province,
China.
e Department of Geography, National University of Singapore, 1 Arts Link, Singapore 117570, 15
Singapore
f College of Earth Environmental Sciences, Lanzhou University, Lanzhou 730000, China.
g College of Geography and Environmental Science, Northwest Normal University, Lanzhou
730030, China
* Corresponding authors: [email protected]; [email protected] 20
25
Atmos. Chem. Phys. Discuss., https://doi.org/10.5194/acp-2017-865Manuscript under review for journal Atmos. Chem. Phys.Discussion started: 24 October 2017c© Author(s) 2017. CC BY 4.0 License.
2
Abstract:
The high altitude glacierized regions of the Tibetan Plateau (TP) are influenced by
carbonaceous aerosols from local sources and long range transport from the adjoining
areas. Deposition and accumulation of light-absorbing carbonaceous matters on
glacier surfaces can alter the energy balance of glaciers. In this study, two years 5
(December 2014 to December 2016) of continuous observations of carbonaceous
aerosols performed in glacierized region of Mt. Yulong (4510 m asl) and Ganhaizi
(GHZ) basin (3054 m asl) are analyzed. The mass absorption efficiency (MAE) of
black carbon (BC) was determined for the first time in Mt. Yulong using a
thermal-optical carbon analyzer. The average BC and organic carbon (OC) 10
concentrations were 1.51±0.93 and 2.57±1.32 g m-3
, respectively. The average SOC
(secondary OC) concentration, quantified using BC-tracer method, was 1.67±1.15 g
m-3
. Monthly mean BC concentrations from monsoon to post-monsoon season were
higher than OC in the high altitudes (approximately 5000 m asl) of Mt. Yulong. The
concentrations of carbonaceous matter have distinct spatial and inter-annual variations 15
in this glacierization area. High carbonaceous matter associated with OC (including
both SOC and POC) in GHZ basin was mainly contributed from tour bus emissions.
The annual mean OC/BC ratio was 2.45±1.96 in Mt. Yulong. Strong photochemical
reactions and local tourism activities in monsoon season were the main factors
inducing high OC/BC ratios in the Mt. Yulong region. The mean MAE of BC, 20
measured at 632 nm with a thermal-optical protocol under the filter-based method,
was 6.82±0.73 m2 g
-1, comparable with the results from other studies. Strong seasonal
and spatial variations of BC MAE were largely related to the OC and SOC abundance.
Source attribution analysis using a global aerosol-climate model, equipped with a BC
source tagging technique, suggests that East Asia emissions, including local sources, 25
have the dominant contribution (over 50%) to annual mean near-surface BC at the two
sites. There is also a strong seasonal variation in the regional source apportionment.
South Asia has the largest contribution during the pre-monsoon season, while East
Asia dominates the monsoon season and post-monsoon season. Results in this study
have great implications for accurately evaluating the influences of carbonaceous 30
Atmos. Chem. Phys. Discuss., https://doi.org/10.5194/acp-2017-865Manuscript under review for journal Atmos. Chem. Phys.Discussion started: 24 October 2017c© Author(s) 2017. CC BY 4.0 License.
3
matter on glacial melting and water resource supply in glacierization areas.
Keywords: Black carbon; Carbonaceous aerosol; Light absorption; Mt. Yulong
1. Introduction
Carbonaceous aerosols play an important role in Earth’s climate system and energy 5
budget (Bond et al., 2013; Schuckmann et al., 2016). It has sophisticated/complex
effects on the health of human and living organisms (Jerret et al., 2005), visibility,
atmospheric radiative balance, and the surface albedo of snow and ice. Carbonaceous
aerosol is an aggregate of thousands of species with various thermal, physicochemical
and optical properties (Andreae and Gelencsér, 2006; Cheng et al., 2011a). In the 10
atmosphere, carbonaceous aerosols affect the radiative balance by absorbing and
scattering solar radiation and affecting the properties of clouds (IPCC, 2013;
Lohmann and Feichter, 2005; Carslaw et al., 2010). In the cryosphere, deposition of
carbonaceous matter on snow and glaciers reduces the surface spectral albedo (snow
darkening) (Flanner et al., 2009; Doherty et al., 2013; Qian et al., 2015; Niu et al., 15
2017a) and accelerates snow/glacial melting (Hansen and Nazarenko, 2004; Xu et al.,
2009a).
Carbonaceous matter in smoke/emissions from biomass burning and fossil fuel
combustion has been identified as the typical atmospheric pollutant since historical
period (Brimblecombe, 1987). Recently, scientific attention has shifted from the role 20
of carbonaceous matter as atmospheric pollutant to its influence as one of driving
factors of climate change (Andreae, 1995; Andreae and Gelencsér, 2006; Hansen et al.,
2005; Ramanathan et al., 2005). Some model simulations proposed that the radiative
forcing of black carbon (BC) is comparable to that of methane (Chung and Seinfeld,
2005; Jacobson, 2004), suggesting that BC may be the second most important 25
warming agent (only after CO2) in terms of direct radiative forcing (Jacobson, 2001).
Ding et al. (2016) found that BC particles play a key role in modifying/heating the
planetary boundary layer (PBL) and enhancing the haze pollution, called the “dome
effect” of BC, and suggested an urgent need for reducing BC emissions to mitigate the
extreme haze pollution in megacities in China. In addition, high concentrations of 30
Atmos. Chem. Phys. Discuss., https://doi.org/10.5194/acp-2017-865Manuscript under review for journal Atmos. Chem. Phys.Discussion started: 24 October 2017c© Author(s) 2017. CC BY 4.0 License.
4
absorbing aerosols over eastern China during winter and spring were found to be the
major reason for the observed recent warming trend (Yu et al., 2001). BC in snow can
increase the surface air-temperature by approximately 1.0 ◦C over the Tibetan Plateau
(TP) and reduce spring snow cover (Qian et al., 2011). Generally, sampled
carbonaceous aerosols can be divided into elemental carbon (EC) and organic carbon 5
(OC) using thermal/optical reflectance (TOR) method (Cao et al., 2010; Chow et al.,
1993), and EC is usually used synonymously with BC (Chen et al., 2011; Ming et al.,
2013; Xu et al., 2009b). Moreover, in the low-latitude and high-elevation areas,
extensive incoming solar radiation and large amount of carbonaceous aerosol
deposited on snowpack and glaciers result in surface albedo reduction and the retreat 10
of glaciers in the TP, and further affect Asian hydrological cycle and monsoon climate
(Qian et al., 2011; Qu et al., 2014; Li et al., 2016a). This is closely related to water
resources for billions of local habitants in South Asia (Ramanathan et al., 2005, 2007).
Therefore, it is rather important and necessary to carry out carbonaceous aerosol study
in glacierization regions. 15
The mass absorption efficiency (MAE, m2 g
-1) is a typical parameter characterizing
the optical (or light absorbing) properties of aerosols. For BC particles it is
determined by the mass concentration (g m-3
) and absorption coefficient (babs, Mm-1
)
of BC (Liousse et al., 1993; Chen et al., 2011), where babs is the cross section of BC
available to absorb light (Bond and Bergstrom 2006; Knox et al., 2009). MAE of BC 20
is usually estimated using quartz filter based methods, which detect the change in the
light transmittance through a quartz filter due to the presence of BC particles (Sharma
et al., 2002; Knox et al., 2009; Cheng et al., 2011a). Bond and Bergstrom (2006)
suggested a mass-normalized MAE of 7.5±1.2 m2
g-1
at 550 nm for uncoated aerosol
particles. However, Ram and Sarin (2009) studied the babs and MAE of BC in aerosols 25
sampled at three typical sites in India, and they found a distinct spatio-temporal
variability in babs and BC MAE on a regional scale. Discrepancies are sometimes
inevitable for the filter based techniques related to aerosol-filter interactions (Cheng et
al., 2011a; Ssandradewi et al., 2008). Moreover, the MAE of BC can be largely
influenced by the aerosol mixing state (Bond et al., 2006; Doran et al., 2007; Jacobson, 30
Atmos. Chem. Phys. Discuss., https://doi.org/10.5194/acp-2017-865Manuscript under review for journal Atmos. Chem. Phys.Discussion started: 24 October 2017c© Author(s) 2017. CC BY 4.0 License.
5
2001; Schnaiter et al., 2005). It was proposed that non-carbon species (e.g., sulphate,
nitrate) can increase the MAE value of BC (Knox et al., 2009) because the coating by
other components can focus light into the BC core of the particle (Bergstrom et al.,
1982; Cheng et al., 2011a). Enhancement of MAE by coating can be described in
terms of absorption amplification that is largely independent of coating thickness 5
(Schnaiter et al., 2005; Knox et al., 2009). Therefore, it is quite necessary to make a
further analysis on BC MAE to reduce the uncertainties in evaluating light absorption
of carbonaceous aerosols.
Recently, in addition to BC, it has been recognized that certain organic carbon (OC)
components in carbonaceous aerosol can also absorb light (Andreae and Gelencsér, 10
2006; Cheng et al., 2011a). However, light absorption by OC has not yet been taken
into consideration in most climate models, which causes certain uncertainties in
precisely evaluating climate/radiative forcing of carbonaceous aerosol in the
atmosphere and snow/ice. The radiative forcing of carbonaceous aerosol remains one
of the great challenges in climate simulation (Jacobson, 2001). 15
In this study, total suspended particulates (TSP) were simultaneously collected at
two remote stations on Yulong Snow Mountain (abbreviated Mt. Yulong), in the
southeast fringe of the TP. Spatial and seasonal variations of atmospheric
carbonaceous matter are examined, and the corrected BC MAE is calculated to
evaluate light-absorbing property of carbonaceous aerosol in the typical glacierization 20
area. Cloud-Aerosol Lidar with Orthogonal Polarization (CALIOP) is used to retrieve
total attenuated backscatter and sub-type information of smoke plumes to help on
source attribution of carbonaceous aerosols in Mt. Yulong.
2. Material and methods
2.1 Study area and TSP sampling 25
The study area, Mt. Yulong (26°59′-27°17′ N, 100°04′-100°15′ E), is the
southernmost glaciated mountain in the Eurasian continent (Fig. 1). Mt. Yulong is
exposed to emissions from South Asia and impacted by carbonaceous aerosol during
Indian summer monsoon more than other regions in the TP. The Baishui glacier
(27°06'16″ N; 100°11'44″ E) on Mt. Yulong is a typical temperate glacier that has 30
Atmos. Chem. Phys. Discuss., https://doi.org/10.5194/acp-2017-865Manuscript under review for journal Atmos. Chem. Phys.Discussion started: 24 October 2017c© Author(s) 2017. CC BY 4.0 License.

6
large energy fluxes, particularly at lower snow-covered elevations. The climate of Mt.
Yulong is typically affected by the Indian summer monsoon and East Asian summer
monsoon (Nie et al., 2017) in the monsoon season (June-September), and
characterized by other three distinct seasons: post-monsoon (Oct. - Nov.), winter (Dec.
- Feb.), pre-monsoon (Mar. - May) season (Chen et al., 2015; Cong et al., 2015a; 5
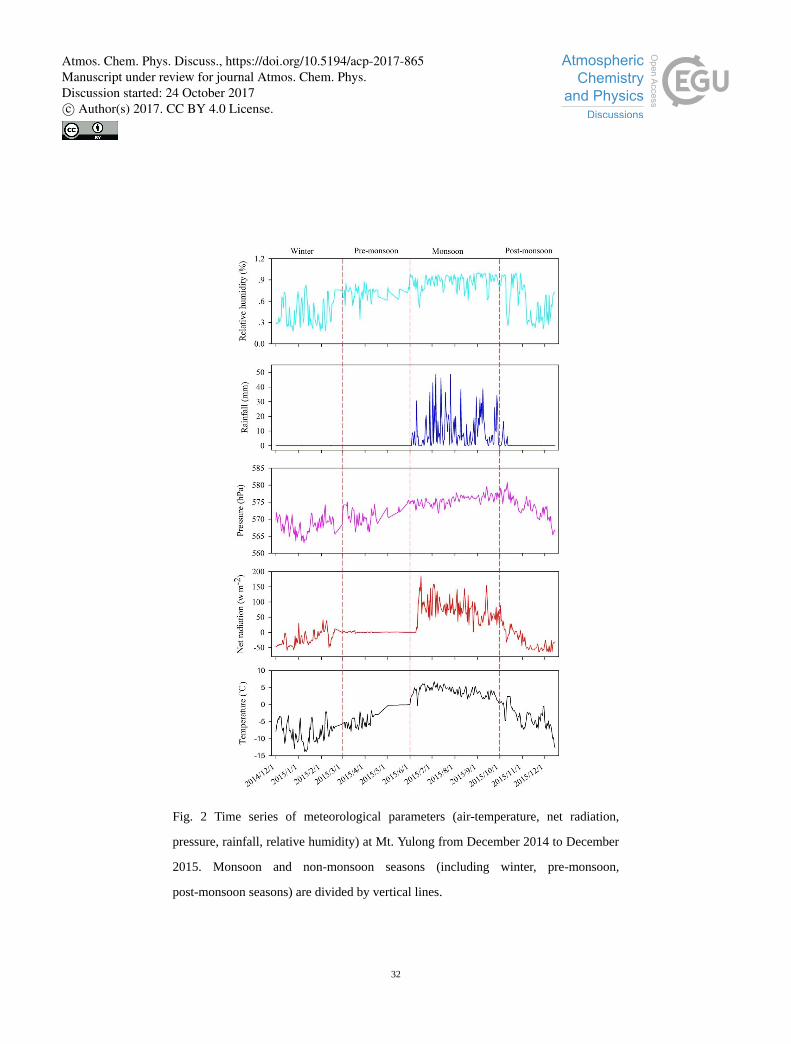
Bonasoni et al., 2010; Niu et al., 2013). Annual rainfall in Mt. Yulong occurs
considerably (~80%) in the monsoons season (Fig. 2). There is little rainfall in winter
when the westerly jet dominates (Liu et al., 2017).
One of the TSP sampling sites is at the elevation of 4510.25 m asl, which is close to
the location of the upper station (27°06′16.953″ N, 100°11′59.297″ E) of tourism 10
cableway on Mt. Yulong. Ganhaizi (GHZ) basin, the other TSP sampling site
(27°06′08.285″ N, 100°15′25.418″ E), is located on the east side and the foot of Mt.
Yulong, at an elevation of 3054.05 m asl. It is separated from the urban area, but is an
increasingly popular tourist destination, with a geological museum and a golf course.
Moreover, there is a spacious parking lot and a tourist dining-center in GHZ. Beside 15
the emission from tourist vehicles, there are very limited pollution source in the study
sites. These two sampling sites are located on the southeast fringe of the TP, away
from urban areas, and thus considered as typical remote areas in the Northern
Hemisphere (Li et al., 2016a) and ideal observation areas for atmospheric
environment in glacierization region. 20
The TSP samples analyzed in this study were collected from December 2014 to
December 2016 at these two sites using a particulate sampling apparatus (TH150-A,
Wuhan Tianhong INST Group). The sampling apparatuses were placed 15 m above
the ground, away from the surface dust and any specific pollutant sources.
Atmospheric air (and suspended particulates) was sampled at a flow rate of 100 L 25
min-1
and each sample was collected for 24 h using a stable vacuum pump, the
sampling interval for each TSP sample was 6 days. The collected TSP samples were
loaded on 90 mm (in diameter) pre-combusted (heating at 550 ℃ for 6 h in an oven)
quartz fibre filters (Whatman Corp.).
After sampling, the quartz filters were wrapped with an aluminum foil and were 30
Atmos. Chem. Phys. Discuss., https://doi.org/10.5194/acp-2017-865Manuscript under review for journal Atmos. Chem. Phys.Discussion started: 24 October 2017c© Author(s) 2017. CC BY 4.0 License.
7
kept in a refrigerator at 4 °C in the Yulong Glacier Station of Chinese Academy of
Sciences in Lijiang city, and then were transported to the State Key Laboratory of
Cryospheric Science in Lanzhou city for chemical analysis. In addition, precautions
were taken during both collection and analysis processes to avoid the possible
contamination of TSP samples. 5
2.2 Sample analysis
OC and BC on the quartz filters were analyzed using a Desert Research Institute
(DRI) Model 2001 thermal-optical reflectance carbon analyzer (Atmoslytic Inc.,
Calabasas, California) to determine the BC concentration and optical attenuation
(ATN) (Chow et al., 2001; Cheng et al., 2011a; Li et al., 2016b; Niu et al., 2017a). 10
Every filter was analyzed for a portion of carbon in a 0.502 cm2
punch. A temperature
peak (550 ℃) was designed to reduce measuring time that BC exposed in the
catalyzing atmosphere. The applied heating conditions permitted the separation of BC
portions in O2 (2%) and helium (98%) atmosphere and OC portions in a helium
atmosphere (Wang et al., 2015; Niu et al., 2017a). 15
2.3 Calculation methods of secondary OC (SOC), ATN and MAE
2.3.1 SOC calculation
OCpri= (BC·(OC/BC)min, OCtot)min (1)
OCsec= OCtot−OCpri (2)
where (OC/BC)min is the minimum OC/BC ratio in a specific set of data, OCpri 20
indicates the primary OC (or POC) content. SOC (i.e. OCsec) is calculated as the
difference between total OC content (OCtot) and OCpri. The OCpri is constrained so
that it may not exceed the OCtot (Yu et al., 2004, 2007). The minimum OC/BC
(OC-to-BC) ratio was suggested for use in the calculation of SOC concentration in
several previous studies (Castro et al., 1999; Cong et al., 2015a; Ram and Sarin, 2015; 25
Pachauri et al., 2013). Semi-empirical BC-tracer technique was employed in the SOC
calculation, and OCsec was set to zero in cases where (OC/BC)pri > (OCtot/BC) (Yu et
al., 2007). These cases are indicative of model overestimations of (OC/EC)pri. The
semi-empirical estimates of OCsec after screening for outliers are comparable to the
empirical estimates, and sometimes are even superior to empirical estimates. 30
Atmos. Chem. Phys. Discuss., https://doi.org/10.5194/acp-2017-865Manuscript under review for journal Atmos. Chem. Phys.Discussion started: 24 October 2017c© Author(s) 2017. CC BY 4.0 License.
8
Nonetheless, it should be noted that both semi-empirical OCsec estimates and
empirical estimates have limitations, and there is no standard or more perfect method
of OCsec estimation (Yu et al., 2007). Thus, BC-tracer method employed here is
reliable in determining SOC concentrations.
2.3.2 ATN calculation 5
The ATN is calculated based on the transmittance signal during the filter analysis,
defined as
0ln( )I
ATNI
where I0 and I are the transmittance signal after and before the thermal/optical
analysis (Ram and Sarin, 2009). Lights passing through a particle-loaded and a blank 10
filter were simultaneously measured in the determination of ATN by the
(thermal-optical reflectance) carbon analyzer. ATN determined by the carbon analyzer
is similar to the Aethalometer (Cheng et al., 2011a). Previous studies have
demonstrated that ATN of blank quartz fibre filters averaged 0.00±0.01, suggesting
that the ATN of loaded quartz filter could generally be ascribed to the existence of 15
light-absorbing carbon (Yang et al., 2009; Cheng et al., 2011a).
2.3.3 MAE calculation
The mass absorption efficiency (MAE) is calculated as:
2 110
s
ATNMAE
BC C
where BCs (g C cm-2
) is the filter loading amount of BC, which is directly measured 20
from the thermal optical analysis. The filter-based determination of light absorption
has many artifacts, though the various scattering effects can be properly corrected by
an empirical factor, C. A value of C = 3.6 was proposed for the internally mixed
atmospheric aerosol when employing thermal-optical analysis method in several
studies (Weingartner et al., 2003; Doran et al., 2007; Ram and Sarin, 2009; Cheng et 25
al., 2011a). The same empirical factor was also used in the optical measurement by
the Aethalometer (Ram and Sarin, 2009). There are many factors (e.g., measurement
methods, mixed states) accounting for the discrepancy of MAE. The corrected
Atmos. Chem. Phys. Discuss., https://doi.org/10.5194/acp-2017-865Manuscript under review for journal Atmos. Chem. Phys.Discussion started: 24 October 2017c© Author(s) 2017. CC BY 4.0 License.
9
equation of MAE calculation (i.e., corrected for the multiple scattering effects)
performed in this study has greatly diminished the uncertainties (around 15%). By
converting previously published MAE values (Ram and Sarin, 2009) to the
equivalent-MAE, Cheng et al. (2011a) has found that the equivalent-MAE was much
lower in the regions severely affected by biomass burning (e.g., Allahabad, India). 5
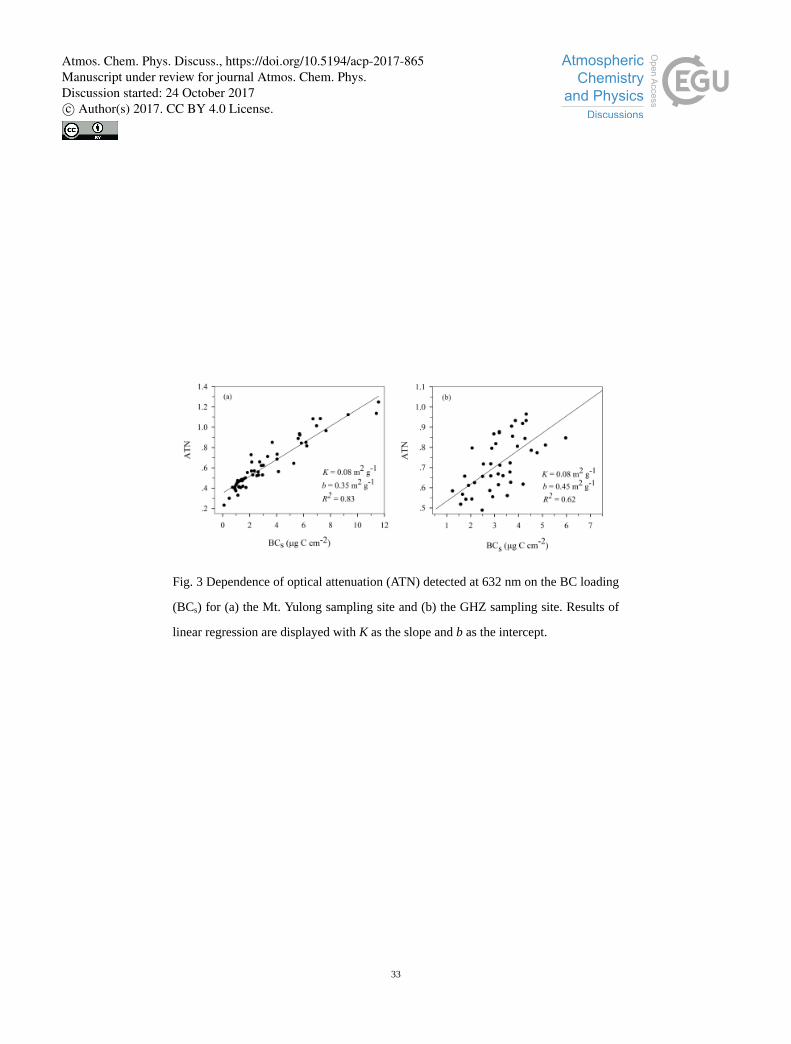
The dependence of light attenuation (ATN) detected at 632 nm on BC loading (BCs)
is shown in Fig. 3, to identify the artifact relevant to filter-based measurements. As a
result, ATN and BCs correlate well (R2=0.83) with a slope (K) of 0.08 m
2 g
-1 and an
intercept (b) of 0.35 m2 g
-1 for our samples at the Mt. Yulong sampling site. Strong
correlation (R2=0.62) between ATN and BCs also exists for the GHZ sampling site, 10
with K=0.08 m2 g
-1 and b=0.45 m
2 g
-1. Strong dependence of ATN on BCs has been
found in the present study, and artifact associated with filter-based method was not
identified and thus can be neglected.
2.4 Model experiment
We use a global aerosol-climate model, the Community Atmosphere Model version 15
5 (CAM5) equipped with a BC source tagging technique (Wang et al., 2013, 2014;
Zhang et al., 2015), to help estimate the source attribution of BC measured at the two
sites. The 4-mode modal aerosol scheme of CAM5 recently developed by Liu et al.
(2016) is used here, in which BC and primary OC particles are emitted into a
primary-carbon mode. They then grow through condensation of gas-phase precursors 20
(e.g., sulfuric and organic gases) and move to the accumulation size mode, where
hygroscopic aerosol particles, including carbonaceous aerosols, are subject to wet
removal by precipitation.
The CAM5 experiment is conducted for five years (2010-2014) at horizontal grid
spacing of 1.9° × 2.5° and 30 vertical levels. The sea surface temperatures and sea ice 25
concentrations are prescribed with observations, and winds are constrained with
reanalysis from NASA Modern Era Retrospective-Analysis for Research and
Applications (MERRA) (Rienecker et al., 2011; Ma et al., 2013). Monthly mean
anthropogenic and open fire emissions (Hoesly et al., 2017; van Marle et al., 2017;
Yang et al. 2017), including primary OC, SOC gases and BC, used in the simulation 30
Atmos. Chem. Phys. Discuss., https://doi.org/10.5194/acp-2017-865Manuscript under review for journal Atmos. Chem. Phys.Discussion started: 24 October 2017c© Author(s) 2017. CC BY 4.0 License.
10
come from the recently released datasets for the Coupled Model Intercomparison
Project Phase 6 (CMIP6), which are only available up to year 2014. Therefore, the
model experiment is not designed to simulate the two-year observations of aerosols in
Tibetan Plateau, but rather for a recent time period (2010-2014) to estimate the mean
source attributions and seasonal variations of near-surface BC concentrations. 5
3. Results and discussion
3.1 Characteristics of the carbonaceous aerosols
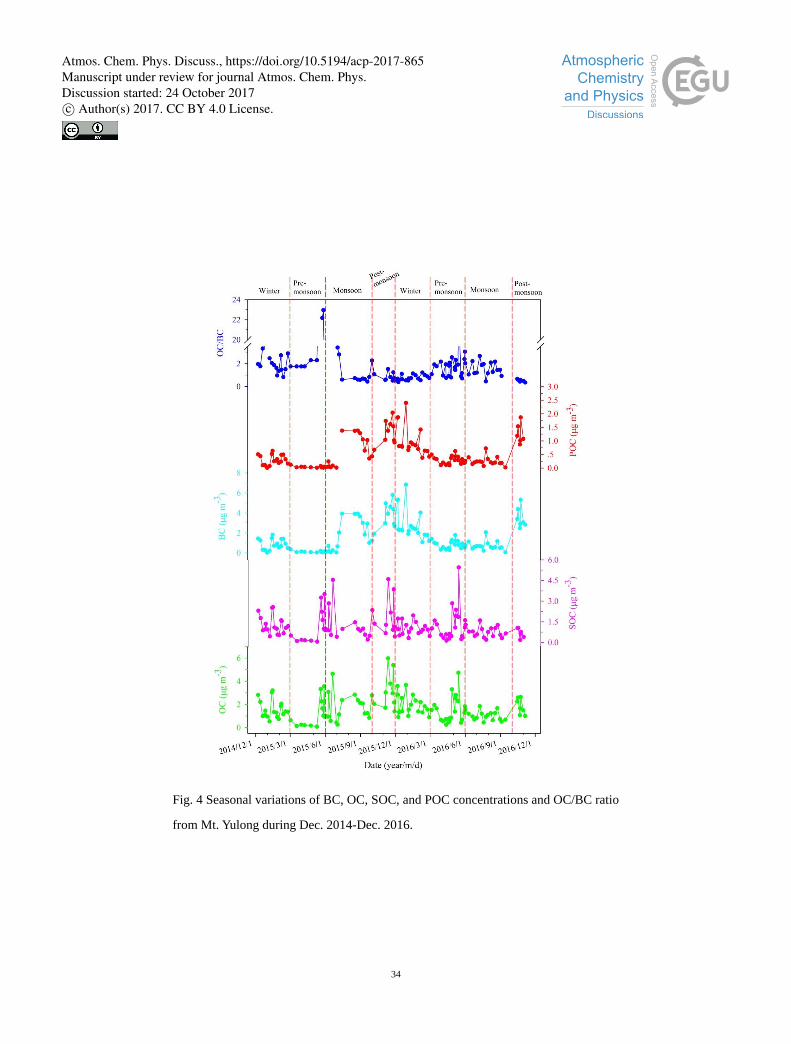
Temporal variations of carbonaceous matter measured from Mt. Yulong are shown
in Fig. 4. Distinct seasonal differences presented during the sampling time period. The
winter season and post-monsoon season had higher concentrations of carbonaceous 10
matter in the TSP during the two years, which is consistent for BC, OC, SOC, and
POC. However, the OC/BC ratio showed an opposite seasonal contrast. Monsoon
season in 2016 had the lowest carbonaceous matter contents in the two-year time
period, whereas the concentrations of OC, BC, and POC in the monsoon and
pre-monsoon season in 2015 presented relatively high and low values, respectively. 15
This is somewhat uncharacteristic compared with the general seasonal variations of
atmospheric chemistry (Kang et al., 2004, 2007; Niu et al., 2013, 2016). It is quite
likely that the below-average rainfall and sporadic dust events during the monsoon in
2015 is responsible for this unusual phenomenon (i.e. relatively high content in
monsoon season in 2015). 20
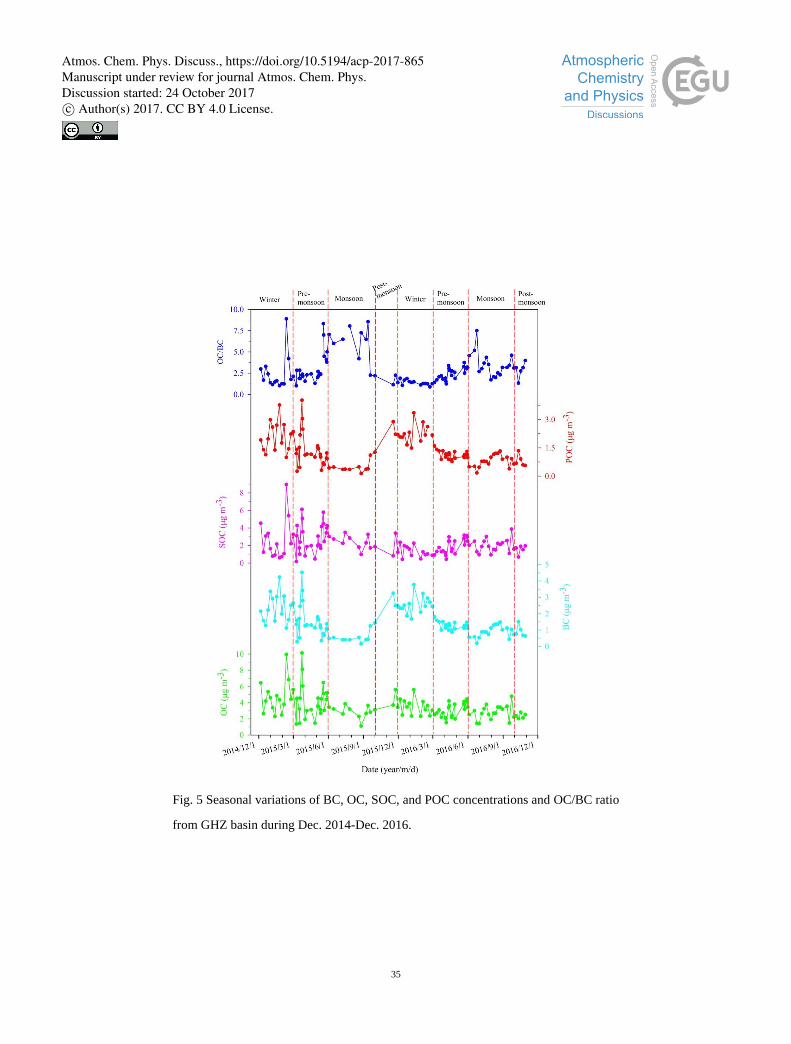
In comparison to Mt. Yulong, the trends of carbonaceous matter from the GHZ
basin presented more distinct seasonal variations (Fig. 5), i.e., the monsoon season
regularly had the lowest concentrations of BC, OC, SOC, and POC. The OC/BC ratio
was consistently opposite to that, e.g., higher values of OC/BC appeared in monsoon
seasons. Lower ratio of OC/BC in the other seasons (winter, pre-monsoon, 25
post-monsoon) was probably attributed to the little material available for
external-coating of BC, and the limited photochemical ability of OC during the
non-monsoon season (Knox et al., 2009). In addition, seasonal changes in BC and OC
sources (e.g., biomass burning vs. fossil fuel combustion) might play an important
role for the variations of OC/BC ratios. 30
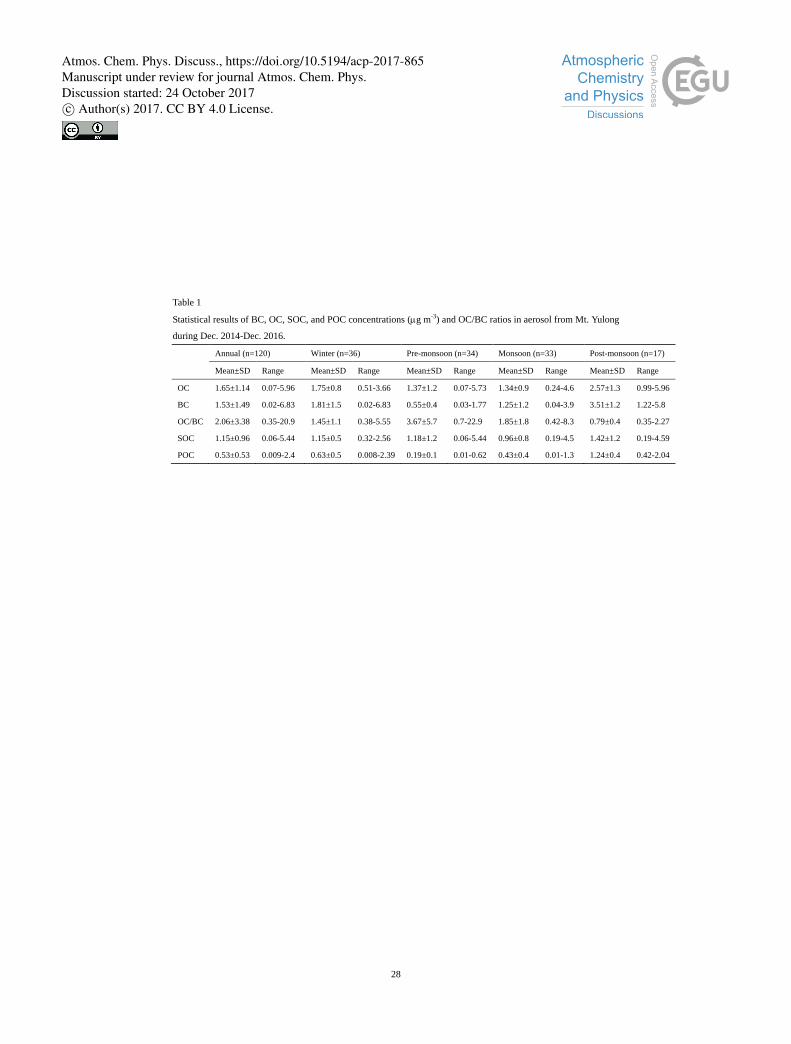
Table 1 summarizes statistical results of BC, OC, SOC, and POC concentrations in
atmospheric aerosol from Mt. Yulong. The annual mean BC concentration was 1.53 ±
Atmos. Chem. Phys. Discuss., https://doi.org/10.5194/acp-2017-865Manuscript under review for journal Atmos. Chem. Phys.Discussion started: 24 October 2017c© Author(s) 2017. CC BY 4.0 License.
11
1.49 g m-3
, with the sampled values ranging from 0.02 to 6.83g m-3
during the
study period (December 2014-Decmber 2016). The post-monsoon season had the
highest BC content of 3.51 ± 1.2 g m-3
, ranging from 1.22 to 5.8g m-3
. The annual
average OC and SOC concentrations were 1.65 ± 1.14 g m-3
and 1.15 ± 0.96 g m-3
,
respectively, with the lowest concentrations in the monsoon season (OC: 1.34 ± 0.9 5
g m-3
and SOC: 0.96 ± 0.8 g m-3
) and the highest concentrations in the
post-monsoon season (OC: 2.57 ± 1.3 g m-3
and SOC: 1.42 ± 1.2 g m-3
). Similar
seasonal differences were also found in other areas such as Lumbini, Nepal (Wan et
al., 2017), NCO-P (Bonasoni et al., 2010), Kanpur, India (Ram et al., 2012), and
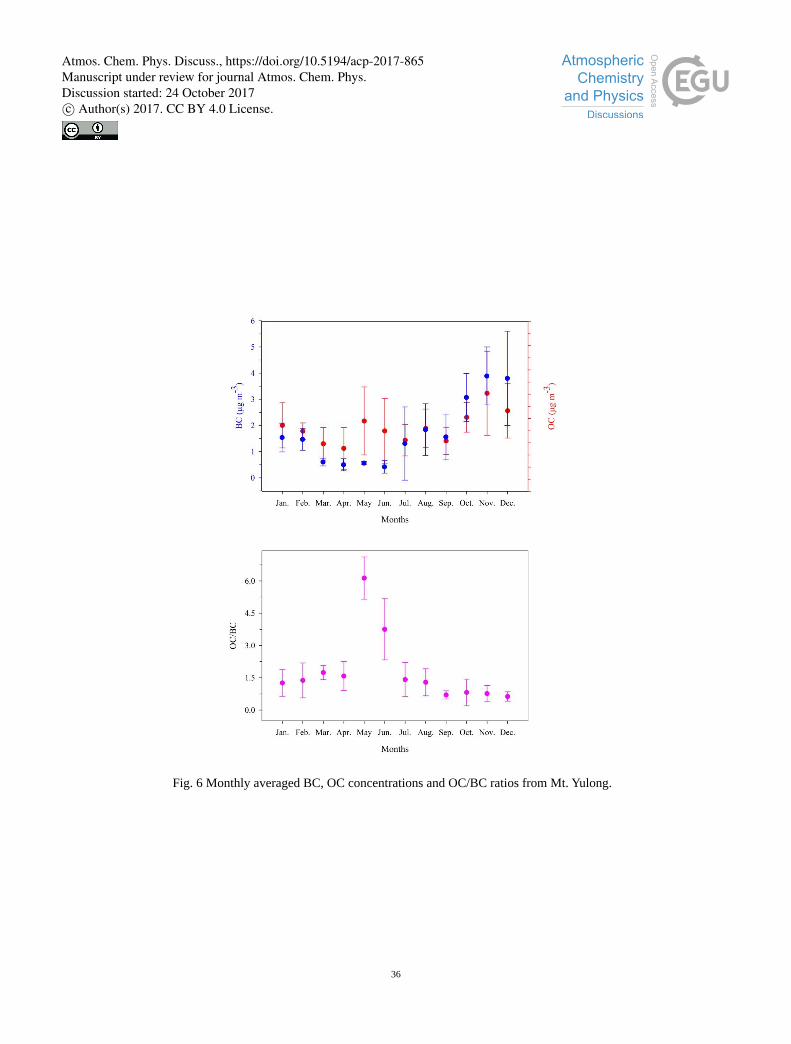
Delhi, India (Mandal et al., 2014). Moreover, monthly averaged carbonaceous aerosol 10
(BC, OC) concentrations were analyzed for Mt. Yulong (Fig. 6). It shows that from
the monsoon season to the post-monsoon season (particularly from Sep. to Dec.), BC
concentrations were higher than that of OC. A large amount of biomass burning
emissions in the high atmosphere (around 5000 m asl) in Mt. Yulong were probably
long range transported from source regions. 15
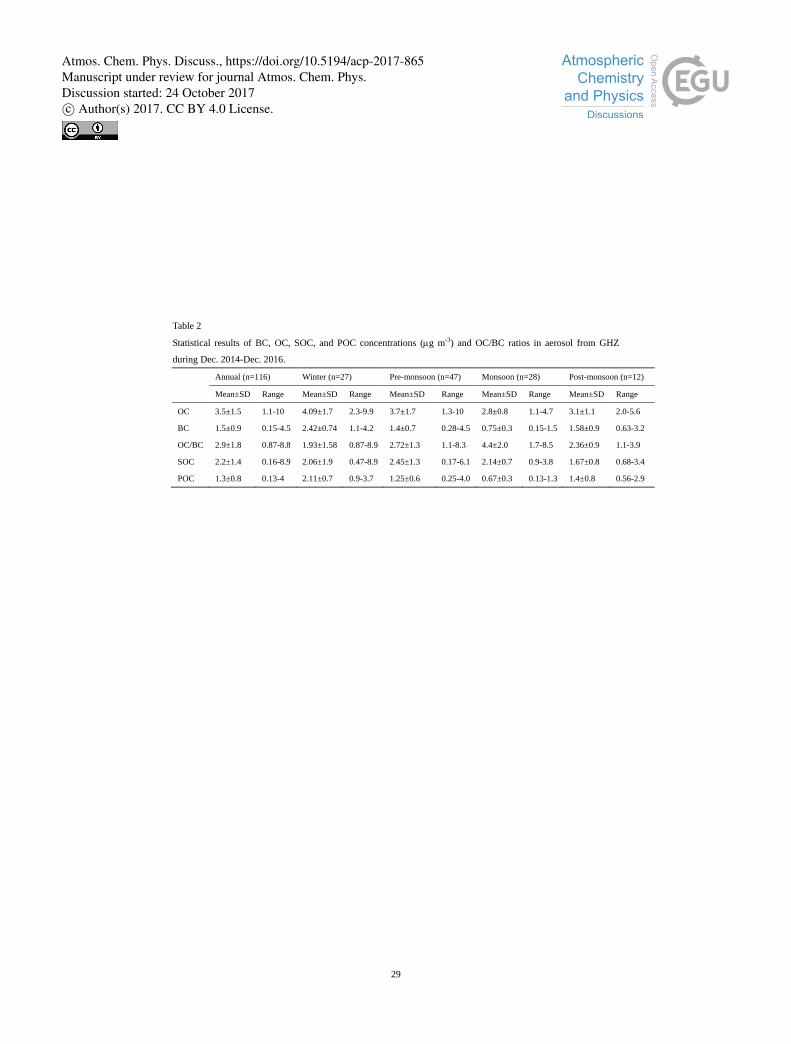
Statistical results of BC, OC, SOC, and POC concentrations in aerosol from the
GHZ site are shown in Table 2. The annual average BC concentration, 1.5 ± 0.9 g
m-3
, is slightly lower than that from Mt. Yulong, BC deposition in high elevation
areas of Mt. Yulong was primarily due to the long-range transport of biomass burning
from South Asia by crossing the Himalayas (Bonasoni et al., 2010; Lüthi et al., 2014; 20
Cong et al., 2015a, b; Li et al., 2016a, b; Wang et al., 2015). However, OC and SOC
annual mean concentrations, 3.5 ± 1.5 g m-3
and 2.2 ± 1.4 g m-3
, respectively, were
higher than those from Mt. Yulong. Therefore, carbonaceous matter associated with
OC (e.g., SOC, POC) in the GHZ basin was mainly contributed from fossil fuel
(vehicle) emissions. The GHZ basin has local emissions from the frequent and intense 25
tourism activities, including the use of vehicles, which is totally different from that of
Mt. Yulong. Maximum seasonal mean BC and OC concentration occurred in the
winter season (BC: 2.42 ± 0.74 g m-3
, OC: 4.09 ± 1.7 g m-3
, respectively) in the
GHZ basin, and their lowest concentrations conventionally occurred in monsoons
season (BC: 0.75 ± 0.3 g m-3
, OC: 2.8 ± 0.8 g m-3
, respectively). The pre-monsoon 30
Atmos. Chem. Phys. Discuss., https://doi.org/10.5194/acp-2017-865Manuscript under review for journal Atmos. Chem. Phys.Discussion started: 24 October 2017c© Author(s) 2017. CC BY 4.0 License.
12
season had the highest SOC concentration of 2.45 ± 1.3 g m-3
, ranging from 0.17-6.1
g m-3
. The mean SOC concentration in the monsoon season was larger than the
post-monsoon SOC in the GHZ basin (Table 2), which was typically due to the
extensive vehicle emissions and strong photochemical reactions during the monsoon
season. The seasonal variation of carbonaceous aerosols found in the GHZ basin was 5
somewhat different from that found in Mt. Yulong, probably because of the distinct
elevation difference and different degrees of human activities between the Mt. Yulong
and the GHZ sampling sites.
The OC/BC ratios at the two sites were relatively low, and they have distinct
seasonal variations and spatial differences over the Mt. Yulong region. The annual 10
average value was 2.06 ± 3.38 for Mt. Yulong, with the highest value occurred in the
pre-monsoon season (3.67 ± 5.7) and the lowest value in the post-monsoon season
(0.79 ± 0.4) (Table 1). Monthly variation of the average OC/BC ratio was determined
by the relative concentrations of BC and OC in aerosol, for example, the lowest
OC/BC ratio occurred in post-monsoon was due to substantially high BC 15
concentrations in that season (Fig. 6). The annual mean OC/BC ratio in samples from
the GHZ basin was 2.9 ± 1.8, while the monsoon season had the highest value (4.4 ±
2.0) and the winter season had the lowest value (1.93 ± 1.58) (Table 2). Previous
studies suggested that OC/BC ratios from biofuel and biomass burning emissions are
generally higher than those from fossil fuel combustion (Cao et al., 2013; Ram et al., 20
2012; Cong et al., 2015a; Wan et al., 2017). Strong photochemical reactions and
tourism activities in the monsoon season were likely the main factors that result in
relatively high OC/BC ratios in GHZ.
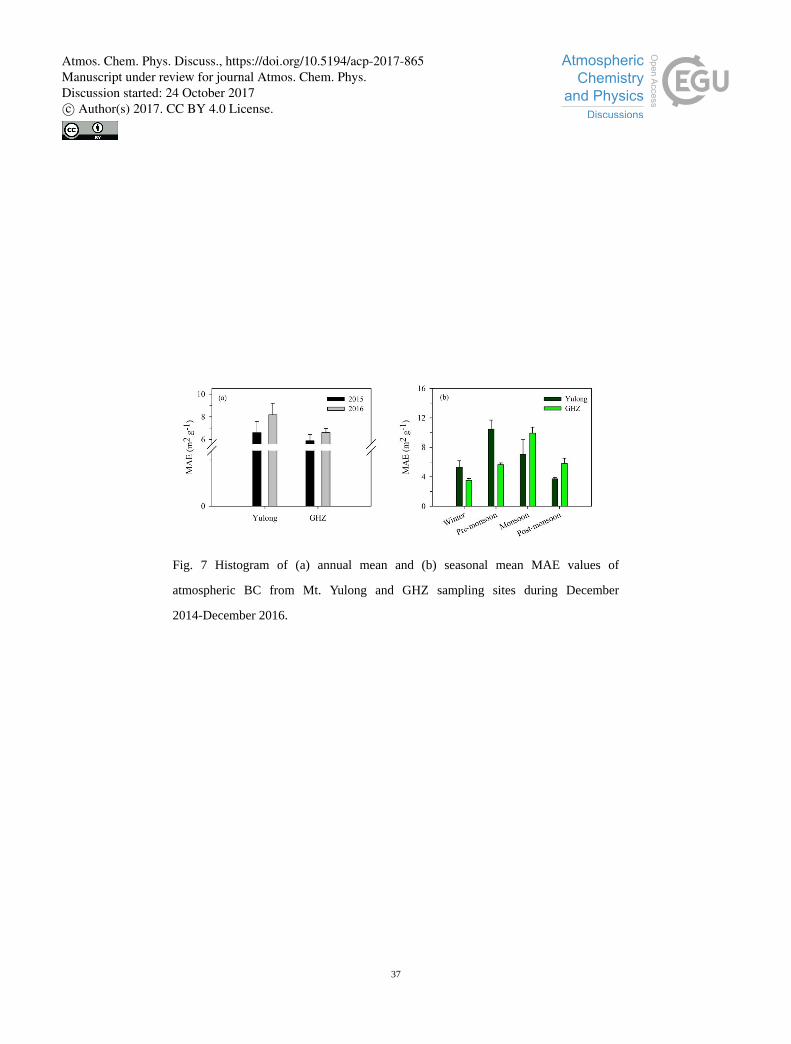
3.2 Optical properties of BC
The corrected MAE values of BC at 632 nm were 7.38 ± 1.01 and 6.25 ± 0.46 m2 25
g-1
for Mt. Yulong and GHZ samples, respectively. The BC MAE has distinct seasonal
variations, with the peak of BC MAE values in the pre-monsoon and monsoon
seasons at Mt. Yulong and GHZ, respectively (Fig. 7). The high MAE values suggest
an enhancement of MAE (or absorption amplification) by external-coating with OC
(particularly SOC) (Cheng et al., 2011a; Knox et al., 2009; Schnaiter et al., 2005). 30
Atmos. Chem. Phys. Discuss., https://doi.org/10.5194/acp-2017-865Manuscript under review for journal Atmos. Chem. Phys.Discussion started: 24 October 2017c© Author(s) 2017. CC BY 4.0 License.
13
Strong seasonal and spatial differences of BC MAE values in Mt. Yulong and GHZ
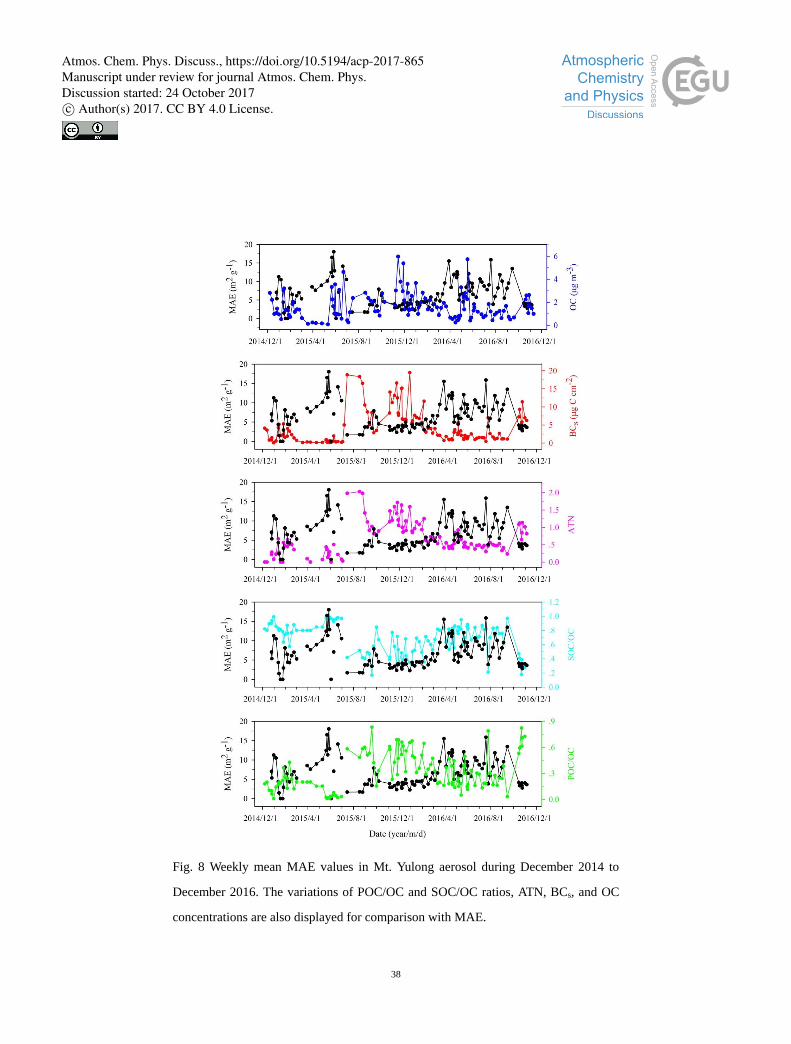
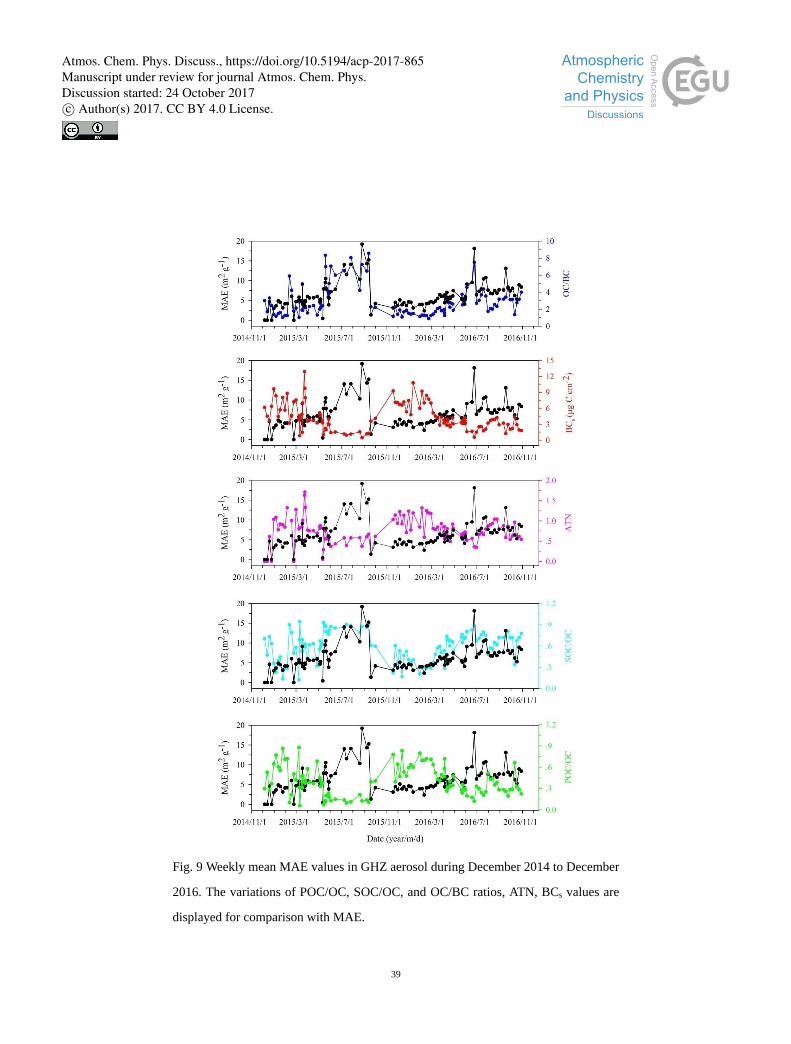
largely related to OC and SOC abundance. Furthermore, the variations of weekly
mean MAE are consistent with the variations of OC concentration and SOC/OC ratio
in Mt. Yulong (Fig. 8 and 9), as well as agree well with the trend of OC/BC ratio (Fig.
9). MAE and POC/OC ratio, ATN, and BCs are negatively correlated. The 5
correlations between MAE and OC/BC ratio, SOC/OC ratio, and OC appear to be
substantially influenced by the OC abundance. The availability of OC or SOA for
external-coating is somewhat responsible for the variations of mean BC MAE (Knox
et al., 2009). Values of atmospheric BC MAE are also dependent on the extent of
internal-mixing of the BC with other substances (Cappa et al., 2012; Schnaiter et al., 10
2005). Atmospheric BC light absorption is linearly proportional to the BC
concentration since BC particles are small enough (Schwarz et al., 2013).
Many previous studies have quantified the BC MAE values at various sites (Bond
and Bergstrom, 2006; Cheng et al., 2011a; Knox et al., 2009; Ram and Sarin, 2009; Li
et al., 2016c). However, large uncertainties exist among different calculation 15
approaches. Measurement methods of ATN and ECs (various temperature protocols)
definitely affect the BC MAE (Cheng et al., 2011a, b; Li et al., 2016c). In addition,
biomass burning and brown carbon (BrC) decrease the BC MAE. BrC is less
absorptive comparing with pure BC (Cheng et al., 2011a). BrC emitted from biomass
burning considerably lower MAE values (Jeong et al., 2004). Whereas coating by 20
organic aerosol (particularly SOC) or mix-state can enhance the MAC values (Knox
et al., 2009).
3.3 Controls of carbonaceous matter components
Our results show that carbonaceous matter (BC, OC, SOC) in aerosol exhibited an
apparent spatial discrepancy between Mt. Yulong and GHZ. In addition to the 25
elevation difference, other potential factors accounting for this discrepancy need to be
evaluated in depth. Concentrations of carbonaceous aerosols from GHZ were higher
than those from Mt. Yulong, except for BC concentration, which to a large extent,
indicate that carbonaceous matter in the Mt. Yulong region was primarily due to local
vehicle (tour bus) emissions (e.g., 1.87 Tg C in 2016 in Yunnan province, China). 30
Atmos. Chem. Phys. Discuss., https://doi.org/10.5194/acp-2017-865Manuscript under review for journal Atmos. Chem. Phys.Discussion started: 24 October 2017c© Author(s) 2017. CC BY 4.0 License.
14
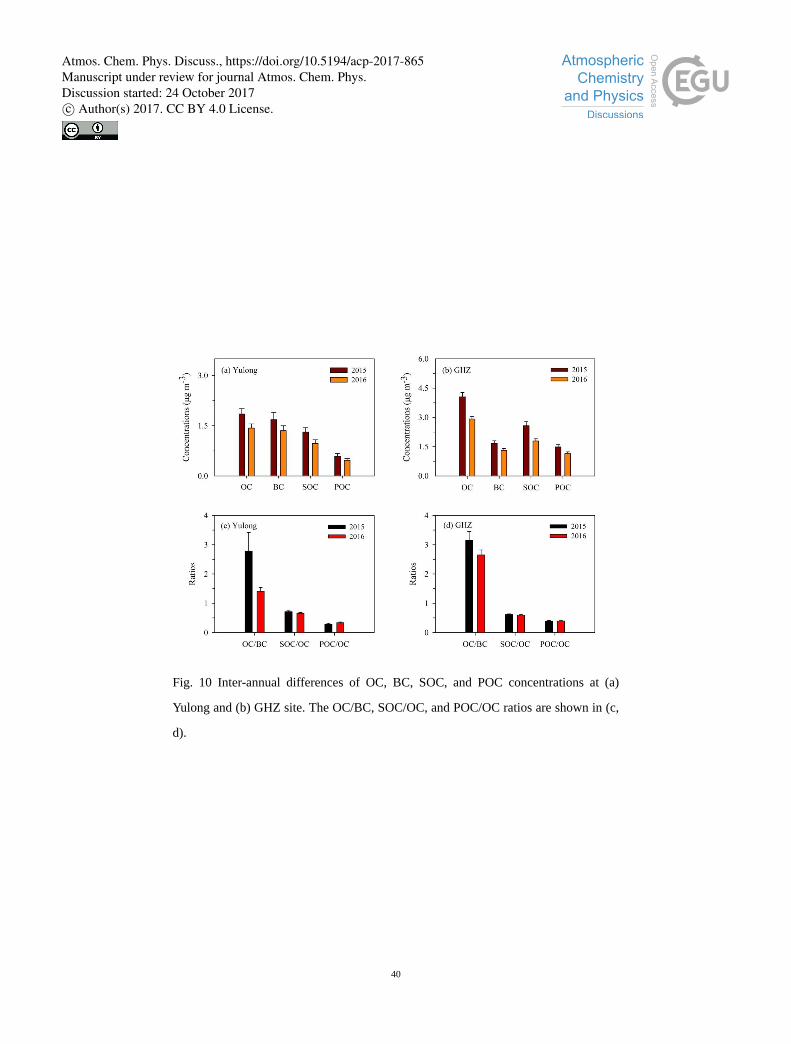
In addition, inter-annual differences of carbonaceous aerosol from Mt. Yulong and
GHZ were also distinct (Fig. 10). The annual mean concentrations of carbonaceous
matter collected in 2016 were lower than those in 2015 for the two sites (Fig 10 a, b),
indicating that the improvement of local atmospheric environment in the Mt. Yulong
region might ascribe to strict mitigation measures. For example, the amount of soot 5
emissions (2.44 Tg C) in 2016 were reduced by 21.76% compared to 2015 in Yunnan
province (http://www.zhb.gov.cn/). The average OC/BC ratios also decreased in 2016
compared to 2015, whereas the mean SOC/OC and POC/OC ratios have no obvious
difference between the two years in both Mt. Yulong and GHZ (Fig. 10). However, it
is complex to accurately evaluate the inter-annual variations of OC/BC ratios in the 10
current study.
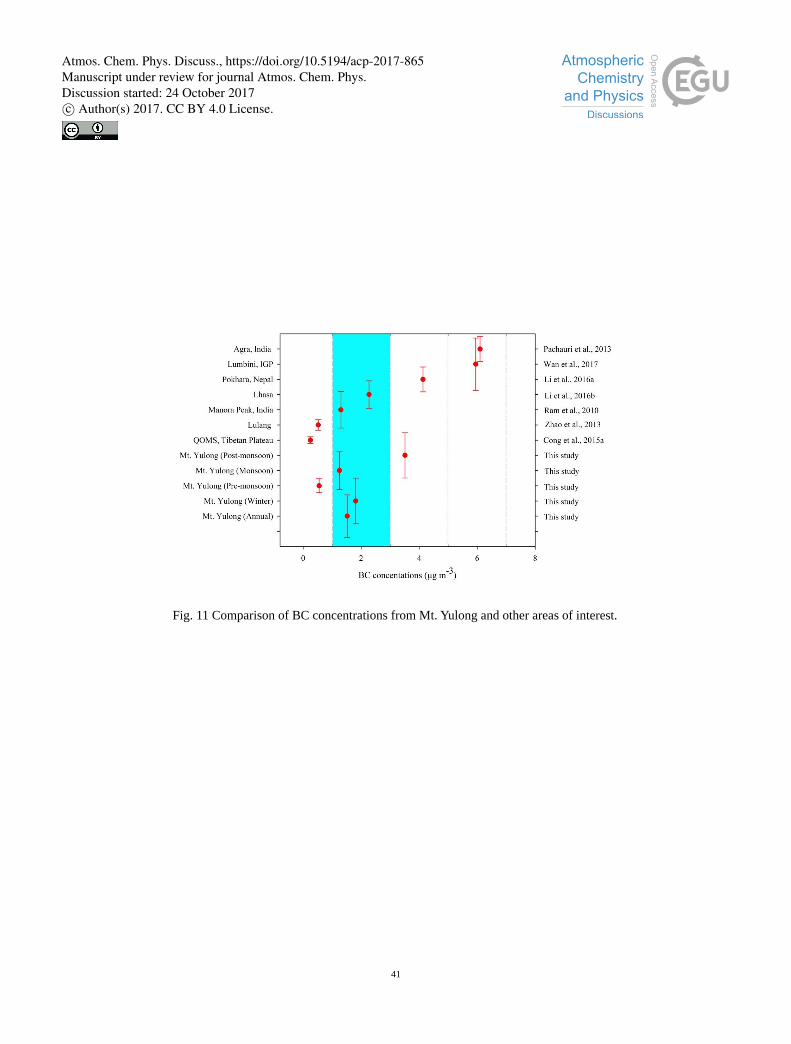
We also compare atmospheric BC concentrations in Mt. Yulong with other
interested areas. It shows that BC concentrations in Mt. Yulong aerosol were relatively
low and, among the compared values, most of BC concentrations were typically
within the range of 1.0-3.0 g m-3
(Fig. 11), while some of values were extremely low 15
(close to 0.5 g m-3
) and high (above 6.0 g m-3
). The low BC concentrations were
typically found in the TP, e.g., QSMS, TP (Cong et al., 2015a), pre-monsoon season in
Mt Yulong. Whereas the BC concentrations in Agra, India (6.1 ± 0.83 g m-3
) (Pachauri
et al., 2013) were almost three folds of values found in Mt. Yulong. Agra and Lumbini
have been identified as regions in the world that are highly affected by biomass 20
burning (Wan et al., 2017). A large amount of carbonaceous aerosols emitted from
those regions can reach Mt. Yulong by crossing the Himalayas (e.g., Lüthi et al.,
2014), which substantially influence the Mt. Yulong region.
3.4 Source apportionments of carbonaceous aerosols
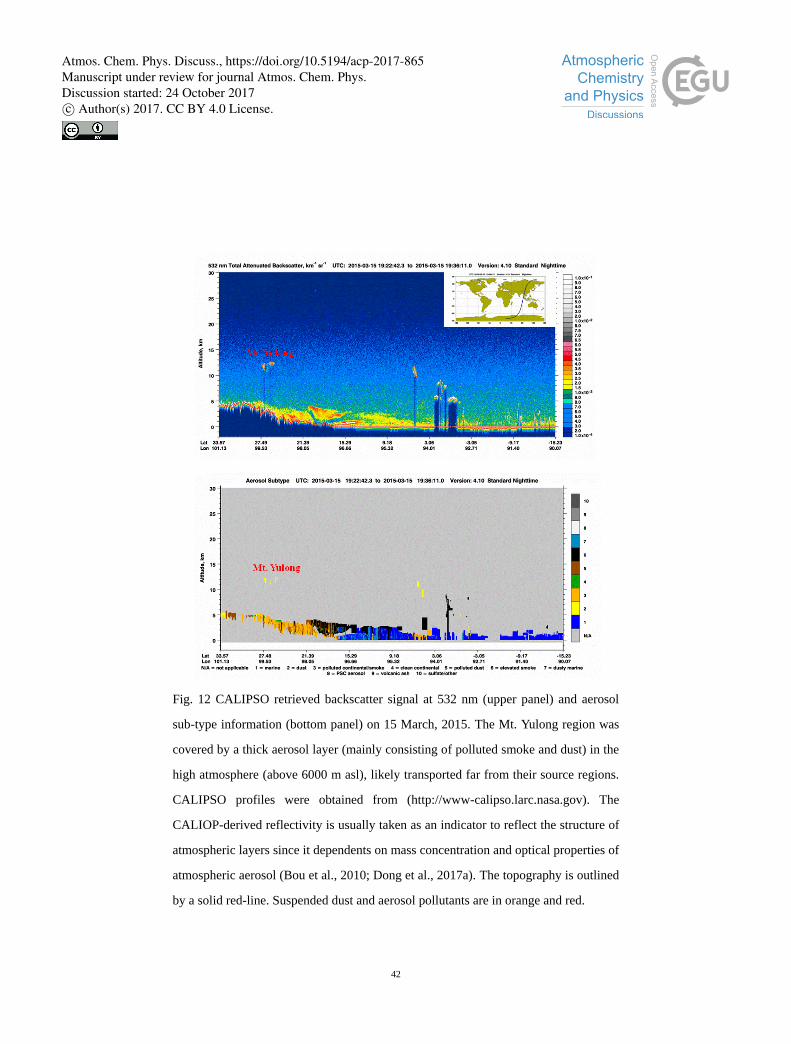
Aerosol vertical distributions from CALIOP retrievals often reveal that smoke 25
plume could reach approximately 6 km (Fig. 12), which is higher than most of the
mountains and mountain glaciers in the Himalaya regions. Some typical
CALIOP/CALIPSO transections, having strong backscattering signal (i.e., 532 nm
total attenuated backscatter), show spatially continuous atmospheric pollutant layers
from the ocean all the way to Mt. Yulong (Fig. 12), indicating a penetration of smoke 30
Atmos. Chem. Phys. Discuss., https://doi.org/10.5194/acp-2017-865Manuscript under review for journal Atmos. Chem. Phys.Discussion started: 24 October 2017c© Author(s) 2017. CC BY 4.0 License.
15
plume toward the inland of the TP. It was reported that the pre-monsoon season is the
major vegetation-fire period in the foothill areas of the southern Himalaya (Vadrevu et
al., 2012; Putero et al., 2014), and the winds surrounding the Himalayas and TP could
facilitate the transport of carbonaceous matter from South Asia to the Himalayas
(Cong et al., 2015b; Dong et al., 2017b). 5
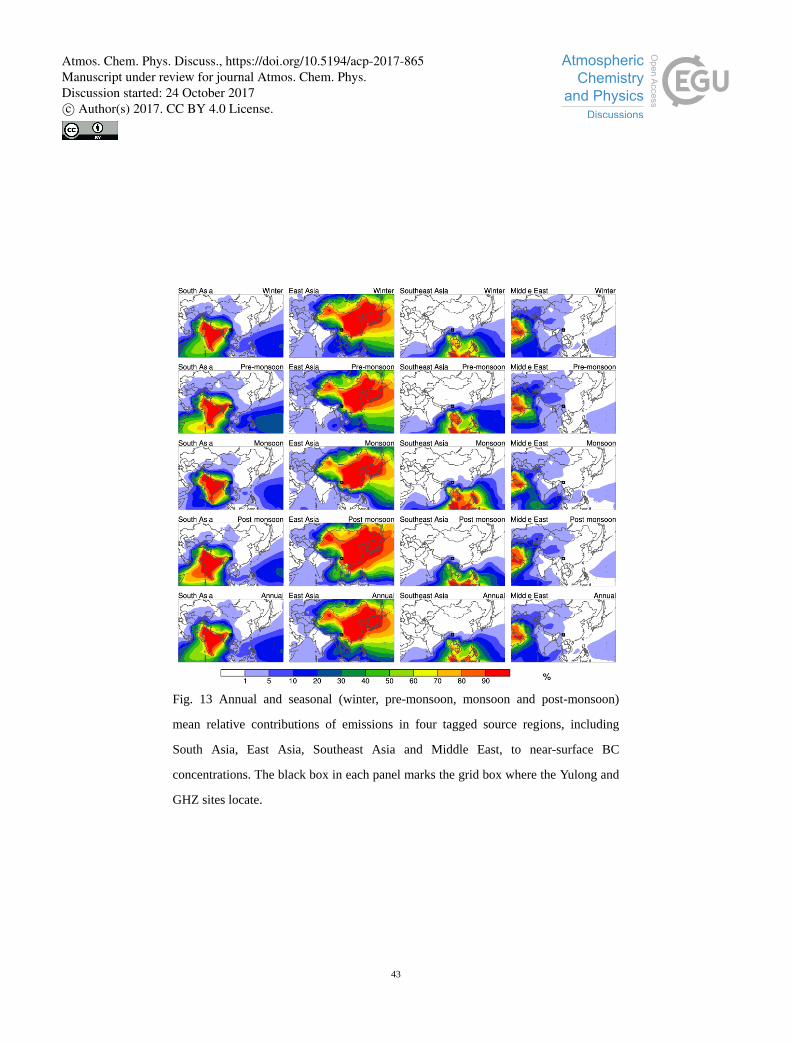
We analyze the CAM5 model results to quantify the source attributions of BC at the
surface measurement stations. BC emissions from each of the four source regions in
the surrounding area (i.e., South Asia, East Asia, Middle East and Southeast Asia) are
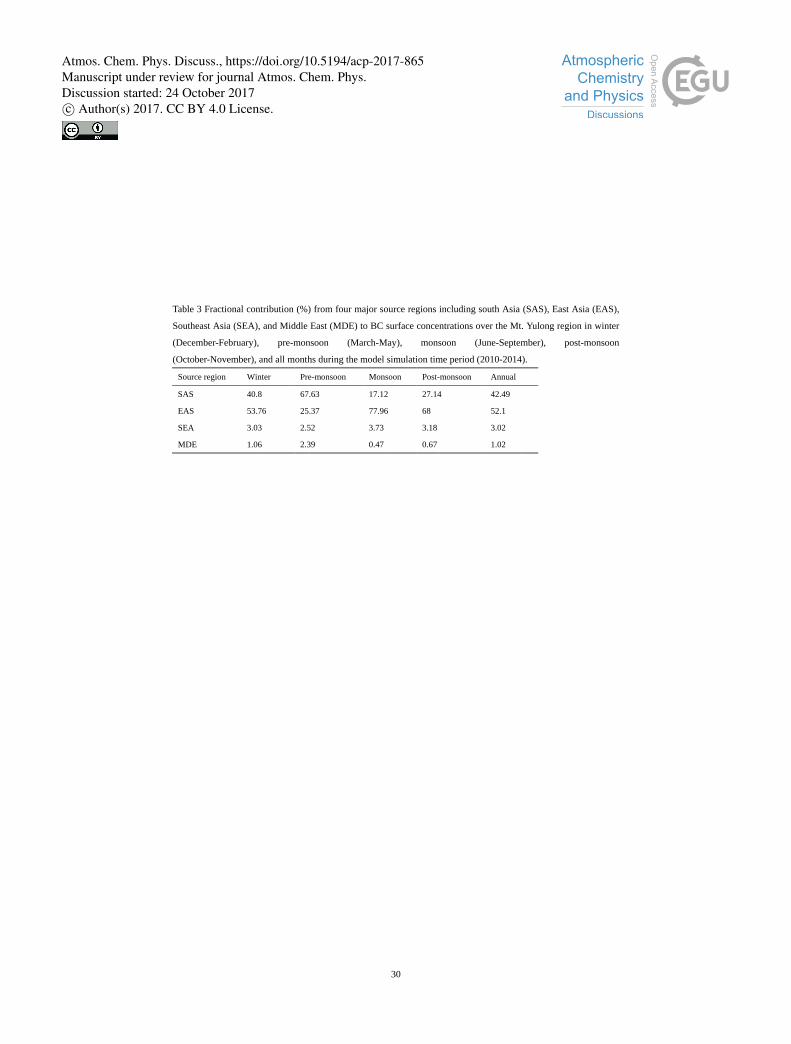
explicitly tracked. Figure 13 shows the annual and seasonal mean relative
contributions from the tagged source regions. The two sampling sites locate in the 10
same model grid box, as marked in the figure. The modeled near-surface BC is
predominately (more than 90%) from South Asia and East Asia. East Asia has a
dominant contribution in the monsoon, post-monsoon and winter seasons, while South
Asia dominates in the pre-monsoon season (Table 3). Thus relatively high BC
concentrations in the high atmosphere (approximately 5000 m asl) of Mt. Yulong 15
indicate an important role of the long-range transport of biomass and biofuel burning
emissions from South Asia (e.g., Cong et al., 2015a, b; Lee et al., 2013; Li et al., 2016
a, b; Lüthi et al., 2014) and East Asia. As discussed by Wang et al. (2015), circulation
patterns during the monsoon and non-monsoon seasons largely determine the seasonal
variations in the transport of aerosols from the different major sources to the 20
southeastern TP. Strong precipitation during the monsoon season can substantially
remove atmospheric BC during the transport, especially, from South Asia. Although
smoke plumes can sometimes be lifted over the natural block of the Himalayas, they
have relatively less important contribution to the surface than to the upper-level BC
concentrations. Therefore, emissions from East Asia, including location sources, have 25
a dominant contribution to the near-surface BC at the Mt. Yulong sites during the
monsoon and post-monsoon seasons, as well as the winter season. The seasonal
changes in source apportionments also have an implication on the cause of variations
in OC/BC ratios over the southeastern TP (e.g., Wang et al., 2015).
4. Conclusions and remarks 30
Atmos. Chem. Phys. Discuss., https://doi.org/10.5194/acp-2017-865Manuscript under review for journal Atmos. Chem. Phys.Discussion started: 24 October 2017c© Author(s) 2017. CC BY 4.0 License.
16
Carbonaceous aerosols from the Mt. Yulong region and GHZ basin were measured
to investigate the spatio-temporal variations and light-absorbing properties. Results of
first two years of continuous observations show that the annual mean BC and OC
concentrations in aerosol were 1.51 ± 0.93 and 2.57 ± 1.32 g m-3
, respectively. The
average SOC concentrations were 1.67 ± 1.15 g m-3
determined using BC-tracer 5
method.
Concentrations of carbonaceous matter displayed distinct seasonal differences, with
the lowest content found in monsoon season and the highest concentration in winter
season. Monthly mean BC concentrations in aerosols from monsoon to post-monsoon
season were higher than OC, a large impact from biomass burning emissions in the 10
high atmosphere (approximately 5000 m asl) of Mt. Yulong. The seasonal differences
of carbonaceous matter found in GHZ basin were different with that in Mt. Yulong,
distinct elevation difference and different degrees of human activities between the two
sites were the main reasons account for the discrepancy. Furthermore, high
carbonaceous matter associated with OC (e.g., SOC, POC) in carbonaceous aerosols 15
in GHZ basin was mainly contributed from vehicle emissions. Therefore there have
distinct spatial differences in the concentrations of carbonaceous matter in this
glacierized region. Moreover, inter-annual differences of carbonaceous aerosols in Mt.
Yulong and GHZ were also distinct. The annual mean concentrations of carbonaceous
matter in 2016 were totally lower than those in 2015, indicating the improvement of 20
local atmospheric environment in the Mt. Yulong region.
The annual mean OC/BC ratio was 2.45 ± 1.96 in Mt. Yulong, with the highest
value in monsoon season (4.4 ± 2.0) and the lowest in winter (0.79 ± 0.4). Strong
photochemical reactions and local tourism activities in monsoon season were the main
factors resulting in relatively high OC/BC ratios in the Mt. Yulong region, particularly 25
in GHZ basin.
BC MAE was quantified using a thermal-optical carbon analyzer, and was
measured at 632 nm under the quartz filter-based method. The corrected mean BC
MAE at 632 nm was 6.82 ± 0.73 m2 g
-1 in the Mt. Yulong region, comparable with the
results in other studies. The trends of weekly mean BC MAE consistent with the 30
Atmos. Chem. Phys. Discuss., https://doi.org/10.5194/acp-2017-865Manuscript under review for journal Atmos. Chem. Phys.Discussion started: 24 October 2017c© Author(s) 2017. CC BY 4.0 License.
17
variations of OC concentrations, SOC/OC, and OC/BC ratios. Strong seasonal and
spatial discrepancies of BC MAE in the study area were largely related to the OC and
SOA abundance. The enhancement of MAE was mainly due to external-coating of
OC (particularly SOA) and/or mixing state.
To quantitatively estimate the source apportionment of BC at the Mt. Yulong sites, 5
we used a global aerosol-climate model, in which BC emissions from four regions
(i.e., South Asia, East Asia, Middle East and Southeast Asia) are explicitly tracked.
The five-year (2010-2014) mean results show that East Asia has the largest
contribution (52%) to the annual mean near-surface BC concentration at the two sites,
followed by South Asia (43%). There is a quite strong seasonal variation in the source 10
apportionment. East Asia has a dominant contribution in the monsoon and
post-monsoon seasons, while South Asia dominates in the pre-monsoon season.
The authors declare that they have no conflict of interest.
15
Acknowledgements
This work was supported by the National Natural Science Foundation of China
(41601071, 41421061, 41225002), the Chinese Academy of Sciences (CAS)
(KJZD-EW-G03-04), the "Light of West China" Program (Y62992) and the
independent program of SKLCS (SKLCS-22-2017), and China Postdoctoral Science 20
Foundation (2015M582725, 2016T90963) and Youth Talent Program of CAREERI
CAS (Y551C11001). R. Zhang acknowledges support from NSFC (41605041),
Jiangsu Provincial Science Fund (BK20160621), Fundamental Research Funds for the
Central Universities (020714380020) and International Postdoctoral Exchange
Fellowship (20160046). H. Wang and Y. Qian acknowledge support from the U.S. 25
Department of Energy (DOE), Office of Science, Biological and Environmental
Research as part of the Earth System Modeling program. The Pacific Northwest
National Laboratory (PNNL) is operated for DOE by Battelle Memorial Institute
under contract DE-AC05-76RLO1830. The model simulations were performed using
PNNL Institutional Computing resources. 30
Atmos. Chem. Phys. Discuss., https://doi.org/10.5194/acp-2017-865Manuscript under review for journal Atmos. Chem. Phys.Discussion started: 24 October 2017c© Author(s) 2017. CC BY 4.0 License.
18
References
Andreae, M. O.: Climatic effects of changing atmospheric aerosol levels, in: World
Survey of Climatology, Future Climates of the World, edited by: Henderson-Sellers,
A., Elsevier, Amsterdam, Vol. 16, pp. 341-392, 1995.
Andreae, M. O. and Gelencsér, A.: Black carbon or brown carbon? The nature of 5
light-absorbing carbonaceous aerosols, Atmos. Chem. Phys., 6, 3131-3148,
doi:10.5194/acp-6-3131-2006, 2006.
Bergstrom, R. W., Ackerman, T. P., and Richards, L. W.: Optical Properties of
particulate elemental carbon. Particulate carbon: atmospheric life cycle, edited by:
Wolff, G. T. and Klimisch, R. L., Plenum Press, New York, USA, 43-51, 1982. 10
Bonasoni, P., Laj, P., Marinoni, A., Sprenger, M., Angelini, F., Arduini, J., Bonafe, U.,
Calzolari, F., Colombo, T., Decesari, S., Di Biagio, C., Di Sarra, A., Evangelisti, F.,
Duchi, R., Facchini, M., Fuzzi , S., Gobbi, G., Maione, M., Panday, A., Roccato, F.,
Sellegri, K., Venzac, H., Verza, G., Villani, P., Vuillermoz, E., Cristofanelli, P.:
Atmospheric brown clouds in the Himalayas: first two years of continuous 15
observations at the Nepal Climate Observatory-Pyramid (5079 m), Atmos. Chem.
Phys. 10, 75150-7531, 2010.
Bond, T. C., Habib, G., and Bergstrom, R. W.: Limitations in the enhancement of
visible light absorption due to mixing state, J. Geophys. Res., 111, D20211,
doi:10.1029/2006JD007315, 2006. 20
Bond, T. C., and Bergstrom, R. W.: Light absorption by carbonaceous particles: an
investigative review, Aerosol Sci. Technol. 40:27-67, 2006.
Bond, T. C., et al.: Bounding the role of black carbon in the climate system: A
scientific assessment, J. Geophys. Res. Atmos., 118, 5380-5552,
doi:10.1002/jgrd.50171, 2013. 25
Brimblecombe, P.: The big smoke: a history of air pollution in London since medieval
times, London, New York, Methuen, 185 p., 1987.
Cappa, C. D. et al.: Radiative absorption enhancements due to the mixing state of
atmospheric black carbon, Science 31, 337, 1078-1081, 2012.
Carslaw, K. S., Boucher O., Spracklen D. V., Mann G. W., Rae J. G. L., Woodward S., 30
Atmos. Chem. Phys. Discuss., https://doi.org/10.5194/acp-2017-865Manuscript under review for journal Atmos. Chem. Phys.Discussion started: 24 October 2017c© Author(s) 2017. CC BY 4.0 License.
19
Kulmala M.: A review of natural aerosol interactions and feedbacks within the
Earth system, Atmos. Chem. Phys., 10, 1701-1737, 2010.
Castro, L, P. C, Harrison, R. M, et al.: Carbonaceous aerosol in urban and rural
European atmospheres: estimation of secondary organic carbon concentrations,
Atmos. Environ., 33, 2771-2781, 1999. 5
Cao, J. J., Tie, X., Xu, B. Q., Zhao, Z., Zhu, C., Li G., Liu S.: Measuring and
modeling black carbon (BC) contamination in the SE Tibetan Plateau, J. Atmos.
Chem. 67, 45-60. 2010.
Cao, J. J., Zhu, C. S., Tie, X. X., Geng, F. H., Xu, H. M., Ho, S. S. H., Wang, G. H.,
Han, Y. M., Ho, K.F.: Characteristics and sources of carbonaceous aerosols from 10
Shanghai, China, Atmos. Chem. Phys., 13, 803-817, 10.5194/acp-13-803-2013,
2013.
Chen, P. F, Kang, S. C, Li, C. L., Rupakheti, M., et al.: Characteristics and sources of
polycyclic aromatic hydrocarbons in atmospheric aerosols in the Kathmandu Valley,
Nepal, Sci. of the Tot. Environ., 538, 86-92, 2015. 15
Cheng, Y., He, K. B., Zheng, M., Duan, F. K., Du, Z. Y., Ma, Y. L., Tan, J. H.: Mass
absorption efficiency of elemental carbon and water-soluble organic carbon in
Beijing, China, Atmos. Chem. Phys., 11, 11497-11510, 2011a.
Cheng, Y., He, K. B., Duan, F. K., Zheng, M., Du, Z. Y., Ma, Y. L., Tan, J. H.:
Ambient organic carbon to elemental carbon ratios: Influences of the measurement 20
methods and implications. Atmos. Environ., 45, 2060-2066, 2011b.
Chow, J. C., Watson, J. G., Pritchett, L. C., Pierson, W. R., Frazier, C. A., and Purcell,
R. G.: The DRI Thermal/Optical Reflectance carbon analysis system: description,
evaluation and applications in U.S. air quality studies, Atmos. Environ., 27A,
1185-1201, 1993. 25
Chow, J. C, Watson, J. G., Crow, D.: Comparison of IMPROVE and NIOSH carbon
measurements, Aerosol Sci. Technol., 34, 23-34, 2001.
Chung, S. H., Seinfeld, J. H.: Climate response of direct radiative forcing of
anthropogenic black carbon, J. Geophys. Res., 110, D11102,
doi:10.1029/2004JD005441, 2005. 30
Atmos. Chem. Phys. Discuss., https://doi.org/10.5194/acp-2017-865Manuscript under review for journal Atmos. Chem. Phys.Discussion started: 24 October 2017c© Author(s) 2017. CC BY 4.0 License.
20
Cong, Z. Y., Kang, S. C., Kawamura, K.: Carbonaceous aerosols on the south edge of
the Tibetan Plateau: concentrations, seasonality and sources, Atmos. Chem. Phys.
Discuss., 15, 1573-1584, 2015a.
Cong, Z. Y., Kawamura, K., Kang, S. C., et al.: Penetration of biomass-burning
emissions from South Asia through the Himalayas: new insights from atmospheric 5
organic acids, Scientific Report, 5, 9580, Doi:10.1038/srep09580, 2015b.
Ding, A. J., Huang, X., Nie, W., Sun, J. N., Kerminen, V., Petäjä, T., Su, H., Cheng. Y.
F., Yang, X. Q., Wang, M. H., Chi, X. G., Wang, J. P., Virkkula, A., Guo, W. D.,
Yuan, J., Wang, S. Y., Zhang, R. J., Wu, Y. F., Song, Y., Zhu, T., Zilitinkevich, S.,
Kulmala, M., and Fu, C. B.: Enhanced haze pollution by black carbon in megacities 10
in China, Geophys. Res. Lett., 43, 2873-2879, 2016.
Doherty, S. J., Grenfell, T. C., Forsström, S.: Observed vertical redistribution of black
carbon and other insoluble light-absorbing particles in melting snow, J. Geophys
Res-Atmos., 118, 5553-5569, 2013.
Dong, Z. W., Kang, S. C., Qin, D. H., Qin, X., Yan, F. P., Du, W. T., Wei, T.: Temporal 15
and diurnal analysis of trace elements in the Cryospheric water at remote Laohugou
basin in northeast Tibetan Plateau, Chemosphere, 171, 386-398, 2017a.
Dong, Z. W., Kang, S. C., Guo, J. M., Wang, X. J., Qin, D. H.: Composition and
mixing states of brown haze particle over the Himalayas along two transboundary
south-north transects. Atmos. Environ., 156, 24-35, 2017b. 20
Doran, J. C., Barnard, J. C., Arnott, W. P., Cary, R., Coulter, R., Fast., J. D., Kassianov,
E. I., Kleinman, L., Laulainen, N. S., Martin, T., Paredes-Miranda, G., Pekour, M.
S., Shaw, W. J., Smith, D. F., Springston, S. R., and Yu, X. Y.: The T1-T2 study:
evolution of aerosol properties downwind of Mexico city, Atmos. Chem. Phys., 7,
1585-1598, 2007. 25
Flanner, M. G., Zender, C. S., Hess, P. G., Mahowald, N. M., Painter, T. H.,
Ramanathan, V., Rasch P. J.: Springtime warming and reduced snow cover from
carbonaceous particles, Atmos. Chem. Phys. 9, 2481-2497,
doi:10.5194/acp-9-2481- 2009, 2009.
Jacobson, M. Z.: Strong radiative heating due to the mixing state of black carbon in 30
Atmos. Chem. Phys. Discuss., https://doi.org/10.5194/acp-2017-865Manuscript under review for journal Atmos. Chem. Phys.Discussion started: 24 October 2017c© Author(s) 2017. CC BY 4.0 License.
21
atmospheric aerosols, Nature, 409, 695-697, 2001.
Jacobson, M. Z.: Climate response of fossil fuel and biofuel soot, accounting for
soot’s feedback to snow and sea ice albedo and emissivity, J. Geophys. Res., 109,
D21201, doi:10.1029/2004JD004945, 2004.
Jeong, C. H., Hopke, P. K., Kim, E., and Lee, D. W.: The comparison between 5
thermal-optical transmittance elemental carbon and Aethalometer black carbon
measured at multiple monitoring sites, Atmos. Environ., 38, 5193-5204, 2004.
Jerret, M., Burnett, R. T., Ma, R., Pope, C. A., Krewski, D., Newbold, K. B., Thurston,
G., Shi, Y., Finkelstein, N., Calle, E. E., and Thun, M. J.: Spatial analysis of air
pollution and mortality in Los Angeles, Epidemiology, 16, 727-736, 2005. 10
Kang, S. C., Mayewski, P. A., Qin, D. H., Sneed, S. R., Ren, J. W. and Zhang, D. Q.:
Seasonal differences in snow chemistry from the vicinity of Mt. Everest, central
Himalayas, Atmos. Environ., 382819-2829, 2004.
Kang, S. C., Zhang, Q. Q., Kaspari, S. S., Qin, D. H., Cong, Z. Y., Ren, J. W. and
Mayewski, P. A.: Spatial and seasonal variations of elements composition in Mt. 15
Everest (Qomolangma) snow/firn, Atmos. Environ., 41, 7208-7218, 2007.
Knox, A., Evans, G. J., Brook, J. R., Yao, X., Jeong, C. H., Godri, K. J., Sabaliauskas,
K., Slowik J. G.: Mass absorption cross-section of ambient black carbon aerosol in
relation to chemical age, Aerosol Science and Technology, 43, 6, 522-532, DOI:
10.1080/02786820902777207, 2009. 20
Hansen, J., and Nazarenko, L.: Soot climate forcing via snow and ice albedos, Proc.
Natl. Acad. Sci. USA, 101(2), 423-428, doi:10.1073/pnas.2237157100, 2004.
Hansen, J., Sato, M., Ruedy, R., et al.: Efficacy of climate forcings, J. Geophys. Res.,
110, D18104, doi:10.1029/2005JD005776, 2005.
Hoesly, R. M., Smith, S. J., Feng, L., Klimont, Z., Janssens-Maenhout, G., Pitkanen, 25
T., Seibert, J. J., Vu, L., Andres, R. J., Bolt, R. M., Bond, T. C., Dawidowski, L.,
Kholod, N., Kurokawa, J. I., Li, M., Liu, L., Lu, Z., Moura, M. C. P., O'Rourke, P.
R., and Zhang, Q.: Historical (1750-2014) anthropogenic emissions of reactive
gases and aerosols from the Community Emission Data System (CEDS), Geosci.
Model Dev. Discuss., doi:10.5194/gmd-2017-43, in review, 2017. 30
Atmos. Chem. Phys. Discuss., https://doi.org/10.5194/acp-2017-865Manuscript under review for journal Atmos. Chem. Phys.Discussion started: 24 October 2017c© Author(s) 2017. CC BY 4.0 License.
22
IPCC, 2013.: Summary for Policymakers. In: Climate Change 2013: The Physical
Science Basis. Contribution of Working Group I to the Fifth Assessment Report of
the Intergovernmental Panel on Climate Change, (Stocker, T. F., Qin, D., Plattner, G.
K., et al.: Cambridge University Press, Cambridge, United Kingdom and New York:
NY, USA. 129-234, 2013.) 5
Knox, A., Evans, G. J., Brook, J. R., Yao, X., Jeong, C. H., Godri, K. J., Sabaliauskas,
K., and Slowik, J. G.: Mass absorption cross-section of ambient black carbon
aerosol in relation to chemical age, Aerosol Sci. Technol., 43, 522-532, 2009.
Lee, W. S., Bhawar, R. L., Kim, M. K., Sang, J.: Stud y of aerosol effect on
accelerated snow melting over the Tibetan Plateau during boreal spring, Atmos. 10
Environ., 75, 113-122, 2013.
Li, C. L., Yan, F. P., Kang, S. C., et al.: Light absorption characteristics of
carbonaceous aerosols in two remote stations of the southern fringe of the Tibetan
Plateau, China, Atmos. Environ., 143, 79-85, 2016a.
Li, C. L. et al.: Sources of black carbon to the Himalayan-Tibetan Plateau glaciers, 15
Nat. Commun., 7, 12574, doi: 10.1038/ncomms12574, 2016b.
Li, C. L., Chen, P. F., Kang, S. C., Yan, F. P., Hu, Z. F., Qu, B.: Concentrations and
light absorption characteristics of carbonaceous aerosol in PM2.5 and PM10 of Lhasa
city, the Tibetan Plateau, Atmos. Environ., 127, 340-346, 2016c.
Liousse, C., Cachier, H., and Jennings, S. G.: Optical and thermal measurements of 20
black carbon aerosol content in different environments: variation of the specific
attenuation cross-section, sigma (σ), Atmos. Environ., 27A, 1203-1211, 1993.
Liu, J. B., Rühland, K. M., Chen, J. H., Xu, Y. Y., Chen, S. Q., Chen, Q. M., Huang,
W., Xu, Q. H., Chen, F. H., Smol, J. P.: Aerosol-weakened summer monsoons
decrease lake fertilization on the Chinese Loess Plateau, Nature Climate Change, 25
DOI:10.1038/NCLIMATE3220, 2017.
Lohmann, U. and Feichter, J.: Global indirect aerosol effects: a review, Atmos. Chem.
Phys., 5, 715-737, 2005.
Lüthi, Z. L, Skerlak, B., Kim, S. W., et al.: Atmospheric brown clouds reach the
Tibetan Plateau by crossing the Himalayas, Atmos. Chem. Phys. Discuss., 14, 30
Atmos. Chem. Phys. Discuss., https://doi.org/10.5194/acp-2017-865Manuscript under review for journal Atmos. Chem. Phys.Discussion started: 24 October 2017c© Author(s) 2017. CC BY 4.0 License.
23
28105-28146, 2014.
Ma, P. L., Rasch, P. J., Wang, H., Zhang, K., Easter, R. C., Tilmes, S., Fast, J. D., Liu,
X., Yoon, J. H., and Lamarque, J. F.: The role of circulation features on black
carbon transport into the Arctic in the Community Atmosphere Model version 5
(CAM5), J. Geophys. Res. Atmos., 118, 4657-4669, doi:10.1002/jgrd.50411, 2013. 5
Mandal, P., Saud, T., Sarkar, R., Mandal, A., Sharma, S. K., Mandal, T. K., and Bassin,
J. K.: High seasonal variation of atmospheric C and particle concentrations in Delhi,
India, Environ. Chemi. Lett., 12, 225-230, 10.1007/s10311-013-0438-y, 2014.
Ming, J., Wang, P. L., Zhao, S. Y., Chen, P. F.: Disturbance of light-absorbing aerosols
on the albedo in a winter snowpack of Central Tibet, J. of Environ. Sci., 25(8), 10
1601-1607, 2013.
Nie, J., Garzione, C., Su, Q., Liu, Q., Zhang, R., Heslop, D., Necula, C., Zhang, S.,
Song, Y., Luo, Z.: Dominant 100,000-year precipitation cyclicity in a late Miocene
lake from northeast Tibet, Sci. Adv. 3, e1600762. 2017.
Niu, H. W., He, Y. Q., Zhu, G. F., Xin, H. J., Du, J. K., Pu, T., Lu, X. X.: 15
Environmental implications of the snow chemistry from Mt Yulong, southeastern
Tibetan Plateau, Quaternary International, 313-314, 168-178, 2013.
Niu, H. W., He, Y. Q., Kang, S. C., Lu, X. X.: Chemical compositions of snow from
Mt. Yulong, southeastern Tibetan Plateau, J. Earth Syst. Sci., 125(2), 403-416,
2016. 20
Niu, H. W., Kang, S. C., Shi, X. F.: In-situ measurements of light-absorbing impurities
in snow of glacier on Mt. Yulong and implications for radiative forcing estimates,
Sci. of the Tot. Environ., 581-582, 848-856, 2017a.
Niu, H. W., Kang, S. C., Shi, X. F.: Water-soluble elements in snow and ice on Mt.
Yulong, Sci. of the Tot. Environ., 574, 889-900, 2017b. 25
Pachauri, T., Singla, V., Satsangi, A.: Characterization of carbonaceous aerosols with
special reference to episodic events at Agra, India, Atmos. Res., 128, 98-110, 2013.
Putero, D. et al.: Influence of open vegetation fires on black carbon and ozone
variability in the southern Himalayas (NCO-P, 5079 m a.s.l.), Environ. Pollut., 184,
597-604, 2014. 30
Atmos. Chem. Phys. Discuss., https://doi.org/10.5194/acp-2017-865Manuscript under review for journal Atmos. Chem. Phys.Discussion started: 24 October 2017c© Author(s) 2017. CC BY 4.0 License.
24
Qian, Y., Flanner, M. G., Leung, L. R., Wang, W.: Sensitivity studies on the impacts of
Tibetan Plateau snowpack pollution on the Asian hydrological cycle and monsoon
climate, Atmos. Chem. Phys., 11, 1929-1948, 2011.
Qian, Y., Yasunari, T., Doherty, S. J.: Light-absorbing particles in snow and ice:
Measurement and modeling of climatic and hydrological impact, Adv. Atmos. Sci., 5
32, 64-91, 2015.
Qu, B., Ming, J., Kang, S. C., Zhang, G. S., Li, Y. W., Li, C. D., Zhao, S. Y., Ji, Z. M.,
Cao, J. J.: The decreasing albedo of the Zhadang glacier on western
Nyainqentanglha and the role of light-absorbing impurities, Atmos. Chem. Phys.,
14, 11117-11128, 2014. 10
Ram, K. and Sarin, M. M.: Absorption coefficient and site-specific mass absorption
efficiency of elemental carbon in aerosols over urban, rural, and high-altitude sites
in India, Environ. Sci. Technol., 43, 8233-8239, 2009.
Ram, K., Sarin, M.M., and Tripathi, S. N.: A 1 year record of carbonaceous aerosols
from an urban site in the Indo-Gangetic Plain: Characterization, sources, and 15
temporal variability, J. Geophys. Res.-Atmos., 115, 10.1029/2010jd014188, 2010.
Ram, K., Sarin, M. M., and Tripathi, S. N.: Temporal trends in atmospheric PM2.5,
PM10, elemental carbon, organic carbon, water-soluble organic carbon, and optical
properties: impact of biomass burning emissions in the Indo-Gangetic Plain,
Environ. Sci. Technol., 46, 686-695, 10.1021/es202857w, 2012. 20
Ram, K., Sarin, M. M.: Atmospheric carbonaceous aerosols from Indo-Gangetic Plain
and Central Himalaya: Impact of anthropogenic sources, Journal of Environmental
Management, 148, 153-163, 2015.
Ramanathan, V., Chung, C., Kim, D., Bettge, T., Buja, L., Kiehl, J. T., Washington, W.
M., Fu, Q., Sikka, D. R., and Wild, M.: Atmospheric brown clouds: Impacts on 25
South Asian climate and hydrological cycle, Proc. Natl. Acad. Sci. USA, 102,
5326-5333, 2005.
Ramanathan, V., Li, F., Ramana, M. V., Praveen, P. S., Kim, D., Corrigan, C. E.,
Nguyen, H., Stone, E. A., Schauer, J. J., Carmichael, G. R., Adhikary, B., Yoon, S.
C.: Atmospheric brown clouds: hemispherical and regional variations in long-range 30
Atmos. Chem. Phys. Discuss., https://doi.org/10.5194/acp-2017-865Manuscript under review for journal Atmos. Chem. Phys.Discussion started: 24 October 2017c© Author(s) 2017. CC BY 4.0 License.
25
transport, absorption, and radiative forcing, J. Geophys. Res. Atmos., 112, 2007.
Rienecker, M. M., Suarez, M. J., Gelaro, R., Todling, R., Bacmeister, J., Liu, R.,
Bosilovich, M. G., Schubert, S. D., Takacs, L., Kim, G-K, Bloom, S., Chen, J.,
Collins, D., Conaty, A., da Silva, A., Gu, W., Joiner, J., Koster, R. D., Lucchesi, R.,
Molod, A., Owens, T., Pawson, S., Pegion, P., Redder, C. R., Reichle, R., Robertson, 5
F. R., Ruddick, A. G., Sienkiewicz, M., and Woollen, J.: MERRA: NASA’s
Modern-Era Retrospective Analysis for Research and Applications, J. Climate, 24,
3624-3648, 2011.
Schnaiter, M., Linke, C., Mohler, O., Naumann, K. H., Saathoff, H., Wagner, R.,
Schurath, U., and Wehner, B.: Absorption amplification of black carbon internally 10
mixed with secondary organic aerosol, J. Geophys. Res., 110, D19204, 2005.
Schwarz, J. P., Gao, R. S., Perring, A. E., Spackman, J. R., and Fahey, D. W.: Black
carbon aerosol size in snow, Nat. Sci. Reports, 3, 1356. doi:10.1038/srep01356,
2013.
Schuckmann, K. V., Palmer, M. D., Trenberth, K. E.: An imperative to monitor Earth’s 15
energy imbalance, Nature Climate Change, 6, DOI: 10.1038/NCLIMATE2876,
2016.
Sharma, S., Brook, J. R., Cachier, H., Chow, J., Gaudenzi, A., and Lu, G.: Light
absorption and thermal measurements of black carbon in different regions of
Canada, J. Geophys. Res., 107, 4771, doi:10.1029/2002JD002496, 2002. 20
Vadrevu, K. P. et al.: Vegetation fires in the Himalayan region - Aerosol load, black
carbon emissions and smoke plume heights, Atmos. Environ., 47, 241-251, 2012.
van Marle, M. J. E., Kloster, S., Magi, B. I., Marlon, J. R., Daniau, A. L., Field, R. D.,
Arneth, A., Forrest, M., Hantson, S., Kehrwald, N. M., Knorr, W., Lasslop, G., Li, F.,
Mangeon, S., Yue, C., Kaiser, J. W., and van der Werf, G. R.: Historic global 25
biomass burning emissions based on merging satellite observations with proxies
and fire models (1750-2015), Geosci. Model Dev. Discuss.,
doi:10.5194/gmd-2017-32, in review, 2017.
Wan, X., Kang, S. C., Li, Q. L., Rupakhetiet, D., Zhang, Q. G., Guo, J. M., Chen, P.
F.: Organic molecular tracers in the atmospheric aerosols from Lumbini, Nepal, 30
Atmos. Chem. Phys. Discuss., https://doi.org/10.5194/acp-2017-865Manuscript under review for journal Atmos. Chem. Phys.Discussion started: 24 October 2017c© Author(s) 2017. CC BY 4.0 License.
26
in the northern Indo-Gangetic Plain: Influence of biomass burning. Atmos, Chem.
Phys. Discuss., doi:10.5194/acp-2016-1176, 2017.
Wang, H., Easter, R. C., Rasch, P. J., Wang, M., Liu, X., Ghan, S. J., Qian, Y., Yoon,
J.-H., Ma, P.-L., and Vinoj, V.: Sensitivity of remote aerosol distributions to
representation of cloud–aerosol interactions in a global climate model, Geosci. 5
Model Dev., 6, 765-782, doi:10.5194/gmd-6-765-2013, 2013.
Wang, H., Rasch, P. J., Easter, R. C., Singh, B., Zhang, R., Ma, P. L., Qian, Y., Ghan,
S. J., and Beagley, N.: Using an explicit emission tagging method in global
modeling of source-receptor relationships for black carbon in the Arctic: Variations,
sources, and transport pathways, J. Geophys, Res. Atmos., 119, 12, 888-12,909, 10
doi:10.1002/ 2014JD022297, 2014.
Wang, M., Xu, B. Q., Cao, J. J., et al.: Carbonaceous aerosols recorded in a
southeastern Tibetan glacier: analysis of temporal variations and model estimates of
sources and radiative forcing, Atmos. Chem. Phys., 15, 1191-1204, 2015.
Weingartner, E., Saathoff, H., Schnaiter, M., Streit, N., Bitnar, B., and Baltensperger, 15
U.: Absorption of light by soot particles: determination of the absorption coefficient
by means of Aethalometers, J. Aerosol Sci., 34, 1445-1463, 2003.
Xu, B. Q., and Coauthors: Black soot and the survival of Tibetan glaciers, Proc. Natl.
Acad. Sci. USA, 106(52), 22 114-22 118, doi: 10.1073/pnas.0910444106, 2009.
Xu, B. Q., Wang, M., Joswiak, D. R., Cao, J. J., Yao, T. D., Wu, G. J., Yang, W., Zhao, 20
H. B.: Deposition of anthropogenic aerosols in a southeastern Tibetan glacier, J.
Geophys. Res., 114, D17209, doi:10.1029/2008JD011510, 2009b.
Yang, Y., Wang, H., Smith, S. J., Ma, P. L., and Rasch, P. J.: Source attribution of
black carbon and its direct radiative forcing in China, Atmos. Chem. Phys., 17,
4319-4336, doi:10.5194/acp-17-4319-2017, 2017. 25
Yu, S. C., Saxena, V. K., and Zhao, Z.: A comparison of signals of regional
aerosol-induced forcing in eastern China and the southeastern United States,
Geophys. Res. Lett., 28, 713-716, 2001.
Yu, S. C., Dennis, R. L., Bhave, P. V., Eder, B. K.: Primary and secondary organic
aerosols over the United States: estimates on the basis of observed organic carbon 30
Atmos. Chem. Phys. Discuss., https://doi.org/10.5194/acp-2017-865Manuscript under review for journal Atmos. Chem. Phys.Discussion started: 24 October 2017c© Author(s) 2017. CC BY 4.0 License.
27
(OC) and elemental carbon (EC), and air quality modeled primary OC/EC ratios,
Atmos. Environ., 38, 5257-5268, 2004.
Yu, S. C., Bhave, P. V., Dennis, R. L., and Mathur, R.: Seasonal and regional
variations of primary and secondary organic aerosols over the continental United
States: Semi-empirical estimates and model evaluation, Environ. Sci. & Tech., 5
41(13), 4690-4697, 2007.
Zhang, R., Wang, H., Qian, Y., Rasch, P. J., Easter, R. C., Ma, P.-L., Singh, B., Huang,
J., and Fu, Q.: Quantifying sources, transport, deposition, and radiative forcing of
black carbon over the Himalayas and Tibetan Plateau, Atmos. Chem. Phys., 15,
6205-6223, https://doi.org/10.5194/acp-15-6205-2015, 2015. 10
Zhao, Z., Cao, J., Shen, Z., Xu, B., Zhu, C., Chen, L. W. A., Su, X., Liu, S., Han, Y.,
and Wang, G.: Aerosol particles at a high-altitude site on the Southeast Tibetan
Plateau, China: implications for pollution transport from South Asia, J. Geophys.
Res.-Atmos., 118, 11360-11375, 2013.
15
Atmos. Chem. Phys. Discuss., https://doi.org/10.5194/acp-2017-865Manuscript under review for journal Atmos. Chem. Phys.Discussion started: 24 October 2017c© Author(s) 2017. CC BY 4.0 License.
28
Table 1
Statistical results of BC, OC, SOC, and POC concentrations (g m-3) and OC/BC ratios in aerosol from Mt. Yulong
during Dec. 2014-Dec. 2016.
Annual (n=120) Winter (n=36) Pre-monsoon (n=34) Monsoon (n=33) Post-monsoon (n=17)
Mean±SD Range Mean±SD Range Mean±SD Range Mean±SD Range Mean±SD Range
OC 1.65±1.14 0.07-5.96 1.75±0.8 0.51-3.66 1.37±1.2 0.07-5.73 1.34±0.9 0.24-4.6 2.57±1.3 0.99-5.96
BC 1.53±1.49 0.02-6.83 1.81±1.5 0.02-6.83 0.55±0.4 0.03-1.77 1.25±1.2 0.04-3.9 3.51±1.2 1.22-5.8
OC/BC 2.06±3.38 0.35-20.9 1.45±1.1 0.38-5.55 3.67±5.7 0.7-22.9 1.85±1.8 0.42-8.3 0.79±0.4 0.35-2.27
SOC 1.15±0.96 0.06-5.44 1.15±0.5 0.32-2.56 1.18±1.2 0.06-5.44 0.96±0.8 0.19-4.5 1.42±1.2 0.19-4.59
POC 0.53±0.53 0.009-2.4 0.63±0.5 0.008-2.39 0.19±0.1 0.01-0.62 0.43±0.4 0.01-1.3 1.24±0.4 0.42-2.04
Atmos. Chem. Phys. Discuss., https://doi.org/10.5194/acp-2017-865Manuscript under review for journal Atmos. Chem. Phys.Discussion started: 24 October 2017c© Author(s) 2017. CC BY 4.0 License.
29
Table 2
Statistical results of BC, OC, SOC, and POC concentrations (g m-3) and OC/BC ratios in aerosol from GHZ
during Dec. 2014-Dec. 2016.
Annual (n=116) Winter (n=27) Pre-monsoon (n=47) Monsoon (n=28) Post-monsoon (n=12)
Mean±SD Range Mean±SD Range Mean±SD Range Mean±SD Range Mean±SD Range
OC 3.5±1.5 1.1-10 4.09±1.7 2.3-9.9 3.7±1.7 1.3-10 2.8±0.8 1.1-4.7 3.1±1.1 2.0-5.6
BC 1.5±0.9 0.15-4.5 2.42±0.74 1.1-4.2 1.4±0.7 0.28-4.5 0.75±0.3 0.15-1.5 1.58±0.9 0.63-3.2
OC/BC 2.9±1.8 0.87-8.8 1.93±1.58 0.87-8.9 2.72±1.3 1.1-8.3 4.4±2.0 1.7-8.5 2.36±0.9 1.1-3.9
SOC 2.2±1.4 0.16-8.9 2.06±1.9 0.47-8.9 2.45±1.3 0.17-6.1 2.14±0.7 0.9-3.8 1.67±0.8 0.68-3.4
POC 1.3±0.8 0.13-4 2.11±0.7 0.9-3.7 1.25±0.6 0.25-4.0 0.67±0.3 0.13-1.3 1.4±0.8 0.56-2.9
Atmos. Chem. Phys. Discuss., https://doi.org/10.5194/acp-2017-865Manuscript under review for journal Atmos. Chem. Phys.Discussion started: 24 October 2017c© Author(s) 2017. CC BY 4.0 License.
30
Table 3 Fractional contribution (%) from four major source regions including south Asia (SAS), East Asia (EAS),
Southeast Asia (SEA), and Middle East (MDE) to BC surface concentrations over the Mt. Yulong region in winter
(December-February), pre-monsoon (March-May), monsoon (June-September), post-monsoon
(October-November), and all months during the model simulation time period (2010-2014).
Source region Winter Pre-monsoon Monsoon Post-monsoon Annual
SAS 40.8 67.63 17.12 27.14 42.49
EAS 53.76 25.37 77.96 68 52.1
SEA 3.03 2.52 3.73 3.18 3.02
MDE 1.06 2.39 0.47 0.67 1.02
Atmos. Chem. Phys. Discuss., https://doi.org/10.5194/acp-2017-865Manuscript under review for journal Atmos. Chem. Phys.Discussion started: 24 October 2017c© Author(s) 2017. CC BY 4.0 License.
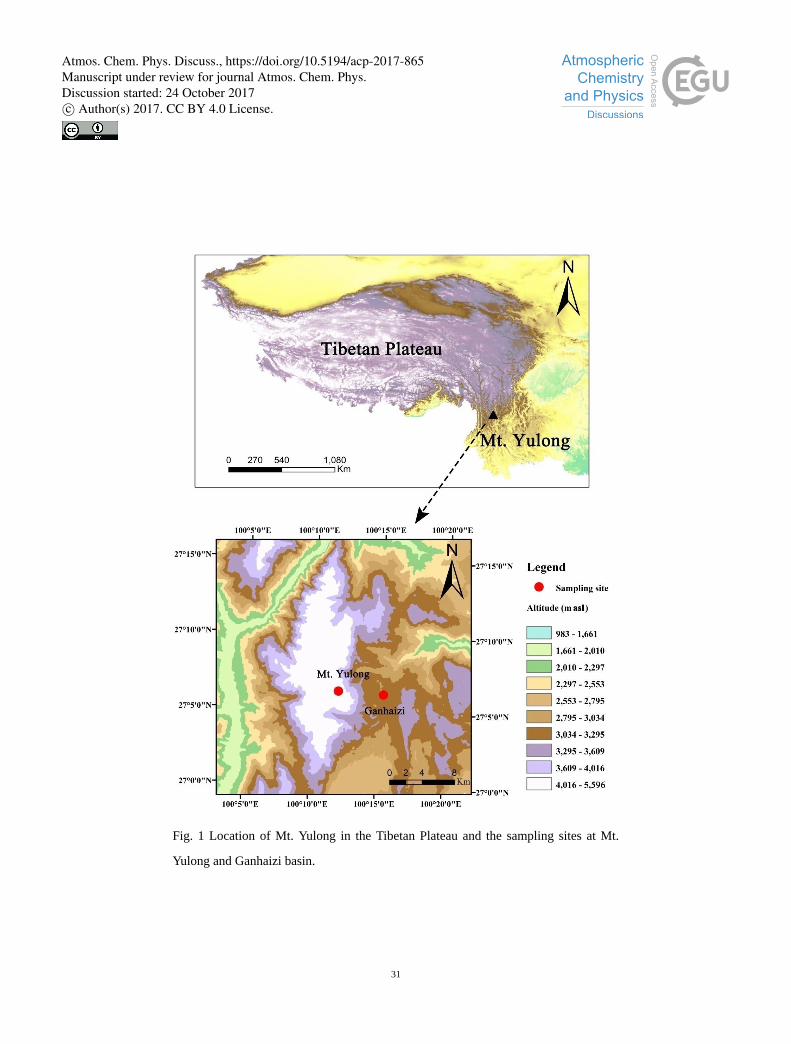
31
Fig. 1 Location of Mt. Yulong in the Tibetan Plateau and the sampling sites at Mt.
Yulong and Ganhaizi basin.
Atmos. Chem. Phys. Discuss., https://doi.org/10.5194/acp-2017-865Manuscript under review for journal Atmos. Chem. Phys.Discussion started: 24 October 2017c© Author(s) 2017. CC BY 4.0 License.
32
Fig. 2 Time series of meteorological parameters (air-temperature, net radiation,
pressure, rainfall, relative humidity) at Mt. Yulong from December 2014 to December
2015. Monsoon and non-monsoon seasons (including winter, pre-monsoon,
post-monsoon seasons) are divided by vertical lines.
Atmos. Chem. Phys. Discuss., https://doi.org/10.5194/acp-2017-865Manuscript under review for journal Atmos. Chem. Phys.Discussion started: 24 October 2017c© Author(s) 2017. CC BY 4.0 License.
33
Fig. 3 Dependence of optical attenuation (ATN) detected at 632 nm on the BC loading
(BCs) for (a) the Mt. Yulong sampling site and (b) the GHZ sampling site. Results of
linear regression are displayed with K as the slope and b as the intercept.
Atmos. Chem. Phys. Discuss., https://doi.org/10.5194/acp-2017-865Manuscript under review for journal Atmos. Chem. Phys.Discussion started: 24 October 2017c© Author(s) 2017. CC BY 4.0 License.
34
Fig. 4 Seasonal variations of BC, OC, SOC, and POC concentrations and OC/BC ratio
from Mt. Yulong during Dec. 2014-Dec. 2016.
Atmos. Chem. Phys. Discuss., https://doi.org/10.5194/acp-2017-865Manuscript under review for journal Atmos. Chem. Phys.Discussion started: 24 October 2017c© Author(s) 2017. CC BY 4.0 License.
35
Fig. 5 Seasonal variations of BC, OC, SOC, and POC concentrations and OC/BC ratio
from GHZ basin during Dec. 2014-Dec. 2016.
Atmos. Chem. Phys. Discuss., https://doi.org/10.5194/acp-2017-865Manuscript under review for journal Atmos. Chem. Phys.Discussion started: 24 October 2017c© Author(s) 2017. CC BY 4.0 License.
36
Fig. 6 Monthly averaged BC, OC concentrations and OC/BC ratios from Mt. Yulong.
Atmos. Chem. Phys. Discuss., https://doi.org/10.5194/acp-2017-865Manuscript under review for journal Atmos. Chem. Phys.Discussion started: 24 October 2017c© Author(s) 2017. CC BY 4.0 License.
37
Fig. 7 Histogram of (a) annual mean and (b) seasonal mean MAE values of
atmospheric BC from Mt. Yulong and GHZ sampling sites during December
2014-December 2016.
Atmos. Chem. Phys. Discuss., https://doi.org/10.5194/acp-2017-865Manuscript under review for journal Atmos. Chem. Phys.Discussion started: 24 October 2017c© Author(s) 2017. CC BY 4.0 License.
38
Fig. 8 Weekly mean MAE values in Mt. Yulong aerosol during December 2014 to
December 2016. The variations of POC/OC and SOC/OC ratios, ATN, BCs, and OC
concentrations are also displayed for comparison with MAE.
Atmos. Chem. Phys. Discuss., https://doi.org/10.5194/acp-2017-865Manuscript under review for journal Atmos. Chem. Phys.Discussion started: 24 October 2017c© Author(s) 2017. CC BY 4.0 License.
39
Fig. 9 Weekly mean MAE values in GHZ aerosol during December 2014 to December
2016. The variations of POC/OC, SOC/OC, and OC/BC ratios, ATN, BCs values are
displayed for comparison with MAE.
Atmos. Chem. Phys. Discuss., https://doi.org/10.5194/acp-2017-865Manuscript under review for journal Atmos. Chem. Phys.Discussion started: 24 October 2017c© Author(s) 2017. CC BY 4.0 License.
40
Fig. 10 Inter-annual differences of OC, BC, SOC, and POC concentrations at (a)
Yulong and (b) GHZ site. The OC/BC, SOC/OC, and POC/OC ratios are shown in (c,
d).
Atmos. Chem. Phys. Discuss., https://doi.org/10.5194/acp-2017-865Manuscript under review for journal Atmos. Chem. Phys.Discussion started: 24 October 2017c© Author(s) 2017. CC BY 4.0 License.
41
Fig. 11 Comparison of BC concentrations from Mt. Yulong and other areas of interest.
Atmos. Chem. Phys. Discuss., https://doi.org/10.5194/acp-2017-865Manuscript under review for journal Atmos. Chem. Phys.Discussion started: 24 October 2017c© Author(s) 2017. CC BY 4.0 License.
42
Fig. 12 CALIPSO retrieved backscatter signal at 532 nm (upper panel) and aerosol
sub-type information (bottom panel) on 15 March, 2015. The Mt. Yulong region was
covered by a thick aerosol layer (mainly consisting of polluted smoke and dust) in the
high atmosphere (above 6000 m asl), likely transported far from their source regions.
CALIPSO profiles were obtained from (http://www-calipso.larc.nasa.gov). The
CALIOP-derived reflectivity is usually taken as an indicator to reflect the structure of
atmospheric layers since it dependents on mass concentration and optical properties of
atmospheric aerosol (Bou et al., 2010; Dong et al., 2017a). The topography is outlined
by a solid red-line. Suspended dust and aerosol pollutants are in orange and red.
Atmos. Chem. Phys. Discuss., https://doi.org/10.5194/acp-2017-865Manuscript under review for journal Atmos. Chem. Phys.Discussion started: 24 October 2017c© Author(s) 2017. CC BY 4.0 License.
43
Fig. 13 Annual and seasonal (winter, pre-monsoon, monsoon and post-monsoon)
mean relative contributions of emissions in four tagged source regions, including
South Asia, East Asia, Southeast Asia and Middle East, to near-surface BC
concentrations. The black box in each panel marks the grid box where the Yulong and
GHZ sites locate.
Atmos. Chem. Phys. Discuss., https://doi.org/10.5194/acp-2017-865Manuscript under review for journal Atmos. Chem. Phys.Discussion started: 24 October 2017c© Author(s) 2017. CC BY 4.0 License.