manufacturing investments in the czech republic:: an international comparison
TRANSCRIPT
ARTICLE IN PRESS
Int. J. Production Economics 88 (2004) 1–14
*Correspondin
E-mail addre1AMT is a t
process that em
basic numericall
integrated flexib
0925-5273/03/$ -
doi:10.1016/S092
Manufacturing investments in the Czech Republic:An international comparison
Frank Lefleya, Frank Whartona,*, Ladislav H!ajekb, Josef Hynekb, V!aclav Janecekb
aThe Business School, University of Hull, Cottingham Road, Hull HU6 7RX, UKbFaculty of Informatics and Management, University of Hradec Kr !alov!e, V!ıta Nejed!eho 573, 500 03 Hradec Kr !alov!e, Czech Republic
Received 14 November 2000; accepted 24 April 2003
Abstract
The principal economic measures taken by the Czech Republic (CR) over the last 10 years to encourage investments
in more advanced manufacturing technology (AMT)1 are briefly described. The results of a survey in large CR
manufacturing companies are presented which show the current levels of investment in AMT, the techniques and
criteria used to assess AMT capital projects, and attitudes to the need for further investment. Comparisons are made
with the results of earlier identical surveys in the UK and in the US. The comparisons reveal numerous statistically
significant differences. The current levels of investment in the CR are relatively low, the techniques used for evaluation
relatively unsophisticated, the investment criteria used favour short-term investments, and there is less concern about
the need for AMT. It would appear that more generous incentives and stronger management motivation are needed if
the Czech manufacturing industry is to compete effectively in the world markets.
r 2003 Elsevier B.V. All rights reserved.
Keywords: Investment appraisal; Advanced manufacturing technology; International survey; Czech manufacturing industry
1. Introduction
The main purpose of the government reformsintroduced in Czechoslovakia since 1990 and theCzech Republic (CR) since 1993 has been thetransformation of a centrally planned economyinto a market economy (Hospod!a$rsk!e Noviny,1990, pp. I–IV). Associated with this transforma-tion is the need to develop a new managerial ethos,
g author.
ss: [email protected] (F. Wharton).
erm applied to any form of manufacturing
braces a computer control system, from the
y controlled machine tools to fully computer-
le manufacturing systems.
see front matter r 2003 Elsevier B.V. All rights rese
5-5273(03)00129-4
which will allow Czech organisations to competesuccessfully in international markets (Pavlica andThorpe, 1998).
During the last decade, government measureshave been taken to promote and facilitate thetransformation of state owned companies intojointly and privately owned companies. Morerecently, the government has introduced incentivesto encourage both domestic and foreign invest-ment in manufacturing industries and in particularin the implementation of more advanced manu-facturing technology (AMT). The principal eco-nomic incentives introduced by the Czechgovernment and their over all effect are brieflydescribed below.
rved.
ARTICLE IN PRESS
F. Lefley et al. / Int. J. Production Economics 88 (2004) 1–142
The main purpose of this paper, however, is toreport the results of a survey of CR manufacturingcompanies concerning current level of investmentin AMT, methods used to evaluate AMT invest-ment proposals and the perceived need for furtherAMT investment. The results of the CR survey arecompared throughout with the results of earlierand identical surveys conducted in the UK and theUS. This is believed to be the only survey of itskind that uses an identical questionnaire toinvestigate the importance of AMT investmentsin the three countries—UK, US and CR.
2. Economic transition in Czechoslovakia/CR
2.1. Privatisation
In 1990 the private sector was almost non-existent and prices were state controlled. Heavyindustry was overdeveloped whilst the servicesector was underdeveloped. Extremely high mate-rial and energy consumption and the growingtechnological gap in industry had resulted inrelatively low economic efficiency.
During the decade that followed, state ownedsmall and medium sized companies were sold byauction to private owners. Large-scale stateenterprises were transformed into private compa-nies by direct sale, share issues and free transfer.Some privatisation was achieved through a processof restitution of nationalised properties and assetsto former owners. The share of the private sectorincreased from just 1% of GDP in 1990 to 80%in 2000.
2.2. Economic growth
The highest economic growth since 1990 oc-curred in 1995 when the real gross domesticproduct (GDP) increased by 4.9%. Since thenthe rate of increase has fallen and GDP fell tobelow 0% in 1999.
The slowdown of economic growth since 1995is due to a sharp fall in domestic demand, aweakening of the Czech crown, and an inabilityof Czech firms to adapt rapidly to changing de-mand in the domestic and foreign markets. This
inflexibility was attributed to mismanagement,under-capitalisation, and low productivity(Jan!aWek, 1998, p. 100).
Nevertheless, international comparison showsthat the CR is still among the top economies ofCentral European countries (with Slovenia) inGDP per capita in spite of the slowdown duringthe last decade.
2.3. Investment
The growth of new investment started in 1992.Great importance was attached to encouraging theinflow of foreign capital investment on theassumption that new capital would bring newtechnology, managerial skills, and progressivereorganisation. However, technological develop-ment and, more generally, scientific and technolo-gical progress was slow during the first half of the1990s.
In 1998 the Czech government introduced someincentives to encourage foreign capital investmentsabove USD 10 million (Hospod!a$rsk!e Noviny,1998, p. 1) including the following:
* postponement of corporation taxes for the first5 years,
* faster depreciation of machinery for tax pur-poses (25% a year),
* creation of free trade zones,* elimination of tariffs and taxes on imports of hi-
tech products, including machines and equip-ment,
* introduction of reduced interest rate on creditfor equipment replacement and up grading.
These and other measures will attract furtherforeign and domestic investment in general butmore especially in manufacturing industries andAMT (Komu$snık, 1997, p. 72).
3. Research methodology and response
3.1. The objectives
The main objective of the research was to assessthe extent to which government measures to
ARTICLE IN PRESS
F. Lefley et al. / Int. J. Production Economics 88 (2004) 1–14 3
encourage investment in more advanced manufac-turing technologies had been successful both interms of the actual levels of AMT alreadyimplemented and in the attitudes of CR managersto the need for further investment.
Progress was to be measured by reference to thelevels of investment achieved and opinions held byfinancial directors in UK and US companies. Forease of comparison, a questionnaire which hadbeen used in earlier surveys in the UK and in theUS (Lefley, 1994; Lefley and Sarkis, 1997) wouldbe translated into the Czech language and sent tofinancial directors of Czech manufacturing com-panies.
3.2. Questionnaire design
Questions in Part I of the survey was intended toestablish the level of implementation of AMT thathad been achieved to date. Three levels of AMTwere identified which correspond to the levels ofsophistication proposed by McDonald (1985),Suresh and Meredith (1985), and Dornan (1987).Level 1 AMT systems comprise stand-aloneprojects, e.g. Robots, NC machines, CAD, etc.Level 2 systems are linked systems, e.g. linkingtogether of a number of CNC machines, CAD/CAM, etc. and Level 3 systems are fully integratedsystems including CIM and FMS.
In Part II of the survey the respondents wereasked which techniques and criteria were used incapital project appraisal and what methods, if any,were used to measure and take into accountproject risk. This part of the research was alsoaimed at identifying the extent to which computeraids were used in investment appraisal. Informa-tion was obtained about the indicators used inassessing the performance of senior executives.
Part III of the survey was designed to exploreopinions about the need for AMT investment, theappropriateness of the investment criteria usedand the extent to which other factors andconsiderations had a bearing on capital investmentdecisions, in particular the difficulties experiencedover the recognition and financial quantification ofsome of the benefits associated with AMT invest-ments.
3.3. The sampling frames and responses
In the original 1992 UK survey, the question-naires were sent to the financial directors of the500 largest UK manufacturing companies (rankedby turnover) as compiled in the ‘Jordans Best ofBritish Directory’. A usable response of 144(28.8%) was achieved.
In the subsequent 1994 US survey, question-naires were sent to the financial decision-maker’sof 500 medium/large US manufacturing firmsrandomly selected from the Dun and BradstreetElectronic Database of American ManufacturingFirms. A usable response of 122 (24.4%) wasobtained.
In the 1998 CR survey the questionnaire wassent to the financial directors of 416 largemanufacturing companies chosen from the CzechBusiness Register. A useable replies of 79 (19%)were obtained. The response rate, although lowerthan in the UK and in the US surveys, was of thesame order as that achieved in other surveys of thiskind (Remer et al., 1993—19.5%; Chen and Clark,1994—18.0%; Abdel-Kader and Dugdale, 1998—21.2%; Cotton and Schinski, 1999—16%; Sandahland Sj .ogren, 2003—group ‘A’ 26.1% and group‘B’ 16.5%).
3.4. The analysis
The proportion of questionnaire respondentsfrom each country that had responded positivelyto each question posed was compared. Theprobability that differences could be attributed tosampling variation was estimated using the chi-square distribution and the Pearson significancetest.
4. Survey statistical results
4.1. Level of evaluation and implementation of
AMT projects
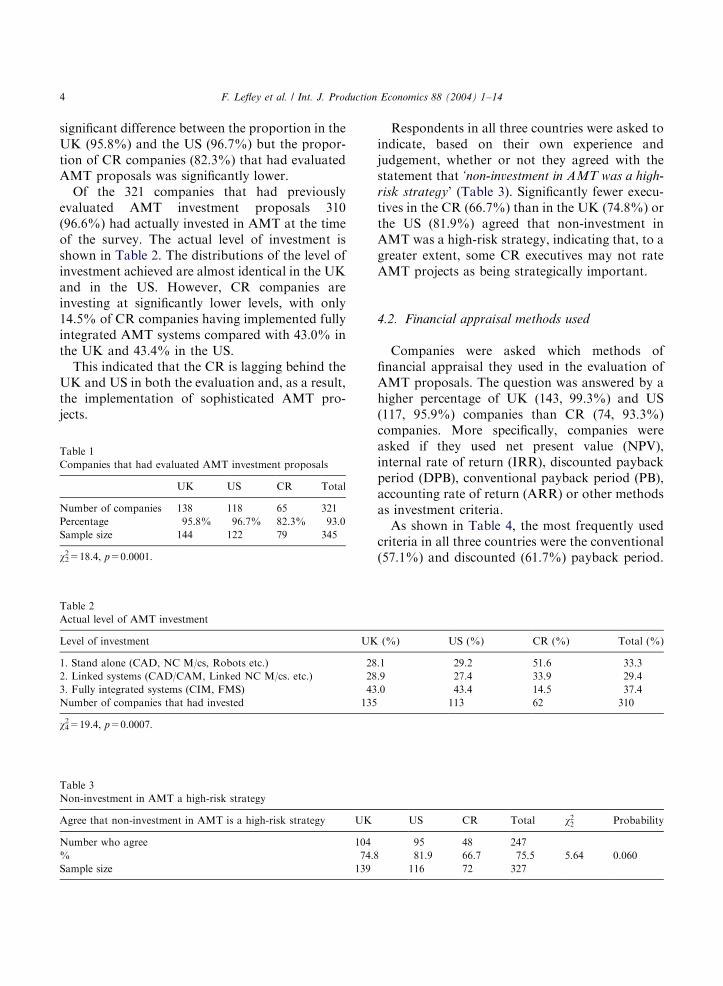
The number and percentage of companies ineach country that stated that they had evaluatedAMT investment proposals over the 10 years priorto each survey is shown in Table 1. There was no
ARTICLE IN PRESS
F. Lefley et al. / Int. J. Production Economics 88 (2004) 1–144
significant difference between the proportion in theUK (95.8%) and the US (96.7%) but the propor-tion of CR companies (82.3%) that had evaluatedAMT proposals was significantly lower.
Of the 321 companies that had previouslyevaluated AMT investment proposals 310(96.6%) had actually invested in AMT at the timeof the survey. The actual level of investment isshown in Table 2. The distributions of the level ofinvestment achieved are almost identical in the UKand in the US. However, CR companies areinvesting at significantly lower levels, with only14.5% of CR companies having implemented fullyintegrated AMT systems compared with 43.0% inthe UK and 43.4% in the US.
This indicated that the CR is lagging behind theUK and US in both the evaluation and, as a result,the implementation of sophisticated AMT pro-jects.
Table 1
Companies that had evaluated AMT investment proposals
UK US CR Total
Number of companies 138 118 65 321
Percentage 95.8% 96.7% 82.3% 93.0
Sample size 144 122 79 345
w22=18.4, p=0.0001.
Table 2
Actual level of AMT investment
Level of investment UK
1. Stand alone (CAD, NC M/cs, Robots etc.) 28
2. Linked systems (CAD/CAM, Linked NC M/cs. etc.) 28
3. Fully integrated systems (CIM, FMS) 43
Number of companies that had invested 135
w42=19.4, p=0.0007.
Table 3
Non-investment in AMT a high-risk strategy
Agree that non-investment in AMT is a high-risk strategy UK
Number who agree 104
% 74.8
Sample size 139
Respondents in all three countries were asked toindicate, based on their own experience andjudgement, whether or not they agreed with thestatement that ‘non-investment in AMT was a high-
risk strategy’ (Table 3). Significantly fewer execu-tives in the CR (66.7%) than in the UK (74.8%) orthe US (81.9%) agreed that non-investment inAMT was a high-risk strategy, indicating that, to agreater extent, some CR executives may not rateAMT projects as being strategically important.
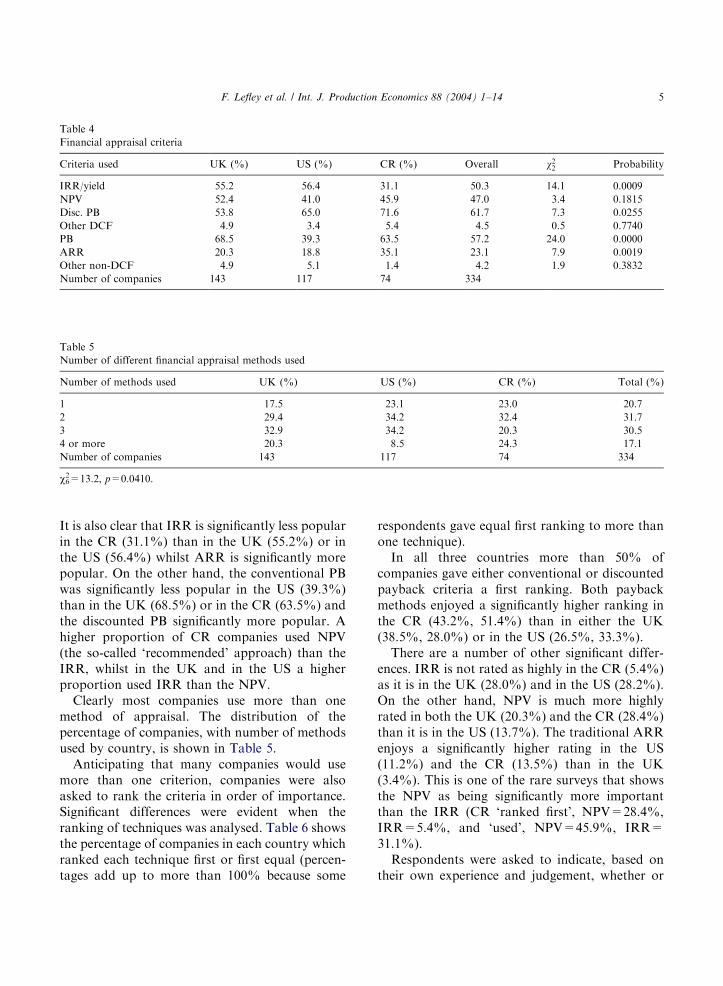
4.2. Financial appraisal methods used
Companies were asked which methods offinancial appraisal they used in the evaluation ofAMT proposals. The question was answered by ahigher percentage of UK (143, 99.3%) and US(117, 95.9%) companies than CR (74, 93.3%)companies. More specifically, companies wereasked if they used net present value (NPV),internal rate of return (IRR), discounted paybackperiod (DPB), conventional payback period (PB),accounting rate of return (ARR) or other methodsas investment criteria.
As shown in Table 4, the most frequently usedcriteria in all three countries were the conventional(57.1%) and discounted (61.7%) payback period.
(%) US (%) CR (%) Total (%)
.1 29.2 51.6 33.3
.9 27.4 33.9 29.4
.0 43.4 14.5 37.4
113 62 310
US CR Total w22 Probability
95 48 247
81.9 66.7 75.5 5.64 0.060
116 72 327
ARTICLE IN PRESS
Table 5
Number of different financial appraisal methods used
Number of methods used UK (%) US (%) CR (%) Total (%)
1 17.5 23.1 23.0 20.7
2 29.4 34.2 32.4 31.7
3 32.9 34.2 20.3 30.5
4 or more 20.3 8.5 24.3 17.1
Number of companies 143 117 74 334
w62=13.2, p=0.0410.
Table 4
Financial appraisal criteria
Criteria used UK (%) US (%) CR (%) Overall w22 Probability
IRR/yield 55.2 56.4 31.1 50.3 14.1 0.0009
NPV 52.4 41.0 45.9 47.0 3.4 0.1815
Disc. PB 53.8 65.0 71.6 61.7 7.3 0.0255
Other DCF 4.9 3.4 5.4 4.5 0.5 0.7740
PB 68.5 39.3 63.5 57.2 24.0 0.0000
ARR 20.3 18.8 35.1 23.1 7.9 0.0019
Other non-DCF 4.9 5.1 1.4 4.2 1.9 0.3832
Number of companies 143 117 74 334
F. Lefley et al. / Int. J. Production Economics 88 (2004) 1–14 5
It is also clear that IRR is significantly less popularin the CR (31.1%) than in the UK (55.2%) or inthe US (56.4%) whilst ARR is significantly morepopular. On the other hand, the conventional PBwas significantly less popular in the US (39.3%)than in the UK (68.5%) or in the CR (63.5%) andthe discounted PB significantly more popular. Ahigher proportion of CR companies used NPV(the so-called ‘recommended’ approach) than theIRR, whilst in the UK and in the US a higherproportion used IRR than the NPV.
Clearly most companies use more than onemethod of appraisal. The distribution of thepercentage of companies, with number of methodsused by country, is shown in Table 5.
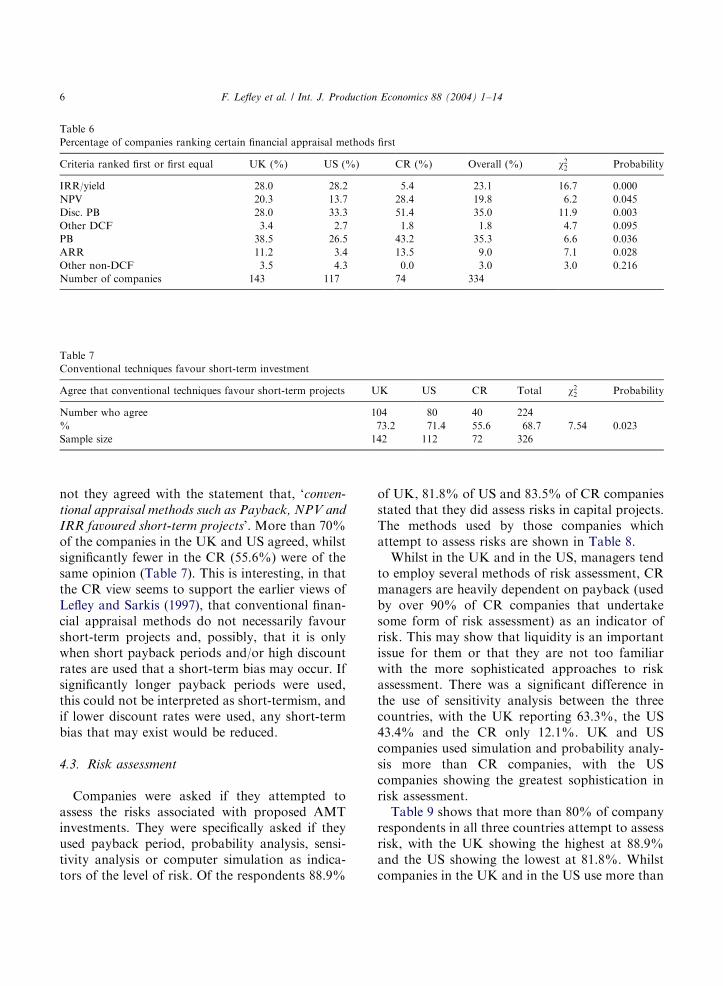
Anticipating that many companies would usemore than one criterion, companies were alsoasked to rank the criteria in order of importance.Significant differences were evident when theranking of techniques was analysed. Table 6 showsthe percentage of companies in each country whichranked each technique first or first equal (percen-tages add up to more than 100% because some
respondents gave equal first ranking to more thanone technique).
In all three countries more than 50% ofcompanies gave either conventional or discountedpayback criteria a first ranking. Both paybackmethods enjoyed a significantly higher ranking inthe CR (43.2%, 51.4%) than in either the UK(38.5%, 28.0%) or in the US (26.5%, 33.3%).
There are a number of other significant differ-ences. IRR is not rated as highly in the CR (5.4%)as it is in the UK (28.0%) and in the US (28.2%).On the other hand, NPV is much more highlyrated in both the UK (20.3%) and the CR (28.4%)than it is in the US (13.7%). The traditional ARRenjoys a significantly higher rating in the US(11.2%) and the CR (13.5%) than in the UK(3.4%). This is one of the rare surveys that showsthe NPV as being significantly more importantthan the IRR (CR ‘ranked first’, NPV=28.4%,IRR=5.4%, and ‘used’, NPV=45.9%, IRR=31.1%).
Respondents were asked to indicate, based ontheir own experience and judgement, whether or
ARTICLE IN PRESS
Table 7
Conventional techniques favour short-term investment
Agree that conventional techniques favour short-term projects UK US CR Total w22 Probability
Number who agree 104 80 40 224
% 73.2 71.4 55.6 68.7 7.54 0.023
Sample size 142 112 72 326
Table 6
Percentage of companies ranking certain financial appraisal methods first
Criteria ranked first or first equal UK (%) US (%) CR (%) Overall (%) w22 Probability
IRR/yield 28.0 28.2 5.4 23.1 16.7 0.000
NPV 20.3 13.7 28.4 19.8 6.2 0.045
Disc. PB 28.0 33.3 51.4 35.0 11.9 0.003
Other DCF 3.4 2.7 1.8 1.8 4.7 0.095
PB 38.5 26.5 43.2 35.3 6.6 0.036
ARR 11.2 3.4 13.5 9.0 7.1 0.028
Other non-DCF 3.5 4.3 0.0 3.0 3.0 0.216
Number of companies 143 117 74 334
F. Lefley et al. / Int. J. Production Economics 88 (2004) 1–146
not they agreed with the statement that, ‘conven-
tional appraisal methods such as Payback, NPV and
IRR favoured short-term projects’. More than 70%of the companies in the UK and US agreed, whilstsignificantly fewer in the CR (55.6%) were of thesame opinion (Table 7). This is interesting, in thatthe CR view seems to support the earlier views ofLefley and Sarkis (1997), that conventional finan-cial appraisal methods do not necessarily favourshort-term projects and, possibly, that it is onlywhen short payback periods and/or high discountrates are used that a short-term bias may occur. Ifsignificantly longer payback periods were used,this could not be interpreted as short-termism, andif lower discount rates were used, any short-termbias that may exist would be reduced.
4.3. Risk assessment
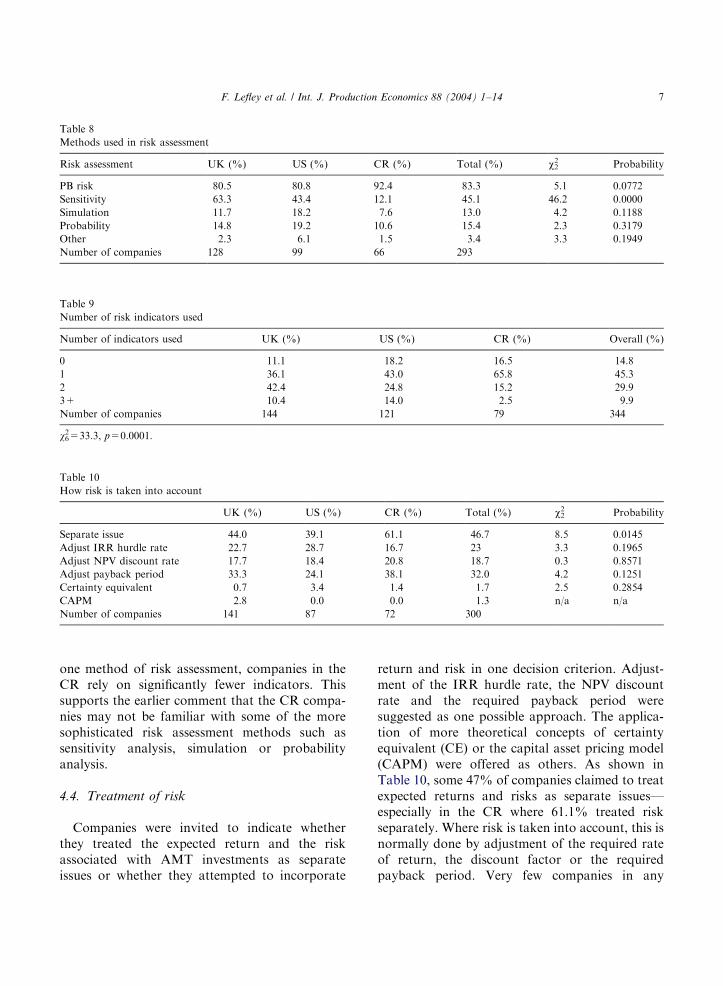
Companies were asked if they attempted toassess the risks associated with proposed AMTinvestments. They were specifically asked if theyused payback period, probability analysis, sensi-tivity analysis or computer simulation as indica-tors of the level of risk. Of the respondents 88.9%
of UK, 81.8% of US and 83.5% of CR companiesstated that they did assess risks in capital projects.The methods used by those companies whichattempt to assess risks are shown in Table 8.
Whilst in the UK and in the US, managers tendto employ several methods of risk assessment, CRmanagers are heavily dependent on payback (usedby over 90% of CR companies that undertakesome form of risk assessment) as an indicator ofrisk. This may show that liquidity is an importantissue for them or that they are not too familiarwith the more sophisticated approaches to riskassessment. There was a significant difference inthe use of sensitivity analysis between the threecountries, with the UK reporting 63.3%, the US43.4% and the CR only 12.1%. UK and UScompanies used simulation and probability analy-sis more than CR companies, with the UScompanies showing the greatest sophistication inrisk assessment.
Table 9 shows that more than 80% of companyrespondents in all three countries attempt to assessrisk, with the UK showing the highest at 88.9%and the US showing the lowest at 81.8%. Whilstcompanies in the UK and in the US use more than
ARTICLE IN PRESS
Table 9
Number of risk indicators used
Number of indicators used UK (%) US (%) CR (%) Overall (%)
0 11.1 18.2 16.5 14.8
1 36.1 43.0 65.8 45.3
2 42.4 24.8 15.2 29.9
3+ 10.4 14.0 2.5 9.9
Number of companies 144 121 79 344
w62=33.3, p=0.0001.
Table 8
Methods used in risk assessment
Risk assessment UK (%) US (%) CR (%) Total (%) w22 Probability
PB risk 80.5 80.8 92.4 83.3 5.1 0.0772
Sensitivity 63.3 43.4 12.1 45.1 46.2 0.0000
Simulation 11.7 18.2 7.6 13.0 4.2 0.1188
Probability 14.8 19.2 10.6 15.4 2.3 0.3179
Other 2.3 6.1 1.5 3.4 3.3 0.1949
Number of companies 128 99 66 293
Table 10
How risk is taken into account
UK (%) US (%) CR (%) Total (%) w22 Probability
Separate issue 44.0 39.1 61.1 46.7 8.5 0.0145
Adjust IRR hurdle rate 22.7 28.7 16.7 23 3.3 0.1965
Adjust NPV discount rate 17.7 18.4 20.8 18.7 0.3 0.8571
Adjust payback period 33.3 24.1 38.1 32.0 4.2 0.1251
Certainty equivalent 0.7 3.4 1.4 1.7 2.5 0.2854
CAPM 2.8 0.0 0.0 1.3 n/a n/a
Number of companies 141 87 72 300
F. Lefley et al. / Int. J. Production Economics 88 (2004) 1–14 7
one method of risk assessment, companies in theCR rely on significantly fewer indicators. Thissupports the earlier comment that the CR compa-nies may not be familiar with some of the moresophisticated risk assessment methods such assensitivity analysis, simulation or probabilityanalysis.
4.4. Treatment of risk
Companies were invited to indicate whetherthey treated the expected return and the riskassociated with AMT investments as separateissues or whether they attempted to incorporate
return and risk in one decision criterion. Adjust-ment of the IRR hurdle rate, the NPV discountrate and the required payback period weresuggested as one possible approach. The applica-tion of more theoretical concepts of certaintyequivalent (CE) or the capital asset pricing model(CAPM) were offered as others. As shown inTable 10, some 47% of companies claimed to treatexpected returns and risks as separate issues—especially in the CR where 61.1% treated riskseparately. Where risk is taken into account, this isnormally done by adjustment of the required rateof return, the discount factor or the requiredpayback period. Very few companies in any
ARTICLE IN PRESS
Table 11
Use of computer aids
UK (%) US (%) CR (%) Total (%) w22 Probability
Spreadsheets 90.9 87.2 75.7 86.2 9.7 0.008
Dedicated software 13.3 22.2 16.2 17.1 3.7 0.159
Other computer aids 1.4 1.7 4.1 2.1 1.8 0.412
Number of companies 141 117 74 332
Table 12
Too much importance attached to conventional techniques
Agree that too much importance attached to conventional techniques UK US CR Total w22 Probability
Number who agree 60 56 37 153
% 42.3 48.7 51.4 46.5 1.94 0.378
Sample size 142 115 72 329
Table 13
Not all benefits taken into account
Agree that not all benefits are taken into account UK US CR Total w22 Probability
Number who agree 114 95 64 273
% 80.9 81.2 90.1 83.0 3.29 0.193
Sample size 141 117 71 329
F. Lefley et al. / Int. J. Production Economics 88 (2004) 1–148
country claimed to use either the CE approach(1.7%) or the CAPM (1.3%).
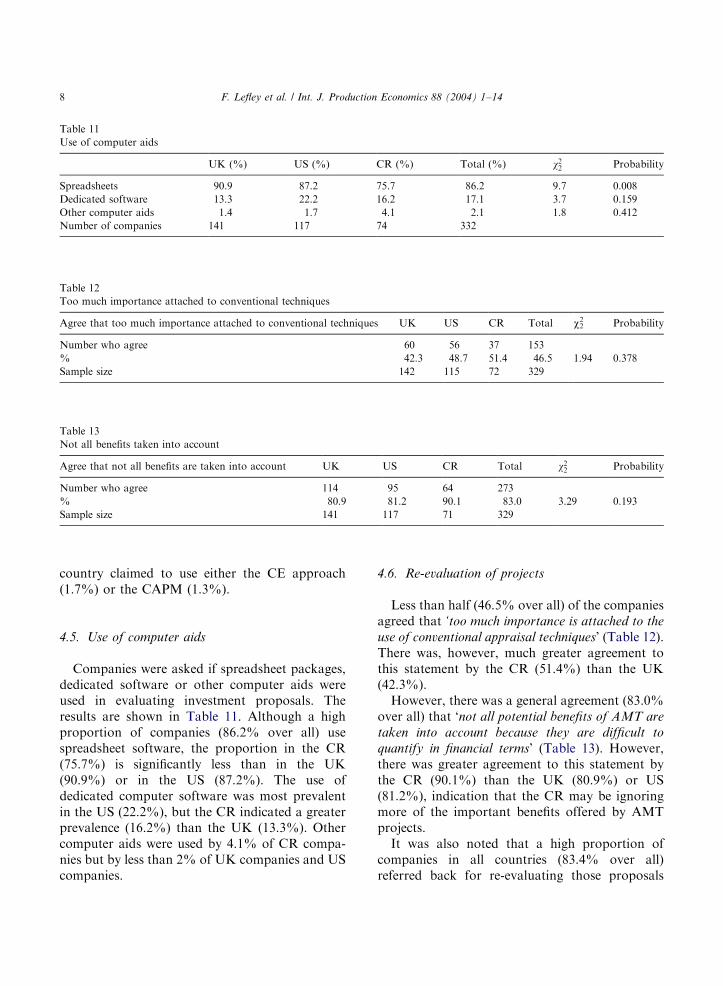
4.5. Use of computer aids
Companies were asked if spreadsheet packages,dedicated software or other computer aids wereused in evaluating investment proposals. Theresults are shown in Table 11. Although a highproportion of companies (86.2% over all) usespreadsheet software, the proportion in the CR(75.7%) is significantly less than in the UK(90.9%) or in the US (87.2%). The use ofdedicated computer software was most prevalentin the US (22.2%), but the CR indicated a greaterprevalence (16.2%) than the UK (13.3%). Othercomputer aids were used by 4.1% of CR compa-nies but by less than 2% of UK companies and UScompanies.
4.6. Re-evaluation of projects
Less than half (46.5% over all) of the companiesagreed that ‘too much importance is attached to the
use of conventional appraisal techniques’ (Table 12).There was, however, much greater agreement tothis statement by the CR (51.4%) than the UK(42.3%).
However, there was a general agreement (83.0%over all) that ‘not all potential benefits of AMT are
taken into account because they are difficult to
quantify in financial terms’ (Table 13). However,there was greater agreement to this statement bythe CR (90.1%) than the UK (80.9%) or US(81.2%), indication that the CR may be ignoringmore of the important benefits offered by AMTprojects.
It was also noted that a high proportion ofcompanies in all countries (83.4% over all)referred back for re-evaluating those proposals
ARTICLE IN PRESS
Table 14
Percentage of proposals re-evaluated
Proposals re-evaluated UK US CR Total
Number who re-evaluate 117 94 66 277
% 84.2 80.3 89.2 83.9
Sample size 139 117 74 330
w22=2.64, p=0.2669.
Table 15
Management performance measures
UK (%) US (%) CR (%) Total (%) w22 Probability
Annual gross profit 36.9 31.1 37.5 35.1 1.1 0.5739
Annual profit before tax 74.5 50.9 27.8 56.1 43.9 0.0000
Profit after tax 12.1 25.5 20.8 18.5 7.6 0.0228
Earnings per share 27.7 13.2 0.0 16.6 27.7 0.0000
Return on investment 46.1 59.4 6.9 41.7 50.6 0.0000
Sales growth 39.0 53.8 51.4 46.7 6.1 0.0469
Cash flow 61.0 50.0 27.8 49.8 21.0 0.0000
Weighted factor approach 2.8 13.2 52.8 17.6 84.2 0.0000
Level of strategic investment 4.3 7.5 0.0 4.4 5.8 0.0542
Long term strategic goals 19.1 26.4 20.8 21.9 1.9 0.3806
Number of companies 141 106 72 319
F. Lefley et al. / Int. J. Production Economics 88 (2004) 1–14 9
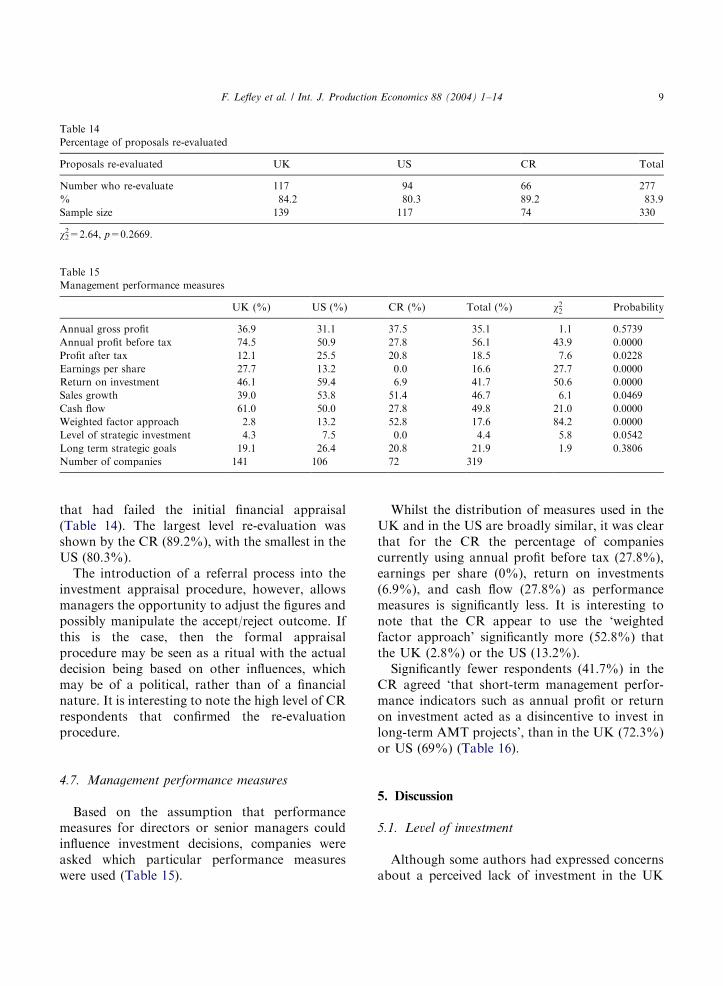
that had failed the initial financial appraisal(Table 14). The largest level re-evaluation wasshown by the CR (89.2%), with the smallest in theUS (80.3%).
The introduction of a referral process into theinvestment appraisal procedure, however, allowsmanagers the opportunity to adjust the figures andpossibly manipulate the accept/reject outcome. Ifthis is the case, then the formal appraisalprocedure may be seen as a ritual with the actualdecision being based on other influences, whichmay be of a political, rather than of a financialnature. It is interesting to note the high level of CRrespondents that confirmed the re-evaluationprocedure.
4.7. Management performance measures
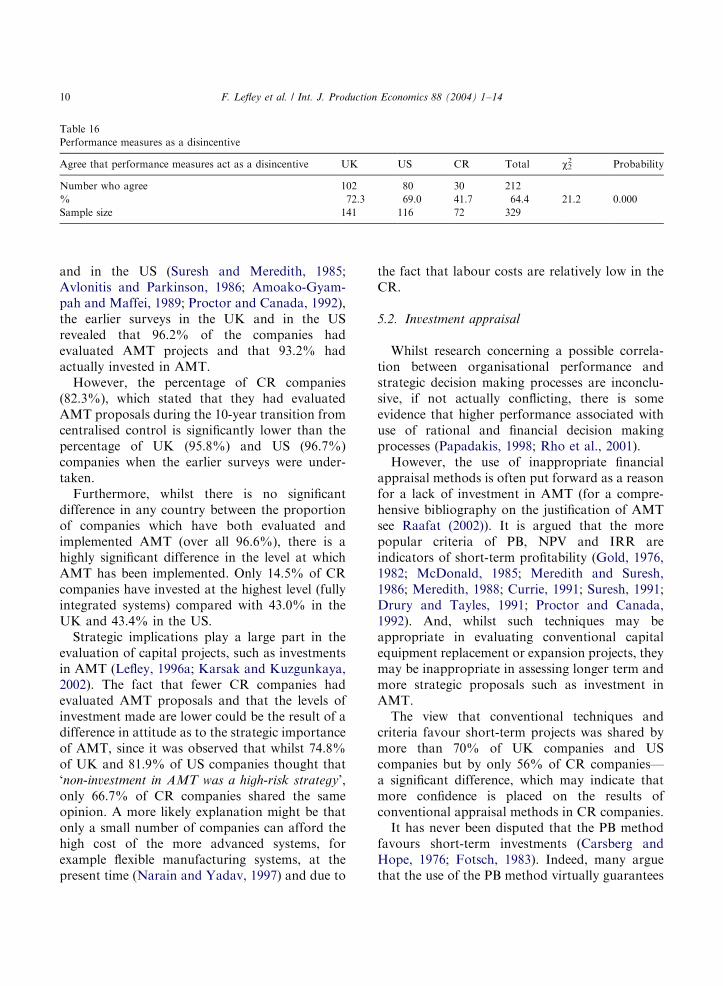
Based on the assumption that performancemeasures for directors or senior managers couldinfluence investment decisions, companies wereasked which particular performance measureswere used (Table 15).
Whilst the distribution of measures used in theUK and in the US are broadly similar, it was clearthat for the CR the percentage of companiescurrently using annual profit before tax (27.8%),earnings per share (0%), return on investments(6.9%), and cash flow (27.8%) as performancemeasures is significantly less. It is interesting tonote that the CR appear to use the ‘weightedfactor approach’ significantly more (52.8%) thatthe UK (2.8%) or the US (13.2%).
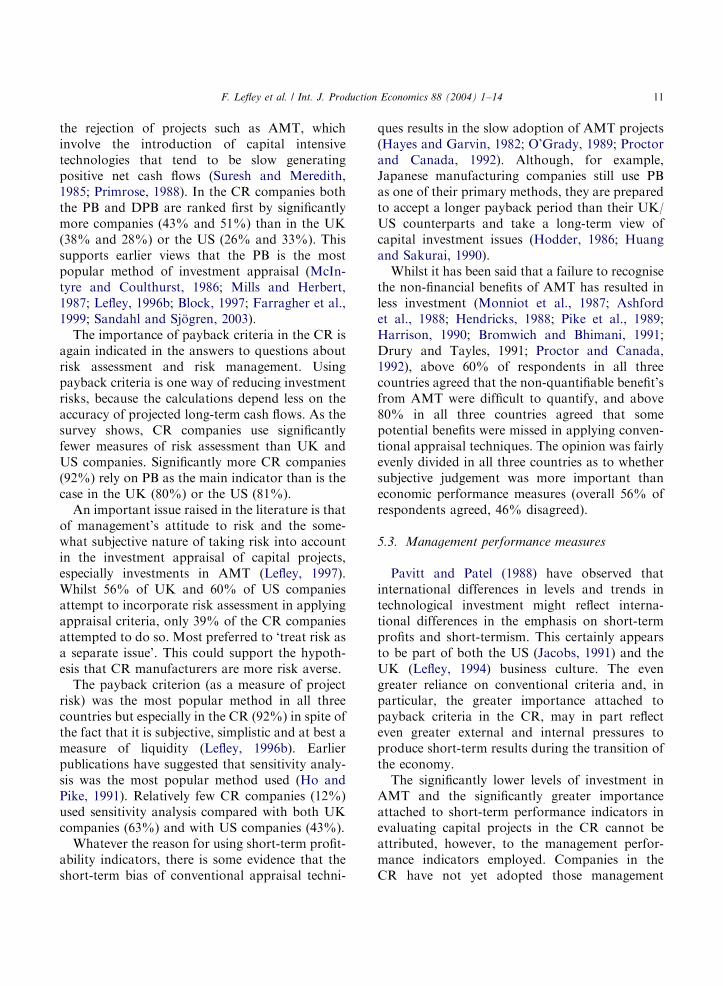
Significantly fewer respondents (41.7%) in theCR agreed ‘that short-term management perfor-mance indicators such as annual profit or returnon investment acted as a disincentive to invest inlong-term AMT projects’, than in the UK (72.3%)or US (69%) (Table 16).
5. Discussion
5.1. Level of investment
Although some authors had expressed concernsabout a perceived lack of investment in the UK
ARTICLE IN PRESS
Table 16
Performance measures as a disincentive
Agree that performance measures act as a disincentive UK US CR Total w22 Probability
Number who agree 102 80 30 212
% 72.3 69.0 41.7 64.4 21.2 0.000
Sample size 141 116 72 329
F. Lefley et al. / Int. J. Production Economics 88 (2004) 1–1410
and in the US (Suresh and Meredith, 1985;Avlonitis and Parkinson, 1986; Amoako-Gyam-pah and Maffei, 1989; Proctor and Canada, 1992),the earlier surveys in the UK and in the USrevealed that 96.2% of the companies hadevaluated AMT projects and that 93.2% hadactually invested in AMT.
However, the percentage of CR companies(82.3%), which stated that they had evaluatedAMT proposals during the 10-year transition fromcentralised control is significantly lower than thepercentage of UK (95.8%) and US (96.7%)companies when the earlier surveys were under-taken.
Furthermore, whilst there is no significantdifference in any country between the proportionof companies which have both evaluated andimplemented AMT (over all 96.6%), there is ahighly significant difference in the level at whichAMT has been implemented. Only 14.5% of CRcompanies have invested at the highest level (fullyintegrated systems) compared with 43.0% in theUK and 43.4% in the US.
Strategic implications play a large part in theevaluation of capital projects, such as investmentsin AMT (Lefley, 1996a; Karsak and Kuzgunkaya,2002). The fact that fewer CR companies hadevaluated AMT proposals and that the levels ofinvestment made are lower could be the result of adifference in attitude as to the strategic importanceof AMT, since it was observed that whilst 74.8%of UK and 81.9% of US companies thought that‘non-investment in AMT was a high-risk strategy’,only 66.7% of CR companies shared the sameopinion. A more likely explanation might be thatonly a small number of companies can afford thehigh cost of the more advanced systems, forexample flexible manufacturing systems, at thepresent time (Narain and Yadav, 1997) and due to
the fact that labour costs are relatively low in theCR.
5.2. Investment appraisal
Whilst research concerning a possible correla-tion between organisational performance andstrategic decision making processes are inconclu-sive, if not actually conflicting, there is someevidence that higher performance associated withuse of rational and financial decision makingprocesses (Papadakis, 1998; Rho et al., 2001).
However, the use of inappropriate financialappraisal methods is often put forward as a reasonfor a lack of investment in AMT (for a compre-hensive bibliography on the justification of AMTsee Raafat (2002)). It is argued that the morepopular criteria of PB, NPV and IRR areindicators of short-term profitability (Gold, 1976,1982; McDonald, 1985; Meredith and Suresh,1986; Meredith, 1988; Currie, 1991; Suresh, 1991;Drury and Tayles, 1991; Proctor and Canada,1992). And, whilst such techniques may beappropriate in evaluating conventional capitalequipment replacement or expansion projects, theymay be inappropriate in assessing longer term andmore strategic proposals such as investment inAMT.
The view that conventional techniques andcriteria favour short-term projects was shared bymore than 70% of UK companies and UScompanies but by only 56% of CR companies—a significant difference, which may indicate thatmore confidence is placed on the results ofconventional appraisal methods in CR companies.
It has never been disputed that the PB methodfavours short-term investments (Carsberg andHope, 1976; Fotsch, 1983). Indeed, many arguethat the use of the PB method virtually guarantees
ARTICLE IN PRESS
F. Lefley et al. / Int. J. Production Economics 88 (2004) 1–14 11
the rejection of projects such as AMT, whichinvolve the introduction of capital intensivetechnologies that tend to be slow generatingpositive net cash flows (Suresh and Meredith,1985; Primrose, 1988). In the CR companies boththe PB and DPB are ranked first by significantlymore companies (43% and 51%) than in the UK(38% and 28%) or the US (26% and 33%). Thissupports earlier views that the PB is the mostpopular method of investment appraisal (McIn-tyre and Coulthurst, 1986; Mills and Herbert,1987; Lefley, 1996b; Block, 1997; Farragher et al.,1999; Sandahl and Sj .ogren, 2003).
The importance of payback criteria in the CR isagain indicated in the answers to questions aboutrisk assessment and risk management. Usingpayback criteria is one way of reducing investmentrisks, because the calculations depend less on theaccuracy of projected long-term cash flows. As thesurvey shows, CR companies use significantlyfewer measures of risk assessment than UK andUS companies. Significantly more CR companies(92%) rely on PB as the main indicator than is thecase in the UK (80%) or the US (81%).
An important issue raised in the literature is thatof management’s attitude to risk and the some-what subjective nature of taking risk into accountin the investment appraisal of capital projects,especially investments in AMT (Lefley, 1997).Whilst 56% of UK and 60% of US companiesattempt to incorporate risk assessment in applyingappraisal criteria, only 39% of the CR companiesattempted to do so. Most preferred to ‘treat risk asa separate issue’. This could support the hypoth-esis that CR manufacturers are more risk averse.
The payback criterion (as a measure of projectrisk) was the most popular method in all threecountries but especially in the CR (92%) in spite ofthe fact that it is subjective, simplistic and at best ameasure of liquidity (Lefley, 1996b). Earlierpublications have suggested that sensitivity analy-sis was the most popular method used (Ho andPike, 1991). Relatively few CR companies (12%)used sensitivity analysis compared with both UKcompanies (63%) and with US companies (43%).
Whatever the reason for using short-term profit-ability indicators, there is some evidence that theshort-term bias of conventional appraisal techni-
ques results in the slow adoption of AMT projects(Hayes and Garvin, 1982; O’Grady, 1989; Proctorand Canada, 1992). Although, for example,Japanese manufacturing companies still use PBas one of their primary methods, they are preparedto accept a longer payback period than their UK/US counterparts and take a long-term view ofcapital investment issues (Hodder, 1986; Huangand Sakurai, 1990).
Whilst it has been said that a failure to recognisethe non-financial benefits of AMT has resulted inless investment (Monniot et al., 1987; Ashfordet al., 1988; Hendricks, 1988; Pike et al., 1989;Harrison, 1990; Bromwich and Bhimani, 1991;Drury and Tayles, 1991; Proctor and Canada,1992), above 60% of respondents in all threecountries agreed that the non-quantifiable benefit’sfrom AMT were difficult to quantify, and above80% in all three countries agreed that somepotential benefits were missed in applying conven-tional appraisal techniques. The opinion was fairlyevenly divided in all three countries as to whethersubjective judgement was more important thaneconomic performance measures (overall 56% ofrespondents agreed, 46% disagreed).
5.3. Management performance measures
Pavitt and Patel (1988) have observed thatinternational differences in levels and trends intechnological investment might reflect interna-tional differences in the emphasis on short-termprofits and short-termism. This certainly appearsto be part of both the US (Jacobs, 1991) and theUK (Lefley, 1994) business culture. The evengreater reliance on conventional criteria and, inparticular, the greater importance attached topayback criteria in the CR, may in part reflecteven greater external and internal pressures toproduce short-term results during the transition ofthe economy.
The significantly lower levels of investment inAMT and the significantly greater importanceattached to short-term performance indicators inevaluating capital projects in the CR cannot beattributed, however, to the management perfor-mance indicators employed. Companies in theCR have not yet adopted those management
ARTICLE IN PRESS
F. Lefley et al. / Int. J. Production Economics 88 (2004) 1–1412
performance indicators, which tend to encourage ashort-term view. Measures such as annual profitbefore or after tax, return on investment, andearnings per share are used less in the CR.Significantly more companies in the CR than inthe UK or US claim to be using a weighted factorapproach. There was no significant differencebetween the UK, US and CR companies in usingthe achievement of long-term strategic goals as abasis for measuring management performance(overall 21%). As previously observed, signifi-cantly fewer CR respondents were of the view thatshort-term management performance indicatorswere a disincentive to invest in long-term AMTprojects.
Some authors have suggested that short-ter-mism is the consequence of management mobilityand self interest (Hayes and Abernathy, 1980;Sheridan, 1986). There were no significant differ-ences between the three countries surveyed in theextent to which the opinion was expressed that theadoption of short-term measures might be attri-butable to management mobility or self-interest.The opinion in all three countries is fairly evenlydivided about the extent to which a short-termview can be attributed to management mobility(overall 56% agree) or self-interest (overall 59%agree).
6. Conclusions
Manufacturers in the Czech Republic (CR)must invest more heavily in AMT if the countryis to restore its former pre-eminence as a world-class manufacturing nation. Whilst the CR gov-ernment has implemented a number of measures toencourage AMT investment, it is clear that to-datesignificantly fewer manufacturing companies in theCR have taken steps to evaluate such projects thanin the UK or in the US. Those that have evaluatedand implemented AMT projects are tending tolimit the investment to the less sophisticated andless expensive systems.
CR managers place a greater reliance on short-term performance indicators, such as paybackperiod, which makes it less likely that AMTprojects would be accepted, and there is some
evidence that fewer CR company directors recog-nise the strategic importance of AMT investment.The reason for using of short-term investmentperformance indicators cannot be attributed to thepressures imposed by short-term managementperformance indicators. These incentives are notyet in use in the CR to the same extent that theyare in the UK and the US.
Anxiety to achieve short-term returns frominvestments funded by limited capital reservesmay be a natural consequence of the transitionin the Czech economy, but it could prove fatal fora manufacturing sector which needs to be able tosurvive in a competitive environment that reliesincreasingly on technologically advanced manu-facturing.
Acknowledgements
This research was a joint project between TheBusiness School, University of Hull, UK, and theUniversity of Hradec Kr!alov!e, Czech Republic.
References
Abdel-Kader, M.G., Dugdale, D., 1998. Investment in ad-
vanced manufacturing technology: A study of practice in
large UK companies. Management Accounting Research
9 (3), 261–284.
Amoako-Gyampah, K., Maffei, M.J., 1989. The adoption of
flexible manufacturing systems: Strategic considerations.
Technovation 9, 479–491.
Ashford, R.W., Dyson, R.G., Hodges, S.D., 1988. The capital
investment appraisal of new technology: Problems, mis-
conceptions and research directions. Journal of the Opera-
tional Research Society 39 (7), 637.
Avlonitis, G.J., Parkinson, S., 1986. The adoption of flexible
manufacturing systems in British and German companies.
Industrial Marketing Management 15 (2), 97–108.
Block, S., 1997. Capital budgeting techniques used by small
business firms in the 1990s. Engineering Economist 42 (4),
289–302.
Bromwich, M., Bhimani, A., 1991. Strategic investment
appraisal. Management Accounting (UK) 69 (3), 45–48.
Carsberg, B., Hope, A., 1976. Business Investment Decisions
Under Inflation. ICAEW, London.
Chen, S., Clark, R.L., 1994. Management compensation and
payback method in capital budgeting: A path analysis.
Accounting and Business Research 24 (94), 121–132.
ARTICLE IN PRESS
F. Lefley et al. / Int. J. Production Economics 88 (2004) 1–14 13
Cotton, W.D.J., Schinski, M., 1999. Justifying capital expen-
ditures in new technology: A survey. Engineering Economist
44 (4), 362–376.
Currie, W.L., 1991. Managing technology: A crisis in manage-
ment accounting. Management Accounting (UK) 69 (2),
24–27.
Dornan, S.B., 1987. Cells and systems: Justifying the invest-
ment. Production, February, 30–35.
Drury, C., Tayles, M., 1991. Investment appraisal, product
costing and performance measurement. Company Accoun-
tant, June, 10–17.
Farragher, E.J., Kleiman, R.T., Sahu, A.P., 1999. Current
capital investment practices. Engineering Economist 44 (2),
137–150.
Fotsch, R.J., 1983. Machine tool justification policies: Their
effect on productivity and profitability. Journal of Manu-
facturing Systems 3 (2), 169–195.
Gold, B., 1976. The shaky foundations of capital budgeting.
California Management Review 19 (2), 51–60.
Gold, B., 1982. CAM sets new rules of production. Harvard
Business Review 60 (6), 88–94.
Harrison, B., 1990. Automation: Managing to make the right
decision. Electrical Review 2 (15), 17–18.
Hayes, R.H., Abernathy, W.J., 1980. Managing our way
to economic decline. Harvard Business Review 57 (1),
67–77.
Hayes, R.H., Garvin, D.A., 1982. Managing as if tomorrow
matters. Harvard Business Review 60 (3), 70–79.
Hendricks, J.A., 1988. Applying cost accounting to factory
automation. Management Accounting (US) 70 (6), 24–30.
Ho, S.S.M., Pike, R., 1991. Risk analysis in capital budgeting
contexts: Simple or sophisticated? Accounting and Business
Research 21 (83), 227–238.
Hodder, J.E., 1986. Evaluation of manufacturing investments:
A comparison of US and Japanese practices. Financial
Management 15 (1), 17–24.
Hospod!a$rsk!e Noviny, 1990. Economic papers, September 4,
p. I–IV.
Hospod!a$rsk!e Noviny, 1998. April 30, p. 1.
Huang, P.Y., Sakurai, M., 1990. Factory automation: The
Japanese experience. IEEE Transactions on Engineering
Management 37 (2), 102–108.
Jacobs, M.T., 1991. Short-Term America: The Causes and
Cures of Our Business Myopia. Harvard Business School
Press, Boston.
Jan!aWek, K., et al., 1998. Czech Economy in 1998. Risks and
Challenges, Prague Economic Papers, 2, 99–139.
Karsak, E.E., Kuzgunkaya, O., 2002. A fuzzy multiple
programming approach for the selection of a flexible
manufacturing system. International Journal of Production
Economics 79 (2), 101–111.
Komu$snık, C., 1997. Zamy$slen!ı nad ekonomickou transformac!ı.
Politick!a ekonomie 1, 59–73.
Lefley, F., 1994. Capital investment appraisal of advanced
manufacturing technology. International Journal of Pro-
duction Research 32 (12), 2751–2776.
Lefley, F., 1996a. Strategic methodologies of investment
appraisal of AMT projects: A review and synthesis.
Engineering Economist 41 (4), 345–363.
Lefley, F., 1996b. The payback method of investment appraisal:
A review and synthesis. International Journal of Production
Economics 44 (3), 207–224.
Lefley, F., 1997. Approaches to risk and uncertainty in the
appraisal of new technology capital projects. International
Journal of Production Economics 53 (1), 21–33.
Lefley, F., Sarkis, J., 1997. Short-termism and the appraisal of
AMT capital projects in the US and UK. International
Journal of Production Research 35 (2), 341–368.
McDonald, I., 1985. Modern systems demand fresh look at
ROI concepts. Accountancy 96, 136–137.
McIntyre, A.D., Coulthurst, N.J., 1986. Capital budgeting
practices in medium-sized businesses—a survey. A Research
Report. Institute of Cost and Management Accountants,
London.
Meredith, J.R., 1988. The role of manufacturing technology in
competitiveness: Peerless laser processors. IEEE Transac-
tions on Engineering Management 35 (1), 3–10.
Meredith, J.R., Suresh, N.C., 1986. Justification techniques for
advanced manufacturing technologies. International Jour-
nal of Production Research 24 (5), 1043–1057.
Mills, R.W., Herbert, P.J.A., 1987. Corporate and Divisional
Influence in Capital Budgeting. ICMA, London.
Monniot, J.P., Rhodes, D.J., Towill, D.R., Waterlow, J.G.,
1987. A study of computer aided production management in
UK batch manufacturing industry. International Journal of
Operations and Production Management 7 (2), 1–32.
Narain, R., Yadav, R.C., 1997. Technological Forecasting and
Social Change, 55, 83–98.
O’Grady, P., 1989. Flexible manufacturing systems: Present
development and trends. Computers in Industry 12 (3),
241–251.
Papadakis, V.M., 1998. Strategic investment decision processes
and organisational performance. The British Journal of
Management 9 (2), 115–132.
Pavitt, K., Patel, P., 1988. The international distribution and
determinants of technological activities. Oxford Review of
Economic Policy 4 (4), 35–55.
Pavlica, K., Thorpe, K., 1998. Managers’ perceptions of their
identity: A comparative study between the Czech Republic
and Britain. The British Journal of Management 9 (2),
133–149.
Pike, R.H., Sharp, J., Price, D., 1989. AMT investment in the
larger UK firm. International Journal of Operations and
Production Management 9 (2), 13–26.
Primrose, P.L., 1988. AMT investment and costing systems.
Management Accounting (UK) 66 (9), 26–27.
Proctor, M.D., Canada, J.R., 1992. Past and present methods
of manufacturing investment: A review of the empirical and
theoretical literature. Engineering Economist 38 (1), 45–58.
Raafat, F., 2002. A comprehensive bibliography on the
justification of advanced manufacturing systems. Interna-
tional Journal of Production Economics 79 (3), 197–208.

ARTICLE IN PRESS
F. Lefley et al. / Int. J. Production Economics 88 (2004) 1–1414
Remer, D.S., Stokdyke, S.B., Driel, M.V., 1993. Survey of
project evaluation techniques currently used in industry.
International Journal of Production Economics 32,
103–115.
Rho, B.-O., Park, K., Yu, Y.-M., 2001. An international
comparison of the effect of manufacturing strategy-imple-
mentation gap on business performance. International
Journal of Production Economics 70 (1), 89–97.
Sandahl, C., Sj .ogren, S., 2003. Capital budgeting methods
among Sweden’s largest groups of companies. The state of
the art and a comparison with earlier studies. International
Journal of Production Economics 84 (1), 51–69.
Sheridan, T., 1986. How to account for manufacturing.
Management Today, August, 61–62, 74–75.
Suresh, N.C., 1991. An extended multi-objective replacement
model for flexible automation investments. International
Journal of Production Research 29 (9), 1823–1844.
Suresh, N.C., Meredith, J.R., 1985. Justifying multimachine
systems: An integrated strategic approach. Journal of
Manufacturing Systems 4 (2), 117–134.