manual - practical nmr · experiment 4: practical nmr 40 also just add solvent directly to the...
TRANSCRIPT
39
Experiment 4
Practical NMR: Collecting and Interpreting Your Own Spectra
Reading: Handbook for Organic Chemistry Lab, chapters on NMR Spectroscopy (Chapter 18) and Identification of
Compounds (Chapter 20). Organic Chemistry, Marc Loudon, 6th ed., pp. 611-653 (13.1-13.7); pp. 662-667 (13.10-13.11).
Previously, you learned how to interpret the 1H NMR spectra of pure compounds. In this experiment, you will learn how to collect and analyze your own spectra and deal with all the complications of impure samples. This way, you can use NMR to assess how successful each of your reactions is in future experiments. There is no prelab or quiz for this experiment.
You can save some time by installing MestreNova on your computer before the lab. To do this, go to www.orgchemboulder.com/Labs/Software and follow the instructions for acquiring and installing MestreNova. Note that this software needs to contact a license server which can sometimes be unreliable, so make sure you install this software well in advance of when your writeup is due! Inability to contact the server will not be considered a valid excuse for late work.
How to Prepare and Submit an NMR Sample
As soon as you arrive in your lab today, clean an NMR tube and cap with acetone and allow them to start drying upside-down in a flask. This will mean that your tube is ready to use when you need it for running your own spectrum. If the cap is stuck to the tube, you can soak it off by filling a vial or small beaker with acetone, and placing the end of the tube upside-down in the acetone for a few minutes.
The majority of NMR samples are run in solution – a little of the sample is dissolved in a solvent. Since all hydrogen nuclei (protons) are visible in NMR, any protons in the solvent molecules will likely give off a much stronger signal than protons in the sample, since there are so many more molecule of solvent present, and will drown out the peaks from the sample. The best way to avoid this problem is to use a solvent where all of the protons have been replaced with deuterium, called a deuterated solvent. These deuterium atoms will not interfere with the signal from the protons in the sample. (Another reason why deuterated solvents are necessary is that the instrument needs to “lock on” to the separate signal that comes from the deuterium nuclei, to ensure that it is properly tuned.)
Some common deuterated solvents include CDCl3 (deuterated chloroform), D2O (deuterated water), and CD3COCD3 (deuterated acetone or acetone-d6). Of the deuterated solvents, the most commonly used is CDCl3, since it has fewer deuterium atoms per molecule and is therefore less expensive (although still fairly expensive). Most compounds will dissolve in CDCl3 readily, but if not, then D2O or acetone-d6 can be tried instead.
You should already have rinsed your NMR tube with acetone by this point, and allowed it to dry for at least an hour. This is a good idea for any experiment that requires an NMR spectrum. If you ever forget to give it time to dry, you can remove most of the acetone by adding a small amount of CDCl3 to a depth of half an inch in the tube, and tilting the tube back and forth to rinse it. However, due to cost, this solvent is better to save for actual spectra.
It is important to avoid having solid particles in your NMR sample. This is because particles distort the magnetic field in the solution around them, causing all of the spectrum’s peaks to appear broad and smeared-out. For this reason, it is best to make up your sample in a separate vial first before transferring it to the tube. If you have very little sample or if your sample is too gummy to transfer to a vial, you can
Experiment 4: Practical NMR
40
also just add solvent directly to the flask that contains it. Then, once your sample has dissolved, you can pipet the solution into your tube, while carefully avoiding the transfer of any particles.
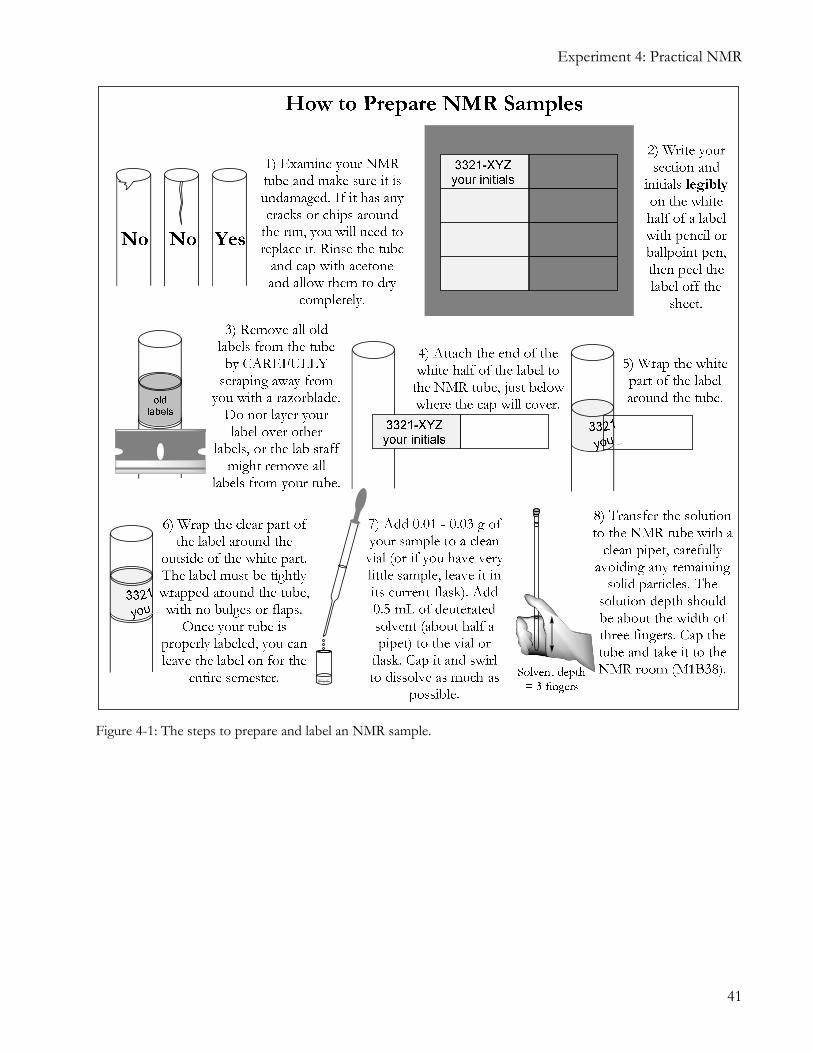
Once your sample is dissolved in deuterated solvent, you will place it into an NMR tube, a narrow glass tube that can be capped at one end. To keep track of which tube is yours, you will need to wrap a special NMR tube label around it. When your sample is placed in the instrument, it will be spun very rapidly to cancel out any unevenness in the tube walls. For this reason, you should wrap your label tightly, so that it will not make the tube spin off-balance. These labels are self-laminating: the white half with writing on it is wrapped around the tube first, and then the clear half is wrapped around the outside to prevent the writing from being smudged off. You will need to peel old labels off the tube before applying your own. Do not use regular label tape, do not allow any parts of your label to stick out or bulge, and do
not apply your label over any labels that are already present. If you do any of these things, your
tube may be pulled out of the NMR queue by the lab staff.
The teaching labs at CU have a Bruker Avance-III 300 NMR Spectrometer. This instrument uses an autosampler: a rotating rack capable of holding up to sixty samples, which can place a sample into the NMR and remove it afterwards. This is invaluable for processing the large number of NMR samples produced by the organic teaching labs, since samples can be submitted quickly and then allowed to run overnight. Each sample typically takes two to four minutes for acquisition of a 1H NMR spectrum. When submitting samples, you should type in your email address, so that the instrument will email you your spectrum as soon as it is finished. The drawback is that the autosampler crashes easily if the sample is not prepared according to specifications. If the tube is damaged, if the label is placed incorrectly, or if the sample is placed in the wrong spot on the rack, then the autosampler may crash and stop running samples until it is reset.
An even more important reason to be careful is to avoid breaking the NMR machine itself. If your NMR tube is dirty and deposits residue inside the machine, or if it breaks inside the NMR, then the instrument will be unusable for all other organic students, potentially for several months. For this reason, FOLLOW
THESE INSTRUCTIONS CAREFULLY. Figure 4-1 and Figure 4-2 below will show you how to prepare, label, and submit your NMR sample. Once you have done this, input your sample information into the computer in the NMR room.
How to Input Your Sample Information
1. On the computer next to the carousel, enter your sample details into the form. Make sure that your sample position matches the sample position on the form. Use a unique description for each sample you submit – if you use the same sample name twice, your old spectrum will be overwritten. If you had to put your tube in the overflow rack, use the rows towards the bottom of the form labeled “Overflow 1”, “Overflow 2”, etc.
2. Make sure your tube label is legible! If the spreadsheet is lost for any reason, the lab staff may have to re-enter the information based on what they can read from the labels. If your label doesn’t have your initials and section clearly visible, you may never receive your spectrum, or even your tube back.
3. You should be emailed your spectrum the next time the carousel is run, usually within a day or two. If you are waiting for longer than this, you may need to download it from the server yourself, or come in to resubmit your sample. Instructions are posted at www.orgchemboulder.com/Labs/Software, under “What If You Don't Get Your Spectra?”.
4. All the tubes submitted by your section will be set out in the NMR room, so that you can pick up your tube during the following lab and reuse it. Make sure you pick up your own tube from the rack and not someone else’s. Rinse it with acetone and allow it to dry until you need it again.
Experiment 4: Practical NMR
41
Figure 4-1: The steps to prepare and label an NMR sample.

Experiment 4: Practical NMR
42
Figure 4-2: The steps to submit an NMR sample to the queue.
1
Experiment 4: Practical NMR
43
Working Up Your Spectrum in MestreNova
For the following sections, there are example spectra files available on the orgchem website. You can access them directly by going to www.orgchemboulder.com/Labs/Experiments/PracticalNMR.zip. You should download this file, unzip it, and follow along with the steps to work up the spectrum yourself (you will need to turn it in as part of the experiment). If you haven’t already done so, you should also download and install MestreNova, following the directions at www.orgchemboulder.com/Labs/Software.
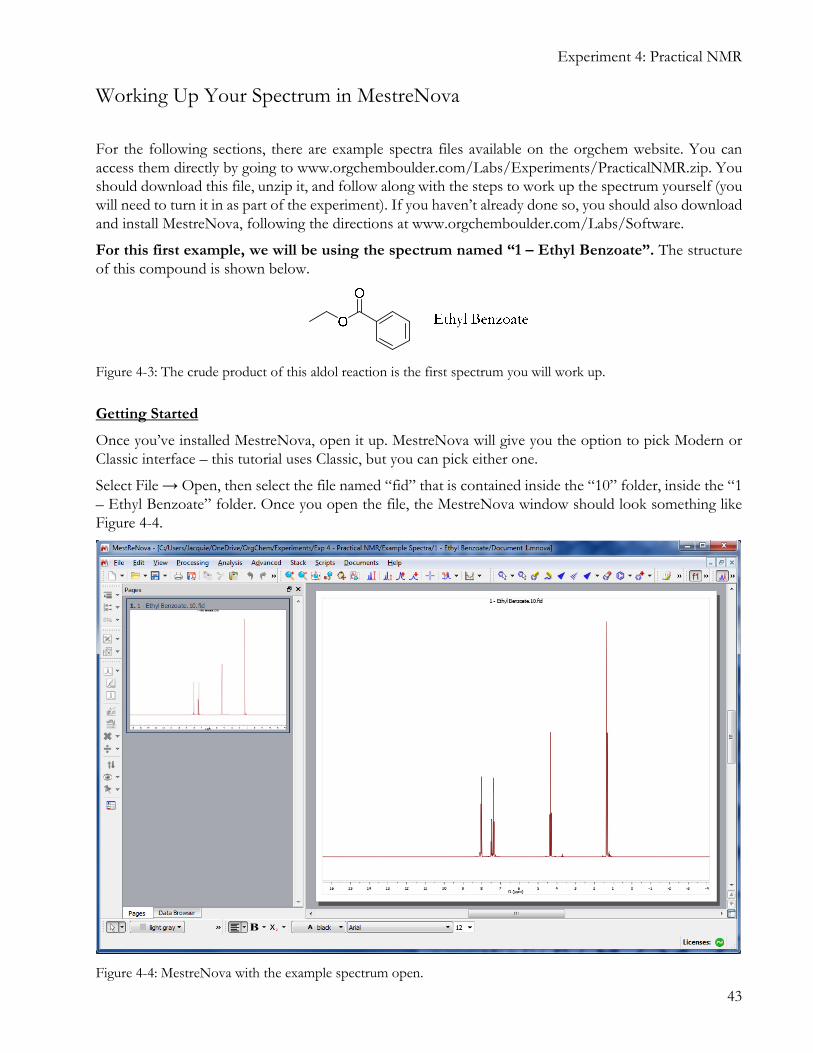
For this first example, we will be using the spectrum named “1 – Ethyl Benzoate”. The structure of this compound is shown below.
Figure 4-3: The crude product of this aldol reaction is the first spectrum you will work up.
Getting Started
Once you’ve installed MestreNova, open it up. MestreNova will give you the option to pick Modern or Classic interface – this tutorial uses Classic, but you can pick either one.
Select File → Open, then select the file named “fid” that is contained inside the “10” folder, inside the “1 – Ethyl Benzoate” folder. Once you open the file, the MestreNova window should look something like Figure 4-4.
Figure 4-4: MestreNova with the example spectrum open.

Experiment 4: Practical NMR
44
Occasionally, when you open a spectrum, it might be badly phased. This means that the integrals on your spectrum – the numbers that tell you how many protons are contributing to each peak – will be inaccurate. A poorly-phased spectrum will have the peaks either inverted so they point down, or skewed so they point up and down asymptotically. To phase the spectrum, right click it and select Phase Correction → Automatic. Figure 4-5 shows the results. After this, you can select View → Fit to Height (or just hit the H key) to resize your vertical scale to a convenient size. MestreNova may have done this for you automatically, but this will not always be the case.
Figure 4-5: The same peaks, before and after phasing.
If the peaks in your spectrum are crowded together at the center of the main window, there are four buttons you can use to control horizontal zoom. The easiest one to use for now is the magnifying glass with a plus sign next to it, in the middle of the upper menu bar (Figure 4-6). This will allow you to draw a box around the part of the spectrum you wish to examine. You can always revert to showing the full spectrum using the button with a magnifying glass over a white rectangle. If you like, you can also click the fourth button in this set (a hand holding a magnifying glass) to manually type in what range you’d like to see.
Figure 4-6: The “Zoom In” tool and the “Show Full Spectrum” tool are useful for taking a closer look at peaks.
For now, let’s zoom in on the area between about 9 ppm and 0 ppm, since all the peaks are in this region. Click the Zoom In tool (or just hit the Z key on your keyboard) and draw a box around the area between 9 and 0 ppm. If the peaks in your spectrum are too short or tall to see easily, you can use the scroll wheel of your mouse to change the vertical zoom. Do this until your spectrum looks like Figure 4-7.
Experiment 4: Practical NMR
45
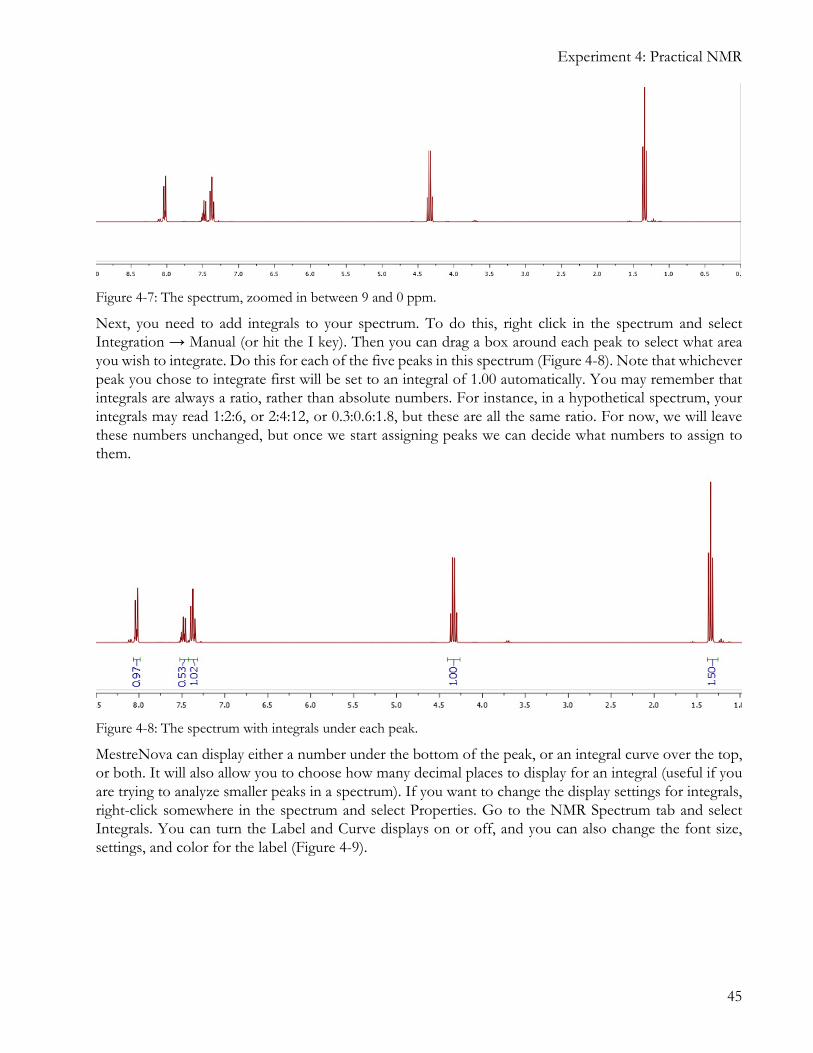
Figure 4-7: The spectrum, zoomed in between 9 and 0 ppm.
Next, you need to add integrals to your spectrum. To do this, right click in the spectrum and select Integration → Manual (or hit the I key). Then you can drag a box around each peak to select what area you wish to integrate. Do this for each of the five peaks in this spectrum (Figure 4-8). Note that whichever peak you chose to integrate first will be set to an integral of 1.00 automatically. You may remember that integrals are always a ratio, rather than absolute numbers. For instance, in a hypothetical spectrum, your integrals may read 1:2:6, or 2:4:12, or 0.3:0.6:1.8, but these are all the same ratio. For now, we will leave these numbers unchanged, but once we start assigning peaks we can decide what numbers to assign to them.
Figure 4-8: The spectrum with integrals under each peak.
MestreNova can display either a number under the bottom of the peak, or an integral curve over the top, or both. It will also allow you to choose how many decimal places to display for an integral (useful if you are trying to analyze smaller peaks in a spectrum). If you want to change the display settings for integrals, right-click somewhere in the spectrum and select Properties. Go to the NMR Spectrum tab and select Integrals. You can turn the Label and Curve displays on or off, and you can also change the font size, settings, and color for the label (Figure 4-9).
Experiment 4: Practical NMR
46
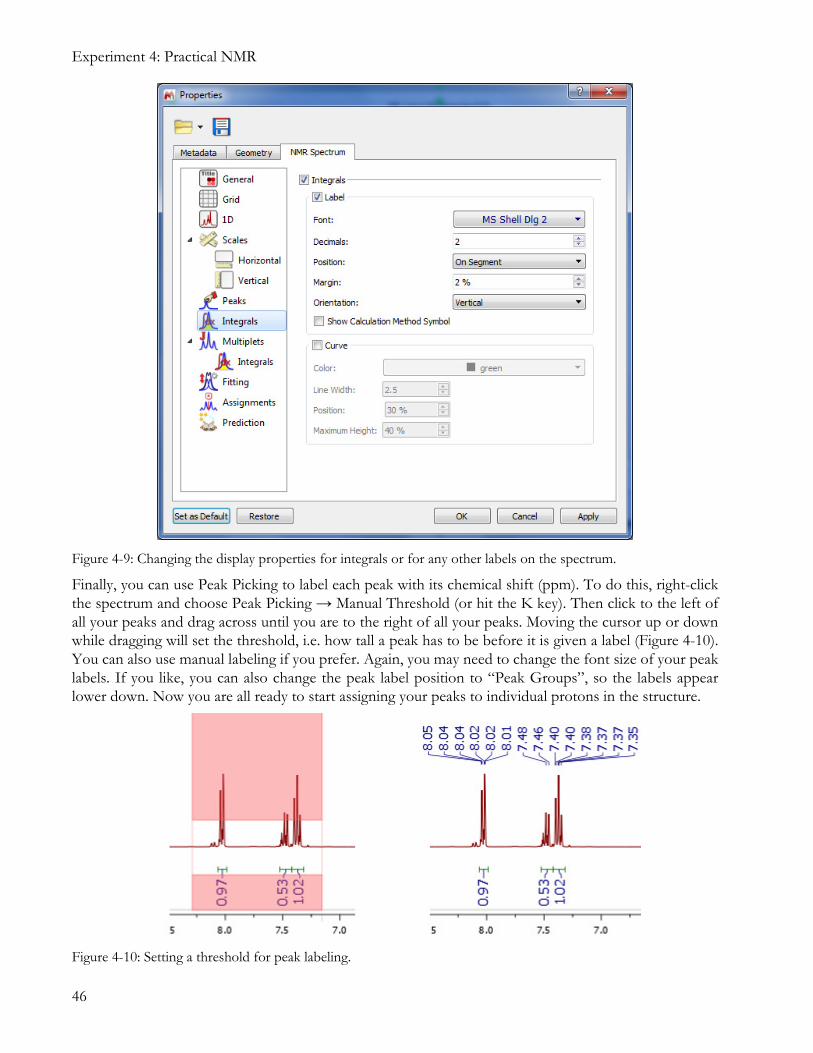
Figure 4-9: Changing the display properties for integrals or for any other labels on the spectrum.
Finally, you can use Peak Picking to label each peak with its chemical shift (ppm). To do this, right-click the spectrum and choose Peak Picking → Manual Threshold (or hit the K key). Then click to the left of all your peaks and drag across until you are to the right of all your peaks. Moving the cursor up or down while dragging will set the threshold, i.e. how tall a peak has to be before it is given a label (Figure 4-10). You can also use manual labeling if you prefer. Again, you may need to change the font size of your peak labels. If you like, you can also change the peak label position to “Peak Groups”, so the labels appear lower down. Now you are all ready to start assigning your peaks to individual protons in the structure.
Figure 4-10: Setting a threshold for peak labeling.
Experiment 4: Practical NMR
47
Assigning Peaks
Although most of the spectra you saw in the NMR tutorial were taken from pure compounds, you will seldom see such clean spectra when running your own products. Often there are peaks belonging to solvents, side products, starting materials, contaminants from glassware, or other trace impurities that have been carried through from previous steps of a synthesis.
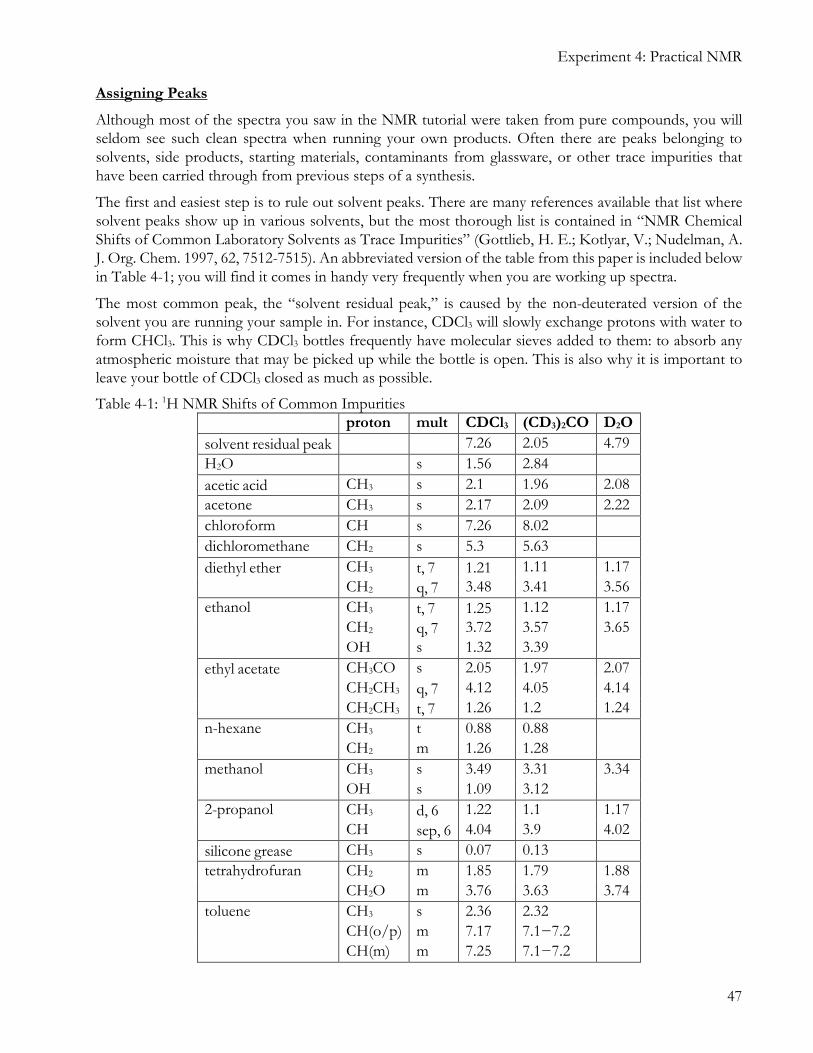
The first and easiest step is to rule out solvent peaks. There are many references available that list where solvent peaks show up in various solvents, but the most thorough list is contained in “NMR Chemical Shifts of Common Laboratory Solvents as Trace Impurities” (Gottlieb, H. E.; Kotlyar, V.; Nudelman, A. J. Org. Chem. 1997, 62, 7512-7515). An abbreviated version of the table from this paper is included below in Table 4-1; you will find it comes in handy very frequently when you are working up spectra.
The most common peak, the “solvent residual peak,” is caused by the non-deuterated version of the solvent you are running your sample in. For instance, CDCl3 will slowly exchange protons with water to form CHCl3. This is why CDCl3 bottles frequently have molecular sieves added to them: to absorb any atmospheric moisture that may be picked up while the bottle is open. This is also why it is important to leave your bottle of CDCl3 closed as much as possible.
Table 4-1: 1H NMR Shifts of Common Impurities proton mult CDCl3 (CD3)2CO D2O
solvent residual peak 7.26 2.05 4.79
H2O s 1.56 2.84
acetic acid CH3 s 2.1 1.96 2.08
acetone CH3 s 2.17 2.09 2.22
chloroform CH s 7.26 8.02
dichloromethane CH2 s 5.3 5.63
diethyl ether CH3 t, 7 1.21 1.11 1.17
CH2 q, 7 3.48 3.41 3.56
ethanol CH3 t, 7 1.25 1.12 1.17
CH2 q, 7 3.72 3.57 3.65
OH s 1.32 3.39
ethyl acetate CH3CO s 2.05 1.97 2.07
CH2CH3 q, 7 4.12 4.05 4.14
CH2CH3 t, 7 1.26 1.2 1.24
n-hexane CH3 t 0.88 0.88
CH2 m 1.26 1.28
methanol CH3 s 3.49 3.31 3.34
OH s 1.09 3.12
2-propanol CH3 d, 6 1.22 1.1 1.17
CH sep, 6 4.04 3.9 4.02
silicone grease CH3 s 0.07 0.13
tetrahydrofuran CH2 m 1.85 1.79 1.88
CH2O m 3.76 3.63 3.74
toluene CH3 s 2.36 2.32
CH(o/p) m 7.17 7.1−7.2
CH(m) m 7.25 7.1−7.2
Experiment 4: Practical NMR
48
As a side note: all of the peaks given are in reference to a standard for proton NMR. This standard is set by defining the chemical shift of TMS (tetramethylsilane) as exactly 0 ppm (Figure 4-11). In older instruments, it was necessary to add a small amount of TMS to the sample so that the instrument could use it as a reference.
Figure 4-11: TMS, the standard that is used for proton NMRs, is always defined to be 0 ppm.
If a molecule has multiple peaks associated with it, you need to make sure every peak in that listing is present. If you want to assign an impurity as toluene, for example, because there's a singlet at 2.36 ppm, the other two peaks (a multiplet at 7.17 ppm and another multiplet at 7.25) need to be there as well. If you want to make extra sure of your impurity peak assignments, you can check the ratio of their integrals to make sure they all make sense (with the toluene example, it would need to be 3:3:2, since it has a total of eight protons).
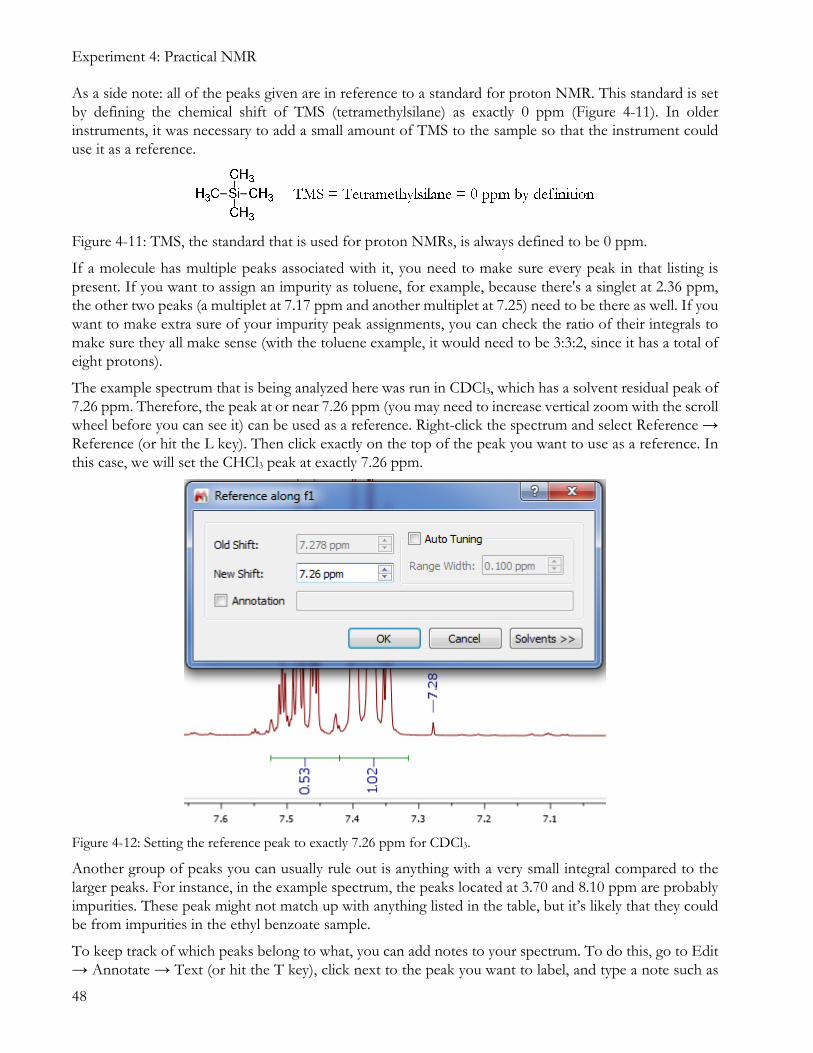
The example spectrum that is being analyzed here was run in CDCl3, which has a solvent residual peak of 7.26 ppm. Therefore, the peak at or near 7.26 ppm (you may need to increase vertical zoom with the scroll wheel before you can see it) can be used as a reference. Right-click the spectrum and select Reference → Reference (or hit the L key). Then click exactly on the top of the peak you want to use as a reference. In this case, we will set the CHCl3 peak at exactly 7.26 ppm.
Figure 4-12: Setting the reference peak to exactly 7.26 ppm for CDCl3.
Another group of peaks you can usually rule out is anything with a very small integral compared to the larger peaks. For instance, in the example spectrum, the peaks located at 3.70 and 8.10 ppm are probably impurities. These peak might not match up with anything listed in the table, but it’s likely that they could be from impurities in the ethyl benzoate sample.
To keep track of which peaks belong to what, you can add notes to your spectrum. To do this, go to Edit → Annotate → Text (or hit the T key), click next to the peak you want to label, and type a note such as
Experiment 4: Practical NMR
49
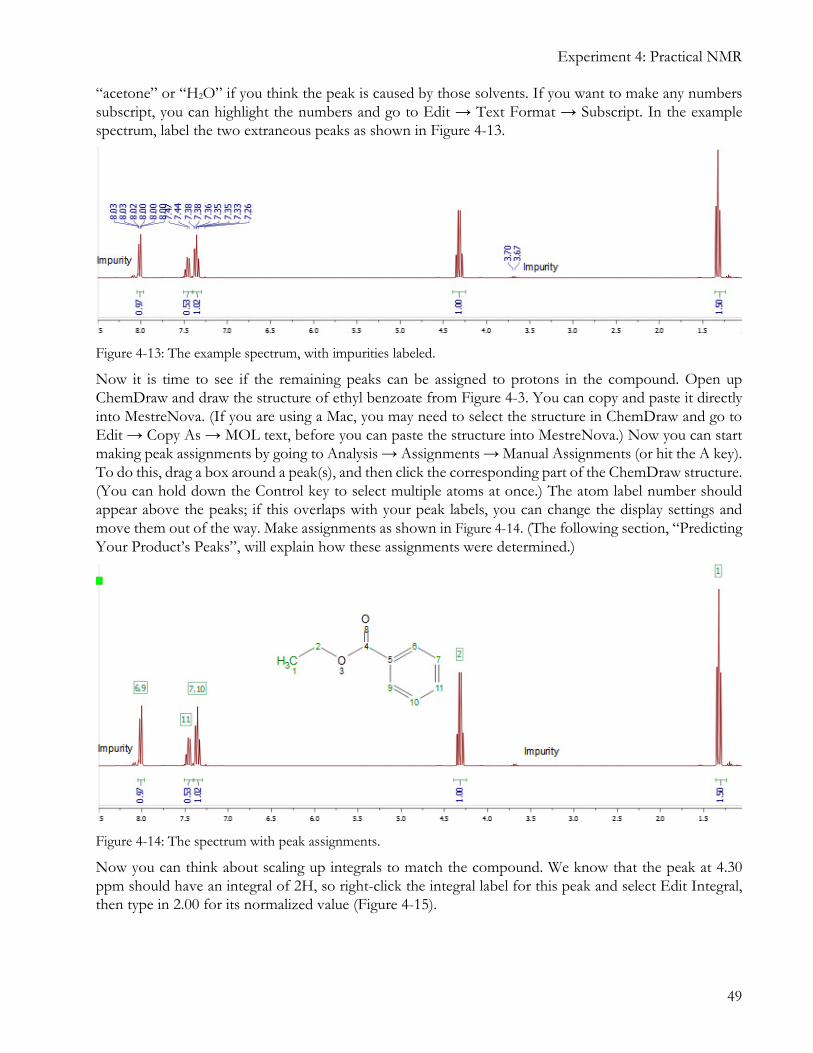
“acetone” or “H2O” if you think the peak is caused by those solvents. If you want to make any numbers subscript, you can highlight the numbers and go to Edit → Text Format → Subscript. In the example spectrum, label the two extraneous peaks as shown in Figure 4-13.
Figure 4-13: The example spectrum, with impurities labeled.
Now it is time to see if the remaining peaks can be assigned to protons in the compound. Open up ChemDraw and draw the structure of ethyl benzoate from Figure 4-3. You can copy and paste it directly into MestreNova. (If you are using a Mac, you may need to select the structure in ChemDraw and go to Edit → Copy As → MOL text, before you can paste the structure into MestreNova.) Now you can start making peak assignments by going to Analysis → Assignments → Manual Assignments (or hit the A key). To do this, drag a box around a peak(s), and then click the corresponding part of the ChemDraw structure. (You can hold down the Control key to select multiple atoms at once.) The atom label number should appear above the peaks; if this overlaps with your peak labels, you can change the display settings and move them out of the way. Make assignments as shown in Figure 4-14. (The following section, “Predicting Your Product’s Peaks”, will explain how these assignments were determined.)
Figure 4-14: The spectrum with peak assignments.
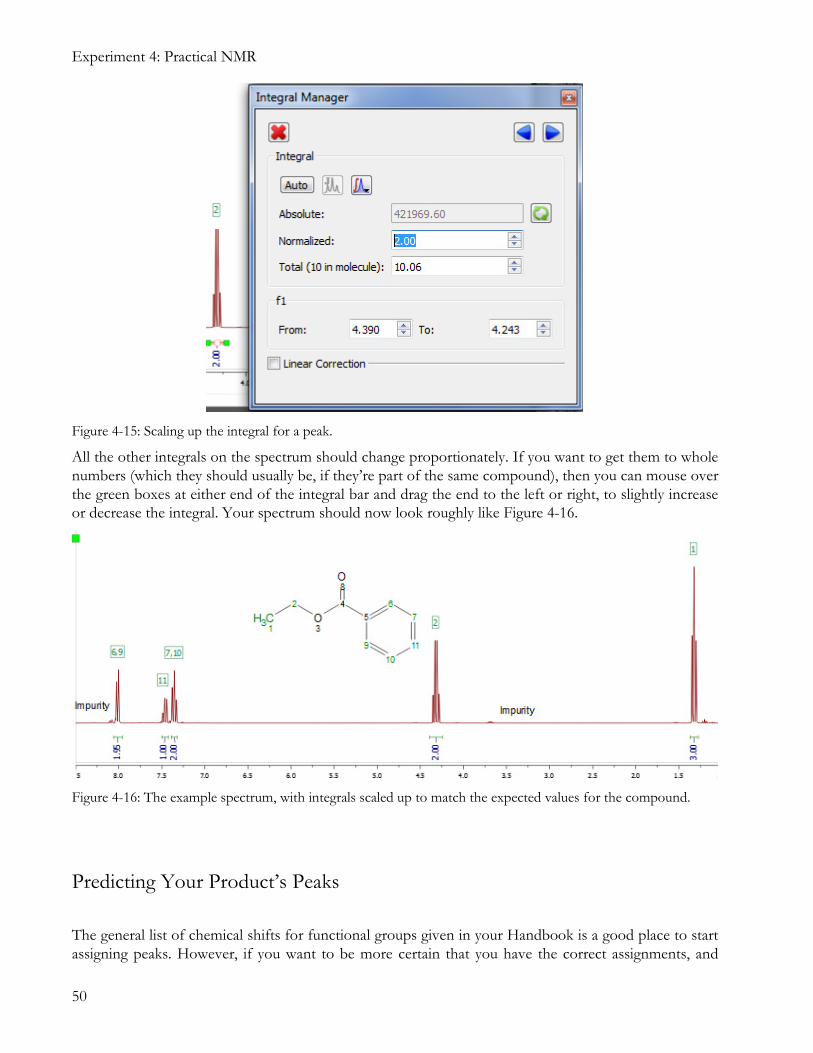
Now you can think about scaling up integrals to match the compound. We know that the peak at 4.30 ppm should have an integral of 2H, so right-click the integral label for this peak and select Edit Integral, then type in 2.00 for its normalized value (Figure 4-15).
Experiment 4: Practical NMR
50
Figure 4-15: Scaling up the integral for a peak.
All the other integrals on the spectrum should change proportionately. If you want to get them to whole numbers (which they should usually be, if they’re part of the same compound), then you can mouse over the green boxes at either end of the integral bar and drag the end to the left or right, to slightly increase or decrease the integral. Your spectrum should now look roughly like Figure 4-16.
Figure 4-16: The example spectrum, with integrals scaled up to match the expected values for the compound.
Predicting Your Product’s Peaks
The general list of chemical shifts for functional groups given in your Handbook is a good place to start assigning peaks. However, if you want to be more certain that you have the correct assignments, and
Experiment 4: Practical NMR
51
especially if your molecule has multiple functional groups of the same type, it helps to get a more precise prediction. There are several methods you can use to do this.
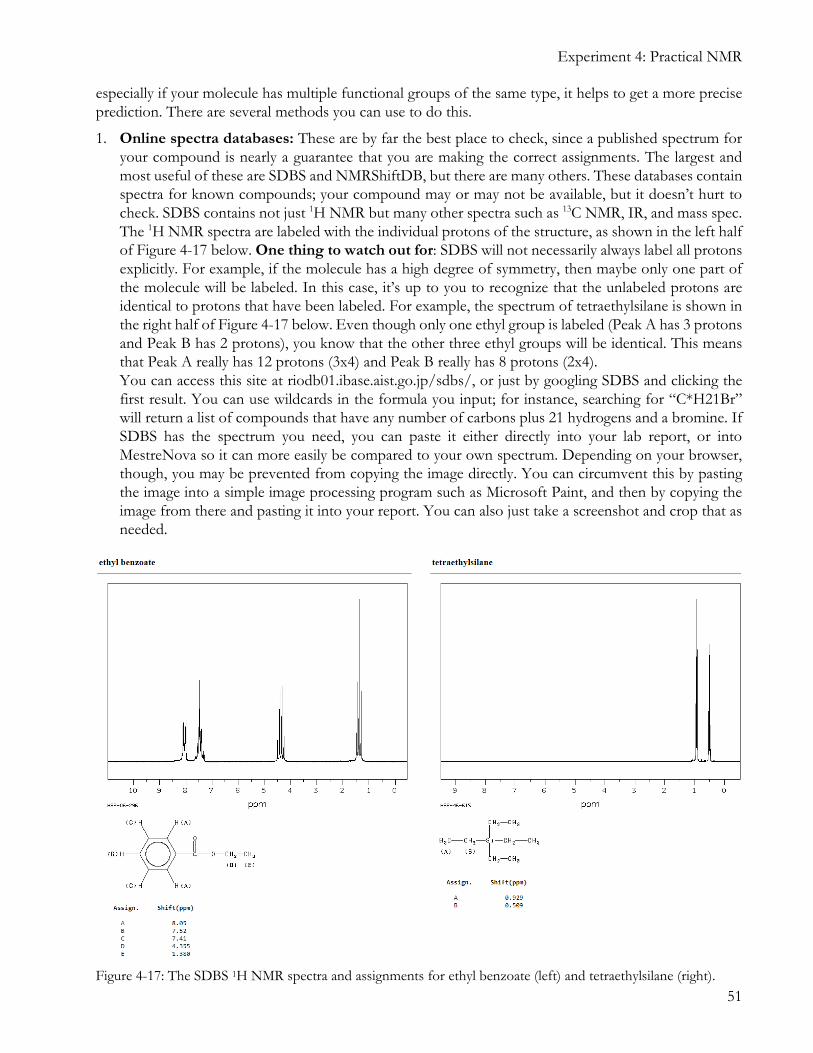
1. Online spectra databases: These are by far the best place to check, since a published spectrum for your compound is nearly a guarantee that you are making the correct assignments. The largest and most useful of these are SDBS and NMRShiftDB, but there are many others. These databases contain spectra for known compounds; your compound may or may not be available, but it doesn’t hurt to check. SDBS contains not just 1H NMR but many other spectra such as 13C NMR, IR, and mass spec. The 1H NMR spectra are labeled with the individual protons of the structure, as shown in the left half of Figure 4-17 below. One thing to watch out for: SDBS will not necessarily always label all protons explicitly. For example, if the molecule has a high degree of symmetry, then maybe only one part of the molecule will be labeled. In this case, it’s up to you to recognize that the unlabeled protons are identical to protons that have been labeled. For example, the spectrum of tetraethylsilane is shown in the right half of Figure 4-17 below. Even though only one ethyl group is labeled (Peak A has 3 protons and Peak B has 2 protons), you know that the other three ethyl groups will be identical. This means that Peak A really has 12 protons (3x4) and Peak B really has 8 protons (2x4). You can access this site at riodb01.ibase.aist.go.jp/sdbs/, or just by googling SDBS and clicking the first result. You can use wildcards in the formula you input; for instance, searching for “C*H21Br” will return a list of compounds that have any number of carbons plus 21 hydrogens and a bromine. If SDBS has the spectrum you need, you can paste it either directly into your lab report, or into MestreNova so it can more easily be compared to your own spectrum. Depending on your browser, though, you may be prevented from copying the image directly. You can circumvent this by pasting the image into a simple image processing program such as Microsoft Paint, and then by copying the image from there and pasting it into your report. You can also just take a screenshot and crop that as needed.
Figure 4-17: The SDBS 1H NMR spectra and assignments for ethyl benzoate (left) and tetraethylsilane (right).
Experiment 4: Practical NMR
52
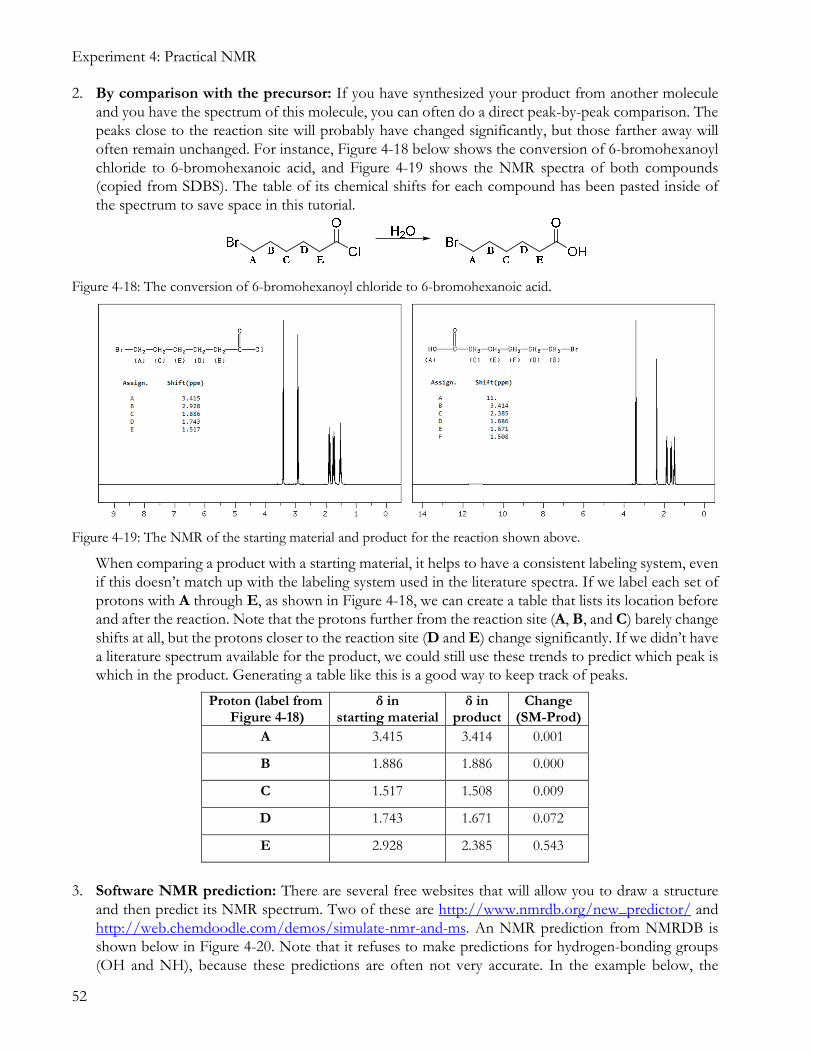
2. By comparison with the precursor: If you have synthesized your product from another molecule and you have the spectrum of this molecule, you can often do a direct peak-by-peak comparison. The peaks close to the reaction site will probably have changed significantly, but those farther away will often remain unchanged. For instance, Figure 4-18 below shows the conversion of 6-bromohexanoyl chloride to 6-bromohexanoic acid, and Figure 4-19 shows the NMR spectra of both compounds (copied from SDBS). The table of its chemical shifts for each compound has been pasted inside of the spectrum to save space in this tutorial.
Figure 4-18: The conversion of 6-bromohexanoyl chloride to 6-bromohexanoic acid.
Figure 4-19: The NMR of the starting material and product for the reaction shown above.
When comparing a product with a starting material, it helps to have a consistent labeling system, even if this doesn’t match up with the labeling system used in the literature spectra. If we label each set of protons with A through E, as shown in Figure 4-18, we can create a table that lists its location before and after the reaction. Note that the protons further from the reaction site (A, B, and C) barely change shifts at all, but the protons closer to the reaction site (D and E) change significantly. If we didn’t have a literature spectrum available for the product, we could still use these trends to predict which peak is which in the product. Generating a table like this is a good way to keep track of peaks.
Proton (label from Figure 4-18)
δ in starting material
δ in product
Change (SM-Prod)
A 3.415 3.414 0.001
B 1.886 1.886 0.000
C 1.517 1.508 0.009
D 1.743 1.671 0.072
E 2.928 2.385 0.543
3. Software NMR prediction: There are several free websites that will allow you to draw a structure
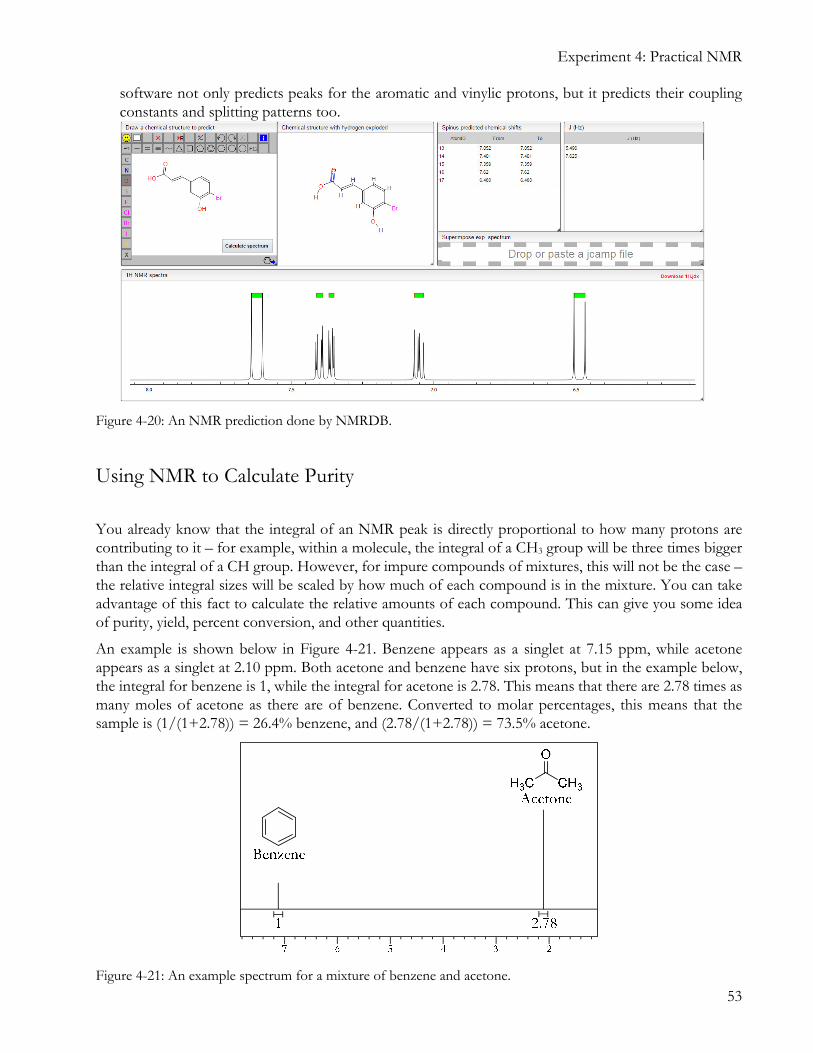
and then predict its NMR spectrum. Two of these are http://www.nmrdb.org/new_predictor/ and http://web.chemdoodle.com/demos/simulate-nmr-and-ms. An NMR prediction from NMRDB is shown below in Figure 4-20. Note that it refuses to make predictions for hydrogen-bonding groups (OH and NH), because these predictions are often not very accurate. In the example below, the
Experiment 4: Practical NMR
53
software not only predicts peaks for the aromatic and vinylic protons, but it predicts their coupling constants and splitting patterns too.
Figure 4-20: An NMR prediction done by NMRDB.
Using NMR to Calculate Purity
You already know that the integral of an NMR peak is directly proportional to how many protons are contributing to it – for example, within a molecule, the integral of a CH3 group will be three times bigger than the integral of a CH group. However, for impure compounds of mixtures, this will not be the case – the relative integral sizes will be scaled by how much of each compound is in the mixture. You can take advantage of this fact to calculate the relative amounts of each compound. This can give you some idea of purity, yield, percent conversion, and other quantities.
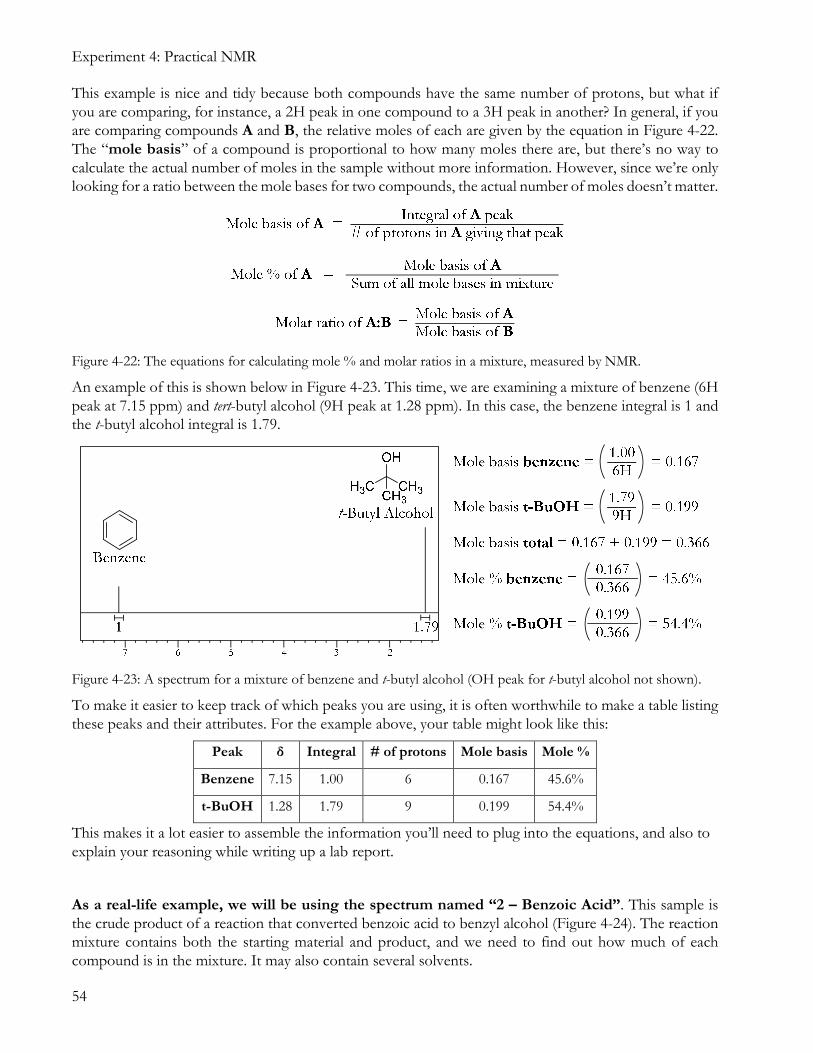
An example is shown below in Figure 4-21. Benzene appears as a singlet at 7.15 ppm, while acetone appears as a singlet at 2.10 ppm. Both acetone and benzene have six protons, but in the example below, the integral for benzene is 1, while the integral for acetone is 2.78. This means that there are 2.78 times as many moles of acetone as there are of benzene. Converted to molar percentages, this means that the sample is (1/(1+2.78)) = 26.4% benzene, and (2.78/(1+2.78)) = 73.5% acetone.
Figure 4-21: An example spectrum for a mixture of benzene and acetone.
Experiment 4: Practical NMR
54
This example is nice and tidy because both compounds have the same number of protons, but what if you are comparing, for instance, a 2H peak in one compound to a 3H peak in another? In general, if you are comparing compounds A and B, the relative moles of each are given by the equation in Figure 4-22. The “mole basis” of a compound is proportional to how many moles there are, but there’s no way to calculate the actual number of moles in the sample without more information. However, since we’re only looking for a ratio between the mole bases for two compounds, the actual number of moles doesn’t matter.
Figure 4-22: The equations for calculating mole % and molar ratios in a mixture, measured by NMR.
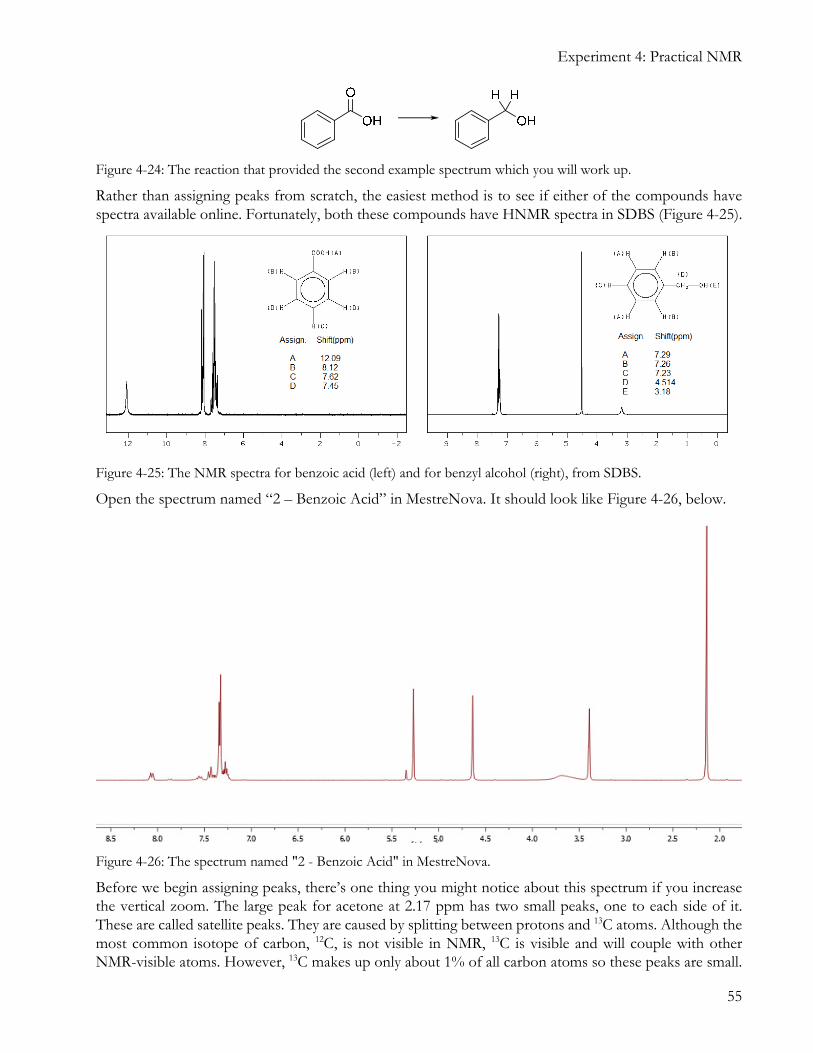
An example of this is shown below in Figure 4-23. This time, we are examining a mixture of benzene (6H peak at 7.15 ppm) and tert-butyl alcohol (9H peak at 1.28 ppm). In this case, the benzene integral is 1 and the t-butyl alcohol integral is 1.79.
Figure 4-23: A spectrum for a mixture of benzene and t-butyl alcohol (OH peak for t-butyl alcohol not shown).
To make it easier to keep track of which peaks you are using, it is often worthwhile to make a table listing these peaks and their attributes. For the example above, your table might look like this:
Peak δ Integral # of protons Mole basis Mole %
Benzene 7.15 1.00 6 0.167 45.6%
t-BuOH 1.28 1.79 9 0.199 54.4%
This makes it a lot easier to assemble the information you’ll need to plug into the equations, and also to explain your reasoning while writing up a lab report.
As a real-life example, we will be using the spectrum named “2 – Benzoic Acid”. This sample is the crude product of a reaction that converted benzoic acid to benzyl alcohol (Figure 4-24). The reaction mixture contains both the starting material and product, and we need to find out how much of each compound is in the mixture. It may also contain several solvents.
Experiment 4: Practical NMR
55
Figure 4-24: The reaction that provided the second example spectrum which you will work up.
Rather than assigning peaks from scratch, the easiest method is to see if either of the compounds have spectra available online. Fortunately, both these compounds have HNMR spectra in SDBS (Figure 4-25).
Figure 4-25: The NMR spectra for benzoic acid (left) and for benzyl alcohol (right), from SDBS.
Open the spectrum named “2 – Benzoic Acid” in MestreNova. It should look like Figure 4-26, below.
Figure 4-26: The spectrum named "2 - Benzoic Acid" in MestreNova.
Before we begin assigning peaks, there’s one thing you might notice about this spectrum if you increase the vertical zoom. The large peak for acetone at 2.17 ppm has two small peaks, one to each side of it. These are called satellite peaks. They are caused by splitting between protons and 13C atoms. Although the most common isotope of carbon, 12C, is not visible in NMR, 13C is visible and will couple with other NMR-visible atoms. However, 13C makes up only about 1% of all carbon atoms so these peaks are small.
Experiment 4: Practical NMR
56
Figure 4-27: Any large peak will have satellite peaks visible to either side of it, due to spitting between 1H and 13C.
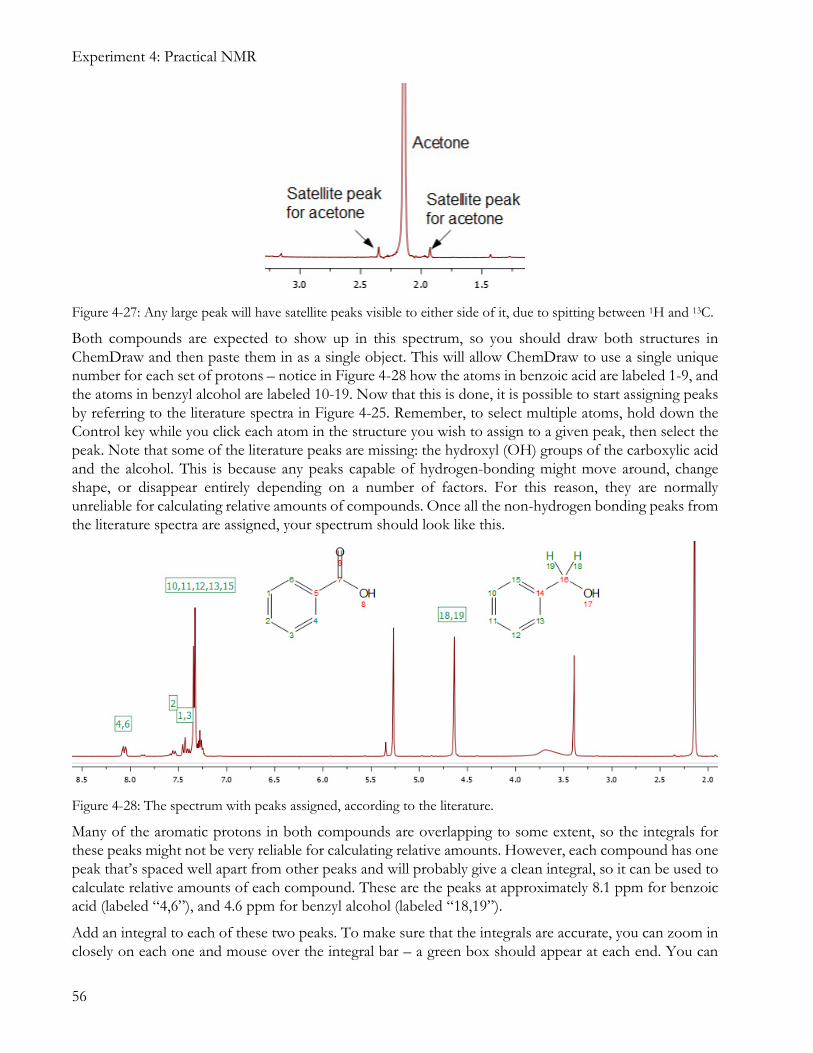
Both compounds are expected to show up in this spectrum, so you should draw both structures in ChemDraw and then paste them in as a single object. This will allow ChemDraw to use a single unique number for each set of protons – notice in Figure 4-28 how the atoms in benzoic acid are labeled 1-9, and the atoms in benzyl alcohol are labeled 10-19. Now that this is done, it is possible to start assigning peaks by referring to the literature spectra in Figure 4-25. Remember, to select multiple atoms, hold down the Control key while you click each atom in the structure you wish to assign to a given peak, then select the peak. Note that some of the literature peaks are missing: the hydroxyl (OH) groups of the carboxylic acid and the alcohol. This is because any peaks capable of hydrogen-bonding might move around, change shape, or disappear entirely depending on a number of factors. For this reason, they are normally unreliable for calculating relative amounts of compounds. Once all the non-hydrogen bonding peaks from the literature spectra are assigned, your spectrum should look like this.
Figure 4-28: The spectrum with peaks assigned, according to the literature.
Many of the aromatic protons in both compounds are overlapping to some extent, so the integrals for these peaks might not be very reliable for calculating relative amounts. However, each compound has one peak that’s spaced well apart from other peaks and will probably give a clean integral, so it can be used to calculate relative amounts of each compound. These are the peaks at approximately 8.1 ppm for benzoic acid (labeled “4,6”), and 4.6 ppm for benzyl alcohol (labeled “18,19”).
Add an integral to each of these two peaks. To make sure that the integrals are accurate, you can zoom in closely on each one and mouse over the integral bar – a green box should appear at each end. You can
Experiment 4: Practical NMR
57
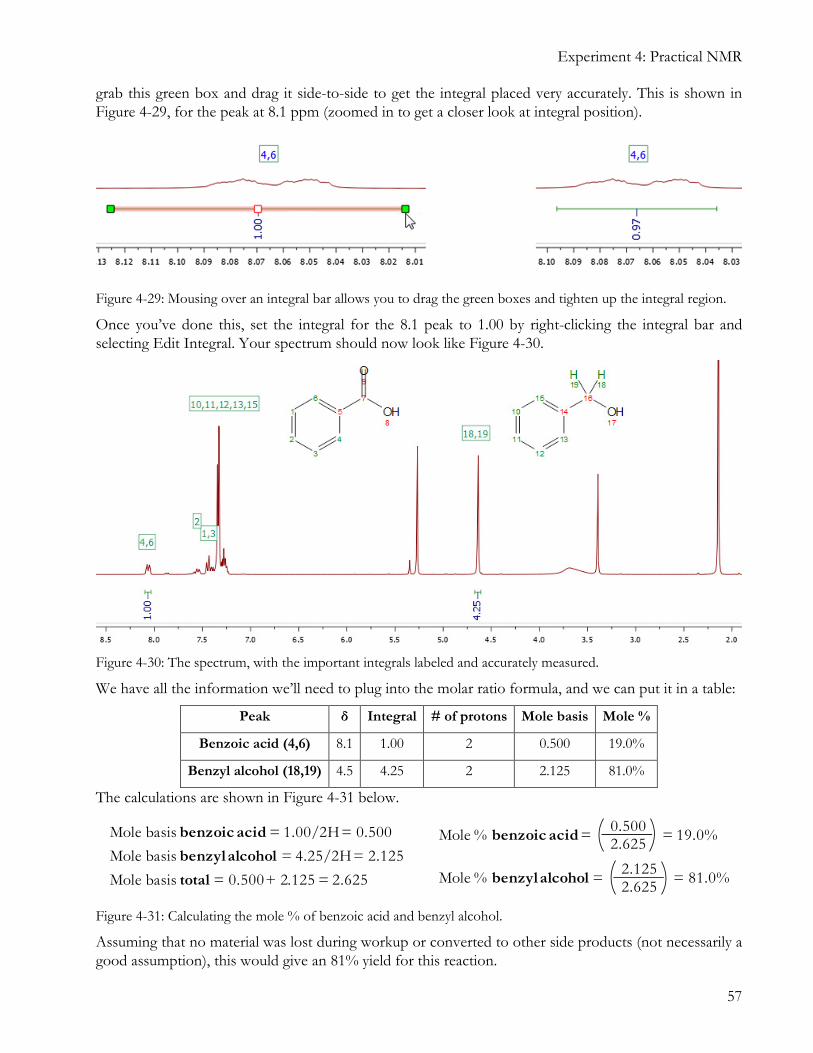
grab this green box and drag it side-to-side to get the integral placed very accurately. This is shown in Figure 4-29, for the peak at 8.1 ppm (zoomed in to get a closer look at integral position).
Figure 4-29: Mousing over an integral bar allows you to drag the green boxes and tighten up the integral region.
Once you’ve done this, set the integral for the 8.1 peak to 1.00 by right-clicking the integral bar and selecting Edit Integral. Your spectrum should now look like Figure 4-30.
Figure 4-30: The spectrum, with the important integrals labeled and accurately measured.
We have all the information we’ll need to plug into the molar ratio formula, and we can put it in a table:
Peak δ Integral # of protons Mole basis Mole %
Benzoic acid (4,6) 8.1 1.00 2 0.500 19.0%
Benzyl alcohol (18,19) 4.5 4.25 2 2.125 81.0%
The calculations are shown in Figure 4-31 below.
Mole % benzoic acid =0.5002.625
= 19.0%
Mole % benzyl alcohol =2.1252.625
= 81.0%
Mole basis benzoic acid = 1.00/2H = 0.500
Mole basis benzyl alcohol = 4.25/2H = 2.125
Mole basis total = 0.500 + 2.125 = 2.625
Figure 4-31: Calculating the mole % of benzoic acid and benzyl alcohol.
Assuming that no material was lost during workup or converted to other side products (not necessarily a good assumption), this would give an 81% yield for this reaction.
Experiment 4: Practical NMR
58
NMR Spectra Checklist for Lab Reports
In future experiments, whenever you collect an NMR spectrum you should complete the following steps.
1. Within a day or two of submitting your sample, make sure to check whether you received a
spectrum and whether it looks acceptable. If you don’t receive your spectrum within a couple of days, you may need to download it from the server yourself, or come in to resubmit your sample. Instructions are posted at www.orgchemboulder.com/Labs/Software, under “What If You Don't Get Your Spectra?”
2. Draw your structure(s) in ChemDraw and paste them into the spectrum. This might be just one structure, for example the product of a reaction, or it might be two or more structures, especially if you’re doing an experiment that involves separating two compounds or if you did a reaction with multiple products.
3. For each structure you drew, check to see if there is a literature spectrum available, either in SDBS or some other database, or on the course website. (The experiment manual will usually tell you, in this case). It might be listed under a different name from the name given in the experiment manual, so in this case you might have to search by formula, or look up alternative names for your compound. Once you find a literature spectrum, paste at least the structure and peak assignments into your lab report. You do not have to paste the actual spectrum but you can if you want to.
4. Add integrals, assignments, and peak-picking labels to each peak that is part of any of the structures you drew. Sometimes peaks might be overlapping and you won’t be able to integrate or assign them individually, but you can still integrate/assign them as a group. To get your integral regions accurate, you might have to zoom in and tighten up the integral bars so they line up with the edges of the peaks. You may or may not see hydrogen-bonding peaks (OH, NH) show up in the correct locations, have the correct shape, or be visible at all, so label them if you can find them, but don’t worry if you can’t.
5. Choose one of the compounds that you drew (usually the major product/biggest component of your mixture) and scale up your integrals to match its proton counts. For instance, if your product has a 1H peak somewhere, you can set this peak to have an integral of 1.
6. Identify any solvent peaks present. Generally, you won’t have to integrate these (unless you are doing a lab where the quantity of solvent is important), but add a text label to identify the solvent. This should usually be a solvent that was used as part of the lab at some point. If the solvent peaks are large you might be able to see their satellite peaks too. If a molecule has multiple peaks associated with it, you need to make sure every peak in that listing is present (except for possibly the hydrogen-bonding peaks).
7. If there are still unidentified peaks, label them as “Impurity”. 8. If you are trying to calculate the ratio of two compounds (especially in an experiment that involves
separating two compounds), you can use the equation listed in the section titled “Using NMR to Calculate Purity”. Use a table to keep track of what information you are using for your calculation.
9. Attach the spectrum as a full-page printout to your lab report. Do not embed it into the lab report directly – this is usually too small for your TA to make out any details.
Experiment 4: Practical NMR
59
Practical NMR Exercise
For this lab, you will turn in a typed report containing all of the information requested below. The report is due one week after you perform the lab (or two lab periods in the summer).
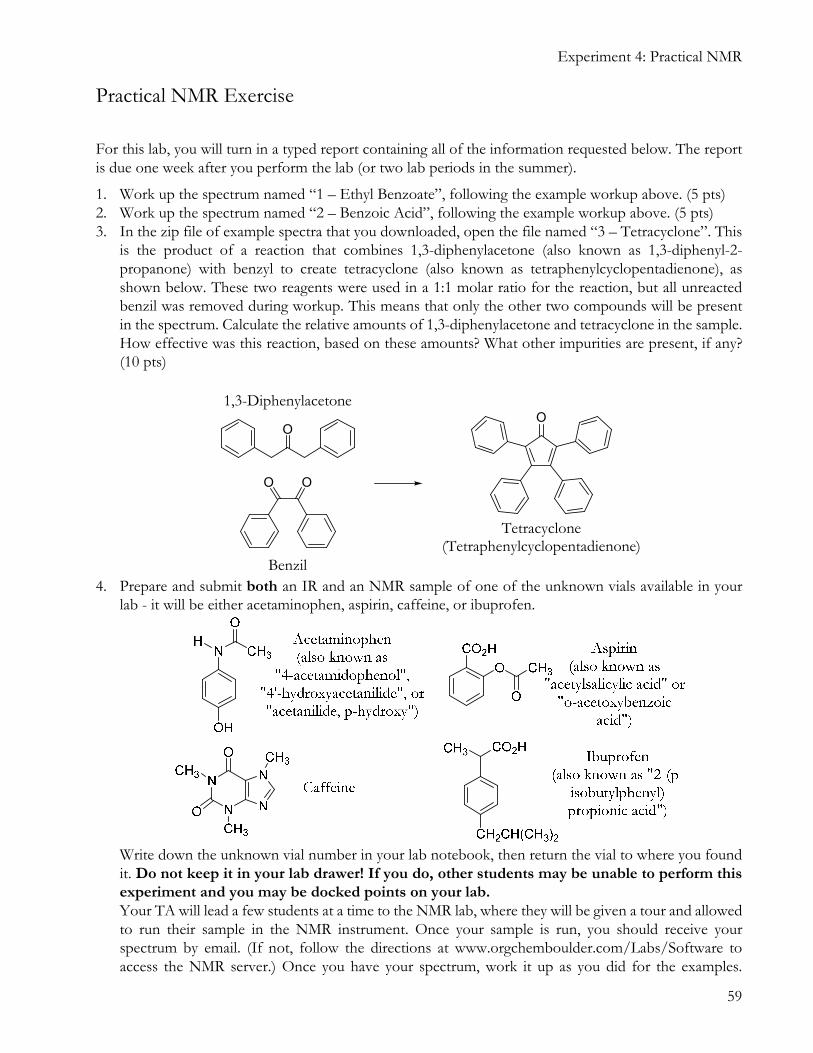
1. Work up the spectrum named “1 – Ethyl Benzoate”, following the example workup above. (5 pts) 2. Work up the spectrum named “2 – Benzoic Acid”, following the example workup above. (5 pts) 3. In the zip file of example spectra that you downloaded, open the file named “3 – Tetracyclone”. This
is the product of a reaction that combines 1,3-diphenylacetone (also known as 1,3-diphenyl-2-propanone) with benzyl to create tetracyclone (also known as tetraphenylcyclopentadienone), as shown below. These two reagents were used in a 1:1 molar ratio for the reaction, but all unreacted benzil was removed during workup. This means that only the other two compounds will be present in the spectrum. Calculate the relative amounts of 1,3-diphenylacetone and tetracyclone in the sample. How effective was this reaction, based on these amounts? What other impurities are present, if any? (10 pts)
4. Prepare and submit both an IR and an NMR sample of one of the unknown vials available in your
lab - it will be either acetaminophen, aspirin, caffeine, or ibuprofen.
Write down the unknown vial number in your lab notebook, then return the vial to where you found it. Do not keep it in your lab drawer! If you do, other students may be unable to perform this
experiment and you may be docked points on your lab.
Your TA will lead a few students at a time to the NMR lab, where they will be given a tour and allowed to run their sample in the NMR instrument. Once your sample is run, you should receive your spectrum by email. (If not, follow the directions at www.orgchemboulder.com/Labs/Software to access the NMR server.) Once you have your spectrum, work it up as you did for the examples.
O
OO
1,3-Diphenylacetone
Benzil
O
Tetracyclone(Tetraphenylcyclopentadienone)
Experiment 4: Practical NMR
60
Compare your spectrum to the SDBS spectra (both for IR and NMR) to determine which compound you have, and if possible, determine what impurities are mixed with it. Assign as many peaks as possible in both spectra. (10 pts)
5. In SDBS or another spectral database, look up the 1H NMR spectrum for any compound with at least 15 hydrogens and 2 heteroatoms. Each person in your lab must choose their own unique compound. Once you find a satisfactory compound with a 1H NMR spectrum available, copy the spectrum into your lab report. Using an NMR prediction software such as the ones listed above under “Predicting Your Product’s Peaks”, predict the NMR structure for this compound and copy it into your report. You may have to save the spectrum as an image first, then insert the image into your report. Make a table listing the location of each peak, both in its literature spectrum and in the predicted spectrum, as well as the difference between these numbers. How similar is the prediction to the literature spectra you found? Which protons have the greatest discrepancy between the predicted and literature spectra? (10 pts)