manitoba immunization monitoring system (mims) · pdf filemanitoba immunization monitoring...
TRANSCRIPT
ManitobaImmunization
Monitoring System(MIMS)
Annual Report 2009
Manitoba Immunization Report
Public Health Planning BranchPublic Health and Primary Health Care
Manitoba Health

Table of ContentsAcknowledgments ii
1. Overview 1
2. Glossary 2
3. Description of Criteria for MIMS Annual Reports 3
3.1 Coverage Rates 3
3.2 Vaccine Doses Reports 6
4. Childhood Immunization Coverage Reports 7
For Manitoba and each region of residence
Report 1: Complete for Age from Birth to 2009 by Immunogen and Region 7of Residence
Report 2: Complete for Age from Birth to 2009 by Immunogen and Age 19
Report 3: Complete for Age from Birth to 2009 for all Immunogens by Region 29of Residence; for all residents, continuous residents and non-continuous residents
Report 4: Complete for Age from Birth for all Immunogens by Region of 33Residence 2005-2009For all residents, continuous residents and non-continuous residents.
Report 5: Childhood Vaccine Doses by Provider Type and Location, 2009 37
5. Influenza and Pneumococcal Immunization Reports 43
For Manitoba and each region of residence
Report 6: Influenza & Pneumococcal Immunization Coverage Report by 43Client Age and Region of Residence, 2009
Report 7: Influenza Vaccine Doses by Reason for Immunization, Provider Type 47and Location, 2009
Report 8: Pneumococcal Vaccine Doses by Reason for Immunization, Provider 53Type and Location, 2009
Appendix 1: Manitoba’s Routine Immunization Schedule for Infants and Children 59
Appendix 2: Map of Manitoba’s Regional Health Authorities 60
Manitoba Immunization Monitoring System Annual Report 2009 i
AcknowledgmentsThe 2009 MIMS Annual Report is a result of the ongoing efforts of a dedicated team ofindividuals throughout the province of Manitoba including public health nurses,immunization coordinators, physicians and other primary health care providers. Theircombined efforts and expertise in the area of immunization provide the data that isnecessary to produce this valuable report. We also gratefully acknowledge the work of theMIMS data entry staff throughout the province.
In addition, thanks are extended to the Health Information Branch (HIM) and theInformation Systems Branch staff at Manitoba Health for their contribution to theproduction of the 2009 MIMS Report.
Manitoba Immunization Monitoring System Annual Report 2009ii

1. OverviewImmunization is one of the most effective and cost-efficient health interventions of moderntimes. In the last 50 years, immunization has probably saved more lives in Canada than anyother health intervention (Canadian Immunization Guide, 7th Edition, 2006).Immunization registries play a key role in ensuring that individuals receive allrecommended immunizations and avoid those that are unnecessary. These registries alsopermit efficient evaluation of the immunization status of specific individuals, groups or thepopulation overall.
Manitoba’s immunization registry, the Manitoba Immunization Monitoring System(MIMS), became functional province-wide in 1988, making it the first such registry inCanada. The aim of the MIMS annual report is to provide an overall picture of childhood,influenza and pneumococcal immunization that can be used to inform priority setting,policy development, program planning and evaluation. The 2009 MIMS Annual Report isthe eighth such report produced using a standardized methodology to allow year-to-yearreview of progress against provincial and national immunization rates.
MIMS is managed by the Public Health Planning Branch, Public Health and PrimaryHealth Care, Manitoba Health (MH). Initially, MIMS only recorded immunizationsprovided to children (born after 1980). In 2000, adult immunizations were added to theregistry. Immunization events are captured in MIMS in two ways: publicly-fundedimmunizations administered by physicians are entered into the system via the physicianbilling system; all other immunizations, such as those provided by public health nurses, arerecorded by data entry staff in the regions. The goal is to have all immunizationsadministered in Manitoba recorded in MIMS.
MIMS captures information related to an immunization event, including type of vaccineadministered, date of administration and service provider. This data is the basis of a varietyof immunization reports, including this annual report. MIMS also provides a centralized“reminder” function, automatically generating letters on a monthly basis to parents ofchildren aged 15 months, 20 months and 5 ½ years who may be missing recommendedimmunizations (as per Manitoba’s Routine Immunization Schedule for Infants andChildren, Appendix 1) and encouraging them to ensure their children’s immunizations areup-to-date. Over 155 sites have MIMS access throughout the province. Usually associatedwith public health offices, these sites provide information on the immunization status ofclients to health care providers and allow data input following the delivery of animmunziation.
Your comments and suggestions to make future reports more informative are mostwelcome. To provide feedback please contact:
Public Health PlanningPublic Health and Primary Health CareManitoba Health4th Floor-300 Carlton StreetWinnipeg, MB R3B 3M9Tel: 204-788-6702Fax: 204-948-2204Email: [email protected]
Manitoba Immunization Monitoring System Annual Report 2009 1
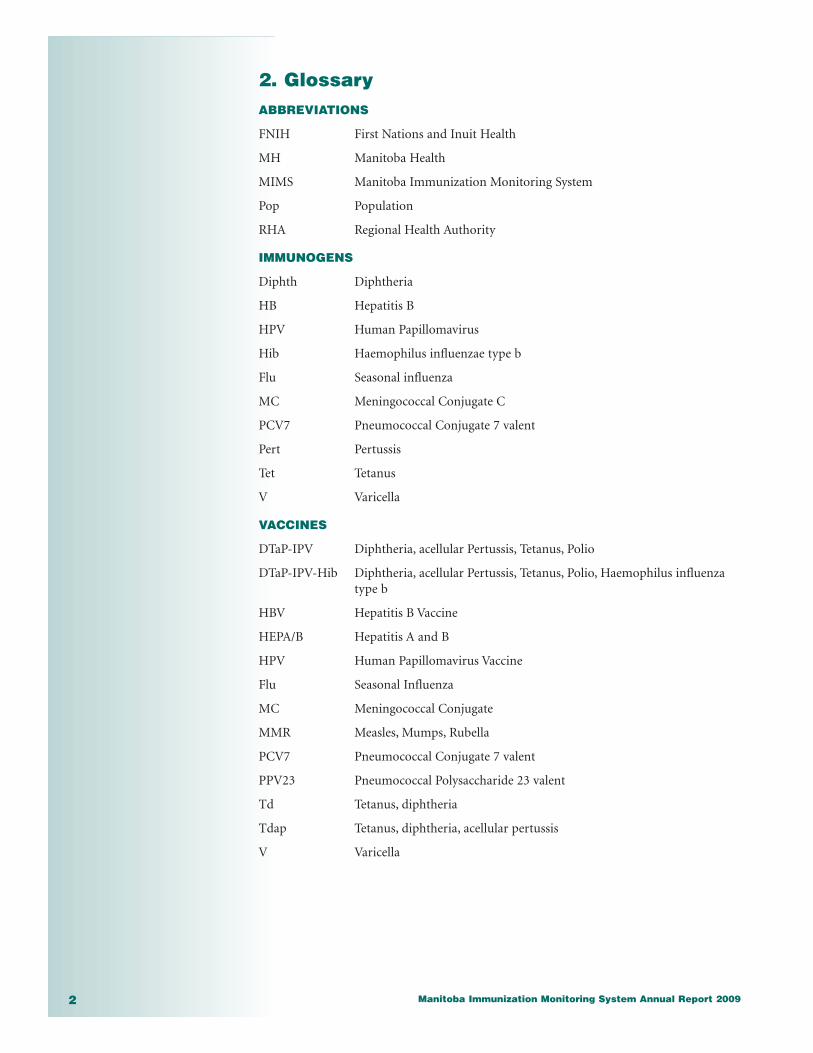
2. GlossaryABBREVIATIONS
FNIH First Nations and Inuit Health
MH Manitoba Health
MIMS Manitoba Immunization Monitoring System
Pop Population
RHA Regional Health Authority
IMMUNOGENS
Diphth Diphtheria
HB Hepatitis B
HPV Human Papillomavirus
Hib Haemophilus influenzae type b
Flu Seasonal influenza
MC Meningococcal Conjugate C
PCV7 Pneumococcal Conjugate 7 valent
Pert Pertussis
Tet Tetanus
V Varicella
VACCINES
DTaP-IPV Diphtheria, acellular Pertussis, Tetanus, Polio
DTaP-IPV-Hib Diphtheria, acellular Pertussis, Tetanus, Polio, Haemophilus influenza type b
HBV Hepatitis B Vaccine
HEPA/B Hepatitis A and B
HPV Human Papillomavirus Vaccine
Flu Seasonal Influenza
MC Meningococcal Conjugate
MMR Measles, Mumps, Rubella
PCV7 Pneumococcal Conjugate 7 valent
PPV23 Pneumococcal Polysaccharide 23 valent
Td Tetanus, diphtheria
Tdap Tetanus, diphtheria, acellular pertussis
V Varicella
Manitoba Immunization Monitoring System Annual Report 20092
3. Description of Criteria for MIMS AnnualReport
The annual report includes eight separate reports that fall into two main groupings:Childhood Immunization Reports and Influenza and Pneumococcal ImmunizationReports. These reports provide information on immunization coverage by age or by regionof residence (coverage reports), and a description of who provided vaccine doses by regionof practice (vaccine doses reports).
A consistent format is followed for each report. Data is provided for Manitoba overall andthen for each of the 11 regional health authorities (Appendix 2). The data is grouped byFirst Nations status, Non-First Nations status, and a total overall.
First Nations Status is based on voluntary self-declaration at the time of registration withManitoba Health. First Nations and Inuit Health (FNIH) estimate that this representsapproximately 65 per cent of the status First Nation population. First Nations and InuitHealth is responsible for providing immunizations to First Nations clients living on reserve(approximately 60 per cent of the status First Nation population). Audits indicate that gapsexist between immunizations administered to FNIH clients as documented on paperrecords versus those data entered into MIMS. Actual coverage rates for FNIH clients are,therefore, likely higher than those generated using MIMS data.
3.1 Coverage Reports
3.11 Childhood Immunization Coverage Reports
The data represented in these reports represents the percentage rates of children who arecompletely immunized from birth with a specific number of doses for a particularimmunogen (see definition below) or all the recommended immunogens for a particularage. The accepted terminology to describe this is “Complete for age from birth.” Coveragereports do not include children who were not immunized as per the routine recommendedimmunization schedule from birth.
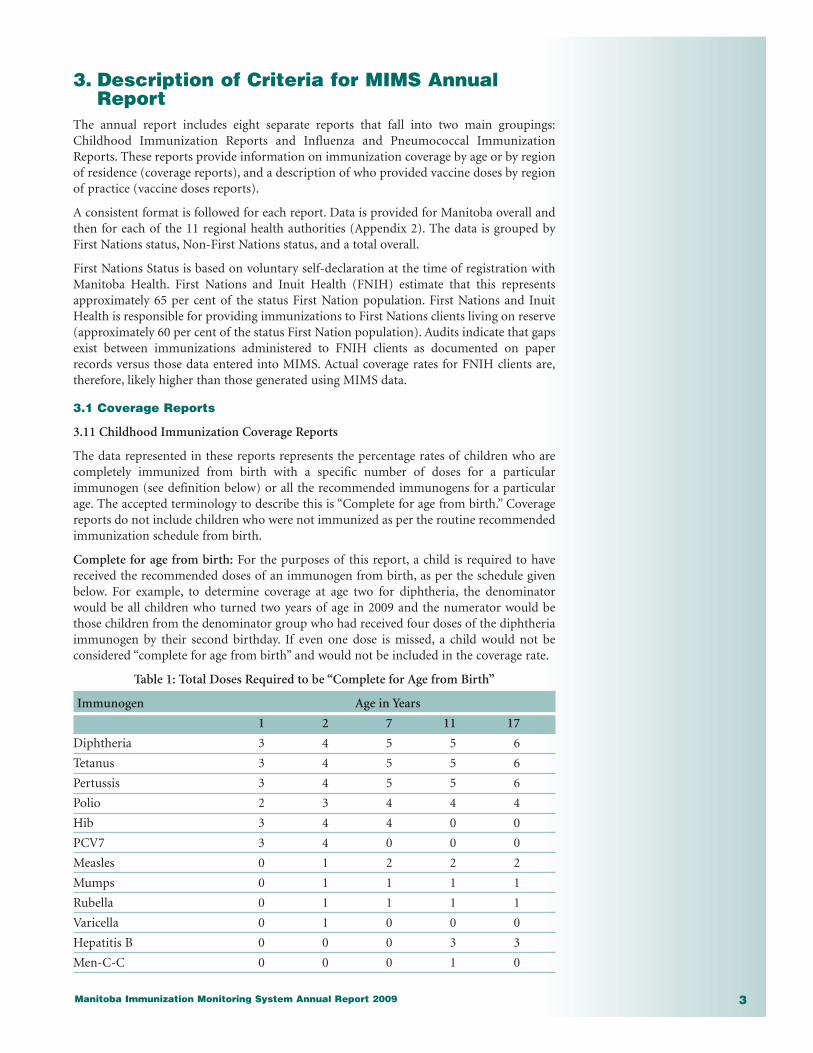
Complete for age from birth: For the purposes of this report, a child is required to havereceived the recommended doses of an immunogen from birth, as per the schedule givenbelow. For example, to determine coverage at age two for diphtheria, the denominatorwould be all children who turned two years of age in 2009 and the numerator would bethose children from the denominator group who had received four doses of the diphtheriaimmunogen by their second birthday. If even one dose is missed, a child would not beconsidered “complete for age from birth” and would not be included in the coverage rate.
Table 1: Total Doses Required to be “Complete for Age from Birth”
Immunogen Age in Years
1 2 7 11 17
Diphtheria 3 4 5 5 6
Tetanus 3 4 5 5 6
Pertussis 3 4 5 5 6
Polio 2 3 4 4 4
Hib 3 4 4 0 0
PCV7 3 4 0 0 0
Measles 0 1 2 2 2
Mumps 0 1 1 1 1
Rubella 0 1 1 1 1
Varicella 0 1 0 0 0
Hepatitis B 0 0 0 3 3
Men-C-C 0 0 0 1 0
Manitoba Immunization Monitoring System Annual Report 2009 3
Doses required: The number of doses of immunogens required to be complete for age frombirth is as per Manitoba’s Routine Immunization Schedule for Infants and Children(Appendix 1).
Coverage by Immunogen: The coverage reports are listed byimmunogen rather than by vaccine, as vaccines may include morethan one immunogen and the immunogen composition ofvaccines can change over time. The term immunogen, rather thanantigen, is used in this report to be consistent with the CanadianImmunization Guide, 7th Edition. All doses of each immunogenwere included in the coverage report irrespective of the vaccinegiven. For example, hepatitis B reflects all doses of immunogenadministered to individuals including those from hepatitis A/Bcombination vaccine (Twinrix) and hepatitis B vaccine.
Age in years reflects a client’s age on date of birth within the calendar year 2009; forexample, if a child turned three years of age on May 1, 2009 the child is considered to bethree years old for the purpose of this report.
Continuous residents in Manitoba is determined based on an individual being continuouslyregistered with Manitoba Health for insured benefits from birth until December 31, 2009.
Non-continuous residents would include clients who, for example, may have been born inManitoba, moved out for a period of time and then returned; or clients who were not bornin Manitoba and moved to the province.
All residents include continuous and non-continuous residents, as defined above.
Childhood Immunization coverage rates (Report 1, 2, 3 and 4) were calculated as follows:
Rate/100 = Number of individuals in age group “X” from the MIMS dataset
x 100Number of individuals in age group “X” in the population dataset
The numerator was determined as follows:
n The MIMS data used was an April 2010 “snapshot” (to permit immunizationsoccurring at the end of 2009 to be entered) of individuals complete for age from birth,from the MIMS database that was provided by MH’s Information Systems Branch.Multiple years of data are required to determine whether children are complete for agefrom birth. Immunizations where the service date is unknown were excluded. The datawere summarized by individual and included: age, First Nations status and a count ofimmunogen doses.
n The MIMS data was linked to the MH Registry to determineclient region of residence. Each individual was assigned toonly one region of residence (Appendix 2) during thereporting period (2009), irrespective of whether or not theylived in multiple health regions since birth. The region usedwas the health authority in which the individual wasresident as of April following the report year (i.e., April2010) to coincide with the MIMS April snapshot of dosesadministered as of December 31, 2009.
The denominator was determined as follows:
n The number of people within a specific health region was determined as of June 1 duringthe report year (June 1, 2009). This population data comes from the MH PopulationReport and is based on records of residents registered with MH as of that date.
Notes:
n Manitoba Health introduced a voluntary publicly funded school based HPVimmunization program for Grade 6 females starting in the school year 2008-2009. The
Manitoba Immunization Monitoring System Annual Report 20094
Immunogen: asubstance capableof inducing a specific immuneresponse
Region of residence: theregional healthauthority withinwhich the individual resides
program is delivered by Public Health Nurses. Report 5 of the MIMS Annual Report –Childhood Vaccine Doses by Provider Type and Provider Location captures the totalnumber of vaccine doses administered to this cohort since the inception of theprogram in 2008.
n On January 1, 2009 Manitoba Health introduced the Men-C Infant Program for infantsof at least 12 months of age born on or after January 1, 2008 resulting in an increase incoverage for Age 1
n Immunogens included in one vaccine may require a different number of doses to beconsidered complete for age from birth. This may result in different coverage rates foreach immunogen included in the same vaccine. For example, the measles, mumps andrubella vaccine (recommended at 12 months and again at four to six years of age)requires two doses of measles, but only one dose of mumps and rubella for a child tobe considered “complete for age from birth.”
n Hib doses are required at ages one, two and seven years. Hib is included in theimmunogen coverage reports for children at age 11 and 17 years for information onlyas there is no provincial recommendation for Hib vaccine after children reach age 60months. Hib is not included in “complete for age from birth” requirements for childrenbeyond the age of seven.
n Again there was an increase in Hib coverage rate in 2009 for 17 year olds. This cohortreached complete for age in 2008 since the introduction of Hib in 1992. The increasein coverage for 2009 is a continuum of this cohort.
n One dose of varicella vaccine at the age of two years is required for a child to be“Complete for Age from Birth for all Immunogens” (Reports 3 and 4). However, it maynot be clinically recommended for a child to receive varicella immunization by this ageif he/she has a previous history of varicella illness. This may result in slightly lower ratesfor “Complete for Age from Birth for all Immunogens.”
As a result of the differences in when individuals in the numerator and denominator areassigned to a regional health authority, coverage rates may be greater than 100 per cent ifthe number of individuals vaccinated against a particular disease is greater than the numberof individuals assigned to that regional health authority.
3.12 Influenza and Pneumococcal Coverage Report
Influenza and pneumococcal immunization coverage rates (Report 6) were calculated asfollows:
Rate/100 = Number of immunized individuals in age group “X” from the MIMS dataset
x 100Number of individuals in age group “X” in the population dataset
The numerator was determined as follows:
n The MIMS data used was an April 2010 “snapshot” (to permit immunizationsoccurring at the end of 2009 to be entered) of individuals who have received influenzaor pneumococcal immunizations, as per the MIMS database. The data weresummarized by individual and include age, First Nations status and a count ofindividuals receiving a dose of influenza or pneumococcal vaccine.
n The age of the individual was determined as of his/her birthday within the calendaryear. Age data were converted to age groups: birth to two years, three to 17 years, 18 to64 years, <65 high risk, <65 all and 65+ years. The “<65 high risk” population estimatewas based on a calculation of 11 per cent of the total under-65 population. The sameestimate was used for both influenza and pneumococcal high-risk groups, although thetarget population for immunization is not identical. The “<65 high risk” numeratordata are those doses identified via public health data entry in MIMS, as doses recordedvia physician billing do not capture this information. These same doses are alsoincluded in the “<65 all” category and coverage calculations.
Manitoba Immunization Monitoring System Annual Report 2009 5
n For influenza, only immunizations administered during 2009 are used in this report.
n For pneumococcal immunizations, the data are analyzed twice: the first report includesonly those doses administered during 2009; the second, all individuals who have everreceived a pneumococcal immunization (presented as a cumulative coverage rate). Thecumulative data is important as the eligible population is recommended to have onedose.
n The MIMS data was linked to the MH Registry to determineclient region of residence. Each individual was assigned to onlyone region of residence (Appendix 2) during the reportingperiod (2009), regardless of whether or not they lived in morethan one region during that time. The region used was that inwhich the individual was resident as of April following thereport year (April 2010) to coincide with the MIMS Aprilsnapshot of doses administered as of December 31, 2009.
The denominator was determined as follows:
n The number of people within a specific health region is determined as of June 1 duringthe report year (June 1, 2009). This population data comes from the MH PopulationReport and is based on records of residents registered with MH as of that date.
3.2 Vaccine Doses Report
These reports reflect doses administered by providers from January 1 to December 31, 2009,based on the region in which they practice (Appendix 2). The same data cannot be used tocalculate immunization coverage rates as providers do not have a particular populationdenominator to which they are assigned.
These data reflect doses administered by four different provider types:
n Public health nurse (off reserve)
n Physician
n First Nation/Tribal Council (all providers on reserve, including public health nurses)
n Other (all other providers, including facilities, primary care providers, pharmacies andother unknown providers)
3.21 Childhood Vaccine Doses Report
Vaccine doses are reported by provider type for all vaccines recommended in Manitoba’sRoutine Immunization Schedule for Infants and Children (Appendix 1). Td doses are alsoreported to capture individuals ≥ seven years of age who received tetanus and diphtheriaalone. HPV doses are also reported to capture Grade 6 females who received the HPVvaccine since the inception of the voluntary school based immunization program in 2008.
3.22 Influenza Vaccine Doses Report
Influenza doses are reported by provider type and reason for immunization. Reason forimmunization is based on the MH eligibility criteria for influenza vaccine. These criteriainclude: health care worker, high risk, household contact, no risk identified (client paid) andoutbreak immunization. Immunizations captured via the physician billing system do notinclude the reason for immunization and therefore these vaccine doses are reported as “noreason given.”
3.23 Pneumococcal Vaccine Doses Report
Pneumococcal doses are reported by provider type and reason for immunization. Reason forimmunization is based on the MH eligibility criteria for pneumococcal (PPV23) vaccine. Thesecriteria include: high risk, no risk identified (client paid) and outbreak immunization.Immunizations captured via the physician billing system do not include the reason forimmunization and therefore these vaccine doses are reported as “no reason given.”
Manitoba Immunization Monitoring System Annual Report 20096
Provider location: theregion (RHA) inwhich a provider’spractice is located
Manitoba Immunization Monitoring System Annual Report 2009 7
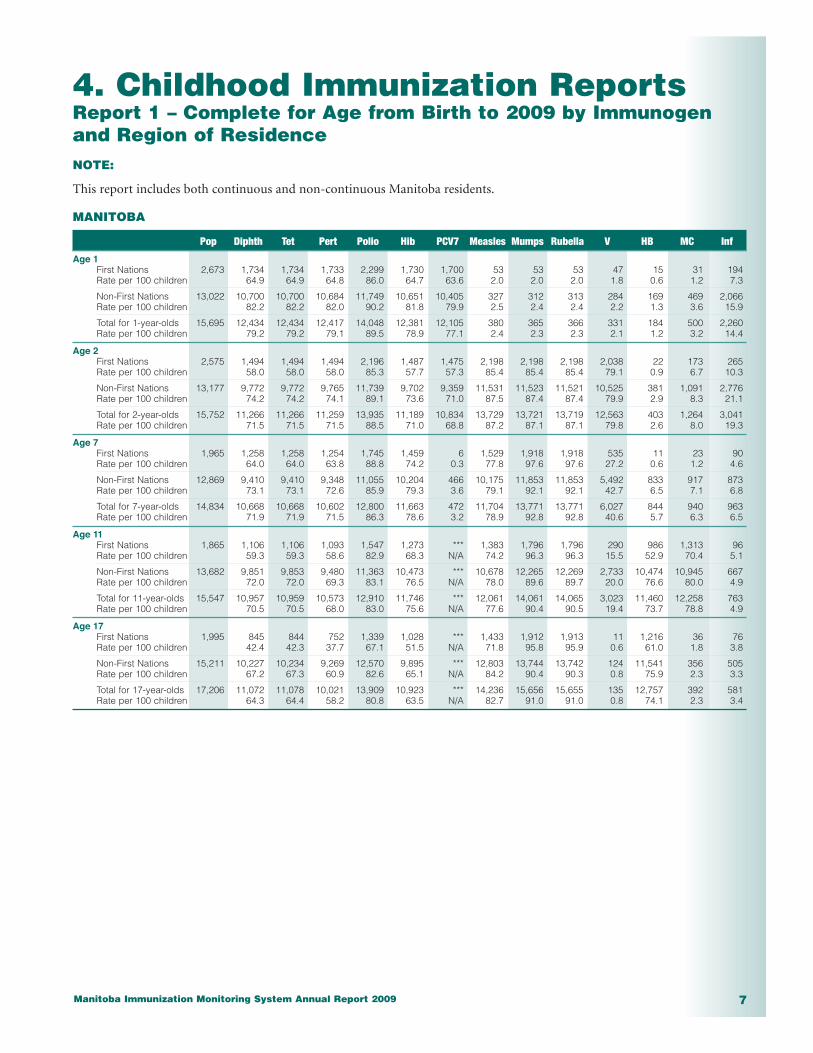
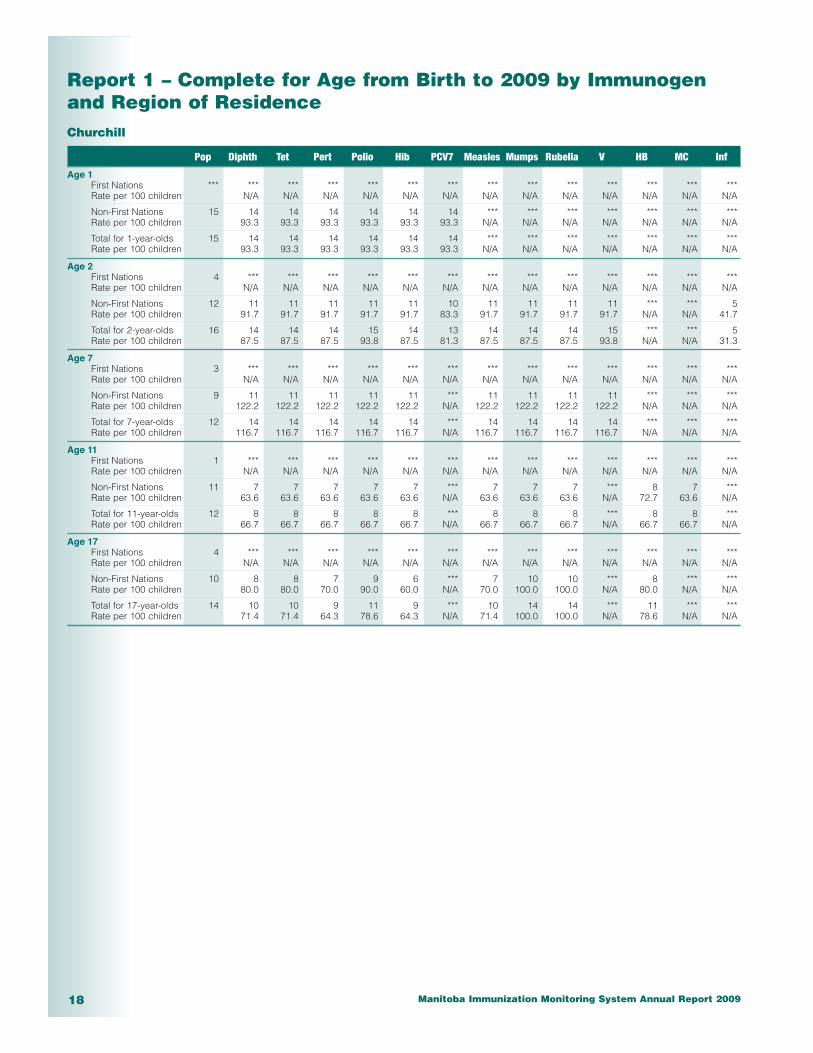
4. Childhood Immunization ReportsReport 1 – Complete for Age from Birth to 2009 by Immunogenand Region of ResidenceNOTE:
This report includes both continuous and non-continuous Manitoba residents.
MANITOBA
Pop Diphth Tet Pert Polio Hib PCV7 Measles Mumps Rubella V HB MC Inf
Age 1First Nations 2,673 1,734 1,734 1,733 2,299 1,730 1,700 53 53 53 47 15 31 194Rate per 100 children 64.9 64.9 64.8 86.0 64.7 63.6 2.0 2.0 2.0 1.8 0.6 1.2 7.3
Non-First Nations 13,022 10,700 10,700 10,684 11,749 10,651 10,405 327 312 313 284 169 469 2,066Rate per 100 children 82.2 82.2 82.0 90.2 81.8 79.9 2.5 2.4 2.4 2.2 1.3 3.6 15.9
Total for 1-year-olds 15,695 12,434 12,434 12,417 14,048 12,381 12,105 380 365 366 331 184 500 2,260Rate per 100 children 79.2 79.2 79.1 89.5 78.9 77.1 2.4 2.3 2.3 2.1 1.2 3.2 14.4
Age 2First Nations 2,575 1,494 1,494 1,494 2,196 1,487 1,475 2,198 2,198 2,198 2,038 22 173 265Rate per 100 children 58.0 58.0 58.0 85.3 57.7 57.3 85.4 85.4 85.4 79.1 0.9 6.7 10.3
Non-First Nations 13,177 9,772 9,772 9,765 11,739 9,702 9,359 11,531 11,523 11,521 10,525 381 1,091 2,776Rate per 100 children 74.2 74.2 74.1 89.1 73.6 71.0 87.5 87.4 87.4 79.9 2.9 8.3 21.1
Total for 2-year-olds 15,752 11,266 11,266 11,259 13,935 11,189 10,834 13,729 13,721 13,719 12,563 403 1,264 3,041Rate per 100 children 71.5 71.5 71.5 88.5 71.0 68.8 87.2 87.1 87.1 79.8 2.6 8.0 19.3
Age 7First Nations 1,965 1,258 1,258 1,254 1,745 1,459 6 1,529 1,918 1,918 535 11 23 90Rate per 100 children 64.0 64.0 63.8 88.8 74.2 0.3 77.8 97.6 97.6 27.2 0.6 1.2 4.6
Non-First Nations 12,869 9,410 9,410 9,348 11,055 10,204 466 10,175 11,853 11,853 5,492 833 917 873Rate per 100 children 73.1 73.1 72.6 85.9 79.3 3.6 79.1 92.1 92.1 42.7 6.5 7.1 6.8
Total for 7-year-olds 14,834 10,668 10,668 10,602 12,800 11,663 472 11,704 13,771 13,771 6,027 844 940 963Rate per 100 children 71.9 71.9 71.5 86.3 78.6 3.2 78.9 92.8 92.8 40.6 5.7 6.3 6.5
Age 11First Nations 1,865 1,106 1,106 1,093 1,547 1,273 *** 1,383 1,796 1,796 290 986 1,313 96Rate per 100 children 59.3 59.3 58.6 82.9 68.3 N/A 74.2 96.3 96.3 15.5 52.9 70.4 5.1
Non-First Nations 13,682 9,851 9,853 9,480 11,363 10,473 *** 10,678 12,265 12,269 2,733 10,474 10,945 667Rate per 100 children 72.0 72.0 69.3 83.1 76.5 N/A 78.0 89.6 89.7 20.0 76.6 80.0 4.9
Total for 11-year-olds 15,547 10,957 10,959 10,573 12,910 11,746 *** 12,061 14,061 14,065 3,023 11,460 12,258 763Rate per 100 children 70.5 70.5 68.0 83.0 75.6 N/A 77.6 90.4 90.5 19.4 73.7 78.8 4.9
Age 17First Nations 1,995 845 844 752 1,339 1,028 *** 1,433 1,912 1,913 11 1,216 36 76Rate per 100 children 42.4 42.3 37.7 67.1 51.5 N/A 71.8 95.8 95.9 0.6 61.0 1.8 3.8
Non-First Nations 15,211 10,227 10,234 9,269 12,570 9,895 *** 12,803 13,744 13,742 124 11,541 356 505Rate per 100 children 67.2 67.3 60.9 82.6 65.1 N/A 84.2 90.4 90.3 0.8 75.9 2.3 3.3
Total for 17-year-olds 17,206 11,072 11,078 10,021 13,909 10,923 *** 14,236 15,656 15,655 135 12,757 392 581Rate per 100 children 64.3 64.4 58.2 80.8 63.5 N/A 82.7 91.0 91.0 0.8 74.1 2.3 3.4
Manitoba Immunization Monitoring System Annual Report 20098
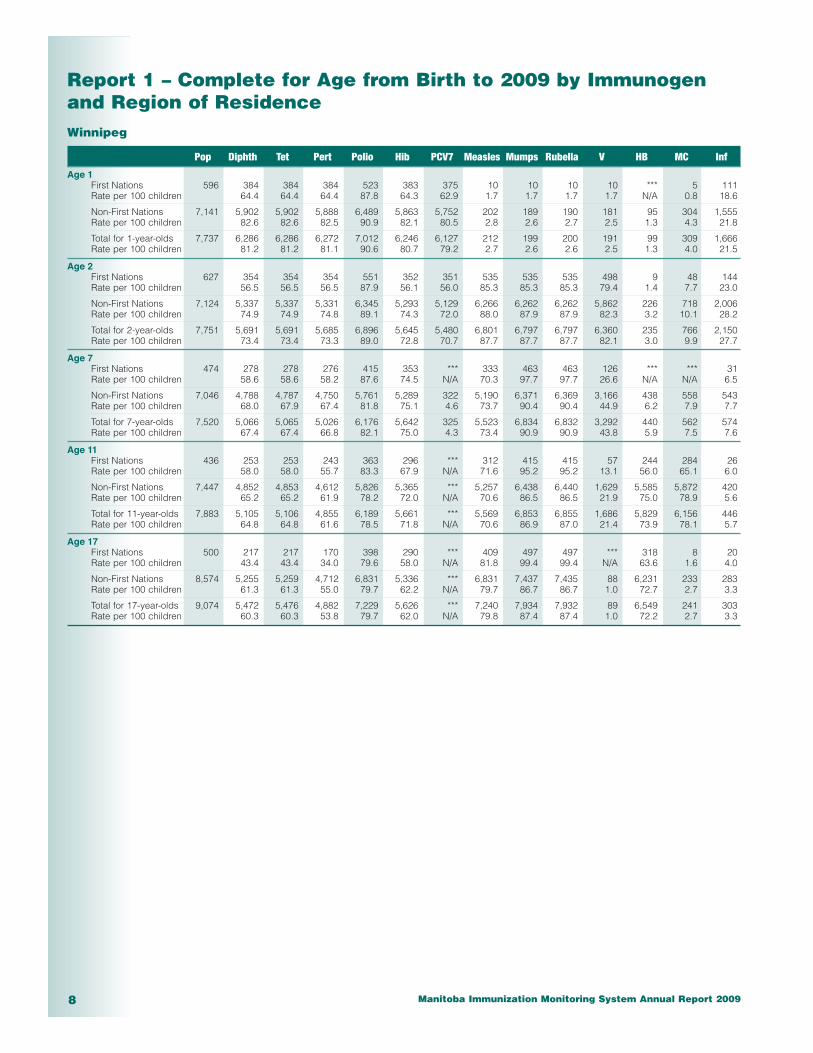
Report 1 – Complete for Age from Birth to 2009 by Immunogenand Region of ResidenceWinnipeg
Pop Diphth Tet Pert Polio Hib PCV7 Measles Mumps Rubella V HB MC Inf
Age 1First Nations 596 384 384 384 523 383 375 10 10 10 10 *** 5 111Rate per 100 children 64.4 64.4 64.4 87.8 64.3 62.9 1.7 1.7 1.7 1.7 N/A 0.8 18.6
Non-First Nations 7,141 5,902 5,902 5,888 6,489 5,863 5,752 202 189 190 181 95 304 1,555Rate per 100 children 82.6 82.6 82.5 90.9 82.1 80.5 2.8 2.6 2.7 2.5 1.3 4.3 21.8
Total for 1-year-olds 7,737 6,286 6,286 6,272 7,012 6,246 6,127 212 199 200 191 99 309 1,666Rate per 100 children 81.2 81.2 81.1 90.6 80.7 79.2 2.7 2.6 2.6 2.5 1.3 4.0 21.5
Age 2First Nations 627 354 354 354 551 352 351 535 535 535 498 9 48 144Rate per 100 children 56.5 56.5 56.5 87.9 56.1 56.0 85.3 85.3 85.3 79.4 1.4 7.7 23.0
Non-First Nations 7,124 5,337 5,337 5,331 6,345 5,293 5,129 6,266 6,262 6,262 5,862 226 718 2,006Rate per 100 children 74.9 74.9 74.8 89.1 74.3 72.0 88.0 87.9 87.9 82.3 3.2 10.1 28.2
Total for 2-year-olds 7,751 5,691 5,691 5,685 6,896 5,645 5,480 6,801 6,797 6,797 6,360 235 766 2,150Rate per 100 children 73.4 73.4 73.3 89.0 72.8 70.7 87.7 87.7 87.7 82.1 3.0 9.9 27.7
Age 7First Nations 474 278 278 276 415 353 *** 333 463 463 126 *** *** 31Rate per 100 children 58.6 58.6 58.2 87.6 74.5 N/A 70.3 97.7 97.7 26.6 N/A N/A 6.5
Non-First Nations 7,046 4,788 4,787 4,750 5,761 5,289 322 5,190 6,371 6,369 3,166 438 558 543Rate per 100 children 68.0 67.9 67.4 81.8 75.1 4.6 73.7 90.4 90.4 44.9 6.2 7.9 7.7
Total for 7-year-olds 7,520 5,066 5,065 5,026 6,176 5,642 325 5,523 6,834 6,832 3,292 440 562 574Rate per 100 children 67.4 67.4 66.8 82.1 75.0 4.3 73.4 90.9 90.9 43.8 5.9 7.5 7.6
Age 11First Nations 436 253 253 243 363 296 *** 312 415 415 57 244 284 26Rate per 100 children 58.0 58.0 55.7 83.3 67.9 N/A 71.6 95.2 95.2 13.1 56.0 65.1 6.0
Non-First Nations 7,447 4,852 4,853 4,612 5,826 5,365 *** 5,257 6,438 6,440 1,629 5,585 5,872 420Rate per 100 children 65.2 65.2 61.9 78.2 72.0 N/A 70.6 86.5 86.5 21.9 75.0 78.9 5.6
Total for 11-year-olds 7,883 5,105 5,106 4,855 6,189 5,661 *** 5,569 6,853 6,855 1,686 5,829 6,156 446Rate per 100 children 64.8 64.8 61.6 78.5 71.8 N/A 70.6 86.9 87.0 21.4 73.9 78.1 5.7
Age 17First Nations 500 217 217 170 398 290 *** 409 497 497 *** 318 8 20Rate per 100 children 43.4 43.4 34.0 79.6 58.0 N/A 81.8 99.4 99.4 N/A 63.6 1.6 4.0
Non-First Nations 8,574 5,255 5,259 4,712 6,831 5,336 *** 6,831 7,437 7,435 88 6,231 233 283Rate per 100 children 61.3 61.3 55.0 79.7 62.2 N/A 79.7 86.7 86.7 1.0 72.7 2.7 3.3
Total for 17-year-olds 9,074 5,472 5,476 4,882 7,229 5,626 *** 7,240 7,934 7,932 89 6,549 241 303Rate per 100 children 60.3 60.3 53.8 79.7 62.0 N/A 79.8 87.4 87.4 1.0 72.2 2.7 3.3

Manitoba Immunization Monitoring System Annual Report 2009 9
Report 1 – Complete for Age from Birth to 2009 by Immunogenand Region of ResidenceBrandon
Pop Diphth Tet Pert Polio Hib PCV7 Measles Mumps Rubella V HB MC Inf
Age 1First Nations 65 46 46 46 56 46 46 *** *** *** *** *** *** ***Rate per 100 children 70.8 70.8 70.8 86.2 70.8 70.8 N/A N/A N/A N/A N/A N/A N/A
Non-First Nations 604 521 521 521 567 520 506 24 23 23 21 5 25 71Rate per 100 children 86.3 86.3 86.3 93.9 86.1 83.8 4.0 3.8 3.8 3.5 0.8 4.1 11.8
Total for 1-year-olds 669 567 567 567 623 566 552 26 25 25 23 5 26 74Rate per 100 children 84.8 84.8 84.8 93.1 84.6 82.5 3.9 3.7 3.7 3.4 0.7 3.9 11.1
Age 2First Nations 58 27 27 27 39 27 26 39 39 39 36 *** *** ***Rate per 100 children 46.6 46.6 46.6 67.2 46.6 44.8 67.2 67.2 67.2 62.1 N/A N/A N/A
Non-First Nations 666 484 484 484 612 475 455 594 592 590 554 15 27 97Rate per 100 children 72.7 72.7 72.7 91.9 71.3 68.3 89.2 88.9 88.6 83.2 2.3 4.1 14.6
Total for 2-year-olds 724 511 511 511 651 502 481 633 631 629 590 15 28 100Rate per 100 children 70.6 70.6 70.6 89.9 69.3 66.4 87.4 87.2 86.9 81.5 2.1 3.9 13.8
Age 7First Nations 51 33 33 33 47 38 *** 43 49 49 15 *** *** ***Rate per 100 children 64.7 64.7 64.7 92.2 74.5 N/A 84.3 96.1 96.1 29.4 N/A N/A N/A
Non-First Nations 564 424 424 419 492 449 18 470 525 526 272 21 43 43Rate per 100 children 75.2 75.2 74.3 87.2 79.6 3.2 83.3 93.1 93.3 48.2 3.7 7.6 7.6
Total for 7-year-olds 615 457 457 452 539 487 18 513 574 575 287 21 44 44Rate per 100 children 74.3 74.3 73.5 87.6 79.2 2.9 83.4 93.3 93.5 46.7 3.4 7.2 7.2
Age 11First Nations 42 31 31 31 39 33 *** 36 40 40 9 19 25 ***Rate per 100 children 73.8 73.8 73.8 92.9 78.6 N/A 85.7 95.2 95.2 21.4 45.2 59.5 N/A
Non-First Nations 540 396 396 393 449 410 *** 433 486 486 129 424 454 29Rate per 100 children 73.3 73.3 72.8 83.1 75.9 N/A 80.2 90.0 90.0 23.9 78.5 84.1 5.4
Total for 11-year-olds 582 427 427 424 488 443 *** 469 526 526 138 443 479 32Rate per 100 children 73.4 73.4 72.9 83.8 76.1 N/A 80.6 90.4 90.4 23.7 76.1 82.3 5.5
Age 17First Nations 36 20 20 18 27 22 *** 31 38 38 *** 29 *** ***Rate per 100 children 55.6 55.6 50.0 75.0 61.1 N/A 86.1 105.6 105.6 N/A 80.6 N/A N/A
Non-First Nations 580 420 420 404 457 412 *** 495 529 530 *** 451 6 22Rate per 100 children 72.4 72.4 69.7 78.8 71.0 N/A 85.3 91.2 91.4 N/A 77.8 1.0 3.8
Total for 17-year-olds 616 440 440 422 484 434 *** 526 567 568 *** 480 6 23Rate per 100 children 71.4 71.4 68.5 78.6 70.5 N/A 85.4 92.0 92.2 N/A 77.9 1.0 3.7
Manitoba Immunization Monitoring System Annual Report 200910
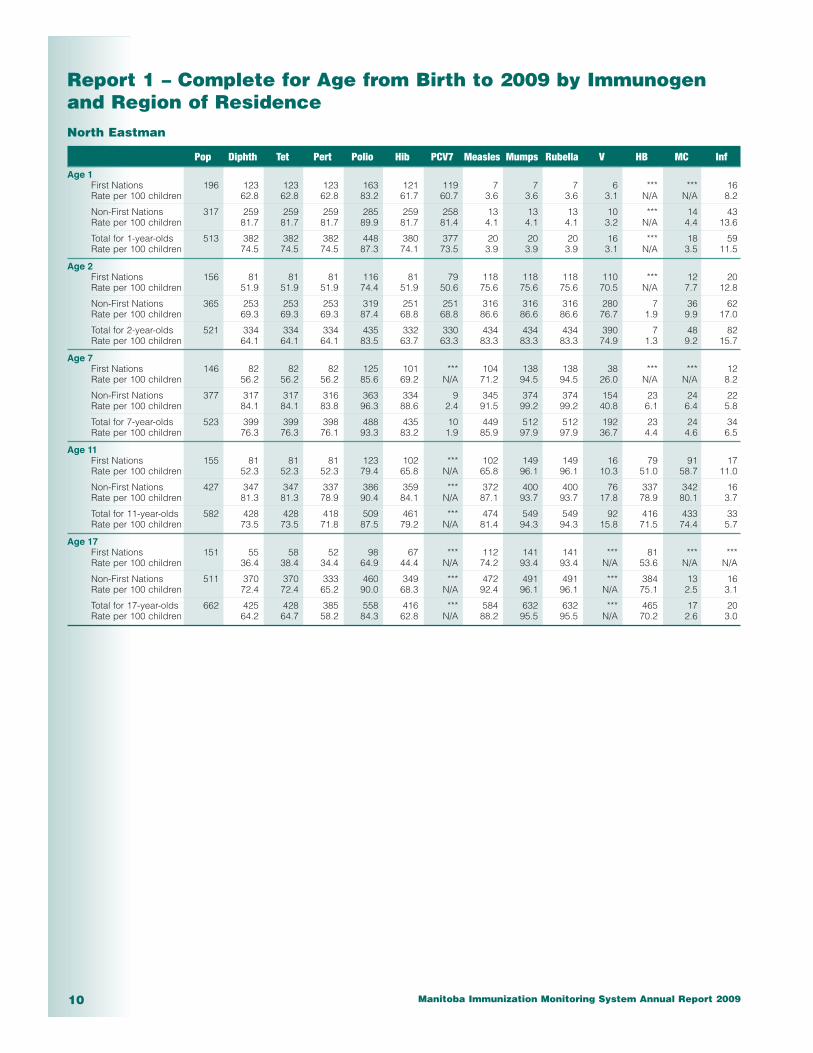
Report 1 – Complete for Age from Birth to 2009 by Immunogenand Region of ResidenceNorth Eastman
Pop Diphth Tet Pert Polio Hib PCV7 Measles Mumps Rubella V HB MC Inf
Age 1First Nations 196 123 123 123 163 121 119 7 7 7 6 *** *** 16Rate per 100 children 62.8 62.8 62.8 83.2 61.7 60.7 3.6 3.6 3.6 3.1 N/A N/A 8.2
Non-First Nations 317 259 259 259 285 259 258 13 13 13 10 *** 14 43Rate per 100 children 81.7 81.7 81.7 89.9 81.7 81.4 4.1 4.1 4.1 3.2 N/A 4.4 13.6
Total for 1-year-olds 513 382 382 382 448 380 377 20 20 20 16 *** 18 59Rate per 100 children 74.5 74.5 74.5 87.3 74.1 73.5 3.9 3.9 3.9 3.1 N/A 3.5 11.5
Age 2First Nations 156 81 81 81 116 81 79 118 118 118 110 *** 12 20Rate per 100 children 51.9 51.9 51.9 74.4 51.9 50.6 75.6 75.6 75.6 70.5 N/A 7.7 12.8
Non-First Nations 365 253 253 253 319 251 251 316 316 316 280 7 36 62Rate per 100 children 69.3 69.3 69.3 87.4 68.8 68.8 86.6 86.6 86.6 76.7 1.9 9.9 17.0
Total for 2-year-olds 521 334 334 334 435 332 330 434 434 434 390 7 48 82Rate per 100 children 64.1 64.1 64.1 83.5 63.7 63.3 83.3 83.3 83.3 74.9 1.3 9.2 15.7
Age 7First Nations 146 82 82 82 125 101 *** 104 138 138 38 *** *** 12Rate per 100 children 56.2 56.2 56.2 85.6 69.2 N/A 71.2 94.5 94.5 26.0 N/A N/A 8.2
Non-First Nations 377 317 317 316 363 334 9 345 374 374 154 23 24 22Rate per 100 children 84.1 84.1 83.8 96.3 88.6 2.4 91.5 99.2 99.2 40.8 6.1 6.4 5.8
Total for 7-year-olds 523 399 399 398 488 435 10 449 512 512 192 23 24 34Rate per 100 children 76.3 76.3 76.1 93.3 83.2 1.9 85.9 97.9 97.9 36.7 4.4 4.6 6.5
Age 11First Nations 155 81 81 81 123 102 *** 102 149 149 16 79 91 17Rate per 100 children 52.3 52.3 52.3 79.4 65.8 N/A 65.8 96.1 96.1 10.3 51.0 58.7 11.0
Non-First Nations 427 347 347 337 386 359 *** 372 400 400 76 337 342 16Rate per 100 children 81.3 81.3 78.9 90.4 84.1 N/A 87.1 93.7 93.7 17.8 78.9 80.1 3.7
Total for 11-year-olds 582 428 428 418 509 461 *** 474 549 549 92 416 433 33Rate per 100 children 73.5 73.5 71.8 87.5 79.2 N/A 81.4 94.3 94.3 15.8 71.5 74.4 5.7
Age 17First Nations 151 55 58 52 98 67 *** 112 141 141 *** 81 *** ***Rate per 100 children 36.4 38.4 34.4 64.9 44.4 N/A 74.2 93.4 93.4 N/A 53.6 N/A N/A
Non-First Nations 511 370 370 333 460 349 *** 472 491 491 *** 384 13 16Rate per 100 children 72.4 72.4 65.2 90.0 68.3 N/A 92.4 96.1 96.1 N/A 75.1 2.5 3.1
Total for 17-year-olds 662 425 428 385 558 416 *** 584 632 632 *** 465 17 20Rate per 100 children 64.2 64.7 58.2 84.3 62.8 N/A 88.2 95.5 95.5 N/A 70.2 2.6 3.0
Manitoba Immunization Monitoring System Annual Report 2009 11
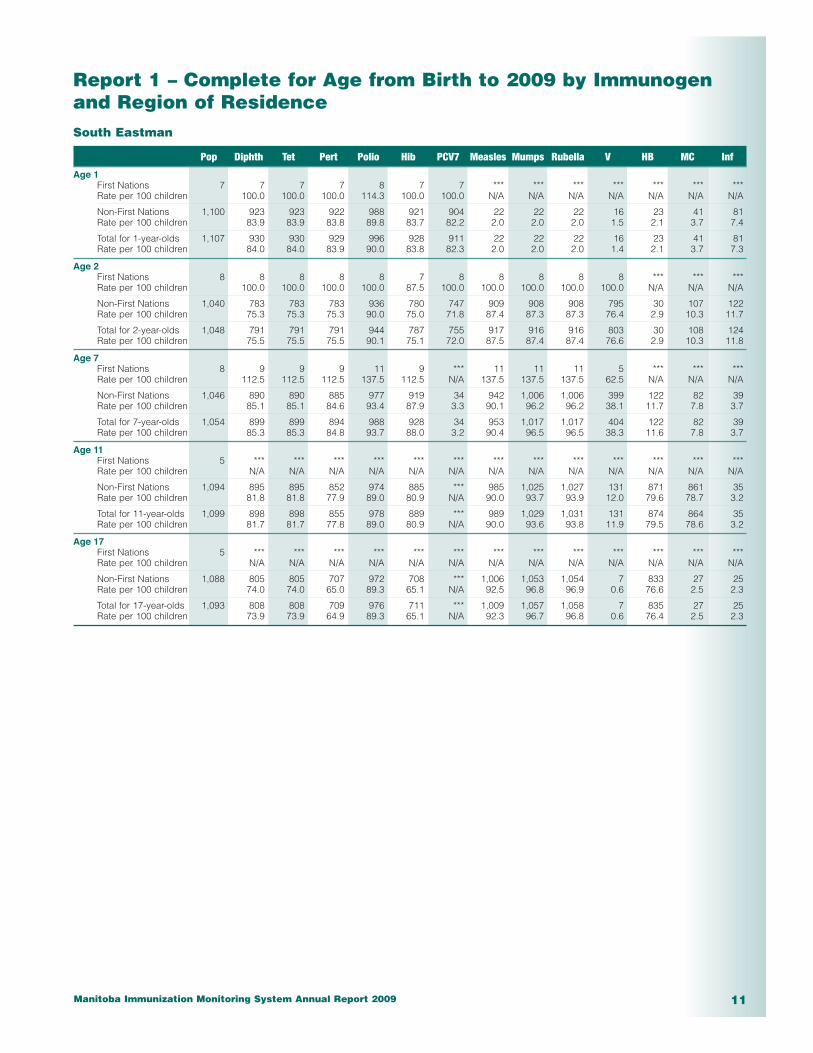
Report 1 – Complete for Age from Birth to 2009 by Immunogenand Region of ResidenceSouth Eastman
Pop Diphth Tet Pert Polio Hib PCV7 Measles Mumps Rubella V HB MC Inf
Age 1First Nations 7 7 7 7 8 7 7 *** *** *** *** *** *** ***Rate per 100 children 100.0 100.0 100.0 114.3 100.0 100.0 N/A N/A N/A N/A N/A N/A N/A
Non-First Nations 1,100 923 923 922 988 921 904 22 22 22 16 23 41 81Rate per 100 children 83.9 83.9 83.8 89.8 83.7 82.2 2.0 2.0 2.0 1.5 2.1 3.7 7.4
Total for 1-year-olds 1,107 930 930 929 996 928 911 22 22 22 16 23 41 81Rate per 100 children 84.0 84.0 83.9 90.0 83.8 82.3 2.0 2.0 2.0 1.4 2.1 3.7 7.3
Age 2First Nations 8 8 8 8 8 7 8 8 8 8 8 *** *** ***Rate per 100 children 100.0 100.0 100.0 100.0 87.5 100.0 100.0 100.0 100.0 100.0 N/A N/A N/A
Non-First Nations 1,040 783 783 783 936 780 747 909 908 908 795 30 107 122Rate per 100 children 75.3 75.3 75.3 90.0 75.0 71.8 87.4 87.3 87.3 76.4 2.9 10.3 11.7
Total for 2-year-olds 1,048 791 791 791 944 787 755 917 916 916 803 30 108 124Rate per 100 children 75.5 75.5 75.5 90.1 75.1 72.0 87.5 87.4 87.4 76.6 2.9 10.3 11.8
Age 7First Nations 8 9 9 9 11 9 *** 11 11 11 5 *** *** ***Rate per 100 children 112.5 112.5 112.5 137.5 112.5 N/A 137.5 137.5 137.5 62.5 N/A N/A N/A
Non-First Nations 1,046 890 890 885 977 919 34 942 1,006 1,006 399 122 82 39Rate per 100 children 85.1 85.1 84.6 93.4 87.9 3.3 90.1 96.2 96.2 38.1 11.7 7.8 3.7
Total for 7-year-olds 1,054 899 899 894 988 928 34 953 1,017 1,017 404 122 82 39Rate per 100 children 85.3 85.3 84.8 93.7 88.0 3.2 90.4 96.5 96.5 38.3 11.6 7.8 3.7
Age 11First Nations 5 *** *** *** *** *** *** *** *** *** *** *** *** ***Rate per 100 children N/A N/A N/A N/A N/A N/A N/A N/A N/A N/A N/A N/A N/A
Non-First Nations 1,094 895 895 852 974 885 *** 985 1,025 1,027 131 871 861 35Rate per 100 children 81.8 81.8 77.9 89.0 80.9 N/A 90.0 93.7 93.9 12.0 79.6 78.7 3.2
Total for 11-year-olds 1,099 898 898 855 978 889 *** 989 1,029 1,031 131 874 864 35Rate per 100 children 81.7 81.7 77.8 89.0 80.9 N/A 90.0 93.6 93.8 11.9 79.5 78.6 3.2
Age 17First Nations 5 *** *** *** *** *** *** *** *** *** *** *** *** ***Rate per 100 children N/A N/A N/A N/A N/A N/A N/A N/A N/A N/A N/A N/A N/A
Non-First Nations 1,088 805 805 707 972 708 *** 1,006 1,053 1,054 7 833 27 25Rate per 100 children 74.0 74.0 65.0 89.3 65.1 N/A 92.5 96.8 96.9 0.6 76.6 2.5 2.3
Total for 17-year-olds 1,093 808 808 709 976 711 *** 1,009 1,057 1,058 7 835 27 25Rate per 100 children 73.9 73.9 64.9 89.3 65.1 N/A 92.3 96.7 96.8 0.6 76.4 2.5 2.3

Manitoba Immunization Monitoring System Annual Report 200912
Report 1 – Complete for Age from Birth to 2009 by Immunogenand Region of ResidenceInterlake
Pop Diphth Tet Pert Polio Hib PCV7 Measles Mumps Rubella V HB MC Inf
Age 1First Nations 164 106 106 106 139 106 105 *** *** *** *** *** *** 14Rate per 100 children 64.6 64.6 64.6 84.8 64.6 64.0 N/A N/A N/A N/A N/A N/A 8.5
Non-First Nations 701 574 574 574 632 572 563 15 15 15 13 *** 19 88Rate per 100 children 81.9 81.9 81.9 90.2 81.6 80.3 2.1 2.1 2.1 1.9 N/A 2.7 12.6
Total for 1-year-olds 865 680 680 680 771 678 668 16 16 16 15 5 19 102Rate per 100 children 78.6 78.6 78.6 89.1 78.4 77.2 1.8 1.8 1.8 1.7 0.6 2.2 11.8
Age 2First Nations 156 79 79 79 123 79 80 118 118 118 84 *** 13 10Rate per 100 children 50.6 50.6 50.6 78.8 50.6 51.3 75.6 75.6 75.6 53.8 N/A 8.3 6.4
Non-First Nations 754 549 549 549 653 547 528 645 645 645 588 9 51 114Rate per 100 children 72.8 72.8 72.8 86.6 72.5 70.0 85.5 85.5 85.5 78.0 1.2 6.8 15.1
Total for 2-year-olds 910 628 628 628 776 626 608 763 763 763 672 10 64 124Rate per 100 children 69.0 69.0 69.0 85.3 68.8 66.8 83.8 83.8 83.8 73.8 1.1 7.0 13.6
Age 7First Nations 128 90 90 90 109 97 *** 104 126 126 28 *** 9 5Rate per 100 children 70.3 70.3 70.3 85.2 75.8 N/A 81.3 98.4 98.4 21.9 N/A 7.0 3.9
Non-First Nations 788 564 564 561 684 629 21 615 716 716 328 20 44 55Rate per 100 children 71.6 71.6 71.2 86.8 79.8 2.7 78.0 90.9 90.9 41.6 2.5 5.6 7.0
Total for 7-year-olds 916 654 654 651 793 726 21 719 842 842 356 21 53 60Rate per 100 children 71.4 71.4 71.1 86.6 79.3 2.3 78.5 91.9 91.9 38.9 2.3 5.8 6.6
Age 11First Nations 132 86 86 85 123 109 *** 98 130 130 18 54 80 7Rate per 100 children 65.2 65.2 64.4 93.2 82.6 N/A 74.2 98.5 98.5 13.6 40.9 60.6 5.3
Non-First Nations 858 635 635 617 720 682 *** 668 759 759 152 651 667 25Rate per 100 children 74.0 74.0 71.9 83.9 79.5 N/A 77.9 88.5 88.5 17.7 75.9 77.7 2.9
Total for 11-year-olds 990 721 721 702 843 791 *** 766 889 889 170 705 747 32Rate per 100 children 72.8 72.8 70.9 85.2 79.9 N/A 77.4 89.8 89.8 17.2 71.2 75.5 3.2
Age 17First Nations 164 66 66 63 116 102 *** 113 161 161 *** 96 5 ***Rate per 100 children 40.2 40.2 38.4 70.7 62.2 N/A 68.9 98.2 98.2 N/A 58.5 3.0 N/A
Non-First Nations 1,003 715 715 640 831 657 *** 837 907 907 12 782 16 38Rate per 100 children 71.3 71.3 63.8 82.9 65.5 N/A 83.4 90.4 90.4 1.2 78.0 1.6 3.8
Total for 17-year-olds 1,167 781 781 703 947 759 *** 950 1,068 1,068 14 878 21 41Rate per 100 children 66.9 66.9 60.2 81.1 65.0 N/A 81.4 91.5 91.5 1.2 75.2 1.8 3.5
Manitoba Immunization Monitoring System Annual Report 2009 13
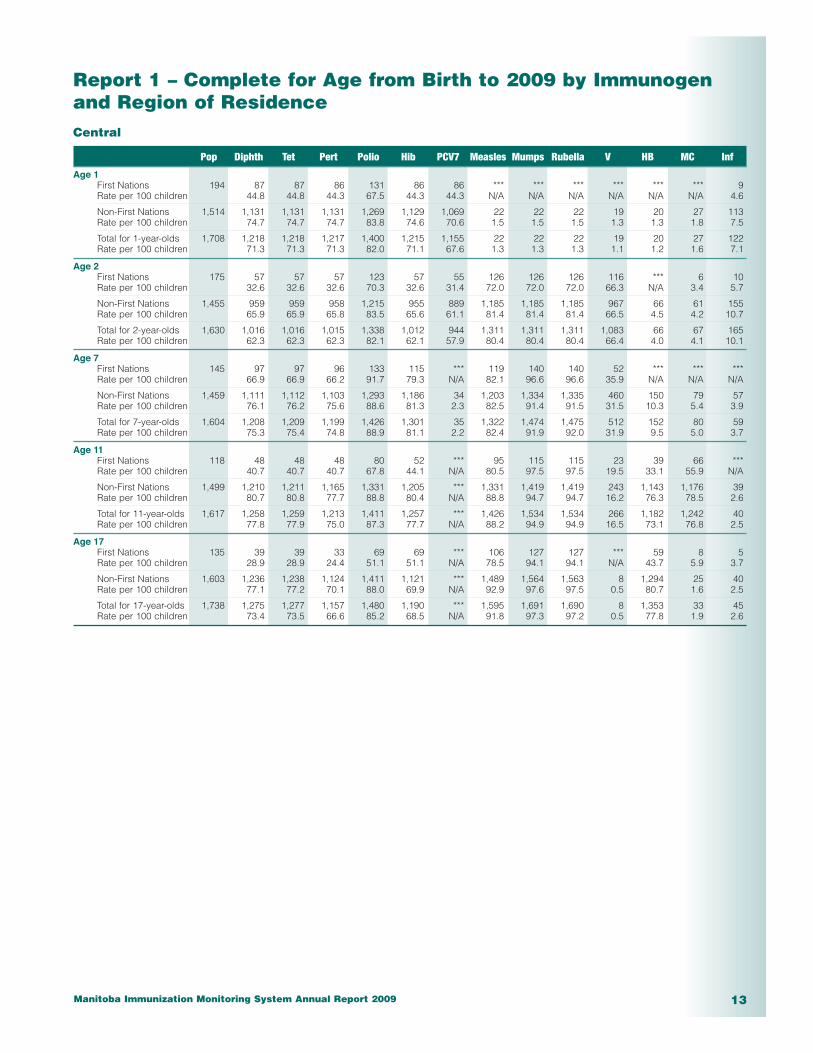
Report 1 – Complete for Age from Birth to 2009 by Immunogenand Region of ResidenceCentral
Pop Diphth Tet Pert Polio Hib PCV7 Measles Mumps Rubella V HB MC Inf
Age 1First Nations 194 87 87 86 131 86 86 *** *** *** *** *** *** 9Rate per 100 children 44.8 44.8 44.3 67.5 44.3 44.3 N/A N/A N/A N/A N/A N/A 4.6
Non-First Nations 1,514 1,131 1,131 1,131 1,269 1,129 1,069 22 22 22 19 20 27 113Rate per 100 children 74.7 74.7 74.7 83.8 74.6 70.6 1.5 1.5 1.5 1.3 1.3 1.8 7.5
Total for 1-year-olds 1,708 1,218 1,218 1,217 1,400 1,215 1,155 22 22 22 19 20 27 122Rate per 100 children 71.3 71.3 71.3 82.0 71.1 67.6 1.3 1.3 1.3 1.1 1.2 1.6 7.1
Age 2First Nations 175 57 57 57 123 57 55 126 126 126 116 *** 6 10Rate per 100 children 32.6 32.6 32.6 70.3 32.6 31.4 72.0 72.0 72.0 66.3 N/A 3.4 5.7
Non-First Nations 1,455 959 959 958 1,215 955 889 1,185 1,185 1,185 967 66 61 155Rate per 100 children 65.9 65.9 65.8 83.5 65.6 61.1 81.4 81.4 81.4 66.5 4.5 4.2 10.7
Total for 2-year-olds 1,630 1,016 1,016 1,015 1,338 1,012 944 1,311 1,311 1,311 1,083 66 67 165Rate per 100 children 62.3 62.3 62.3 82.1 62.1 57.9 80.4 80.4 80.4 66.4 4.0 4.1 10.1
Age 7First Nations 145 97 97 96 133 115 *** 119 140 140 52 *** *** ***Rate per 100 children 66.9 66.9 66.2 91.7 79.3 N/A 82.1 96.6 96.6 35.9 N/A N/A N/A
Non-First Nations 1,459 1,111 1,112 1,103 1,293 1,186 34 1,203 1,334 1,335 460 150 79 57Rate per 100 children 76.1 76.2 75.6 88.6 81.3 2.3 82.5 91.4 91.5 31.5 10.3 5.4 3.9
Total for 7-year-olds 1,604 1,208 1,209 1,199 1,426 1,301 35 1,322 1,474 1,475 512 152 80 59Rate per 100 children 75.3 75.4 74.8 88.9 81.1 2.2 82.4 91.9 92.0 31.9 9.5 5.0 3.7
Age 11First Nations 118 48 48 48 80 52 *** 95 115 115 23 39 66 ***Rate per 100 children 40.7 40.7 40.7 67.8 44.1 N/A 80.5 97.5 97.5 19.5 33.1 55.9 N/A
Non-First Nations 1,499 1,210 1,211 1,165 1,331 1,205 *** 1,331 1,419 1,419 243 1,143 1,176 39Rate per 100 children 80.7 80.8 77.7 88.8 80.4 N/A 88.8 94.7 94.7 16.2 76.3 78.5 2.6
Total for 11-year-olds 1,617 1,258 1,259 1,213 1,411 1,257 *** 1,426 1,534 1,534 266 1,182 1,242 40Rate per 100 children 77.8 77.9 75.0 87.3 77.7 N/A 88.2 94.9 94.9 16.5 73.1 76.8 2.5
Age 17First Nations 135 39 39 33 69 69 *** 106 127 127 *** 59 8 5Rate per 100 children 28.9 28.9 24.4 51.1 51.1 N/A 78.5 94.1 94.1 N/A 43.7 5.9 3.7
Non-First Nations 1,603 1,236 1,238 1,124 1,411 1,121 *** 1,489 1,564 1,563 8 1,294 25 40Rate per 100 children 77.1 77.2 70.1 88.0 69.9 N/A 92.9 97.6 97.5 0.5 80.7 1.6 2.5
Total for 17-year-olds 1,738 1,275 1,277 1,157 1,480 1,190 *** 1,595 1,691 1,690 8 1,353 33 45Rate per 100 children 73.4 73.5 66.6 85.2 68.5 N/A 91.8 97.3 97.2 0.5 77.8 1.9 2.6

Manitoba Immunization Monitoring System Annual Report 200914
Report 1 – Complete for Age from Birth to 2009 by Immunogenand Region of ResidenceAssiniboine
Pop Diphth Tet Pert Polio Hib PCV7 Measles Mumps Rubella V HB MC Inf
Age 1First Nations 108 74 74 74 95 74 72 *** *** *** *** *** *** ***Rate per 100 children 68.5 68.5 68.5 88.0 68.5 66.7 N/A N/A N/A N/A N/A N/A N/A
Non-First Nations 658 564 564 564 606 563 536 10 10 10 8 6 11 21Rate per 100 children 85.7 85.7 85.7 92.1 85.6 81.5 1.5 1.5 1.5 1.2 0.9 1.7 3.2
Total for 1-year-olds 766 638 638 638 701 637 608 11 11 11 8 6 12 23Rate per 100 children 83.3 83.3 83.3 91.5 83.2 79.4 1.4 1.4 1.4 1.0 0.8 1.6 3.0
Age 2First Nations 99 57 57 57 80 56 57 78 78 78 74 *** *** ***Rate per 100 children 57.6 57.6 57.6 80.8 56.6 57.6 78.8 78.8 78.8 74.7 N/A N/A N/A
Non-First Nations 718 579 579 579 670 577 548 651 650 650 563 10 29 58Rate per 100 children 80.6 80.6 80.6 93.3 80.4 76.3 90.7 90.5 90.5 78.4 1.4 4.0 8.1
Total for 2-year-olds 817 636 636 636 750 633 605 729 728 728 637 10 32 61Rate per 100 children 77.8 77.8 77.8 91.8 77.5 74.1 89.2 89.1 89.1 78.0 1.2 3.9 7.5
Age 7First Nations 79 61 61 61 74 68 *** 66 77 77 24 *** *** ***Rate per 100 children 77.2 77.2 77.2 93.7 86.1 N/A 83.5 97.5 97.5 30.4 N/A N/A N/A
Non-First Nations 675 546 546 545 606 576 17 583 623 623 289 24 45 32Rate per 100 children 80.9 80.9 80.7 89.8 85.3 2.5 86.4 92.3 92.3 42.8 3.6 6.7 4.7
Total for 7-year-olds 754 607 607 606 680 644 17 649 700 700 313 24 46 34Rate per 100 children 80.5 80.5 80.4 90.2 85.4 2.3 86.1 92.8 92.8 41.5 3.2 6.1 4.5
Age 11First Nations 68 36 36 36 58 47 *** 47 67 67 *** 38 51 7Rate per 100 children 52.9 52.9 52.9 85.3 69.1 N/A 69.1 98.5 98.5 N/A 55.9 75.0 10.3
Non-First Nations 780 655 655 648 711 672 *** 700 740 740 152 636 669 32Rate per 100 children 84.0 84.0 83.1 91.2 86.2 N/A 89.7 94.9 94.9 19.5 81.5 85.8 4.1
Total for 11-year-olds 848 691 691 684 769 719 *** 747 807 807 156 674 720 39Rate per 100 children 81.5 81.5 80.7 90.7 84.8 N/A 88.1 95.2 95.2 18.4 79.5 84.9 4.6
Age 17First Nations 96 37 37 33 63 69 *** 67 92 92 *** 75 *** 6Rate per 100 children 38.5 38.5 34.4 65.6 71.9 N/A 69.8 95.8 95.8 N/A 78.1 N/A 6.3
Non-First Nations 865 694 694 656 747 641 *** 771 800 800 *** 718 19 30Rate per 100 children 80.2 80.2 75.8 86.4 74.1 N/A 89.1 92.5 92.5 N/A 83.0 2.2 3.5
Total for 17-year-olds 961 731 731 689 810 710 *** 838 892 892 *** 793 21 36Rate per 100 children 76.1 76.1 71.7 84.3 73.9 N/A 87.2 92.8 92.8 N/A 82.5 2.2 3.7

Manitoba Immunization Monitoring System Annual Report 2009 15
Report 1 – Complete for Age from Birth to 2009 by Immunogenand Region of ResidenceParkland
Pop Diphth Tet Pert Polio Hib PCV7 Measles Mumps Rubella V HB MC Inf
Age 1First Nations 155 121 121 121 140 121 111 *** *** *** *** *** *** 5Rate per 100 children 78.1 78.1 78.1 90.3 78.1 71.6 N/A N/A N/A N/A N/A N/A 3.2
Non-First Nations 404 353 353 353 381 352 346 8 8 8 6 *** 16 26Rate per 100 children 87.4 87.4 87.4 94.3 87.1 85.6 2.0 2.0 2.0 1.5 N/A 4.0 6.4
Total for 1-year-olds 559 474 474 474 521 473 457 9 9 9 7 *** 17 31Rate per 100 children 84.8 84.8 84.8 93.2 84.6 81.8 1.6 1.6 1.6 1.3 N/A 3.0 5.5
Age 2First Nations 125 93 93 93 116 93 88 114 114 114 106 *** 5 12Rate per 100 children 74.4 74.4 74.4 92.8 74.4 70.4 91.2 91.2 91.2 84.8 N/A 4.0 9.6
Non-First Nations 429 348 348 348 404 347 341 390 390 390 371 *** 30 37Rate per 100 children 81.1 81.1 81.1 94.2 80.9 79.5 90.9 90.9 90.9 86.5 N/A 7.0 8.6
Total for 2-year-olds 554 441 441 441 520 440 429 504 504 504 477 *** 35 49Rate per 100 children 79.6 79.6 79.6 93.9 79.4 77.4 91.0 91.0 91.0 86.1 N/A 6.3 8.8
Age 7First Nations 87 70 70 70 85 75 *** 78 90 90 47 *** *** ***Rate per 100 children 80.5 80.5 80.5 97.7 86.2 N/A 89.7 103.4 103.4 54.0 N/A N/A N/A
Non-First Nations 417 363 363 363 402 383 7 383 415 415 186 20 25 25Rate per 100 children 87.1 87.1 87.1 96.4 91.8 1.7 91.8 99.5 99.5 44.6 4.8 6.0 6.0
Total for 7-year-olds 504 433 433 433 487 458 7 461 505 505 233 20 26 27Rate per 100 children 85.9 85.9 85.9 96.6 90.9 1.4 91.5 100.2 100.2 46.2 4.0 5.2 5.4
Age 11First Nations 85 76 76 76 85 78 *** 81 86 86 24 56 70 5Rate per 100 children 89.4 89.4 89.4 100.0 91.8 N/A 95.3 101.2 101.2 28.2 65.9 82.4 5.9
Non-First Nations 470 408 408 405 447 417 *** 439 453 453 99 392 414 18Rate per 100 children 86.8 86.8 86.2 95.1 88.7 N/A 93.4 96.4 96.4 21.1 83.4 88.1 3.8
Total for 11-year-olds 555 484 484 481 532 495 *** 520 539 539 123 448 484 23Rate per 100 children 87.2 87.2 86.7 95.9 89.2 N/A 93.7 97.1 97.1 22.2 80.7 87.2 4.1
Age 17First Nations 111 74 74 72 93 65 *** 106 113 113 *** 104 *** 6Rate per 100 children 66.7 66.7 64.9 83.8 58.6 N/A 95.5 101.8 101.8 N/A 93.7 N/A 5.4
Non-First Nations 472 382 383 361 427 349 *** 448 465 464 *** 411 *** 17Rate per 100 children 80.9 81.1 76.5 90.5 73.9 N/A 94.9 98.5 98.3 N/A 87.1 N/A 3.6
Total for 17-year-olds 583 456 457 433 520 414 *** 554 578 577 *** 515 *** 23Rate per 100 children 78.2 78.4 74.3 89.2 71.0 N/A 95.0 99.1 99.0 N/A 88.3 N/A 3.9

Manitoba Immunization Monitoring System Annual Report 200916
Report 1 – Complete for Age from Birth to 2009 by Immunogenand Region of ResidenceNOR-MAN
Pop Diphth Tet Pert Polio Hib PCV7 Measles Mumps Rubella V HB MC Inf
Age 1First Nations 226 162 162 162 202 162 161 7 7 7 6 *** *** 14Rate per 100 children 71.7 71.7 71.7 89.4 71.7 71.2 3.1 3.1 3.1 2.7 N/A N/A 6.2
Non-First Nations 210 182 182 182 198 182 181 6 6 6 5 *** 5 43Rate per 100 children 86.7 86.7 86.7 94.3 86.7 86.2 2.9 2.9 2.9 2.4 N/A 2.4 20.5
Total for 1-year-olds 436 344 344 344 400 344 342 13 13 13 11 *** 9 57Rate per 100 children 78.9 78.9 78.9 91.7 78.9 78.4 3.0 3.0 3.0 2.5 N/A 2.1 13.1
Age 2First Nations 231 158 158 158 212 157 156 214 214 214 202 *** 6 24Rate per 100 children 68.4 68.4 68.4 91.8 68.0 67.5 92.6 92.6 92.6 87.4 N/A 2.6 10.4
Non-First Nations 264 200 200 200 247 199 197 240 240 240 229 *** 12 66Rate per 100 children 75.8 75.8 75.8 93.6 75.4 74.6 90.9 90.9 90.9 86.7 N/A 4.5 25.0
Total for 2-year-olds 495 358 358 358 459 356 353 454 454 454 431 *** 18 90Rate per 100 children 72.3 72.3 72.3 92.7 71.9 71.3 91.7 91.7 91.7 87.1 N/A 3.6 18.2
Age 7First Nations 169 137 137 137 167 145 *** 158 173 173 50 *** *** 13Rate per 100 children 81.1 81.1 81.1 98.8 85.8 N/A 93.5 102.4 102.4 29.6 N/A N/A 7.7
Non-First Nations 237 207 207 206 223 216 *** 213 227 227 121 6 11 23Rate per 100 children 87.3 87.3 86.9 94.1 91.1 N/A 89.9 95.8 95.8 51.1 2.5 4.6 9.7
Total for 7-year-olds 406 344 344 343 390 361 *** 371 400 400 171 7 15 36Rate per 100 children 84.7 84.7 84.5 96.1 88.9 N/A 91.4 98.5 98.5 42.1 1.7 3.7 8.9
Age 11First Nations 171 134 134 134 161 145 *** 152 172 172 23 99 138 7Rate per 100 children 78.4 78.4 78.4 94.2 84.8 N/A 88.9 100.6 100.6 13.5 57.9 80.7 4.1
Non-First Nations 258 216 216 215 239 224 *** 231 249 249 51 207 233 18Rate per 100 children 83.7 83.7 83.3 92.6 86.8 N/A 89.5 96.5 96.5 19.8 80.2 90.3 7.0
Total for 11-year-olds 429 350 350 349 400 369 *** 383 421 421 74 306 371 25Rate per 100 children 81.6 81.6 81.4 93.2 86.0 N/A 89.3 98.1 98.1 17.2 71.3 86.5 5.8
Age 17First Nations 129 63 63 60 98 78 *** 108 123 123 *** 97 *** 13Rate per 100 children 48.8 48.8 46.5 76.0 60.5 N/A 83.7 95.3 95.3 N/A 75.2 N/A 10.1
Non-First Nations 253 177 177 172 218 172 *** 233 249 249 *** 230 *** 14Rate per 100 children 70.0 70.0 68.0 86.2 68.0 N/A 92.1 98.4 98.4 N/A 90.9 N/A 5.5
Total for 17-year-olds 382 240 240 232 316 250 *** 341 372 372 *** 327 6 27Rate per 100 children 62.8 62.8 60.7 82.7 65.4 N/A 89.3 97.4 97.4 N/A 85.6 1.6 7.1

Manitoba Immunization Monitoring System Annual Report 2009 17
Report 1 – Complete for Age from Birth to 2009 by Immunogenand Region of ResidenceBurntwood
Pop Diphth Tet Pert Polio Hib PCV7 Measles Mumps Rubella V HB MC Inf
Age 1First Nations 962 624 624 624 842 624 618 24 24 24 20 10 15 20Rate per 100 children 64.9 64.9 64.9 87.5 64.9 64.2 2.5 2.5 2.5 2.1 1.0 1.6 2.1
Non-First Nations 358 277 277 276 320 276 276 5 *** *** 5 11 7 23Rate per 100 children 77.4 77.4 77.1 89.4 77.1 77.1 1.4 N/A N/A 1.4 3.1 2.0 6.4
Total for 1-year-olds 1,320 901 901 900 1,162 900 894 29 28 28 25 21 22 43Rate per 100 children 68.3 68.3 68.2 88.0 68.2 67.7 2.2 2.1 2.1 1.9 1.6 1.7 3.3
Age 2First Nations 936 577 577 577 824 575 572 845 845 845 800 11 78 37Rate per 100 children 61.6 61.6 61.6 88.0 61.4 61.1 90.3 90.3 90.3 85.5 1.2 8.3 4.0
Non-First Nations 350 269 269 269 327 267 264 324 324 324 305 13 19 54Rate per 100 children 76.9 76.9 76.9 93.4 76.3 75.4 92.6 92.6 92.6 87.1 3.7 5.4 15.4
Total for 2-year-olds 1,286 846 846 846 1,151 842 836 1,169 1,169 1,169 1,105 24 97 91Rate per 100 children 65.8 65.8 65.8 89.5 65.5 65.0 90.9 90.9 90.9 85.9 1.9 7.5 7.1
Age 7First Nations 675 398 398 397 576 455 *** 510 648 648 147 5 *** 20Rate per 100 children 59.0 59.0 58.8 85.3 67.4 N/A 75.6 96.0 96.0 21.8 0.7 N/A 3.0
Non-First Nations 251 189 189 189 243 212 *** 220 251 251 106 8 6 32Rate per 100 children 75.3 75.3 75.3 96.8 84.5 N/A 87.6 100.0 100.0 42.2 3.2 2.4 12.7
Total for 7-year-olds 926 587 587 586 819 667 *** 730 899 899 253 13 8 52Rate per 100 children 63.4 63.4 63.3 88.4 72.0 N/A 78.8 97.1 97.1 27.3 1.4 0.9 5.6
Age 11First Nations 652 357 357 355 510 406 *** 455 617 617 116 355 504 23Rate per 100 children 54.8 54.8 54.4 78.2 62.3 N/A 69.8 94.6 94.6 17.8 54.4 77.3 3.5
Non-First Nations 298 230 230 229 273 247 *** 255 289 289 68 220 250 33Rate per 100 children 77.2 77.2 76.8 91.6 82.9 N/A 85.6 97.0 97.0 22.8 73.8 83.9 11.1
Total for 11-year-olds 950 587 587 584 783 653 *** 710 906 906 184 575 754 56Rate per 100 children 61.8 61.8 61.5 82.4 68.7 N/A 74.7 95.4 95.4 19.4 60.5 79.4 5.9
Age 17First Nations 664 269 265 247 371 260 *** 375 612 613 *** 352 7 18Rate per 100 children 40.5 39.9 37.2 55.9 39.2 N/A 56.5 92.2 92.3 N/A 53.0 1.1 2.7
Non-First Nations 252 165 165 153 207 144 *** 214 239 239 *** 199 9 20Rate per 100 children 65.5 65.5 60.7 82.1 57.1 N/A 84.9 94.8 94.8 N/A 79.0 3.6 7.9
Total for 17-year-olds 916 434 430 400 578 404 *** 589 851 852 5 551 16 38Rate per 100 children 47.4 46.9 43.7 63.1 44.1 N/A 64.3 92.9 93.0 0.5 60.2 1.7 4.1
Manitoba Immunization Monitoring System Annual Report 200918
Report 1 – Complete for Age from Birth to 2009 by Immunogenand Region of ResidenceChurchill
Pop Diphth Tet Pert Polio Hib PCV7 Measles Mumps Rubella V HB MC Inf
Age 1First Nations *** *** *** *** *** *** *** *** *** *** *** *** *** ***Rate per 100 children N/A N/A N/A N/A N/A N/A N/A N/A N/A N/A N/A N/A N/A
Non-First Nations 15 14 14 14 14 14 14 *** *** *** *** *** *** ***Rate per 100 children 93.3 93.3 93.3 93.3 93.3 93.3 N/A N/A N/A N/A N/A N/A N/A
Total for 1-year-olds 15 14 14 14 14 14 14 *** *** *** *** *** *** ***Rate per 100 children 93.3 93.3 93.3 93.3 93.3 93.3 N/A N/A N/A N/A N/A N/A N/A
Age 2First Nations 4 *** *** *** *** *** *** *** *** *** *** *** *** ***Rate per 100 children N/A N/A N/A N/A N/A N/A N/A N/A N/A N/A N/A N/A N/A
Non-First Nations 12 11 11 11 11 11 10 11 11 11 11 *** *** 5Rate per 100 children 91.7 91.7 91.7 91.7 91.7 83.3 91.7 91.7 91.7 91.7 N/A N/A 41.7
Total for 2-year-olds 16 14 14 14 15 14 13 14 14 14 15 *** *** 5Rate per 100 children 87.5 87.5 87.5 93.8 87.5 81.3 87.5 87.5 87.5 93.8 N/A N/A 31.3
Age 7First Nations 3 *** *** *** *** *** *** *** *** *** *** *** *** ***Rate per 100 children N/A N/A N/A N/A N/A N/A N/A N/A N/A N/A N/A N/A N/A
Non-First Nations 9 11 11 11 11 11 *** 11 11 11 11 *** *** ***Rate per 100 children 122.2 122.2 122.2 122.2 122.2 N/A 122.2 122.2 122.2 122.2 N/A N/A N/A
Total for 7-year-olds 12 14 14 14 14 14 *** 14 14 14 14 *** *** ***Rate per 100 children 116.7 116.7 116.7 116.7 116.7 N/A 116.7 116.7 116.7 116.7 N/A N/A N/A
Age 11First Nations 1 *** *** *** *** *** *** *** *** *** *** *** *** ***Rate per 100 children N/A N/A N/A N/A N/A N/A N/A N/A N/A N/A N/A N/A N/A
Non-First Nations 11 7 7 7 7 7 *** 7 7 7 *** 8 7 ***Rate per 100 children 63.6 63.6 63.6 63.6 63.6 N/A 63.6 63.6 63.6 N/A 72.7 63.6 N/A
Total for 11-year-olds 12 8 8 8 8 8 *** 8 8 8 *** 8 8 ***Rate per 100 children 66.7 66.7 66.7 66.7 66.7 N/A 66.7 66.7 66.7 N/A 66.7 66.7 N/A
Age 17First Nations 4 *** *** *** *** *** *** *** *** *** *** *** *** ***Rate per 100 children N/A N/A N/A N/A N/A N/A N/A N/A N/A N/A N/A N/A N/A
Non-First Nations 10 8 8 7 9 6 *** 7 10 10 *** 8 *** ***Rate per 100 children 80.0 80.0 70.0 90.0 60.0 N/A 70.0 100.0 100.0 N/A 80.0 N/A N/A
Total for 17-year-olds 14 10 10 9 11 9 *** 10 14 14 *** 11 *** ***Rate per 100 children 71.4 71.4 64.3 78.6 64.3 N/A 71.4 100.0 100.0 N/A 78.6 N/A N/A
Manitoba Immunization Monitoring System Annual Report 2009 19
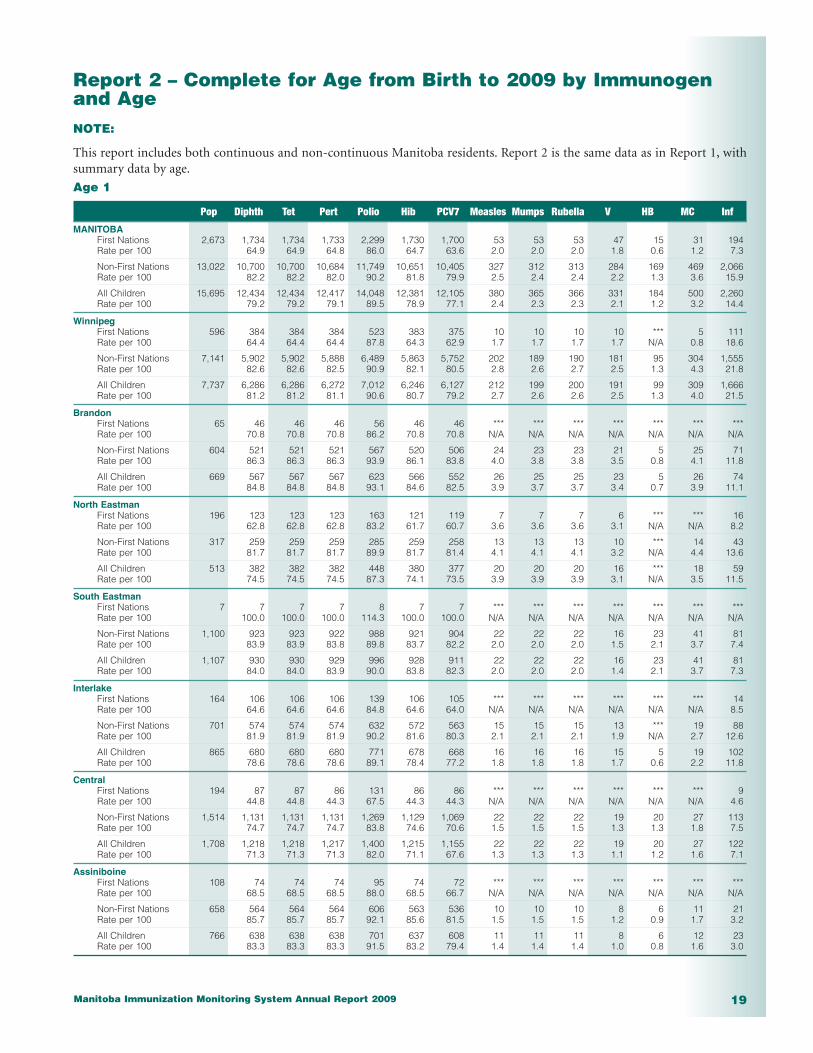
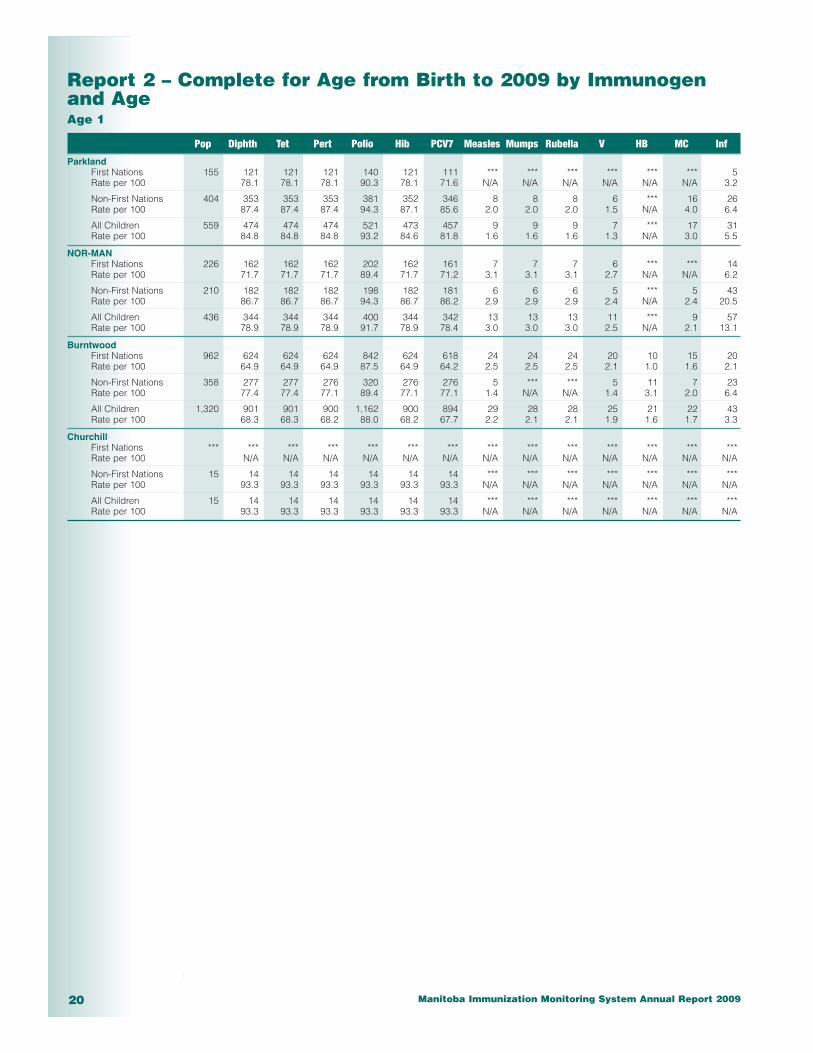
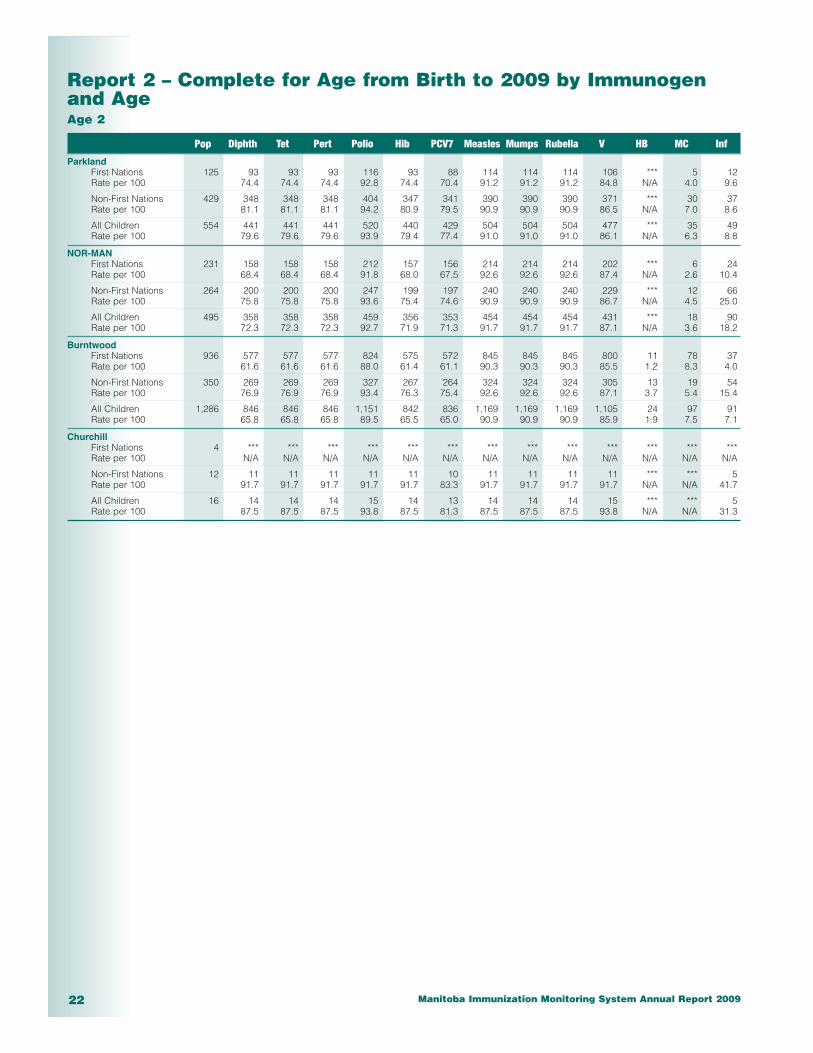
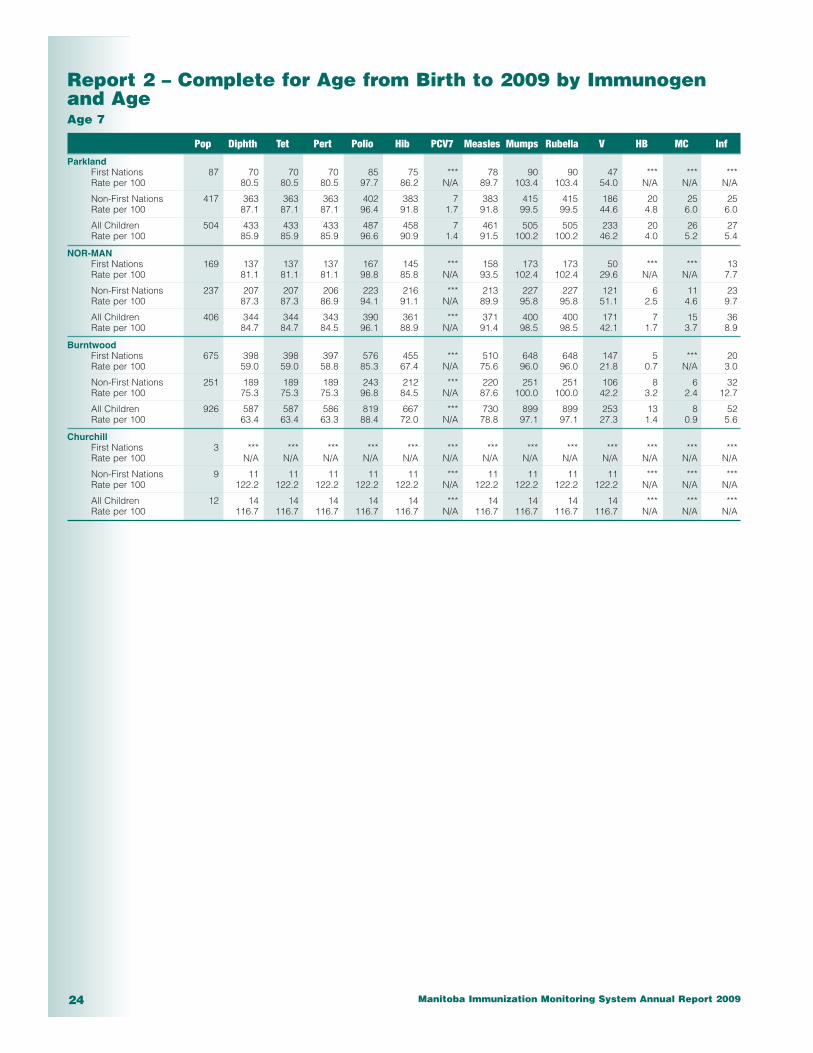
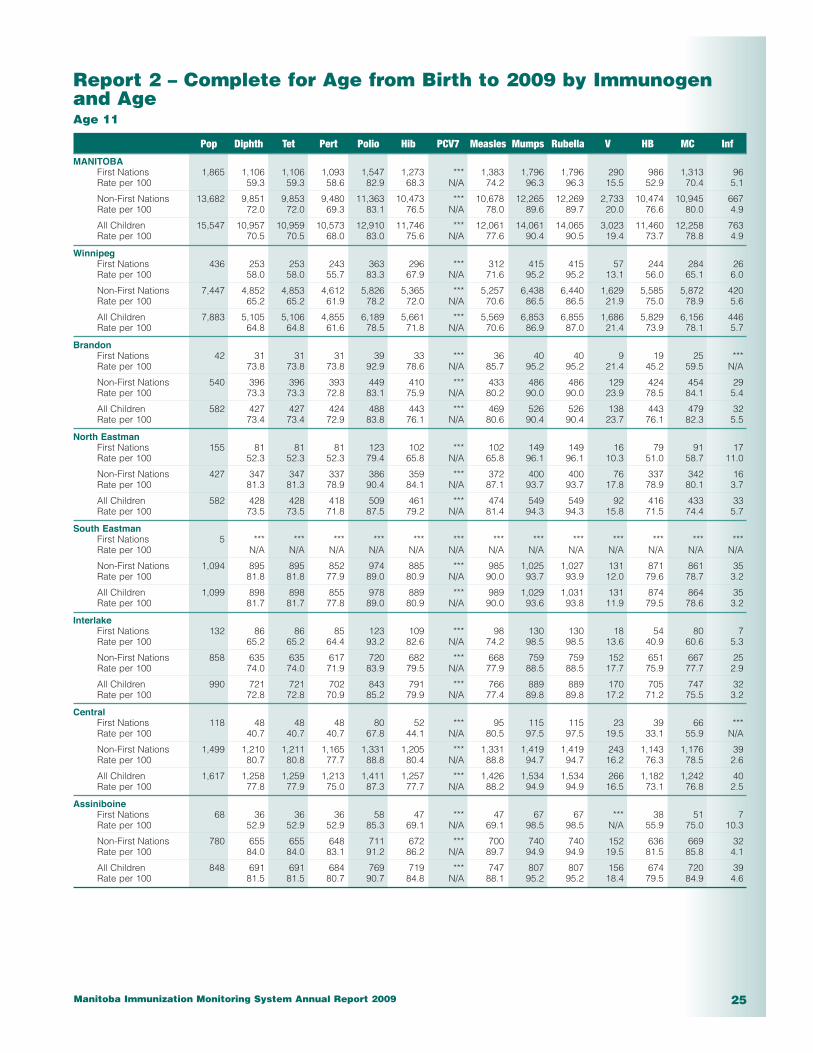
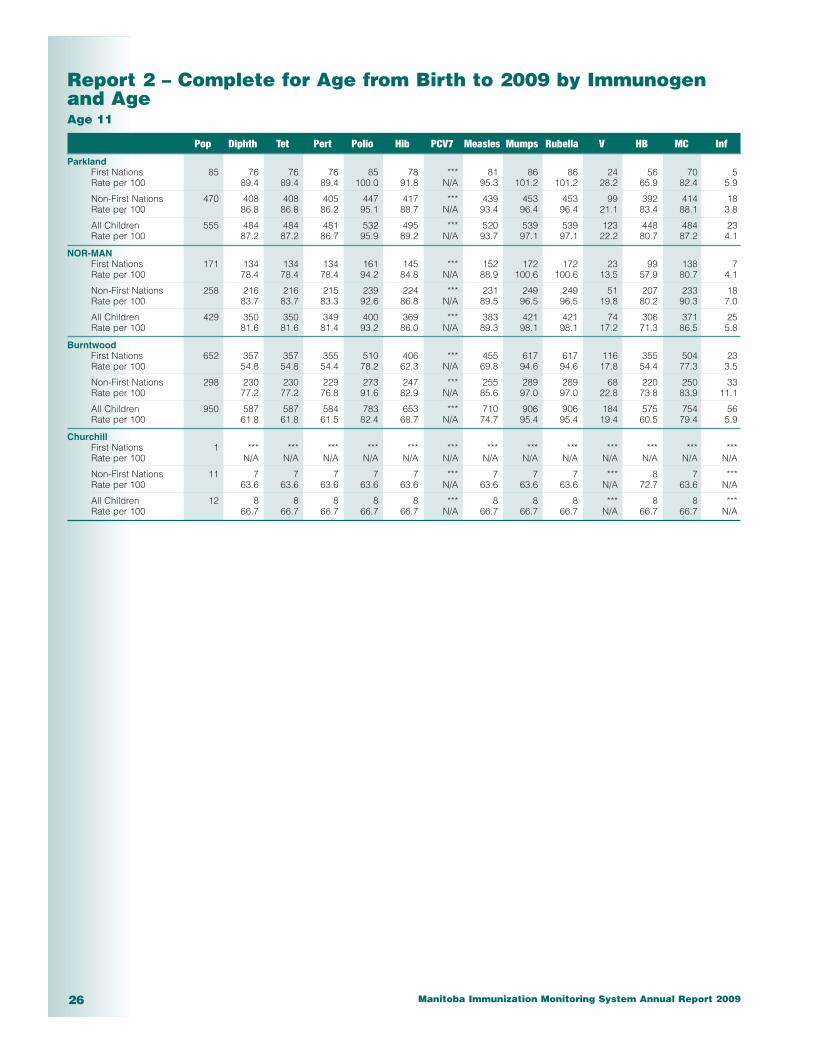
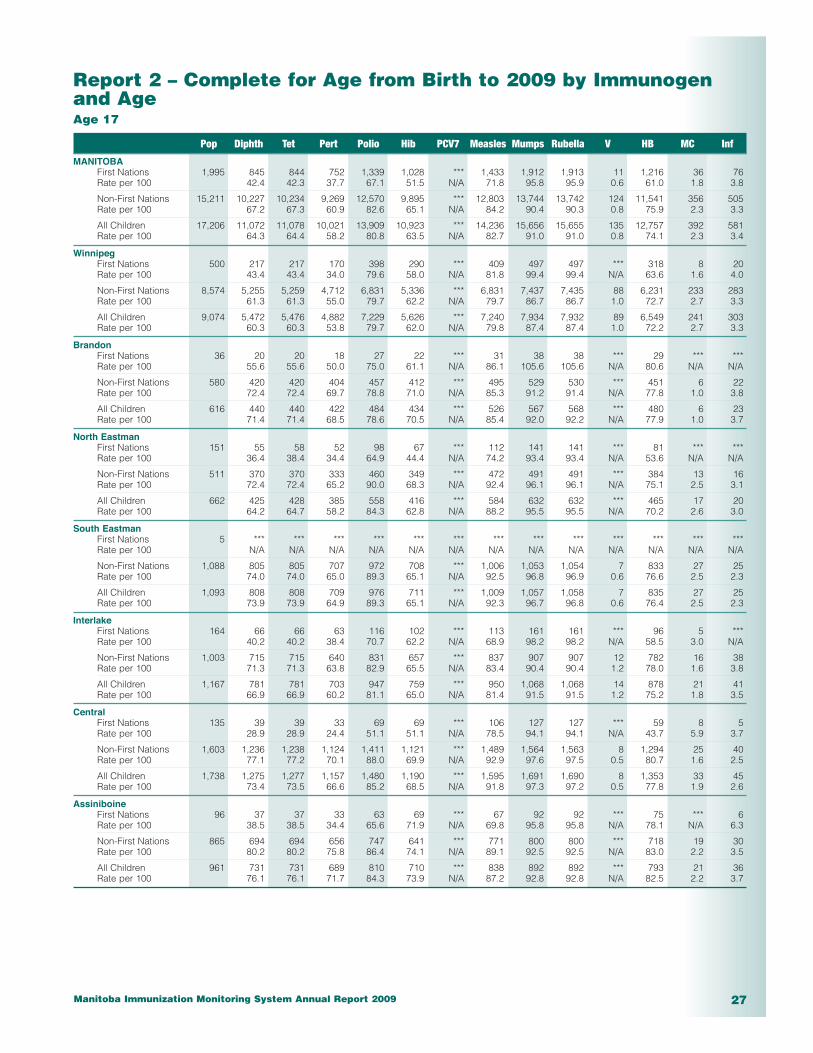
Report 2 – Complete for Age from Birth to 2009 by Immunogenand AgeNOTE:
This report includes both continuous and non-continuous Manitoba residents. Report 2 is the same data as in Report 1, withsummary data by age.
Age 1
Pop Diphth Tet Pert Polio Hib PCV7 Measles Mumps Rubella V HB MC Inf
MANITOBAFirst Nations 2,673 1,734 1,734 1,733 2,299 1,730 1,700 53 53 53 47 15 31 194Rate per 100 64.9 64.9 64.8 86.0 64.7 63.6 2.0 2.0 2.0 1.8 0.6 1.2 7.3
Non-First Nations 13,022 10,700 10,700 10,684 11,749 10,651 10,405 327 312 313 284 169 469 2,066Rate per 100 82.2 82.2 82.0 90.2 81.8 79.9 2.5 2.4 2.4 2.2 1.3 3.6 15.9
All Children 15,695 12,434 12,434 12,417 14,048 12,381 12,105 380 365 366 331 184 500 2,260Rate per 100 79.2 79.2 79.1 89.5 78.9 77.1 2.4 2.3 2.3 2.1 1.2 3.2 14.4
WinnipegFirst Nations 596 384 384 384 523 383 375 10 10 10 10 *** 5 111Rate per 100 64.4 64.4 64.4 87.8 64.3 62.9 1.7 1.7 1.7 1.7 N/A 0.8 18.6
Non-First Nations 7,141 5,902 5,902 5,888 6,489 5,863 5,752 202 189 190 181 95 304 1,555Rate per 100 82.6 82.6 82.5 90.9 82.1 80.5 2.8 2.6 2.7 2.5 1.3 4.3 21.8
All Children 7,737 6,286 6,286 6,272 7,012 6,246 6,127 212 199 200 191 99 309 1,666Rate per 100 81.2 81.2 81.1 90.6 80.7 79.2 2.7 2.6 2.6 2.5 1.3 4.0 21.5
BrandonFirst Nations 65 46 46 46 56 46 46 *** *** *** *** *** *** ***Rate per 100 70.8 70.8 70.8 86.2 70.8 70.8 N/A N/A N/A N/A N/A N/A N/A
Non-First Nations 604 521 521 521 567 520 506 24 23 23 21 5 25 71Rate per 100 86.3 86.3 86.3 93.9 86.1 83.8 4.0 3.8 3.8 3.5 0.8 4.1 11.8
All Children 669 567 567 567 623 566 552 26 25 25 23 5 26 74Rate per 100 84.8 84.8 84.8 93.1 84.6 82.5 3.9 3.7 3.7 3.4 0.7 3.9 11.1
North EastmanFirst Nations 196 123 123 123 163 121 119 7 7 7 6 *** *** 16Rate per 100 62.8 62.8 62.8 83.2 61.7 60.7 3.6 3.6 3.6 3.1 N/A N/A 8.2
Non-First Nations 317 259 259 259 285 259 258 13 13 13 10 *** 14 43Rate per 100 81.7 81.7 81.7 89.9 81.7 81.4 4.1 4.1 4.1 3.2 N/A 4.4 13.6
All Children 513 382 382 382 448 380 377 20 20 20 16 *** 18 59Rate per 100 74.5 74.5 74.5 87.3 74.1 73.5 3.9 3.9 3.9 3.1 N/A 3.5 11.5
South EastmanFirst Nations 7 7 7 7 8 7 7 *** *** *** *** *** *** ***Rate per 100 100.0 100.0 100.0 114.3 100.0 100.0 N/A N/A N/A N/A N/A N/A N/A
Non-First Nations 1,100 923 923 922 988 921 904 22 22 22 16 23 41 81Rate per 100 83.9 83.9 83.8 89.8 83.7 82.2 2.0 2.0 2.0 1.5 2.1 3.7 7.4
All Children 1,107 930 930 929 996 928 911 22 22 22 16 23 41 81Rate per 100 84.0 84.0 83.9 90.0 83.8 82.3 2.0 2.0 2.0 1.4 2.1 3.7 7.3
InterlakeFirst Nations 164 106 106 106 139 106 105 *** *** *** *** *** *** 14Rate per 100 64.6 64.6 64.6 84.8 64.6 64.0 N/A N/A N/A N/A N/A N/A 8.5
Non-First Nations 701 574 574 574 632 572 563 15 15 15 13 *** 19 88Rate per 100 81.9 81.9 81.9 90.2 81.6 80.3 2.1 2.1 2.1 1.9 N/A 2.7 12.6
All Children 865 680 680 680 771 678 668 16 16 16 15 5 19 102Rate per 100 78.6 78.6 78.6 89.1 78.4 77.2 1.8 1.8 1.8 1.7 0.6 2.2 11.8
CentralFirst Nations 194 87 87 86 131 86 86 *** *** *** *** *** *** 9Rate per 100 44.8 44.8 44.3 67.5 44.3 44.3 N/A N/A N/A N/A N/A N/A 4.6
Non-First Nations 1,514 1,131 1,131 1,131 1,269 1,129 1,069 22 22 22 19 20 27 113Rate per 100 74.7 74.7 74.7 83.8 74.6 70.6 1.5 1.5 1.5 1.3 1.3 1.8 7.5
All Children 1,708 1,218 1,218 1,217 1,400 1,215 1,155 22 22 22 19 20 27 122Rate per 100 71.3 71.3 71.3 82.0 71.1 67.6 1.3 1.3 1.3 1.1 1.2 1.6 7.1
AssiniboineFirst Nations 108 74 74 74 95 74 72 *** *** *** *** *** *** ***Rate per 100 68.5 68.5 68.5 88.0 68.5 66.7 N/A N/A N/A N/A N/A N/A N/A
Non-First Nations 658 564 564 564 606 563 536 10 10 10 8 6 11 21Rate per 100 85.7 85.7 85.7 92.1 85.6 81.5 1.5 1.5 1.5 1.2 0.9 1.7 3.2
All Children 766 638 638 638 701 637 608 11 11 11 8 6 12 23Rate per 100 83.3 83.3 83.3 91.5 83.2 79.4 1.4 1.4 1.4 1.0 0.8 1.6 3.0
Manitoba Immunization Monitoring System Annual Report 200920
Report 2 – Complete for Age from Birth to 2009 by Immunogenand AgeAge 1
Pop Diphth Tet Pert Polio Hib PCV7 Measles Mumps Rubella V HB MC Inf
ParklandFirst Nations 155 121 121 121 140 121 111 *** *** *** *** *** *** 5Rate per 100 78.1 78.1 78.1 90.3 78.1 71.6 N/A N/A N/A N/A N/A N/A 3.2
Non-First Nations 404 353 353 353 381 352 346 8 8 8 6 *** 16 26Rate per 100 87.4 87.4 87.4 94.3 87.1 85.6 2.0 2.0 2.0 1.5 N/A 4.0 6.4
All Children 559 474 474 474 521 473 457 9 9 9 7 *** 17 31Rate per 100 84.8 84.8 84.8 93.2 84.6 81.8 1.6 1.6 1.6 1.3 N/A 3.0 5.5
NOR-MANFirst Nations 226 162 162 162 202 162 161 7 7 7 6 *** *** 14Rate per 100 71.7 71.7 71.7 89.4 71.7 71.2 3.1 3.1 3.1 2.7 N/A N/A 6.2
Non-First Nations 210 182 182 182 198 182 181 6 6 6 5 *** 5 43Rate per 100 86.7 86.7 86.7 94.3 86.7 86.2 2.9 2.9 2.9 2.4 N/A 2.4 20.5
All Children 436 344 344 344 400 344 342 13 13 13 11 *** 9 57Rate per 100 78.9 78.9 78.9 91.7 78.9 78.4 3.0 3.0 3.0 2.5 N/A 2.1 13.1
BurntwoodFirst Nations 962 624 624 624 842 624 618 24 24 24 20 10 15 20Rate per 100 64.9 64.9 64.9 87.5 64.9 64.2 2.5 2.5 2.5 2.1 1.0 1.6 2.1
Non-First Nations 358 277 277 276 320 276 276 5 *** *** 5 11 7 23Rate per 100 77.4 77.4 77.1 89.4 77.1 77.1 1.4 N/A N/A 1.4 3.1 2.0 6.4
All Children 1,320 901 901 900 1,162 900 894 29 28 28 25 21 22 43Rate per 100 68.3 68.3 68.2 88.0 68.2 67.7 2.2 2.1 2.1 1.9 1.6 1.7 3.3
ChurchillFirst Nations *** *** *** *** *** *** *** *** *** *** *** *** *** ***Rate per 100 N/A N/A N/A N/A N/A N/A N/A N/A N/A N/A N/A N/A N/A
Non-First Nations 15 14 14 14 14 14 14 *** *** *** *** *** *** ***Rate per 100 93.3 93.3 93.3 93.3 93.3 93.3 N/A N/A N/A N/A N/A N/A N/A
All Children 15 14 14 14 14 14 14 *** *** *** *** *** *** ***Rate per 100 93.3 93.3 93.3 93.3 93.3 93.3 N/A N/A N/A N/A N/A N/A N/A

Manitoba Immunization Monitoring System Annual Report 2009 21
Report 2 – Complete for Age from Birth to 2009 by Immunogenand AgeAge 2
Pop Diphth Tet Pert Polio Hib PCV7 Measles Mumps Rubella V HB MC Inf
MANITOBAFirst Nations 2,575 1,494 1,494 1,494 2,196 1,487 1,475 2,198 2,198 2,198 2,038 22 173 265Rate per 100 58.0 58.0 58.0 85.3 57.7 57.3 85.4 85.4 85.4 79.1 0.9 6.7 10.3
Non-First Nations 13,177 9,772 9,772 9,765 11,739 9,702 9,359 11,531 11,523 11,521 10,525 381 1,091 2,776Rate per 100 74.2 74.2 74.1 89.1 73.6 71.0 87.5 87.4 87.4 79.9 2.9 8.3 21.1
All Children 15,752 11,266 11,266 11,259 13,935 11,189 10,834 13,729 13,721 13,719 12,563 403 1,264 3,041Rate per 100 71.5 71.5 71.5 88.5 71.0 68.8 87.2 87.1 87.1 79.8 2.6 8.0 19.3
WinnipegFirst Nations 627 354 354 354 551 352 351 535 535 535 498 9 48 144Rate per 100 56.5 56.5 56.5 87.9 56.1 56.0 85.3 85.3 85.3 79.4 1.4 7.7 23.0
Non-First Nations 7,124 5,337 5,337 5,331 6,345 5,293 5,129 6,266 6,262 6,262 5,862 226 718 2,006Rate per 100 74.9 74.9 74.8 89.1 74.3 72.0 88.0 87.9 87.9 82.3 3.2 10.1 28.2
All Children 7,751 5,691 5,691 5,685 6,896 5,645 5,480 6,801 6,797 6,797 6,360 235 766 2,150Rate per 100 73.4 73.4 73.3 89.0 72.8 70.7 87.7 87.7 87.7 82.1 3.0 9.9 27.7
BrandonFirst Nations 58 27 27 27 39 27 26 39 39 39 36 *** *** ***Rate per 100 46.6 46.6 46.6 67.2 46.6 44.8 67.2 67.2 67.2 62.1 N/A N/A N/A
Non-First Nations 666 484 484 484 612 475 455 594 592 590 554 15 27 97Rate per 100 72.7 72.7 72.7 91.9 71.3 68.3 89.2 88.9 88.6 83.2 2.3 4.1 14.6
All Children 724 511 511 511 651 502 481 633 631 629 590 15 28 100Rate per 100 70.6 70.6 70.6 89.9 69.3 66.4 87.4 87.2 86.9 81.5 2.1 3.9 13.8
North EastmanFirst Nations 156 81 81 81 116 81 79 118 118 118 110 *** 12 20Rate per 100 51.9 51.9 51.9 74.4 51.9 50.6 75.6 75.6 75.6 70.5 N/A 7.7 12.8
Non-First Nations 365 253 253 253 319 251 251 316 316 316 280 7 36 62Rate per 100 69.3 69.3 69.3 87.4 68.8 68.8 86.6 86.6 86.6 76.7 1.9 9.9 17.0
All Children 521 334 334 334 435 332 330 434 434 434 390 7 48 82Rate per 100 64.1 64.1 64.1 83.5 63.7 63.3 83.3 83.3 83.3 74.9 1.3 9.2 15.7
South EastmanFirst Nations 8 8 8 8 8 7 8 8 8 8 8 *** *** ***Rate per 100 100.0 100.0 100.0 100.0 87.5 100.0 100.0 100.0 100.0 100.0 N/A N/A N/A
Non-First Nations 1,040 783 783 783 936 780 747 909 908 908 795 30 107 122Rate per 100 75.3 75.3 75.3 90.0 75.0 71.8 87.4 87.3 87.3 76.4 2.9 10.3 11.7
All Children 1,048 791 791 791 944 787 755 917 916 916 803 30 108 124Rate per 100 75.5 75.5 75.5 90.1 75.1 72.0 87.5 87.4 87.4 76.6 2.9 10.3 11.8
InterlakeFirst Nations 156 79 79 79 123 79 80 118 118 118 84 *** 13 10Rate per 100 50.6 50.6 50.6 78.8 50.6 51.3 75.6 75.6 75.6 53.8 N/A 8.3 6.4
Non-First Nations 754 549 549 549 653 547 528 645 645 645 588 9 51 114Rate per 100 72.8 72.8 72.8 86.6 72.5 70.0 85.5 85.5 85.5 78.0 1.2 6.8 15.1
All Children 910 628 628 628 776 626 608 763 763 763 672 10 64 124Rate per 100 69.0 69.0 69.0 85.3 68.8 66.8 83.8 83.8 83.8 73.8 1.1 7.0 13.6
CentralFirst Nations 175 57 57 57 123 57 55 126 126 126 116 *** 6 10Rate per 100 32.6 32.6 32.6 70.3 32.6 31.4 72.0 72.0 72.0 66.3 N/A 3.4 5.7
Non-First Nations 1,455 959 959 958 1,215 955 889 1,185 1,185 1,185 967 66 61 155Rate per 100 65.9 65.9 65.8 83.5 65.6 61.1 81.4 81.4 81.4 66.5 4.5 4.2 10.7
All Children 1,630 1,016 1,016 1,015 1,338 1,012 944 1,311 1,311 1,311 1,083 66 67 165Rate per 100 62.3 62.3 62.3 82.1 62.1 57.9 80.4 80.4 80.4 66.4 4.0 4.1 10.1
AssiniboineFirst Nations 99 57 57 57 80 56 57 78 78 78 74 *** *** ***Rate per 100 57.6 57.6 57.6 80.8 56.6 57.6 78.8 78.8 78.8 74.7 N/A N/A N/A
Non-First Nations 718 579 579 579 670 577 548 651 650 650 563 10 29 58Rate per 100 80.6 80.6 80.6 93.3 80.4 76.3 90.7 90.5 90.5 78.4 1.4 4.0 8.1
All Children 817 636 636 636 750 633 605 729 728 728 637 10 32 61Rate per 100 77.8 77.8 77.8 91.8 77.5 74.1 89.2 89.1 89.1 78.0 1.2 3.9 7.5
Manitoba Immunization Monitoring System Annual Report 200922
Report 2 – Complete for Age from Birth to 2009 by Immunogenand AgeAge 2
Pop Diphth Tet Pert Polio Hib PCV7 Measles Mumps Rubella V HB MC Inf
ParklandFirst Nations 125 93 93 93 116 93 88 114 114 114 106 *** 5 12Rate per 100 74.4 74.4 74.4 92.8 74.4 70.4 91.2 91.2 91.2 84.8 N/A 4.0 9.6
Non-First Nations 429 348 348 348 404 347 341 390 390 390 371 *** 30 37Rate per 100 81.1 81.1 81.1 94.2 80.9 79.5 90.9 90.9 90.9 86.5 N/A 7.0 8.6
All Children 554 441 441 441 520 440 429 504 504 504 477 *** 35 49Rate per 100 79.6 79.6 79.6 93.9 79.4 77.4 91.0 91.0 91.0 86.1 N/A 6.3 8.8
NOR-MANFirst Nations 231 158 158 158 212 157 156 214 214 214 202 *** 6 24Rate per 100 68.4 68.4 68.4 91.8 68.0 67.5 92.6 92.6 92.6 87.4 N/A 2.6 10.4
Non-First Nations 264 200 200 200 247 199 197 240 240 240 229 *** 12 66Rate per 100 75.8 75.8 75.8 93.6 75.4 74.6 90.9 90.9 90.9 86.7 N/A 4.5 25.0
All Children 495 358 358 358 459 356 353 454 454 454 431 *** 18 90Rate per 100 72.3 72.3 72.3 92.7 71.9 71.3 91.7 91.7 91.7 87.1 N/A 3.6 18.2
BurntwoodFirst Nations 936 577 577 577 824 575 572 845 845 845 800 11 78 37Rate per 100 61.6 61.6 61.6 88.0 61.4 61.1 90.3 90.3 90.3 85.5 1.2 8.3 4.0
Non-First Nations 350 269 269 269 327 267 264 324 324 324 305 13 19 54Rate per 100 76.9 76.9 76.9 93.4 76.3 75.4 92.6 92.6 92.6 87.1 3.7 5.4 15.4
All Children 1,286 846 846 846 1,151 842 836 1,169 1,169 1,169 1,105 24 97 91Rate per 100 65.8 65.8 65.8 89.5 65.5 65.0 90.9 90.9 90.9 85.9 1.9 7.5 7.1
ChurchillFirst Nations 4 *** *** *** *** *** *** *** *** *** *** *** *** ***Rate per 100 N/A N/A N/A N/A N/A N/A N/A N/A N/A N/A N/A N/A N/A
Non-First Nations 12 11 11 11 11 11 10 11 11 11 11 *** *** 5Rate per 100 91.7 91.7 91.7 91.7 91.7 83.3 91.7 91.7 91.7 91.7 N/A N/A 41.7
All Children 16 14 14 14 15 14 13 14 14 14 15 *** *** 5Rate per 100 87.5 87.5 87.5 93.8 87.5 81.3 87.5 87.5 87.5 93.8 N/A N/A 31.3

Manitoba Immunization Monitoring System Annual Report 2009 23
Report 2 – Complete for Age from Birth to 2009 by Immunogenand AgeAge 7
Pop Diphth Tet Pert Polio Hib PCV7 Measles Mumps Rubella V HB MC Inf
MANITOBAFirst Nations 1,965 1,258 1,258 1,254 1,745 1,459 6 1,529 1,918 1,918 535 11 23 90Rate per 100 64.0 64.0 63.8 88.8 74.2 0.3 77.8 97.6 97.6 27.2 0.6 1.2 4.6
Non-First Nations 12,869 9,410 9,410 9,348 11,055 10,204 466 10,175 11,853 11,853 5,492 833 917 873Rate per 100 73.1 73.1 72.6 85.9 79.3 3.6 79.1 92.1 92.1 42.7 6.5 7.1 6.8
All Children 14,834 10,668 10,668 10,602 12,800 11,663 472 11,704 13,771 13,771 6,027 844 940 963Rate per 100 71.9 71.9 71.5 86.3 78.6 3.2 78.9 92.8 92.8 40.6 5.7 6.3 6.5
WinnipegFirst Nations 474 278 278 276 415 353 *** 333 463 463 126 *** *** 31Rate per 100 58.6 58.6 58.2 87.6 74.5 N/A 70.3 97.7 97.7 26.6 N/A N/A 6.5
Non-First Nations 7,046 4,788 4,787 4,750 5,761 5,289 322 5,190 6,371 6,369 3,166 438 558 543Rate per 100 68.0 67.9 67.4 81.8 75.1 4.6 73.7 90.4 90.4 44.9 6.2 7.9 7.7
All Children 7,520 5,066 5,065 5,026 6,176 5,642 325 5,523 6,834 6,832 3,292 440 562 574Rate per 100 67.4 67.4 66.8 82.1 75.0 4.3 73.4 90.9 90.9 43.8 5.9 7.5 7.6
BrandonFirst Nations 51 33 33 33 47 38 *** 43 49 49 15 *** *** ***Rate per 100 64.7 64.7 64.7 92.2 74.5 N/A 84.3 96.1 96.1 29.4 N/A N/A N/A
Non-First Nations 564 424 424 419 492 449 18 470 525 526 272 21 43 43Rate per 100 75.2 75.2 74.3 87.2 79.6 3.2 83.3 93.1 93.3 48.2 3.7 7.6 7.6
All Children 615 457 457 452 539 487 18 513 574 575 287 21 44 44Rate per 100 74.3 74.3 73.5 87.6 79.2 2.9 83.4 93.3 93.5 46.7 3.4 7.2 7.2
North EastmanFirst Nations 146 82 82 82 125 101 *** 104 138 138 38 *** *** 12Rate per 100 56.2 56.2 56.2 85.6 69.2 N/A 71.2 94.5 94.5 26.0 N/A N/A 8.2
Non-First Nations 377 317 317 316 363 334 9 345 374 374 154 23 24 22Rate per 100 84.1 84.1 83.8 96.3 88.6 2.4 91.5 99.2 99.2 40.8 6.1 6.4 5.8
All Children 523 399 399 398 488 435 10 449 512 512 192 23 24 34Rate per 100 76.3 76.3 76.1 93.3 83.2 1.9 85.9 97.9 97.9 36.7 4.4 4.6 6.5
South EastmanFirst Nations 8 9 9 9 11 9 *** 11 11 11 5 *** *** ***Rate per 100 112.5 112.5 112.5 137.5 112.5 N/A 137.5 137.5 137.5 62.5 N/A N/A N/A
Non-First Nations 1,046 890 890 885 977 919 34 942 1,006 1,006 399 122 82 39Rate per 100 85.1 85.1 84.6 93.4 87.9 3.3 90.1 96.2 96.2 38.1 11.7 7.8 3.7
All Children 1,054 899 899 894 988 928 34 953 1,017 1,017 404 122 82 39Rate per 100 85.3 85.3 84.8 93.7 88.0 3.2 90.4 96.5 96.5 38.3 11.6 7.8 3.7
InterlakeFirst Nations 128 90 90 90 109 97 *** 104 126 126 28 *** 9 5Rate per 100 70.3 70.3 70.3 85.2 75.8 N/A 81.3 98.4 98.4 21.9 N/A 7.0 3.9
Non-First Nations 788 564 564 561 684 629 21 615 716 716 328 20 44 55Rate per 100 71.6 71.6 71.2 86.8 79.8 2.7 78.0 90.9 90.9 41.6 2.5 5.6 7.0
All Children 916 654 654 651 793 726 21 719 842 842 356 21 53 60Rate per 100 71.4 71.4 71.1 86.6 79.3 2.3 78.5 91.9 91.9 38.9 2.3 5.8 6.6
CentralFirst Nations 145 97 97 96 133 115 *** 119 140 140 52 *** *** ***Rate per 100 66.9 66.9 66.2 91.7 79.3 N/A 82.1 96.6 96.6 35.9 N/A N/A N/A
Non-First Nations 1,459 1,111 1,112 1,103 1,293 1,186 34 1,203 1,334 1,335 460 150 79 57Rate per 100 76.1 76.2 75.6 88.6 81.3 2.3 82.5 91.4 91.5 31.5 10.3 5.4 3.9
All Children 1,604 1,208 1,209 1,199 1,426 1,301 35 1,322 1,474 1,475 512 152 80 59Rate per 100 75.3 75.4 74.8 88.9 81.1 2.2 82.4 91.9 92.0 31.9 9.5 5.0 3.7
AssiniboineFirst Nations 79 61 61 61 74 68 *** 66 77 77 24 *** *** ***Rate per 100 77.2 77.2 77.2 93.7 86.1 N/A 83.5 97.5 97.5 30.4 N/A N/A N/A
Non-First Nations 675 546 546 545 606 576 17 583 623 623 289 24 45 32Rate per 100 80.9 80.9 80.7 89.8 85.3 2.5 86.4 92.3 92.3 42.8 3.6 6.7 4.7
All Children 754 607 607 606 680 644 17 649 700 700 313 24 46 34Rate per 100 80.5 80.5 80.4 90.2 85.4 2.3 86.1 92.8 92.8 41.5 3.2 6.1 4.5
Manitoba Immunization Monitoring System Annual Report 200924
Report 2 – Complete for Age from Birth to 2009 by Immunogenand AgeAge 7
Pop Diphth Tet Pert Polio Hib PCV7 Measles Mumps Rubella V HB MC Inf
ParklandFirst Nations 87 70 70 70 85 75 *** 78 90 90 47 *** *** ***Rate per 100 80.5 80.5 80.5 97.7 86.2 N/A 89.7 103.4 103.4 54.0 N/A N/A N/A
Non-First Nations 417 363 363 363 402 383 7 383 415 415 186 20 25 25Rate per 100 87.1 87.1 87.1 96.4 91.8 1.7 91.8 99.5 99.5 44.6 4.8 6.0 6.0
All Children 504 433 433 433 487 458 7 461 505 505 233 20 26 27Rate per 100 85.9 85.9 85.9 96.6 90.9 1.4 91.5 100.2 100.2 46.2 4.0 5.2 5.4
NOR-MANFirst Nations 169 137 137 137 167 145 *** 158 173 173 50 *** *** 13Rate per 100 81.1 81.1 81.1 98.8 85.8 N/A 93.5 102.4 102.4 29.6 N/A N/A 7.7
Non-First Nations 237 207 207 206 223 216 *** 213 227 227 121 6 11 23Rate per 100 87.3 87.3 86.9 94.1 91.1 N/A 89.9 95.8 95.8 51.1 2.5 4.6 9.7
All Children 406 344 344 343 390 361 *** 371 400 400 171 7 15 36Rate per 100 84.7 84.7 84.5 96.1 88.9 N/A 91.4 98.5 98.5 42.1 1.7 3.7 8.9
BurntwoodFirst Nations 675 398 398 397 576 455 *** 510 648 648 147 5 *** 20Rate per 100 59.0 59.0 58.8 85.3 67.4 N/A 75.6 96.0 96.0 21.8 0.7 N/A 3.0
Non-First Nations 251 189 189 189 243 212 *** 220 251 251 106 8 6 32Rate per 100 75.3 75.3 75.3 96.8 84.5 N/A 87.6 100.0 100.0 42.2 3.2 2.4 12.7
All Children 926 587 587 586 819 667 *** 730 899 899 253 13 8 52Rate per 100 63.4 63.4 63.3 88.4 72.0 N/A 78.8 97.1 97.1 27.3 1.4 0.9 5.6
ChurchillFirst Nations 3 *** *** *** *** *** *** *** *** *** *** *** *** ***Rate per 100 N/A N/A N/A N/A N/A N/A N/A N/A N/A N/A N/A N/A N/A
Non-First Nations 9 11 11 11 11 11 *** 11 11 11 11 *** *** ***Rate per 100 122.2 122.2 122.2 122.2 122.2 N/A 122.2 122.2 122.2 122.2 N/A N/A N/A
All Children 12 14 14 14 14 14 *** 14 14 14 14 *** *** ***Rate per 100 116.7 116.7 116.7 116.7 116.7 N/A 116.7 116.7 116.7 116.7 N/A N/A N/A
Manitoba Immunization Monitoring System Annual Report 2009 25
Report 2 – Complete for Age from Birth to 2009 by Immunogenand AgeAge 11
Pop Diphth Tet Pert Polio Hib PCV7 Measles Mumps Rubella V HB MC Inf
MANITOBAFirst Nations 1,865 1,106 1,106 1,093 1,547 1,273 *** 1,383 1,796 1,796 290 986 1,313 96Rate per 100 59.3 59.3 58.6 82.9 68.3 N/A 74.2 96.3 96.3 15.5 52.9 70.4 5.1
Non-First Nations 13,682 9,851 9,853 9,480 11,363 10,473 *** 10,678 12,265 12,269 2,733 10,474 10,945 667Rate per 100 72.0 72.0 69.3 83.1 76.5 N/A 78.0 89.6 89.7 20.0 76.6 80.0 4.9
All Children 15,547 10,957 10,959 10,573 12,910 11,746 *** 12,061 14,061 14,065 3,023 11,460 12,258 763Rate per 100 70.5 70.5 68.0 83.0 75.6 N/A 77.6 90.4 90.5 19.4 73.7 78.8 4.9
WinnipegFirst Nations 436 253 253 243 363 296 *** 312 415 415 57 244 284 26Rate per 100 58.0 58.0 55.7 83.3 67.9 N/A 71.6 95.2 95.2 13.1 56.0 65.1 6.0
Non-First Nations 7,447 4,852 4,853 4,612 5,826 5,365 *** 5,257 6,438 6,440 1,629 5,585 5,872 420Rate per 100 65.2 65.2 61.9 78.2 72.0 N/A 70.6 86.5 86.5 21.9 75.0 78.9 5.6
All Children 7,883 5,105 5,106 4,855 6,189 5,661 *** 5,569 6,853 6,855 1,686 5,829 6,156 446Rate per 100 64.8 64.8 61.6 78.5 71.8 N/A 70.6 86.9 87.0 21.4 73.9 78.1 5.7
BrandonFirst Nations 42 31 31 31 39 33 *** 36 40 40 9 19 25 ***Rate per 100 73.8 73.8 73.8 92.9 78.6 N/A 85.7 95.2 95.2 21.4 45.2 59.5 N/A
Non-First Nations 540 396 396 393 449 410 *** 433 486 486 129 424 454 29Rate per 100 73.3 73.3 72.8 83.1 75.9 N/A 80.2 90.0 90.0 23.9 78.5 84.1 5.4
All Children 582 427 427 424 488 443 *** 469 526 526 138 443 479 32Rate per 100 73.4 73.4 72.9 83.8 76.1 N/A 80.6 90.4 90.4 23.7 76.1 82.3 5.5
North EastmanFirst Nations 155 81 81 81 123 102 *** 102 149 149 16 79 91 17Rate per 100 52.3 52.3 52.3 79.4 65.8 N/A 65.8 96.1 96.1 10.3 51.0 58.7 11.0
Non-First Nations 427 347 347 337 386 359 *** 372 400 400 76 337 342 16Rate per 100 81.3 81.3 78.9 90.4 84.1 N/A 87.1 93.7 93.7 17.8 78.9 80.1 3.7
All Children 582 428 428 418 509 461 *** 474 549 549 92 416 433 33Rate per 100 73.5 73.5 71.8 87.5 79.2 N/A 81.4 94.3 94.3 15.8 71.5 74.4 5.7
South EastmanFirst Nations 5 *** *** *** *** *** *** *** *** *** *** *** *** ***Rate per 100 N/A N/A N/A N/A N/A N/A N/A N/A N/A N/A N/A N/A N/A
Non-First Nations 1,094 895 895 852 974 885 *** 985 1,025 1,027 131 871 861 35Rate per 100 81.8 81.8 77.9 89.0 80.9 N/A 90.0 93.7 93.9 12.0 79.6 78.7 3.2
All Children 1,099 898 898 855 978 889 *** 989 1,029 1,031 131 874 864 35Rate per 100 81.7 81.7 77.8 89.0 80.9 N/A 90.0 93.6 93.8 11.9 79.5 78.6 3.2
InterlakeFirst Nations 132 86 86 85 123 109 *** 98 130 130 18 54 80 7Rate per 100 65.2 65.2 64.4 93.2 82.6 N/A 74.2 98.5 98.5 13.6 40.9 60.6 5.3
Non-First Nations 858 635 635 617 720 682 *** 668 759 759 152 651 667 25Rate per 100 74.0 74.0 71.9 83.9 79.5 N/A 77.9 88.5 88.5 17.7 75.9 77.7 2.9
All Children 990 721 721 702 843 791 *** 766 889 889 170 705 747 32Rate per 100 72.8 72.8 70.9 85.2 79.9 N/A 77.4 89.8 89.8 17.2 71.2 75.5 3.2
CentralFirst Nations 118 48 48 48 80 52 *** 95 115 115 23 39 66 ***Rate per 100 40.7 40.7 40.7 67.8 44.1 N/A 80.5 97.5 97.5 19.5 33.1 55.9 N/A
Non-First Nations 1,499 1,210 1,211 1,165 1,331 1,205 *** 1,331 1,419 1,419 243 1,143 1,176 39Rate per 100 80.7 80.8 77.7 88.8 80.4 N/A 88.8 94.7 94.7 16.2 76.3 78.5 2.6
All Children 1,617 1,258 1,259 1,213 1,411 1,257 *** 1,426 1,534 1,534 266 1,182 1,242 40Rate per 100 77.8 77.9 75.0 87.3 77.7 N/A 88.2 94.9 94.9 16.5 73.1 76.8 2.5
AssiniboineFirst Nations 68 36 36 36 58 47 *** 47 67 67 *** 38 51 7Rate per 100 52.9 52.9 52.9 85.3 69.1 N/A 69.1 98.5 98.5 N/A 55.9 75.0 10.3
Non-First Nations 780 655 655 648 711 672 *** 700 740 740 152 636 669 32Rate per 100 84.0 84.0 83.1 91.2 86.2 N/A 89.7 94.9 94.9 19.5 81.5 85.8 4.1
All Children 848 691 691 684 769 719 *** 747 807 807 156 674 720 39Rate per 100 81.5 81.5 80.7 90.7 84.8 N/A 88.1 95.2 95.2 18.4 79.5 84.9 4.6
Manitoba Immunization Monitoring System Annual Report 200926
Report 2 – Complete for Age from Birth to 2009 by Immunogenand AgeAge 11
Pop Diphth Tet Pert Polio Hib PCV7 Measles Mumps Rubella V HB MC Inf
ParklandFirst Nations 85 76 76 76 85 78 *** 81 86 86 24 56 70 5Rate per 100 89.4 89.4 89.4 100.0 91.8 N/A 95.3 101.2 101.2 28.2 65.9 82.4 5.9
Non-First Nations 470 408 408 405 447 417 *** 439 453 453 99 392 414 18Rate per 100 86.8 86.8 86.2 95.1 88.7 N/A 93.4 96.4 96.4 21.1 83.4 88.1 3.8
All Children 555 484 484 481 532 495 *** 520 539 539 123 448 484 23Rate per 100 87.2 87.2 86.7 95.9 89.2 N/A 93.7 97.1 97.1 22.2 80.7 87.2 4.1
NOR-MANFirst Nations 171 134 134 134 161 145 *** 152 172 172 23 99 138 7Rate per 100 78.4 78.4 78.4 94.2 84.8 N/A 88.9 100.6 100.6 13.5 57.9 80.7 4.1
Non-First Nations 258 216 216 215 239 224 *** 231 249 249 51 207 233 18Rate per 100 83.7 83.7 83.3 92.6 86.8 N/A 89.5 96.5 96.5 19.8 80.2 90.3 7.0
All Children 429 350 350 349 400 369 *** 383 421 421 74 306 371 25Rate per 100 81.6 81.6 81.4 93.2 86.0 N/A 89.3 98.1 98.1 17.2 71.3 86.5 5.8
BurntwoodFirst Nations 652 357 357 355 510 406 *** 455 617 617 116 355 504 23Rate per 100 54.8 54.8 54.4 78.2 62.3 N/A 69.8 94.6 94.6 17.8 54.4 77.3 3.5
Non-First Nations 298 230 230 229 273 247 *** 255 289 289 68 220 250 33Rate per 100 77.2 77.2 76.8 91.6 82.9 N/A 85.6 97.0 97.0 22.8 73.8 83.9 11.1
All Children 950 587 587 584 783 653 *** 710 906 906 184 575 754 56Rate per 100 61.8 61.8 61.5 82.4 68.7 N/A 74.7 95.4 95.4 19.4 60.5 79.4 5.9
ChurchillFirst Nations 1 *** *** *** *** *** *** *** *** *** *** *** *** ***Rate per 100 N/A N/A N/A N/A N/A N/A N/A N/A N/A N/A N/A N/A N/A
Non-First Nations 11 7 7 7 7 7 *** 7 7 7 *** 8 7 ***Rate per 100 63.6 63.6 63.6 63.6 63.6 N/A 63.6 63.6 63.6 N/A 72.7 63.6 N/A
All Children 12 8 8 8 8 8 *** 8 8 8 *** 8 8 ***Rate per 100 66.7 66.7 66.7 66.7 66.7 N/A 66.7 66.7 66.7 N/A 66.7 66.7 N/A
Manitoba Immunization Monitoring System Annual Report 2009 27
Report 2 – Complete for Age from Birth to 2009 by Immunogenand AgeAge 17
Pop Diphth Tet Pert Polio Hib PCV7 Measles Mumps Rubella V HB MC Inf
MANITOBAFirst Nations 1,995 845 844 752 1,339 1,028 *** 1,433 1,912 1,913 11 1,216 36 76Rate per 100 42.4 42.3 37.7 67.1 51.5 N/A 71.8 95.8 95.9 0.6 61.0 1.8 3.8
Non-First Nations 15,211 10,227 10,234 9,269 12,570 9,895 *** 12,803 13,744 13,742 124 11,541 356 505Rate per 100 67.2 67.3 60.9 82.6 65.1 N/A 84.2 90.4 90.3 0.8 75.9 2.3 3.3
All Children 17,206 11,072 11,078 10,021 13,909 10,923 *** 14,236 15,656 15,655 135 12,757 392 581Rate per 100 64.3 64.4 58.2 80.8 63.5 N/A 82.7 91.0 91.0 0.8 74.1 2.3 3.4
WinnipegFirst Nations 500 217 217 170 398 290 *** 409 497 497 *** 318 8 20Rate per 100 43.4 43.4 34.0 79.6 58.0 N/A 81.8 99.4 99.4 N/A 63.6 1.6 4.0
Non-First Nations 8,574 5,255 5,259 4,712 6,831 5,336 *** 6,831 7,437 7,435 88 6,231 233 283Rate per 100 61.3 61.3 55.0 79.7 62.2 N/A 79.7 86.7 86.7 1.0 72.7 2.7 3.3
All Children 9,074 5,472 5,476 4,882 7,229 5,626 *** 7,240 7,934 7,932 89 6,549 241 303Rate per 100 60.3 60.3 53.8 79.7 62.0 N/A 79.8 87.4 87.4 1.0 72.2 2.7 3.3
BrandonFirst Nations 36 20 20 18 27 22 *** 31 38 38 *** 29 *** ***Rate per 100 55.6 55.6 50.0 75.0 61.1 N/A 86.1 105.6 105.6 N/A 80.6 N/A N/A
Non-First Nations 580 420 420 404 457 412 *** 495 529 530 *** 451 6 22Rate per 100 72.4 72.4 69.7 78.8 71.0 N/A 85.3 91.2 91.4 N/A 77.8 1.0 3.8
All Children 616 440 440 422 484 434 *** 526 567 568 *** 480 6 23Rate per 100 71.4 71.4 68.5 78.6 70.5 N/A 85.4 92.0 92.2 N/A 77.9 1.0 3.7
North EastmanFirst Nations 151 55 58 52 98 67 *** 112 141 141 *** 81 *** ***Rate per 100 36.4 38.4 34.4 64.9 44.4 N/A 74.2 93.4 93.4 N/A 53.6 N/A N/A
Non-First Nations 511 370 370 333 460 349 *** 472 491 491 *** 384 13 16Rate per 100 72.4 72.4 65.2 90.0 68.3 N/A 92.4 96.1 96.1 N/A 75.1 2.5 3.1
All Children 662 425 428 385 558 416 *** 584 632 632 *** 465 17 20Rate per 100 64.2 64.7 58.2 84.3 62.8 N/A 88.2 95.5 95.5 N/A 70.2 2.6 3.0
South EastmanFirst Nations 5 *** *** *** *** *** *** *** *** *** *** *** *** ***Rate per 100 N/A N/A N/A N/A N/A N/A N/A N/A N/A N/A N/A N/A N/A
Non-First Nations 1,088 805 805 707 972 708 *** 1,006 1,053 1,054 7 833 27 25Rate per 100 74.0 74.0 65.0 89.3 65.1 N/A 92.5 96.8 96.9 0.6 76.6 2.5 2.3
All Children 1,093 808 808 709 976 711 *** 1,009 1,057 1,058 7 835 27 25Rate per 100 73.9 73.9 64.9 89.3 65.1 N/A 92.3 96.7 96.8 0.6 76.4 2.5 2.3
InterlakeFirst Nations 164 66 66 63 116 102 *** 113 161 161 *** 96 5 ***Rate per 100 40.2 40.2 38.4 70.7 62.2 N/A 68.9 98.2 98.2 N/A 58.5 3.0 N/A
Non-First Nations 1,003 715 715 640 831 657 *** 837 907 907 12 782 16 38Rate per 100 71.3 71.3 63.8 82.9 65.5 N/A 83.4 90.4 90.4 1.2 78.0 1.6 3.8
All Children 1,167 781 781 703 947 759 *** 950 1,068 1,068 14 878 21 41Rate per 100 66.9 66.9 60.2 81.1 65.0 N/A 81.4 91.5 91.5 1.2 75.2 1.8 3.5
CentralFirst Nations 135 39 39 33 69 69 *** 106 127 127 *** 59 8 5Rate per 100 28.9 28.9 24.4 51.1 51.1 N/A 78.5 94.1 94.1 N/A 43.7 5.9 3.7
Non-First Nations 1,603 1,236 1,238 1,124 1,411 1,121 *** 1,489 1,564 1,563 8 1,294 25 40Rate per 100 77.1 77.2 70.1 88.0 69.9 N/A 92.9 97.6 97.5 0.5 80.7 1.6 2.5
All Children 1,738 1,275 1,277 1,157 1,480 1,190 *** 1,595 1,691 1,690 8 1,353 33 45Rate per 100 73.4 73.5 66.6 85.2 68.5 N/A 91.8 97.3 97.2 0.5 77.8 1.9 2.6
AssiniboineFirst Nations 96 37 37 33 63 69 *** 67 92 92 *** 75 *** 6Rate per 100 38.5 38.5 34.4 65.6 71.9 N/A 69.8 95.8 95.8 N/A 78.1 N/A 6.3
Non-First Nations 865 694 694 656 747 641 *** 771 800 800 *** 718 19 30Rate per 100 80.2 80.2 75.8 86.4 74.1 N/A 89.1 92.5 92.5 N/A 83.0 2.2 3.5
All Children 961 731 731 689 810 710 *** 838 892 892 *** 793 21 36Rate per 100 76.1 76.1 71.7 84.3 73.9 N/A 87.2 92.8 92.8 N/A 82.5 2.2 3.7
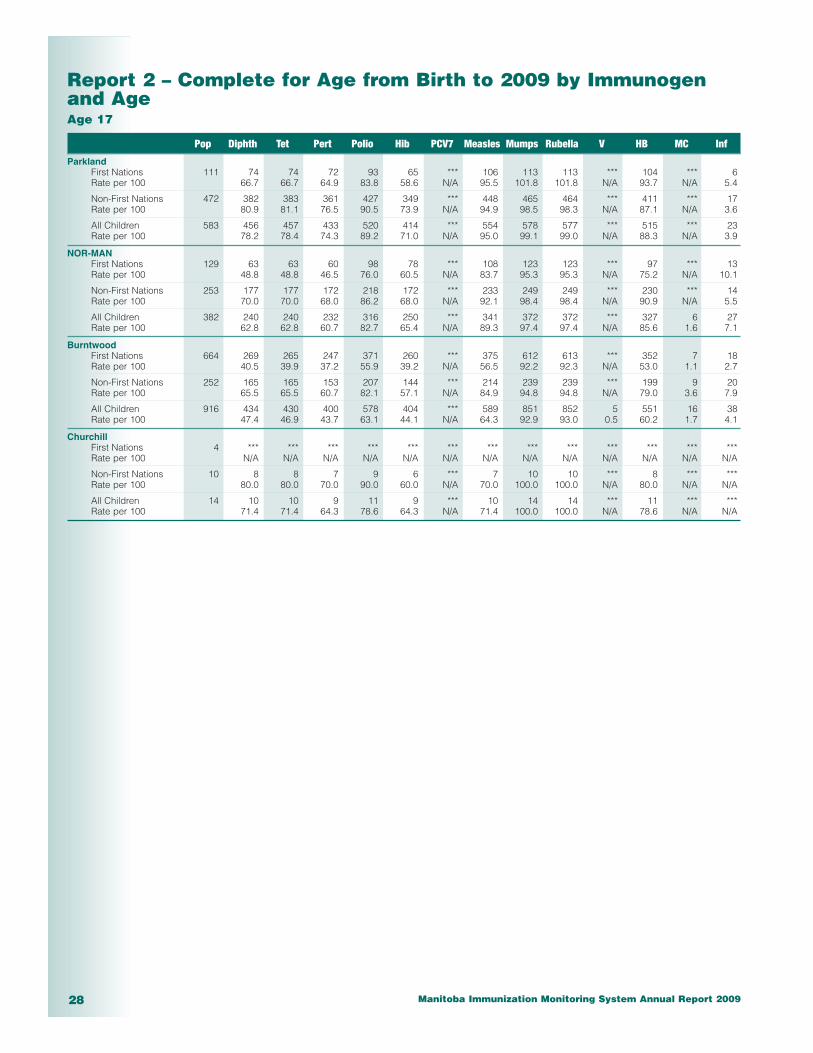
Manitoba Immunization Monitoring System Annual Report 200928
Report 2 – Complete for Age from Birth to 2009 by Immunogenand AgeAge 17
Pop Diphth Tet Pert Polio Hib PCV7 Measles Mumps Rubella V HB MC Inf
ParklandFirst Nations 111 74 74 72 93 65 *** 106 113 113 *** 104 *** 6Rate per 100 66.7 66.7 64.9 83.8 58.6 N/A 95.5 101.8 101.8 N/A 93.7 N/A 5.4
Non-First Nations 472 382 383 361 427 349 *** 448 465 464 *** 411 *** 17Rate per 100 80.9 81.1 76.5 90.5 73.9 N/A 94.9 98.5 98.3 N/A 87.1 N/A 3.6
All Children 583 456 457 433 520 414 *** 554 578 577 *** 515 *** 23Rate per 100 78.2 78.4 74.3 89.2 71.0 N/A 95.0 99.1 99.0 N/A 88.3 N/A 3.9
NOR-MANFirst Nations 129 63 63 60 98 78 *** 108 123 123 *** 97 *** 13Rate per 100 48.8 48.8 46.5 76.0 60.5 N/A 83.7 95.3 95.3 N/A 75.2 N/A 10.1
Non-First Nations 253 177 177 172 218 172 *** 233 249 249 *** 230 *** 14Rate per 100 70.0 70.0 68.0 86.2 68.0 N/A 92.1 98.4 98.4 N/A 90.9 N/A 5.5
All Children 382 240 240 232 316 250 *** 341 372 372 *** 327 6 27Rate per 100 62.8 62.8 60.7 82.7 65.4 N/A 89.3 97.4 97.4 N/A 85.6 1.6 7.1
BurntwoodFirst Nations 664 269 265 247 371 260 *** 375 612 613 *** 352 7 18Rate per 100 40.5 39.9 37.2 55.9 39.2 N/A 56.5 92.2 92.3 N/A 53.0 1.1 2.7
Non-First Nations 252 165 165 153 207 144 *** 214 239 239 *** 199 9 20Rate per 100 65.5 65.5 60.7 82.1 57.1 N/A 84.9 94.8 94.8 N/A 79.0 3.6 7.9
All Children 916 434 430 400 578 404 *** 589 851 852 5 551 16 38Rate per 100 47.4 46.9 43.7 63.1 44.1 N/A 64.3 92.9 93.0 0.5 60.2 1.7 4.1
ChurchillFirst Nations 4 *** *** *** *** *** *** *** *** *** *** *** *** ***Rate per 100 N/A N/A N/A N/A N/A N/A N/A N/A N/A N/A N/A N/A N/A
Non-First Nations 10 8 8 7 9 6 *** 7 10 10 *** 8 *** ***Rate per 100 80.0 80.0 70.0 90.0 60.0 N/A 70.0 100.0 100.0 N/A 80.0 N/A N/A
All Children 14 10 10 9 11 9 *** 10 14 14 *** 11 *** ***Rate per 100 71.4 71.4 64.3 78.6 64.3 N/A 71.4 100.0 100.0 N/A 78.6 N/A N/A
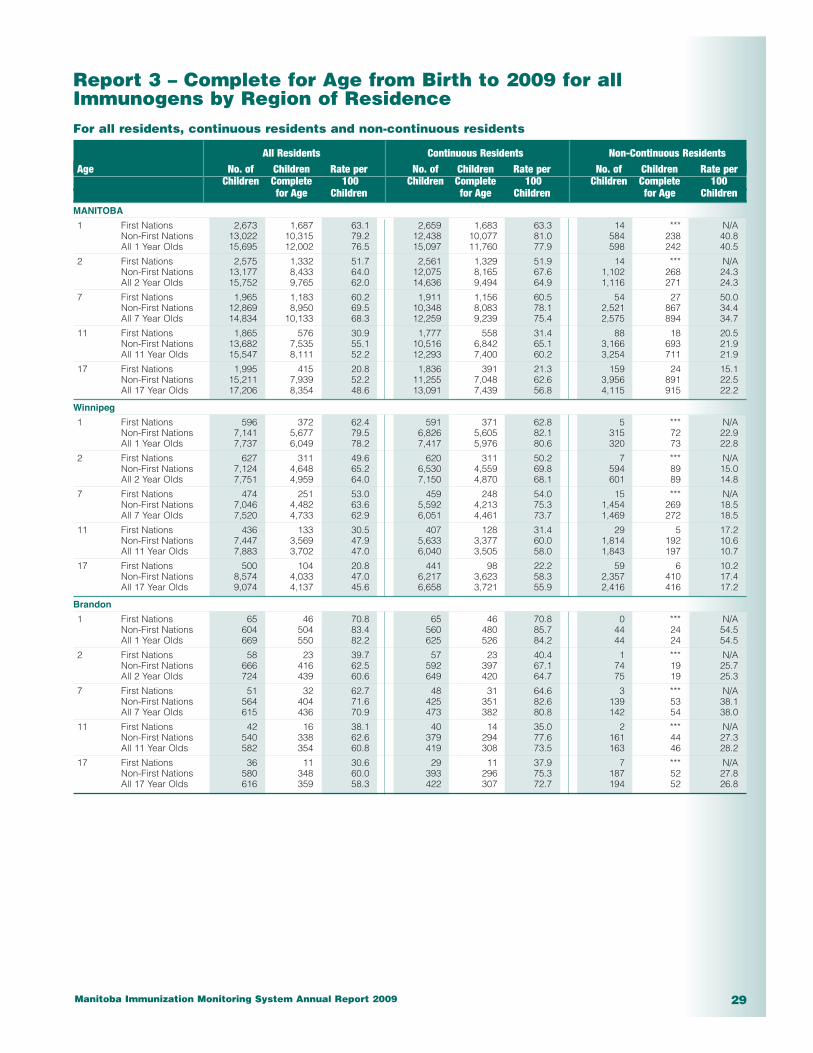
Manitoba Immunization Monitoring System Annual Report 2009 29
Report 3 – Complete for Age from Birth to 2009 for allImmunogens by Region of ResidenceFor all residents, continuous residents and non-continuous residents
All Residents Continuous Residents Non-Continuous ResidentsAge No. of Children Rate per No. of Children Rate per No. of Children Rate per
Children Complete 100 Children Complete 100 Children Complete 100for Age Children for Age Children for Age Children
MANITOBA
1 First Nations 2,673 1,687 63.1 2,659 1,683 63.3 14 *** N/ANon-First Nations 13,022 10,315 79.2 12,438 10,077 81.0 584 238 40.8All 1 Year Olds 15,695 12,002 76.5 15,097 11,760 77.9 598 242 40.5
2 First Nations 2,575 1,332 51.7 2,561 1,329 51.9 14 *** N/ANon-First Nations 13,177 8,433 64.0 12,075 8,165 67.6 1,102 268 24.3All 2 Year Olds 15,752 9,765 62.0 14,636 9,494 64.9 1,116 271 24.3
7 First Nations 1,965 1,183 60.2 1,911 1,156 60.5 54 27 50.0Non-First Nations 12,869 8,950 69.5 10,348 8,083 78.1 2,521 867 34.4All 7 Year Olds 14,834 10,133 68.3 12,259 9,239 75.4 2,575 894 34.7
11 First Nations 1,865 576 30.9 1,777 558 31.4 88 18 20.5Non-First Nations 13,682 7,535 55.1 10,516 6,842 65.1 3,166 693 21.9All 11 Year Olds 15,547 8,111 52.2 12,293 7,400 60.2 3,254 711 21.9
17 First Nations 1,995 415 20.8 1,836 391 21.3 159 24 15.1Non-First Nations 15,211 7,939 52.2 11,255 7,048 62.6 3,956 891 22.5All 17 Year Olds 17,206 8,354 48.6 13,091 7,439 56.8 4,115 915 22.2
Winnipeg
1 First Nations 596 372 62.4 591 371 62.8 5 *** N/ANon-First Nations 7,141 5,677 79.5 6,826 5,605 82.1 315 72 22.9All 1 Year Olds 7,737 6,049 78.2 7,417 5,976 80.6 320 73 22.8
2 First Nations 627 311 49.6 620 311 50.2 7 *** N/ANon-First Nations 7,124 4,648 65.2 6,530 4,559 69.8 594 89 15.0All 2 Year Olds 7,751 4,959 64.0 7,150 4,870 68.1 601 89 14.8
7 First Nations 474 251 53.0 459 248 54.0 15 *** N/ANon-First Nations 7,046 4,482 63.6 5,592 4,213 75.3 1,454 269 18.5All 7 Year Olds 7,520 4,733 62.9 6,051 4,461 73.7 1,469 272 18.5
11 First Nations 436 133 30.5 407 128 31.4 29 5 17.2Non-First Nations 7,447 3,569 47.9 5,633 3,377 60.0 1,814 192 10.6All 11 Year Olds 7,883 3,702 47.0 6,040 3,505 58.0 1,843 197 10.7
17 First Nations 500 104 20.8 441 98 22.2 59 6 10.2Non-First Nations 8,574 4,033 47.0 6,217 3,623 58.3 2,357 410 17.4All 17 Year Olds 9,074 4,137 45.6 6,658 3,721 55.9 2,416 416 17.2
Brandon
1 First Nations 65 46 70.8 65 46 70.8 0 *** N/ANon-First Nations 604 504 83.4 560 480 85.7 44 24 54.5All 1 Year Olds 669 550 82.2 625 526 84.2 44 24 54.5
2 First Nations 58 23 39.7 57 23 40.4 1 *** N/ANon-First Nations 666 416 62.5 592 397 67.1 74 19 25.7All 2 Year Olds 724 439 60.6 649 420 64.7 75 19 25.3
7 First Nations 51 32 62.7 48 31 64.6 3 *** N/ANon-First Nations 564 404 71.6 425 351 82.6 139 53 38.1All 7 Year Olds 615 436 70.9 473 382 80.8 142 54 38.0
11 First Nations 42 16 38.1 40 14 35.0 2 *** N/ANon-First Nations 540 338 62.6 379 294 77.6 161 44 27.3All 11 Year Olds 582 354 60.8 419 308 73.5 163 46 28.2
17 First Nations 36 11 30.6 29 11 37.9 7 *** N/ANon-First Nations 580 348 60.0 393 296 75.3 187 52 27.8All 17 Year Olds 616 359 58.3 422 307 72.7 194 52 26.8
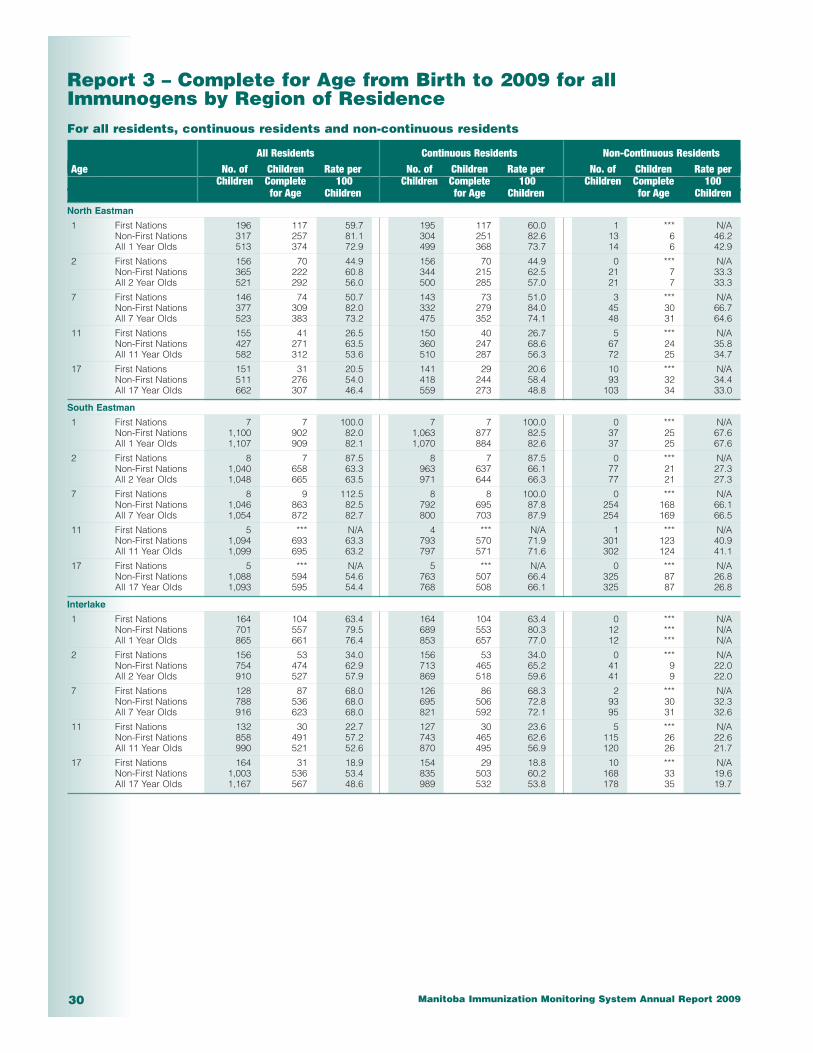
Manitoba Immunization Monitoring System Annual Report 200930
Report 3 – Complete for Age from Birth to 2009 for allImmunogens by Region of ResidenceFor all residents, continuous residents and non-continuous residents
All Residents Continuous Residents Non-Continuous ResidentsAge No. of Children Rate per No. of Children Rate per No. of Children Rate per
Children Complete 100 Children Complete 100 Children Complete 100for Age Children for Age Children for Age Children
North Eastman
1 First Nations 196 117 59.7 195 117 60.0 1 *** N/ANon-First Nations 317 257 81.1 304 251 82.6 13 6 46.2All 1 Year Olds 513 374 72.9 499 368 73.7 14 6 42.9
2 First Nations 156 70 44.9 156 70 44.9 0 *** N/ANon-First Nations 365 222 60.8 344 215 62.5 21 7 33.3All 2 Year Olds 521 292 56.0 500 285 57.0 21 7 33.3
7 First Nations 146 74 50.7 143 73 51.0 3 *** N/ANon-First Nations 377 309 82.0 332 279 84.0 45 30 66.7All 7 Year Olds 523 383 73.2 475 352 74.1 48 31 64.6
11 First Nations 155 41 26.5 150 40 26.7 5 *** N/ANon-First Nations 427 271 63.5 360 247 68.6 67 24 35.8All 11 Year Olds 582 312 53.6 510 287 56.3 72 25 34.7
17 First Nations 151 31 20.5 141 29 20.6 10 *** N/ANon-First Nations 511 276 54.0 418 244 58.4 93 32 34.4All 17 Year Olds 662 307 46.4 559 273 48.8 103 34 33.0
South Eastman
1 First Nations 7 7 100.0 7 7 100.0 0 *** N/ANon-First Nations 1,100 902 82.0 1,063 877 82.5 37 25 67.6All 1 Year Olds 1,107 909 82.1 1,070 884 82.6 37 25 67.6
2 First Nations 8 7 87.5 8 7 87.5 0 *** N/ANon-First Nations 1,040 658 63.3 963 637 66.1 77 21 27.3All 2 Year Olds 1,048 665 63.5 971 644 66.3 77 21 27.3
7 First Nations 8 9 112.5 8 8 100.0 0 *** N/ANon-First Nations 1,046 863 82.5 792 695 87.8 254 168 66.1All 7 Year Olds 1,054 872 82.7 800 703 87.9 254 169 66.5
11 First Nations 5 *** N/A 4 *** N/A 1 *** N/ANon-First Nations 1,094 693 63.3 793 570 71.9 301 123 40.9All 11 Year Olds 1,099 695 63.2 797 571 71.6 302 124 41.1
17 First Nations 5 *** N/A 5 *** N/A 0 *** N/ANon-First Nations 1,088 594 54.6 763 507 66.4 325 87 26.8All 17 Year Olds 1,093 595 54.4 768 508 66.1 325 87 26.8
Interlake
1 First Nations 164 104 63.4 164 104 63.4 0 *** N/ANon-First Nations 701 557 79.5 689 553 80.3 12 *** N/AAll 1 Year Olds 865 661 76.4 853 657 77.0 12 *** N/A
2 First Nations 156 53 34.0 156 53 34.0 0 *** N/ANon-First Nations 754 474 62.9 713 465 65.2 41 9 22.0All 2 Year Olds 910 527 57.9 869 518 59.6 41 9 22.0
7 First Nations 128 87 68.0 126 86 68.3 2 *** N/ANon-First Nations 788 536 68.0 695 506 72.8 93 30 32.3All 7 Year Olds 916 623 68.0 821 592 72.1 95 31 32.6
11 First Nations 132 30 22.7 127 30 23.6 5 *** N/ANon-First Nations 858 491 57.2 743 465 62.6 115 26 22.6All 11 Year Olds 990 521 52.6 870 495 56.9 120 26 21.7
17 First Nations 164 31 18.9 154 29 18.8 10 *** N/ANon-First Nations 1,003 536 53.4 835 503 60.2 168 33 19.6All 17 Year Olds 1,167 567 48.6 989 532 53.8 178 35 19.7
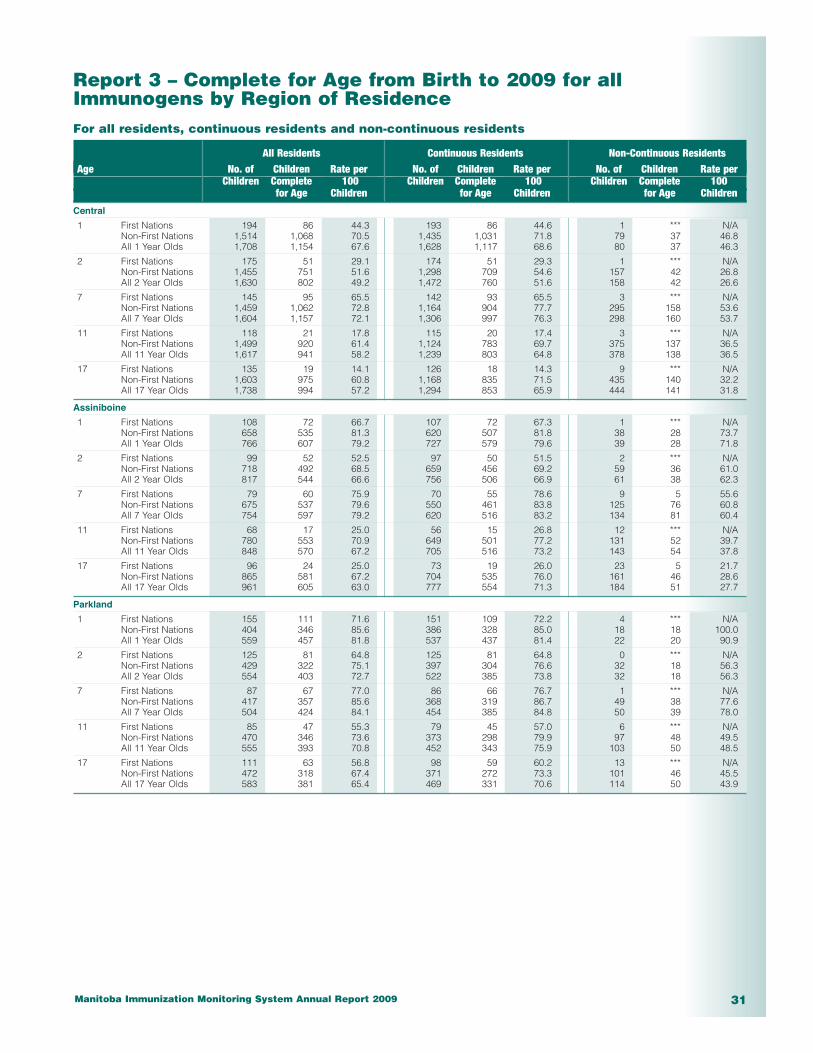
Manitoba Immunization Monitoring System Annual Report 2009 31
Report 3 – Complete for Age from Birth to 2009 for allImmunogens by Region of ResidenceFor all residents, continuous residents and non-continuous residents
All Residents Continuous Residents Non-Continuous ResidentsAge No. of Children Rate per No. of Children Rate per No. of Children Rate per
Children Complete 100 Children Complete 100 Children Complete 100for Age Children for Age Children for Age Children
Central
1 First Nations 194 86 44.3 193 86 44.6 1 *** N/ANon-First Nations 1,514 1,068 70.5 1,435 1,031 71.8 79 37 46.8All 1 Year Olds 1,708 1,154 67.6 1,628 1,117 68.6 80 37 46.3
2 First Nations 175 51 29.1 174 51 29.3 1 *** N/ANon-First Nations 1,455 751 51.6 1,298 709 54.6 157 42 26.8All 2 Year Olds 1,630 802 49.2 1,472 760 51.6 158 42 26.6
7 First Nations 145 95 65.5 142 93 65.5 3 *** N/ANon-First Nations 1,459 1,062 72.8 1,164 904 77.7 295 158 53.6All 7 Year Olds 1,604 1,157 72.1 1,306 997 76.3 298 160 53.7
11 First Nations 118 21 17.8 115 20 17.4 3 *** N/ANon-First Nations 1,499 920 61.4 1,124 783 69.7 375 137 36.5All 11 Year Olds 1,617 941 58.2 1,239 803 64.8 378 138 36.5
17 First Nations 135 19 14.1 126 18 14.3 9 *** N/ANon-First Nations 1,603 975 60.8 1,168 835 71.5 435 140 32.2All 17 Year Olds 1,738 994 57.2 1,294 853 65.9 444 141 31.8
Assiniboine
1 First Nations 108 72 66.7 107 72 67.3 1 *** N/ANon-First Nations 658 535 81.3 620 507 81.8 38 28 73.7All 1 Year Olds 766 607 79.2 727 579 79.6 39 28 71.8
2 First Nations 99 52 52.5 97 50 51.5 2 *** N/ANon-First Nations 718 492 68.5 659 456 69.2 59 36 61.0All 2 Year Olds 817 544 66.6 756 506 66.9 61 38 62.3
7 First Nations 79 60 75.9 70 55 78.6 9 5 55.6Non-First Nations 675 537 79.6 550 461 83.8 125 76 60.8All 7 Year Olds 754 597 79.2 620 516 83.2 134 81 60.4
11 First Nations 68 17 25.0 56 15 26.8 12 *** N/ANon-First Nations 780 553 70.9 649 501 77.2 131 52 39.7All 11 Year Olds 848 570 67.2 705 516 73.2 143 54 37.8
17 First Nations 96 24 25.0 73 19 26.0 23 5 21.7Non-First Nations 865 581 67.2 704 535 76.0 161 46 28.6All 17 Year Olds 961 605 63.0 777 554 71.3 184 51 27.7
Parkland
1 First Nations 155 111 71.6 151 109 72.2 4 *** N/ANon-First Nations 404 346 85.6 386 328 85.0 18 18 100.0All 1 Year Olds 559 457 81.8 537 437 81.4 22 20 90.9
2 First Nations 125 81 64.8 125 81 64.8 0 *** N/ANon-First Nations 429 322 75.1 397 304 76.6 32 18 56.3All 2 Year Olds 554 403 72.7 522 385 73.8 32 18 56.3
7 First Nations 87 67 77.0 86 66 76.7 1 *** N/ANon-First Nations 417 357 85.6 368 319 86.7 49 38 77.6All 7 Year Olds 504 424 84.1 454 385 84.8 50 39 78.0
11 First Nations 85 47 55.3 79 45 57.0 6 *** N/ANon-First Nations 470 346 73.6 373 298 79.9 97 48 49.5All 11 Year Olds 555 393 70.8 452 343 75.9 103 50 48.5
17 First Nations 111 63 56.8 98 59 60.2 13 *** N/ANon-First Nations 472 318 67.4 371 272 73.3 101 46 45.5All 17 Year Olds 583 381 65.4 469 331 70.6 114 50 43.9
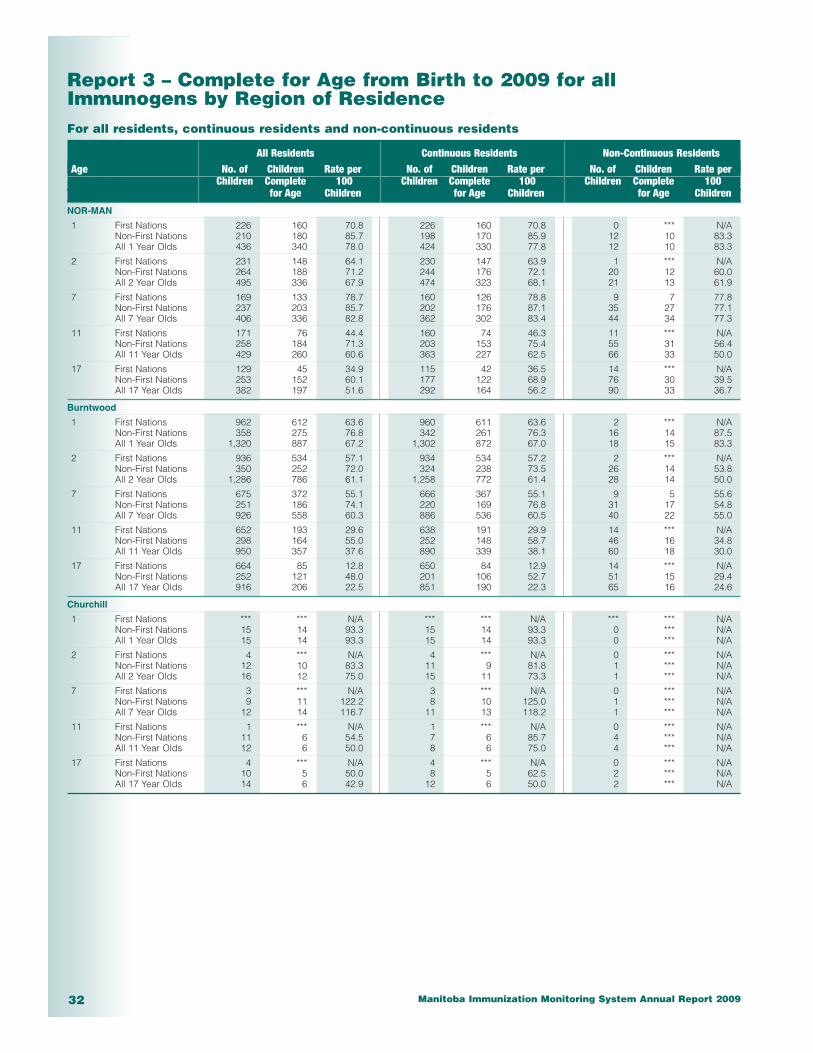
Manitoba Immunization Monitoring System Annual Report 200932
Report 3 – Complete for Age from Birth to 2009 for allImmunogens by Region of ResidenceFor all residents, continuous residents and non-continuous residents
All Residents Continuous Residents Non-Continuous ResidentsAge No. of Children Rate per No. of Children Rate per No. of Children Rate per
Children Complete 100 Children Complete 100 Children Complete 100for Age Children for Age Children for Age Children
NOR-MAN
1 First Nations 226 160 70.8 226 160 70.8 0 *** N/ANon-First Nations 210 180 85.7 198 170 85.9 12 10 83.3All 1 Year Olds 436 340 78.0 424 330 77.8 12 10 83.3
2 First Nations 231 148 64.1 230 147 63.9 1 *** N/ANon-First Nations 264 188 71.2 244 176 72.1 20 12 60.0All 2 Year Olds 495 336 67.9 474 323 68.1 21 13 61.9
7 First Nations 169 133 78.7 160 126 78.8 9 7 77.8Non-First Nations 237 203 85.7 202 176 87.1 35 27 77.1All 7 Year Olds 406 336 82.8 362 302 83.4 44 34 77.3
11 First Nations 171 76 44.4 160 74 46.3 11 *** N/ANon-First Nations 258 184 71.3 203 153 75.4 55 31 56.4All 11 Year Olds 429 260 60.6 363 227 62.5 66 33 50.0
17 First Nations 129 45 34.9 115 42 36.5 14 *** N/ANon-First Nations 253 152 60.1 177 122 68.9 76 30 39.5All 17 Year Olds 382 197 51.6 292 164 56.2 90 33 36.7
Burntwood
1 First Nations 962 612 63.6 960 611 63.6 2 *** N/ANon-First Nations 358 275 76.8 342 261 76.3 16 14 87.5All 1 Year Olds 1,320 887 67.2 1,302 872 67.0 18 15 83.3
2 First Nations 936 534 57.1 934 534 57.2 2 *** N/ANon-First Nations 350 252 72.0 324 238 73.5 26 14 53.8All 2 Year Olds 1,286 786 61.1 1,258 772 61.4 28 14 50.0
7 First Nations 675 372 55.1 666 367 55.1 9 5 55.6Non-First Nations 251 186 74.1 220 169 76.8 31 17 54.8All 7 Year Olds 926 558 60.3 886 536 60.5 40 22 55.0
11 First Nations 652 193 29.6 638 191 29.9 14 *** N/ANon-First Nations 298 164 55.0 252 148 58.7 46 16 34.8All 11 Year Olds 950 357 37.6 890 339 38.1 60 18 30.0
17 First Nations 664 85 12.8 650 84 12.9 14 *** N/ANon-First Nations 252 121 48.0 201 106 52.7 51 15 29.4All 17 Year Olds 916 206 22.5 851 190 22.3 65 16 24.6
Churchill
1 First Nations *** *** N/A *** *** N/A *** *** N/ANon-First Nations 15 14 93.3 15 14 93.3 0 *** N/AAll 1 Year Olds 15 14 93.3 15 14 93.3 0 *** N/A
2 First Nations 4 *** N/A 4 *** N/A 0 *** N/ANon-First Nations 12 10 83.3 11 9 81.8 1 *** N/AAll 2 Year Olds 16 12 75.0 15 11 73.3 1 *** N/A
7 First Nations 3 *** N/A 3 *** N/A 0 *** N/ANon-First Nations 9 11 122.2 8 10 125.0 1 *** N/AAll 7 Year Olds 12 14 116.7 11 13 118.2 1 *** N/A
11 First Nations 1 *** N/A 1 *** N/A 0 *** N/ANon-First Nations 11 6 54.5 7 6 85.7 4 *** N/AAll 11 Year Olds 12 6 50.0 8 6 75.0 4 *** N/A
17 First Nations 4 *** N/A 4 *** N/A 0 *** N/ANon-First Nations 10 5 50.0 8 5 62.5 2 *** N/AAll 17 Year Olds 14 6 42.9 12 6 50.0 2 *** N/A
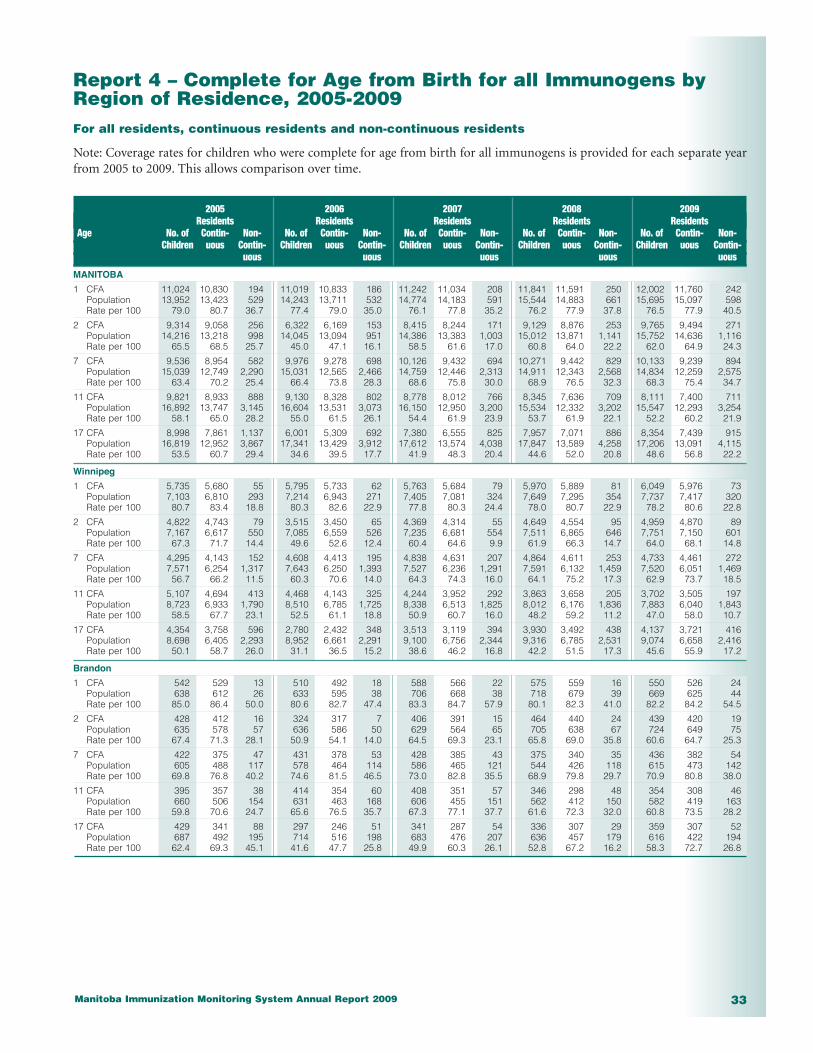
Manitoba Immunization Monitoring System Annual Report 2009 33
Report 4 – Complete for Age from Birth for all Immunogens byRegion of Residence, 2005-2009For all residents, continuous residents and non-continuous residents
Note: Coverage rates for children who were complete for age from birth for all immunogens is provided for each separate yearfrom 2005 to 2009. This allows comparison over time.
2005 2006 2007 2008 2009Residents Residents Residents Residents Residents
Age No. of Contin- Non- No. of Contin- Non- No. of Contin- Non- No. of Contin- Non- No. of Contin- Non-Children uous Contin- Children uous Contin- Children uous Contin- Children uous Contin- Children uous Contin-
uous uous uous uous uous
MANITOBA
1 CFA 11,024 10,830 194 11,019 10,833 186 11,242 11,034 208 11,841 11,591 250 12,002 11,760 242Population 13,952 13,423 529 14,243 13,711 532 14,774 14,183 591 15,544 14,883 661 15,695 15,097 598Rate per 100 79.0 80.7 36.7 77.4 79.0 35.0 76.1 77.8 35.2 76.2 77.9 37.8 76.5 77.9 40.5
2 CFA 9,314 9,058 256 6,322 6,169 153 8,415 8,244 171 9,129 8,876 253 9,765 9,494 271Population 14,216 13,218 998 14,045 13,094 951 14,386 13,383 1,003 15,012 13,871 1,141 15,752 14,636 1,116Rate per 100 65.5 68.5 25.7 45.0 47.1 16.1 58.5 61.6 17.0 60.8 64.0 22.2 62.0 64.9 24.3
7 CFA 9,536 8,954 582 9,976 9,278 698 10,126 9,432 694 10,271 9,442 829 10,133 9,239 894Population 15,039 12,749 2,290 15,031 12,565 2,466 14,759 12,446 2,313 14,911 12,343 2,568 14,834 12,259 2,575Rate per 100 63.4 70.2 25.4 66.4 73.8 28.3 68.6 75.8 30.0 68.9 76.5 32.3 68.3 75.4 34.7
11 CFA 9,821 8,933 888 9,130 8,328 802 8,778 8,012 766 8,345 7,636 709 8,111 7,400 711Population 16,892 13,747 3,145 16,604 13,531 3,073 16,150 12,950 3,200 15,534 12,332 3,202 15,547 12,293 3,254Rate per 100 58.1 65.0 28.2 55.0 61.5 26.1 54.4 61.9 23.9 53.7 61.9 22.1 52.2 60.2 21.9
17 CFA 8,998 7,861 1,137 6,001 5,309 692 7,380 6,555 825 7,957 7,071 886 8,354 7,439 915Population 16,819 12,952 3,867 17,341 13,429 3,912 17,612 13,574 4,038 17,847 13,589 4,258 17,206 13,091 4,115Rate per 100 53.5 60.7 29.4 34.6 39.5 17.7 41.9 48.3 20.4 44.6 52.0 20.8 48.6 56.8 22.2
Winnipeg
1 CFA 5,735 5,680 55 5,795 5,733 62 5,763 5,684 79 5,970 5,889 81 6,049 5,976 73Population 7,103 6,810 293 7,214 6,943 271 7,405 7,081 324 7,649 7,295 354 7,737 7,417 320Rate per 100 80.7 83.4 18.8 80.3 82.6 22.9 77.8 80.3 24.4 78.0 80.7 22.9 78.2 80.6 22.8
2 CFA 4,822 4,743 79 3,515 3,450 65 4,369 4,314 55 4,649 4,554 95 4,959 4,870 89Population 7,167 6,617 550 7,085 6,559 526 7,235 6,681 554 7,511 6,865 646 7,751 7,150 601Rate per 100 67.3 71.7 14.4 49.6 52.6 12.4 60.4 64.6 9.9 61.9 66.3 14.7 64.0 68.1 14.8
7 CFA 4,295 4,143 152 4,608 4,413 195 4,838 4,631 207 4,864 4,611 253 4,733 4,461 272Population 7,571 6,254 1,317 7,643 6,250 1,393 7,527 6,236 1,291 7,591 6,132 1,459 7,520 6,051 1,469Rate per 100 56.7 66.2 11.5 60.3 70.6 14.0 64.3 74.3 16.0 64.1 75.2 17.3 62.9 73.7 18.5
11 CFA 5,107 4,694 413 4,468 4,143 325 4,244 3,952 292 3,863 3,658 205 3,702 3,505 197Population 8,723 6,933 1,790 8,510 6,785 1,725 8,338 6,513 1,825 8,012 6,176 1,836 7,883 6,040 1,843Rate per 100 58.5 67.7 23.1 52.5 61.1 18.8 50.9 60.7 16.0 48.2 59.2 11.2 47.0 58.0 10.7
17 CFA 4,354 3,758 596 2,780 2,432 348 3,513 3,119 394 3,930 3,492 438 4,137 3,721 416Population 8,698 6,405 2,293 8,952 6,661 2,291 9,100 6,756 2,344 9,316 6,785 2,531 9,074 6,658 2,416Rate per 100 50.1 58.7 26.0 31.1 36.5 15.2 38.6 46.2 16.8 42.2 51.5 17.3 45.6 55.9 17.2
Brandon
1 CFA 542 529 13 510 492 18 588 566 22 575 559 16 550 526 24Population 638 612 26 633 595 38 706 668 38 718 679 39 669 625 44Rate per 100 85.0 86.4 50.0 80.6 82.7 47.4 83.3 84.7 57.9 80.1 82.3 41.0 82.2 84.2 54.5
2 CFA 428 412 16 324 317 7 406 391 15 464 440 24 439 420 19Population 635 578 57 636 586 50 629 564 65 705 638 67 724 649 75Rate per 100 67.4 71.3 28.1 50.9 54.1 14.0 64.5 69.3 23.1 65.8 69.0 35.8 60.6 64.7 25.3
7 CFA 422 375 47 431 378 53 428 385 43 375 340 35 436 382 54Population 605 488 117 578 464 114 586 465 121 544 426 118 615 473 142Rate per 100 69.8 76.8 40.2 74.6 81.5 46.5 73.0 82.8 35.5 68.9 79.8 29.7 70.9 80.8 38.0
11 CFA 395 357 38 414 354 60 408 351 57 346 298 48 354 308 46Population 660 506 154 631 463 168 606 455 151 562 412 150 582 419 163Rate per 100 59.8 70.6 24.7 65.6 76.5 35.7 67.3 77.1 37.7 61.6 72.3 32.0 60.8 73.5 28.2
17 CFA 429 341 88 297 246 51 341 287 54 336 307 29 359 307 52Population 687 492 195 714 516 198 683 476 207 636 457 179 616 422 194Rate per 100 62.4 69.3 45.1 41.6 47.7 25.8 49.9 60.3 26.1 52.8 67.2 16.2 58.3 72.7 26.8

Manitoba Immunization Monitoring System Annual Report 200934
Report 4 – Complete for Age from Birth for all Immunogens byRegion of Residence, 2005-2009For all residents, continuous residents and non-continuous residents
2005 2006 2007 2008 2009Residents Residents Residents Residents Residents
Age No. of Contin- Non- No. of Contin- Non- No. of Contin- Non- No. of Contin- Non- No. of Contin- Non-Children uous Contin- Children uous Contin- Children uous Contin- Children uous Contin- Children uous Contin-
uous uous uous uous uous
North Eastman
1 CFA 348 344 *** 346 344 *** 357 353 *** 357 351 6 374 368 6Population 449 443 *** 433 427 *** 494 484 *** 522 508 14 513 499 14Rate per 100 77.5 77.7 N/A 79.9 80.6 N/A 72.3 72.9 N/A 68.4 69.1 42.9 72.9 73.7 42.9
2 CFA 280 274 6 188 186 *** 237 235 *** 286 283 *** 292 285 7Population 476 458 18 455 440 *** 460 450 *** 495 478 *** 521 500 21Rate per 100 58.8 59.8 33.3 41.3 42.3 N/A 51.5 52.2 N/A 57.8 59.2 N/A 56.0 57.0 33.3
7 CFA 379 359 20 377 354 23 381 369 12 391 370 21 383 352 31Population 553 514 39 527 485 42 527 497 30 554 503 51 523 475 48Rate per 100 68.5 69.8 51.3 71.5 73.0 54.8 72.3 74.2 40.0 70.6 73.6 41.2 73.2 74.1 64.6
11 CFA 346 316 30 321 298 23 291 263 28 274 263 11 312 287 25Population 642 569 73 619 563 56 576 500 76 545 480 65 582 510 72Rate per 100 53.9 55.5 41.1 51.9 52.9 41.1 50.5 52.6 36.8 50.3 54.8 16.9 53.6 56.3 34.7
17 CFA 329 297 32 196 172 24 211 190 21 231 209 22 307 273 34Population 595 510 85 648 560 88 639 525 114 649 560 89 662 559 103Rate per 100 55.3 58.2 37.6 30.2 30.7 27.3 33.0 36.2 18.4 35.6 37.3 24.7 46.4 48.8 33.0
South Eastman
1 CFA 700 677 23 743 728 15 769 752 17 824 801 23 909 884 25Population 821 787 34 914 869 45 955 918 37 1,008 969 39 1,107 1,070 37Rate per 100 85.3 86.0 67.6 81.3 83.8 33.3 80.5 81.9 45.9 81.7 82.7 59.0 82.1 82.6 67.6
2 CFA 624 588 36 381 368 13 621 605 16 685 658 27 665 644 21Population 876 800 76 858 791 67 964 874 90 1,009 925 84 1,048 971 77Rate per 100 71.2 73.5 47.4 44.4 46.5 19.4 64.4 69.2 17.8 67.9 71.1 32.1 63.5 66.3 27.3
7 CFA 723 619 104 713 593 120 779 656 123 865 687 178 872 703 169Population 941 749 192 931 697 234 997 761 236 1,072 798 274 1,054 800 254Rate per 100 76.8 82.6 54.2 76.6 85.1 51.3 78.1 86.2 52.1 80.7 86.1 65.0 82.7 87.9 66.5
11 CFA 640 558 82 674 584 90 655 569 86 670 564 106 695 571 124Population 1,018 768 250 1,061 797 264 1,058 769 289 1,072 779 293 1,099 797 302Rate per 100 62.9 72.7 32.8 63.5 73.3 34.1 61.9 74.0 29.8 62.5 72.4 36.2 63.2 71.6 41.1
17 CFA 561 480 81 344 305 39 486 409 77 574 496 78 595 508 87Population 967 722 245 1,039 762 277 1,097 785 312 1,193 838 355 1,093 768 325Rate per 100 58.0 66.5 33.1 33.1 40.0 14.1 44.3 52.1 24.7 48.1 59.2 22.0 54.4 66.1 26.8
Interlake
1 CFA 626 615 11 620 613 7 637 627 10 687 675 12 661 657 ***Population 805 776 29 795 778 17 838 817 21 883 855 28 865 853 ***Rate per 100 77.8 79.3 37.9 78.0 78.8 41.2 76.0 76.7 47.6 77.8 78.9 42.9 76.4 77.0 N/A
2 CFA 525 510 15 335 327 8 457 452 5 513 501 12 527 518 9Population 808 766 42 824 780 44 812 778 34 861 814 47 910 869 41Rate per 100 65.0 66.6 35.7 40.7 41.9 18.2 56.3 58.1 14.7 59.6 61.5 25.5 57.9 59.6 22.0
7 CFA 681 663 18 654 621 33 613 595 18 621 589 32 623 592 31Population 953 877 76 953 841 112 861 784 77 895 802 93 916 821 95Rate per 100 71.5 75.6 23.7 68.6 73.8 29.5 71.2 75.9 23.4 69.4 73.4 34.4 68.0 72.1 32.6
11 CFA 621 588 33 685 648 37 576 552 24 581 545 36 521 495 26Population 1,100 965 135 1,192 1,038 154 1,076 947 129 1,035 900 135 990 870 120Rate per 100 56.5 60.9 24.4 57.5 62.4 24.0 53.5 58.3 18.6 56.1 60.6 26.7 52.6 56.9 21.7
17 CFA 684 633 51 409 383 26 531 493 38 548 510 38 567 532 35Population 1,197 1,027 170 1,200 1,015 185 1,184 999 185 1,188 1,011 177 1,167 989 178Rate per 100 57.1 61.6 30.0 34.1 37.7 14.1 44.8 49.3 20.5 46.1 50.4 21.5 48.6 53.8 19.7

Manitoba Immunization Monitoring System Annual Report 2009 35
Report 4 – Complete for Age from Birth for all Immunogens byRegion of Residence, 2005-2009For all residents, continuous residents and non-continuous residents
2005 2006 2007 2008 2009Residents Residents Residents Residents Residents
Age No. of Contin- Non- No. of Contin- Non- No. of Contin- Non- No. of Contin- Non- No. of Contin- Non-Children uous Contin- Children uous Contin- Children uous Contin- Children uous Contin- Children uous Contin-
uous uous uous uous uous
Central
1 CFA 1,030 991 39 1,025 1,006 19 1,044 1,021 23 1,084 1,039 45 1,154 1,117 37Population 1,388 1,334 54 1,490 1,426 64 1,521 1,452 69 1,585 1,497 88 1,708 1,628 80Rate per 100 74.2 74.3 72.2 68.8 70.5 29.7 68.6 70.3 33.3 68.4 69.4 51.1 67.6 68.6 46.3
2 CFA 953 913 40 503 486 17 754 733 21 761 737 24 802 760 42Population 1,544 1,419 125 1,428 1,323 105 1,527 1,410 117 1,598 1,453 145 1,630 1,472 158Rate per 100 61.7 64.3 32.0 35.2 36.7 16.2 49.4 52.0 17.9 47.6 50.7 16.6 49.2 51.6 26.6
7 CFA 1,073 976 97 1,139 1,036 103 1,153 1,015 138 1,188 1,019 169 1,157 997 160Population 1,518 1,281 237 1,552 1,288 264 1,560 1,286 274 1,588 1,295 293 1,604 1,306 298Rate per 100 70.7 76.2 40.9 73.4 80.4 39.0 73.9 78.9 50.4 74.8 78.7 57.7 72.1 76.3 53.7
11 CFA 1,036 910 126 979 855 124 937 814 123 1,039 895 144 941 803 138Population 1,670 1,358 312 1,654 1,323 331 1,601 1,278 323 1,691 1,339 352 1,617 1,239 378Rate per 100 62.0 67.0 40.4 59.2 64.6 37.5 58.5 63.7 38.1 61.4 66.8 40.9 58.2 64.8 36.5
17 CFA 1,065 960 105 720 642 78 922 812 110 995 863 132 994 853 141Population 1,626 1,292 334 1,637 1,300 337 1,741 1,345 396 1,822 1,391 431 1,738 1,294 444Rate per 100 65.5 74.3 31.4 44.0 49.4 23.1 53.0 60.4 27.8 54.6 62.0 30.6 57.2 65.9 31.8
Assiniboine
1 CFA 619 598 21 537 511 26 595 569 26 638 605 33 607 579 28Population 744 712 32 702 662 40 743 710 33 804 760 44 766 727 39Rate per 100 83.2 84.0 65.6 76.5 77.2 65.0 80.1 80.1 78.8 79.4 79.6 75.0 79.2 79.6 71.8
2 CFA 521 493 28 307 290 17 441 420 21 475 448 27 544 506 38Population 722 673 49 742 686 56 716 659 57 744 691 53 817 756 61Rate per 100 72.2 73.3 57.1 41.4 42.3 30.4 61.6 63.7 36.8 63.8 64.8 50.9 66.6 66.9 62.3
7 CFA 654 605 49 662 602 60 628 560 68 602 550 52 597 516 81Population 836 726 110 814 694 120 776 653 123 743 627 116 754 620 134Rate per 100 78.2 83.3 44.5 81.3 86.7 50.0 80.9 85.8 55.3 81.0 87.7 44.8 79.2 83.2 60.4
11 CFA 656 589 67 619 561 58 603 544 59 583 512 71 570 516 54Population 944 780 164 905 758 147 865 721 144 834 663 171 848 705 143Rate per 100 69.5 75.5 40.9 68.4 74.0 39.5 69.7 75.5 41.0 69.9 77.2 41.5 67.2 73.2 37.8
17 CFA 686 611 75 551 509 42 572 520 52 587 537 50 605 554 51Population 1,049 831 218 1,069 859 210 1,035 841 194 1,008 821 187 961 777 184Rate per 100 65.4 73.5 34.4 51.5 59.3 20.0 55.3 61.8 26.8 58.2 65.4 26.7 63.0 71.3 27.7
Parkland
1 CFA 394 385 9 435 423 12 428 416 12 466 453 13 457 437 20Population 467 452 15 514 497 17 529 509 20 557 538 19 559 537 22Rate per 100 84.4 85.2 60.0 84.6 85.1 70.6 80.9 81.7 60.0 83.7 84.2 68.4 81.8 81.4 90.9
2 CFA 376 365 11 236 224 12 362 352 10 379 357 22 403 385 18Population 506 479 27 484 453 31 516 490 26 529 496 33 554 522 32Rate per 100 74.3 76.2 40.7 48.8 49.4 38.7 70.2 71.8 38.5 71.6 72.0 66.7 72.7 73.8 56.3
7 CFA 464 417 47 452 404 48 426 382 44 403 364 39 424 385 39Population 570 485 85 568 491 77 517 451 66 484 421 63 504 454 50Rate per 100 81.4 86.0 55.3 79.6 82.3 62.3 82.4 84.7 66.7 83.3 86.5 61.9 84.1 84.8 78.0
11 CFA 440 387 53 393 356 37 398 355 43 388 341 47 393 343 50Population 614 509 105 555 462 93 578 461 117 533 443 90 555 452 103Rate per 100 71.7 76.0 50.5 70.8 77.1 39.8 68.9 77.0 36.8 72.8 77.0 52.2 70.8 75.9 48.5
17 CFA 413 357 56 310 280 30 373 339 34 357 311 46 381 331 50Population 597 469 128 618 492 126 668 549 119 630 500 130 583 469 114Rate per 100 69.2 76.1 43.8 50.2 56.9 23.8 55.8 61.7 28.6 56.7 62.2 35.4 65.4 70.6 43.9
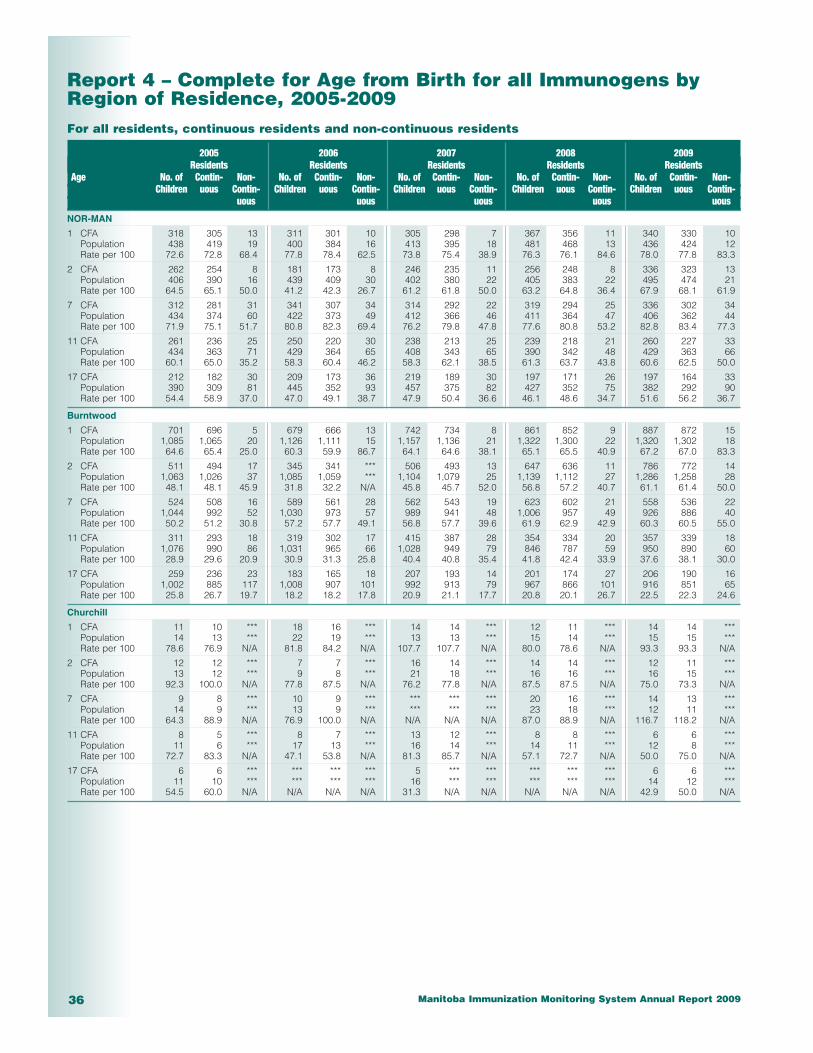
Manitoba Immunization Monitoring System Annual Report 200936
Report 4 – Complete for Age from Birth for all Immunogens byRegion of Residence, 2005-2009For all residents, continuous residents and non-continuous residents
2005 2006 2007 2008 2009Residents Residents Residents Residents Residents
Age No. of Contin- Non- No. of Contin- Non- No. of Contin- Non- No. of Contin- Non- No. of Contin- Non-Children uous Contin- Children uous Contin- Children uous Contin- Children uous Contin- Children uous Contin-
uous uous uous uous uous
NOR-MAN
1 CFA 318 305 13 311 301 10 305 298 7 367 356 11 340 330 10Population 438 419 19 400 384 16 413 395 18 481 468 13 436 424 12Rate per 100 72.6 72.8 68.4 77.8 78.4 62.5 73.8 75.4 38.9 76.3 76.1 84.6 78.0 77.8 83.3
2 CFA 262 254 8 181 173 8 246 235 11 256 248 8 336 323 13Population 406 390 16 439 409 30 402 380 22 405 383 22 495 474 21Rate per 100 64.5 65.1 50.0 41.2 42.3 26.7 61.2 61.8 50.0 63.2 64.8 36.4 67.9 68.1 61.9
7 CFA 312 281 31 341 307 34 314 292 22 319 294 25 336 302 34Population 434 374 60 422 373 49 412 366 46 411 364 47 406 362 44Rate per 100 71.9 75.1 51.7 80.8 82.3 69.4 76.2 79.8 47.8 77.6 80.8 53.2 82.8 83.4 77.3
11 CFA 261 236 25 250 220 30 238 213 25 239 218 21 260 227 33Population 434 363 71 429 364 65 408 343 65 390 342 48 429 363 66Rate per 100 60.1 65.0 35.2 58.3 60.4 46.2 58.3 62.1 38.5 61.3 63.7 43.8 60.6 62.5 50.0
17 CFA 212 182 30 209 173 36 219 189 30 197 171 26 197 164 33Population 390 309 81 445 352 93 457 375 82 427 352 75 382 292 90Rate per 100 54.4 58.9 37.0 47.0 49.1 38.7 47.9 50.4 36.6 46.1 48.6 34.7 51.6 56.2 36.7
Burntwood
1 CFA 701 696 5 679 666 13 742 734 8 861 852 9 887 872 15Population 1,085 1,065 20 1,126 1,111 15 1,157 1,136 21 1,322 1,300 22 1,320 1,302 18Rate per 100 64.6 65.4 25.0 60.3 59.9 86.7 64.1 64.6 38.1 65.1 65.5 40.9 67.2 67.0 83.3
2 CFA 511 494 17 345 341 *** 506 493 13 647 636 11 786 772 14Population 1,063 1,026 37 1,085 1,059 *** 1,104 1,079 25 1,139 1,112 27 1,286 1,258 28Rate per 100 48.1 48.1 45.9 31.8 32.2 N/A 45.8 45.7 52.0 56.8 57.2 40.7 61.1 61.4 50.0
7 CFA 524 508 16 589 561 28 562 543 19 623 602 21 558 536 22Population 1,044 992 52 1,030 973 57 989 941 48 1,006 957 49 926 886 40Rate per 100 50.2 51.2 30.8 57.2 57.7 49.1 56.8 57.7 39.6 61.9 62.9 42.9 60.3 60.5 55.0
11 CFA 311 293 18 319 302 17 415 387 28 354 334 20 357 339 18Population 1,076 990 86 1,031 965 66 1,028 949 79 846 787 59 950 890 60Rate per 100 28.9 29.6 20.9 30.9 31.3 25.8 40.4 40.8 35.4 41.8 42.4 33.9 37.6 38.1 30.0
17 CFA 259 236 23 183 165 18 207 193 14 201 174 27 206 190 16Population 1,002 885 117 1,008 907 101 992 913 79 967 866 101 916 851 65Rate per 100 25.8 26.7 19.7 18.2 18.2 17.8 20.9 21.1 17.7 20.8 20.1 26.7 22.5 22.3 24.6
Churchill
1 CFA 11 10 *** 18 16 *** 14 14 *** 12 11 *** 14 14 ***Population 14 13 *** 22 19 *** 13 13 *** 15 14 *** 15 15 ***Rate per 100 78.6 76.9 N/A 81.8 84.2 N/A 107.7 107.7 N/A 80.0 78.6 N/A 93.3 93.3 N/A
2 CFA 12 12 *** 7 7 *** 16 14 *** 14 14 *** 12 11 ***Population 13 12 *** 9 8 *** 21 18 *** 16 16 *** 16 15 ***Rate per 100 92.3 100.0 N/A 77.8 87.5 N/A 76.2 77.8 N/A 87.5 87.5 N/A 75.0 73.3 N/A
7 CFA 9 8 *** 10 9 *** *** *** *** 20 16 *** 14 13 ***Population 14 9 *** 13 9 *** *** *** *** 23 18 *** 12 11 ***Rate per 100 64.3 88.9 N/A 76.9 100.0 N/A N/A N/A N/A 87.0 88.9 N/A 116.7 118.2 N/A
11 CFA 8 5 *** 8 7 *** 13 12 *** 8 8 *** 6 6 ***Population 11 6 *** 17 13 *** 16 14 *** 14 11 *** 12 8 ***Rate per 100 72.7 83.3 N/A 47.1 53.8 N/A 81.3 85.7 N/A 57.1 72.7 N/A 50.0 75.0 N/A
17 CFA 6 6 *** *** *** *** 5 *** *** *** *** *** 6 6 ***Population 11 10 *** *** *** *** 16 *** *** *** *** *** 14 12 ***Rate per 100 54.5 60.0 N/A N/A N/A N/A 31.3 N/A N/A N/A N/A N/A 42.9 50.0 N/A

Manitoba Immunization Monitoring System Annual Report 2009 37
Report 5 – Childhood Vaccine Doses by Provider Type andProvider Location, 2009January 1 to December 31, 2009
Provider DTaP- DTaP- Td MMR HBV HEPA/B V Tdap MC PCV7 Flu HPV Total IPV IPV-HIB Doses
MANITOBA
Public Health NurseFirst Nations 289 1,505 13 685 1,702 *** 498 386 776 1,496 1,819 549Non-First Nations 3,227 10,799 47 6,251 26,820 416 4,210 9,249 11,393 10,456 14,025 10,490
Total 3,516 12,304 60 6,936 28,522 417 4,708 9,635 12,169 11,952 15,844 11,039 117,102
% of Doses Administered 3.0% 10.5% 0.1% 5.9% 24.4% 0.4% 4.0% 8.2% 10.4% 10.2% 13.5% 9.4% 41.9%
PhysicianFirst Nations 290 2,262 24 851 112 *** 542 48 409 2,183 413 6Non-First Nations 7,277 34,304 454 16,054 2,257 1,776 9,002 1,019 7,244 33,753 8,417 1,149
Total 7,567 36,566 478 16,905 2,369 1,779 9,544 1,067 7,653 35,936 8,830 1,155 129,849
% of Doses Administered 5.8% 28.2% 0.4% 13.0% 1.8% 1.4% 7.4% 0.8% 5.9% 27.7% 6.8% 0.9% 46.5%
First Nation/Tribal CouncilFirst Nations 1,007 5,217 84 2,438 2,043 *** 1,652 588 1,808 5,129 747 722Non-First Nations 209 956 10 469 450 *** 290 114 347 926 183 167
Total 1,216 6,173 94 2,907 2,493 *** 1,942 702 2,155 6,055 930 889 25,559
% of Doses Administered 4.8% 24.2% 0.4% 11.4% 9.8% N/A 7.6% 2.7% 8.4% 23.7% 3.6% 3.5% 9.2%
OtherFirst Nations 92 401 69 218 123 *** 92 103 83 400 108 ***Non-First Nations 303 1,080 296 629 320 72 379 251 297 1,102 335 48
Total 395 1,481 365 847 443 72 471 354 380 1,502 443 48 6,801
% of Doses Administered 5.8% 21.8% 5.4% 12.5% 6.5% 1.1% 6.9% 5.2% 5.6% 22.1% 6.5% 0.7% 2.4%
Total for MANITOBA 12,694 56,524 997 27,595 33,827 2,271 16,665 11,758 22,357 55,445 26,047 13,131 279,311
Winnipeg
Public Health NurseFirst Nations 11 22 *** 31 749 *** 24 113 255 22 538 248Non-First Nations 88 228 5 279 15,053 194 551 4,890 5,643 225 8,037 6,123
Total 99 250 7 310 15,802 195 575 5,003 5,898 247 8,575 6,371 43,332
% of Doses Administered 0.2% 0.6% 0.0% 0.7% 36.5% 0.5% 1.3% 11.5% 13.6% 0.6% 19.8% 14.7% 27.0%
PhysicianFirst Nations 257 1,891 18 752 108 *** 482 44 382 1,815 357 5Non-First Nations 6,389 28,673 372 13,730 2,208 1,565 7,698 984 6,332 28,204 7,783 973
Total 6,646 30,564 390 14,482 2,316 1,567 8,180 1,028 6,714 30,019 8,140 978 111,024
% of Doses Administered 6.0% 27.5% 0.4% 13.0% 2.1% 1.4% 7.4% 0.9% 6.0% 27.0% 7.3% 0.9% 69.3%
First Nation/Tribal CouncilFirst Nations 9 18 *** 18 *** *** 10 *** *** 18 7 ***Non-First Nations 6 *** *** 8 *** *** 5 *** *** *** *** ***
Total 15 22 *** 26 6 *** 15 *** 7 22 7 *** 125
% of Doses Administered 12.0% 17.6% N/A 20.8% 4.8% N/A 12.0% N/A 5.6% 17.6% 5.6% N/A 0.1%
OtherFirst Nations 92 396 11 203 99 *** 90 96 82 396 107 ***Non-First Nations 269 984 55 545 251 38 325 225 246 989 309 25
Total 361 1,380 66 748 350 38 415 321 328 1,385 416 25 5,833
% of Doses Administered 6.2% 23.7% 1.1% 12.8% 6.0% 0.7% 7.1% 5.5% 5.6% 23.7% 7.1% 0.4% 3.6%
Total for Winnipeg 7,121 32,216 463 15,566 18,474 1,800 9,185 6,354 12,947 31,673 17,138 7,377 160,314
NOTE: ‘Other’ providers includes facilities, primary care providers, private health care providers, pharmacies, and other unknown
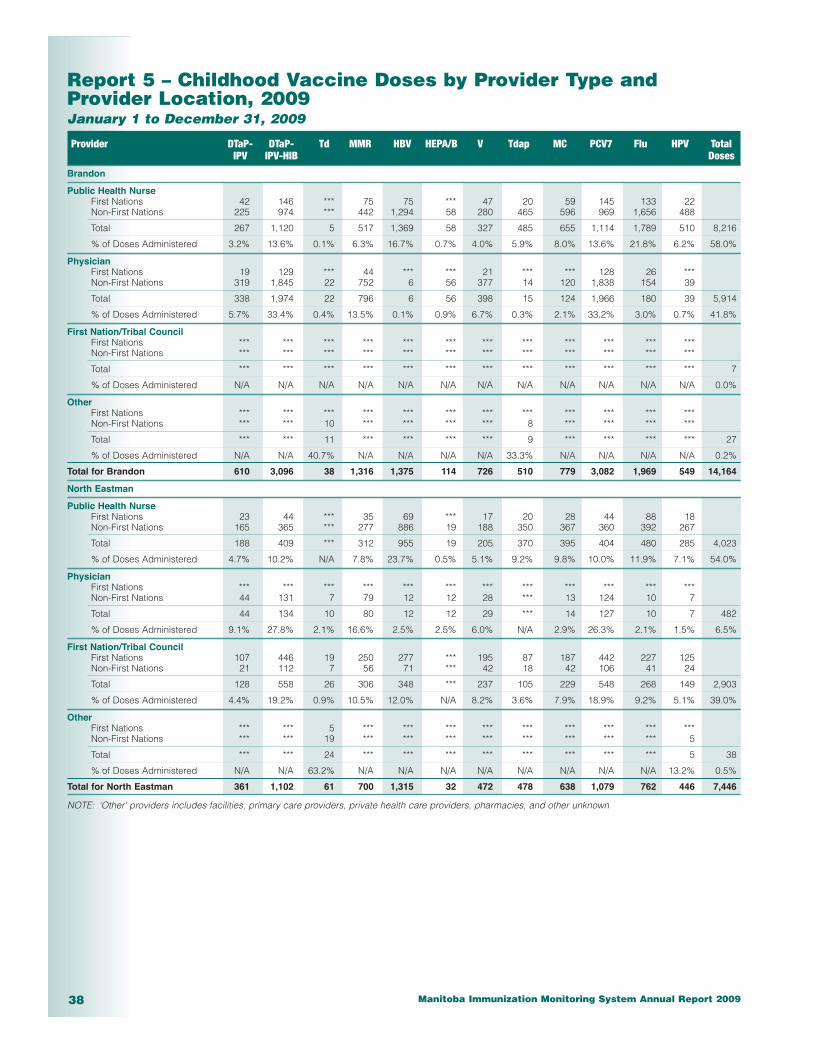
Manitoba Immunization Monitoring System Annual Report 200938
Report 5 – Childhood Vaccine Doses by Provider Type andProvider Location, 2009January 1 to December 31, 2009
Provider DTaP- DTaP- Td MMR HBV HEPA/B V Tdap MC PCV7 Flu HPV Total IPV IPV-HIB Doses
Brandon
Public Health NurseFirst Nations 42 146 *** 75 75 *** 47 20 59 145 133 22Non-First Nations 225 974 *** 442 1,294 58 280 465 596 969 1,656 488
Total 267 1,120 5 517 1,369 58 327 485 655 1,114 1,789 510 8,216
% of Doses Administered 3.2% 13.6% 0.1% 6.3% 16.7% 0.7% 4.0% 5.9% 8.0% 13.6% 21.8% 6.2% 58.0%
PhysicianFirst Nations 19 129 *** 44 *** *** 21 *** *** 128 26 ***Non-First Nations 319 1,845 22 752 6 56 377 14 120 1,838 154 39
Total 338 1,974 22 796 6 56 398 15 124 1,966 180 39 5,914
% of Doses Administered 5.7% 33.4% 0.4% 13.5% 0.1% 0.9% 6.7% 0.3% 2.1% 33.2% 3.0% 0.7% 41.8%
First Nation/Tribal CouncilFirst Nations *** *** *** *** *** *** *** *** *** *** *** ***Non-First Nations *** *** *** *** *** *** *** *** *** *** *** ***
Total *** *** *** *** *** *** *** *** *** *** *** *** 7
% of Doses Administered N/A N/A N/A N/A N/A N/A N/A N/A N/A N/A N/A N/A 0.0%
OtherFirst Nations *** *** *** *** *** *** *** *** *** *** *** ***Non-First Nations *** *** 10 *** *** *** *** 8 *** *** *** ***
Total *** *** 11 *** *** *** *** 9 *** *** *** *** 27
% of Doses Administered N/A N/A 40.7% N/A N/A N/A N/A 33.3% N/A N/A N/A N/A 0.2%
Total for Brandon 610 3,096 38 1,316 1,375 114 726 510 779 3,082 1,969 549 14,164
North Eastman
Public Health NurseFirst Nations 23 44 *** 35 69 *** 17 20 28 44 88 18Non-First Nations 165 365 *** 277 886 19 188 350 367 360 392 267
Total 188 409 *** 312 955 19 205 370 395 404 480 285 4,023
% of Doses Administered 4.7% 10.2% N/A 7.8% 23.7% 0.5% 5.1% 9.2% 9.8% 10.0% 11.9% 7.1% 54.0%
PhysicianFirst Nations *** *** *** *** *** *** *** *** *** *** *** ***Non-First Nations 44 131 7 79 12 12 28 *** 13 124 10 7
Total 44 134 10 80 12 12 29 *** 14 127 10 7 482
% of Doses Administered 9.1% 27.8% 2.1% 16.6% 2.5% 2.5% 6.0% N/A 2.9% 26.3% 2.1% 1.5% 6.5%
First Nation/Tribal CouncilFirst Nations 107 446 19 250 277 *** 195 87 187 442 227 125Non-First Nations 21 112 7 56 71 *** 42 18 42 106 41 24
Total 128 558 26 306 348 *** 237 105 229 548 268 149 2,903
% of Doses Administered 4.4% 19.2% 0.9% 10.5% 12.0% N/A 8.2% 3.6% 7.9% 18.9% 9.2% 5.1% 39.0%
OtherFirst Nations *** *** 5 *** *** *** *** *** *** *** *** ***Non-First Nations *** *** 19 *** *** *** *** *** *** *** *** 5
Total *** *** 24 *** *** *** *** *** *** *** *** 5 38
% of Doses Administered N/A N/A 63.2% N/A N/A N/A N/A N/A N/A N/A N/A 13.2% 0.5%
Total for North Eastman 361 1,102 61 700 1,315 32 472 478 638 1,079 762 446 7,446
NOTE: ‘Other’ providers includes facilities, primary care providers, private health care providers, pharmacies, and other unknown
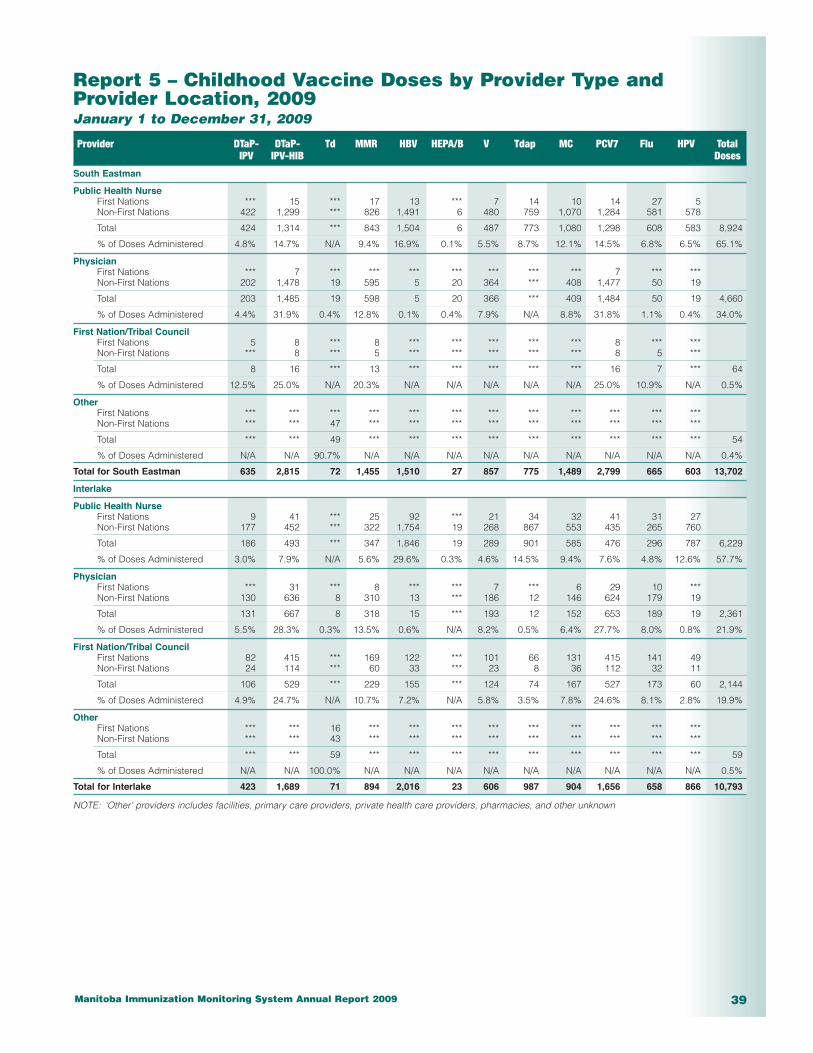
Manitoba Immunization Monitoring System Annual Report 2009 39
Report 5 – Childhood Vaccine Doses by Provider Type andProvider Location, 2009January 1 to December 31, 2009
Provider DTaP- DTaP- Td MMR HBV HEPA/B V Tdap MC PCV7 Flu HPV Total IPV IPV-HIB Doses
South Eastman
Public Health NurseFirst Nations *** 15 *** 17 13 *** 7 14 10 14 27 5Non-First Nations 422 1,299 *** 826 1,491 6 480 759 1,070 1,284 581 578
Total 424 1,314 *** 843 1,504 6 487 773 1,080 1,298 608 583 8,924
% of Doses Administered 4.8% 14.7% N/A 9.4% 16.9% 0.1% 5.5% 8.7% 12.1% 14.5% 6.8% 6.5% 65.1%
PhysicianFirst Nations *** 7 *** *** *** *** *** *** *** 7 *** ***Non-First Nations 202 1,478 19 595 5 20 364 *** 408 1,477 50 19
Total 203 1,485 19 598 5 20 366 *** 409 1,484 50 19 4,660
% of Doses Administered 4.4% 31.9% 0.4% 12.8% 0.1% 0.4% 7.9% N/A 8.8% 31.8% 1.1% 0.4% 34.0%
First Nation/Tribal CouncilFirst Nations 5 8 *** 8 *** *** *** *** *** 8 *** ***Non-First Nations *** 8 *** 5 *** *** *** *** *** 8 5 ***
Total 8 16 *** 13 *** *** *** *** *** 16 7 *** 64
% of Doses Administered 12.5% 25.0% N/A 20.3% N/A N/A N/A N/A N/A 25.0% 10.9% N/A 0.5%
OtherFirst Nations *** *** *** *** *** *** *** *** *** *** *** ***Non-First Nations *** *** 47 *** *** *** *** *** *** *** *** ***
Total *** *** 49 *** *** *** *** *** *** *** *** *** 54
% of Doses Administered N/A N/A 90.7% N/A N/A N/A N/A N/A N/A N/A N/A N/A 0.4%
Total for South Eastman 635 2,815 72 1,455 1,510 27 857 775 1,489 2,799 665 603 13,702
Interlake
Public Health NurseFirst Nations 9 41 *** 25 92 *** 21 34 32 41 31 27Non-First Nations 177 452 *** 322 1,754 19 268 867 553 435 265 760
Total 186 493 *** 347 1,846 19 289 901 585 476 296 787 6,229
% of Doses Administered 3.0% 7.9% N/A 5.6% 29.6% 0.3% 4.6% 14.5% 9.4% 7.6% 4.8% 12.6% 57.7%
PhysicianFirst Nations *** 31 *** 8 *** *** 7 *** 6 29 10 ***Non-First Nations 130 636 8 310 13 *** 186 12 146 624 179 19
Total 131 667 8 318 15 *** 193 12 152 653 189 19 2,361
% of Doses Administered 5.5% 28.3% 0.3% 13.5% 0.6% N/A 8.2% 0.5% 6.4% 27.7% 8.0% 0.8% 21.9%
First Nation/Tribal CouncilFirst Nations 82 415 *** 169 122 *** 101 66 131 415 141 49Non-First Nations 24 114 *** 60 33 *** 23 8 36 112 32 11
Total 106 529 *** 229 155 *** 124 74 167 527 173 60 2,144
% of Doses Administered 4.9% 24.7% N/A 10.7% 7.2% N/A 5.8% 3.5% 7.8% 24.6% 8.1% 2.8% 19.9%
OtherFirst Nations *** *** 16 *** *** *** *** *** *** *** *** ***Non-First Nations *** *** 43 *** *** *** *** *** *** *** *** ***
Total *** *** 59 *** *** *** *** *** *** *** *** *** 59
% of Doses Administered N/A N/A 100.0% N/A N/A N/A N/A N/A N/A N/A N/A N/A 0.5%
Total for Interlake 423 1,689 71 894 2,016 23 606 987 904 1,656 658 866 10,793
NOTE: ‘Other’ providers includes facilities, primary care providers, private health care providers, pharmacies, and other unknown

Manitoba Immunization Monitoring System Annual Report 200940
Report 5 – Childhood Vaccine Doses by Provider Type andProvider Location, 2009January 1 to December 31, 2009
Provider DTaP- DTaP- Td MMR HBV HEPA/B V Tdap MC PCV7 Flu HPV Total IPV IPV-HIB Doses
Central
Public Health NurseFirst Nations 24 81 *** 53 109 *** 34 23 35 78 15 36Non-First Nations 858 2,892 7 1,610 2,534 49 955 840 1,148 2,655 694 783
Total 882 2,973 9 1,663 2,643 49 989 863 1,183 2,733 709 819 15,515
% of Doses Administered 5.7% 19.2% 0.1% 10.7% 17.0% 0.3% 6.4% 5.6% 7.6% 17.6% 4.6% 5.3% 75.6%
PhysicianFirst Nations 6 121 *** 28 *** *** 20 *** 8 121 9 ***Non-First Nations 113 940 17 349 *** 35 219 *** 140 921 138 33
Total 119 1,061 19 377 5 35 239 *** 148 1,042 147 33 3,229
% of Doses Administered 3.7% 32.9% 0.6% 11.7% 0.2% 1.1% 7.4% N/A 4.6% 32.3% 4.6% 1.0% 15.7%
First Nation/Tribal CouncilFirst Nations 67 333 *** 176 115 *** 144 56 91 316 63 43Non-First Nations 19 77 *** 47 27 *** 31 7 24 73 *** 10
Total 86 410 *** 223 142 *** 175 63 115 389 66 53 1,724
% of Doses Administered 5.0% 23.8% N/A 12.9% 8.2% N/A 10.2% 3.7% 6.7% 22.6% 3.8% 3.1% 8.4%
OtherFirst Nations *** *** 9 *** *** *** *** *** *** *** *** ***Non-First Nations *** *** 38 *** *** 9 *** *** *** *** *** ***
Total *** *** 47 *** *** 9 *** *** *** *** *** *** 58
% of Doses Administered N/A N/A 81.0% N/A N/A 15.5% N/A N/A N/A N/A N/A N/A 0.3%
Total for Central 1,087 4,444 77 2,265 2,790 93 1,403 930 1,446 4,164 922 905 20,526
Assiniboine
Public Health NurseFirst Nations *** 26 *** 11 32 *** 9 8 16 26 6 13Non-First Nations 552 1,841 *** 1,007 1,689 14 599 533 838 1,776 392 712
Total 556 1,867 *** 1,018 1,721 14 608 541 854 1,802 398 725 10,106
% of Doses Administered 5.5% 18.5% N/A 10.1% 17.0% 0.1% 6.0% 5.4% 8.5% 17.8% 3.9% 7.2% 80.8%
PhysicianFirst Nations *** *** *** *** *** *** *** *** *** *** *** ***Non-First Nations 34 222 5 94 8 40 30 *** *** 184 47 33
Total 35 222 5 95 9 40 30 *** *** 184 47 33 703
% of Doses Administered 5.0% 31.6% 0.7% 13.5% 1.3% 5.7% 4.3% N/A N/A 26.2% 6.7% 4.7% 5.6%
First Nation/Tribal CouncilFirst Nations 53 273 *** 146 144 *** 98 35 145 273 98 68Non-First Nations 14 61 *** 32 33 *** 19 12 32 60 33 14
Total 67 334 *** 178 177 *** 117 47 177 333 131 82 1,643
% of Doses Administered 4.1% 20.3% N/A 10.8% 10.8% N/A 7.1% 2.9% 10.8% 20.3% 8.0% 5.0% 13.1%
OtherFirst Nations *** *** *** *** *** *** *** *** *** *** *** ***Non-First Nations *** *** 35 *** *** *** *** *** *** *** *** ***
Total *** *** 39 *** *** *** *** *** *** *** *** *** 54
% of Doses Administered N/A N/A 72.2% N/A N/A N/A N/A N/A N/A N/A N/A N/A 0.4%
Total for Assiniboine 658 2,424 46 1,293 1,911 55 755 590 1,034 2,319 577 844 12,506
NOTE: ‘Other’ providers includes facilities, primary care providers, private health care providers, pharmacies, and other unknown
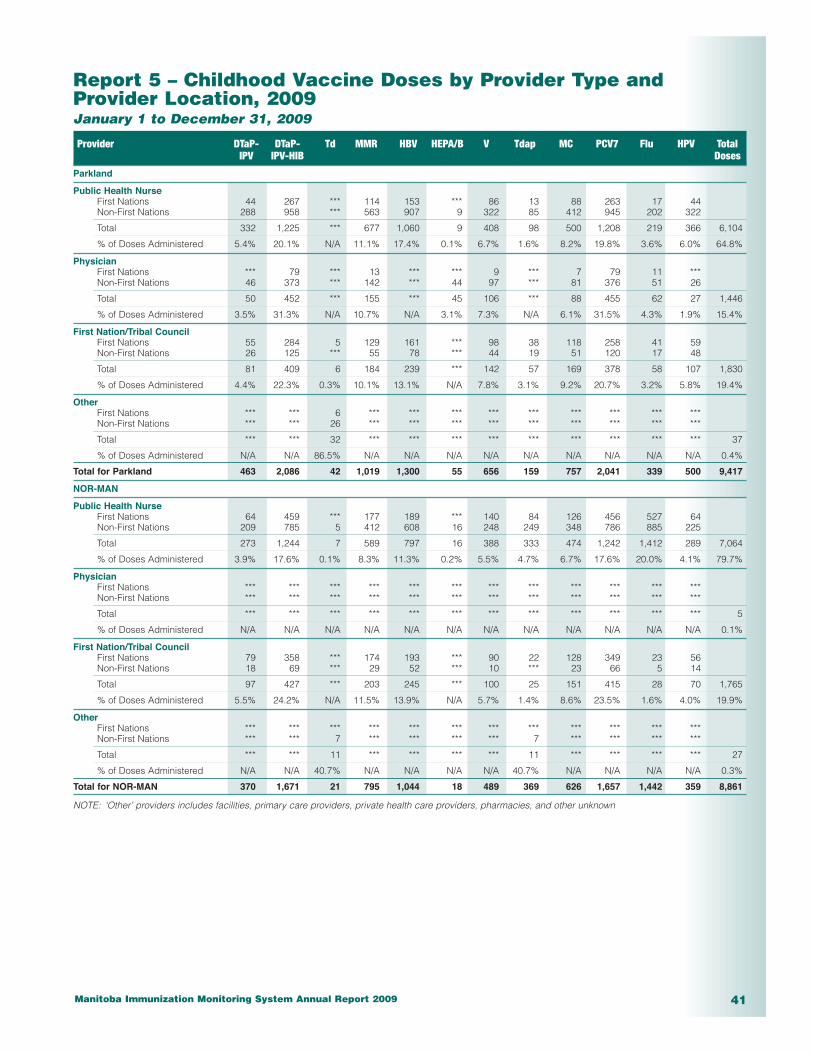
Manitoba Immunization Monitoring System Annual Report 2009 41
Report 5 – Childhood Vaccine Doses by Provider Type andProvider Location, 2009January 1 to December 31, 2009
Provider DTaP- DTaP- Td MMR HBV HEPA/B V Tdap MC PCV7 Flu HPV Total IPV IPV-HIB Doses
Parkland
Public Health NurseFirst Nations 44 267 *** 114 153 *** 86 13 88 263 17 44Non-First Nations 288 958 *** 563 907 9 322 85 412 945 202 322
Total 332 1,225 *** 677 1,060 9 408 98 500 1,208 219 366 6,104
% of Doses Administered 5.4% 20.1% N/A 11.1% 17.4% 0.1% 6.7% 1.6% 8.2% 19.8% 3.6% 6.0% 64.8%
PhysicianFirst Nations *** 79 *** 13 *** *** 9 *** 7 79 11 ***Non-First Nations 46 373 *** 142 *** 44 97 *** 81 376 51 26
Total 50 452 *** 155 *** 45 106 *** 88 455 62 27 1,446
% of Doses Administered 3.5% 31.3% N/A 10.7% N/A 3.1% 7.3% N/A 6.1% 31.5% 4.3% 1.9% 15.4%
First Nation/Tribal CouncilFirst Nations 55 284 5 129 161 *** 98 38 118 258 41 59Non-First Nations 26 125 *** 55 78 *** 44 19 51 120 17 48
Total 81 409 6 184 239 *** 142 57 169 378 58 107 1,830
% of Doses Administered 4.4% 22.3% 0.3% 10.1% 13.1% N/A 7.8% 3.1% 9.2% 20.7% 3.2% 5.8% 19.4%
OtherFirst Nations *** *** 6 *** *** *** *** *** *** *** *** ***Non-First Nations *** *** 26 *** *** *** *** *** *** *** *** ***
Total *** *** 32 *** *** *** *** *** *** *** *** *** 37
% of Doses Administered N/A N/A 86.5% N/A N/A N/A N/A N/A N/A N/A N/A N/A 0.4%
Total for Parkland 463 2,086 42 1,019 1,300 55 656 159 757 2,041 339 500 9,417
NOR-MAN
Public Health NurseFirst Nations 64 459 *** 177 189 *** 140 84 126 456 527 64Non-First Nations 209 785 5 412 608 16 248 249 348 786 885 225
Total 273 1,244 7 589 797 16 388 333 474 1,242 1,412 289 7,064
% of Doses Administered 3.9% 17.6% 0.1% 8.3% 11.3% 0.2% 5.5% 4.7% 6.7% 17.6% 20.0% 4.1% 79.7%
PhysicianFirst Nations *** *** *** *** *** *** *** *** *** *** *** ***Non-First Nations *** *** *** *** *** *** *** *** *** *** *** ***
Total *** *** *** *** *** *** *** *** *** *** *** *** 5
% of Doses Administered N/A N/A N/A N/A N/A N/A N/A N/A N/A N/A N/A N/A 0.1%
First Nation/Tribal CouncilFirst Nations 79 358 *** 174 193 *** 90 22 128 349 23 56Non-First Nations 18 69 *** 29 52 *** 10 *** 23 66 5 14
Total 97 427 *** 203 245 *** 100 25 151 415 28 70 1,765
% of Doses Administered 5.5% 24.2% N/A 11.5% 13.9% N/A 5.7% 1.4% 8.6% 23.5% 1.6% 4.0% 19.9%
OtherFirst Nations *** *** *** *** *** *** *** *** *** *** *** ***Non-First Nations *** *** 7 *** *** *** *** 7 *** *** *** ***
Total *** *** 11 *** *** *** *** 11 *** *** *** *** 27
% of Doses Administered N/A N/A 40.7% N/A N/A N/A N/A 40.7% N/A N/A N/A N/A 0.3%
Total for NOR-MAN 370 1,671 21 795 1,044 18 489 369 626 1,657 1,442 359 8,861
NOTE: ‘Other’ providers includes facilities, primary care providers, private health care providers, pharmacies, and other unknown
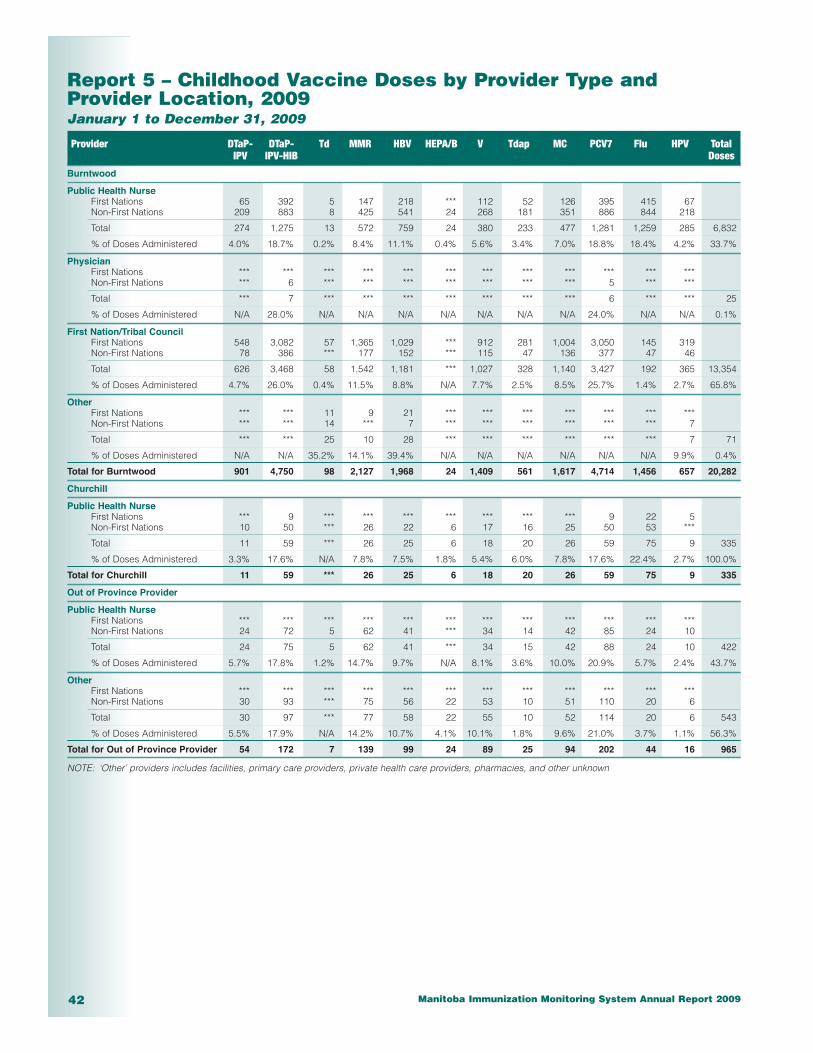
Manitoba Immunization Monitoring System Annual Report 200942
Report 5 – Childhood Vaccine Doses by Provider Type andProvider Location, 2009January 1 to December 31, 2009
Provider DTaP- DTaP- Td MMR HBV HEPA/B V Tdap MC PCV7 Flu HPV Total IPV IPV-HIB Doses
Burntwood
Public Health NurseFirst Nations 65 392 5 147 218 *** 112 52 126 395 415 67Non-First Nations 209 883 8 425 541 24 268 181 351 886 844 218
Total 274 1,275 13 572 759 24 380 233 477 1,281 1,259 285 6,832
% of Doses Administered 4.0% 18.7% 0.2% 8.4% 11.1% 0.4% 5.6% 3.4% 7.0% 18.8% 18.4% 4.2% 33.7%
PhysicianFirst Nations *** *** *** *** *** *** *** *** *** *** *** ***Non-First Nations *** 6 *** *** *** *** *** *** *** 5 *** ***
Total *** 7 *** *** *** *** *** *** *** 6 *** *** 25
% of Doses Administered N/A 28.0% N/A N/A N/A N/A N/A N/A N/A 24.0% N/A N/A 0.1%
First Nation/Tribal CouncilFirst Nations 548 3,082 57 1,365 1,029 *** 912 281 1,004 3,050 145 319Non-First Nations 78 386 *** 177 152 *** 115 47 136 377 47 46
Total 626 3,468 58 1,542 1,181 *** 1,027 328 1,140 3,427 192 365 13,354
% of Doses Administered 4.7% 26.0% 0.4% 11.5% 8.8% N/A 7.7% 2.5% 8.5% 25.7% 1.4% 2.7% 65.8%
OtherFirst Nations *** *** 11 9 21 *** *** *** *** *** *** ***Non-First Nations *** *** 14 *** 7 *** *** *** *** *** *** 7
Total *** *** 25 10 28 *** *** *** *** *** *** 7 71
% of Doses Administered N/A N/A 35.2% 14.1% 39.4% N/A N/A N/A N/A N/A N/A 9.9% 0.4%
Total for Burntwood 901 4,750 98 2,127 1,968 24 1,409 561 1,617 4,714 1,456 657 20,282
Churchill
Public Health NurseFirst Nations *** 9 *** *** *** *** *** *** *** 9 22 5Non-First Nations 10 50 *** 26 22 6 17 16 25 50 53 ***
Total 11 59 *** 26 25 6 18 20 26 59 75 9 335
% of Doses Administered 3.3% 17.6% N/A 7.8% 7.5% 1.8% 5.4% 6.0% 7.8% 17.6% 22.4% 2.7% 100.0%
Total for Churchill 11 59 *** 26 25 6 18 20 26 59 75 9 335
Out of Province Provider
Public Health NurseFirst Nations *** *** *** *** *** *** *** *** *** *** *** ***Non-First Nations 24 72 5 62 41 *** 34 14 42 85 24 10
Total 24 75 5 62 41 *** 34 15 42 88 24 10 422
% of Doses Administered 5.7% 17.8% 1.2% 14.7% 9.7% N/A 8.1% 3.6% 10.0% 20.9% 5.7% 2.4% 43.7%
OtherFirst Nations *** *** *** *** *** *** *** *** *** *** *** ***Non-First Nations 30 93 *** 75 56 22 53 10 51 110 20 6
Total 30 97 *** 77 58 22 55 10 52 114 20 6 543
% of Doses Administered 5.5% 17.9% N/A 14.2% 10.7% 4.1% 10.1% 1.8% 9.6% 21.0% 3.7% 1.1% 56.3%
Total for Out of Province Provider 54 172 7 139 99 24 89 25 94 202 44 16 965
NOTE: ‘Other’ providers includes facilities, primary care providers, private health care providers, pharmacies, and other unknown
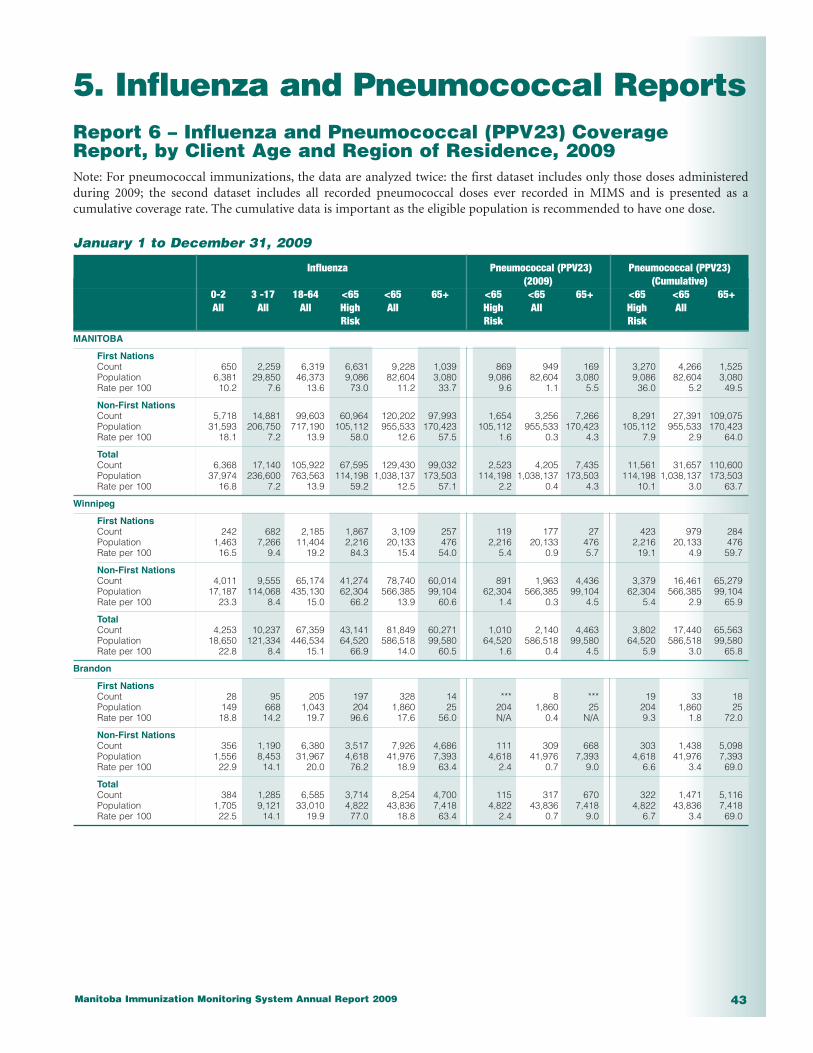
Manitoba Immunization Monitoring System Annual Report 2009 43
5. Influenza and Pneumococcal ReportsReport 6 – Influenza and Pneumococcal (PPV23) CoverageReport, by Client Age and Region of Residence, 2009Note: For pneumococcal immunizations, the data are analyzed twice: the first dataset includes only those doses administeredduring 2009; the second dataset includes all recorded pneumococcal doses ever recorded in MIMS and is presented as acumulative coverage rate. The cumulative data is important as the eligible population is recommended to have one dose.
January 1 to December 31, 2009
Influenza Pneumococcal (PPV23) Pneumococcal (PPV23)(2009) (Cumulative)
0-2 3 -17 18-64 <65 <65 65+ <65 <65 65+ <65 <65 65+All All All High All High All High All
Risk Risk Risk
MANITOBA
First NationsCount 650 2,259 6,319 6,631 9,228 1,039 869 949 169 3,270 4,266 1,525Population 6,381 29,850 46,373 9,086 82,604 3,080 9,086 82,604 3,080 9,086 82,604 3,080Rate per 100 10.2 7.6 13.6 73.0 11.2 33.7 9.6 1.1 5.5 36.0 5.2 49.5
Non-First NationsCount 5,718 14,881 99,603 60,964 120,202 97,993 1,654 3,256 7,266 8,291 27,391 109,075Population 31,593 206,750 717,190 105,112 955,533 170,423 105,112 955,533 170,423 105,112 955,533 170,423Rate per 100 18.1 7.2 13.9 58.0 12.6 57.5 1.6 0.3 4.3 7.9 2.9 64.0
TotalCount 6,368 17,140 105,922 67,595 129,430 99,032 2,523 4,205 7,435 11,561 31,657 110,600Population 37,974 236,600 763,563 114,198 1,038,137 173,503 114,198 1,038,137 173,503 114,198 1,038,137 173,503Rate per 100 16.8 7.2 13.9 59.2 12.5 57.1 2.2 0.4 4.3 10.1 3.0 63.7
Winnipeg
First NationsCount 242 682 2,185 1,867 3,109 257 119 177 27 423 979 284Population 1,463 7,266 11,404 2,216 20,133 476 2,216 20,133 476 2,216 20,133 476Rate per 100 16.5 9.4 19.2 84.3 15.4 54.0 5.4 0.9 5.7 19.1 4.9 59.7
Non-First NationsCount 4,011 9,555 65,174 41,274 78,740 60,014 891 1,963 4,436 3,379 16,461 65,279Population 17,187 114,068 435,130 62,304 566,385 99,104 62,304 566,385 99,104 62,304 566,385 99,104Rate per 100 23.3 8.4 15.0 66.2 13.9 60.6 1.4 0.3 4.5 5.4 2.9 65.9
TotalCount 4,253 10,237 67,359 43,141 81,849 60,271 1,010 2,140 4,463 3,802 17,440 65,563Population 18,650 121,334 446,534 64,520 586,518 99,580 64,520 586,518 99,580 64,520 586,518 99,580Rate per 100 22.8 8.4 15.1 66.9 14.0 60.5 1.6 0.4 4.5 5.9 3.0 65.8
Brandon
First NationsCount 28 95 205 197 328 14 *** 8 *** 19 33 18Population 149 668 1,043 204 1,860 25 204 1,860 25 204 1,860 25Rate per 100 18.8 14.2 19.7 96.6 17.6 56.0 N/A 0.4 N/A 9.3 1.8 72.0
Non-First NationsCount 356 1,190 6,380 3,517 7,926 4,686 111 309 668 303 1,438 5,098Population 1,556 8,453 31,967 4,618 41,976 7,393 4,618 41,976 7,393 4,618 41,976 7,393Rate per 100 22.9 14.1 20.0 76.2 18.9 63.4 2.4 0.7 9.0 6.6 3.4 69.0
TotalCount 384 1,285 6,585 3,714 8,254 4,700 115 317 670 322 1,471 5,116Population 1,705 9,121 33,010 4,822 43,836 7,418 4,822 43,836 7,418 4,822 43,836 7,418Rate per 100 22.5 14.1 19.9 77.0 18.8 63.4 2.4 0.7 9.0 6.7 3.4 69.0
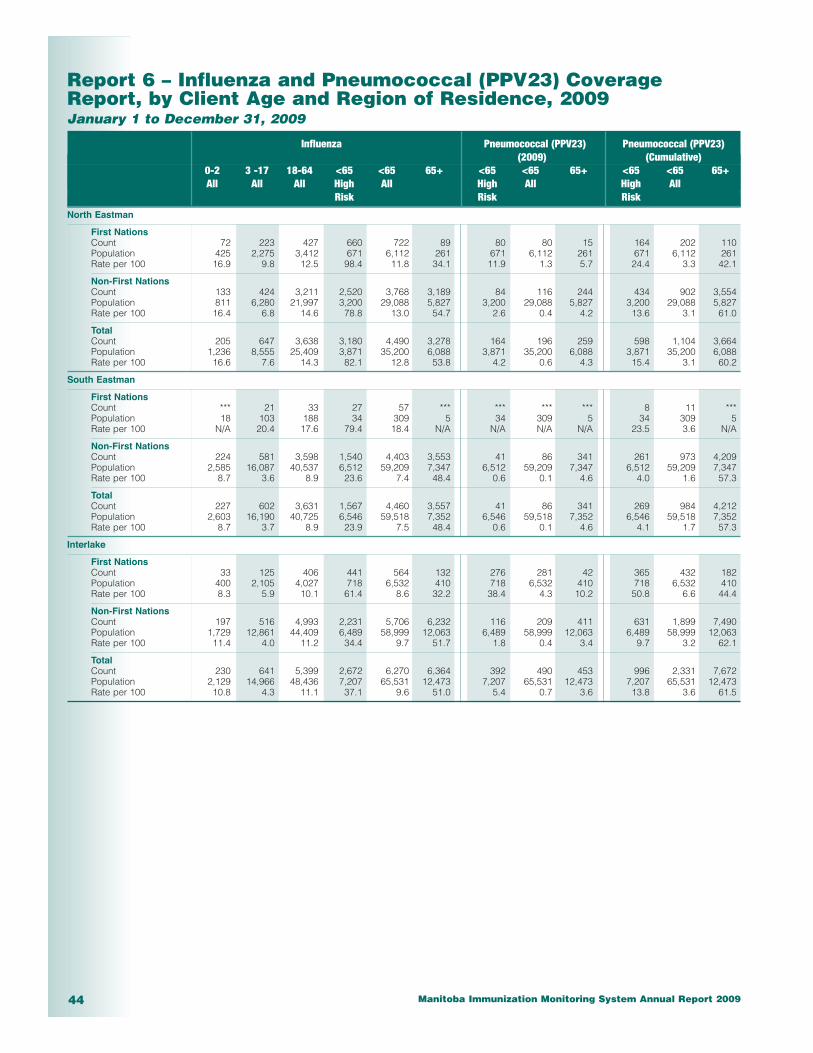
Manitoba Immunization Monitoring System Annual Report 200944
Report 6 – Influenza and Pneumococcal (PPV23) CoverageReport, by Client Age and Region of Residence, 2009January 1 to December 31, 2009
Influenza Pneumococcal (PPV23) Pneumococcal (PPV23)(2009) (Cumulative)
0-2 3 -17 18-64 <65 <65 65+ <65 <65 65+ <65 <65 65+All All All High All High All High All
Risk Risk Risk
North Eastman
First NationsCount 72 223 427 660 722 89 80 80 15 164 202 110Population 425 2,275 3,412 671 6,112 261 671 6,112 261 671 6,112 261Rate per 100 16.9 9.8 12.5 98.4 11.8 34.1 11.9 1.3 5.7 24.4 3.3 42.1
Non-First NationsCount 133 424 3,211 2,520 3,768 3,189 84 116 244 434 902 3,554Population 811 6,280 21,997 3,200 29,088 5,827 3,200 29,088 5,827 3,200 29,088 5,827Rate per 100 16.4 6.8 14.6 78.8 13.0 54.7 2.6 0.4 4.2 13.6 3.1 61.0
TotalCount 205 647 3,638 3,180 4,490 3,278 164 196 259 598 1,104 3,664Population 1,236 8,555 25,409 3,871 35,200 6,088 3,871 35,200 6,088 3,871 35,200 6,088Rate per 100 16.6 7.6 14.3 82.1 12.8 53.8 4.2 0.6 4.3 15.4 3.1 60.2
South Eastman
First NationsCount *** 21 33 27 57 *** *** *** *** 8 11 ***Population 18 103 188 34 309 5 34 309 5 34 309 5Rate per 100 N/A 20.4 17.6 79.4 18.4 N/A N/A N/A N/A 23.5 3.6 N/A
Non-First NationsCount 224 581 3,598 1,540 4,403 3,553 41 86 341 261 973 4,209Population 2,585 16,087 40,537 6,512 59,209 7,347 6,512 59,209 7,347 6,512 59,209 7,347Rate per 100 8.7 3.6 8.9 23.6 7.4 48.4 0.6 0.1 4.6 4.0 1.6 57.3
TotalCount 227 602 3,631 1,567 4,460 3,557 41 86 341 269 984 4,212Population 2,603 16,190 40,725 6,546 59,518 7,352 6,546 59,518 7,352 6,546 59,518 7,352Rate per 100 8.7 3.7 8.9 23.9 7.5 48.4 0.6 0.1 4.6 4.1 1.7 57.3
Interlake
First NationsCount 33 125 406 441 564 132 276 281 42 365 432 182Population 400 2,105 4,027 718 6,532 410 718 6,532 410 718 6,532 410Rate per 100 8.3 5.9 10.1 61.4 8.6 32.2 38.4 4.3 10.2 50.8 6.6 44.4
Non-First NationsCount 197 516 4,993 2,231 5,706 6,232 116 209 411 631 1,899 7,490Population 1,729 12,861 44,409 6,489 58,999 12,063 6,489 58,999 12,063 6,489 58,999 12,063Rate per 100 11.4 4.0 11.2 34.4 9.7 51.7 1.8 0.4 3.4 9.7 3.2 62.1
TotalCount 230 641 5,399 2,672 6,270 6,364 392 490 453 996 2,331 7,672Population 2,129 14,966 48,436 7,207 65,531 12,473 7,207 65,531 12,473 7,207 65,531 12,473Rate per 100 10.8 4.3 11.1 37.1 9.6 51.0 5.4 0.7 3.6 13.8 3.6 61.5
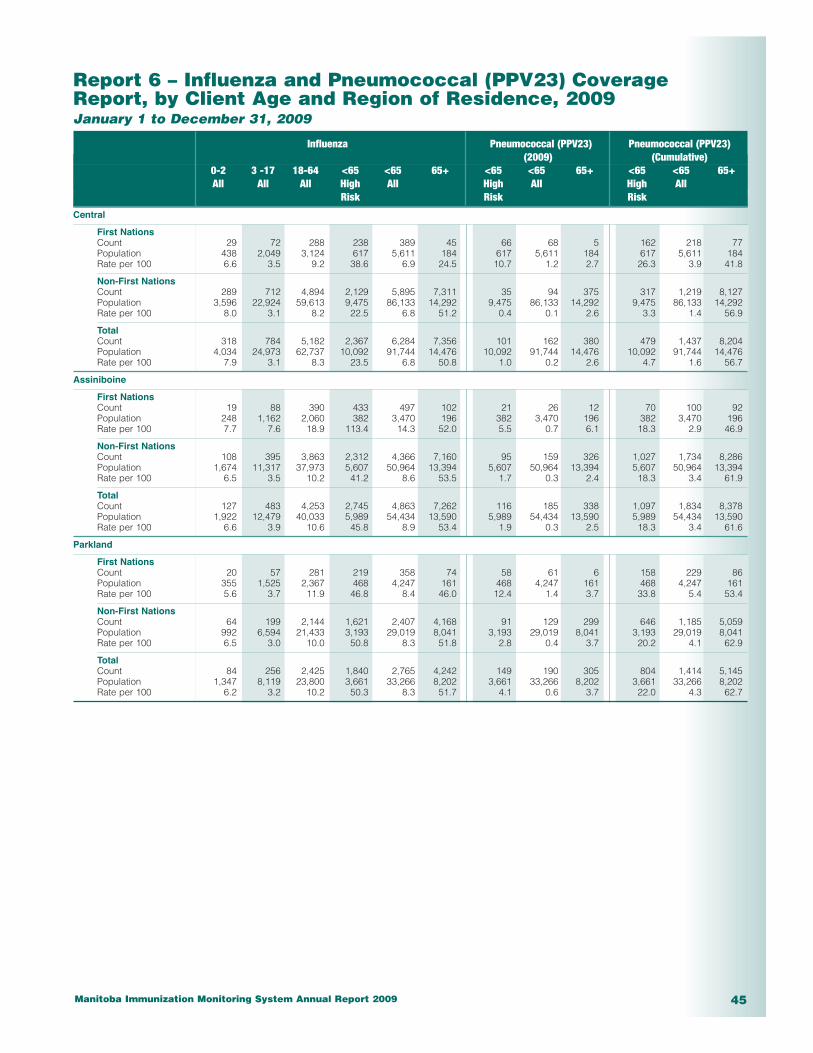
Manitoba Immunization Monitoring System Annual Report 2009 45
Report 6 – Influenza and Pneumococcal (PPV23) CoverageReport, by Client Age and Region of Residence, 2009January 1 to December 31, 2009
Influenza Pneumococcal (PPV23) Pneumococcal (PPV23)(2009) (Cumulative)
0-2 3 -17 18-64 <65 <65 65+ <65 <65 65+ <65 <65 65+All All All High All High All High All
Risk Risk Risk
Central
First NationsCount 29 72 288 238 389 45 66 68 5 162 218 77Population 438 2,049 3,124 617 5,611 184 617 5,611 184 617 5,611 184Rate per 100 6.6 3.5 9.2 38.6 6.9 24.5 10.7 1.2 2.7 26.3 3.9 41.8
Non-First NationsCount 289 712 4,894 2,129 5,895 7,311 35 94 375 317 1,219 8,127Population 3,596 22,924 59,613 9,475 86,133 14,292 9,475 86,133 14,292 9,475 86,133 14,292Rate per 100 8.0 3.1 8.2 22.5 6.8 51.2 0.4 0.1 2.6 3.3 1.4 56.9
TotalCount 318 784 5,182 2,367 6,284 7,356 101 162 380 479 1,437 8,204Population 4,034 24,973 62,737 10,092 91,744 14,476 10,092 91,744 14,476 10,092 91,744 14,476Rate per 100 7.9 3.1 8.3 23.5 6.8 50.8 1.0 0.2 2.6 4.7 1.6 56.7
Assiniboine
First NationsCount 19 88 390 433 497 102 21 26 12 70 100 92Population 248 1,162 2,060 382 3,470 196 382 3,470 196 382 3,470 196Rate per 100 7.7 7.6 18.9 113.4 14.3 52.0 5.5 0.7 6.1 18.3 2.9 46.9
Non-First NationsCount 108 395 3,863 2,312 4,366 7,160 95 159 326 1,027 1,734 8,286Population 1,674 11,317 37,973 5,607 50,964 13,394 5,607 50,964 13,394 5,607 50,964 13,394Rate per 100 6.5 3.5 10.2 41.2 8.6 53.5 1.7 0.3 2.4 18.3 3.4 61.9
TotalCount 127 483 4,253 2,745 4,863 7,262 116 185 338 1,097 1,834 8,378Population 1,922 12,479 40,033 5,989 54,434 13,590 5,989 54,434 13,590 5,989 54,434 13,590Rate per 100 6.6 3.9 10.6 45.8 8.9 53.4 1.9 0.3 2.5 18.3 3.4 61.6
Parkland
First NationsCount 20 57 281 219 358 74 58 61 6 158 229 86Population 355 1,525 2,367 468 4,247 161 468 4,247 161 468 4,247 161Rate per 100 5.6 3.7 11.9 46.8 8.4 46.0 12.4 1.4 3.7 33.8 5.4 53.4
Non-First NationsCount 64 199 2,144 1,621 2,407 4,168 91 129 299 646 1,185 5,059Population 992 6,594 21,433 3,193 29,019 8,041 3,193 29,019 8,041 3,193 29,019 8,041Rate per 100 6.5 3.0 10.0 50.8 8.3 51.8 2.8 0.4 3.7 20.2 4.1 62.9
TotalCount 84 256 2,425 1,840 2,765 4,242 149 190 305 804 1,414 5,145Population 1,347 8,119 23,800 3,661 33,266 8,202 3,661 33,266 8,202 3,661 33,266 8,202Rate per 100 6.2 3.2 10.2 50.3 8.3 51.7 4.1 0.6 3.7 22.0 4.3 62.7
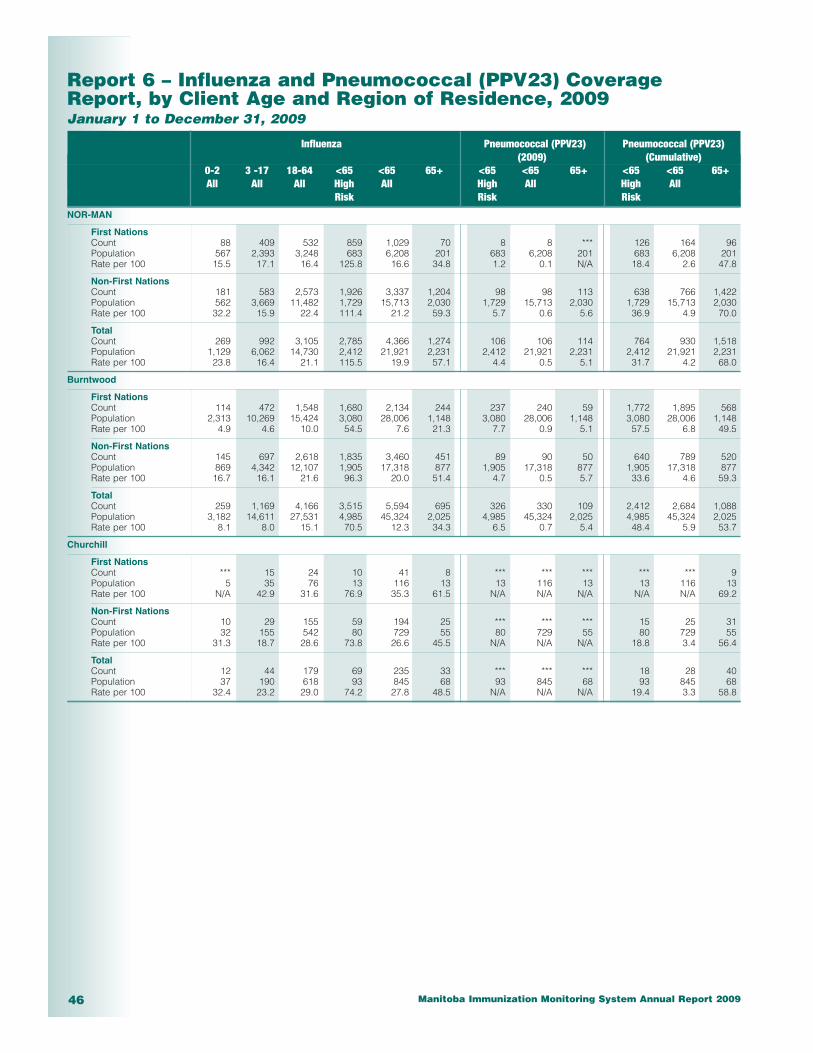
Manitoba Immunization Monitoring System Annual Report 200946
Report 6 – Influenza and Pneumococcal (PPV23) CoverageReport, by Client Age and Region of Residence, 2009January 1 to December 31, 2009
Influenza Pneumococcal (PPV23) Pneumococcal (PPV23)(2009) (Cumulative)
0-2 3 -17 18-64 <65 <65 65+ <65 <65 65+ <65 <65 65+All All All High All High All High All
Risk Risk Risk
NOR-MAN
First NationsCount 88 409 532 859 1,029 70 8 8 *** 126 164 96Population 567 2,393 3,248 683 6,208 201 683 6,208 201 683 6,208 201Rate per 100 15.5 17.1 16.4 125.8 16.6 34.8 1.2 0.1 N/A 18.4 2.6 47.8
Non-First NationsCount 181 583 2,573 1,926 3,337 1,204 98 98 113 638 766 1,422Population 562 3,669 11,482 1,729 15,713 2,030 1,729 15,713 2,030 1,729 15,713 2,030Rate per 100 32.2 15.9 22.4 111.4 21.2 59.3 5.7 0.6 5.6 36.9 4.9 70.0
TotalCount 269 992 3,105 2,785 4,366 1,274 106 106 114 764 930 1,518Population 1,129 6,062 14,730 2,412 21,921 2,231 2,412 21,921 2,231 2,412 21,921 2,231Rate per 100 23.8 16.4 21.1 115.5 19.9 57.1 4.4 0.5 5.1 31.7 4.2 68.0
Burntwood
First NationsCount 114 472 1,548 1,680 2,134 244 237 240 59 1,772 1,895 568Population 2,313 10,269 15,424 3,080 28,006 1,148 3,080 28,006 1,148 3,080 28,006 1,148Rate per 100 4.9 4.6 10.0 54.5 7.6 21.3 7.7 0.9 5.1 57.5 6.8 49.5
Non-First NationsCount 145 697 2,618 1,835 3,460 451 89 90 50 640 789 520Population 869 4,342 12,107 1,905 17,318 877 1,905 17,318 877 1,905 17,318 877Rate per 100 16.7 16.1 21.6 96.3 20.0 51.4 4.7 0.5 5.7 33.6 4.6 59.3
TotalCount 259 1,169 4,166 3,515 5,594 695 326 330 109 2,412 2,684 1,088Population 3,182 14,611 27,531 4,985 45,324 2,025 4,985 45,324 2,025 4,985 45,324 2,025Rate per 100 8.1 8.0 15.1 70.5 12.3 34.3 6.5 0.7 5.4 48.4 5.9 53.7
Churchill
First NationsCount *** 15 24 10 41 8 *** *** *** *** *** 9Population 5 35 76 13 116 13 13 116 13 13 116 13Rate per 100 N/A 42.9 31.6 76.9 35.3 61.5 N/A N/A N/A N/A N/A 69.2
Non-First NationsCount 10 29 155 59 194 25 *** *** *** 15 25 31Population 32 155 542 80 729 55 80 729 55 80 729 55Rate per 100 31.3 18.7 28.6 73.8 26.6 45.5 N/A N/A N/A 18.8 3.4 56.4
TotalCount 12 44 179 69 235 33 *** *** *** 18 28 40Population 37 190 618 93 845 68 93 845 68 93 845 68Rate per 100 32.4 23.2 29.0 74.2 27.8 48.5 N/A N/A N/A 19.4 3.3 58.8

Manitoba Immunization Monitoring System Annual Report 2009 47
Report 7 – Influenza Vaccine Doses by Reason for Immunization,Provider Type and Provider Location, 2009January 1 to December 31, 2009
Health Care High Risk Household No Reason No Risk Outbreak Total Worker Contact Given Identified Immunization Doses
MANITOBA
Public Health NurseFirst Nations Doses 106 4,008 910 *** 10 *** 5,036
% 0.0 1.7 0.4 N/A 0.0 N/A 2.2
Non-First Nations Doses 5,336 94,195 11,268 100 195 *** 111,09% 2.3 40.4 4.8 0.0 0.1 N/A 47.6
TOTAL Doses 5,442 98,203 12,178 102 205 *** 116,13% 2.3 42.1 5.2 0.0 0.1 N/A 49.8
PhysicianFirst Nations Doses *** 20 *** 1,585 *** *** 1,606
% N/A 0.0 N/A 0.7 N/A N/A 0.7
Non-First Nations Doses 6 380 24 91,085 *** *** 91,495% 0.0 0.2 0.0 39.0 N/A N/A 39.2
TOTAL Doses 6 400 25 92,670 *** *** 93,101% 0.0 0.2 0.0 39.7 N/A N/A 39.9
First Nation/Tribal CouncilFirst Nations Doses 27 3,095 179 *** 45 *** 3,346
% 0.0 1.3 0.1 N/A 0.0 N/A 1.4
Non-First Nations Doses 19 698 63 *** 13 *** 795% 0.0 0.3 0.0 N/A 0.0 N/A 0.3
TOTAL Doses 46 3,793 242 *** 58 *** 4,141% 0.0 1.6 0.1 N/A 0.0 N/A 1.8
OtherFirst Nations Doses 22 515 5 *** 16 *** 558
% 0.0 0.2 0.0 N/A 0.0 N/A 0.2
Non-First Nations Doses 3,361 13,393 113 *** 2,506 *** 19,376% 1.4 5.7 0.0 N/A 1.1 N/A 8.3
TOTAL Doses 3,383 13,908 118 *** 2,522 *** 19,934% 1.5 6.0 0.1 N/A 1.1 N/A 8.5
Total Doses 8,877 116,304 12,563 92,776 2,785 *** 233,306% 3.8 49.9 5.4 39.8 1.2 N/A 100.0
WINNIPEG
Public Health NurseFirst Nations Doses 35 1,572 232 *** *** *** 1,843
% 0.0 1.0 0.2 N/A N/A N/A 1.2
Non-First Nations Doses 1,703 53,450 3,246 26 85 *** 58,510% 1.1 35.3 2.1 0.0 0.1 N/A 38.6
TOTAL Doses 1,738 55,022 3,478 27 88 *** 60,353% 1.1 36.3 2.3 0.0 0.1 N/A 39.9
PhysicianFirst Nations Doses *** 20 *** 1,277 *** *** 1,298
% N/A 0.0 N/A 0.8 N/A N/A 0.9
Non-First Nations Doses *** 343 17 74,134 *** *** 74,498% N/A 0.2 0.0 49.0 N/A N/A 49.2
TOTAL Doses *** 363 18 75,411 *** *** 75,796% N/A 0.2 0.0 49.8 N/A N/A 50.1
First Nation/Tribal CouncilFirst Nations Doses *** *** *** *** 5 *** 11
% N/A N/A N/A N/A 0.0 N/A 0.0
Non-First Nations Doses *** *** *** *** *** *** 5% N/A N/A N/A N/A N/A N/A 0.0
TOTAL Doses *** 5 *** *** 6 *** 16% N/A 0.0 N/A N/A 0.0 N/A 0.0
OtherFirst Nations Doses 13 422 *** *** 15 *** 454
% 0.0 0.3 N/A N/A 0.0 N/A 0.3
Non-First Nations Doses 2,684 9,567 99 *** 2,427 *** 14,778% 1.8 6.3 0.1 N/A 1.6 N/A 9.8
TOTAL Doses 2,697 9,989 103 *** 2,442 *** 15,232% 1.8 6.6 0.1 N/A 1.6 N/A 10.1
Total Doses 4,441 65,379 3,602 75,439 2,536 *** 151,397% 2.9 43.2 2.4 49.8 1.7 N/A 100.0
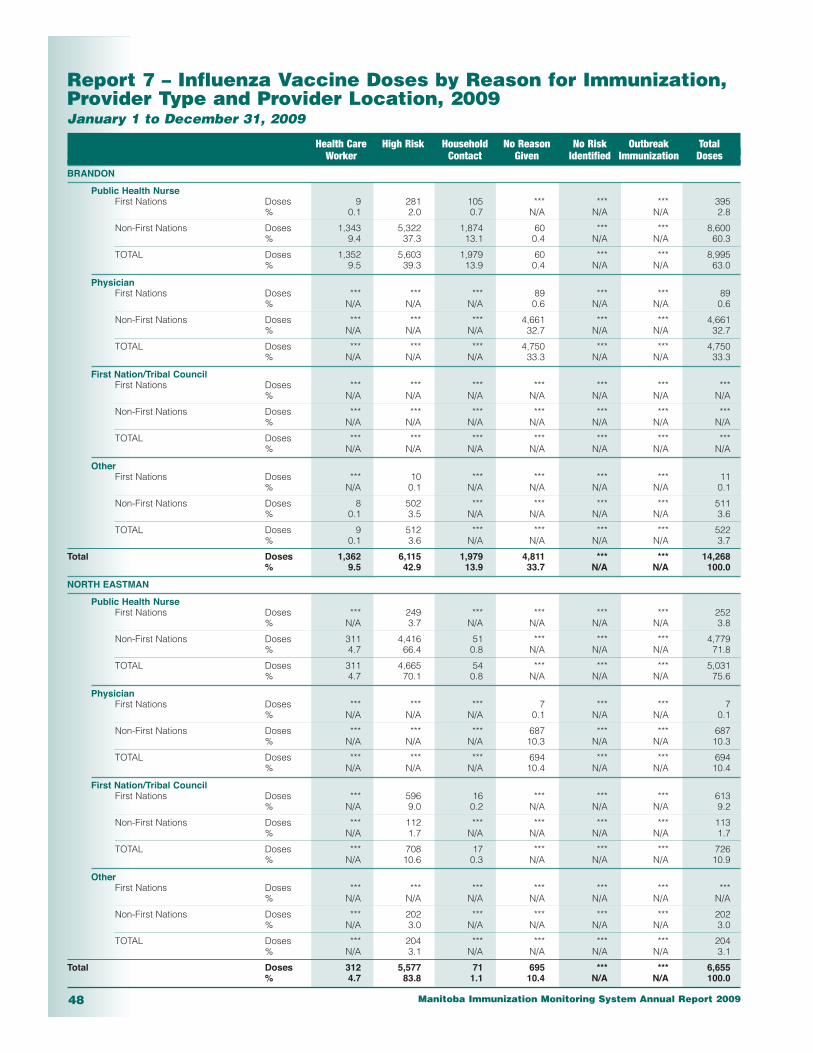
Manitoba Immunization Monitoring System Annual Report 200948
Report 7 – Influenza Vaccine Doses by Reason for Immunization,Provider Type and Provider Location, 2009January 1 to December 31, 2009
Health Care High Risk Household No Reason No Risk Outbreak Total Worker Contact Given Identified Immunization Doses
BRANDON
Public Health NurseFirst Nations Doses 9 281 105 *** *** *** 395
% 0.1 2.0 0.7 N/A N/A N/A 2.8
Non-First Nations Doses 1,343 5,322 1,874 60 *** *** 8,600% 9.4 37.3 13.1 0.4 N/A N/A 60.3
TOTAL Doses 1,352 5,603 1,979 60 *** *** 8,995% 9.5 39.3 13.9 0.4 N/A N/A 63.0
PhysicianFirst Nations Doses *** *** *** 89 *** *** 89
% N/A N/A N/A 0.6 N/A N/A 0.6
Non-First Nations Doses *** *** *** 4,661 *** *** 4,661% N/A N/A N/A 32.7 N/A N/A 32.7
TOTAL Doses *** *** *** 4,750 *** *** 4,750% N/A N/A N/A 33.3 N/A N/A 33.3
First Nation/Tribal CouncilFirst Nations Doses *** *** *** *** *** *** ***
% N/A N/A N/A N/A N/A N/A N/A
Non-First Nations Doses *** *** *** *** *** *** ***% N/A N/A N/A N/A N/A N/A N/A
TOTAL Doses *** *** *** *** *** *** ***% N/A N/A N/A N/A N/A N/A N/A
OtherFirst Nations Doses *** 10 *** *** *** *** 11
% N/A 0.1 N/A N/A N/A N/A 0.1
Non-First Nations Doses 8 502 *** *** *** *** 511% 0.1 3.5 N/A N/A N/A N/A 3.6
TOTAL Doses 9 512 *** *** *** *** 522% 0.1 3.6 N/A N/A N/A N/A 3.7
Total Doses 1,362 6,115 1,979 4,811 *** *** 14,268% 9.5 42.9 13.9 33.7 N/A N/A 100.0
NORTH EASTMAN
Public Health NurseFirst Nations Doses *** 249 *** *** *** *** 252
% N/A 3.7 N/A N/A N/A N/A 3.8
Non-First Nations Doses 311 4,416 51 *** *** *** 4,779% 4.7 66.4 0.8 N/A N/A N/A 71.8
TOTAL Doses 311 4,665 54 *** *** *** 5,031% 4.7 70.1 0.8 N/A N/A N/A 75.6
PhysicianFirst Nations Doses *** *** *** 7 *** *** 7
% N/A N/A N/A 0.1 N/A N/A 0.1
Non-First Nations Doses *** *** *** 687 *** *** 687% N/A N/A N/A 10.3 N/A N/A 10.3
TOTAL Doses *** *** *** 694 *** *** 694% N/A N/A N/A 10.4 N/A N/A 10.4
First Nation/Tribal CouncilFirst Nations Doses *** 596 16 *** *** *** 613
% N/A 9.0 0.2 N/A N/A N/A 9.2
Non-First Nations Doses *** 112 *** *** *** *** 113% N/A 1.7 N/A N/A N/A N/A 1.7
TOTAL Doses *** 708 17 *** *** *** 726% N/A 10.6 0.3 N/A N/A N/A 10.9
OtherFirst Nations Doses *** *** *** *** *** *** ***
% N/A N/A N/A N/A N/A N/A N/A
Non-First Nations Doses *** 202 *** *** *** *** 202% N/A 3.0 N/A N/A N/A N/A 3.0
TOTAL Doses *** 204 *** *** *** *** 204% N/A 3.1 N/A N/A N/A N/A 3.1
Total Doses 312 5,577 71 695 *** *** 6,655% 4.7 83.8 1.1 10.4 N/A N/A 100.0
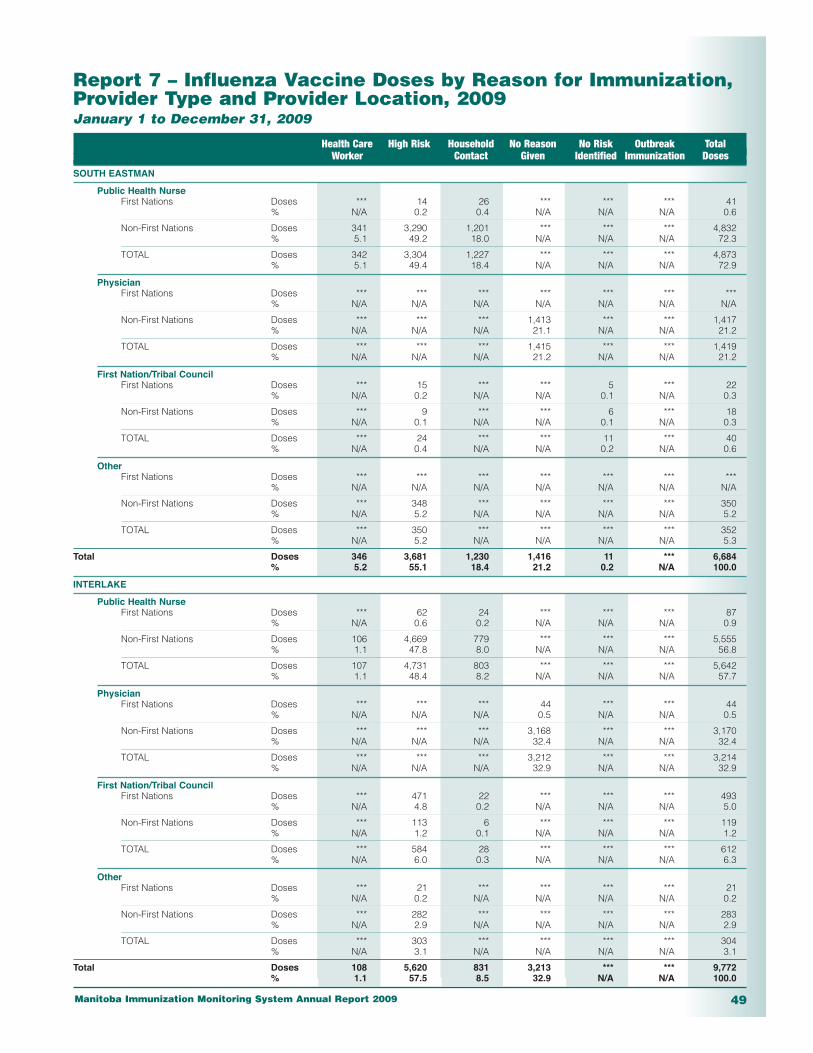
Manitoba Immunization Monitoring System Annual Report 2009 49
Report 7 – Influenza Vaccine Doses by Reason for Immunization,Provider Type and Provider Location, 2009January 1 to December 31, 2009
Health Care High Risk Household No Reason No Risk Outbreak Total Worker Contact Given Identified Immunization Doses
SOUTH EASTMAN
Public Health NurseFirst Nations Doses *** 14 26 *** *** *** 41
% N/A 0.2 0.4 N/A N/A N/A 0.6
Non-First Nations Doses 341 3,290 1,201 *** *** *** 4,832% 5.1 49.2 18.0 N/A N/A N/A 72.3
TOTAL Doses 342 3,304 1,227 *** *** *** 4,873% 5.1 49.4 18.4 N/A N/A N/A 72.9
PhysicianFirst Nations Doses *** *** *** *** *** *** ***
% N/A N/A N/A N/A N/A N/A N/A
Non-First Nations Doses *** *** *** 1,413 *** *** 1,417% N/A N/A N/A 21.1 N/A N/A 21.2
TOTAL Doses *** *** *** 1,415 *** *** 1,419% N/A N/A N/A 21.2 N/A N/A 21.2
First Nation/Tribal CouncilFirst Nations Doses *** 15 *** *** 5 *** 22
% N/A 0.2 N/A N/A 0.1 N/A 0.3
Non-First Nations Doses *** 9 *** *** 6 *** 18% N/A 0.1 N/A N/A 0.1 N/A 0.3
TOTAL Doses *** 24 *** *** 11 *** 40% N/A 0.4 N/A N/A 0.2 N/A 0.6
OtherFirst Nations Doses *** *** *** *** *** *** ***
% N/A N/A N/A N/A N/A N/A N/A
Non-First Nations Doses *** 348 *** *** *** *** 350% N/A 5.2 N/A N/A N/A N/A 5.2
TOTAL Doses *** 350 *** *** *** *** 352% N/A 5.2 N/A N/A N/A N/A 5.3
Total Doses 346 3,681 1,230 1,416 11 *** 6,684% 5.2 55.1 18.4 21.2 0.2 N/A 100.0
INTERLAKE
Public Health NurseFirst Nations Doses *** 62 24 *** *** *** 87
% N/A 0.6 0.2 N/A N/A N/A 0.9
Non-First Nations Doses 106 4,669 779 *** *** *** 5,555% 1.1 47.8 8.0 N/A N/A N/A 56.8
TOTAL Doses 107 4,731 803 *** *** *** 5,642% 1.1 48.4 8.2 N/A N/A N/A 57.7
PhysicianFirst Nations Doses *** *** *** 44 *** *** 44
% N/A N/A N/A 0.5 N/A N/A 0.5
Non-First Nations Doses *** *** *** 3,168 *** *** 3,170% N/A N/A N/A 32.4 N/A N/A 32.4
TOTAL Doses *** *** *** 3,212 *** *** 3,214% N/A N/A N/A 32.9 N/A N/A 32.9
First Nation/Tribal CouncilFirst Nations Doses *** 471 22 *** *** *** 493
% N/A 4.8 0.2 N/A N/A N/A 5.0
Non-First Nations Doses *** 113 6 *** *** *** 119% N/A 1.2 0.1 N/A N/A N/A 1.2
TOTAL Doses *** 584 28 *** *** *** 612% N/A 6.0 0.3 N/A N/A N/A 6.3
OtherFirst Nations Doses *** 21 *** *** *** *** 21
% N/A 0.2 N/A N/A N/A N/A 0.2
Non-First Nations Doses *** 282 *** *** *** *** 283% N/A 2.9 N/A N/A N/A N/A 2.9
TOTAL Doses *** 303 *** *** *** *** 304% N/A 3.1 N/A N/A N/A N/A 3.1
Total Doses 108 5,620 831 3,213 *** *** 9,772% 1.1 57.5 8.5 32.9 N/A N/A 100.0
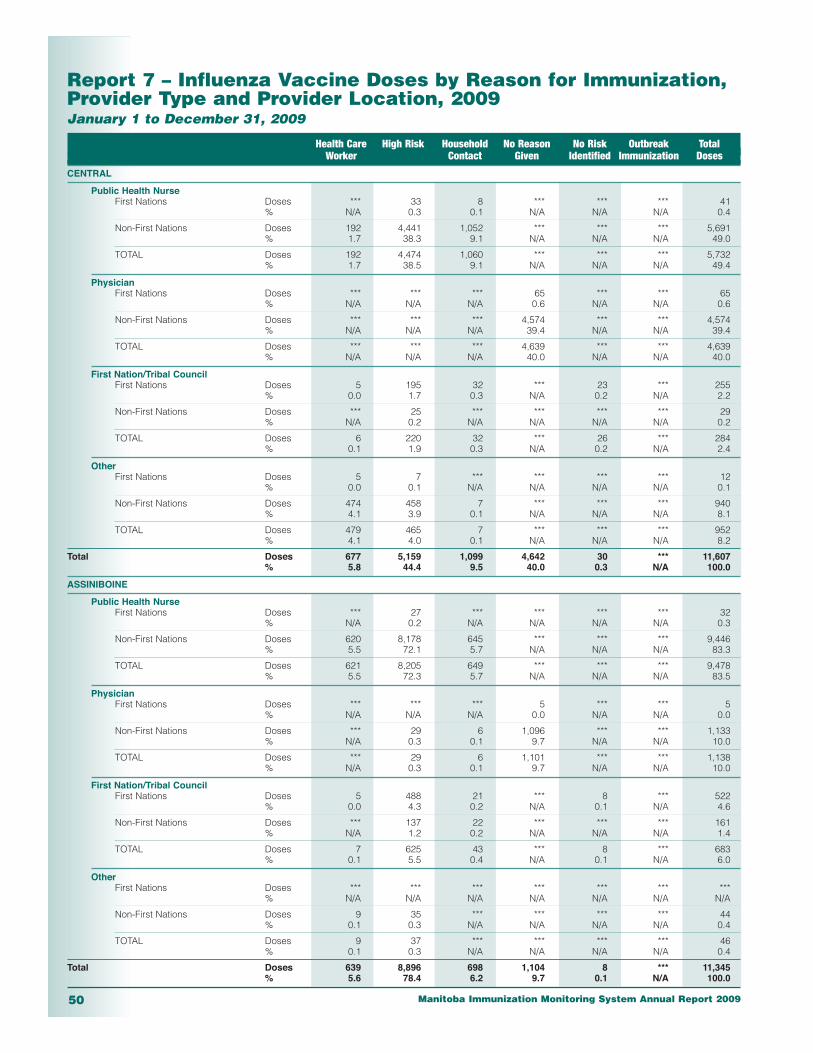
Manitoba Immunization Monitoring System Annual Report 200950
Report 7 – Influenza Vaccine Doses by Reason for Immunization,Provider Type and Provider Location, 2009January 1 to December 31, 2009
Health Care High Risk Household No Reason No Risk Outbreak Total Worker Contact Given Identified Immunization Doses
CENTRAL
Public Health NurseFirst Nations Doses *** 33 8 *** *** *** 41
% N/A 0.3 0.1 N/A N/A N/A 0.4
Non-First Nations Doses 192 4,441 1,052 *** *** *** 5,691% 1.7 38.3 9.1 N/A N/A N/A 49.0
TOTAL Doses 192 4,474 1,060 *** *** *** 5,732% 1.7 38.5 9.1 N/A N/A N/A 49.4
PhysicianFirst Nations Doses *** *** *** 65 *** *** 65
% N/A N/A N/A 0.6 N/A N/A 0.6
Non-First Nations Doses *** *** *** 4,574 *** *** 4,574% N/A N/A N/A 39.4 N/A N/A 39.4
TOTAL Doses *** *** *** 4,639 *** *** 4,639% N/A N/A N/A 40.0 N/A N/A 40.0
First Nation/Tribal CouncilFirst Nations Doses 5 195 32 *** 23 *** 255
% 0.0 1.7 0.3 N/A 0.2 N/A 2.2
Non-First Nations Doses *** 25 *** *** *** *** 29% N/A 0.2 N/A N/A N/A N/A 0.2
TOTAL Doses 6 220 32 *** 26 *** 284% 0.1 1.9 0.3 N/A 0.2 N/A 2.4
OtherFirst Nations Doses 5 7 *** *** *** *** 12
% 0.0 0.1 N/A N/A N/A N/A 0.1
Non-First Nations Doses 474 458 7 *** *** *** 940% 4.1 3.9 0.1 N/A N/A N/A 8.1
TOTAL Doses 479 465 7 *** *** *** 952% 4.1 4.0 0.1 N/A N/A N/A 8.2
Total Doses 677 5,159 1,099 4,642 30 *** 11,607% 5.8 44.4 9.5 40.0 0.3 N/A 100.0
ASSINIBOINE
Public Health NurseFirst Nations Doses *** 27 *** *** *** *** 32
% N/A 0.2 N/A N/A N/A N/A 0.3
Non-First Nations Doses 620 8,178 645 *** *** *** 9,446% 5.5 72.1 5.7 N/A N/A N/A 83.3
TOTAL Doses 621 8,205 649 *** *** *** 9,478% 5.5 72.3 5.7 N/A N/A N/A 83.5
PhysicianFirst Nations Doses *** *** *** 5 *** *** 5
% N/A N/A N/A 0.0 N/A N/A 0.0
Non-First Nations Doses *** 29 6 1,096 *** *** 1,133% N/A 0.3 0.1 9.7 N/A N/A 10.0
TOTAL Doses *** 29 6 1,101 *** *** 1,138% N/A 0.3 0.1 9.7 N/A N/A 10.0
First Nation/Tribal CouncilFirst Nations Doses 5 488 21 *** 8 *** 522
% 0.0 4.3 0.2 N/A 0.1 N/A 4.6
Non-First Nations Doses *** 137 22 *** *** *** 161% N/A 1.2 0.2 N/A N/A N/A 1.4
TOTAL Doses 7 625 43 *** 8 *** 683% 0.1 5.5 0.4 N/A 0.1 N/A 6.0
OtherFirst Nations Doses *** *** *** *** *** *** ***
% N/A N/A N/A N/A N/A N/A N/A
Non-First Nations Doses 9 35 *** *** *** *** 44% 0.1 0.3 N/A N/A N/A N/A 0.4
TOTAL Doses 9 37 *** *** *** *** 46% 0.1 0.3 N/A N/A N/A N/A 0.4
Total Doses 639 8,896 698 1,104 8 *** 11,345% 5.6 78.4 6.2 9.7 0.1 N/A 100.0

Manitoba Immunization Monitoring System Annual Report 2009 51
Report 7 – Influenza Vaccine Doses by Reason for Immunization,Provider Type and Provider Location, 2009January 1 to December 31, 2009
Health Care High Risk Household No Reason No Risk Outbreak Total Worker Contact Given Identified Immunization Doses
PARKLAND
Public Health NurseFirst Nations Doses *** 115 *** *** *** *** 122
% N/A 1.6 N/A N/A N/A N/A 1.7
Non-First Nations Doses 111 5,042 58 *** *** *** 5,215% 1.6 71.6 0.8 N/A N/A N/A 74.1
TOTAL Doses 114 5,157 61 *** 5 *** 5,337% 1.6 73.3 0.9 N/A 0.1 N/A 75.8
PhysicianFirst Nations Doses *** *** *** 92 *** *** 92
% N/A N/A N/A 1.3 N/A N/A 1.3
Non-First Nations Doses *** *** *** 1,287 *** *** 1,290% N/A N/A N/A 18.3 N/A N/A 18.3
TOTAL Doses *** *** *** 1,379 *** *** 1,382% N/A N/A N/A 19.6 N/A N/A 19.6
First Nation/Tribal CouncilFirst Nations Doses 10 166 34 *** *** *** 213
% 0.1 2.4 0.5 N/A N/A N/A 3.0
Non-First Nations Doses 7 58 20 *** *** *** 89% 0.1 0.8 0.3 N/A N/A N/A 1.3
TOTAL Doses 17 224 54 *** 6 *** 302% 0.2 3.2 0.8 N/A 0.1 N/A 4.3
OtherFirst Nations Doses *** *** *** *** *** *** ***
% N/A N/A N/A N/A N/A N/A N/A
Non-First Nations Doses 6 10 *** *** *** *** 17% 0.1 0.1 N/A N/A N/A N/A 0.2
TOTAL Doses 6 10 *** *** *** *** 17% 0.1 0.1 N/A N/A N/A N/A 0.2
Total Doses 137 5,394 115 1,379 12 *** 7,038% 1.9 76.6 1.6 19.6 0.2 N/A 100.0
NOR-MAN
Public Health NurseFirst Nations Doses 8 853 153 *** *** *** 1,014
% 0.1 14.4 2.6 N/A N/A N/A 17.1
Non-First Nations Doses 199 3,116 1,006 5 33 *** 4,359% 3.4 52.6 17.0 0.1 0.6 N/A 73.6
TOTAL Doses 207 3,969 1,159 5 33 *** 5,373% 3.5 67.0 19.6 0.1 0.6 N/A 90.8
PhysicianFirst Nations Doses *** *** *** *** *** *** ***
% N/A N/A N/A N/A N/A N/A N/A
Non-First Nations Doses *** *** *** 46 *** *** 46% N/A N/A N/A 0.8 N/A N/A 0.8
TOTAL Doses *** *** *** 48 *** *** 48% N/A N/A N/A 0.8 N/A N/A 0.8
First Nation/Tribal CouncilFirst Nations Doses *** 119 20 *** *** *** 142
% N/A 2.0 0.3 N/A N/A N/A 2.4
Non-First Nations Doses *** 40 11 *** *** *** 54% N/A 0.7 0.2 N/A N/A N/A 0.9
TOTAL Doses 6 159 31 *** *** *** 196% 0.1 2.7 0.5 N/A N/A N/A 3.3
OtherFirst Nations Doses *** 18 *** *** *** *** 21
% N/A 0.3 N/A N/A N/A N/A 0.4
Non-First Nations Doses 174 108 *** *** *** *** 282% 2.9 1.8 N/A N/A N/A N/A 4.8
TOTAL Doses 176 126 *** *** *** *** 303% 3.0 2.1 N/A N/A N/A N/A 5.1
Total Doses 389 4,254 1,191 53 33 *** 5,920% 6.6 71.9 20.1 0.9 0.6 N/A 100.0
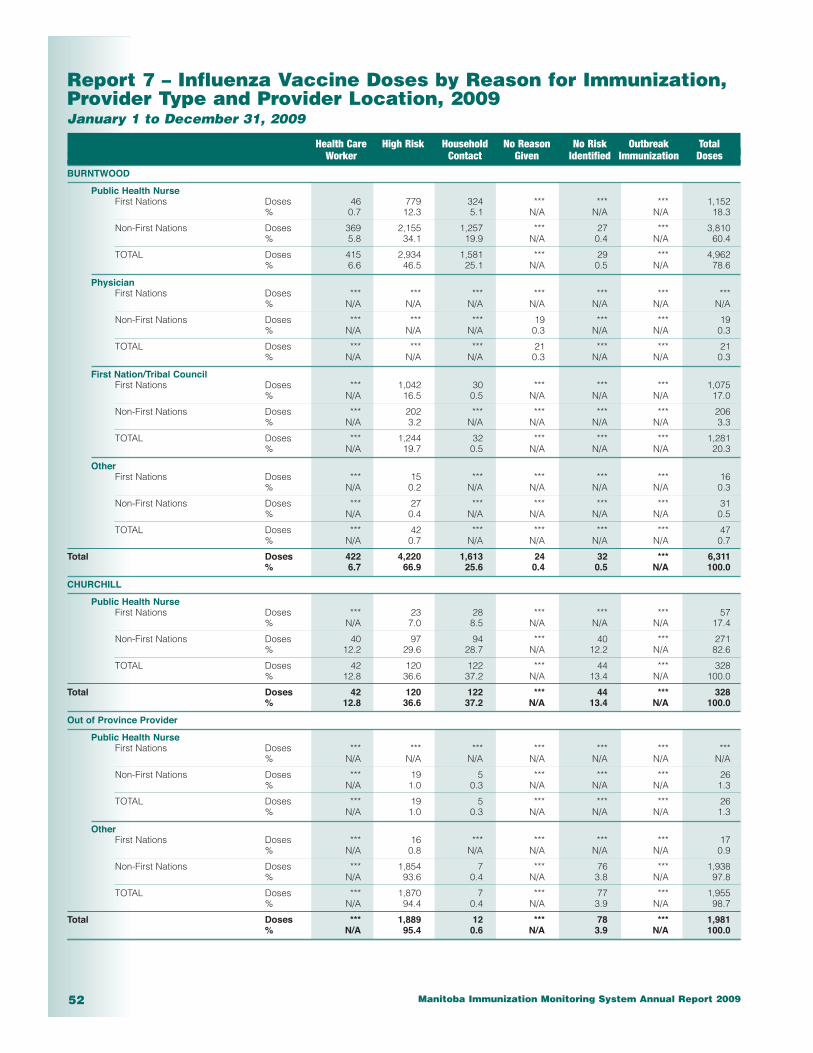
Manitoba Immunization Monitoring System Annual Report 200952
Report 7 – Influenza Vaccine Doses by Reason for Immunization,Provider Type and Provider Location, 2009January 1 to December 31, 2009
Health Care High Risk Household No Reason No Risk Outbreak Total Worker Contact Given Identified Immunization Doses
BURNTWOOD
Public Health NurseFirst Nations Doses 46 779 324 *** *** *** 1,152
% 0.7 12.3 5.1 N/A N/A N/A 18.3
Non-First Nations Doses 369 2,155 1,257 *** 27 *** 3,810% 5.8 34.1 19.9 N/A 0.4 N/A 60.4
TOTAL Doses 415 2,934 1,581 *** 29 *** 4,962% 6.6 46.5 25.1 N/A 0.5 N/A 78.6
PhysicianFirst Nations Doses *** *** *** *** *** *** ***
% N/A N/A N/A N/A N/A N/A N/A
Non-First Nations Doses *** *** *** 19 *** *** 19% N/A N/A N/A 0.3 N/A N/A 0.3
TOTAL Doses *** *** *** 21 *** *** 21% N/A N/A N/A 0.3 N/A N/A 0.3
First Nation/Tribal CouncilFirst Nations Doses *** 1,042 30 *** *** *** 1,075
% N/A 16.5 0.5 N/A N/A N/A 17.0
Non-First Nations Doses *** 202 *** *** *** *** 206% N/A 3.2 N/A N/A N/A N/A 3.3
TOTAL Doses *** 1,244 32 *** *** *** 1,281% N/A 19.7 0.5 N/A N/A N/A 20.3
OtherFirst Nations Doses *** 15 *** *** *** *** 16
% N/A 0.2 N/A N/A N/A N/A 0.3
Non-First Nations Doses *** 27 *** *** *** *** 31% N/A 0.4 N/A N/A N/A N/A 0.5
TOTAL Doses *** 42 *** *** *** *** 47% N/A 0.7 N/A N/A N/A N/A 0.7
Total Doses 422 4,220 1,613 24 32 *** 6,311% 6.7 66.9 25.6 0.4 0.5 N/A 100.0
CHURCHILL
Public Health NurseFirst Nations Doses *** 23 28 *** *** *** 57
% N/A 7.0 8.5 N/A N/A N/A 17.4
Non-First Nations Doses 40 97 94 *** 40 *** 271% 12.2 29.6 28.7 N/A 12.2 N/A 82.6
TOTAL Doses 42 120 122 *** 44 *** 328% 12.8 36.6 37.2 N/A 13.4 N/A 100.0
Total Doses 42 120 122 *** 44 *** 328% 12.8 36.6 37.2 N/A 13.4 N/A 100.0
Out of Province Provider
Public Health NurseFirst Nations Doses *** *** *** *** *** *** ***
% N/A N/A N/A N/A N/A N/A N/A
Non-First Nations Doses *** 19 5 *** *** *** 26% N/A 1.0 0.3 N/A N/A N/A 1.3
TOTAL Doses *** 19 5 *** *** *** 26% N/A 1.0 0.3 N/A N/A N/A 1.3
OtherFirst Nations Doses *** 16 *** *** *** *** 17
% N/A 0.8 N/A N/A N/A N/A 0.9
Non-First Nations Doses *** 1,854 7 *** 76 *** 1,938% N/A 93.6 0.4 N/A 3.8 N/A 97.8
TOTAL Doses *** 1,870 7 *** 77 *** 1,955% N/A 94.4 0.4 N/A 3.9 N/A 98.7
Total Doses *** 1,889 12 *** 78 *** 1,981% N/A 95.4 0.6 N/A 3.9 N/A 100.0
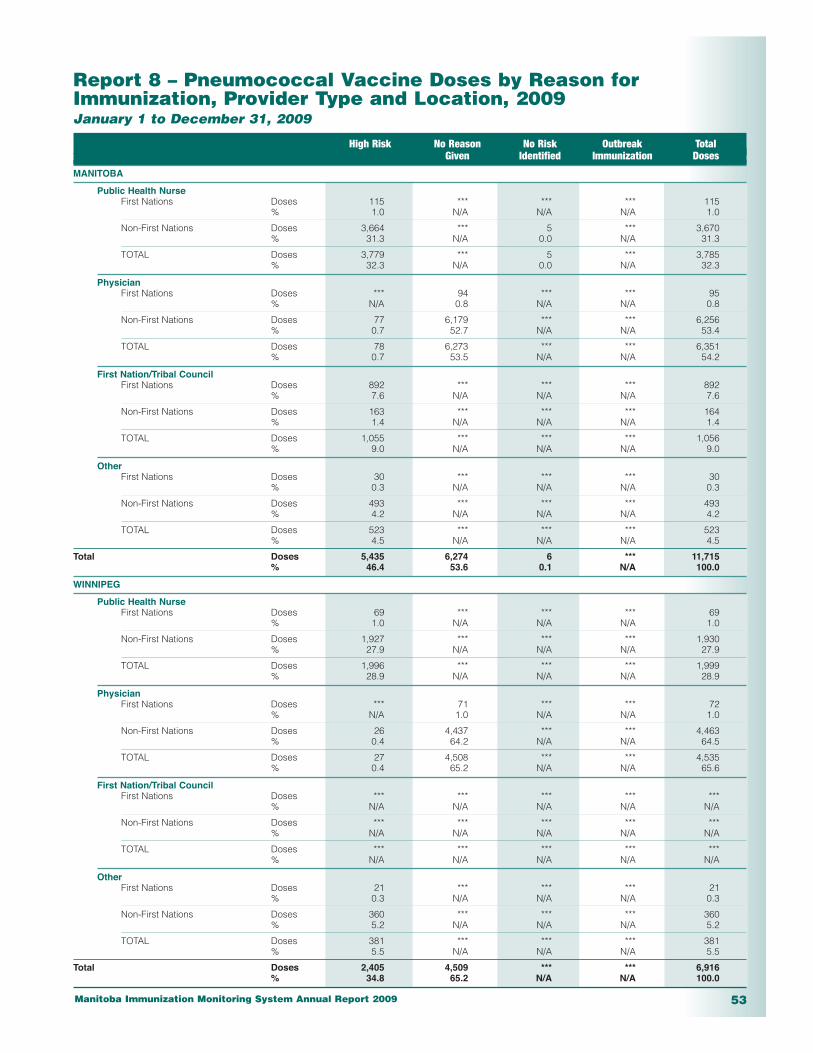
Manitoba Immunization Monitoring System Annual Report 2009 53
Report 8 – Pneumococcal Vaccine Doses by Reason forImmunization, Provider Type and Location, 2009January 1 to December 31, 2009
High Risk No Reason No Risk Outbreak Total Given Identified Immunization Doses
MANITOBA
Public Health NurseFirst Nations Doses 115 *** *** *** 115
% 1.0 N/A N/A N/A 1.0
Non-First Nations Doses 3,664 *** 5 *** 3,670% 31.3 N/A 0.0 N/A 31.3
TOTAL Doses 3,779 *** 5 *** 3,785% 32.3 N/A 0.0 N/A 32.3
PhysicianFirst Nations Doses *** 94 *** *** 95
% N/A 0.8 N/A N/A 0.8
Non-First Nations Doses 77 6,179 *** *** 6,256% 0.7 52.7 N/A N/A 53.4
TOTAL Doses 78 6,273 *** *** 6,351% 0.7 53.5 N/A N/A 54.2
First Nation/Tribal CouncilFirst Nations Doses 892 *** *** *** 892
% 7.6 N/A N/A N/A 7.6
Non-First Nations Doses 163 *** *** *** 164% 1.4 N/A N/A N/A 1.4
TOTAL Doses 1,055 *** *** *** 1,056% 9.0 N/A N/A N/A 9.0
OtherFirst Nations Doses 30 *** *** *** 30
% 0.3 N/A N/A N/A 0.3
Non-First Nations Doses 493 *** *** *** 493% 4.2 N/A N/A N/A 4.2
TOTAL Doses 523 *** *** *** 523% 4.5 N/A N/A N/A 4.5
Total Doses 5,435 6,274 6 *** 11,715% 46.4 53.6 0.1 N/A 100.0
WINNIPEG
Public Health NurseFirst Nations Doses 69 *** *** *** 69
% 1.0 N/A N/A N/A 1.0
Non-First Nations Doses 1,927 *** *** *** 1,930% 27.9 N/A N/A N/A 27.9
TOTAL Doses 1,996 *** *** *** 1,999% 28.9 N/A N/A N/A 28.9
PhysicianFirst Nations Doses *** 71 *** *** 72
% N/A 1.0 N/A N/A 1.0
Non-First Nations Doses 26 4,437 *** *** 4,463% 0.4 64.2 N/A N/A 64.5
TOTAL Doses 27 4,508 *** *** 4,535% 0.4 65.2 N/A N/A 65.6
First Nation/Tribal CouncilFirst Nations Doses *** *** *** *** ***
% N/A N/A N/A N/A N/A
Non-First Nations Doses *** *** *** *** ***% N/A N/A N/A N/A N/A
TOTAL Doses *** *** *** *** ***% N/A N/A N/A N/A N/A
OtherFirst Nations Doses 21 *** *** *** 21
% 0.3 N/A N/A N/A 0.3
Non-First Nations Doses 360 *** *** *** 360% 5.2 N/A N/A N/A 5.2
TOTAL Doses 381 *** *** *** 381% 5.5 N/A N/A N/A 5.5
Total Doses 2,405 4,509 *** *** 6,916% 34.8 65.2 N/A N/A 100.0

Manitoba Immunization Monitoring System Annual Report 200954
Report 8 – Pneumococcal Vaccine Doses by Reason forImmunization, Provider Type and Location, 2009January 1 to December 31, 2009
High Risk No Reason No Risk Outbreak Total Given Identified Immunization Doses
BRANDON
Public Health NurseFirst Nations Doses 5 *** *** *** 5
% 0.4 N/A N/A N/A 0.4
Non-First Nations Doses 211 *** *** *** 211% 18.8 N/A N/A N/A 18.8
TOTAL Doses 216 *** *** *** 216% 19.2 N/A N/A N/A 19.2
PhysicianFirst Nations Doses *** 10 *** *** 10
% N/A 0.9 N/A N/A 0.9
Non-First Nations Doses *** 866 *** *** 866% N/A 77.1 N/A N/A 77.1
TOTAL Doses *** 876 *** *** 876% N/A 78.0 N/A N/A 78.0
First Nation/Tribal CouncilFirst Nations Doses *** *** *** *** ***
% N/A N/A N/A N/A N/A
Non-First Nations Doses *** *** *** *** ***% N/A N/A N/A N/A N/A
TOTAL Doses *** *** *** *** ***% N/A N/A N/A N/A N/A
OtherFirst Nations Doses *** *** *** *** ***
% N/A N/A N/A N/A N/A
Non-First Nations Doses 28 *** *** *** 28% 2.5 N/A N/A N/A 2.5
TOTAL Doses 30 *** *** *** 30% 2.7 N/A N/A N/A 2.7
Total Doses 247 876 *** *** 1,123% 22.0 78.0 N/A N/A 100.0
NORTH EASTMAN
Public Health NurseFirst Nations Doses *** *** *** *** ***
% N/A N/A N/A N/A N/A
Non-First Nations Doses 215 *** *** *** 215% 58.6 N/A N/A N/A 58.6
TOTAL Doses 217 *** *** *** 217% 59.1 N/A N/A N/A 59.1
PhysicianFirst Nations Doses *** *** *** *** ***
% N/A N/A N/A N/A N/A
Non-First Nations Doses *** 34 *** *** 34% N/A 9.3 N/A N/A 9.3
TOTAL Doses *** 37 *** *** 37% N/A 10.1 N/A N/A 10.1
First Nation/Tribal CouncilFirst Nations Doses 93 *** *** *** 93
% 25.3 N/A N/A N/A 25.3
Non-First Nations Doses 9 *** *** *** 9% 2.5 N/A N/A N/A 2.5
TOTAL Doses 102 *** *** *** 102% 27.8 N/A N/A N/A 27.8
OtherFirst Nations Doses *** *** *** *** ***
% N/A N/A N/A N/A N/A
Non-First Nations Doses 11 *** *** *** 11% 3.0 N/A N/A N/A 3.0
TOTAL Doses 11 *** *** *** 11% 3.0 N/A N/A N/A 3.0
Total Doses 330 37 *** *** 367% 89.9 10.1 N/A N/A 100.0
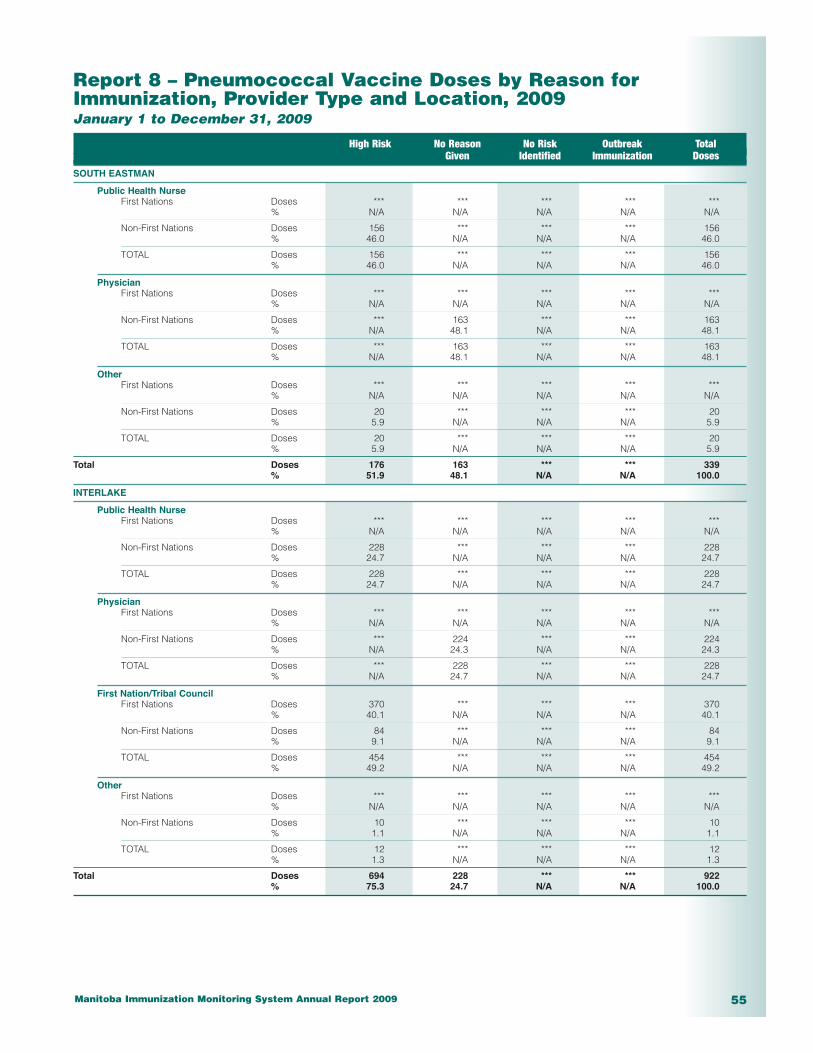
Manitoba Immunization Monitoring System Annual Report 2009 55
Report 8 – Pneumococcal Vaccine Doses by Reason forImmunization, Provider Type and Location, 2009January 1 to December 31, 2009
High Risk No Reason No Risk Outbreak Total Given Identified Immunization Doses
SOUTH EASTMAN
Public Health NurseFirst Nations Doses *** *** *** *** ***
% N/A N/A N/A N/A N/A
Non-First Nations Doses 156 *** *** *** 156% 46.0 N/A N/A N/A 46.0
TOTAL Doses 156 *** *** *** 156% 46.0 N/A N/A N/A 46.0
PhysicianFirst Nations Doses *** *** *** *** ***
% N/A N/A N/A N/A N/A
Non-First Nations Doses *** 163 *** *** 163% N/A 48.1 N/A N/A 48.1
TOTAL Doses *** 163 *** *** 163% N/A 48.1 N/A N/A 48.1
OtherFirst Nations Doses *** *** *** *** ***
% N/A N/A N/A N/A N/A
Non-First Nations Doses 20 *** *** *** 20% 5.9 N/A N/A N/A 5.9
TOTAL Doses 20 *** *** *** 20% 5.9 N/A N/A N/A 5.9
Total Doses 176 163 *** *** 339% 51.9 48.1 N/A N/A 100.0
INTERLAKE
Public Health NurseFirst Nations Doses *** *** *** *** ***
% N/A N/A N/A N/A N/A
Non-First Nations Doses 228 *** *** *** 228% 24.7 N/A N/A N/A 24.7
TOTAL Doses 228 *** *** *** 228% 24.7 N/A N/A N/A 24.7
PhysicianFirst Nations Doses *** *** *** *** ***
% N/A N/A N/A N/A N/A
Non-First Nations Doses *** 224 *** *** 224% N/A 24.3 N/A N/A 24.3
TOTAL Doses *** 228 *** *** 228% N/A 24.7 N/A N/A 24.7
First Nation/Tribal CouncilFirst Nations Doses 370 *** *** *** 370
% 40.1 N/A N/A N/A 40.1
Non-First Nations Doses 84 *** *** *** 84% 9.1 N/A N/A N/A 9.1
TOTAL Doses 454 *** *** *** 454% 49.2 N/A N/A N/A 49.2
OtherFirst Nations Doses *** *** *** *** ***
% N/A N/A N/A N/A N/A
Non-First Nations Doses 10 *** *** *** 10% 1.1 N/A N/A N/A 1.1
TOTAL Doses 12 *** *** *** 12% 1.3 N/A N/A N/A 1.3
Total Doses 694 228 *** *** 922% 75.3 24.7 N/A N/A 100.0

Manitoba Immunization Monitoring System Annual Report 200956
Report 8 – Pneumococcal Vaccine Doses by Reason forImmunization, Provider Type and Location, 2009January 1 to December 31, 2009
High Risk No Reason No Risk Outbreak Total Given Identified Immunization Doses
CENTRAL
Public Health NurseFirst Nations Doses *** *** *** *** ***
% N/A N/A N/A N/A N/A
Non-First Nations Doses 78 *** *** *** 78% 16.8 N/A N/A N/A 16.8
TOTAL Doses 79 *** *** *** 79% 17.1 N/A N/A N/A 17.1
PhysicianFirst Nations Doses *** *** *** *** ***
% N/A N/A N/A N/A N/A
Non-First Nations Doses 37 249 *** *** 286% 8.0 53.8 N/A N/A 61.8
TOTAL Doses 37 251 *** *** 288% 8.0 54.2 N/A N/A 62.2
First Nation/Tribal CouncilFirst Nations Doses 62 *** *** *** 62
% 13.4 N/A N/A N/A 13.4
Non-First Nations Doses 9 *** *** *** 9% 1.9 N/A N/A N/A 1.9
TOTAL Doses 71 *** *** *** 71% 15.3 N/A N/A N/A 15.3
OtherFirst Nations Doses *** *** *** *** ***
% N/A N/A N/A N/A N/A
Non-First Nations Doses 23 *** *** *** 23% 5.0 N/A N/A N/A 5.0
TOTAL Doses 25 *** *** *** 25% 5.4 N/A N/A N/A 5.4
Total Doses 212 251 *** *** 463% 45.8 54.2 N/A N/A 100.0
ASSINIBOINE
Public Health NurseFirst Nations Doses *** *** *** *** ***
% N/A N/A N/A N/A N/A
Non-First Nations Doses 279 *** *** *** 279% 71.0 N/A N/A N/A 71.0
TOTAL Doses 282 *** *** *** 282% 71.8 N/A N/A N/A 71.8
PhysicianFirst Nations Doses *** *** *** *** ***
% N/A N/A N/A N/A N/A
Non-First Nations Doses *** 68 *** *** 71% N/A 17.3 N/A N/A 18.1
TOTAL Doses *** 68 *** *** 71% N/A 17.3 N/A N/A 18.1
First Nation/Tribal CouncilFirst Nations Doses 32 *** *** *** 32
% 8.1 N/A N/A N/A 8.1
Non-First Nations Doses *** *** *** *** ***% N/A N/A N/A N/A N/A
TOTAL Doses 35 *** *** *** 36% 8.9 N/A N/A N/A 9.2
OtherFirst Nations Doses *** *** *** *** ***
% N/A N/A N/A N/A N/A
Non-First Nations Doses *** *** *** *** ***% N/A N/A N/A N/A N/A
TOTAL Doses *** *** *** *** ***% N/A N/A N/A N/A N/A
Total Doses 324 68 *** *** 393% 82.4 17.3 N/A N/A 100.0
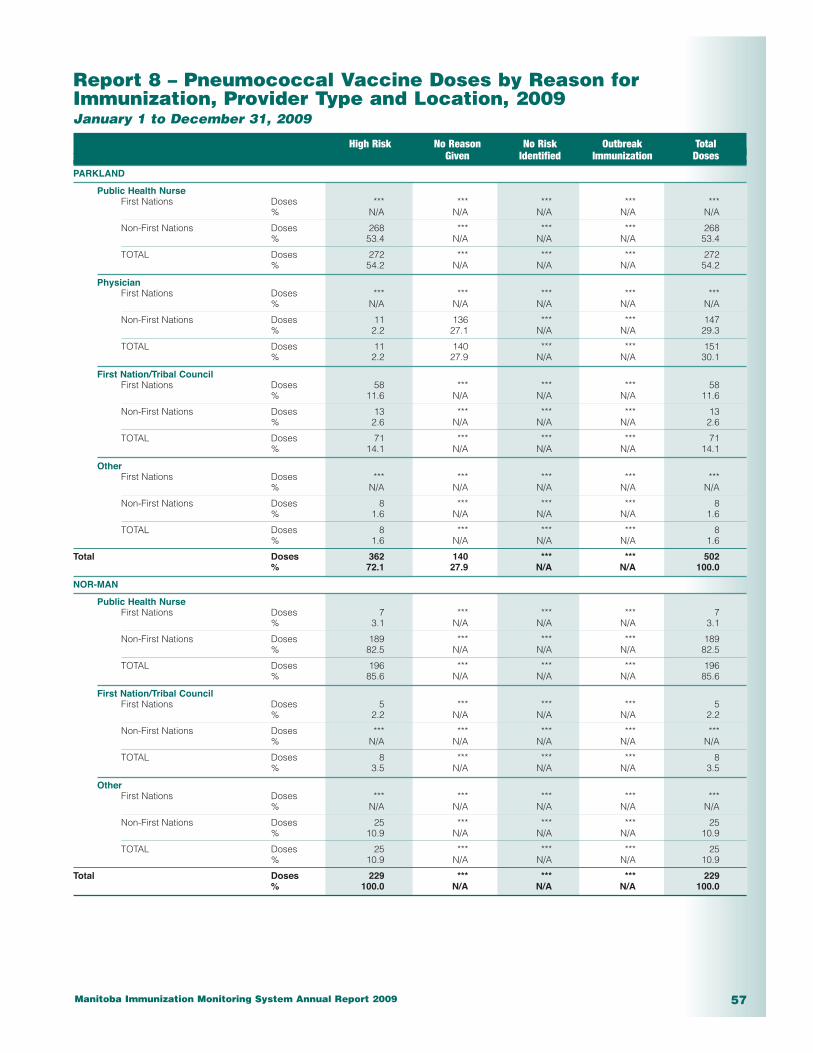
Manitoba Immunization Monitoring System Annual Report 2009 57
Report 8 – Pneumococcal Vaccine Doses by Reason forImmunization, Provider Type and Location, 2009January 1 to December 31, 2009
High Risk No Reason No Risk Outbreak Total Given Identified Immunization Doses
PARKLAND
Public Health NurseFirst Nations Doses *** *** *** *** ***
% N/A N/A N/A N/A N/A
Non-First Nations Doses 268 *** *** *** 268% 53.4 N/A N/A N/A 53.4
TOTAL Doses 272 *** *** *** 272% 54.2 N/A N/A N/A 54.2
PhysicianFirst Nations Doses *** *** *** *** ***
% N/A N/A N/A N/A N/A
Non-First Nations Doses 11 136 *** *** 147% 2.2 27.1 N/A N/A 29.3
TOTAL Doses 11 140 *** *** 151% 2.2 27.9 N/A N/A 30.1
First Nation/Tribal CouncilFirst Nations Doses 58 *** *** *** 58
% 11.6 N/A N/A N/A 11.6
Non-First Nations Doses 13 *** *** *** 13% 2.6 N/A N/A N/A 2.6
TOTAL Doses 71 *** *** *** 71% 14.1 N/A N/A N/A 14.1
OtherFirst Nations Doses *** *** *** *** ***
% N/A N/A N/A N/A N/A
Non-First Nations Doses 8 *** *** *** 8% 1.6 N/A N/A N/A 1.6
TOTAL Doses 8 *** *** *** 8% 1.6 N/A N/A N/A 1.6
Total Doses 362 140 *** *** 502% 72.1 27.9 N/A N/A 100.0
NOR-MAN
Public Health NurseFirst Nations Doses 7 *** *** *** 7
% 3.1 N/A N/A N/A 3.1
Non-First Nations Doses 189 *** *** *** 189% 82.5 N/A N/A N/A 82.5
TOTAL Doses 196 *** *** *** 196% 85.6 N/A N/A N/A 85.6
First Nation/Tribal CouncilFirst Nations Doses 5 *** *** *** 5
% 2.2 N/A N/A N/A 2.2
Non-First Nations Doses *** *** *** *** ***% N/A N/A N/A N/A N/A
TOTAL Doses 8 *** *** *** 8% 3.5 N/A N/A N/A 3.5
OtherFirst Nations Doses *** *** *** *** ***
% N/A N/A N/A N/A N/A
Non-First Nations Doses 25 *** *** *** 25% 10.9 N/A N/A N/A 10.9
TOTAL Doses 25 *** *** *** 25% 10.9 N/A N/A N/A 10.9
Total Doses 229 *** *** *** 229% 100.0 N/A N/A N/A 100.0

Manitoba Immunization Monitoring System Annual Report 200958
Report 8 – Pneumococcal Vaccine Doses by Reason forImmunization, Provider Type and Location, 2009January 1 to December 31, 2009
High Risk No Reason No Risk Outbreak Total Given Identified Immunization Doses
BURNTWOOD
Public Health NurseFirst Nations Doses 24 *** *** *** 24
% 5.4 N/A N/A N/A 5.4
Non-First Nations Doses 105 *** *** *** 105% 23.5 N/A N/A N/A 23.5
TOTAL Doses 129 *** *** *** 129% 28.9 N/A N/A N/A 28.9
PhysicianFirst Nations Doses *** *** *** *** ***
% N/A N/A N/A N/A N/A
Non-First Nations Doses *** *** *** *** ***% N/A N/A N/A N/A N/A
TOTAL Doses *** *** *** *** ***% N/A N/A N/A N/A N/A
First Nation/Tribal CouncilFirst Nations Doses 271 *** *** *** 271
% 60.8 N/A N/A N/A 60.8
Non-First Nations Doses 41 *** *** *** 41% 9.2 N/A N/A N/A 9.2
TOTAL Doses 312 *** *** *** 312% 70.0 N/A N/A N/A 70.0
OtherFirst Nations Doses *** *** *** *** ***
% N/A N/A N/A N/A N/A
Non-First Nations Doses *** *** *** *** ***% N/A N/A N/A N/A N/A
TOTAL Doses *** *** *** *** ***% N/A N/A N/A N/A N/A
Total Doses 444 *** *** *** 446% 99.6 N/A N/A N/A 100.0
CHURCHILL
Public Health NurseFirst Nations Doses *** *** *** *** ***
% N/A N/A N/A N/A N/A
Non-First Nations Doses 6 *** *** *** 6% 100.0 N/A N/A N/A 100.0
TOTAL Doses 6 *** *** *** 6% 100.0 N/A N/A N/A 100.0
Total Doses 6 *** *** *** 6% 100.0 N/A N/A N/A 100.0
Out of Province Provider
Public Health NurseFirst Nations Doses *** *** *** *** ***
% N/A N/A N/A N/A N/A
Non-First Nations Doses *** *** *** *** 5% N/A N/A N/A N/A 55.6
TOTAL Doses *** *** *** *** 5% N/A N/A N/A N/A 55.6
OtherFirst Nations Doses *** *** *** *** ***
% N/A N/A N/A N/A N/A
Non-First Nations Doses *** *** *** *** ***% N/A N/A N/A N/A N/A
TOTAL Doses *** *** *** *** ***% N/A N/A N/A N/A N/A
Total Doses 6 *** *** *** 9% 66.7 N/A N/A N/A 100.0
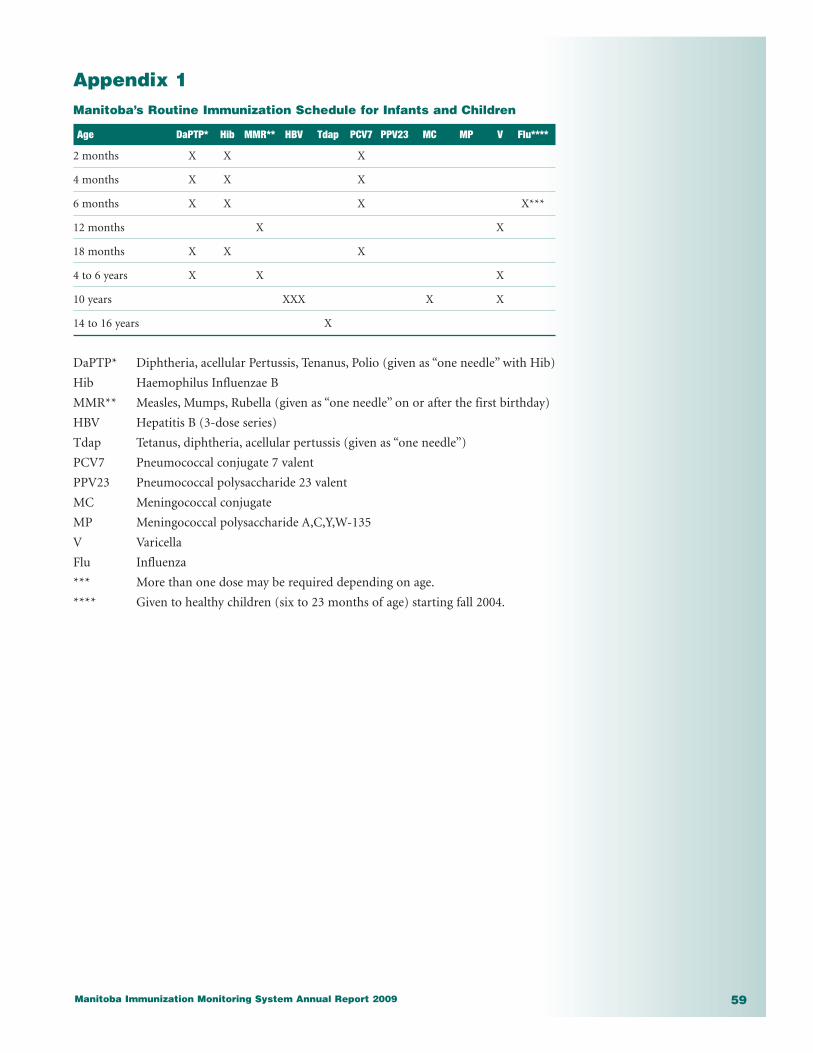
Appendix 1 Manitoba’s Routine Immunization Schedule for Infants and Children
Age DaPTP* Hib MMR** HBV Tdap PCV7 PPV23 MC MP V Flu****
2 months X X X
4 months X X X
6 months X X X X***
12 months X X
18 months X X X
4 to 6 years X X X
10 years XXX X X
14 to 16 years X
DaPTP* Diphtheria, acellular Pertussis, Tenanus, Polio (given as “one needle” with Hib)
Hib Haemophilus Influenzae B
MMR** Measles, Mumps, Rubella (given as “one needle” on or after the first birthday)
HBV Hepatitis B (3-dose series)
Tdap Tetanus, diphtheria, acellular pertussis (given as “one needle”)
PCV7 Pneumococcal conjugate 7 valent
PPV23 Pneumococcal polysaccharide 23 valent
MC Meningococcal conjugate
MP Meningococcal polysaccharide A,C,Y,W-135
V Varicella
Flu Influenza
*** More than one dose may be required depending on age.
**** Given to healthy children (six to 23 months of age) starting fall 2004.
Manitoba Immunization Monitoring System Annual Report 2009 59
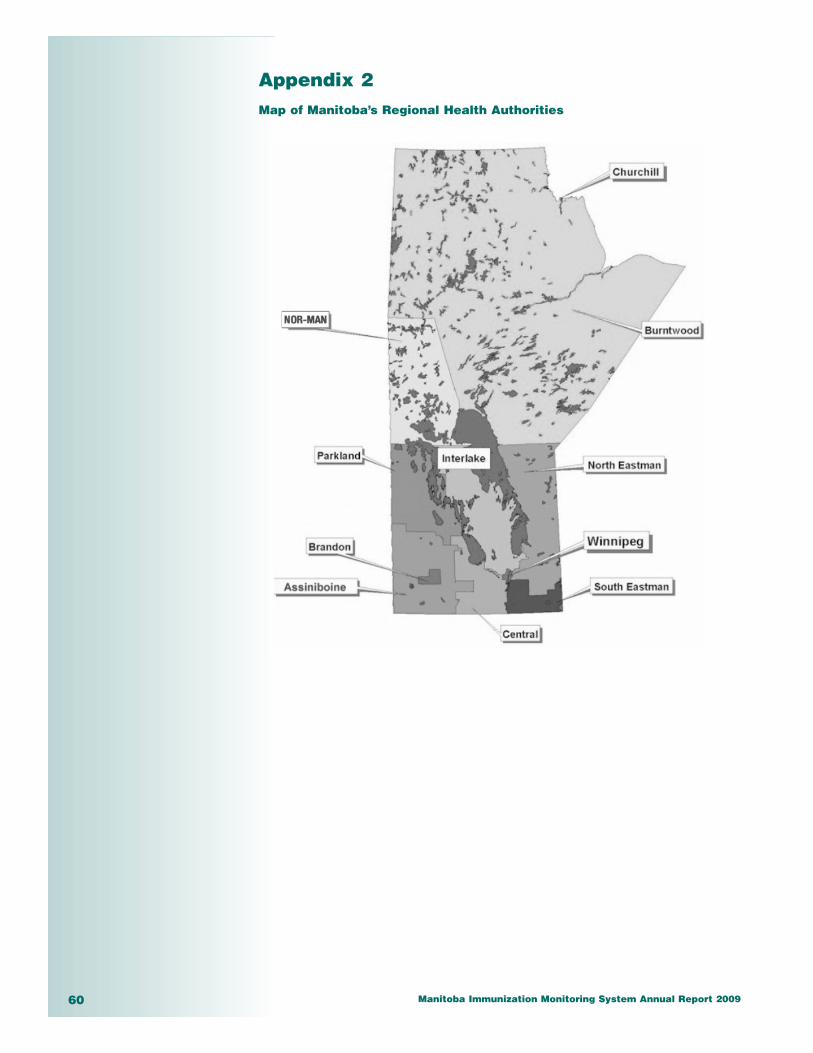
Appendix 2 Map of Manitoba’s Regional Health Authorities
Manitoba Immunization Monitoring System Annual Report 200960