mandalay resources corporation january 2015 investor presentation
TRANSCRIPT
JAN2015
DELIVERING
VALUE AND GROWTH
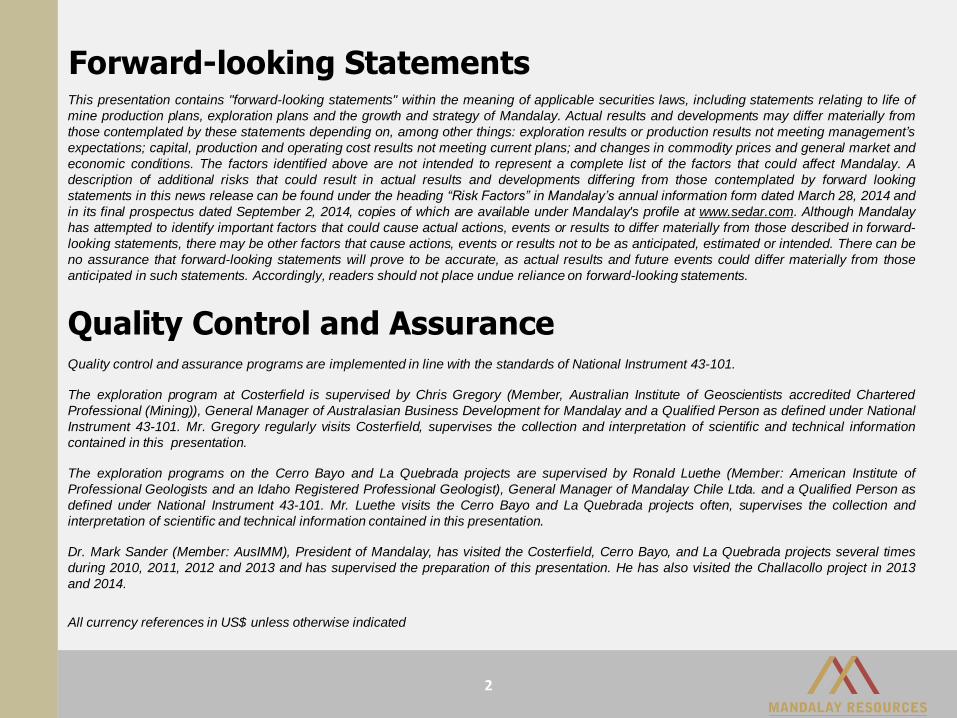
This presentation contains "forward-looking statements" within the meaning of applicable securities laws, including statements relating to life of
mine production plans, exploration plans and the growth and strategy of Mandalay. Actual results and developments may differ materially from
those contemplated by these statements depending on, among other things: exploration results or production results not meeting management’s
expectations; capital, production and operating cost results not meeting current plans; and changes in commodity prices and general market and
economic conditions. The factors identified above are not intended to represent a complete list of the factors that could affect Mandalay. A
description of additional risks that could result in actual results and developments differing from those contemplated by forward looking
statements in this news release can be found under the heading “Risk Factors” in Mandalay’s annual information form dated March 28, 2014 and
in its final prospectus dated September 2, 2014, copies of which are available under Mandalay's profile at www.sedar.com. Although Mandalay
has attempted to identify important factors that could cause actual actions, events or results to differ materially from those described in forward-
looking statements, there may be other factors that cause actions, events or results not to be as anticipated, estimated or intended. There can be
no assurance that forward-looking statements will prove to be accurate, as actual results and future events could differ materially from those
anticipated in such statements. Accordingly, readers should not place undue reliance on forward-looking statements.
Quality Control and AssuranceQuality control and assurance programs are implemented in line with the standards of National Instrument 43-101.
The exploration program at Costerfield is supervised by Chris Gregory (Member, Australian Institute of Geoscientists accredited Chartered
Professional (Mining)), General Manager of Australasian Business Development for Mandalay and a Qualified Person as defined under National
Instrument 43-101. Mr. Gregory regularly visits Costerfield, supervises the collection and interpretation of scientific and technical information
contained in this presentation.
The exploration programs on the Cerro Bayo and La Quebrada projects are supervised by Ronald Luethe (Member: American Institute of
Professional Geologists and an Idaho Registered Professional Geologist), General Manager of Mandalay Chile Ltda. and a Qualified Person as
defined under National Instrument 43-101. Mr. Luethe visits the Cerro Bayo and La Quebrada projects often, supervises the collection and
interpretation of scientific and technical information contained in this presentation.
Dr. Mark Sander (Member: AusIMM), President of Mandalay, has visited the Costerfield, Cerro Bayo, and La Quebrada projects several times
during 2010, 2011, 2012 and 2013 and has supervised the preparation of this presentation. He has also visited the Challacollo project in 2013
and 2014.
All currency references in US$ unless otherwise indicated
Forward-looking Statements
2
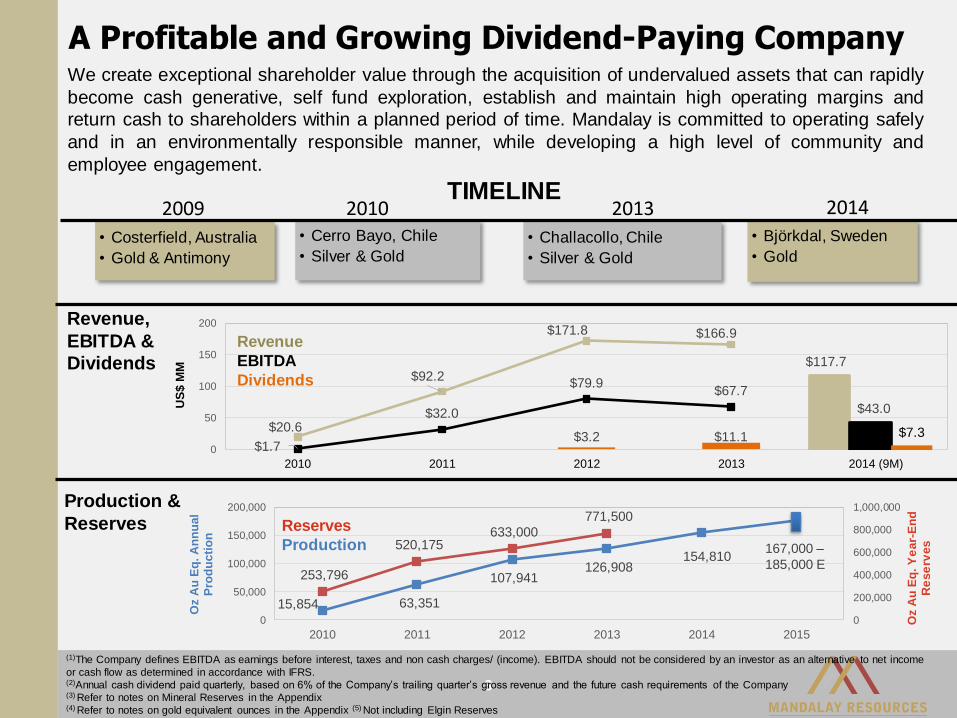
15,854 63,351
107,941 126,908
253,796
520,175 633,000
771,500
0
200,000
400,000
600,000
800,000
1,000,000
0
50,000
100,000
150,000
200,000
2010 2011 2012 2013 2014 2015
Oz A
u E
q. Y
ear-
En
d
Re
se
rves
Oz A
u E
q. A
nn
ual
Pro
du
cti
on
2009
• Costerfield, Australia
• Gold & Antimony
2010• Cerro Bayo, Chile
• Silver & Gold
2013
• Challacollo, Chile
• Silver & Gold
2014
• Björkdal, Sweden
• Gold
$3.2 $11.1$20.6
$92.2
$171.8 $166.9
$1.7
$32.0
$79.9$67.7
0
50
100
150
200
2010 2011 2012 2013 2014 (9M)
US
$ M
M
A Profitable and Growing Dividend-Paying Company
3
We create exceptional shareholder value through the acquisition of undervalued assets that can rapidly
become cash generative, self fund exploration, establish and maintain high operating margins and
return cash to shareholders within a planned period of time. Mandalay is committed to operating safely
and in an environmentally responsible manner, while developing a high level of community and
employee engagement.
(1)The Company defines EBITDA as earnings before interest, taxes and non cash charges/ (income). EBITDA should not be considered by an investor as an alternative to net income
or cash flow as determined in accordance with IFRS.(2)Annual cash dividend paid quarterly, based on 6% of the Company’s trailing quarter’s gross revenue and the future cash requirements of the Company(3) Refer to notes on Mineral Reserves in the Appendix(4) Refer to notes on gold equivalent ounces in the Appendix (5) Not including Elgin Reserves
TIMELINE
Production &
Reserves
Revenue,
EBITDA &
Dividends
Revenue
EBITDA
Dividends
$117.7
$43.0
$7.3
Reserves
Production154,810
167,000 –
185,000 E
4
50%
100%
150%
200%
250%
300%
Q3
200
9
Q4
200
9
Q1
201
0
Q2
201
0
Q3
201
0
Q4
201
0
Q1
201
1
Q2
201
1
Q3
201
1
Q4
201
1
Q1
201
2
Q2
201
2
Q3
201
2
Q4
201
2
Q1
201
3
Q2
201
3
Q3
201
3
Q4
201
3
Q1
201
4
Q2
201
4
Q3
201
4
15-N
ov-
14
CU
M %
VA
LUE
CH
AN
GE
SIN
CE
Q3,
200
9
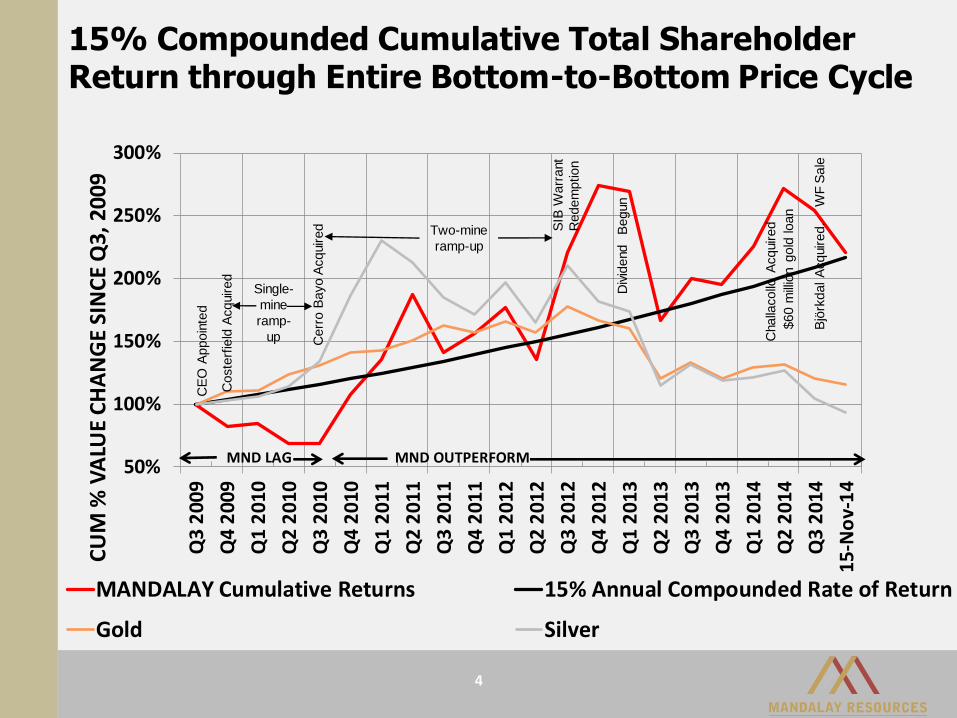
MANDALAY Cumulative Returns 15% Annual Compounded Rate of Return
Gold Silver
MND LAG MND OUTPERFORM
15% Compounded Cumulative Total Shareholder Return through Entire Bottom-to-Bottom Price Cycle
CE
O A
ppoin
ted
Single-
mine
ramp-
up Cerr
o B
ayo
Acquired Two-mine
ramp-up
SIB
Warr
ant
Redem
ption
Div
idend
Begun
Challa
collo
Acquired
$60 m
illio
n g
old
loan
Bjö
rkdal A
cquired.
W
FS
ale
Coste
rfie
ld A
cquired
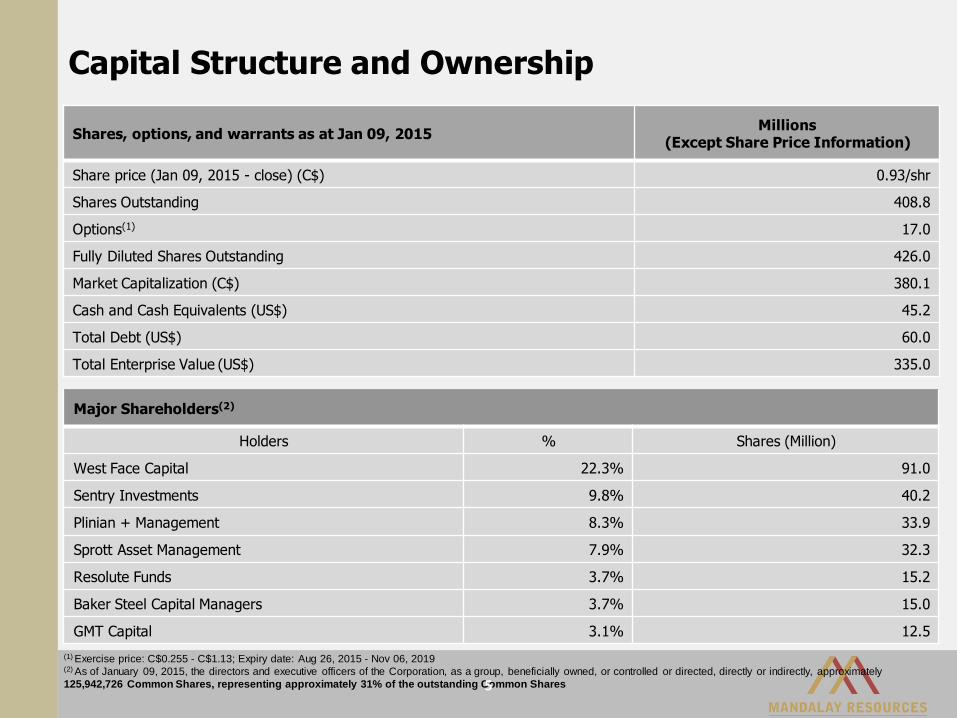
(1) Exercise price: C$0.255 - C$1.13; Expiry date: Aug 26, 2015 - Nov 06, 2019(2) As of January 09, 2015, the directors and executive officers of the Corporation, as a group, beneficially owned, or controlled or directed, directly or indirectly, approximately
125,942,726 Common Shares, representing approximately 31% of the outstanding Common Shares
Capital Structure and Ownership
5
Major Shareholders(2)
Holders % Shares (Million)
West Face Capital 22.3% 91.0
Sentry Investments 9.8% 40.2
Plinian + Management 8.3% 33.9
Sprott Asset Management 7.9% 32.3
Resolute Funds 3.7% 15.2
Baker Steel Capital Managers 3.7% 15.0
GMT Capital 3.1% 12.5
Shares, options, and warrants as at Jan 09, 2015Millions
(Except Share Price Information)
Share price (Jan 09, 2015 - close) (C$) 0.93/shr
Shares Outstanding 408.8
Options(1) 17.0
Fully Diluted Shares Outstanding 426.0
Market Capitalization (C$) 380.1
Cash and Cash Equivalents (US$) 45.2
Total Debt (US$) 60.0
Total Enterprise Value (US$) 335.0
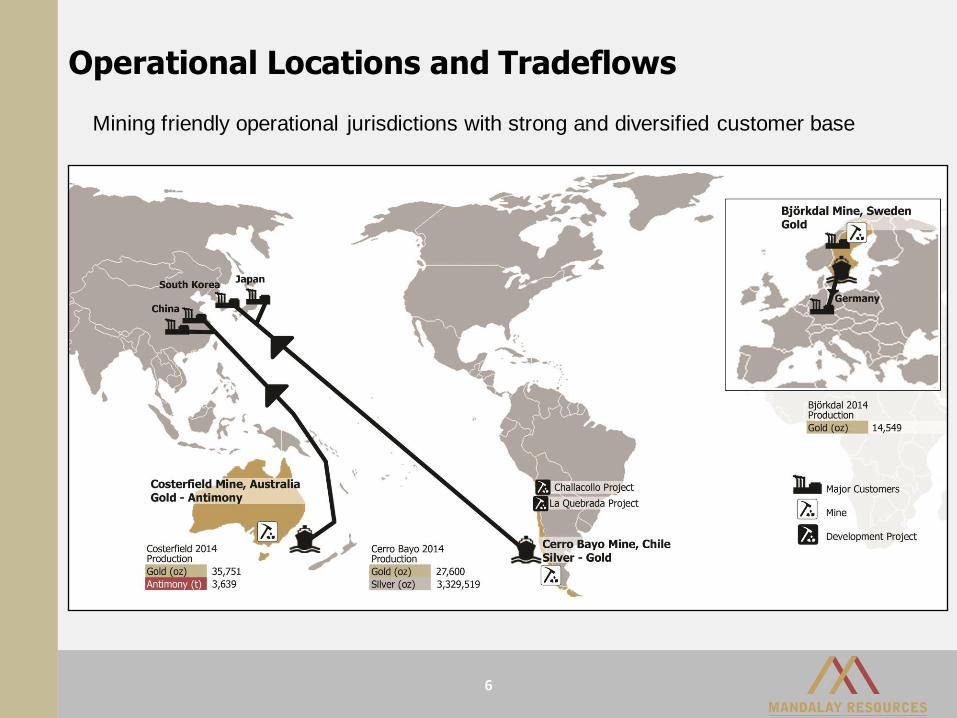
Operational Locations and Tradeflows
6
Mining friendly operational jurisdictions with strong and diversified customer base
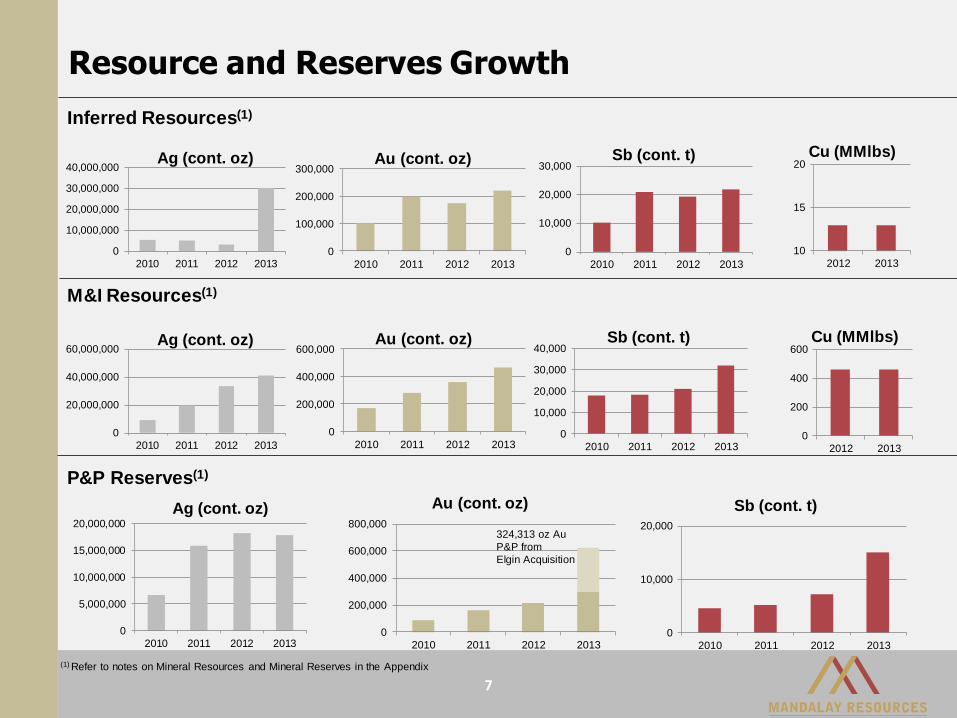
Resource and Reserves Growth
M&I Resources(1)
P&P Reserves(1)
0
20,000,000
40,000,000
60,000,000
2010 2011 2012 2013
Ag (cont. oz)
0
200,000
400,000
600,000
2010 2011 2012 2013
Au (cont. oz)
0
10,000
20,000
30,000
40,000
2010 2011 2012 2013
Sb (cont. t)
(1) Refer to notes on Mineral Resources and Mineral Reserves in the Appendix
0
200
400
600
2012 2013
Cu (MMlbs)
0
5,000,000
10,000,000
15,000,000
20,000,000
2010 2011 2012 2013
Ag (cont. oz)
0
200,000
400,000
600,000
800,000
2010 2011 2012 2013
Au (cont. oz)
0
10,000
20,000
2010 2011 2012 2013
Sb (cont. t)
324,313 oz Au
P&P from
Elgin Acquisition
Inferred Resources(1)
0
10,000,000
20,000,000
30,000,000
40,000,000
2010 2011 2012 2013
Ag (cont. oz)
0
100,000
200,000
300,000
2010 2011 2012 2013
Au (cont. oz)
0
10,000
20,000
30,000
2010 2011 2012 2013
Sb (cont. t)
10
15
20
2012 2013
Cu (MMlbs)
7
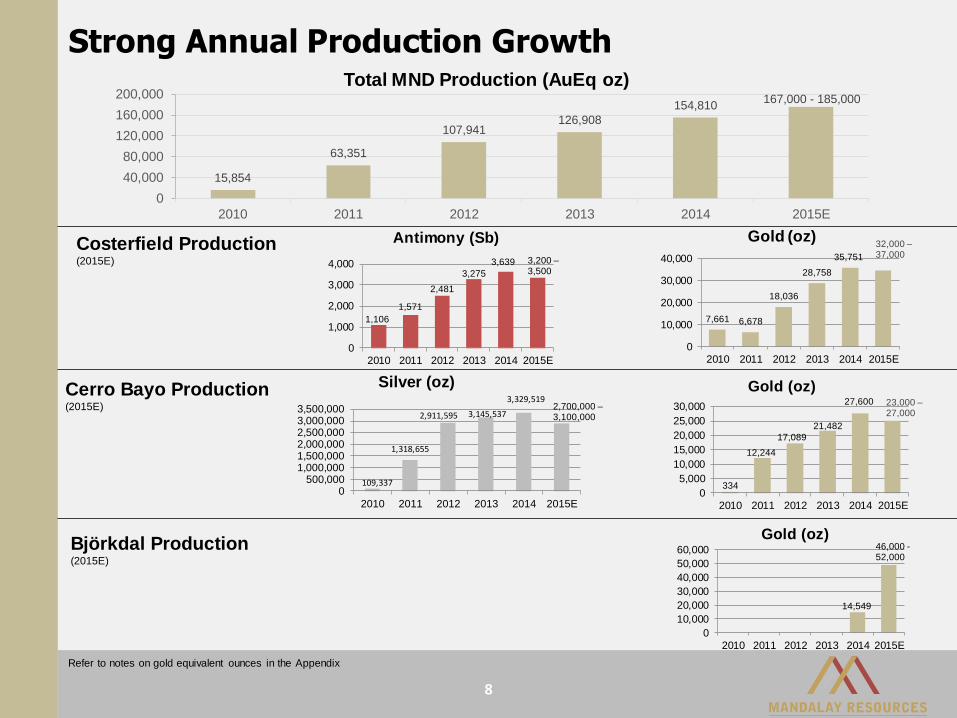
Strong Annual Production Growth
8
109,337
1,318,655
2,911,595 3,145,537
3,329,519
0500,000
1,000,0001,500,0002,000,0002,500,0003,000,0003,500,000
2010 2011 2012 2013 2014 2015E
Silver (oz)
334
12,244
17,089
21,482
27,600
0
5,000
10,000
15,000
20,000
25,000
30,000
2010 2011 2012 2013 2014 2015E
Gold (oz)
7,661 6,678
18,036
28,758
35,751
0
10,000
20,000
30,000
40,000
2010 2011 2012 2013 2014 2015E
Gold (oz)Costerfield Production(2015E)
Cerro Bayo Production(2015E)
1,106
1,571
2,481
3,275
3,639
0
1,000
2,000
3,000
4,000
2010 2011 2012 2013 2014 2015E
Antimony (Sb)
Björkdal Production(2015E)
14,549
0
10,000
20,000
30,000
40,000
50,000
60,000
2010 2011 2012 2013 2014 2015E
Gold (oz)
15,854
63,351
107,941126,908
154,810
0
40,000
80,000
120,000
160,000
200,000
2010 2011 2012 2013 2014 2015E
Total MND Production (AuEq oz)
Refer to notes on gold equivalent ounces in the Appendix
167,000 - 185,000
32,000 –37,000
23,000 –27,000
46,000 -52,000
3,200 –3,500
2,700,000 –3,100,000
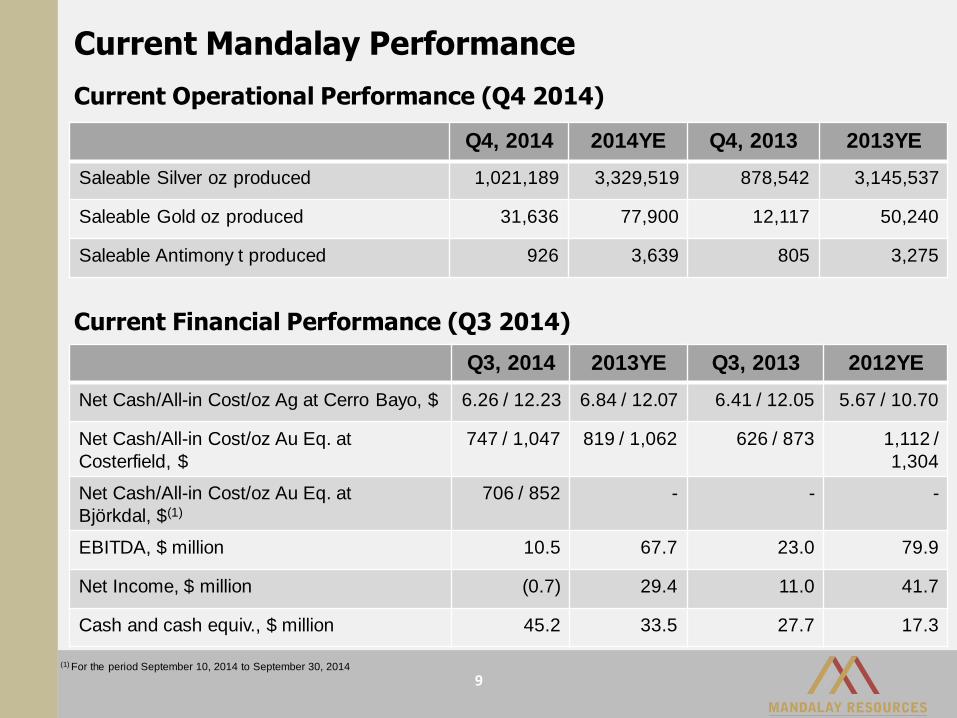
Current Financial Performance (Q3 2014)
9
Current Operational Performance (Q4 2014)
Q4, 2014 2014YE Q4, 2013 2013YE
Saleable Silver oz produced 1,021,189 3,329,519 878,542 3,145,537
Saleable Gold oz produced 31,636 77,900 12,117 50,240
Saleable Antimony t produced 926 3,639 805 3,275
Q3, 2014 2013YE Q3, 2013 2012YE
Net Cash/All-in Cost/oz Ag at Cerro Bayo, $ 6.26 / 12.23 6.84 / 12.07 6.41 / 12.05 5.67 / 10.70
Net Cash/All-in Cost/oz Au Eq. at
Costerfield, $
747 / 1,047 819 / 1,062 626 / 873 1,112 /
1,304
Net Cash/All-in Cost/oz Au Eq. at
Björkdal, $(1)
706 / 852 - - -
EBITDA, $ million 10.5 67.7 23.0 79.9
Net Income, $ million (0.7) 29.4 11.0 41.7
Cash and cash equiv., $ million 45.2 33.5 27.7 17.3
Current Mandalay Performance
(1) For the period September 10, 2014 to September 30, 2014
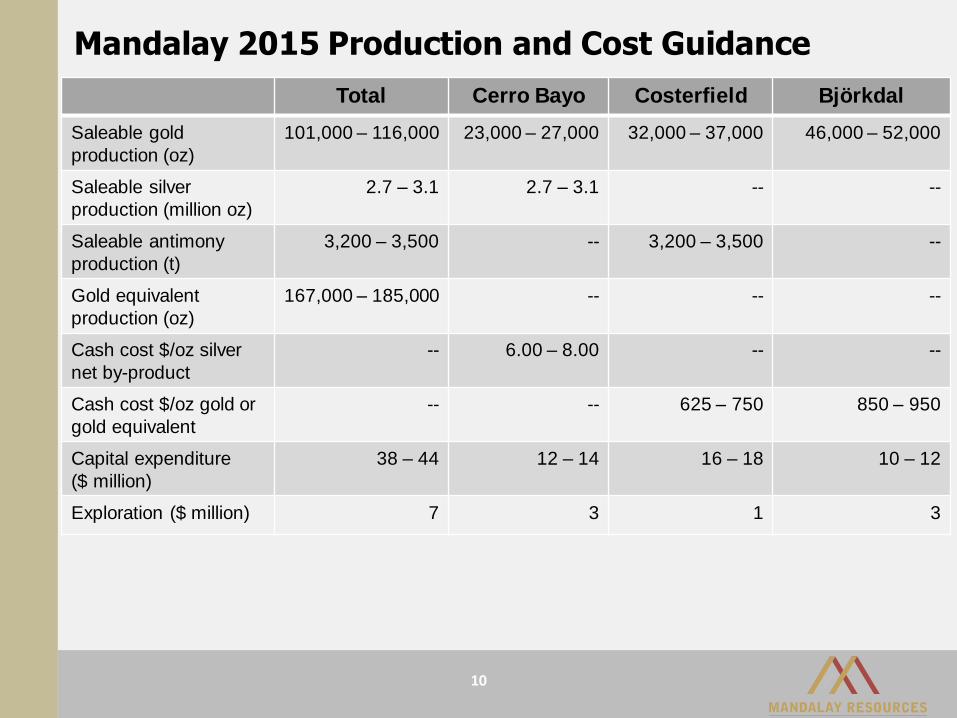
10
Total Cerro Bayo Costerfield Björkdal
Saleable gold
production (oz)
101,000 – 116,000 23,000 – 27,000 32,000 – 37,000 46,000 – 52,000
Saleable silver
production (million oz)
2.7 – 3.1 2.7 – 3.1 -- --
Saleable antimony
production (t)
3,200 – 3,500 -- 3,200 – 3,500 --
Gold equivalent
production (oz)
167,000 – 185,000 -- -- --
Cash cost $/oz silver
net by-product
-- 6.00 – 8.00 -- --
Cash cost $/oz gold or
gold equivalent
-- -- 625 – 750 850 – 950
Capital expenditure
($ million)
38 – 44 12 – 14 16 – 18 10 – 12
Exploration ($ million) 7 3 1 3
Mandalay 2015 Production and Cost Guidance
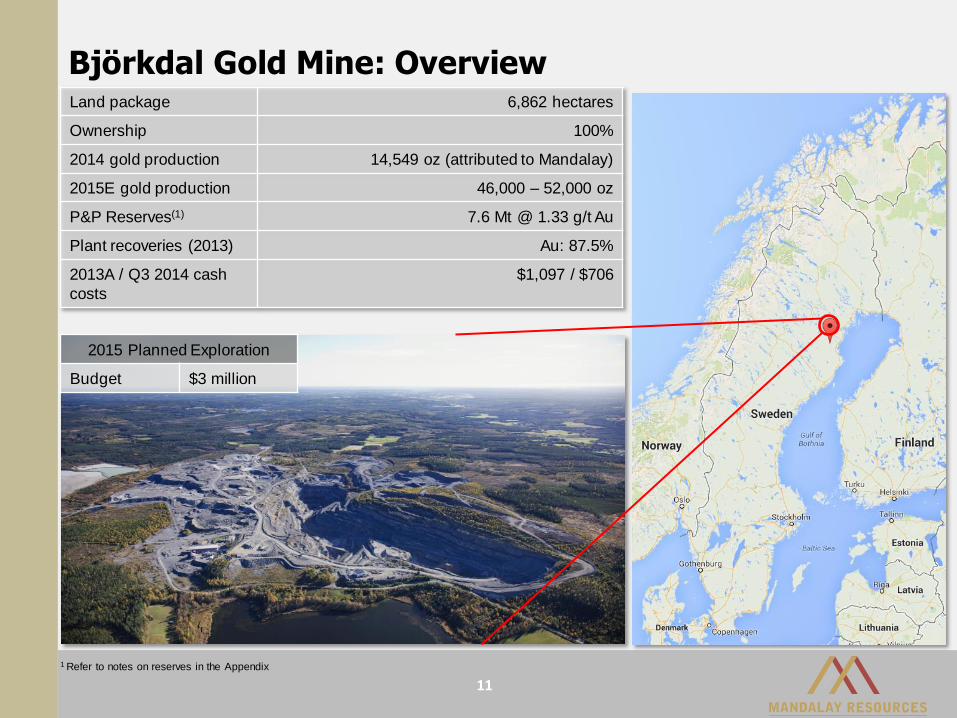
Björkdal Gold Mine: Overview
11
Land package 6,862 hectares
Ownership 100%
2014 gold production 14,549 oz (attributed to Mandalay)
2015E gold production 46,000 – 52,000 oz
P&P Reserves(1) 7.6 Mt @ 1.33 g/t Au
Plant recoveries (2013) Au: 87.5%
2013A / Q3 2014 cash
costs
$1,097 / $706
1 Refer to notes on reserves in the Appendix
2015 Planned Exploration
Budget $3 million
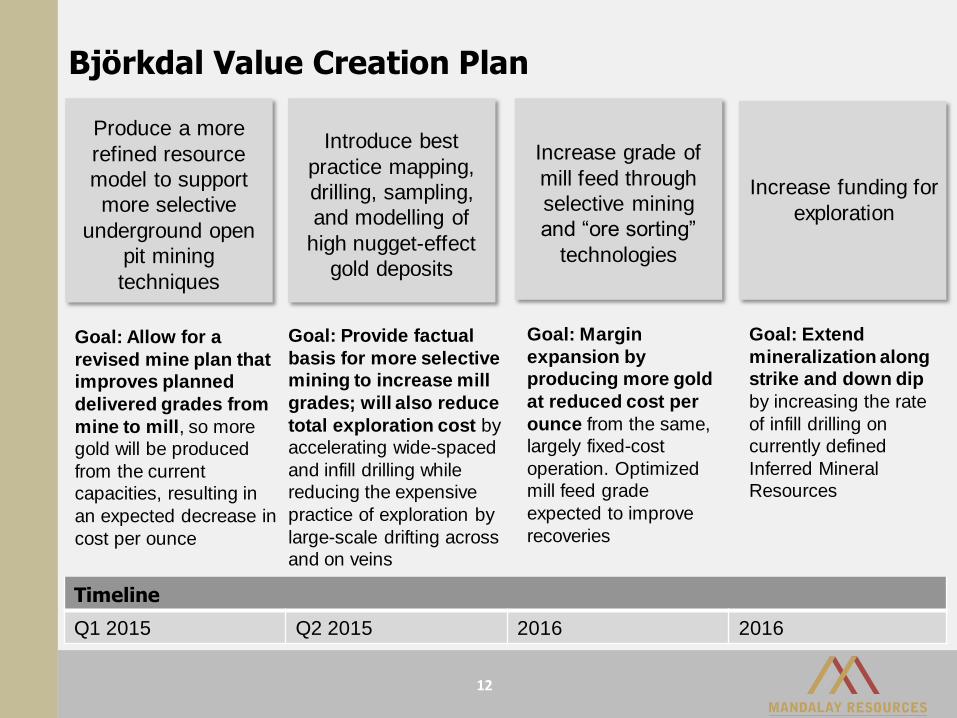
Björkdal Value Creation Plan
12
Goal: Allow for a
revised mine plan that
improves planned
delivered grades from
mine to mill, so more
gold will be produced
from the current
capacities, resulting in
an expected decrease in
cost per ounce
Produce a more
refined resource
model to support
more selective
underground open
pit mining
techniques
Goal: Margin
expansion by
producing more gold
at reduced cost per
ounce from the same,
largely fixed-cost
operation. Optimized
mill feed grade
expected to improve
recoveries
Increase grade of
mill feed through
selective mining
and “ore sorting”
technologies
Goal: Extend
mineralization along
strike and down dip
by increasing the rate
of infill drilling on
currently defined
Inferred Mineral
Resources
Increase funding for
exploration
Introduce best
practice mapping,
drilling, sampling,
and modelling of
high nugget-effect
gold deposits
Goal: Provide factual
basis for more selective
mining to increase mill
grades; will also reduce
total exploration cost by
accelerating wide-spaced
and infill drilling while
reducing the expensive
practice of exploration by
large-scale drifting across
and on veins
Timeline
Q1 2015 Q2 2015 2016 2016
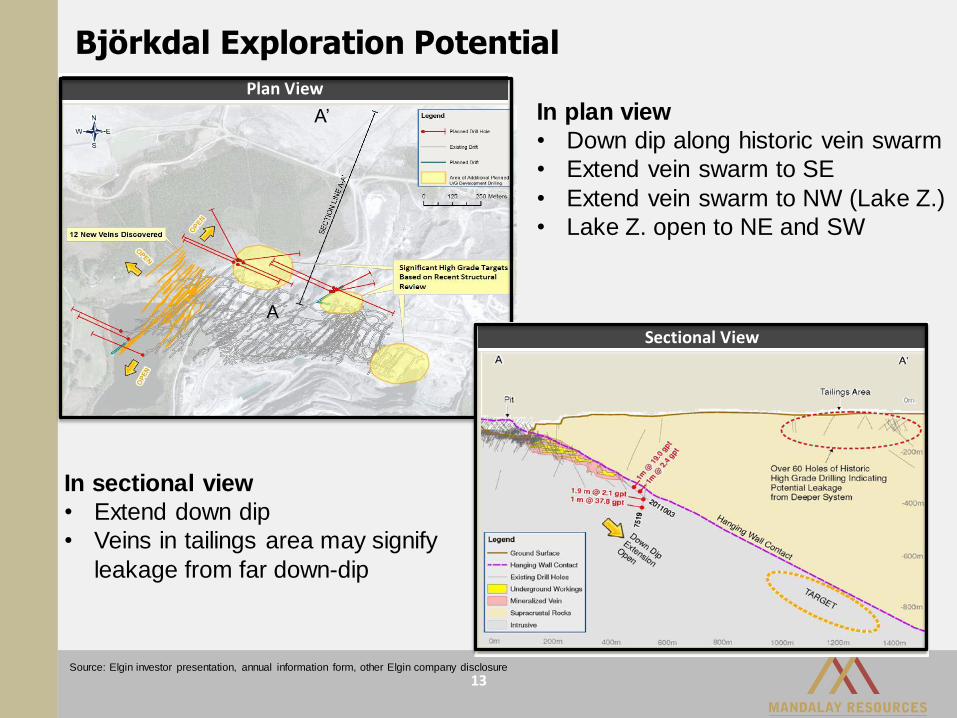
13
Plan View
Björkdal Exploration Potential
Source: Elgin investor presentation, annual information form, other Elgin company disclosure
A
A’
Sectional View
In plan view
• Down dip along historic vein swarm
• Extend vein swarm to SE
• Extend vein swarm to NW (Lake Z.)
• Lake Z. open to NE and SW
In sectional view
• Extend down dip
• Veins in tailings area may signify
leakage from far down-dip
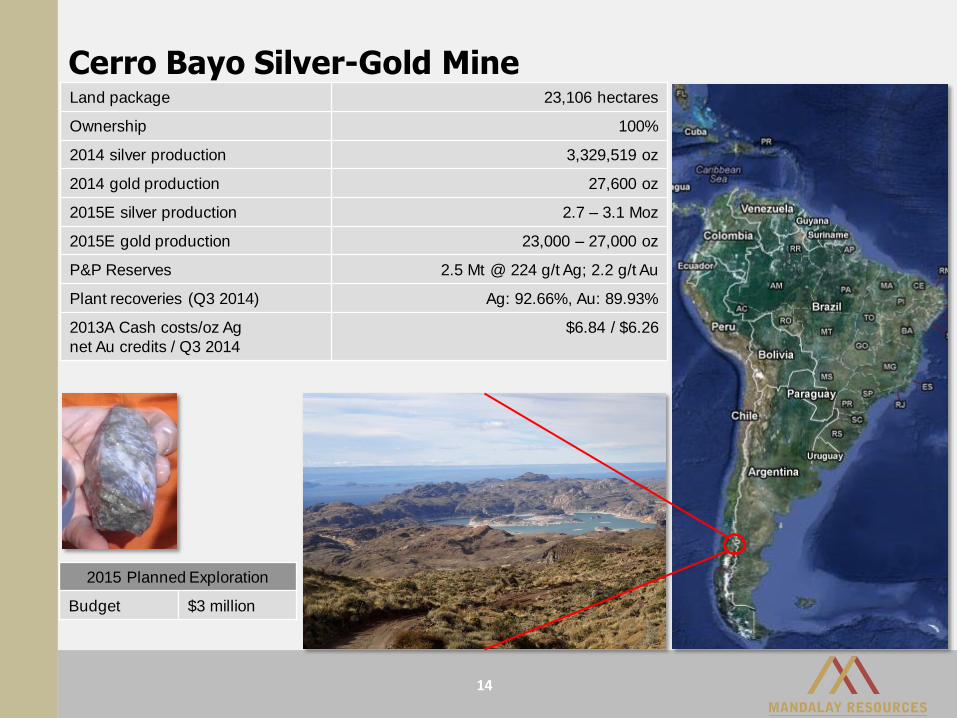
Cerro Bayo Silver-Gold Mine
14
Land package 23,106 hectares
Ownership 100%
2014 silver production 3,329,519 oz
2014 gold production 27,600 oz
2015E silver production 2.7 – 3.1 Moz
2015E gold production 23,000 – 27,000 oz
P&P Reserves 2.5 Mt @ 224 g/t Ag; 2.2 g/t Au
Plant recoveries (Q3 2014) Ag: 92.66%, Au: 89.93%
2013A Cash costs/oz Ag
net Au credits / Q3 2014
$6.84 / $6.26
2015 Planned Exploration
Budget $3 million
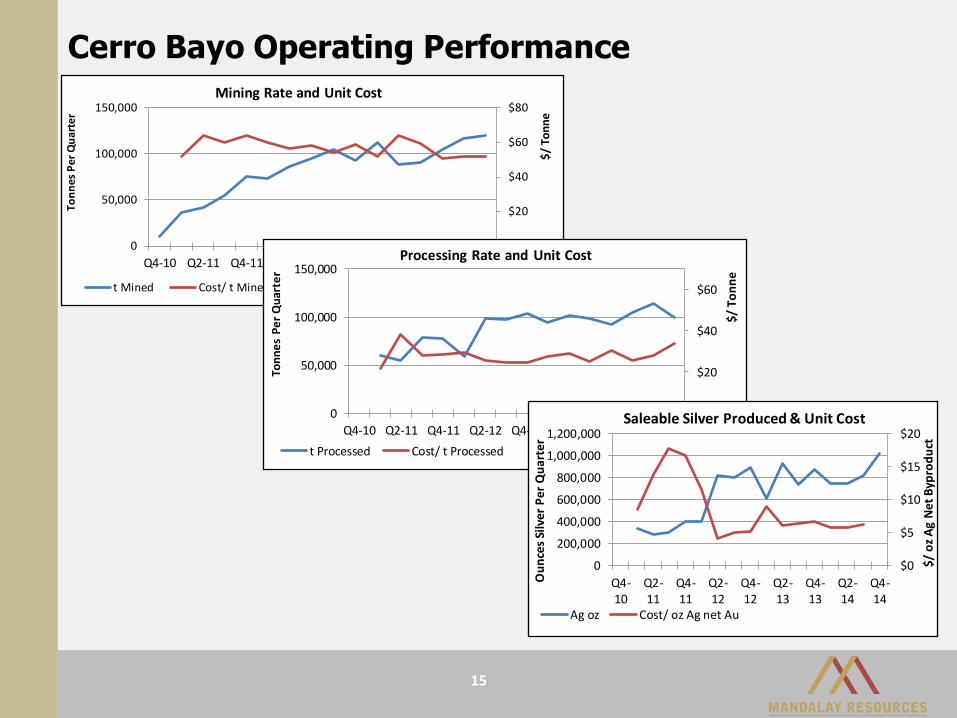
Cerro Bayo Operating Performance
15
$0
$20
$40
$60
$80
0
50,000
100,000
150,000
Q4-10 Q2-11 Q4-11 Q2-12 Q4-12 Q2-2013
Q4-2013
Q2-2014
$/
Ton
ne
Ton
nes
Per
Qu
arte
r
Mining Rate and Unit Cost
t Mined Cost/ t Mined
$0
$20
$40
$60
0
50,000
100,000
150,000
Q4-10 Q2-11 Q4-11 Q2-12 Q4-12 Q2-13 Q4-13 Q2-14
$/ T
on
ne
Ton
ne
s P
er
Qu
arte
r
Processing Rate and Unit Cost
t Processed Cost/ t Processed
$0
$5
$10
$15
$20
0
200,000
400,000
600,000
800,000
1,000,000
1,200,000
Q4-10
Q2-11
Q4-11
Q2-12
Q4-12
Q2-13
Q4-13
Q2-14
Q4-14
$/ o
z A
g N
et B
ypro
du
ct
Ou
nce
s Si
lver
Per
Qu
arte
r
Saleable Silver Produced & Unit Cost
Ag oz Cost/ oz Ag net Au
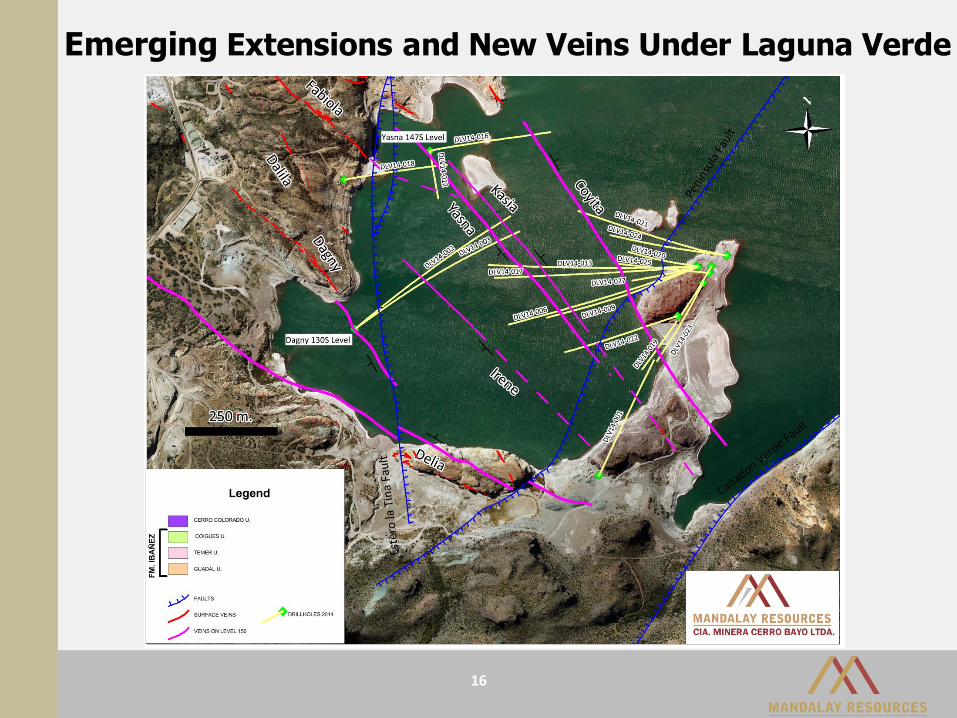
LAGUNA VERDE
Emerging Extensions and New Veins Under Laguna Verde
16
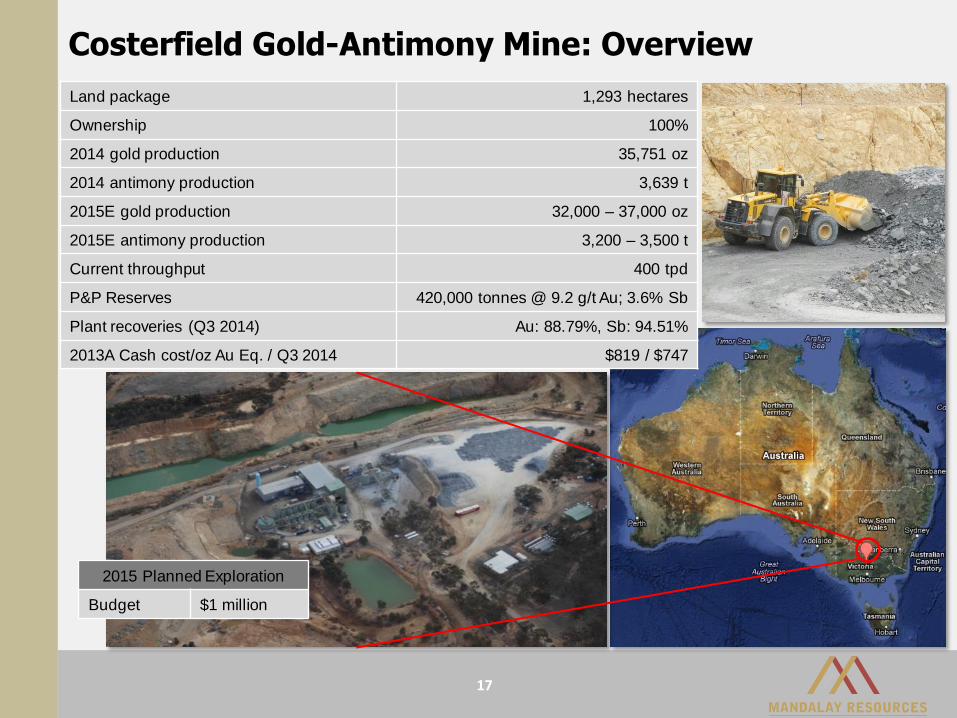
Costerfield Gold-Antimony Mine: Overview
17
2015 Planned Exploration
Budget $1 million
Land package 1,293 hectares
Ownership 100%
2014 gold production 35,751 oz
2014 antimony production 3,639 t
2015E gold production 32,000 – 37,000 oz
2015E antimony production 3,200 – 3,500 t
Current throughput 400 tpd
P&P Reserves 420,000 tonnes @ 9.2 g/t Au; 3.6% Sb
Plant recoveries (Q3 2014) Au: 88.79%, Sb: 94.51%
2013A Cash cost/oz Au Eq. / Q3 2014 $819 / $747
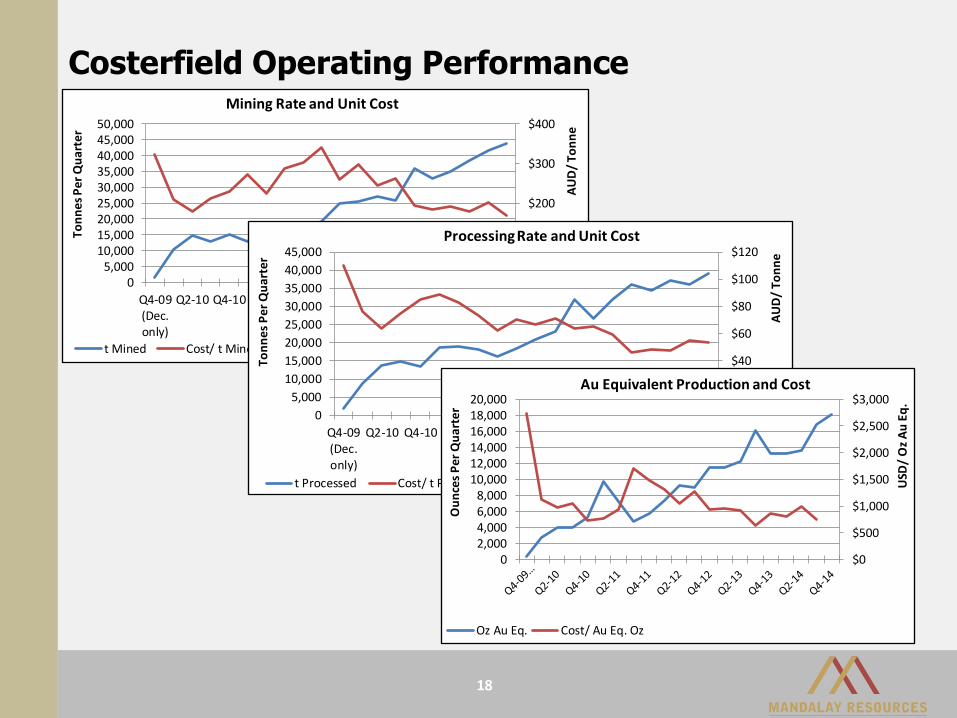
Costerfield Operating Performance
18
$0
$100
$200
$300
$400
05,000
10,00015,00020,00025,00030,00035,00040,00045,00050,000
Q4-09(Dec.only)
Q2-10 Q4-10 Q2-11 Q4-11 Q2-12 Q4-12 Q2-13 Q4-13 Q2-14
AU
D/
Ton
ne
Ton
nes
Per
Qu
arte
r
Mining Rate and Unit Cost
t Mined Cost/ t Mined
$0
$20
$40
$60
$80
$100
$120
0
5,000
10,000
15,000
20,000
25,000
30,000
35,000
40,000
45,000
Q4-09(Dec.only)
Q2-10 Q4-10 Q2-11 Q4-11 Q2-12 Q4-12 Q2-13 Q4-13 Q2-14
AU
D/
Ton
ne
Ton
ne
s P
er
Qu
art
er
Processing Rate and Unit Cost
t Processed Cost/ t Processed
$0
$500
$1,000
$1,500
$2,000
$2,500
$3,000
02,0004,0006,0008,000
10,00012,00014,00016,00018,00020,000
USD
/ O
z A
u E
q.
Ou
nce
s P
er Q
uar
ter
Au Equivalent Production and Cost
Oz Au Eq. Cost/ Au Eq. Oz
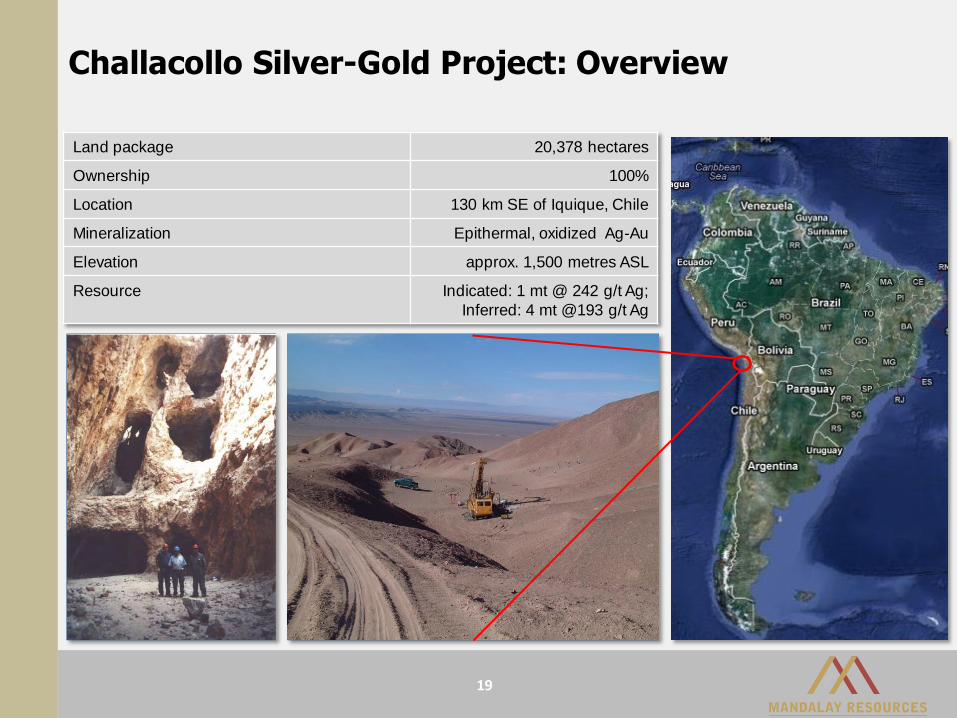
Challacollo Silver-Gold Project: Overview
19
Land package 20,378 hectares
Ownership 100%
Location 130 km SE of Iquique, Chile
Mineralization Epithermal, oxidized Ag-Au
Elevation approx. 1,500 metres ASL
Resource Indicated: 1 mt @ 242 g/t Ag;
Inferred: 4 mt @193 g/t Ag
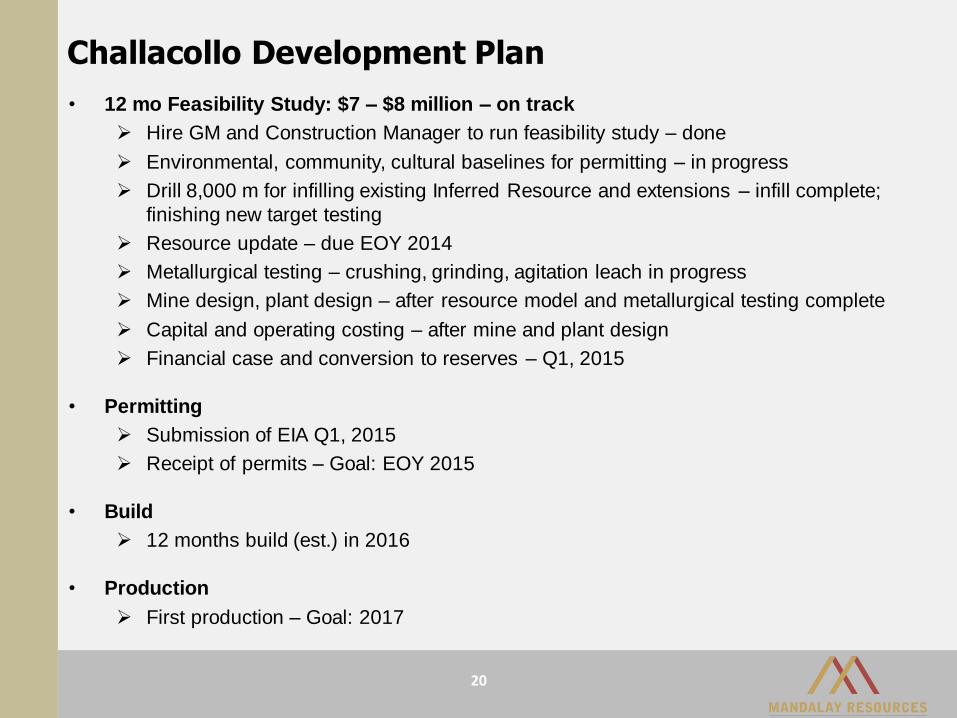
20
• 12 mo Feasibility Study: $7 – $8 million – on track
Hire GM and Construction Manager to run feasibility study – done
Environmental, community, cultural baselines for permitting – in progress
Drill 8,000 m for infilling existing Inferred Resource and extensions – infill complete;
finishing new target testing
Resource update – due EOY 2014
Metallurgical testing – crushing, grinding, agitation leach in progress
Mine design, plant design – after resource model and metallurgical testing complete
Capital and operating costing – after mine and plant design
Financial case and conversion to reserves – Q1, 2015
• Permitting
Submission of EIA Q1, 2015
Receipt of permits – Goal: EOY 2015
• Build
12 months build (est.) in 2016
• Production
First production – Goal: 2017
Challacollo Development Plan
21
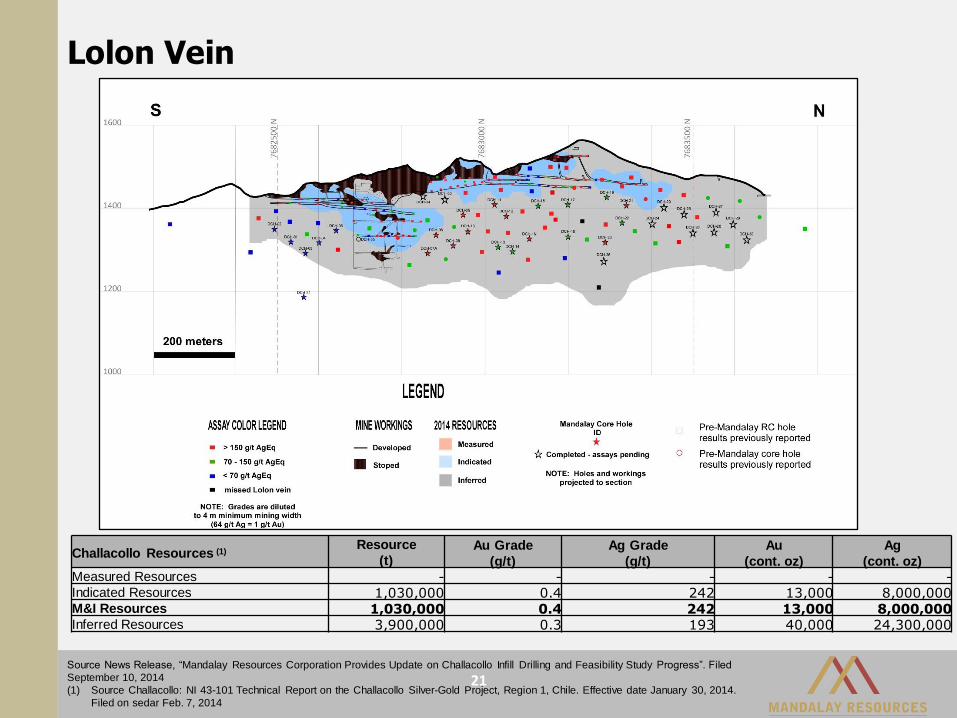
Lolon Vein
Challacollo Resources (1)Resource
(t)Au Grade
(g/t)
Ag Grade
(g/t)
Au
(cont. oz)
Ag
(cont. oz)Measured Resources - - - - -Indicated Resources 1,030,000 0.4 242 13,000 8,000,000 M&I Resources 1,030,000 0.4 242 13,000 8,000,000 Inferred Resources 3,900,000 0.3 193 40,000 24,300,000
Source News Release, “Mandalay Resources Corporation Provides Update on Challacollo Infill Drilling and Feasibility Study Progress”. Filed
September 10, 2014
(1) Source Challacollo: NI 43-101 Technical Report on the Challacollo Silver-Gold Project, Region 1, Chile. Effective date January 30, 2014.
Filed on sedar Feb. 7, 2014
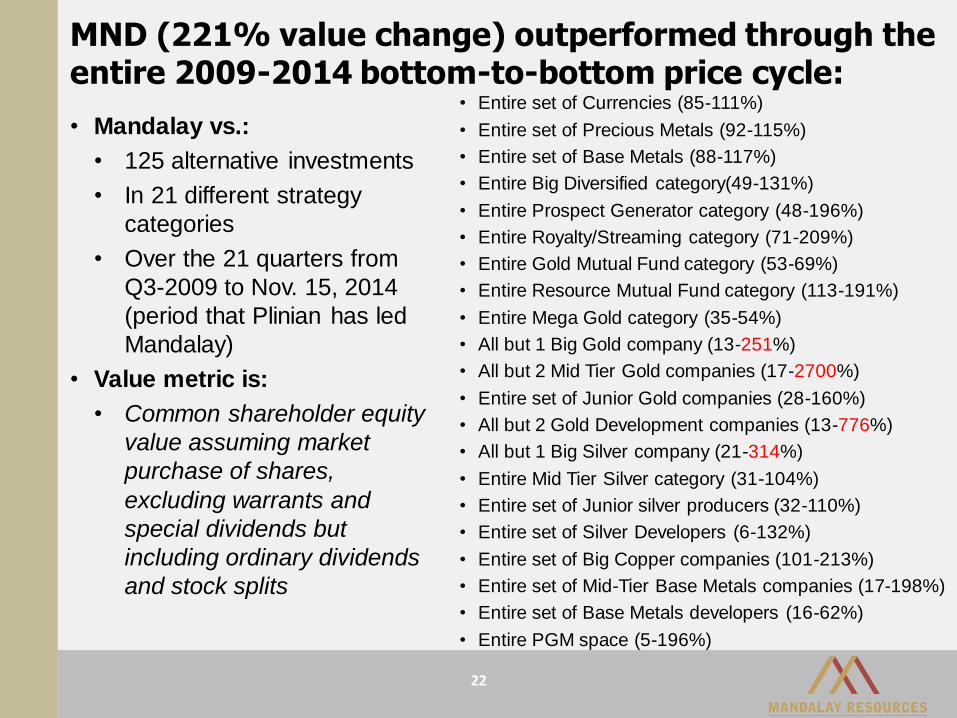
MND (221% value change) outperformed through the entire 2009-2014 bottom-to-bottom price cycle:
• Entire set of Currencies (85-111%)
• Entire set of Precious Metals (92-115%)
• Entire set of Base Metals (88-117%)
• Entire Big Diversified category(49-131%)
• Entire Prospect Generator category (48-196%)
• Entire Royalty/Streaming category (71-209%)
• Entire Gold Mutual Fund category (53-69%)
• Entire Resource Mutual Fund category (113-191%)
• Entire Mega Gold category (35-54%)
• All but 1 Big Gold company (13-251%)
• All but 2 Mid Tier Gold companies (17-2700%)
• Entire set of Junior Gold companies (28-160%)
• All but 2 Gold Development companies (13-776%)
• All but 1 Big Silver company (21-314%)
• Entire Mid Tier Silver category (31-104%)
• Entire set of Junior silver producers (32-110%)
• Entire set of Silver Developers (6-132%)
• Entire set of Big Copper companies (101-213%)
• Entire set of Mid-Tier Base Metals companies (17-198%)
• Entire set of Base Metals developers (16-62%)
• Entire PGM space (5-196%)
22
• Mandalay vs.:
• 125 alternative investments
• In 21 different strategy
categories
• Over the 21 quarters from
Q3-2009 to Nov. 15, 2014
(period that Plinian has led
Mandalay)
• Value metric is:
• Common shareholder equity
value assuming market
purchase of shares,
excluding warrants and
special dividends but
including ordinary dividends
and stock splits
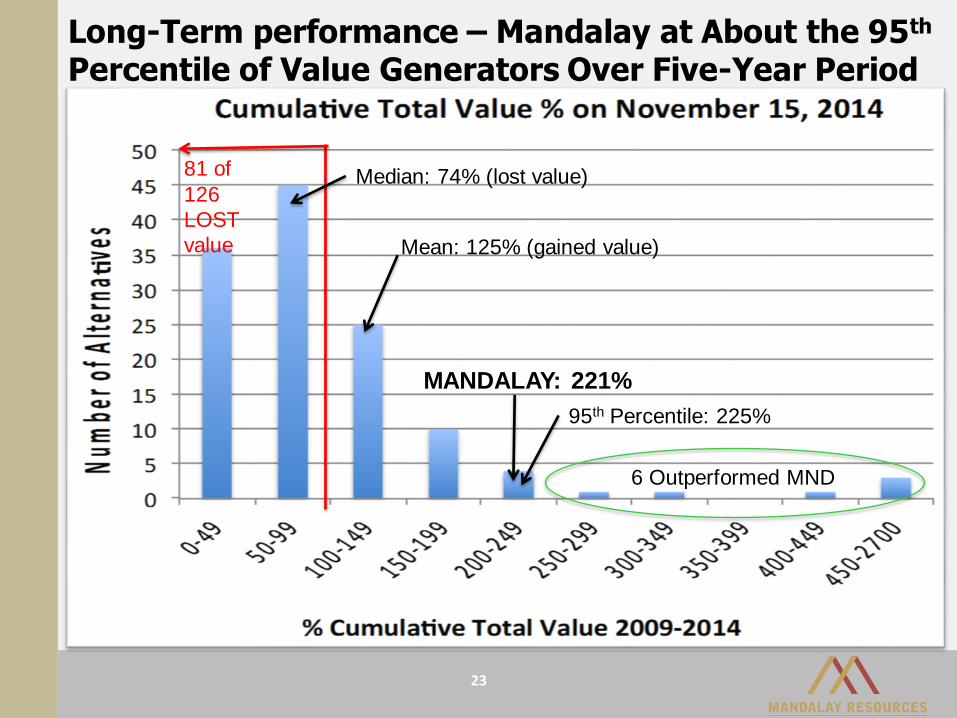
Long-Term performance – Mandalay at About the 95th
Percentile of Value Generators Over Five-Year Period
23
81 of
126
LOST
value Mean: 125% (gained value)
Median: 74% (lost value)
95th Percentile: 225%
MANDALAY: 221%
6 Outperformed MND
24
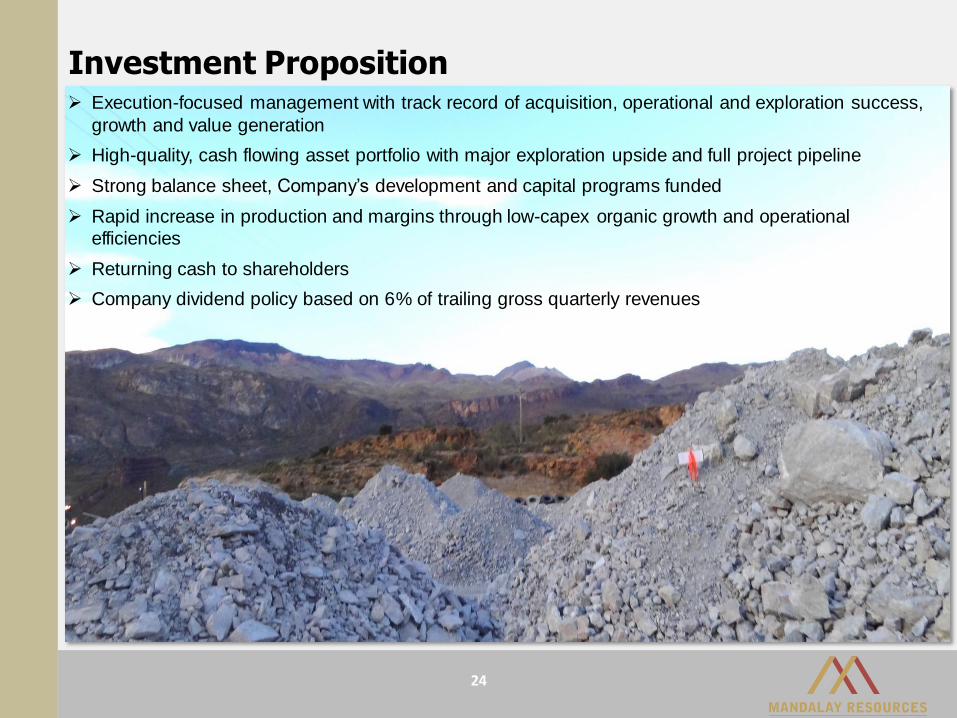
Investment Proposition Execution-focused management with track record of acquisition, operational and exploration success,
growth and value generation
High-quality, cash flowing asset portfolio with major exploration upside and full project pipeline
Strong balance sheet, Company’s development and capital programs funded
Rapid increase in production and margins through low-capex organic growth and operational
efficiencies
Returning cash to shareholders
Company dividend policy based on 6% of trailing gross quarterly revenues
JAN2015
DELIVERING
VALUE AND GROWTH
For more information, please contact:
Greg DiTomaso
Director, Investor Relations
Tel: 647.260.1566
Email: [email protected]
Company Website: www.mandalayresources.com
Twitter: @MandalayAuAg
26
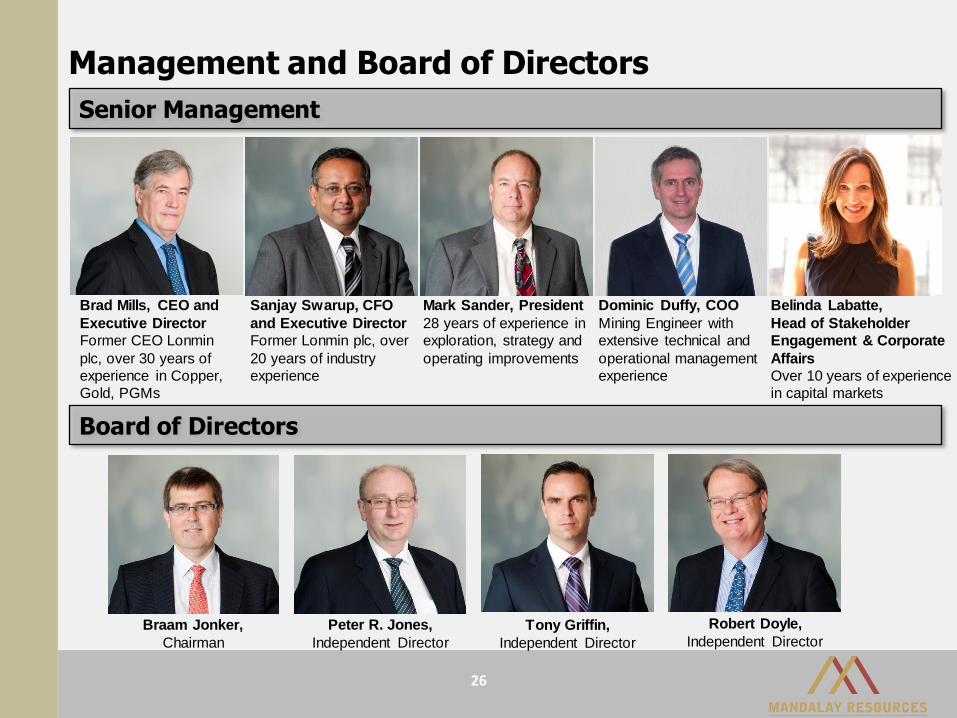
Management and Board of Directors
Senior Management
Board of Directors
Brad Mills, CEO and
Executive Director
Former CEO Lonmin
plc, over 30 years of
experience in Copper,
Gold, PGMs
Mark Sander, President
28 years of experience in
exploration, strategy and
operating improvements
Sanjay Swarup, CFO
and Executive Director
Former Lonmin plc, over
20 years of industry
experience
Belinda Labatte,
Head of Stakeholder
Engagement & Corporate
Affairs
Over 10 years of experience
in capital markets
Braam Jonker,
Chairman
Peter R. Jones,
Independent Director
Tony Griffin,
Independent Director
Robert Doyle,
Independent Director
Dominic Duffy, COO
Mining Engineer with
extensive technical and
operational management
experience
Numbers may differ slightly from source documents due to rounding
27
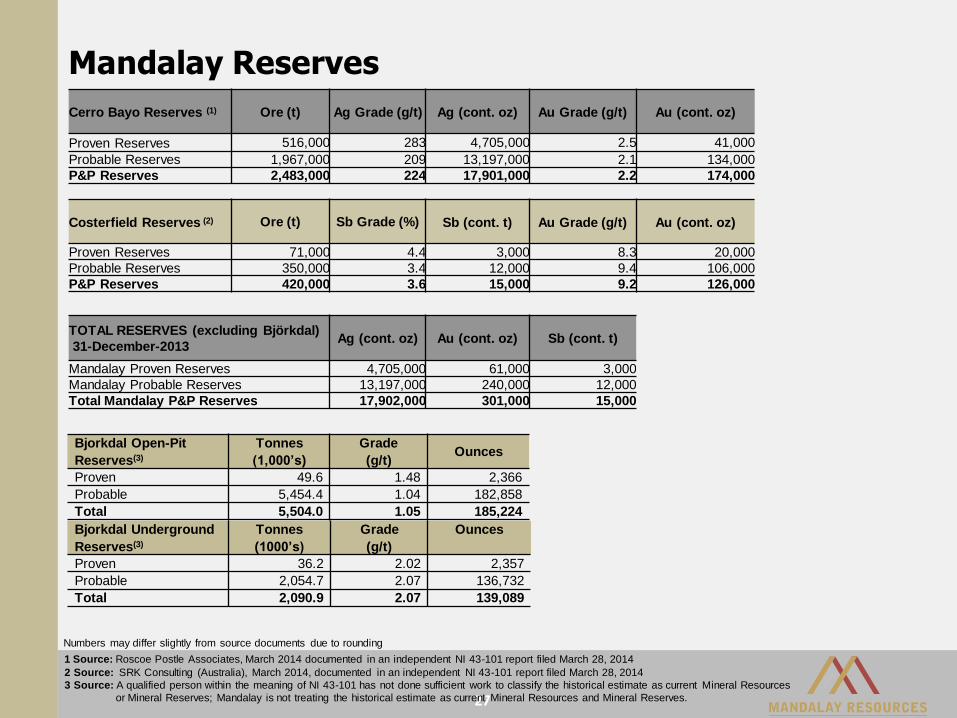
Mandalay Reserves
Cerro Bayo Reserves (1) Ore (t) Ag Grade (g/t) Ag (cont. oz) Au Grade (g/t) Au (cont. oz)
Proven Reserves 516,000 283 4,705,000 2.5 41,000
Probable Reserves 1,967,000 209 13,197,000 2.1 134,000
P&P Reserves 2,483,000 224 17,901,000 2.2 174,000
Costerfield Reserves (2) Ore (t) Sb Grade (%) Sb (cont. t) Au Grade (g/t) Au (cont. oz)
Proven Reserves 71,000 4.4 3,000 8.3 20,000
Probable Reserves 350,000 3.4 12,000 9.4 106,000
P&P Reserves 420,000 3.6 15,000 9.2 126,000
TOTAL RESERVES (excluding Björkdal)
31-December-2013Ag (cont. oz) Au (cont. oz) Sb (cont. t)
Mandalay Proven Reserves 4,705,000 61,000 3,000
Mandalay Probable Reserves 13,197,000 240,000 12,000
Total Mandalay P&P Reserves 17,902,000 301,000 15,000
1 Source: Roscoe Postle Associates, March 2014 documented in an independent NI 43-101 report filed March 28, 2014
2 Source: SRK Consulting (Australia), March 2014, documented in an independent NI 43-101 report filed March 28, 2014
3 Source: A qualified person within the meaning of NI 43-101 has not done sufficient work to classify the historical estimate as current Mineral Resources
or Mineral Reserves; Mandalay is not treating the historical estimate as current Mineral Resources and Mineral Reserves.
Bjorkdal Open-Pit
Reserves(3)
Tonnes
(1,000’s)
Grade
(g/t)Ounces
Proven 49.6 1.48 2,366
Probable 5,454.4 1.04 182,858
Total 5,504.0 1.05 185,224
Bjorkdal Underground
Reserves(3)
Tonnes
(1000’s)
Grade
(g/t)
Ounces
Proven 36.2 2.02 2,357
Probable 2,054.7 2.07 136,732
Total 2,090.9 2.07 139,089
28
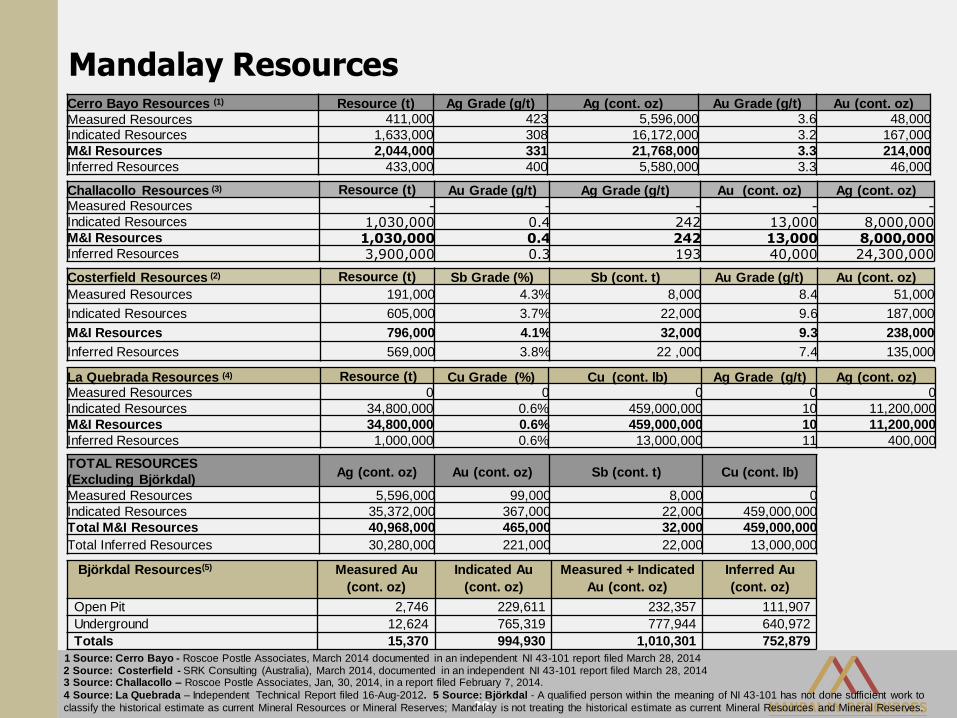
Mandalay ResourcesCerro Bayo Resources (1) Resource (t) Ag Grade (g/t) Ag (cont. oz) Au Grade (g/t) Au (cont. oz)
Measured Resources 411,000 423 5,596,000 3.6 48,000
Indicated Resources 1,633,000 308 16,172,000 3.2 167,000
M&I Resources 2,044,000 331 21,768,000 3.3 214,000
Inferred Resources 433,000 400 5,580,000 3.3 46,000
Costerfield Resources (2) Resource (t) Sb Grade (%) Sb (cont. t) Au Grade (g/t) Au (cont. oz)
Measured Resources 191,000 4.3% 8,000 8.4 51,000
Indicated Resources 605,000 3.7% 22,000 9.6 187,000
M&I Resources 796,000 4.1% 32,000 9.3 238,000
Inferred Resources 569,000 3.8% 22 ,000 7.4 135,000
TOTAL RESOURCES
(Excluding Björkdal)Ag (cont. oz) Au (cont. oz) Sb (cont. t) Cu (cont. lb)
Measured Resources 5,596,000 99,000 8,000 0
Indicated Resources 35,372,000 367,000 22,000 459,000,000
Total M&I Resources 40,968,000 465,000 32,000 459,000,000
Total Inferred Resources 30,280,000 221,000 22,000 13,000,000
1 Source: Cerro Bayo - Roscoe Postle Associates, March 2014 documented in an independent NI 43-101 report filed March 28, 20142 Source: Costerfield - SRK Consulting (Australia), March 2014, documented in an independent NI 43-101 report filed March 28, 2014
La Quebrada Resources (4) Resource (t) Cu Grade (%) Cu (cont. lb) Ag Grade (g/t) Ag (cont. oz)Measured Resources 0 0 0 0 0
Indicated Resources 34,800,000 0.6% 459,000,000 10 11,200,000
M&I Resources 34,800,000 0.6% 459,000,000 10 11,200,000
Inferred Resources 1,000,000 0.6% 13,000,000 11 400,000
Challacollo Resources (3) Resource (t) Au Grade (g/t) Ag Grade (g/t) Au (cont. oz) Ag (cont. oz)Measured Resources - - - - -Indicated Resources 1,030,000 0.4 242 13,000 8,000,000 M&I Resources 1,030,000 0.4 242 13,000 8,000,000 Inferred Resources 3,900,000 0.3 193 40,000 24,300,000
3 Source: Challacollo – Roscoe Postle Associates, Jan, 30, 2014, in a report filed February 7, 2014.
4 Source: La Quebrada – Independent Technical Report filed 16-Aug-2012. 5 Source: Björkdal - A qualified person within the meaning of NI 43-101 has not done sufficient work to
classify the historical estimate as current Mineral Resources or Mineral Reserves; Mandalay is not treating the historical estimate as current Mineral Resources and Mineral Reserves.
Björkdal Resources(5) Measured Au
(cont. oz)
Indicated Au
(cont. oz)
Measured + Indicated
Au (cont. oz)
Inferred Au
(cont. oz)
Open Pit 2,746 229,611 232,357 111,907
Underground 12,624 765,319 777,944 640,972
Totals 15,370 994,930 1,010,301 752,879