managing working capital globally - c.ymcdn.comc.ymcdn.com/sites/ · 2 corporate panelist biography...
TRANSCRIPT
Managing Working Capital Globally Trends in today’s markets
Robin Veariel, Working Capital Advisor, Bank of America Merrill Lynch John Engeman, Director of Treasury, David Yurman May 28, 2015
2
Corporate Panelist Biography
John Engeman, is the Director of Treasury for David Yurman, responsible for global treasury and
insurance. Prior to joining the company in 2014, he was the Vice President, Assistant Treasurer of Kate Spade & Company (formerly Liz Claiborne) and the Treasurer of the Kate Spade Foundation. His primary responsibilities included managing global treasury operations, focusing on cash and risk management, investments, debt and liquidity management. Prior to joining Kate Spade, he was the Treasurer of Agfa Corporation.
John is a Certified Treasury Professional, Certified Management Accountant, Certified Financial Manager and Distinguished Toastmaster. He is a member of the National Association of Corporate Treasurers, Association for Financial Professionals, Institute of Management Accountants and Toastmasters International. He has a BBA in finance from the University of Notre Dame and his MBA from Hofstra University.
3
Agenda
•Working Capital basics
•Best Practices in Liquidity Management
•Global Working Capital Trends
•Global Liquidity Trends
•Global Payment Trends
•Global Trade Trends
•Summary
4
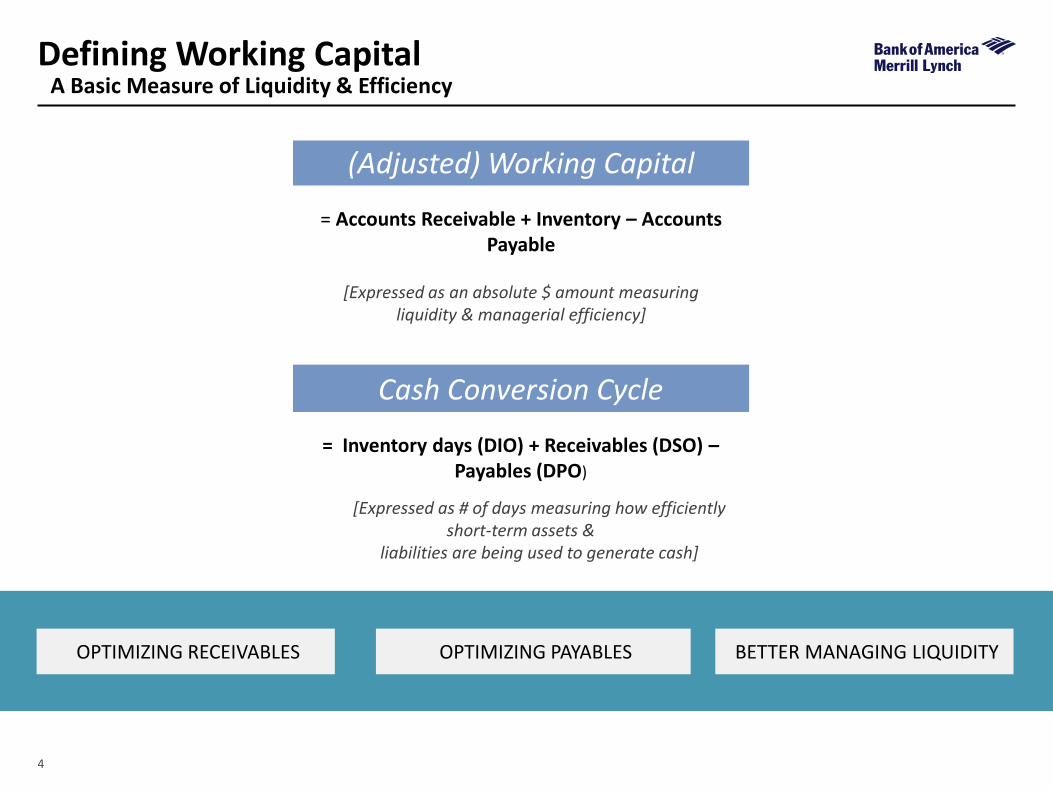
Cash Conversion Cycle
= Inventory days (DIO) + Receivables (DSO) – Payables (DPO)
[Expressed as # of days measuring how efficiently short-term assets &
liabilities are being used to generate cash]
(Adjusted) Working Capital
= Accounts Receivable + Inventory – Accounts Payable
[Expressed as an absolute $ amount measuring liquidity & managerial efficiency]
Defining Working Capital A Basic Measure of Liquidity & Efficiency
OPTIMIZING PAYABLES OPTIMIZING RECEIVABLES BETTER MANAGING LIQUIDITY

5
Global Working Capital Focus
• Pre 2014 - no borrowing required
• 2014 growth and investment
• New stores, new distribution center
• Store maintenance, HQ facelift
• Capex doubled and inventory became “bloated”
• Moderate sales growth
• Significant use of excess cash from 2013
• Borrowing in 2014 to fund growth
6
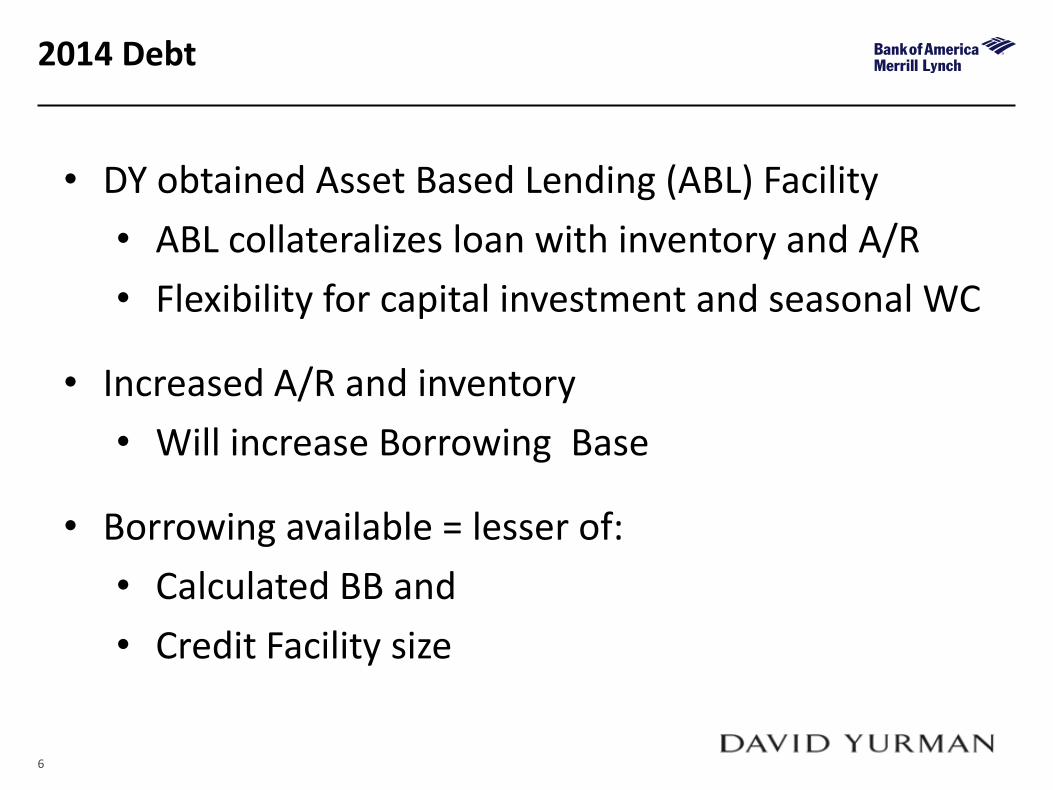
2014 Debt
• DY obtained Asset Based Lending (ABL) Facility
• ABL collateralizes loan with inventory and A/R
• Flexibility for capital investment and seasonal WC
• Increased A/R and inventory
• Will increase Borrowing Base
• Borrowing available = lesser of:
• Calculated BB and
• Credit Facility size
7
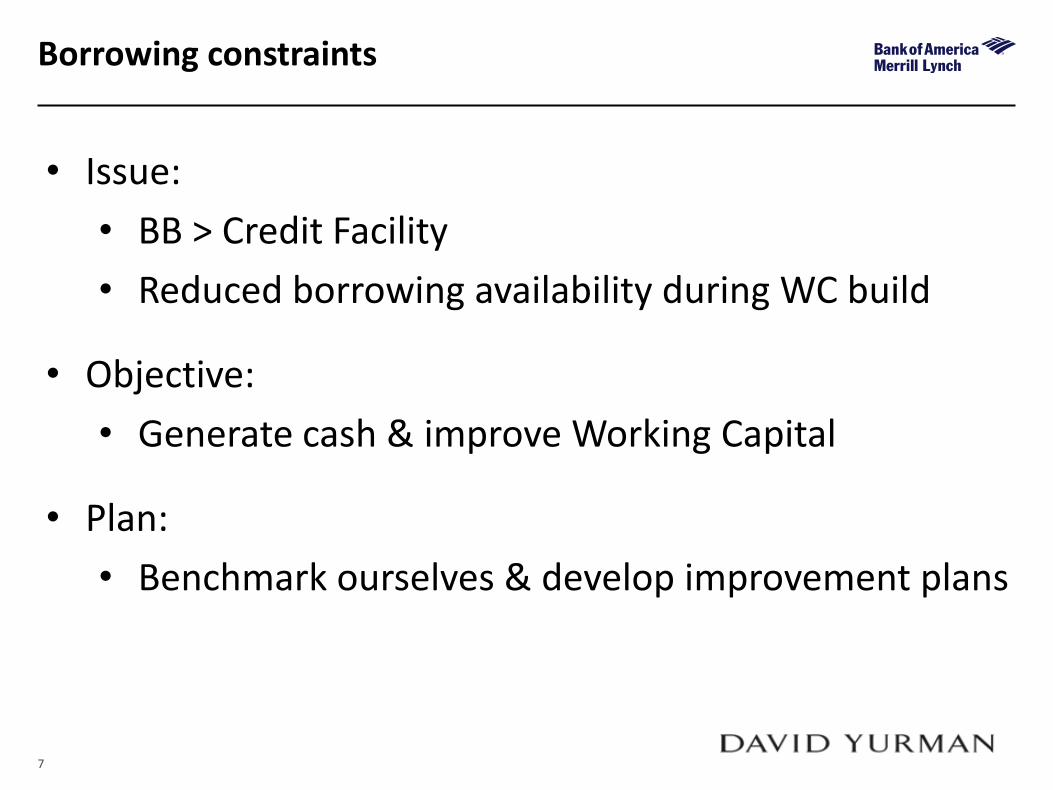
Borrowing constraints
• Issue:
• BB > Credit Facility
• Reduced borrowing availability during WC build
• Objective:
• Generate cash & improve Working Capital
• Plan:
• Benchmark ourselves & develop improvement plans
8
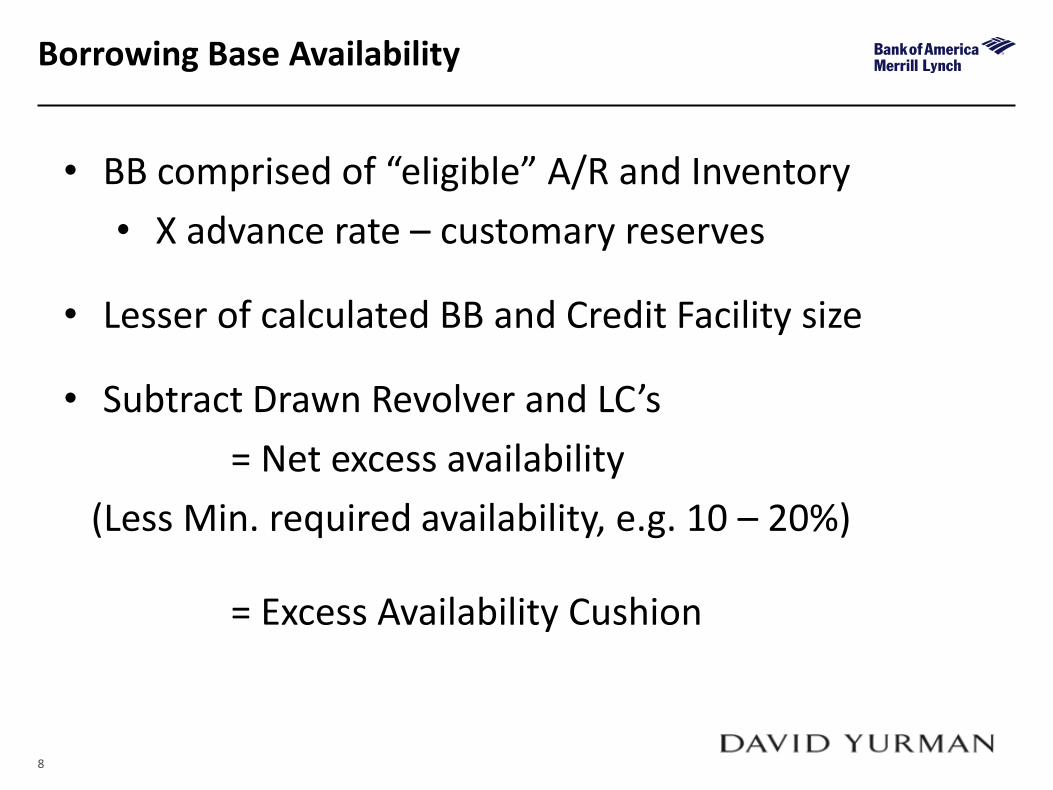
Borrowing Base Availability
• BB comprised of “eligible” A/R and Inventory
• X advance rate – customary reserves
• Lesser of calculated BB and Credit Facility size
• Subtract Drawn Revolver and LC’s
= Net excess availability
(Less Min. required availability, e.g. 10 – 20%)
= Excess Availability Cushion
9
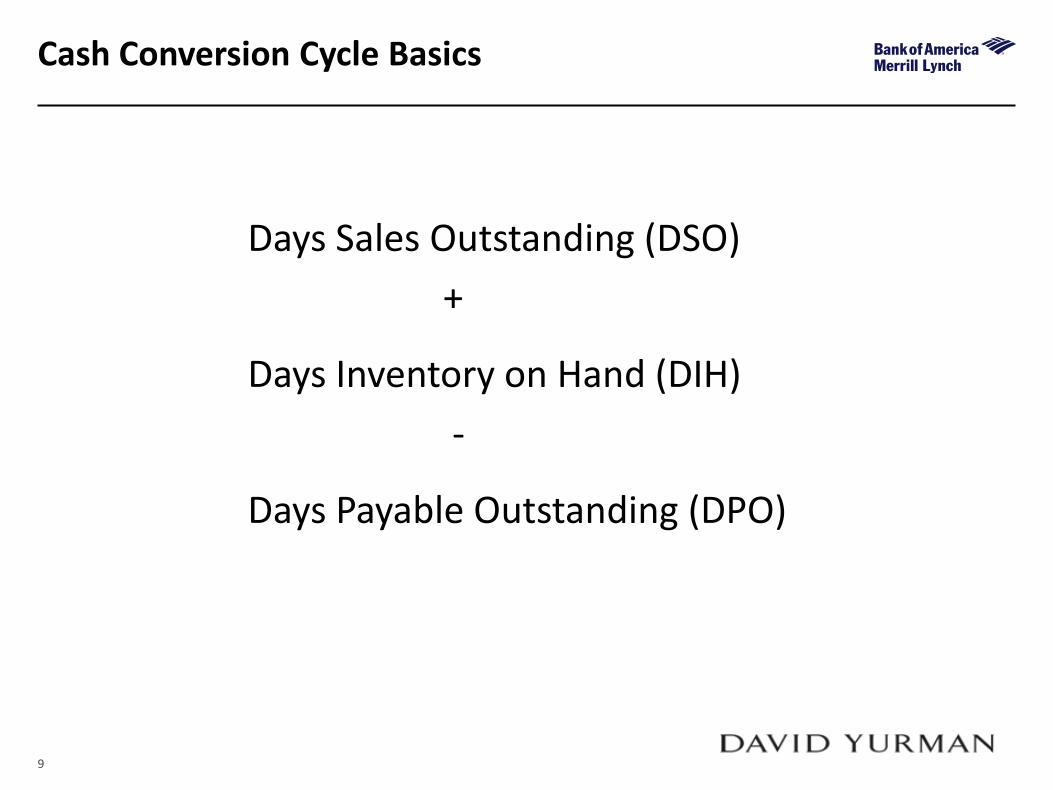
Cash Conversion Cycle Basics
Days Sales Outstanding (DSO)
+
Days Inventory on Hand (DIH)
-
Days Payable Outstanding (DPO)
10
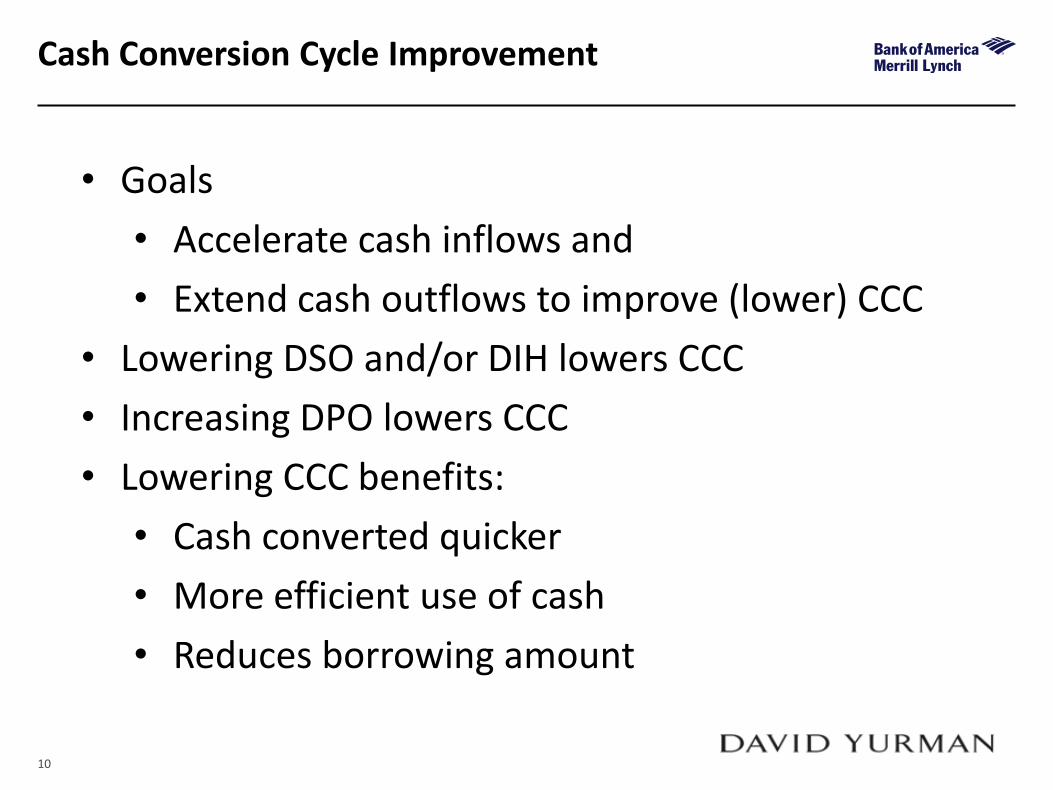
Cash Conversion Cycle Improvement
• Goals
• Accelerate cash inflows and
• Extend cash outflows to improve (lower) CCC
• Lowering DSO and/or DIH lowers CCC
• Increasing DPO lowers CCC
• Lowering CCC benefits:
• Cash converted quicker
• More efficient use of cash
• Reduces borrowing amount
11
Meeting Liquidity Objectives Best Practices
BEST PRACTICES OBJECTIVES
12
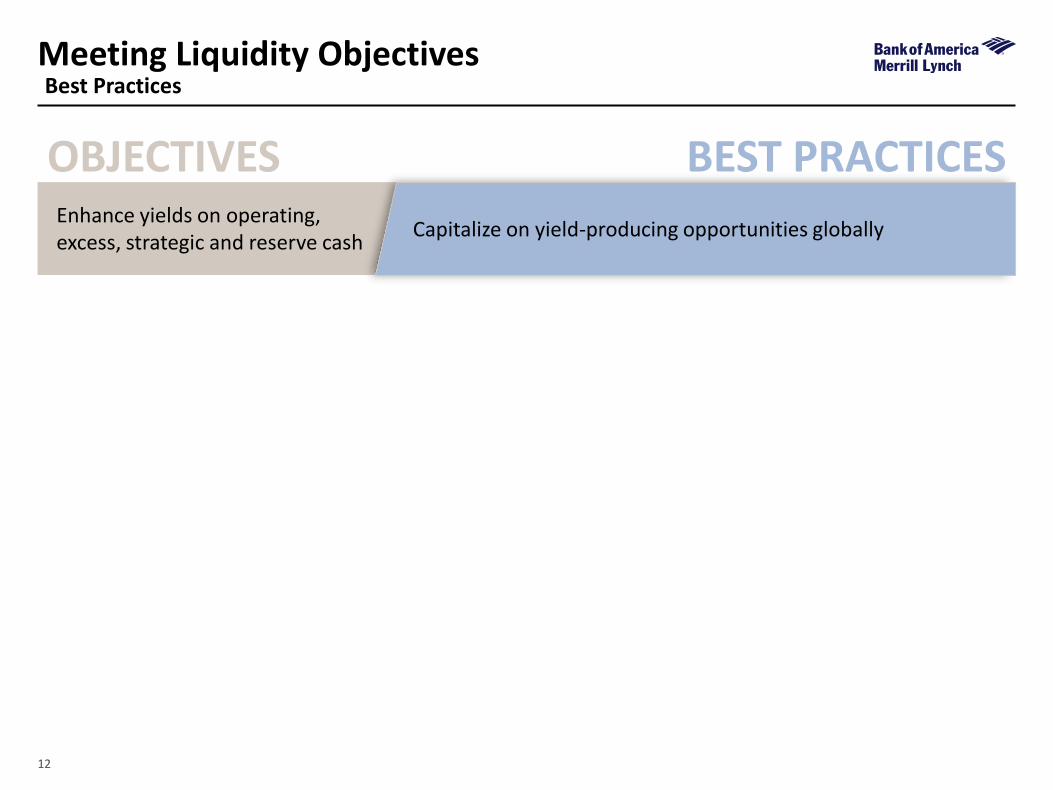
Meeting Liquidity Objectives Best Practices
BEST PRACTICES Enhance yields on operating, excess, strategic and reserve cash
OBJECTIVES
Capitalize on yield-producing opportunities globally
13
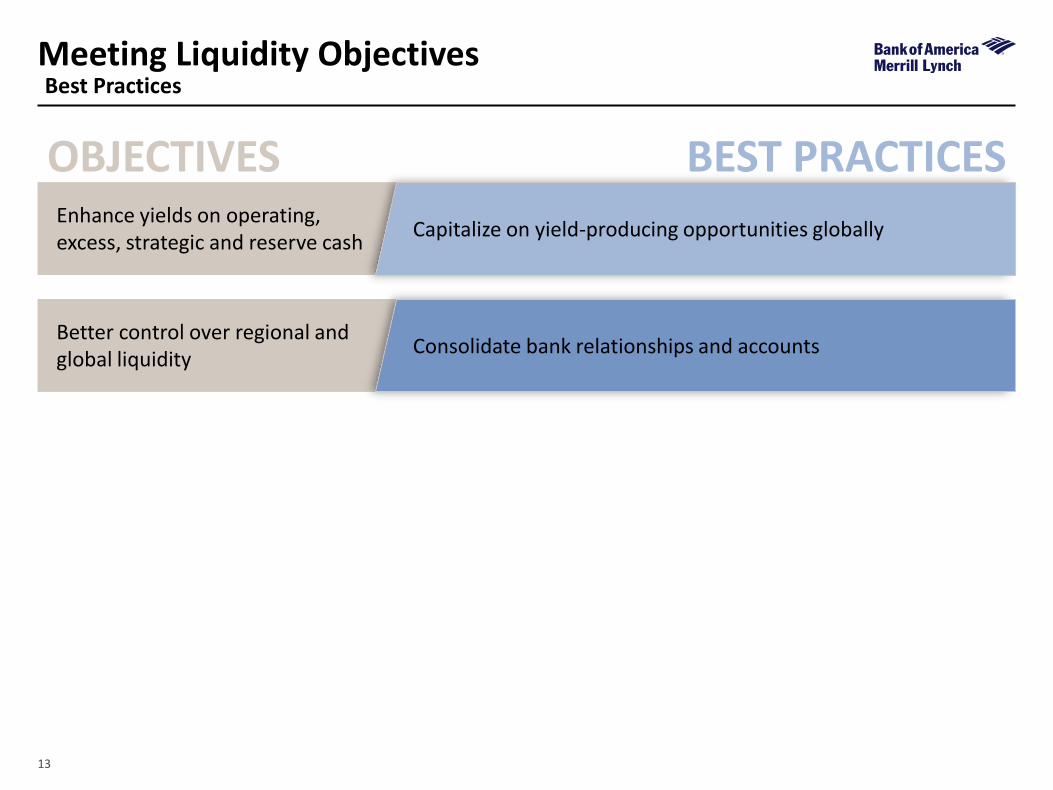
Meeting Liquidity Objectives Best Practices
BEST PRACTICES Enhance yields on operating, excess, strategic and reserve cash
Better control over regional and global liquidity
OBJECTIVES
Capitalize on yield-producing opportunities globally
Consolidate bank relationships and accounts
14
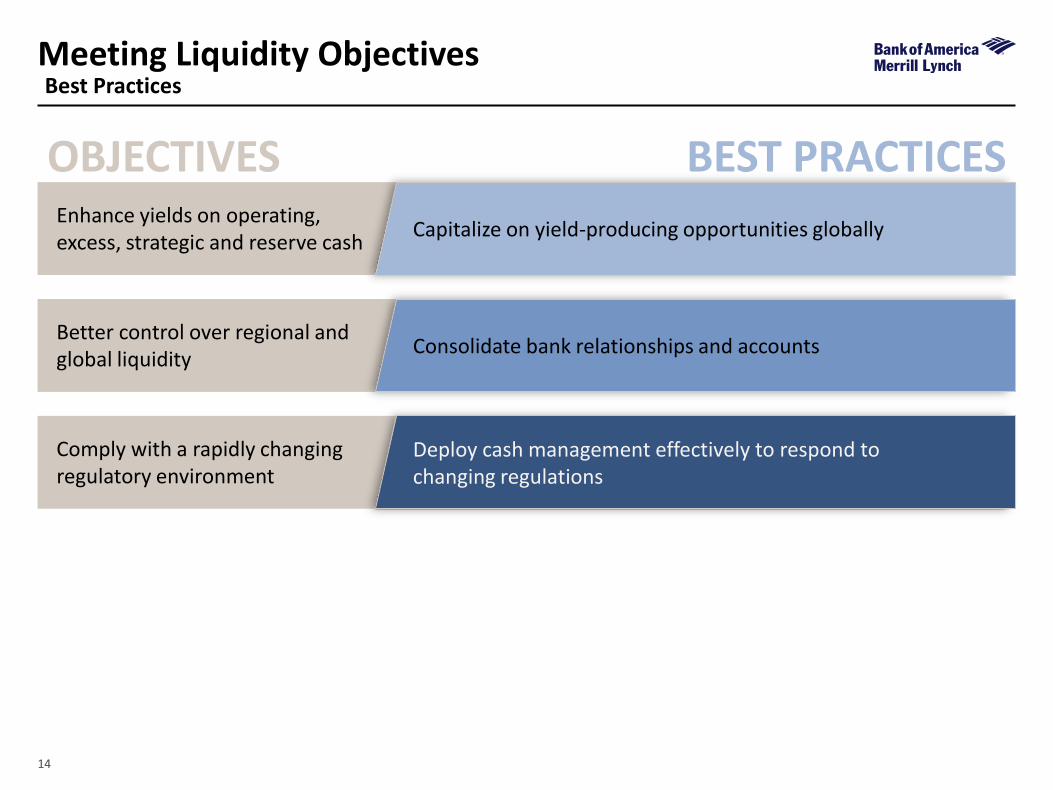
Meeting Liquidity Objectives Best Practices
BEST PRACTICES Enhance yields on operating, excess, strategic and reserve cash
Better control over regional and global liquidity
Comply with a rapidly changing regulatory environment
OBJECTIVES
Capitalize on yield-producing opportunities globally
Consolidate bank relationships and accounts
Deploy cash management effectively to respond to changing regulations
15
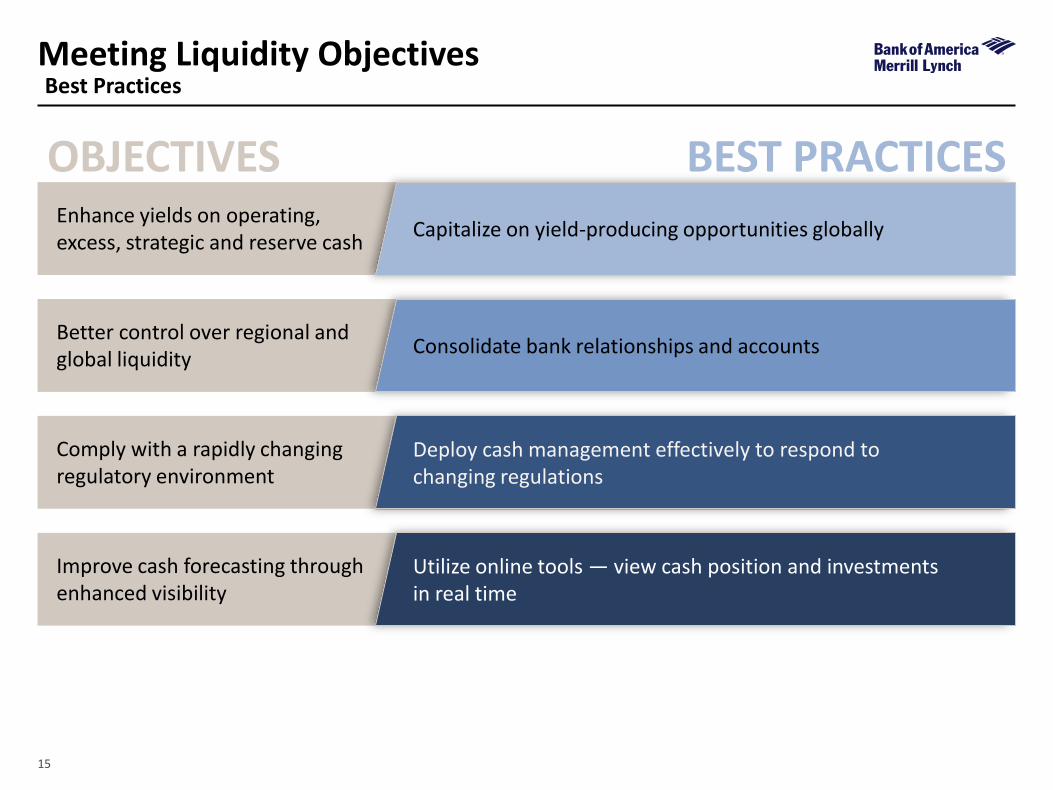
Meeting Liquidity Objectives Best Practices
BEST PRACTICES Enhance yields on operating, excess, strategic and reserve cash
Better control over regional and global liquidity
Comply with a rapidly changing regulatory environment
OBJECTIVES
Improve cash forecasting through enhanced visibility
Capitalize on yield-producing opportunities globally
Consolidate bank relationships and accounts
Deploy cash management effectively to respond to changing regulations
Utilize online tools — view cash position and investments in real time
16
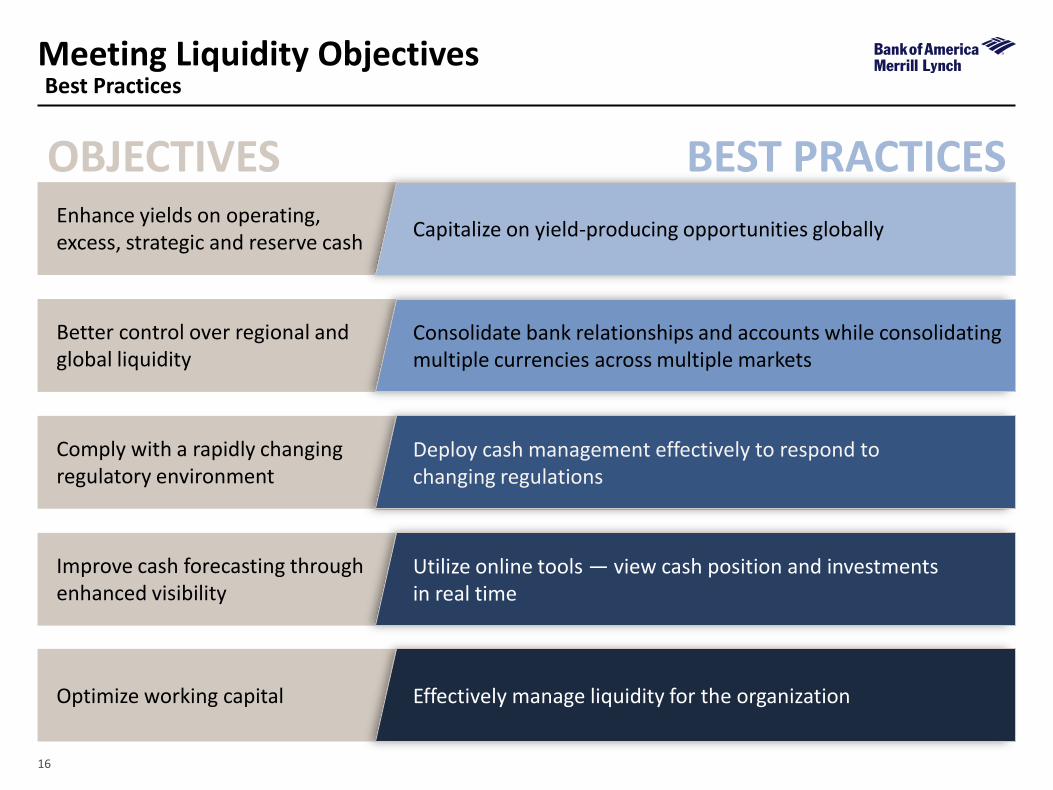
Meeting Liquidity Objectives Best Practices
BEST PRACTICES Enhance yields on operating, excess, strategic and reserve cash
Better control over regional and global liquidity
Comply with a rapidly changing regulatory environment
OBJECTIVES
Improve cash forecasting through enhanced visibility
Capitalize on yield-producing opportunities globally
Consolidate bank relationships and accounts while consolidating multiple currencies across multiple markets
Deploy cash management effectively to respond to changing regulations
Utilize online tools — view cash position and investments in real time
Optimize working capital Effectively manage liquidity for the organization
Global Working Capital Trends
global working capital performance has improved by 2% year over year (1)
(1) Source: PwC Annual Global Working Capital Survey, Cash for Growth (July 2014)
18
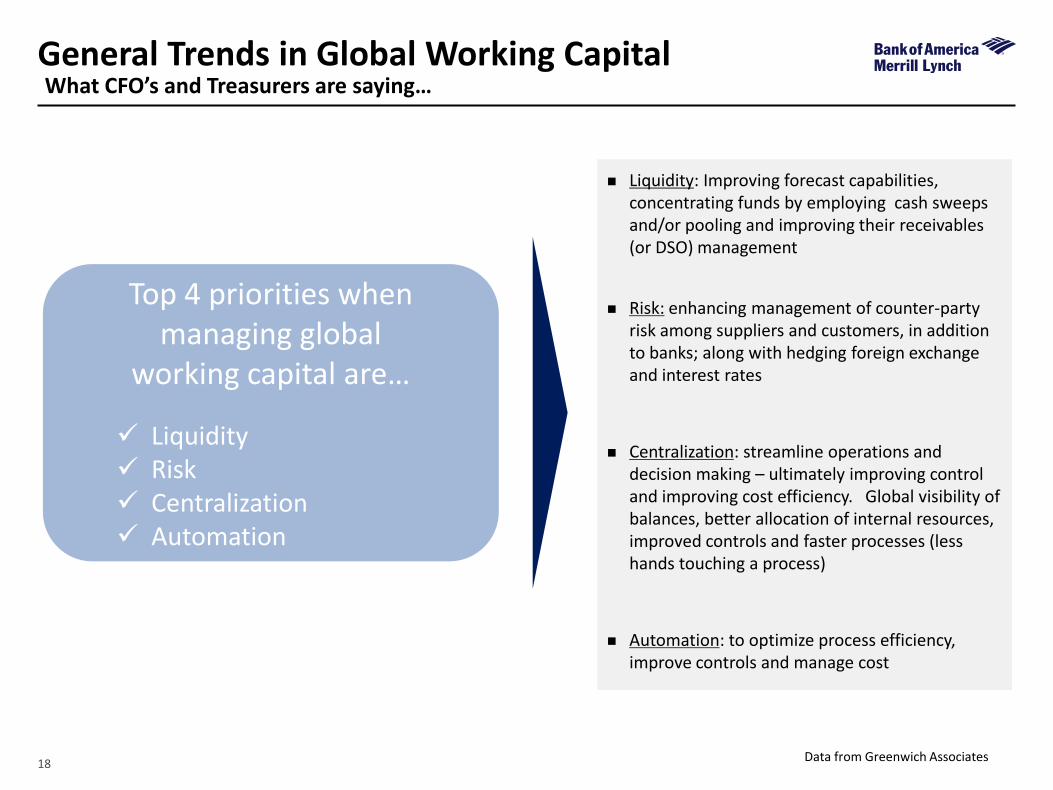
General Trends in Global Working Capital What CFO’s and Treasurers are saying…
Liquidity: Improving forecast capabilities, concentrating funds by employing cash sweeps and/or pooling and improving their receivables (or DSO) management
Risk: enhancing management of counter-party risk among suppliers and customers, in addition to banks; along with hedging foreign exchange and interest rates
Centralization: streamline operations and decision making – ultimately improving control and improving cost efficiency. Global visibility of balances, better allocation of internal resources, improved controls and faster processes (less hands touching a process)
Automation: to optimize process efficiency, improve controls and manage cost
Top 4 priorities when managing global
working capital are…
Liquidity Risk Centralization Automation
Data from Greenwich Associates
19
Global Working Capital Performance Factors Behind Performance Variations
20
Global Working Capital Performance Factors Behind Performance Variations
Payment practices Payment terms and behaviors, payment usage,
legal frameworks and cash collection effectiveness
21
Focus on cash & effectiveness of WC management Intensity of management focus on cash
& WC management processes
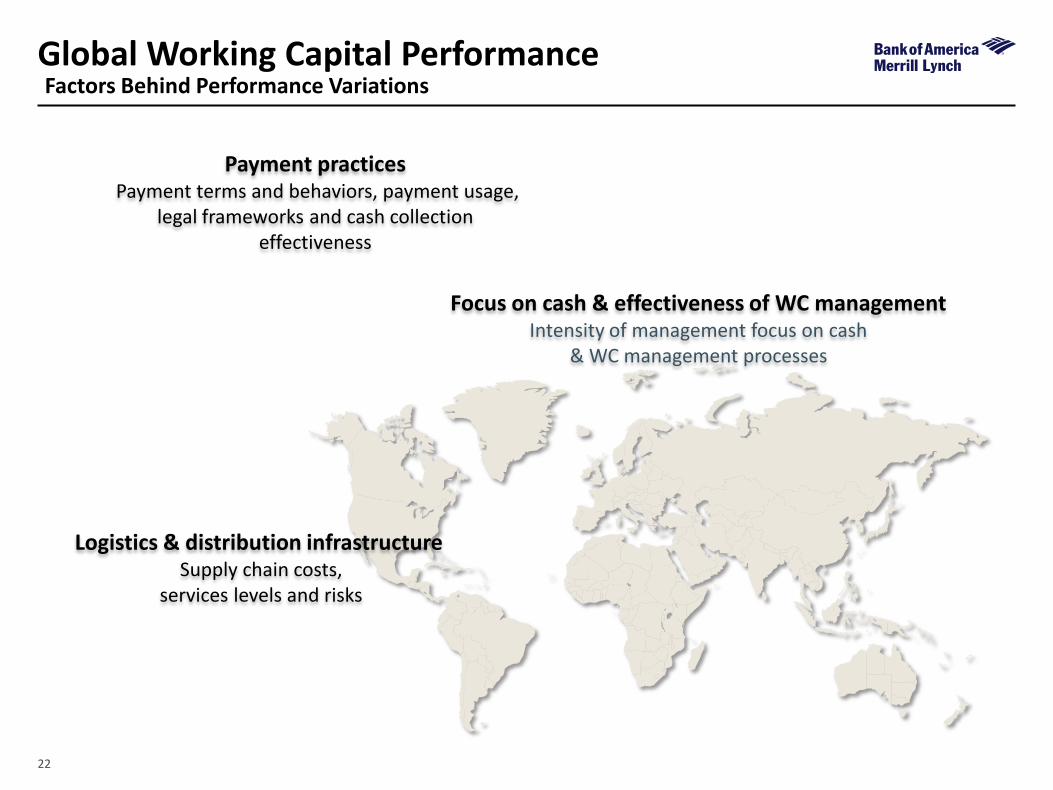
Global Working Capital Performance Factors Behind Performance Variations
Payment practices Payment terms and behaviors, payment usage,
legal frameworks and cash collection effectiveness
22
Logistics & distribution infrastructure Supply chain costs,
services levels and risks
Focus on cash & effectiveness of WC management Intensity of management focus on cash
& WC management processes
Global Working Capital Performance Factors Behind Performance Variations
Payment practices Payment terms and behaviors, payment usage,
legal frameworks and cash collection effectiveness
23 23
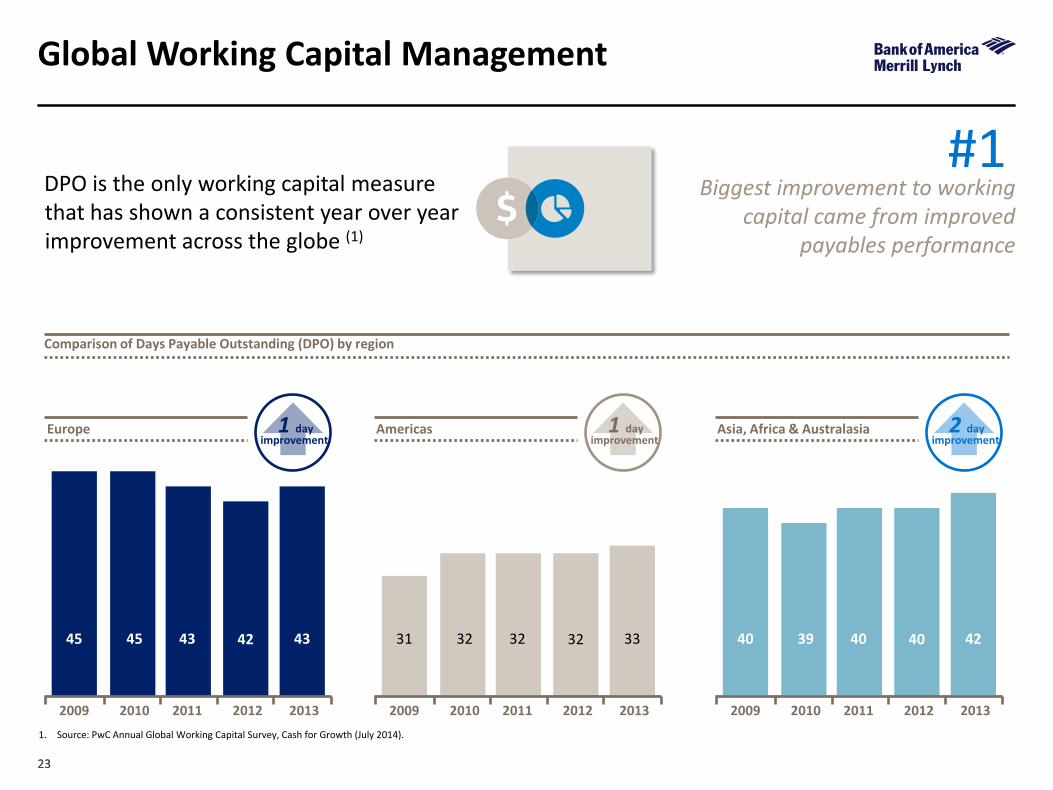
Global Working Capital Management
DPO is the only working capital measure that has shown a consistent year over year improvement across the globe (1)
Biggest improvement to working capital came from improved
payables performance
1. Source: PwC Annual Global Working Capital Survey, Cash for Growth (July 2014).
45 45 43 43 42
2009 2010 2011 2012 2013
Europe improvement
1 day
Comparison of Days Payable Outstanding (DPO) by region
31 32 32 33 32
2009 2010 2011 2012 2013
Americas improvement
1 day
40 39 40 42 40
2009 2010 2011 2012 2013
Asia, Africa & Australasia improvement
2 day
#1
24 24
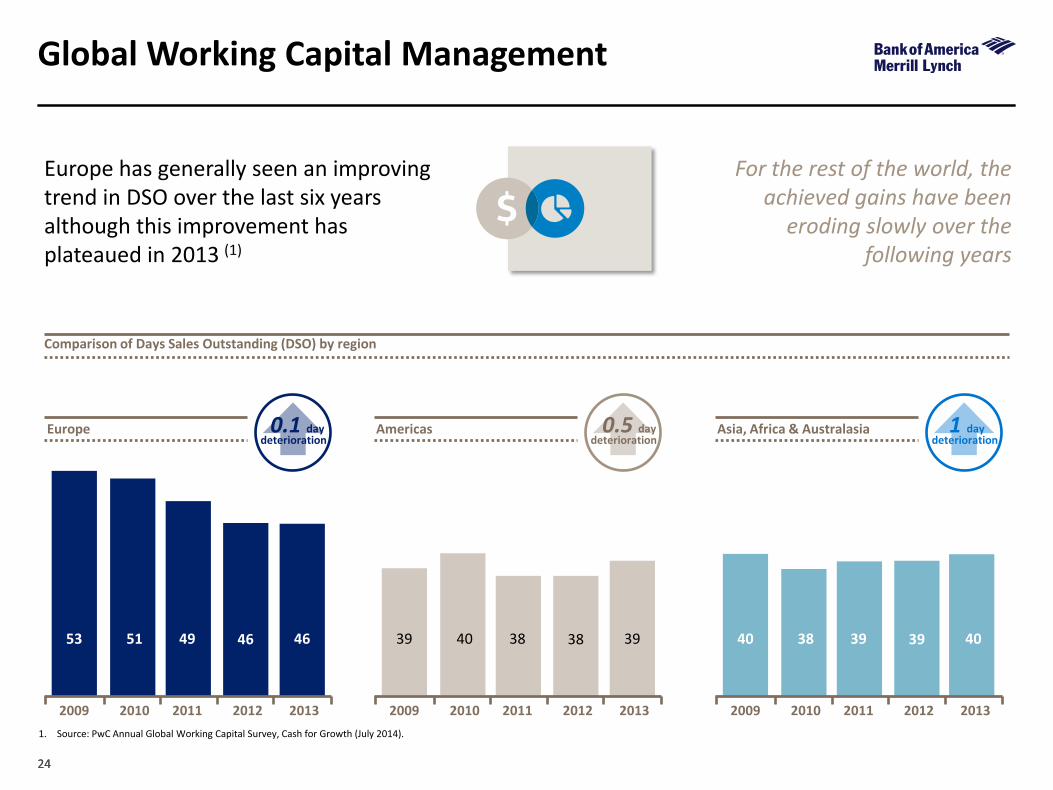
Global Working Capital Management
Europe has generally seen an improving trend in DSO over the last six years although this improvement has plateaued in 2013 (1)
For the rest of the world, the achieved gains have been
eroding slowly over the following years
1. Source: PwC Annual Global Working Capital Survey, Cash for Growth (July 2014).
53 51 49 46 46
2009 2010 2011 2012 2013
Europe deterioration
0.1 day
Comparison of Days Sales Outstanding (DSO) by region
39 40 38 39 38
2009 2010 2011 2012 2013
Americas deterioration
0.5 day
40 38 39 40 39
2009 2010 2011 2012 2013
Asia, Africa & Australasia deterioration
1 day
25 25
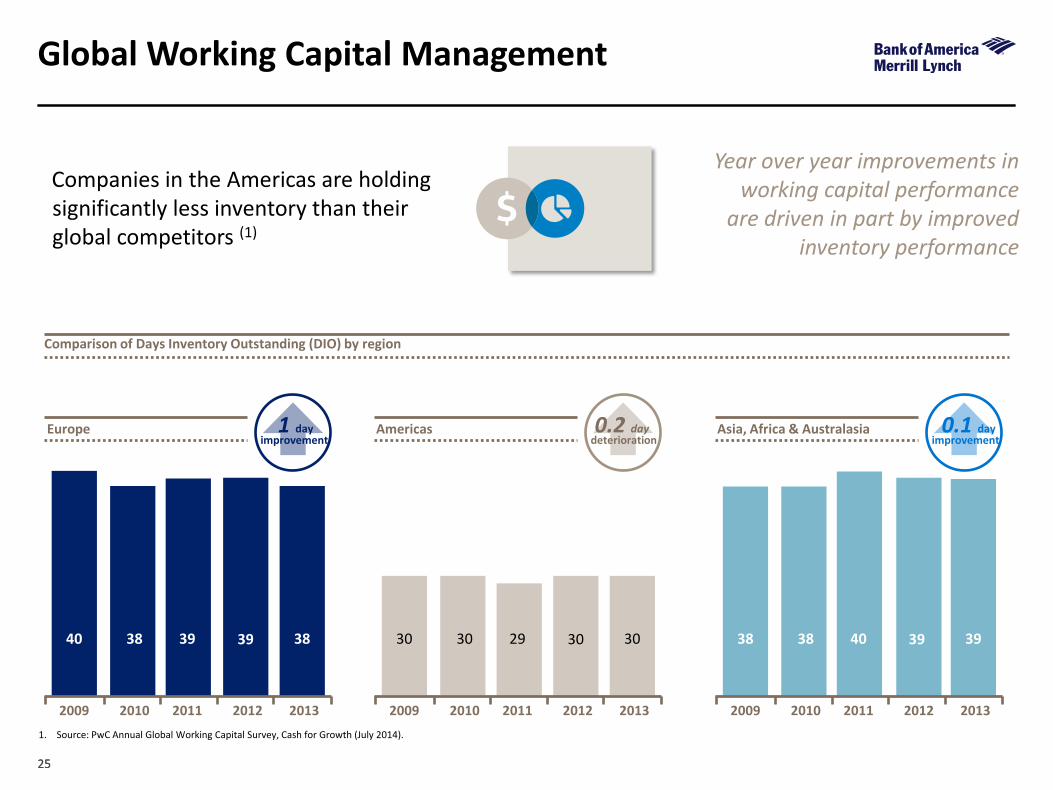
Global Working Capital Management
Companies in the Americas are holding significantly less inventory than their global competitors (1)
Year over year improvements in working capital performance
are driven in part by improved inventory performance
1. Source: PwC Annual Global Working Capital Survey, Cash for Growth (July 2014).
40 38 39 38 39
2009 2010 2011 2012 2013
Europe improvement
1 day
Comparison of Days Inventory Outstanding (DIO) by region
30 30 29 30 30
2009 2010 2011 2012 2013
Americas deterioration 0.2 day
38 38 40 39 39
2009 2010 2011 2012 2013
Asia, Africa & Australasia improvement 0.1 day
Global Liquidity Trends
27 27
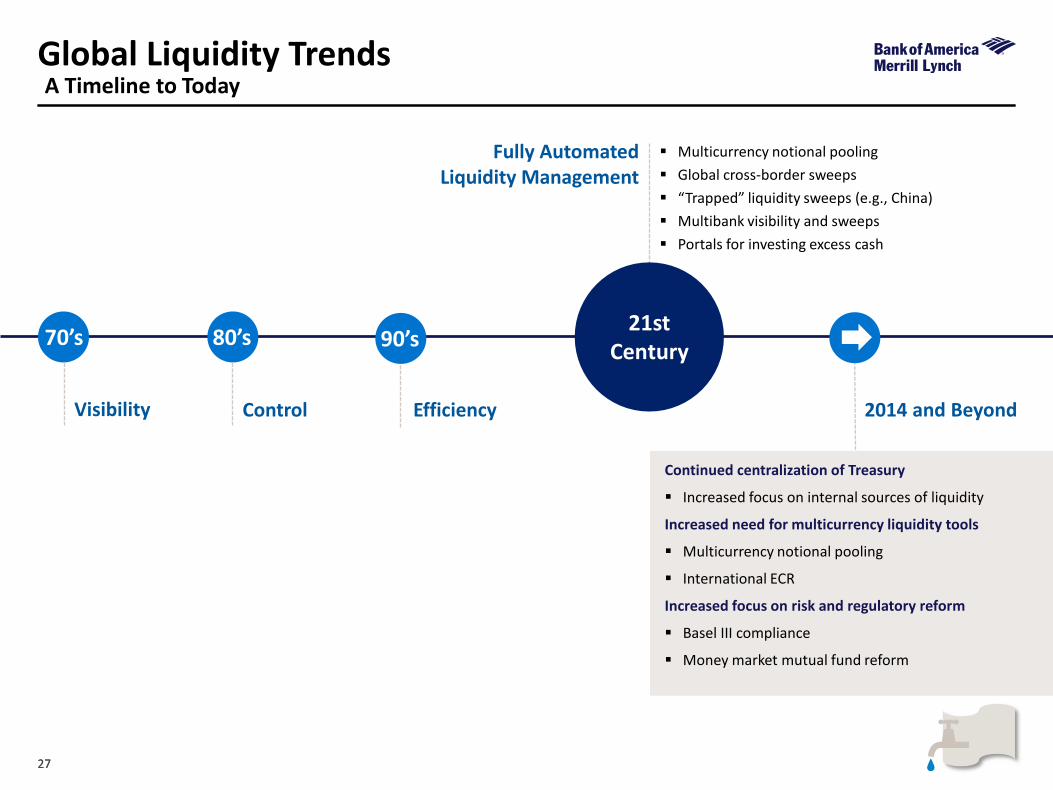
Global Liquidity Trends A Timeline to Today
70’s
Visibility
80’s
Control
90’s
Efficiency
21st Century
Fully Automated Liquidity Management
Continued centralization of Treasury
Increased focus on internal sources of liquidity
Increased need for multicurrency liquidity tools
Multicurrency notional pooling
International ECR
Increased focus on risk and regulatory reform
Basel III compliance
Money market mutual fund reform
Multicurrency notional pooling
Global cross-border sweeps
“Trapped” liquidity sweeps (e.g., China)
Multibank visibility and sweeps
Portals for investing excess cash
2014 and Beyond
28 28
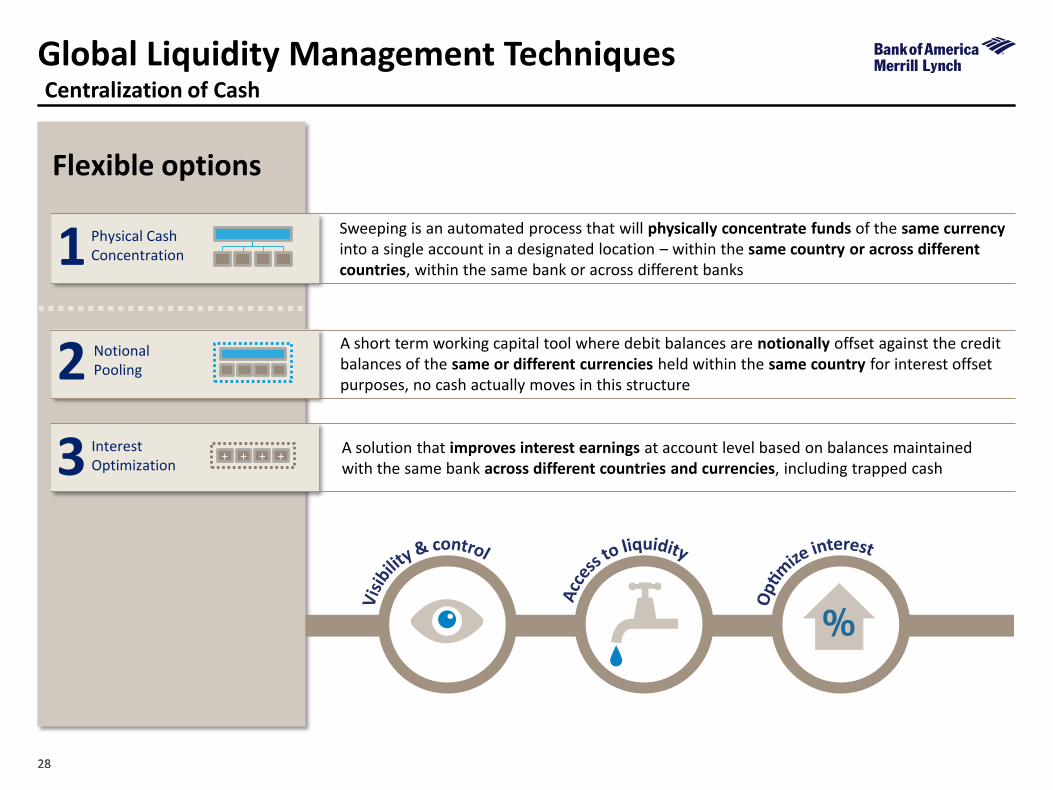
Global Liquidity Management Techniques Centralization of Cash
Sweeping is an automated process that will physically concentrate funds of the same currency into a single account in a designated location – within the same country or across different countries, within the same bank or across different banks
A solution that improves interest earnings at account level based on balances maintained with the same bank across different countries and currencies, including trapped cash
A short term working capital tool where debit balances are notionally offset against the credit balances of the same or different currencies held within the same country for interest offset purposes, no cash actually moves in this structure
Flexible options
3 Interest Optimization
+ + + +
2 Notional Pooling
1 Physical Cash Concentration
29 29
Global Liquidity Management Techniques
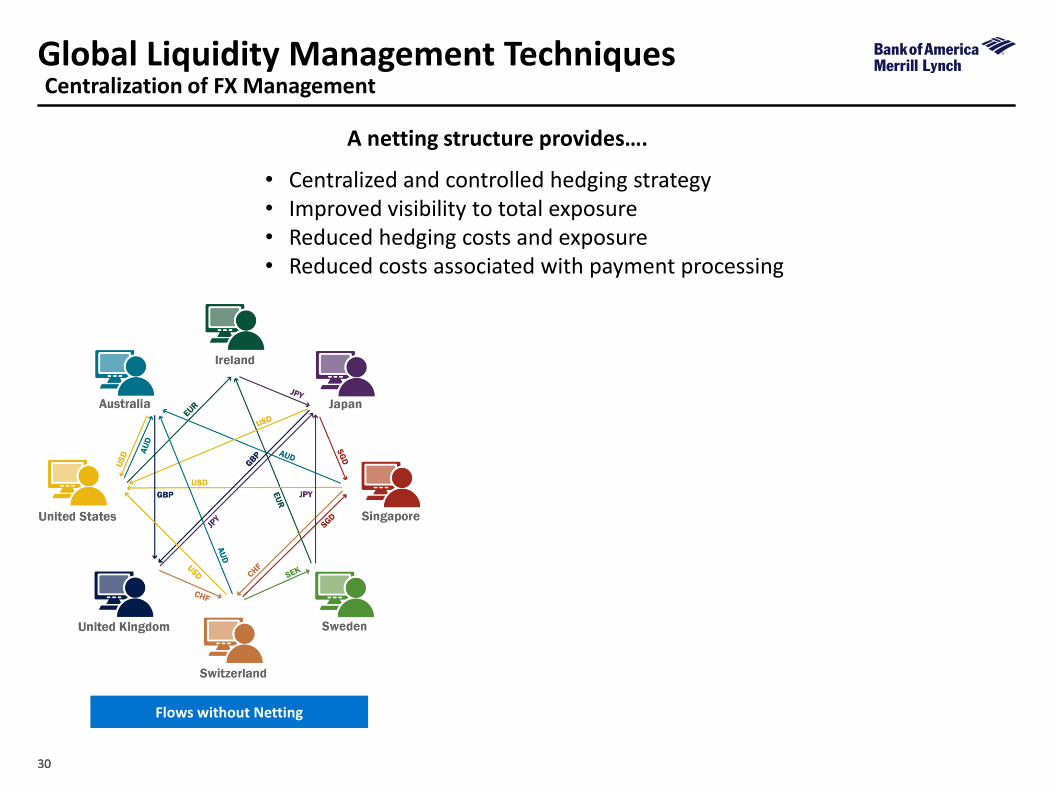
A netting structure provides….
• Centralized and controlled hedging strategy • Improved visibility to total exposure • Reduced hedging costs and exposure • Reduced costs associated with payment processing
Centralization of FX Management
30 30
Global Liquidity Management Techniques Centralization of FX Management
A netting structure provides….
• Centralized and controlled hedging strategy • Improved visibility to total exposure • Reduced hedging costs and exposure • Reduced costs associated with payment processing
Flows without Netting
31 31
Global Liquidity Management Techniques Centralization of FX Management
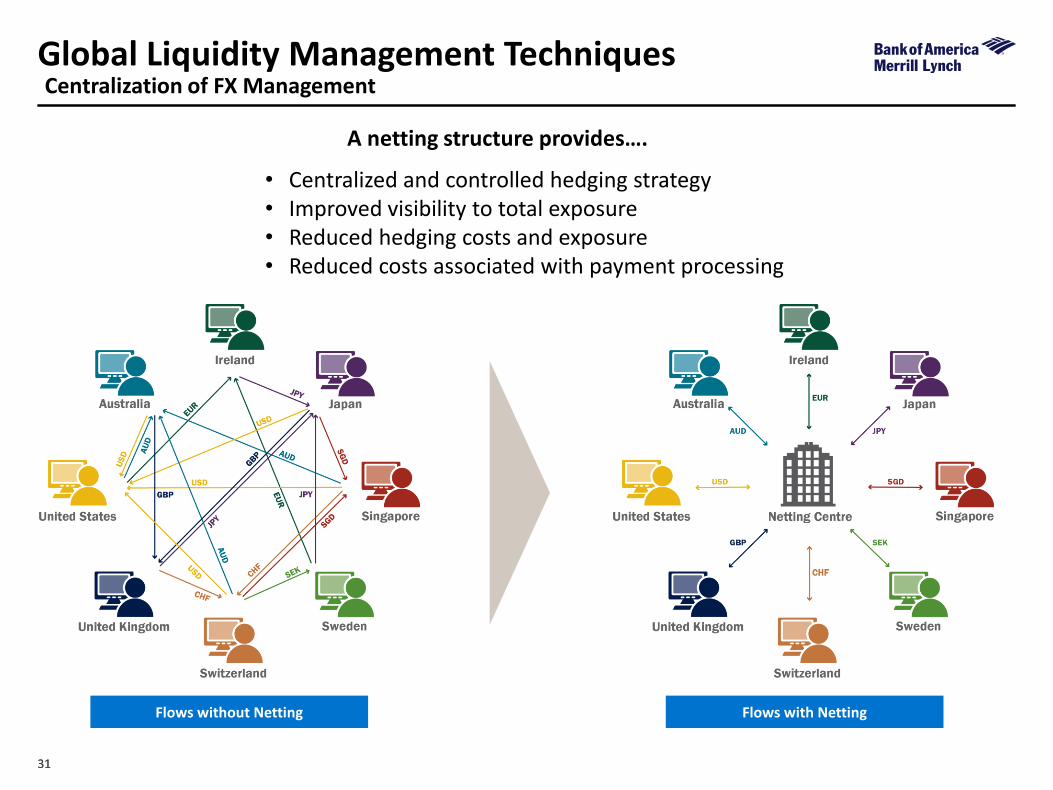
A netting structure provides….
• Centralized and controlled hedging strategy • Improved visibility to total exposure • Reduced hedging costs and exposure • Reduced costs associated with payment processing
Flows without Netting Flows with Netting
32 32
Global Liquidity Management Techniques Shared service centers and “On Behalf Of”
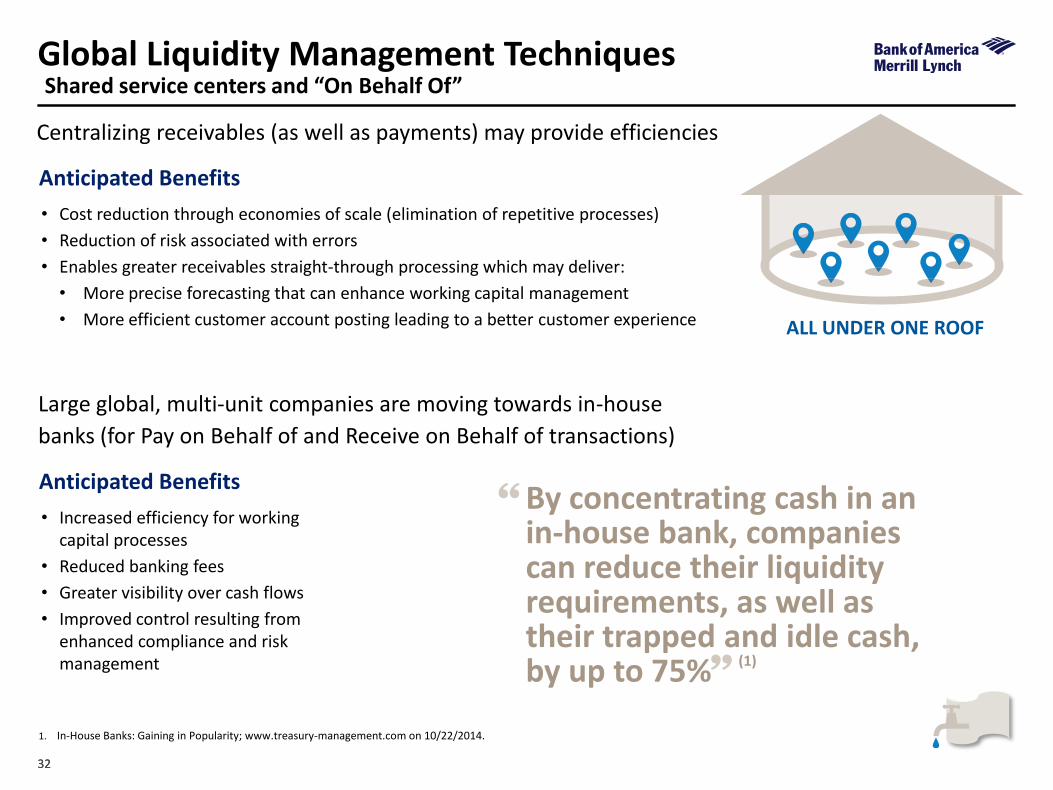
Centralizing receivables (as well as payments) may provide efficiencies
• Cost reduction through economies of scale (elimination of repetitive processes)
• Reduction of risk associated with errors
• Enables greater receivables straight-through processing which may deliver:
• More precise forecasting that can enhance working capital management
• More efficient customer account posting leading to a better customer experience
Anticipated Benefits
Large global, multi-unit companies are moving towards in-house
banks (for Pay on Behalf of and Receive on Behalf of transactions)
• Increased efficiency for working capital processes
• Reduced banking fees
• Greater visibility over cash flows
• Improved control resulting from enhanced compliance and risk management
Anticipated Benefits By concentrating cash in an in-house bank, companies can reduce their liquidity requirements, as well as their trapped and idle cash, by up to 75%
“
” 1. In-House Banks: Gaining in Popularity; www.treasury-management.com on 10/22/2014.
ALL UNDER ONE ROOF
(1)
33 33
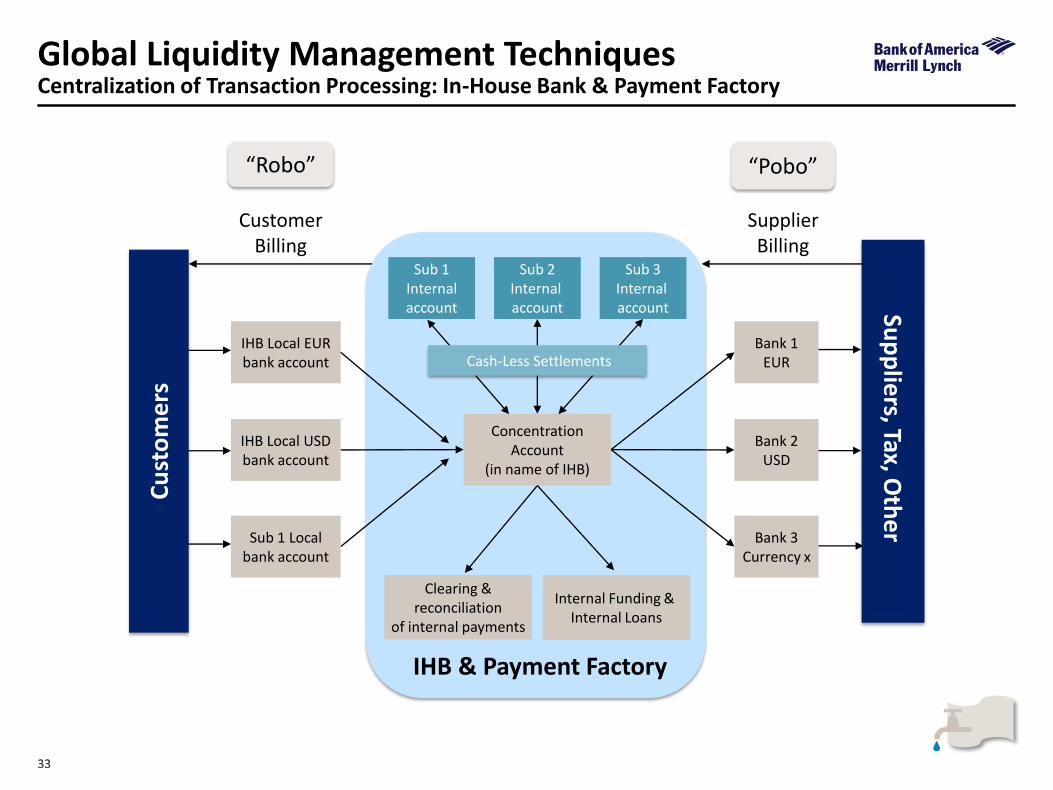
Global Liquidity Management Techniques Centralization of Transaction Processing: In-House Bank & Payment Factory
IHB Local EUR bank account
IHB Local USD bank account
Sub 1 Local bank account
Bank 1 EUR
Bank 2 USD
Bank 3 Currency x
Cu
sto
me
rs
Sup
plie
rs, Tax, Oth
er
IHB & Payment Factory
Sub 1 Internal account
Sub 2 Internal account
Sub 3 Internal account
Concentration
Account (in name of IHB)
Customer Billing
Supplier Billing
“Pobo” “Robo”
Clearing & reconciliation
of internal payments
Internal Funding &
Internal Loans
Cash-Less Settlements
Global Payment Trends
35 35
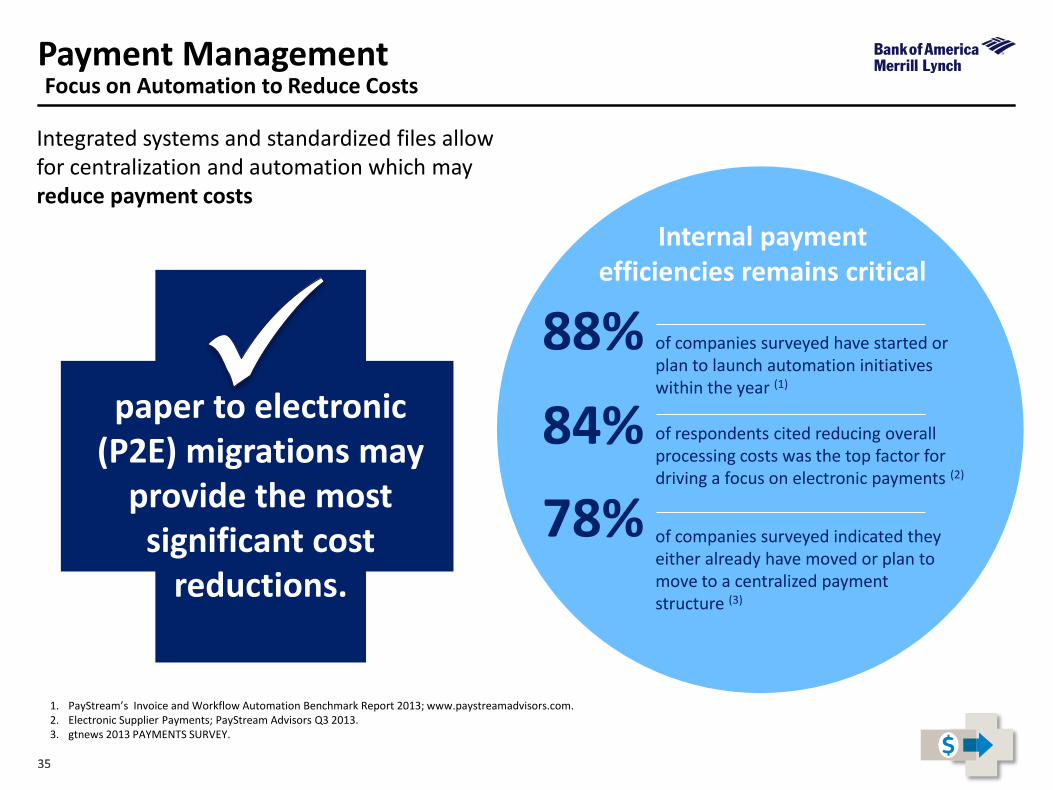
Payment Management
1. PayStream’s Invoice and Workflow Automation Benchmark Report 2013; www.paystreamadvisors.com. 2. Electronic Supplier Payments; PayStream Advisors Q3 2013. 3. gtnews 2013 PAYMENTS SURVEY.
Internal payment efficiencies remains critical
of companies surveyed indicated they either already have moved or plan to move to a centralized payment structure (3)
88%
of respondents cited reducing overall processing costs was the top factor for driving a focus on electronic payments (2)
84%
78%
of companies surveyed have started or plan to launch automation initiatives within the year (1)
Integrated systems and standardized files allow for centralization and automation which may reduce payment costs
paper to electronic
(P2E) migrations may provide the most
significant cost reductions.
Focus on Automation to Reduce Costs
36
Global Working Capital Improvement
• Convert paper payments to Electronic Payments • Benefits:
• Cost Savings • Reduced Fraud • Process Efficiencies • Improved Cash Conversion Cycle (“CCC”)
37
Working Capital Initiatives
• Optimize conversion by maximizing volumes to Card Payment • Value provided by additional “float” added • Vendor gets paid on due date; DYE preserves cash by
paying card statement at end of statement grace period (30 day cycle + 25-day grace period) vs paying by check (clears in 1-5 days)
• Those vendors that won’t take card: target for ACH payments
• Program goal = convert as many check payments as possible to electronic payment
• Estimate 40-50% of payments will convert to electronic payment
• Any vendors not taking electronic payment, outsource check processing to bank at reduced processing cost
38
There Is More!
BIGGER $AVINGS
• Card payments earn REBATES
• Greater volume increases rebate
• Rebate grid = X% to Y% of Card volume
• $20 Million in payments, e.g. $200K+ Rebate
• $30 Million in payments, e.g. $300K+ Rebate
• Goal is to convert vendor payments from check payment to Card (thru an ePayables solution)
39
Optimizing Payment Methods – the Outcome
• Global working capital improved
• Debt maintained or reduced
• Days payable outstanding (DPO) increased
• Cash Conversion Cycle improved (lowered)
• CFO………………………….. HAPPY
40 40
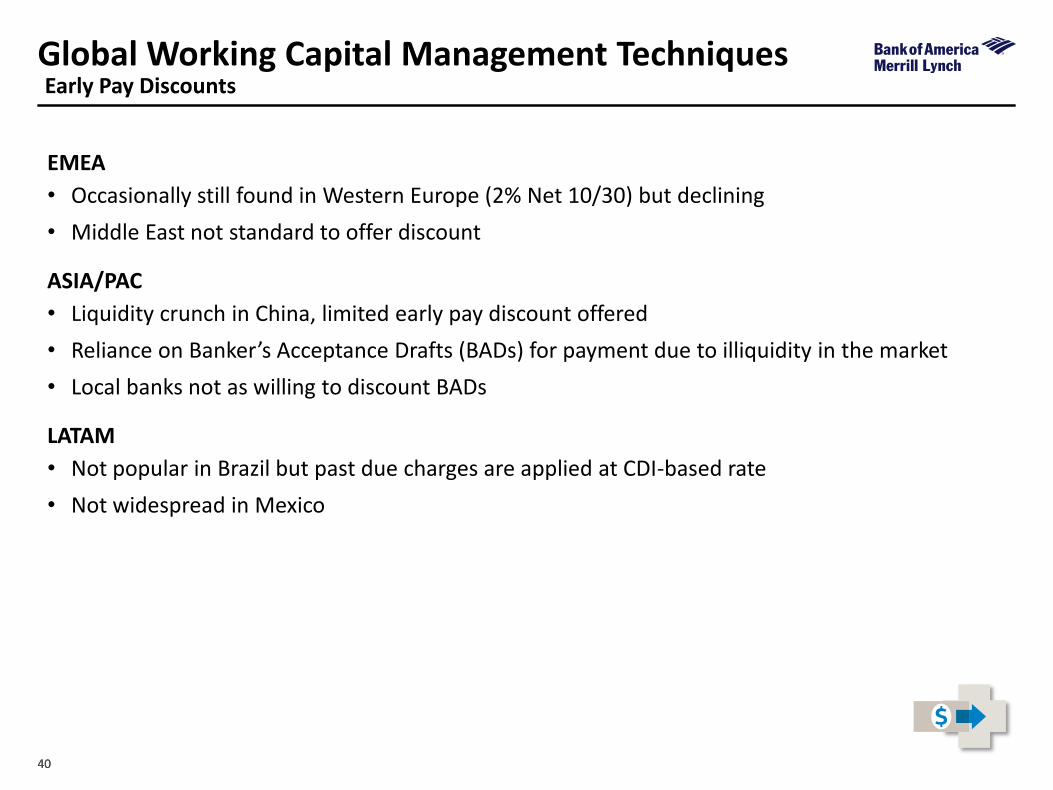
Global Working Capital Management Techniques Early Pay Discounts
EMEA
• Occasionally still found in Western Europe (2% Net 10/30) but declining
• Middle East not standard to offer discount
ASIA/PAC
• Liquidity crunch in China, limited early pay discount offered
• Reliance on Banker’s Acceptance Drafts (BADs) for payment due to illiquidity in the market
• Local banks not as willing to discount BADs
LATAM
• Not popular in Brazil but past due charges are applied at CDI-based rate
• Not widespread in Mexico
Global Trade Trends
42 42
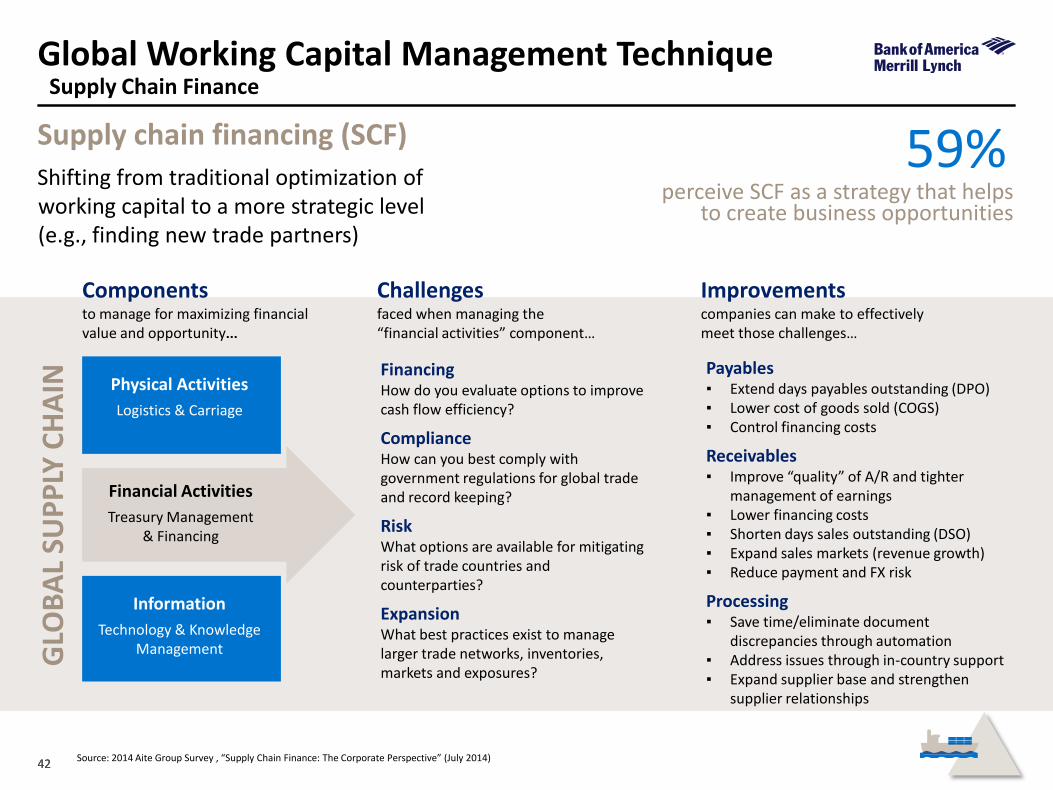
Global Working Capital Management Technique
Supply chain financing (SCF)
Shifting from traditional optimization of working capital to a more strategic level (e.g., finding new trade partners)
59% perceive SCF as a strategy that helps
to create business opportunities
Components to manage for maximizing financial value and opportunity…
GLO
BA
L SU
PP
LY C
HA
IN
Physical Activities
Logistics & Carriage
Challenges faced when managing the “financial activities” component…
Financing How do you evaluate options to improve cash flow efficiency?
Compliance How can you best comply with government regulations for global trade and record keeping?
Risk What options are available for mitigating risk of trade countries and counterparties?
Expansion What best practices exist to manage larger trade networks, inventories, markets and exposures?
Improvements companies can make to effectively meet those challenges…
Payables ▪ Extend days payables outstanding (DPO) ▪ Lower cost of goods sold (COGS) ▪ Control financing costs
Receivables ▪ Improve “quality” of A/R and tighter
management of earnings ▪ Lower financing costs ▪ Shorten days sales outstanding (DSO) ▪ Expand sales markets (revenue growth) ▪ Reduce payment and FX risk
Processing ▪ Save time/eliminate document
discrepancies through automation ▪ Address issues through in-country support ▪ Expand supplier base and strengthen
supplier relationships
Financial Activities
Treasury Management & Financing
Information
Technology & Knowledge Management
Source: 2014 Aite Group Survey , “Supply Chain Finance: The Corporate Perspective” (July 2014)
Supply Chain Finance
43 43
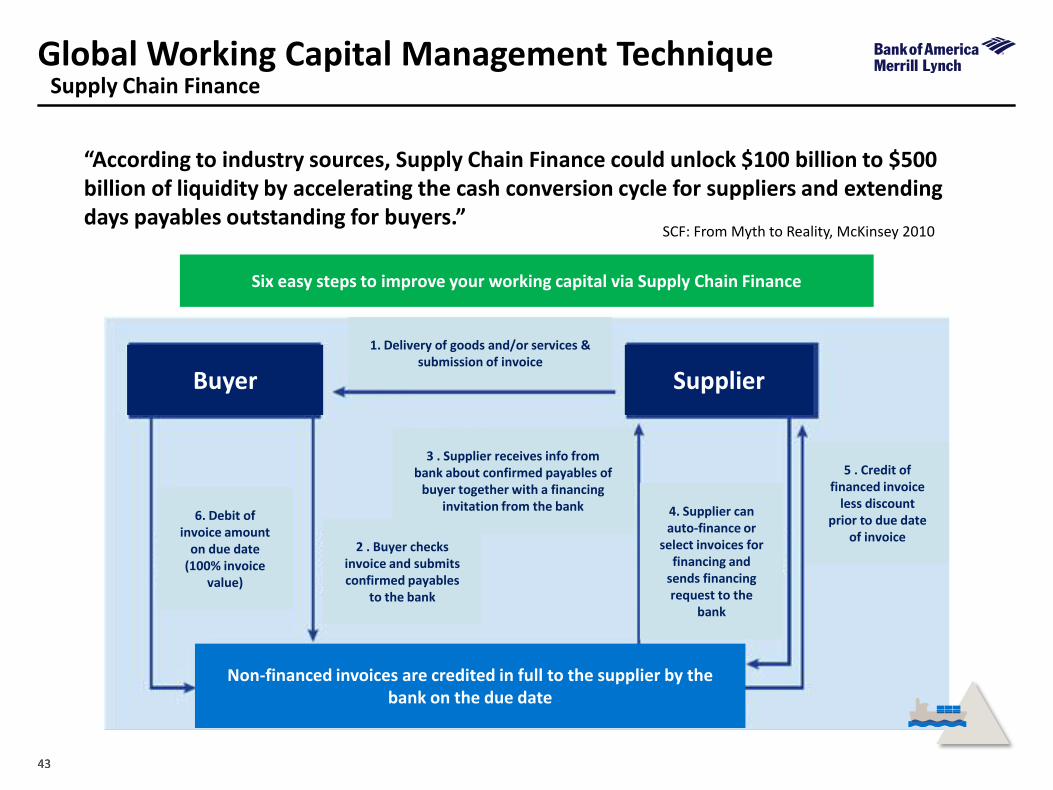
Global Working Capital Management Technique Supply Chain Finance
“According to industry sources, Supply Chain Finance could unlock $100 billion to $500 billion of liquidity by accelerating the cash conversion cycle for suppliers and extending days payables outstanding for buyers.”
SCF: From Myth to Reality, McKinsey 2010
Six easy steps to improve your working capital via Supply Chain Finance
Non-financed invoices are credited in full to the supplier by the bank on the due date
1. Delivery of goods and/or services & submission of invoice
2 . Buyer checks invoice and submits confirmed payables
to the bank
3 . Supplier receives info from bank about confirmed payables of
buyer together with a financing invitation from the bank 4. Supplier can
auto-finance or select invoices for
financing and sends financing request to the
bank
5 . Credit of financed invoice
less discount prior to due date
of invoice
6. Debit of invoice amount
on due date (100% invoice
value)
Buyer Supplier
44 44
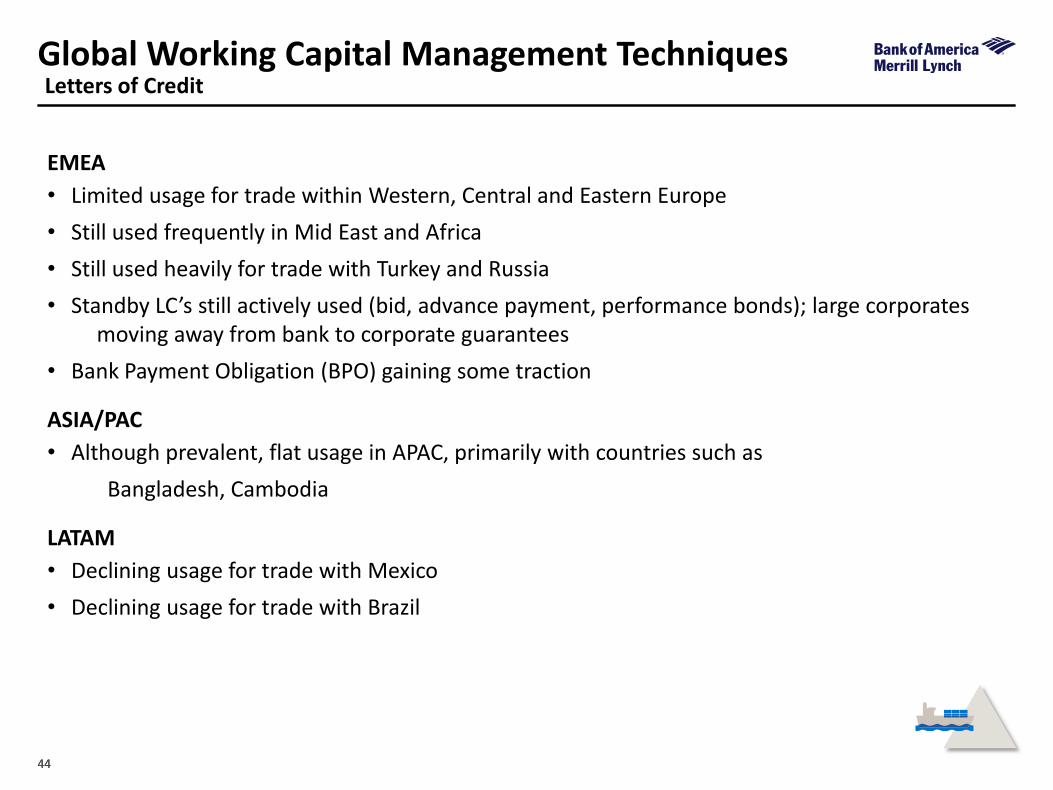
Global Working Capital Management Techniques Letters of Credit
EMEA
• Limited usage for trade within Western, Central and Eastern Europe
• Still used frequently in Mid East and Africa
• Still used heavily for trade with Turkey and Russia
• Standby LC’s still actively used (bid, advance payment, performance bonds); large corporates moving away from bank to corporate guarantees
• Bank Payment Obligation (BPO) gaining some traction
ASIA/PAC
• Although prevalent, flat usage in APAC, primarily with countries such as
Bangladesh, Cambodia
LATAM
• Declining usage for trade with Mexico
• Declining usage for trade with Brazil
Summary
46 46
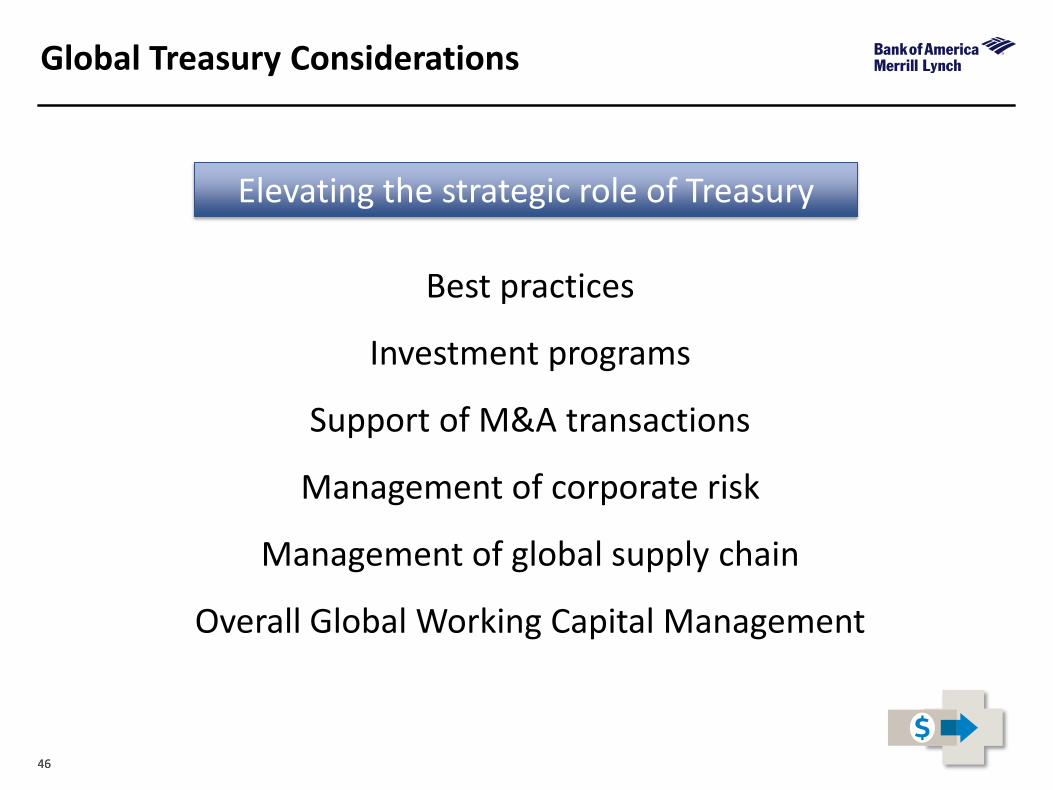
Global Treasury Considerations
Best practices
Investment programs
Support of M&A transactions
Management of corporate risk
Management of global supply chain
Overall Global Working Capital Management
Elevating the strategic role of Treasury
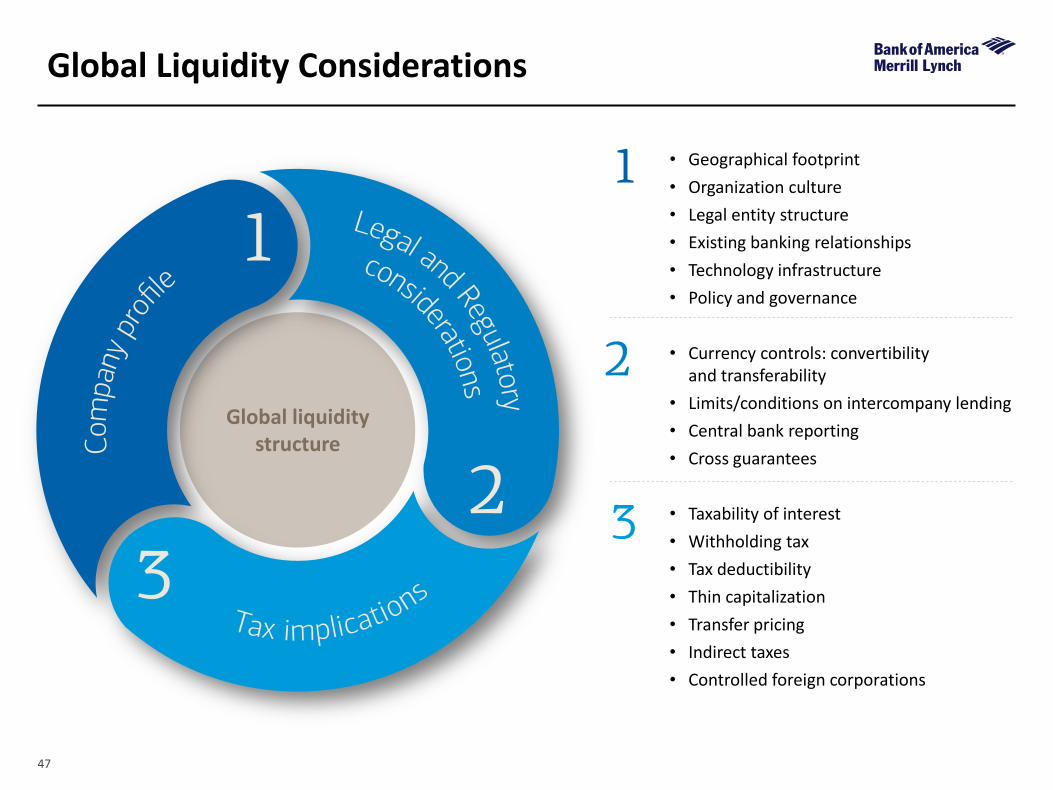
47
• Geographical footprint
• Organization culture
• Legal entity structure
• Existing banking relationships
• Technology infrastructure
• Policy and governance
• Currency controls: convertibility and transferability
• Limits/conditions on intercompany lending
• Central bank reporting
• Cross guarantees
• Taxability of interest
• Withholding tax
• Tax deductibility
• Thin capitalization
• Transfer pricing
• Indirect taxes
• Controlled foreign corporations
Global Liquidity Considerations
Global liquidity structure
48 48
Additional Sources
http://davidstockmanscontracorner.com/the-new-china-syndrome-receivablespayables-meltdown. ZeroHedge (online). The New China Syndrome: Receivables/Payables Chain Reaction Meltdown. Author: Tyler Durden. May 16, 2014. http://pwc.blogs.com/finance_and_treasury/2014/10/the-importance-of-working-capital-management.html. PWC Treasury Talk (online). The Importance of Working Capital Management. Authors: Robert Smid & Anton Koupenov. October 20, 2014. http://www.ey.com/Publication/vwLUAssets/EY-working-capital-management-2014-all_tied_up/$FILE/EY-working-capital-management-2014-all-tied-up. EY Working Capital Management Report 2014 (online) All Tied Up. http://www.thehackettgroup.com/solutions/working-capital-management/. Hackett Group (online); 2014 Europe Working Capital Survey. The Hackett Group 2015. http://www.pwc.com/gx/en/audit-services/corporate-treasury-solutions/cts-publications/global-treasury-survey-2014.jhtml. PwC Corporate Treasury (online); Treasury shown in a new light. PwC Global Treasury Survey 2014. http://www.pwc.com/gx/en/working-capital-management-services/publications/. PwC Annual Global Working Capital Survey 2014 (online) Cash for Growth. Authors: Danielle Windaus, Dr Andrew Sentence, Niall Cooter and Christian Terry. July 2014.
49
Notice to Recipient
John Engeman is not affiliated with Bank of America Corporation and are solely responsible for the information they present at this event.
“Bank of America Merrill Lynch” is the marketing name for the global banking and global markets businesses of Bank of America Corporation. Lending, derivatives, and other commercial banking activities are performed globally by banking affiliates of Bank of America Corporation, including Bank of America, N.A., member FDIC. Securities, capital markets, strategic advisory, and other investment banking activities are performed globally by investment banking affiliates of Bank of America Corporation (“Investment Banking Affiliates”), including, in the United States, Merrill Lynch, Pierce, Fenner & Smith Incorporated and Merrill Lynch Professional Clearing Corp., both of which are registered broker-dealers and members of SIPC, and, in other jurisdictions, locally registered entities. Merrill Lynch, Pierce, Fenner & Smith Incorporated and Merrill Lynch Professional Clearing Corp. are registered as futures commission merchants with the CFTC and are members of the NFA.
This document is intended for information purposes only and does not constitute a binding commitment to enter into any type of transaction or business relationship as a consequence of any information contained herein.
These materials have been prepared by one or more subsidiaries of Bank of America Corporation solely for the client or potential client to whom such materials are directly addressed and delivered (the “Company”) in connection with an actual or potential business relationship and may not be used or relied upon for any purpose other than as specifically contemplated by a written agreement with us. We assume no obligation to update or otherwise revise these materials, which speak as of the date of this presentation (or another date, if so noted) and are subject to change without notice. Under no circumstances may a copy of this presentation be shown, copied, transmitted or otherwise given to any person other than your authorized representatives. Products and services that may be referenced in the accompanying materials may be provided through one or more affiliates of Bank of America, N.A.
We are required to obtain, verify and record certain information that identifies our clients, which information includes the name and address of the client and other information that will allow us to identify the client in accordance with the USA Patriot Act (Title III of Pub. L. 107-56, as amended (signed into law October 26, 2001)) and such other laws, rules and regulations.
We do not provide legal, compliance, tax or accounting advice. Accordingly, any statements contained herein as to tax matters were neither written nor intended by us to be used and cannot be used by any taxpayer for the purpose of avoiding tax penalties that may be imposed on such taxpayer.
For more information, including terms and conditions that apply to the service(s), please contact your Bank of America Merrill Lynch representative.
Investment Banking Affiliates are not banks. The securities and financial instruments sold, offered or recommended by Investment Banking Affiliates, including without limitation money market mutual funds, are not bank deposits, are not guaranteed by, and are not otherwise obligations of, any bank, thrift or other subsidiary of Bank of America Corporation (unless explicitly stated otherwise), and are not insured by the Federal Deposit Insurance Corporation (“FDIC”) or any other governmental agency (unless explicitly stated otherwise).
This document is intended for information purposes only and does not constitute investment advice or a recommendation or an offer or solicitation, and is not the basis for any contract to purchase or sell any security or other instrument, or for Investment Banking Affiliates or banking affiliates to enter into or arrange any type of transaction as a consequent of any information contained herein.
With respect to investments in money market mutual funds, you should carefully consider a fund’s investment objectives, risks, charges, and expenses before investing. Although money market mutual funds seek to preserve the value of your investment at $1.00 per share, it is possible to lose money by investing in money market mutual funds. The value of investments and the income derived from them may go down as well as up and you may not get back your original investment. The level of yield may be subject to fluctuation and is not guaranteed. Changes in rates of exchange between currencies may cause the value of investments to decrease or increase.
We have adopted policies and guidelines designed to preserve the independence of our research analysts. These policies prohibit employees from offering research coverage, a favorable research rating or a specific price target or offering to change a research rating or price target as consideration for or an inducement to obtain business or other compensation.
Copyright 2015 Bank of America Corporation. Bank of America N.A., Member FDIC, Equal Housing Lender.