managing style portfolios vs. low volatility benchmarks · managing style portfolios vs. low...
TRANSCRIPT

Understand. Act.
Dr. Michael Heldmann, CFA
Vice President
Senior Portfolio Manager
Systematic Equity
Managing Style
Portfolios vs. Low
Volatility Benchmarks
May 2013
© Allianz Global Investors -
Capitalisation Weighted Indices Are Not Efficient Well Known Anomalies and New Challenges
2
Cap-weighted Index
Return
Risk
Risk free rate
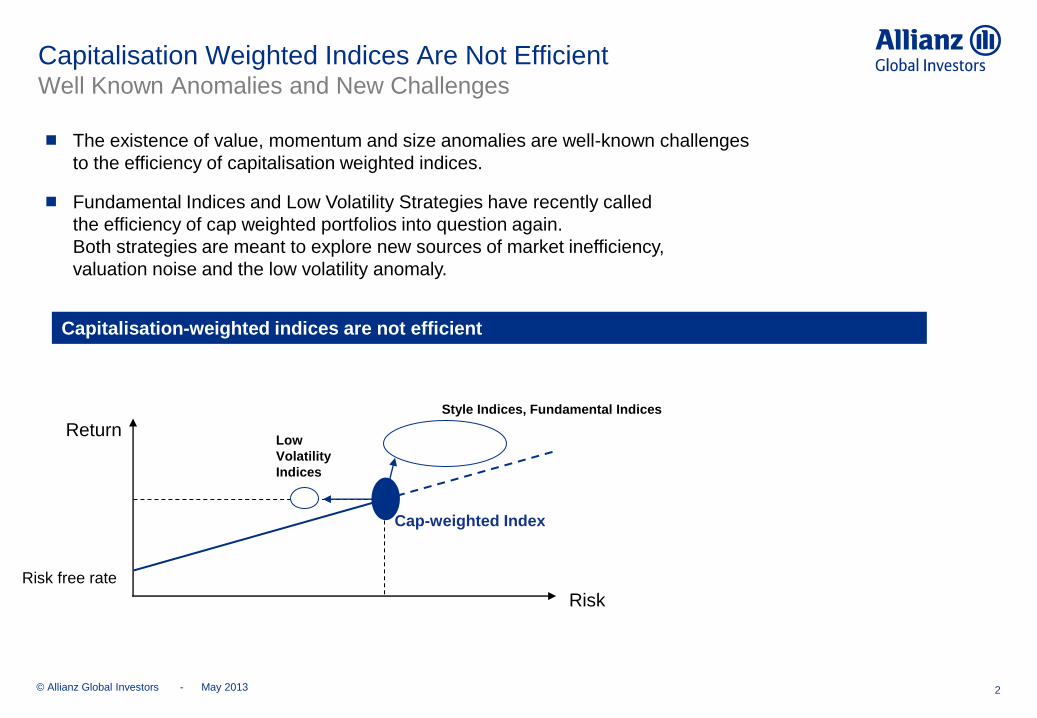
Capitalisation-weighted indices are not efficient
The existence of value, momentum and size anomalies are well-known challenges
to the efficiency of capitalisation weighted indices.
Fundamental Indices and Low Volatility Strategies have recently called
the efficiency of cap weighted portfolios into question again.
Both strategies are meant to explore new sources of market inefficiency,
valuation noise and the low volatility anomaly.
Style Indices, Fundamental Indices
Low
Volatility
Indices
May 2013
© Allianz Global Investors - 3
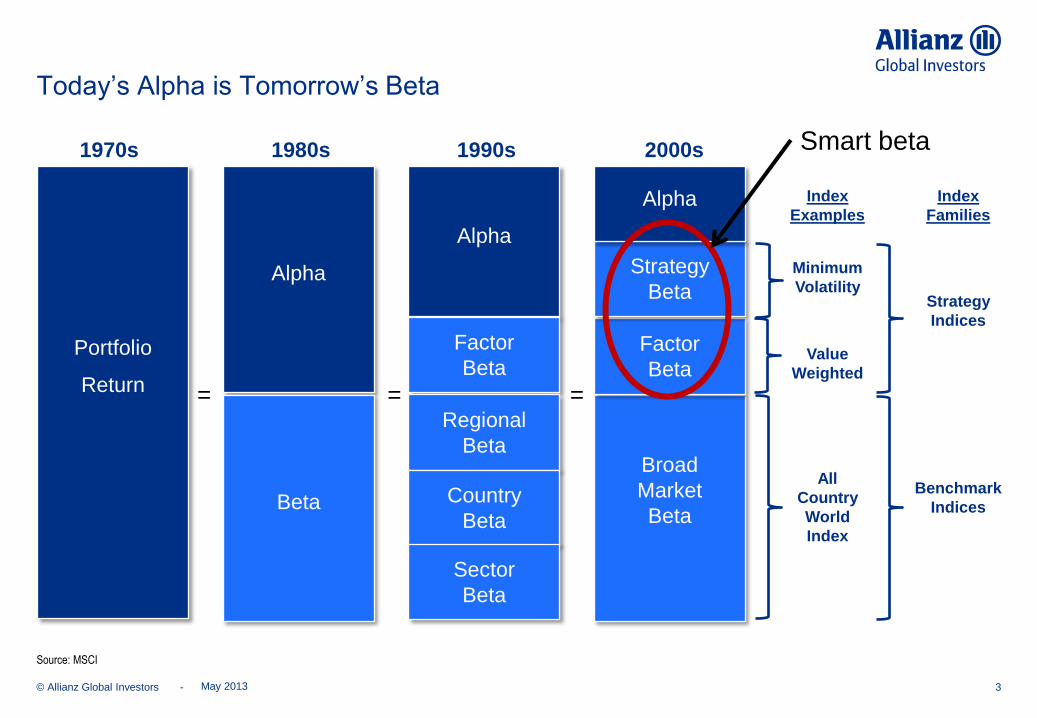
Today’s Alpha is Tomorrow’s Beta
Portfolio
Return
May 2013
Alpha
Beta
Alpha
Factor
Beta
Regional
Beta
Country
Beta
Sector
Beta
Broad
Market
Beta
Factor
Beta
Strategy
Beta
Alpha
= = =
Source: MSCI
Index
Examples
Minimum
Volatility
Value
Weighted
All
Country
World
Index
Index
Families
Strategy
Indices
Benchmark
Indices
1970s 1980s 1990s 2000s Smart beta
© Allianz Global Investors -
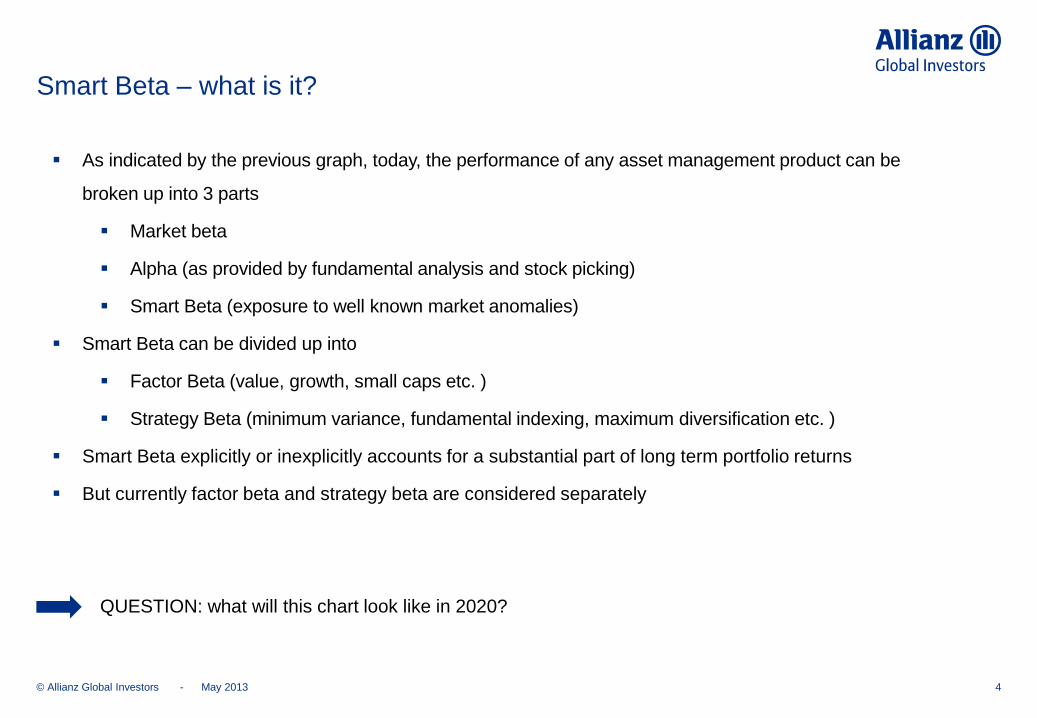
Smart Beta – what is it?
4
As indicated by the previous graph, today, the performance of any asset management product can be
broken up into 3 parts
Market beta
Alpha (as provided by fundamental analysis and stock picking)
Smart Beta (exposure to well known market anomalies)
Smart Beta can be divided up into
Factor Beta (value, growth, small caps etc. )
Strategy Beta (minimum variance, fundamental indexing, maximum diversification etc. )
Smart Beta explicitly or inexplicitly accounts for a substantial part of long term portfolio returns
But currently factor beta and strategy beta are considered separately
QUESTION: what will this chart look like in 2020?
May 2013

© Allianz Global Investors - 5
Strategy beta – risk based benchmarks
May 2013

© Allianz Global Investors -
Two bear markets in a single decade have forced investors to look for less volatile equity products.
Attractive risk/return profile beyond just being defensive.
Higher return - over the long run - at (always) lower risk than the market-cap weighted benchmark.
Equity Strategies with Lower Risk - as recommended by consultants as a core equity investment -
might free up risk budget that could be allocated to higher returning strategies
in an asset allocation framework
in a liability-driven investment strategy
in multi-strategy equity funds
Investors moving away from relative-risk objectives and market-cap weighted indices
towards absolute risk objectives and alternative indices.
Strong Market Drawdowns in Recent Years have Triggered Demand
for Equity Strategies with Lower Risk
6 May 2013
Managed volatility strategies address the demands of risk conscious equity investors

© Allianz Global Investors -
Managed Volatility in the Focus of Investors, Academics & Consultants
7
Heightened interest in this strategy from various parties recently
Prospects & clients
Pension plans
Brokers, asset managers & academics
Many papers and thought pieces have been written on the theme by Nomura, UBS, Deutsche Bank,
Macquarie, GMO, Bernstein and many more
Benchmark vendors like MSCI Barra
They offer strategy indices e.g. MSCI World Risk Weighted Index or MSCI Global Minimum Volatility
Consultants
Mercer increasingly recommends low vol strategies to their clients as core investments in order to free up
risk budget for satellite strategies.
May 2013
Investments in managed volatility products have risen significantly – for good reasons

© Allianz Global Investors -
BlackRock (BLK)'s smart-beta assets
hit $8 billion at the end of 2011,
up from just $100 million three years prior.
Consultants and managers
agree that low volatility is heating up,
with demand for active
management versions boosted
by wild markets
(P&I, Aug. 22
Strong and Rising Demand for Lower Risk Equity Strategies Recent News flow
http://www.pionline.com/article/20120319/PRINTSUB/303199989
8

© Allianz Global Investors -
« CAPM suggest that higher risk is rewarded with higher returns.
Empirically, this does not hold.
Low risk stocks have long outperformed high risk stocks »
Low Risk Anomaly
Behavioral finance
Lottery preference: Investors have a preference for low probability, high payout scenarios, therefore they overpay
for high beta
Index-based investing
In the absence of leverage, a portfolio manager who is evaluated vs. a benchmark is incentivized to underweight
low beta names and overweight high beta names.
Variability of beta
In times of large market moves, beta seems to move to 1, allowing for surprisingly good upside participation and
less downside protection than expected
Low beta shows similarity with call overwriting and therefore earns a call premium
participation in up-markets may be limited
in exchange for some (but less than expected) protection in down-markets
The Low Risk Anomaly is here to stay
Possible Explanations
May 2013

© Allianz Global Investors -
Intense Academic Research on Low Volatility Approaches …
Modern Portfolio Theory
H. Markowitz‘s article Portolio Selection is published.
The concept of minimum variance portfolio is introduced.
The article lays the foudation of Modern Portfolio Theory (MPT).
E. Fama
Efficient Market Hypothesis (Eugene Fama): An investment strategy that is based on publicly available information cannot outperform the market on a risk-adjusted basis. From the hypothesis it follows that the risk-adjusted performance of the minimum variance portfolio is not superior.
Haugen
Minimum Variance Anomaly - Outperformance in Germany, UK, Japan and Canada Kleeberg shows that minimum variance portfolios in many more countries were able to outperform, at lower levels of risk.
H. Markowitz
Minimum Variance Anomaly – Outperformance of the minimum variance portfolio in the USA Haugen/Baker show, that a minimum variance portfolio was able to beat the US market from1973-1989 at lower levels of risk. This contradicts the Efficient Market Hypothesis. Clarke et al. Confirm the result for the time frame 1968-2005.
Kleeberg
Market Anomalies - several researchers find counter examples to the Efficient Market Hypothesis such as the Value-Effect or the Size-Effect.
Kahneman
Behavioral Finance: Kahnemann/Tversky, DeBondt/Thaler
Psychological biases explain market anomalies.
1952
1970
1970
- 1985
1975
-1990
1991
1995
May 2013 10
© Allianz Global Investors -
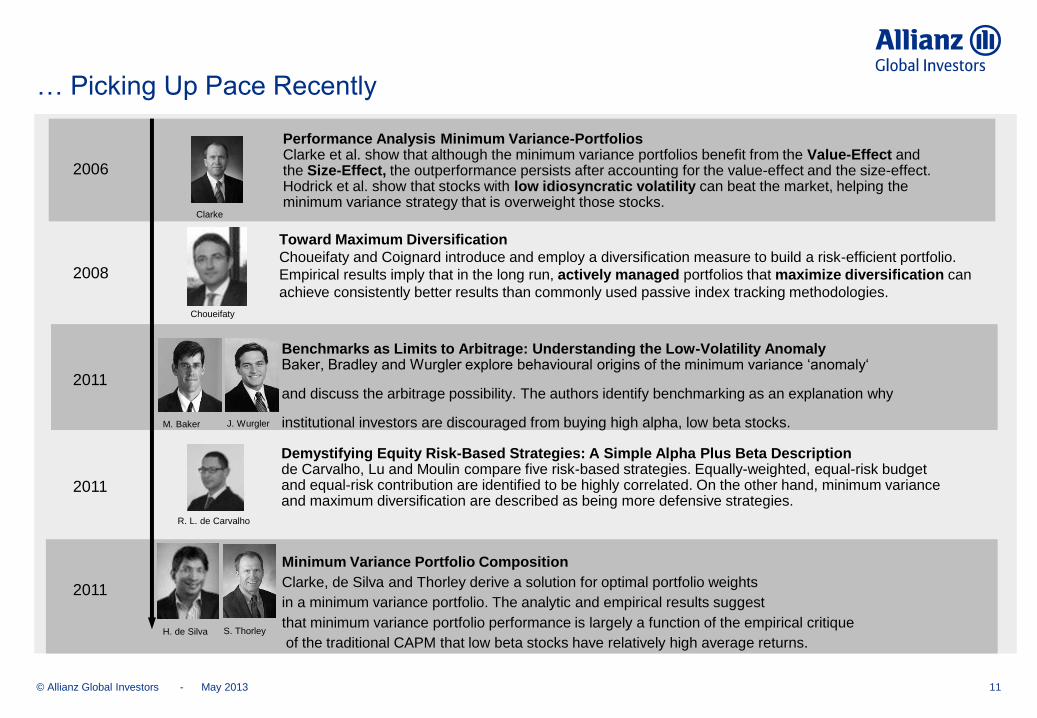
… Picking Up Pace Recently
Minimum Variance Portfolio Composition
Clarke, de Silva and Thorley derive a solution for optimal portfolio weights
in a minimum variance portfolio. The analytic and empirical results suggest
that minimum variance portfolio performance is largely a function of the empirical critique
of the traditional CAPM that low beta stocks have relatively high average returns.
Demystifying Equity Risk-Based Strategies: A Simple Alpha Plus Beta Description de Carvalho, Lu and Moulin compare five risk-based strategies. Equally-weighted, equal-risk budget and equal-risk contribution are identified to be highly correlated. On the other hand, minimum variance and maximum diversification are described as being more defensive strategies.
Toward Maximum Diversification
Choueifaty and Coignard introduce and employ a diversification measure to build a risk-efficient portfolio.
Empirical results imply that in the long run, actively managed portfolios that maximize diversification can
achieve consistently better results than commonly used passive index tracking methodologies.
Choueifaty
Performance Analysis Minimum Variance-Portfolios Clarke et al. show that although the minimum variance portfolios benefit from the Value-Effect and the Size-Effect, the outperformance persists after accounting for the value-effect and the size-effect. Hodrick et al. show that stocks with low idiosyncratic volatility can beat the market, helping the minimum variance strategy that is overweight those stocks.
Clarke
Benchmarks as Limits to Arbitrage: Understanding the Low-Volatility Anomaly Baker, Bradley and Wurgler explore behavioural origins of the minimum variance ‘anomaly‘
and discuss the arbitrage possibility. The authors identify benchmarking as an explanation why
institutional investors are discouraged from buying high alpha, low beta stocks. M. Baker J. Wurgler
R. L. de Carvalho
H. de Silva S. Thorley
2006
2008
2011
2011
2011
May 2013 11
© Allianz Global Investors -
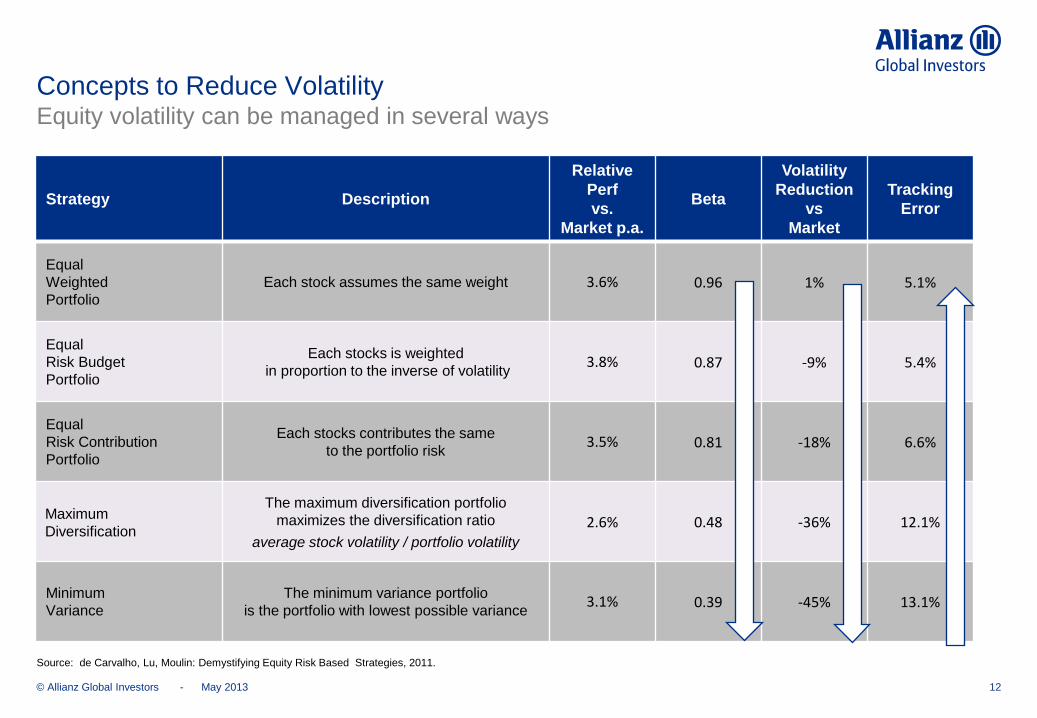
Concepts to Reduce Volatility Equity volatility can be managed in several ways
12
Strategy Description
Relative
Perf
vs.
Market p.a.
Beta
Volatility
Reduction
vs
Market
Tracking
Error
Equal
Weighted
Portfolio
Each stock assumes the same weight 3.6% 0.96 1% 5.1%
Equal
Risk Budget
Portfolio
Each stocks is weighted
in proportion to the inverse of volatility 3.8% 0.87 -9% 5.4%
Equal
Risk Contribution
Portfolio
Each stocks contributes the same
to the portfolio risk 3.5% 0.81 -18% 6.6%
Maximum
Diversification
The maximum diversification portfolio
maximizes the diversification ratio
average stock volatility / portfolio volatility 2.6% 0.48 -36% 12.1%
Minimum
Variance
The minimum variance portfolio
is the portfolio with lowest possible variance 3.1% 0.39 -45% 13.1%
Source: de Carvalho, Lu, Moulin: Demystifying Equity Risk Based Strategies, 2011.
May 2013
© Allianz Global Investors -
A Word of Caution on Unconstrained Minimum Variance Strategies Unconstrained concepts face risks of concentration and estimation error
Minimum Variance is the most attractive of the low risk strategies as the strategy offers the highest volatility
reduction with similar performance than the other strategies.
However, unconstrained Minimum Variance portfolios are low breadth portfolios with a high tracking error
around 15% versus a cap weighted benchmark. Stocks are selected only based on the estimated covariance
matrix in a quadratic optimization that is known to be biased towards stocks with high estimation errors in the
covariance matrix.
Investment decisions are hard to communicate to clients given that investment decisions are just based on
the covariance matrix. This might be unsatisfying for clients if a position turns sour.
The MSCI Minimum Volatility index is an example of a constrained Minimum Variance strategy.
The MSCI Minimum Volatility index offers a lower tracking error of 6% vs. the MSCI Index
and a broader diversification with ~250 stocks.
Managing low volatility products vs. a widely accepted low volatility benchmark
might replace the currently prevailing benchmark-free minimum variance portfolios.
13
Managing risks by constraining minimum variance strategies
May 2013
© Allianz Global Investors -
-50%
-40%
-30%
-20%
-10%
0%
10%
20%
30%
40%
50%
40
60
80
100
120
140
160
Dec 98 Dec 99 Dec 00 Dec 01 Dec 02 Dec 03 Dec 04 Dec 05 Dec 06 Dec 07 Dec 08 Dec 09 Dec 10 Dec 11 Dec 12
MSCI World MSCI World Minimum Volatility rel to MSCI World (rhs)
14
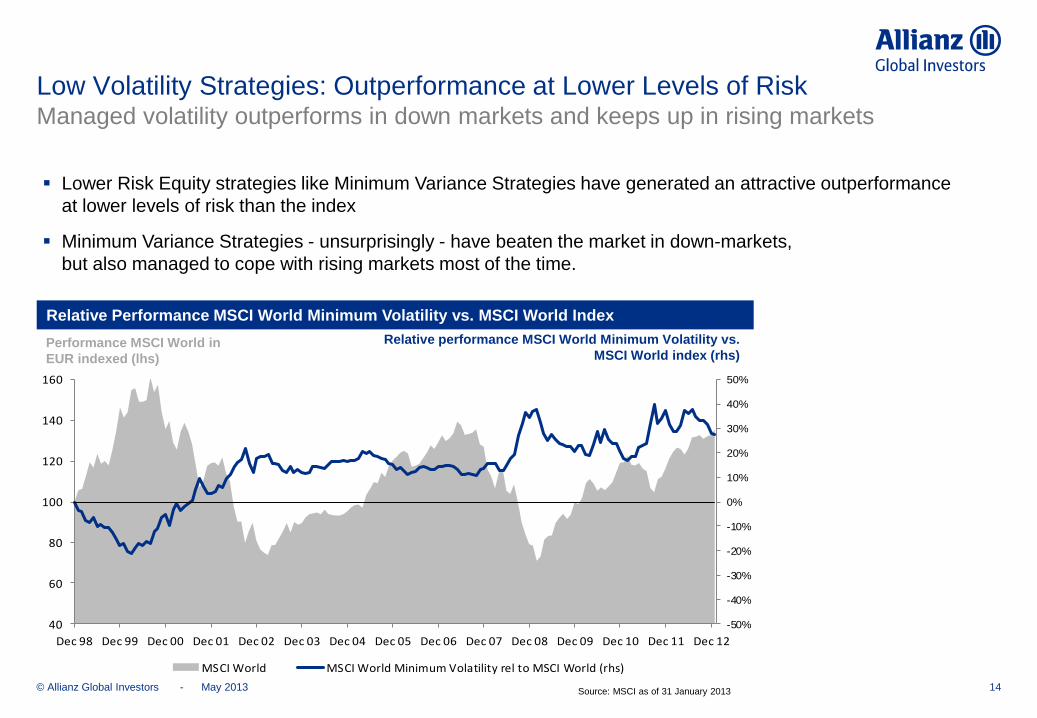
Low Volatility Strategies: Outperformance at Lower Levels of Risk Managed volatility outperforms in down markets and keeps up in rising markets
Lower Risk Equity strategies like Minimum Variance Strategies have generated an attractive outperformance
at lower levels of risk than the index
Minimum Variance Strategies - unsurprisingly - have beaten the market in down-markets,
but also managed to cope with rising markets most of the time.
Relative Performance MSCI World Minimum Volatility vs. MSCI World Index
Relative performance MSCI World Minimum Volatility vs.
MSCI World index (rhs) Performance MSCI World in
EUR indexed (lhs)
Source: MSCI as of 31 January 2013 May 2013

© Allianz Global Investors -
-60%
-40%
-20%
0%
20%
40%
60%
-60% -40% -20% 0% 20% 40% 60%
Low Volatility Strategies Benefit from Variable Beta
15
MSCI World Minimum Volatility vs. MSCI World Index
Strategy holds up
remarkably well in
rising equity market
Winning by not losing
(too much)
Source: AllianzGI, MSCI, 1999-2013
In strong up and strong down markets beta tends to move to 1.
MSCI World
MS
CI W
orld
Min
imu
m V
ola
tilit
y
May 2013
© Allianz Global Investors - 16
• Anecdotal evidence for the MSCI Minimum Volatility Strategy
• Sector Allocation The Minimum Variance Strategy got the two major sector calls of the last 2 decades right -
underweighting IT around 2000 and selling Financials in 2006.
• Regional Allocation The Minimum Variance Strategy got the one major regional call within developed markets right -
underweighting Japan in the early 90s.
• Investment Styles Exposure Performance contributions from investment styles value, momentum and small caps minor on average,
but highly varying exposures that should be managed.
What Drives The Performance
Of the MSCI Minimum Volatily Strategy?
May 2013

© Allianz Global Investors - 17
Strategy beta – risk based benchmarks
May 2013
© Allianz Global Investors -
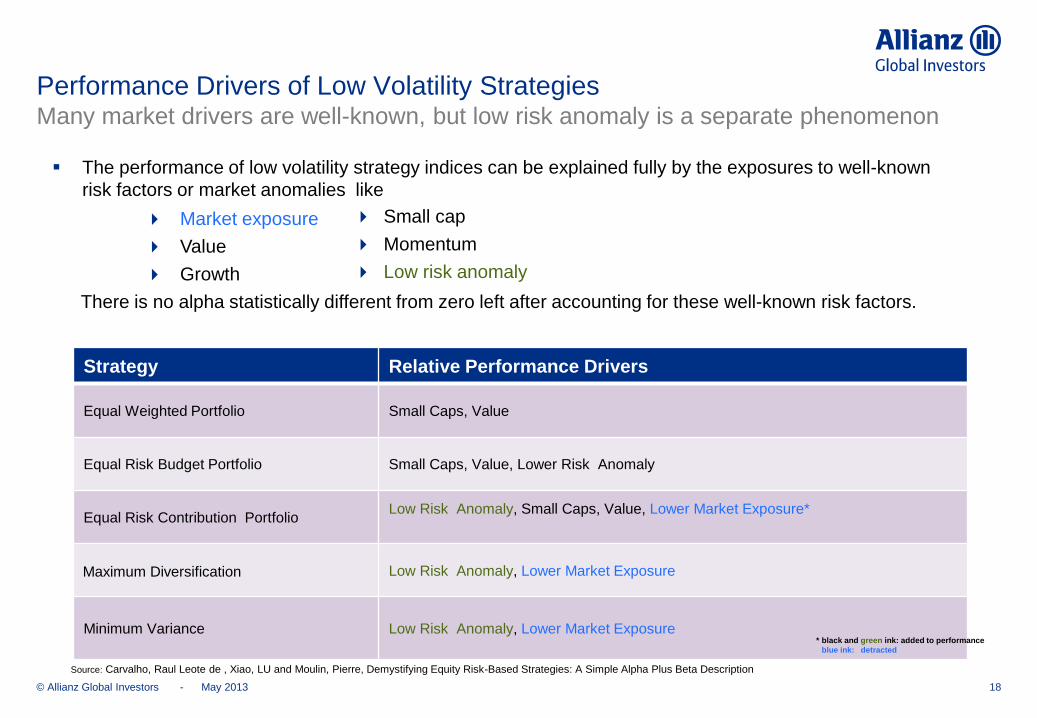
The performance of low volatility strategy indices can be explained fully by the exposures to well-known
risk factors or market anomalies like
Market exposure
Value
Growth
There is no alpha statistically different from zero left after accounting for these well-known risk factors.
18
Performance Drivers of Low Volatility Strategies Many market drivers are well-known, but low risk anomaly is a separate phenomenon
Small cap
Momentum
Low risk anomaly
Strategy Relative Performance Drivers
Equal Weighted Portfolio Small Caps, Value
Equal Risk Budget Portfolio Small Caps, Value, Lower Risk Anomaly
Equal Risk Contribution Portfolio Low Risk Anomaly, Small Caps, Value, Lower Market Exposure*
Maximum Diversification Low Risk Anomaly, Lower Market Exposure
Minimum Variance
Low Risk Anomaly, Lower Market Exposure
* black and green ink: added to performance
blue ink: detracted
Source: Carvalho, Raul Leote de , Xiao, LU and Moulin, Pierre, Demystifying Equity Risk-Based Strategies: A Simple Alpha Plus Beta Description
May 2013

© Allianz Global Investors -
Style investing against risk based benchmarks
19
Minimum variance type benchmarks seem to be the most probable candidates for an industry standard, due to
their firm base in academic literature, widespread use of minimum variance optimization using risk models and
optimizers
Minimum Variance benchmarks are offered by large index providers like MSCI
Minimum Variance seems to realize its superior (compared to market cap) characteristics without significant
(constant) exposures to classical risk factors like value and momentum
We expect a significant portion of assets to be benchmarked against Minimum Variance benchmarks
In a risk return framework risk based strategies and the more classical style factors offer similar levels of
improvement over the market capitalization based indices.
Can we form portfolios which preserve the attractive features of risk based benchmarks but at the same time
outperform these?
May 2013

© Allianz Global Investors - 20
Case study – Diversified Style portfolio against MSCI
Emerging Markets Minimum Volatility
May 2013
© Allianz Global Investors -
Diversified Style portfolio against MSCI EM MIN VOL Setup
21
For the case study presented here 10 years of constituents data for the MSCI Minimum
Volatility Benchmarks for both Europe and Emerging Markets are used. The data has been
kindly provided by MSCI
Due to high interest in the region of emerging markets, the attractive features of Minimum
Volatility and the widespread use of the index provider, we concentrate on MSCI Emerging
Markets Minimum Volatility (MSCI EM MIN VOL) as a benchmark
An extensive list of classical factors from our comprehensive global factor database was tested
against the Minimum Volatility benchmarks
We wanted to see if the attractive features of a MinVol benchmark can be preserved and an
outperformance against the risk based benchmark can be achieved at the same time
First step: check if the characteristics mentioned before hold for emerging markets
May 2013
© Allianz Global Investors - 22
-15%
-10%
-5%
0%
5%
10%
15%
20%
Growth Momentum Quality Revisions Risk Size Value
Tertile 1 Tertile 2 Tertile 3 missing
Expensive
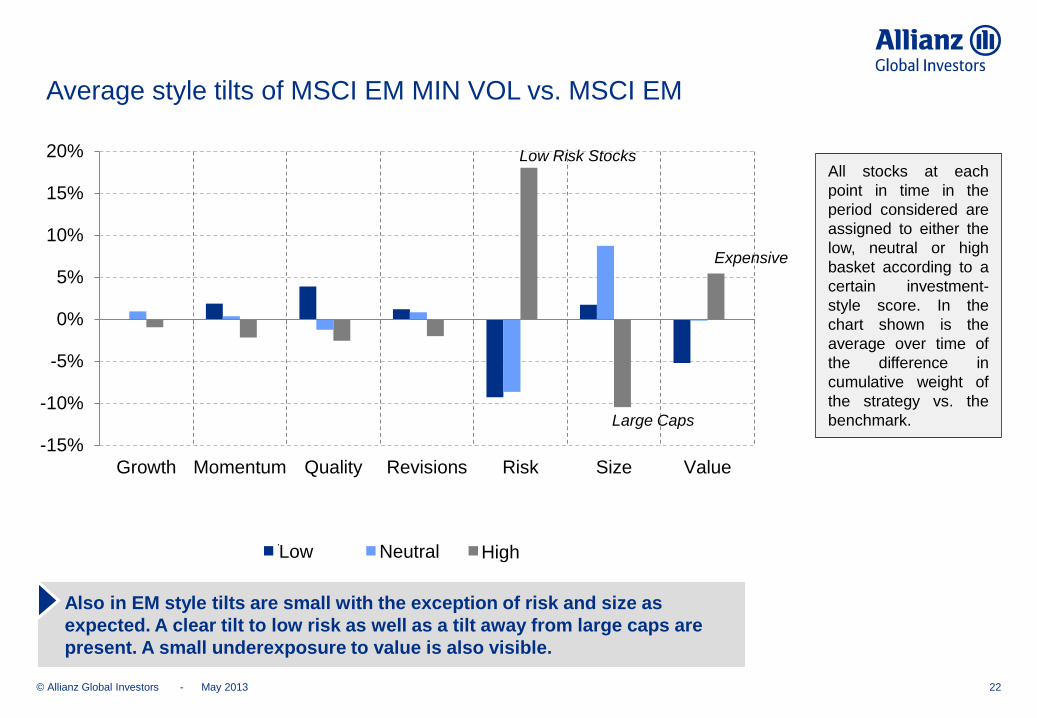
Average style tilts of MSCI EM MIN VOL vs. MSCI EM
Also in EM style tilts are small with the exception of risk and size as
expected. A clear tilt to low risk as well as a tilt away from large caps are
present. A small underexposure to value is also visible.
May 2013
High Neutral Low
All stocks at each
point in time in the
period considered are
assigned to either the
low, neutral or high
basket according to a
certain investment-
style score. In the
chart shown is the
average over time of
the difference in
cumulative weight of
the strategy vs. the
benchmark. Large Caps
Low Risk Stocks

© Allianz Global Investors -
Performance of Investment Styles vs. MSCI EM
23
0.9
1.1
1.3
1.5
1.7
1.9
2.1
2.3
2002 2003 2004 2005 2006 2007 2008 2009 2010 2011
Value Momentum Revisions
Growth Size Quality
May 2013
All stocks in the
benchmark are
assigned scores which
represent
attractiveness
according a certain
investment style like
value. We define the
20% most attractive
stocks to form the
Investment style
portfolio. We regularly
examine various ways
to construct portfolios
which represent
investment styles but
for the sake of
simplicity and since
the general statement
is not changed by
choosing a different
method to construct
the style portfolios we
follow this simple
method here.

© Allianz Global Investors -
Performance of Min Vol Investment Styles* vs. MSCI EM MIN VOL
24
0.7
0.8
0.9
1
1.1
1.2
1.3
1.4
1.5
2002 2003 2004 2005 2006 2007 2008 2009 2010 2011
Value Momentum Revisions Growth Size Quality Low Vol
Strategy BenchmarkReturn p.a.
(after costs)
Benchmark
Return
Relative
Return(after costs)
Information
Ratio(after costs)
Tracking
Error Beta Volatility
Benchmark
Volatility
Return over
Volatility
Momentum MSCI EM MIN VOL 21.5% 18.6% 2.9% 0.74 4.0% 1.06 17.8% 16.4% 1.21
Revisions MSCI EM MIN VOL 20.9% 18.6% 2.4% 0.65 3.6% 1.09 18.3% 16.4% 1.15
Value MSCI EM MIN VOL 21.4% 18.6% 2.9% 0.58 5.0% 1.06 18.0% 16.4% 1.19
Quality MSCI EM MIN VOL 19.0% 18.6% 0.5% 0.21 2.1% 1.03 17.1% 16.4% 1.11
Low Vol MSCI EM MIN VOL 19.2% 18.6% 0.6% 0.21 2.9% 0.91 15.2% 16.4% 1.26
Growth MSCI EM MIN VOL 19.0% 18.6% 0.4% 0.14 3.1% 1.06 17.7% 16.4% 1.07
Size MSCI EM MIN VOL 17.2% 18.6% -1.4% -0.25 5.8% 0.97 16.9% 16.4% 1.01
May 2013
* Min Vol Investment Style
follow the same
methodology described
on the previous page, but
in addition require all
stocks to be members of
the MSCI EM MIN VOL
benchmark.
© Allianz Global Investors - 25
The Min Vol flavors of value, revisions and momentum do well against the MIN VOL
benchmark, with information ratios between 0.6 and 0.8. This is comparable to the
performance of the corresponding non Min Vol flavors against the broad benchmark
Size, Quality and Growth barely add to performance, despite all of their them having positive
performance against the broad benchmark over the time period
Low Volatility as a factor barely adds to performance since building a meaningful low volatility
exposure against a MIN VOL benchmark is difficult. The existing small outperformance is due
to the fact that the MSCI Minimum Volatility benchmark, because of it‘s constraints, does not
exploit the full potential of volatility reduction
Classical factors like value, revisions and momentum are promising
candidates for a style strategy benchmarked against a MIN VOL benchmark
Performance of Min Vol Investment Styles vs. MSCI EM MIN VOL
May 2013

© Allianz Global Investors -
Performance of a Diversified Style Strategy in Emerging Markets
with and without MIN VOL
26
0.8
1
1.2
1.4
1.6
1.8
2
2.2
2.4
2002 2003 2004 2005 2006 2007 2008 2009 2010 2011
MSCI EM MIN VOL vs. MSCI EMStyle Mix vs. MSCI EMMin Vol Style Mix vs. MSCI EM MIN VOL
Strategy Benchmark
Return
p.a.(after costs)
Benchmark
Return
Relative
Return(after costs)
Information
Ratio(after costs)
Tracking
Error Beta Volatility
Benchmark
Volatility
Sharpe
Ratio*
Benchmark
Sharpe
Ratio*
MSCI EM MIN VOL MSCI EM 18.4% 14.7% 3.8% 0.63 6.0% 78.2% 16.4% 20.4% 1.13 0.72
Style Mix MSCI EM 21.9% 14.7% 7.2% 1.20 6.0% 107.0% 22.6% 20.4% 1.12 0.72
Min Vol Style Mix MSCI EM 23.4% 14.7% 8.7% 1.45 6.0% 84.2% 17.9% 20.4% 1.35 0.72
Min Vol Style Mix MSCI EM MIN VOL 23.4% 18.6% 4.8% 1.35 3.6% 107.2% 17.9% 16.4% 1.35 1.13
May 2013
In order to investigate the
possibility to manage an
investment style based
approach against a MIN
VOL benchmark, we
constructed a
combination of value,
momentum and revisions
factors to represent a
core portfolio invested in
a diversified mix of styles.
No fitting of factors has
been done, instead a mix
we use in several places
of our research has been
used.
rela
tive
cu
mu
lative
re
turn
aft
er
co
sts
* For sharpe ratio
calculations the risk
free rate was
assumed to be 0.
© Allianz Global Investors - 27
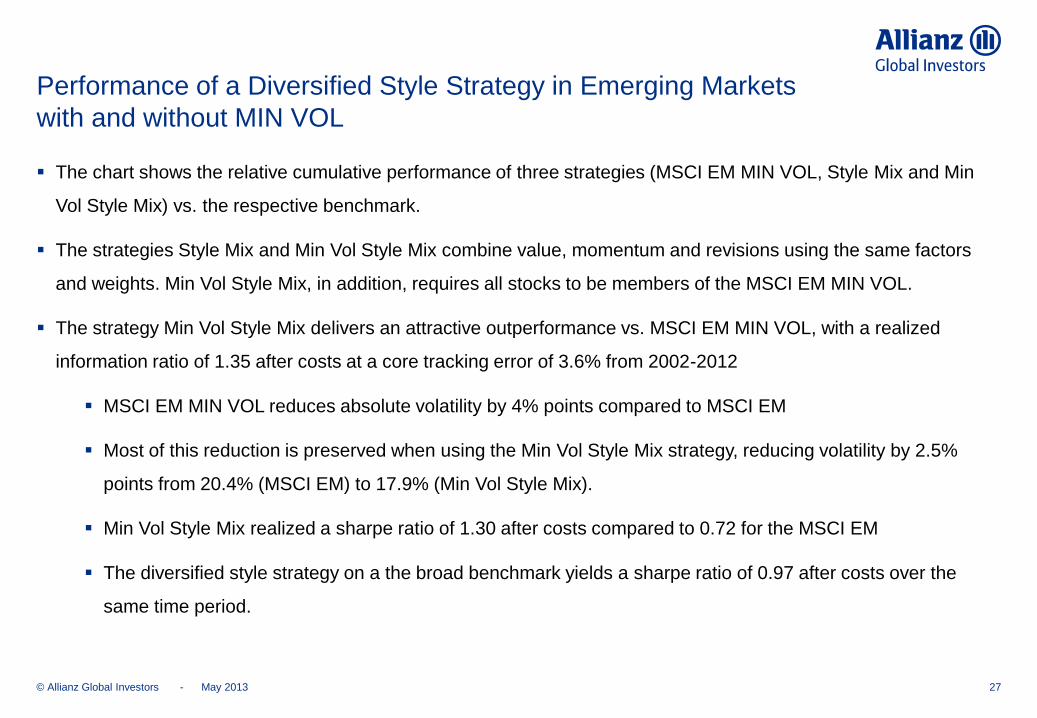
The chart shows the relative cumulative performance of three strategies (MSCI EM MIN VOL, Style Mix and Min
Vol Style Mix) vs. the respective benchmark.
The strategies Style Mix and Min Vol Style Mix combine value, momentum and revisions using the same factors
and weights. Min Vol Style Mix, in addition, requires all stocks to be members of the MSCI EM MIN VOL.
The strategy Min Vol Style Mix delivers an attractive outperformance vs. MSCI EM MIN VOL, with a realized
information ratio of 1.35 after costs at a core tracking error of 3.6% from 2002-2012
MSCI EM MIN VOL reduces absolute volatility by 4% points compared to MSCI EM
Most of this reduction is preserved when using the Min Vol Style Mix strategy, reducing volatility by 2.5%
points from 20.4% (MSCI EM) to 17.9% (Min Vol Style Mix).
Min Vol Style Mix realized a sharpe ratio of 1.30 after costs compared to 0.72 for the MSCI EM
The diversified style strategy on a the broad benchmark yields a sharpe ratio of 0.97 after costs over the
same time period.
May 2013
Performance of a Diversified Style Strategy in Emerging Markets
with and without MIN VOL
© Allianz Global Investors -
Performance of a Diversified Style Strategy in Emerging
Markets - Maximum Drawdowns
28
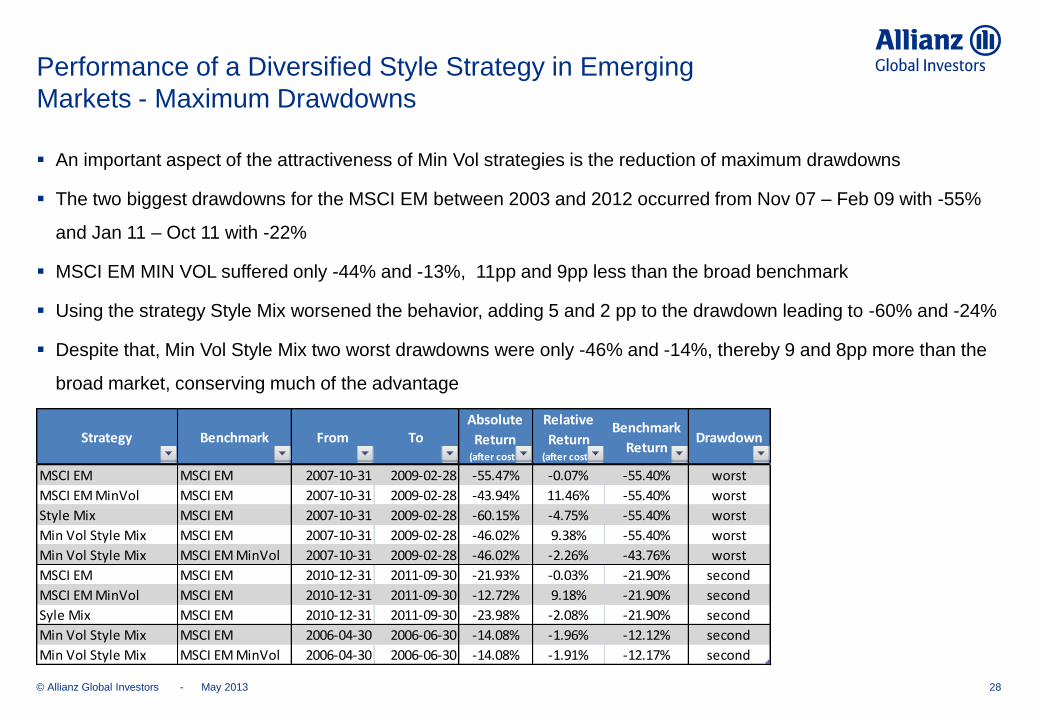
An important aspect of the attractiveness of Min Vol strategies is the reduction of maximum drawdowns
The two biggest drawdowns for the MSCI EM between 2003 and 2012 occurred from Nov 07 – Feb 09 with -55%
and Jan 11 – Oct 11 with -22%
MSCI EM MIN VOL suffered only -44% and -13%, 11pp and 9pp less than the broad benchmark
Using the strategy Style Mix worsened the behavior, adding 5 and 2 pp to the drawdown leading to -60% and -24%
Despite that, Min Vol Style Mix two worst drawdowns were only -46% and -14%, thereby 9 and 8pp more than the
broad market, conserving much of the advantage
May 2013
Strategy Benchmark From ToAbsolute
Return(after costs)
Relative
Return (after costs)
Benchmark
ReturnDrawdown
MSCI EM MSCI EM 2007-10-31 2009-02-28 -55.47% -0.07% -55.40% worst
MSCI EM MinVol MSCI EM 2007-10-31 2009-02-28 -43.94% 11.46% -55.40% worst
Style Mix MSCI EM 2007-10-31 2009-02-28 -60.15% -4.75% -55.40% worst
Min Vol Style Mix MSCI EM 2007-10-31 2009-02-28 -46.02% 9.38% -55.40% worst
Min Vol Style Mix MSCI EM MinVol 2007-10-31 2009-02-28 -46.02% -2.26% -43.76% worst
MSCI EM MSCI EM 2010-12-31 2011-09-30 -21.93% -0.03% -21.90% second
MSCI EM MinVol MSCI EM 2010-12-31 2011-09-30 -12.72% 9.18% -21.90% second
Syle Mix MSCI EM 2010-12-31 2011-09-30 -23.98% -2.08% -21.90% second
Min Vol Style Mix MSCI EM 2006-04-30 2006-06-30 -14.08% -1.96% -12.12% second
Min Vol Style Mix MSCI EM MinVol 2006-04-30 2006-06-30 -14.08% -1.91% -12.17% second

© Allianz Global Investors -
Conclusions
29
Benchmarking
We expect risk based benchmarks to become the default benchmark for a relevant part of core equity
assets
Minimum Volatility offers attractive features which could make it the benchmark of choice, especially in
a multi asset context
Unconstraint Minimum Volatility has drawbacks, like heavy concentration, high turnover, high
sensitivity to details of the risk model (covariance matrix)
We expect a constraint Minimum Volatility benchmark to be favored
Style investing vs. Min Vol Benchmarks
Style tilts are implicit in risk benchmarks and small on average but are important performance drivers.
Management of investment styles vs. e.g. a minimum volatility benchmark is promising
May 2013

© Allianz Global Investors -
Conclusions
30
Over the period from 2003-2012 a diversified style portfolio on a minimum volatility universe would have
outperformed MSCI EM MIN VOL preserving most of the attractive features of such a benchmark
Most investment styles do contribute positively.
Despite the MSCI EM MIN VOL being constraint and therefore not realising the full volatility reduction
volatility as a factor is not able to contribute significantly to performance
Due to a significant tilt already present in the MSCI EM MIN VOL, a small cap tilt does not contribute
positively
Managing investment styles against a Min Vol benchmark is adding significant value over
tracking Min Vol benchmarks
A product which combines both minimum volatility and the classical style factors should
be the choice for asset owners interested in owning a low volatility portfolio
May 2013

Understand. Act.
Thank you for your
attention
© Allianz Global Investors - 32
Appendix - MSCI Emerging Markets Minimum Volatility
May 2013

© Allianz Global Investors -
Sector exposures – MSCI Emerging Markets Minimum Volatility
33
0
0.05
0.1
0.15
0.2
0.25
0.3
20
02-1
2-3
1
20
03-0
3-3
1
20
03-0
6-3
0
20
03-0
9-3
0
20
03-1
2-3
1
20
04-0
3-3
1
20
04-0
6-3
0
20
04-0
9-3
0
20
04-1
2-3
1
20
05-0
3-3
1
20
05-0
6-3
0
20
05-0
9-3
0
20
05-1
2-3
1
20
06-0
3-3
1
20
06-0
6-3
0
20
06-0
9-3
0
20
06-1
2-3
1
20
07-0
3-3
1
20
07-0
6-3
0
20
07-0
9-3
0
20
07-1
2-3
1
20
08-0
3-3
1
20
08-0
6-3
0
20
08-0
9-3
0
20
08-1
2-3
1
20
09-0
3-3
1
20
09-0
6-3
0
20
09-0
9-3
0
20
09-1
2-3
1
20
10-0
3-3
1
20
10-0
6-3
0
20
10-0
9-3
0
20
10-1
2-3
1
20
11-0
3-3
1
20
11-0
6-3
0
20
11-0
9-3
0
20
11-1
2-3
1
20
12-0
3-3
1
20
12-0
6-3
0
20
12-0
9-3
0
20
12-1
2-3
1
20
13-0
3-3
1
Consumer Discretionary
Consumer Staples
Energy
Financials
Health Care
Industrials
Information Technology
Materials
Telecommunication Services
Utilities
May 2013

© Allianz Global Investors -
-20%
0%
20%
40%
60%
0
100
200
300
400
Nov 01 Nov 02 Nov 03 Nov 04 Nov 05 Nov 06 Nov 07 Nov 08 Nov 09 Nov 10 Nov 11 Nov 12
MSCI EM MSCI EM Minimum Volatility rel to MSCI EM (rhs)
Minimum Volatility Strategy Outperforms MSCI Emerging Markets
34
Relative Performance MSCI EM Minimum Volatility vs. MSCI EM Index
Relative performance MSCI EM Minimum
Volatility vs. MSCI EM index (rhs)
Performance MSCI EM in
EUR indexed (lhs)
MSCI EM
Relative performance of MinVol strategy holds
up remarkably well in a multi year strongly rising
equity market
Strong relative performance of
MinVol strategy even in rising
equity market
As expected
MinVol strategy
outperforms in
falling equity
markets
As expected
MinVol strategy
outperforms in
falling equity
markets
Source: AllianzGI, MSCI, as of 31 January 2013
34 May 2013
© Allianz Global Investors -
-20%
-15%
-10%
-5%
0%
5%
10%
15%
2002 2003 2004 2005 2006 2007 2008 2009 2010 2011 2012 2013
Active Return
Relative Performance MSCI Emerging Markets MinVol
vs. MSCI Emerging Markets
35
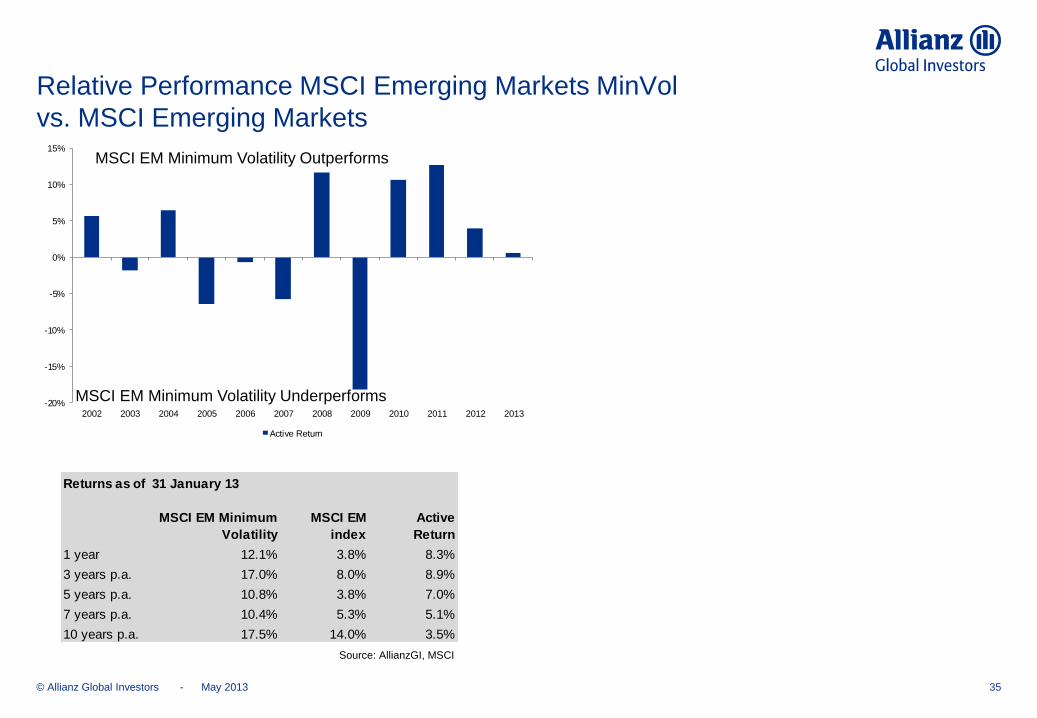
MSCI EM Minimum Volatility Outperforms
MSCI EM Minimum Volatility Underperforms
Returns as of 31 January 13
MSCI EM Minimum
Volatility
MSCI EM
index
Active
Return
1 year 12.1% 3.8% 8.3%
3 years p.a. 17.0% 8.0% 8.9%
5 years p.a. 10.8% 3.8% 7.0%
7 years p.a. 10.4% 5.3% 5.1%
10 years p.a. 17.5% 14.0% 3.5%
Source: AllianzGI, MSCI
May 2013
© Allianz Global Investors -
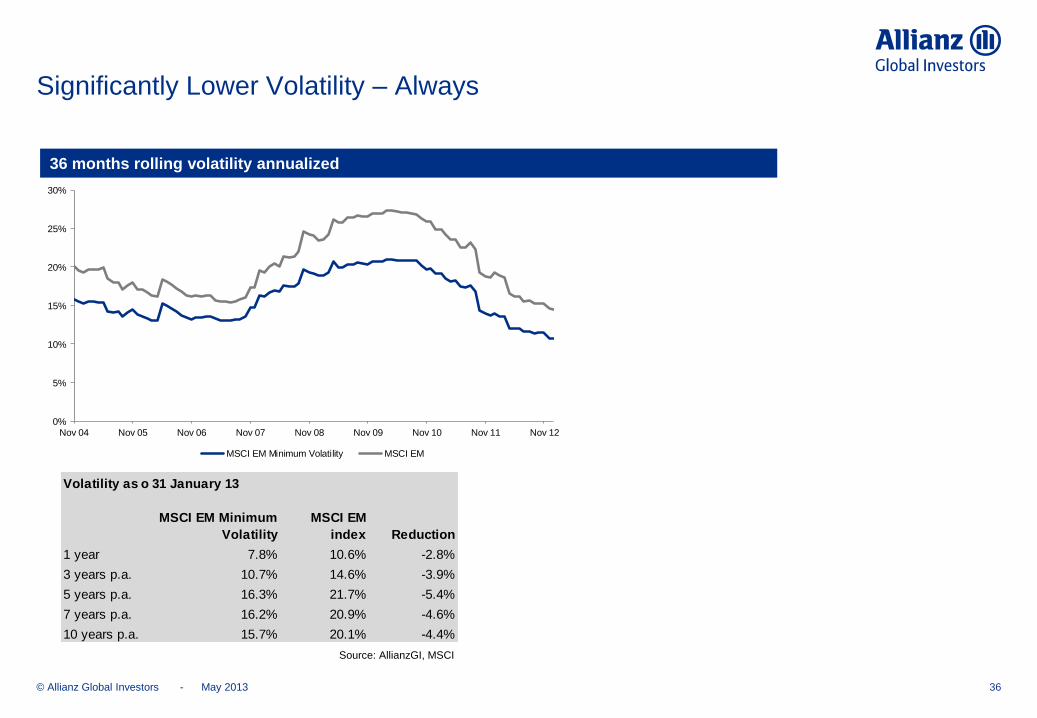
Significantly Lower Volatility – Always
36
36 months rolling volatility annualized
0%
5%
10%
15%
20%
25%
30%
Nov 04 Nov 05 Nov 06 Nov 07 Nov 08 Nov 09 Nov 10 Nov 11 Nov 12
MSCI EM Minimum Volatility MSCI EM
Volatility as of31 January 13
MSCI EM Minimum
Volatility
MSCI EM
index Reduction
1 year 7.8% 10.6% -2.8%
3 years p.a. 10.7% 14.6% -3.9%
5 years p.a. 16.3% 21.7% -5.4%
7 years p.a. 16.2% 20.9% -4.6%
10 years p.a. 15.7% 20.1% -4.4%
Source: AllianzGI, MSCI
May 2013
© Allianz Global Investors -
-80%
-60%
-40%
-20%
0%
20%
40%
60%
80%
-80% -60% -40% -20% 0% 20% 40% 60% 80%
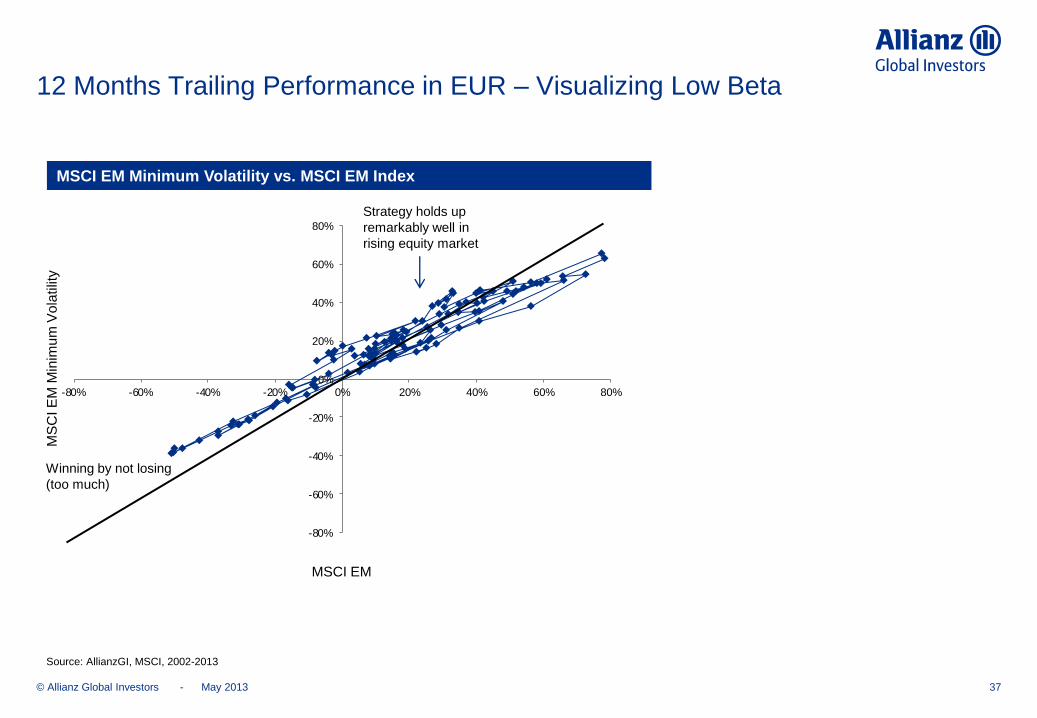
12 Months Trailing Performance in EUR – Visualizing Low Beta
37
MSCI EM Minimum Volatility vs. MSCI EM Index
Winning by not losing
(too much)
Source: AllianzGI, MSCI, 2002-2013
Strategy holds up
remarkably well in
rising equity market
MSCI EM
MS
CI E
M M
inim
um
Vo
latilit
y
May 2013

© Allianz Global Investors - 38
Appendix - MSCI Europe Minimum Volatility
May 2013

© Allianz Global Investors -
-50%
-40%
-30%
-20%
-10%
0%
10%
20%
30%
40%
50%
20
40
60
80
100
120
140
160
180
Nov 01 Nov 02 Nov 03 Nov 04 Nov 05 Nov 06 Nov 07 Nov 08 Nov 09 Nov 10 Nov 11 Nov 12
MSCI Europe MSCI Europe Minimum Volatility rel to MSCI US (rhs)
Minimum Volatility Strategy Outperforms MSCI Europe
In Down-Markets, Holds Up Well In Up-Markets
39
MSCI Europe
Relative performance MSCI Europe Minimum Volatility
vs. MSCI Europe index (rhs) Performance MSCI Europe in EUR
indexed (lhs)
Relative Performance MSCI Europe Minimum Volatility vs. MSCI Europe Index
Strong
outperformance
in the aftermath
of IT bubble
Relative performance of MinVol strategy holds
up remarkably well in a multi year rising equity
market
Strong out-
performance
after the
Lehmann bust
Under per-
formance in
a sharply
rising equity
market
Outperformance of the
MinVol strategy in
sideways markets
In the V-shaped recession the
MinVol strategy’s
outperformance is higher in the
falling equity market than its
under-performance in the
subsequent recovery.
Source: AllianzGI, MSCI, as of 31 January 2013
May 2013

© Allianz Global Investors -
Relative Performance MSCI Europe Min Vol vs. MSCI Europe
40
Source: AllianzGI, MSCI
-15%
-10%
-5%
0%
5%
10%
15%
20%
2002 2003 2004 2005 2006 2007 2008 2009 2010 2011 2012 2013
Active Return
Returns as of 31 January 13
MSCI Europe Minimum
Volatility Index
MSCI Europe
Index
Active
Return
1 year 13.8% 16.1% -2.4%
3 years p.a. 9.0% 8.2% 0.7%
5 years p.a. 1.8% 0.6% 1.2%
7 years p.a. 2.6% 1.2% 1.5%
10 years p.a. 8.3% 7.0% 1.4%
May 2013
© Allianz Global Investors -
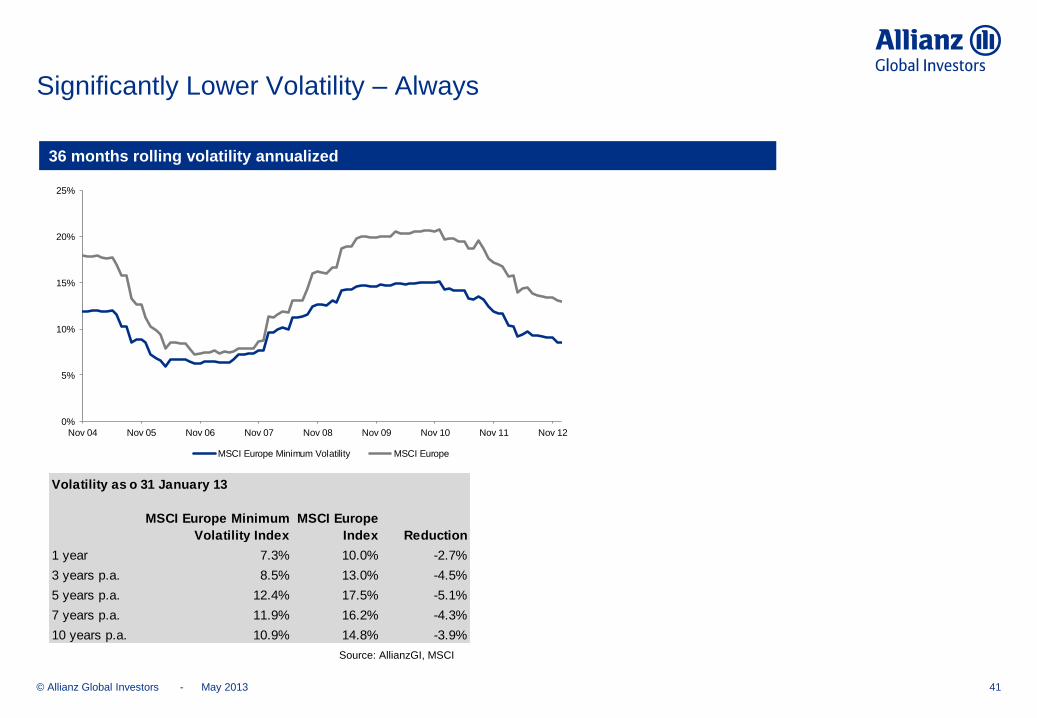
Significantly Lower Volatility – Always
41
36 months rolling volatility annualized
Source: AllianzGI, MSCI
0%
5%
10%
15%
20%
25%
Nov 04 Nov 05 Nov 06 Nov 07 Nov 08 Nov 09 Nov 10 Nov 11 Nov 12
MSCI Europe Minimum Volatility MSCI Europe
Volatility as of31 January 13
MSCI Europe Minimum
Volatility Index
MSCI Europe
Index Reduction
1 year 7.3% 10.0% -2.7%
3 years p.a. 8.5% 13.0% -4.5%
5 years p.a. 12.4% 17.5% -5.1%
7 years p.a. 11.9% 16.2% -4.3%
10 years p.a. 10.9% 14.8% -3.9%
May 2013

© Allianz Global Investors -
12 Months Trailing Performance in EUR – Visualizing Low Beta
42
MSCI Europe Minimum Volatility vs. MSCI Europe Index
Strategy holds up
remarkably well in
rising equity market
Winning by not losing
(too much)
Source: AllianzGI, MSCI, 2002-2013
MSCI Europe
MS
CI E
uro
pe
Min
imu
m V
ola
tilit
y
-60%
-40%
-20%
0%
20%
40%
60%
-60% -40% -20% 0% 20% 40% 60%
May 2013

© Allianz Global Investors - 43
Appendix - Disclaimer
May 2013
© Allianz Global Investors - 44
Disclaimer
Investing involves risk. The value of an investment and the income from it may fall as well as rise and investors may not get back the full
amount invested.
Past performance is not a reliable indicator of future results. If the currency in which the past performance is displayed differs from the currency of the country in which the investor
resides, then the investor should be aware that due to the exchange rate fluctuations the performance shown may be higher or lower if converted into the investor’s local currency.
Back-testings and hypothetical or simulated performance data has many inherent limitations only some of which are described as follows:
i. It is designed with the benefit of hindsight, based on historical data, and does not reflect the impact that certain economic and market factors might have had on the decision-making
process, if a client’s portfolio had actually been managed. No back-testings, hypothetical or simulated performance can completely account for the impact of financial risk in actual
performance.
ii. It does not reflect actual transactions and cannot accurately account for the ability to withstand losses.
iii. the information is based, in part, on hypothetical assumptions made for modeling purposes that may not be realized in the actual management of portfolios.
No representation or warranty is made as to the reasonableness of the assumptions made or that all assumptions used in achieving the returns have been stated or fully considered. Assumption
changes may have a material impact on the model returns presented. The back-testing of performance differs from actual portfolio performance because the investment strategy may be adjusted
at any time, for any reason.
Investors should not assume that they will experience a performance similar to the back-testings, hypothetical or simulated performance shown. Material differences between back-testings,
hypothetical or simulated performance results and actual results subsequently achieved by any investment strategy are possible.
The views and opinions expressed herein, which are subject to change without notice, are those of the issuer and/or its affiliated companies at the time of publication. The data used is derived
from various sources, and assumed to be correct and reliable, but it has not been independently verified; its accuracy or completeness is not guaranteed and no liability is assumed for any direct
or consequential losses arising from its use, unless caused by gross negligence or willful misconduct. The conditions of any underlying offer or contract that may have been, or will be, made or
concluded, shall prevail.
This is a marketing communication. Issued by Allianz Global Investors Europe GmbH, www.allianzglobalinvestors.eu, a limited liability company, incorporated in Germany, with its registered office
at Mainzer Landstrasse 11-13, D-60329 Frankfurt/Main, authorized by Bundesanstalt für Finanzdienstleistungsaufsicht (www.bafin.de). The information contained herein is confidential. The
duplication, publication, or transmission of the contents, irrespective of the form, is not permitted.
May 2013

© Allianz Global Investors - 45
Appendix – The Systematic Equities Team at Allianz
Global Investors
May 2013
© Allianz Global Investors -
Systematic Portfolio Management & Research Team
46
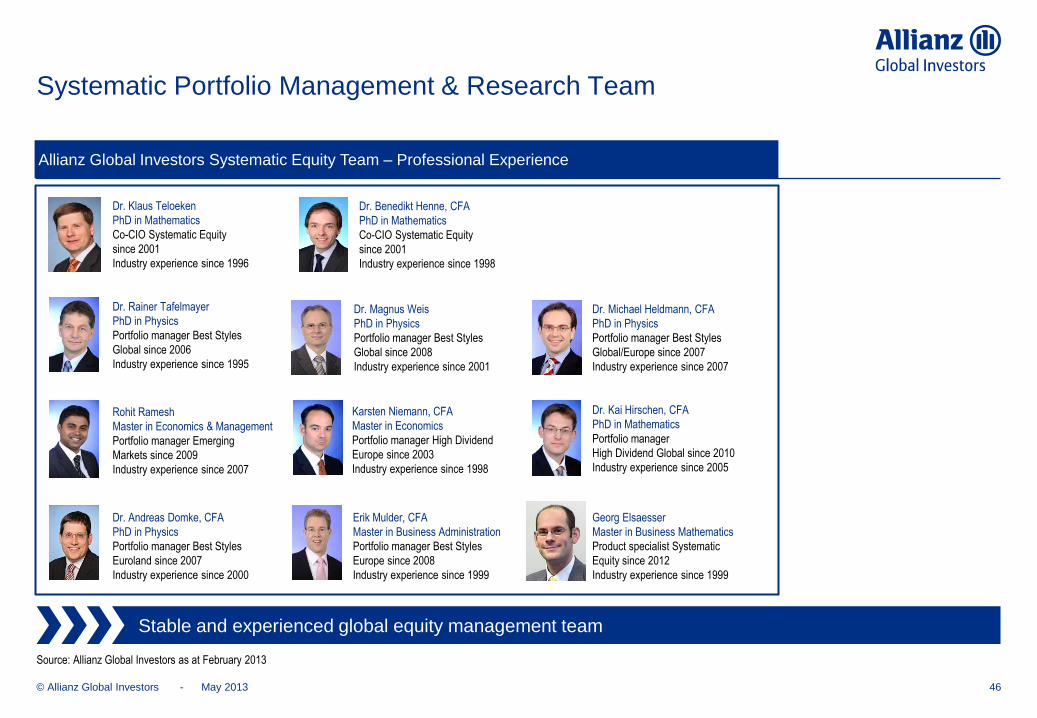
Allianz Global Investors Systematic Equity Team – Professional Experience
Stable and experienced global equity management team
Dr. Klaus Teloeken
PhD in Mathematics
Co-CIO Systematic Equity
since 2001
Industry experience since 1996
Dr. Benedikt Henne, CFA
PhD in Mathematics
Co-CIO Systematic Equity
since 2001
Industry experience since 1998
Dr. Rainer Tafelmayer
PhD in Physics
Portfolio manager Best Styles
Global since 2006
Industry experience since 1995
Rohit Ramesh
Master in Economics & Management
Portfolio manager Emerging
Markets since 2009
Industry experience since 2007
Dr. Andreas Domke, CFA
PhD in Physics
Portfolio manager Best Styles
Euroland since 2007
Industry experience since 2000
Dr. Magnus Weis
PhD in Physics
Portfolio manager Best Styles
Global since 2008
Industry experience since 2001
Karsten Niemann, CFA
Master in Economics
Portfolio manager High Dividend
Europe since 2003
Industry experience since 1998
Erik Mulder, CFA
Master in Business Administration
Portfolio manager Best Styles
Europe since 2008
Industry experience since 1999
Dr. Michael Heldmann, CFA
PhD in Physics
Portfolio manager Best Styles
Global/Europe since 2007
Industry experience since 2007
Dr. Kai Hirschen, CFA
PhD in Mathematics
Portfolio manager
High Dividend Global since 2010
Industry experience since 2005
Georg Elsaesser
Master in Business Mathematics
Product specialist Systematic
Equity since 2012
Industry experience since 1999
Source: Allianz Global Investors as at February 2013
May 2013