managing software project
TRANSCRIPT
1
Par t 4 Managing Sof t war e
Pr oj ect Software Engineering: A Practitioner’s Approach, 6th editionby Roger S. Pressman
2
Chapt er 21Pr oj ect Management
Concept s Software Engineering: A Practitioner’s Approach, 6th editionby Roger S. Pressman
3
The 4 P’s
People — the most important element of a successful project
Product — the software to be built Process — the set of framework
activities and software engineering tasks to get the job done
Project — all work required to make the product a reality
4
St akeholder s Senior managers who define the business issues that often
have significant influence on the project. Project (technical) managers who must plan, motivate, organize,
and control the practitioners who do software work. Practitioners who deliver the technical skills that are necessary
to engineer a product or application. Customers who specify the requirements for the software to be
engineered and other stakeholders who have a peripheral interest in the outcome.
End-users who interact with the software once it is released for production use.
5
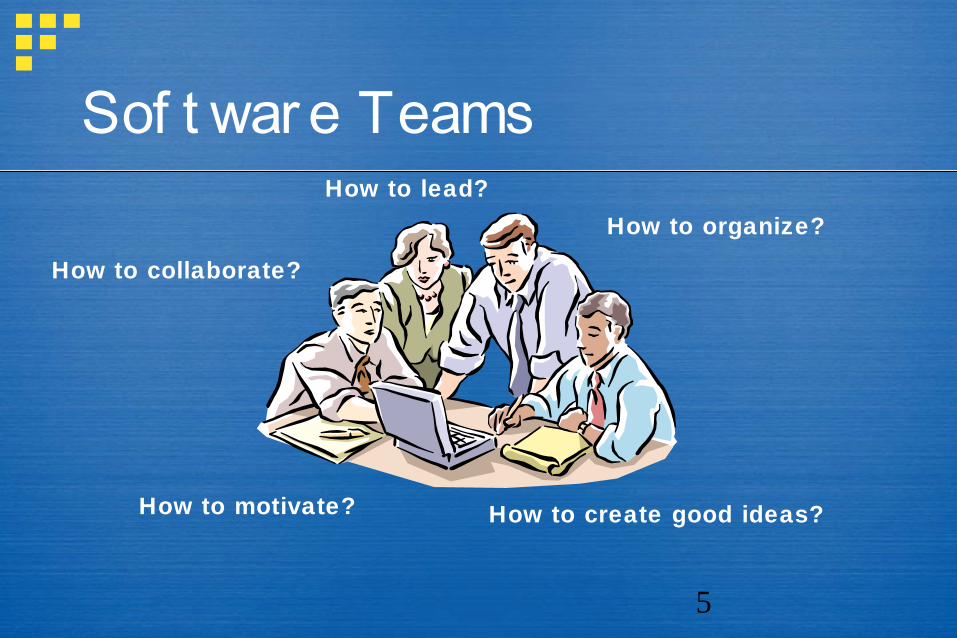
Sof t war e TeamsHow to lead?
How to organize?
How to motivate?
How to collaborate?
How to create good ideas?
6
Team Leader The MOI Model:
Motivation. The ability to encourage (by “push or pull”) technical people to produce to their best ability.
Organization. The ability to mold existing processes (or invent new ones) that will enable the initial concept to be translated into a final product.
Ideas or innovation. The ability to encourage people to create and feel creative even when they must work within bounds established for a particular software product or application.
7
Sof t war e Teams The difficulty of the problem to be solved The size of the resultant program(s) in lines of code or function
points The time that the team will stay together (team lifetime) The degree to which the problem can be modularized The required quality and reliability of the system to be built The rigidity of the delivery date The degree of sociability (communication) required for the
project
The following factors must be considered when selectingThe following factors must be considered when selectinga software project team structure .. .a software project team structure .. .
8
Or ganizat ional Par adigms Closed paradigm—structures a team along a traditional
hierarchy of authority Random paradigm—structures a team loosely and depends on
individual initiative of the team members Open paradigm—attempts to structure a team in a manner that
achieves some of the controls associated with the closed paradigm but also much of the innovation that occurs when using the random paradigm
Synchronous paradigm—relies on the natural compartmentalization of a problem and organizes team members to work on pieces of the problem with little active communication among themselves
suggested by Constantine [CON93]
9
Avoid Team “Toxicit y” A frenzied work atmosphere in which team members waste
energy and lose focus on the objectives of the work to be performed.
High frustration caused by personal, business, or technological factors that cause friction among team members.
“Fragmented or poorly coordinated procedures” or a poorly defined or improperly chosen process model that becomes a roadblock to accomplishment.
Unclear definition of roles resulting in a lack of accountability and resultant finger-pointing.
“Continuous and repeated exposure to failure” that leads to a loss of confidence and a lowering of morale.
10
Agile Teams Team members must have trust in one another. The distribution of skills must be appropriate to the problem. Mavericks may have to be excluded from the team, if team
cohesiveness is to be maintained. Team is “self-organizing”
An adaptive team structure Uses elements of Constantine’s random, open, and
synchronous paradigms Significant autonomy
11
Team Coor dinat ion & Communicat ion Formal, impersonal approaches include software engineering
documents and work products (including source code), technical memos, project milestones, schedules, and project control tools (Chapter 23), change requests and related documentation, error tracking reports, and repository data (see Chapter 26).
Formal, interpersonal procedures focus on quality assurance activities (Chapter 25) applied to software engineering work products. These include status review meetings and design and code inspections.
Informal, interpersonal procedures include group meetings for information dissemination and problem solving and “collocation of requirements and development staff.”
Electronic communication encompasses electronic mail, electronic bulletin boards, and by extension, video-based conferencing systems.
Interpersonal networking includes informal discussions with team members and those outside the project who may have experience or insight that can assist team members.
12
The Pr oduct Scope Scope:
Context. How does the software to be built fit into a larger system, product, or business context and what constraints are imposed as a result of the context?
Information objectives. What customer-visible data objects (Chapter 8) are produced as output from the software? What data objects are required for input?
Function and performance. What function does the software perform to transform input data into output? Are any special performance characteristics to be addressed?
Software project scope must be unambiguous and understandable at the management and technical levels.
13
Pr oblem Decomposit ion Sometimes called partitioning or problem elaboration Once scope is defined …
It is decomposed into constituent functions It is decomposed into user-visible data objects or It is decomposed into a set of problem classes
Decomposition process continues until all functions or problem classes have been defined
14
The Pr ocess Once a process framework has been established
Consider project characteristics Determine the degree of rigor required Define a task set for each software engineering
activity Task set =
Software engineering tasks Work products Quality assurance points Milestones
15
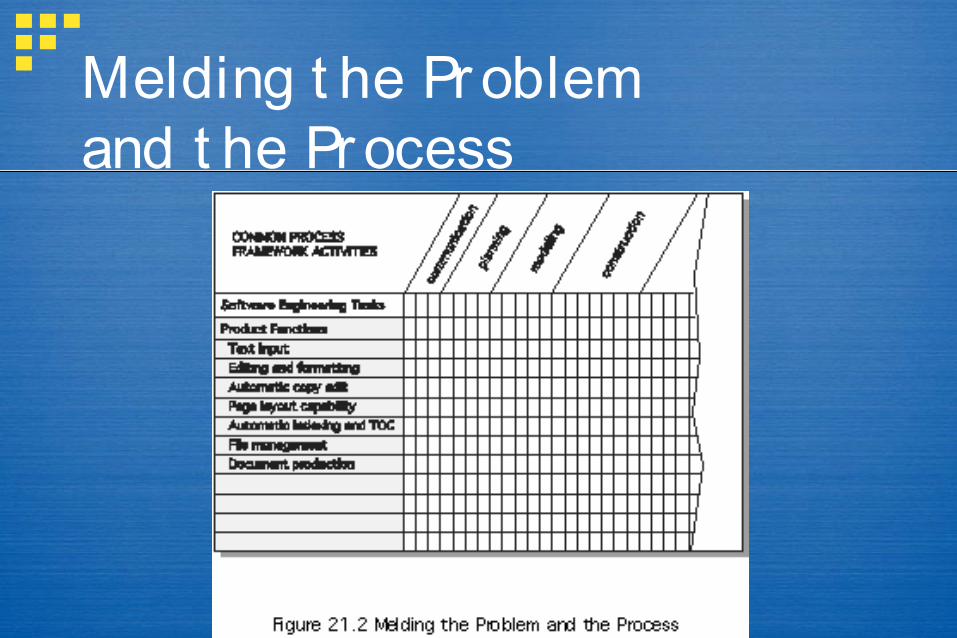
Melding t he Pr oblemand t he Pr ocess
16
The Pr oj ect Projects get into trouble when …
Software people don’t understand their customer’s needs. The product scope is poorly defined. Changes are managed poorly. The chosen technology changes. Business needs change [or are ill-defined]. Deadlines are unrealistic. Users are resistant. Sponsorship is lost [or was never properly obtained]. The project team lacks people with appropriate skills. Managers [and practitioners] avoid best practices and lessons
learned.
17
Common-Sense Appr oacht o Pr oj ect s Start on the right foot. This is accomplished by working hard (very
hard) to understand the problem that is to be solved and then setting realistic objectives and expectations.
Maintain momentum. The project manager must provide incentives to keep turnover of personnel to an absolute minimum, the team should emphasize quality in every task it performs, and senior management should do everything possible to stay out of the team’s way.
Track progress. For a software project, progress is tracked as work products (e.g., models, source code, sets of test cases) are produced and approved (using formal technical reviews) as part of a quality assurance activity.
Make smart decisions. In essence, the decisions of the project manager and the software team should be to “keep it simple.”
Conduct a postmortem analysis. Establish a consistent mechanism for extracting lessons learned for each project.
18
To Get t o t he Essenceof a Pr oj ect Why is the system being developed? What will be done? When will it be accomplished? Who is responsible? Where are they organizationally located? How will the job be done technically and
managerially? How much of each resource (e.g., people, software,
tools, database) will be needed?Barry Boehm
19
Cr it ical Pr act ices Formal risk management
Empirical cost and schedule estimation
Metrics-based project management
Earned value tracking
Defect tracking against quality targets
People aware project management
20
Chapt er 22 Process and Project
Metrics Software Engineering: A Practitioner’s Approach, 6th editionby Roger S. Pressman
21
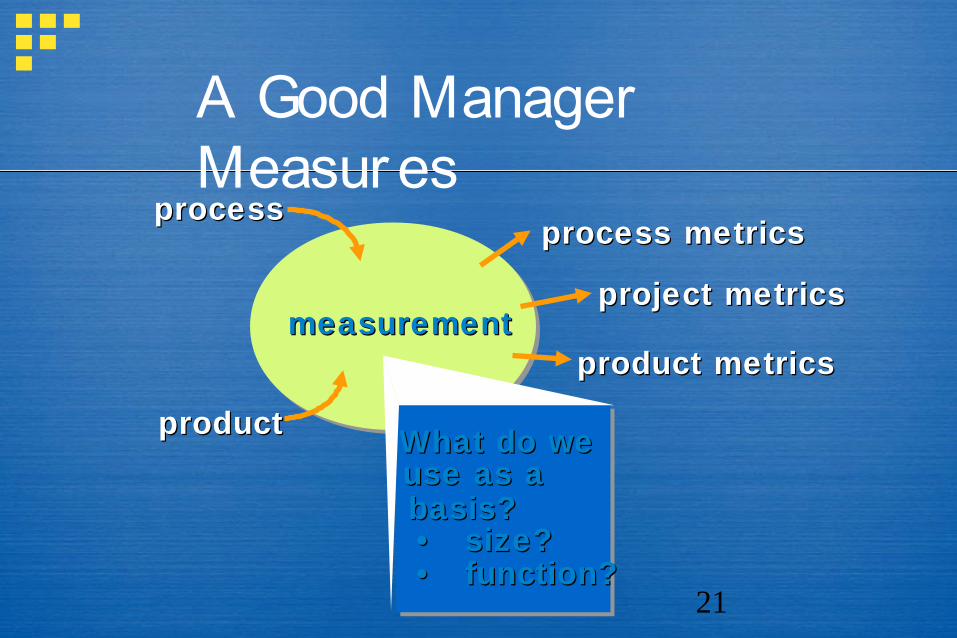
A Good Manager Measur es
measurementmeasurement
What do weWhat do weuse as ause as abasis?basis?
• • size?size? • • function?function?
project metricsproject metrics
process metricsprocess metricsprocessprocess
productproduct
product metricsproduct metrics
22
Why Do We Measur e? assess the status of an ongoing project track potential risks uncover problem areas before they go
“critical,” adjust work flow or tasks, evaluate the project team’s ability to
control quality of software work products.
23
Pr ocess Measur ement We measure the efficacy of a software process indirectly.
That is, we derive a set of metrics based on the outcomes that can be derived from the process.
Outcomes include measures of errors uncovered before release of the software defects delivered to and reported by end-users work products delivered (productivity) human effort expended calendar time expended schedule conformance other measures.
We also derive process metrics by measuring the characteristics of specific software engineering tasks.
24
Pr ocess Met r ics Guidelines Use common sense and organizational sensitivity when
interpreting metrics data. Provide regular feedback to the individuals and teams who
collect measures and metrics. Don’t use metrics to appraise individuals. Work with practitioners and teams to set clear goals and metrics
that will be used to achieve them. Never use metrics to threaten individuals or teams. Metrics data that indicate a problem area should not be
considered “negative.” These data are merely an indicator for process improvement.
Don’t obsess on a single metric to the exclusion of other important metrics.
25
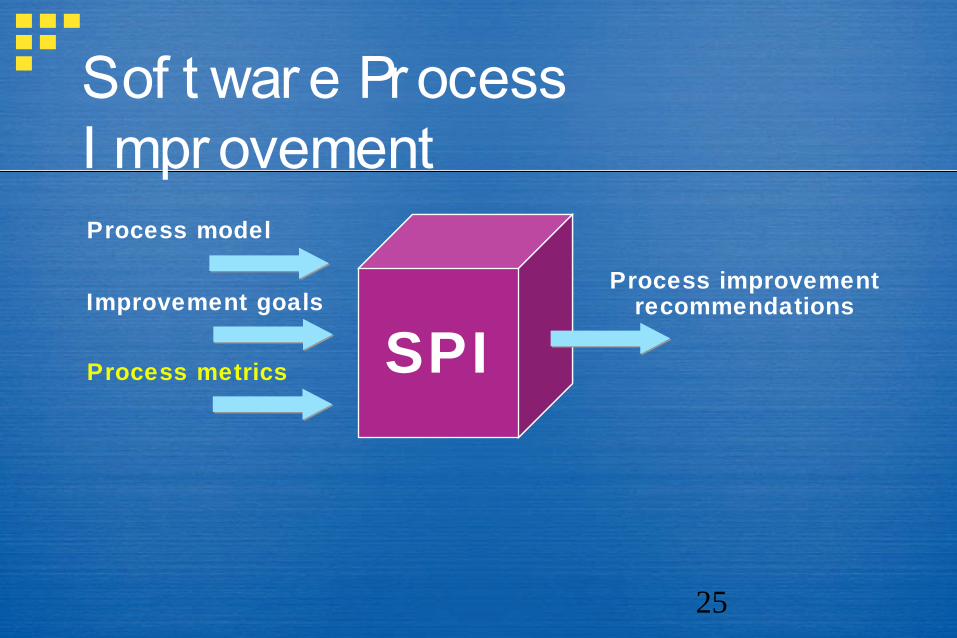
Sof t war e Pr ocess I mpr ovement
SPI
Process model
Improvement goals
Process metrics
Process improvementrecommendations
26
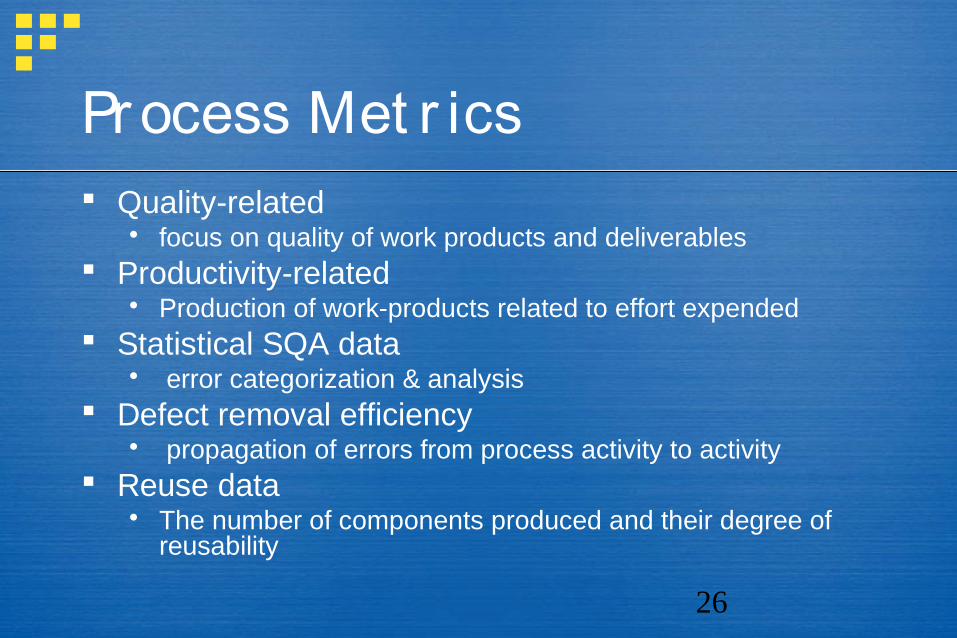
Pr ocess Met r ics Quality-related
focus on quality of work products and deliverables Productivity-related
Production of work-products related to effort expended Statistical SQA data
error categorization & analysis Defect removal efficiency
propagation of errors from process activity to activity Reuse data
The number of components produced and their degree of reusability
27
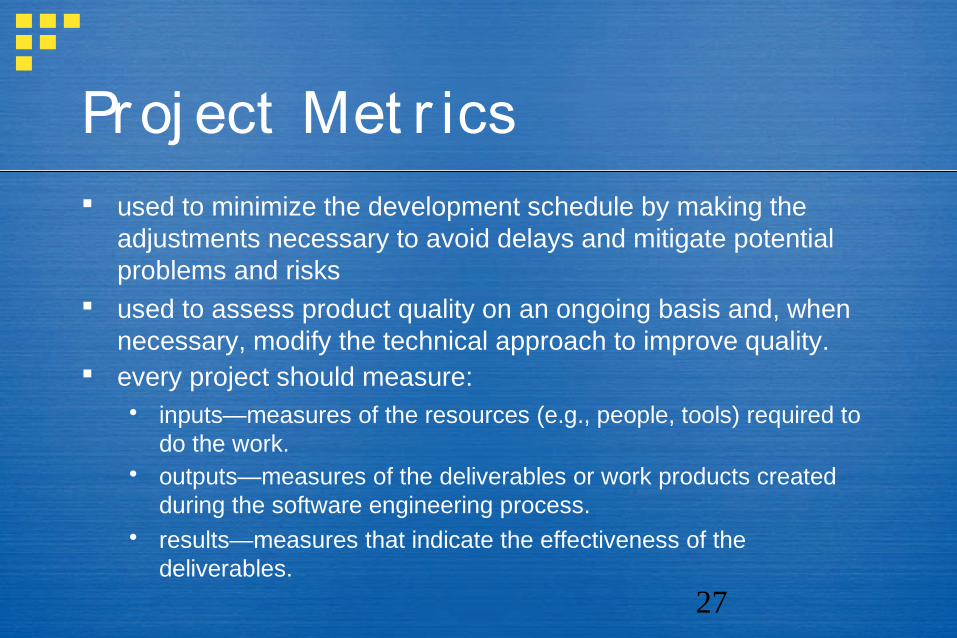
Pr oj ect Met r ics used to minimize the development schedule by making the
adjustments necessary to avoid delays and mitigate potential problems and risks
used to assess product quality on an ongoing basis and, when necessary, modify the technical approach to improve quality.
every project should measure: inputs—measures of the resources (e.g., people, tools) required to
do the work. outputs—measures of the deliverables or work products created
during the software engineering process. results—measures that indicate the effectiveness of the
deliverables.
28
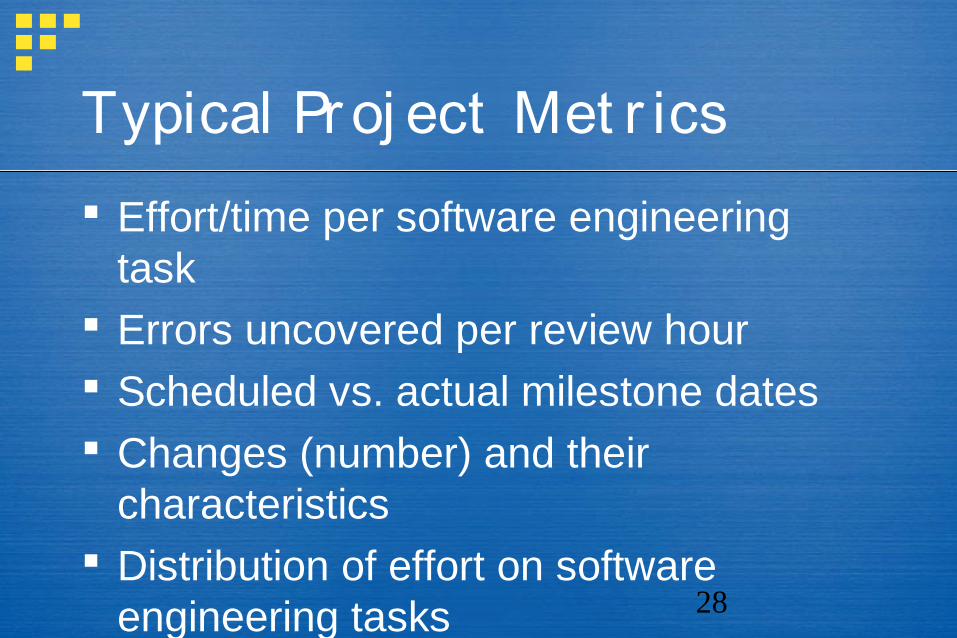
Typical Pr oj ect Met r ics Effort/time per software engineering
task Errors uncovered per review hour Scheduled vs. actual milestone dates Changes (number) and their
characteristics Distribution of effort on software
engineering tasks
29
Met r ics Guidelines Use common sense and organizational sensitivity when
interpreting metrics data. Provide regular feedback to the individuals and teams who have
worked to collect measures and metrics. Don’t use metrics to appraise individuals. Work with practitioners and teams to set clear goals and metrics
that will be used to achieve them. Never use metrics to threaten individuals or teams. Metrics data that indicate a problem area should not be
considered “negative.” These data are merely an indicator for process improvement.
Don’t obsess on a single metric to the exclusion of other important metrics.
30
Typical Size-Or ient ed Met r ics errors per KLOC (thousand lines of code) defects per KLOC $ per LOC pages of documentation per KLOC errors per person-month Errors per review hour LOC per person-month $ per page of documentation
31
Typical Funct ion-Or ient ed Met r ics
errors per FP (thousand lines of code) defects per FP $ per FP pages of documentation per FP FP per person-month
32
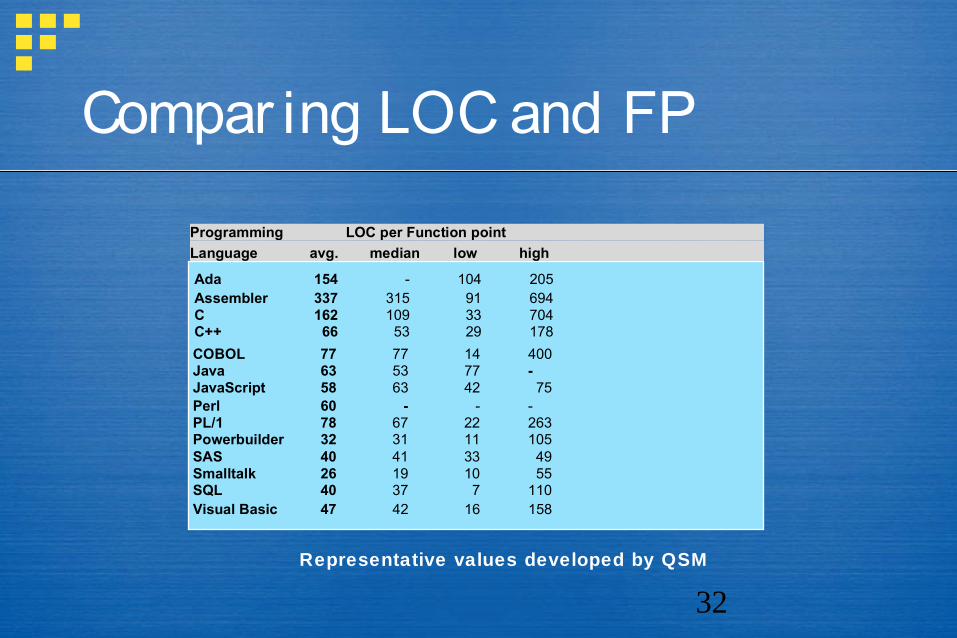
Compar ing LOC and FP
Programming LOC per Function point
Language avg. median low high
Ada 154 - 104 205Assembler 337 315 91 694C 162 109 33 704C++ 66 53 29 178
COBOL 77 77 14 400Java 63 53 77 -JavaScript 58 63 42 75Perl 60 - - -PL/1 78 67 22 263Powerbuilder 32 31 11 105SAS 40 41 33 49Smalltalk 26 19 10 55SQL 40 37 7 110Visual Basic 47 42 16 158
Representative values developed by QSM
33
Why Opt f or FP? Programming language independent Used readily countable characteristics that are
determined early in the software process Does not “penalize” inventive (short)
implementations that use fewer LOC that other more clumsy versions
Makes it easier to measure the impact of reusable components
34
Obj ect -Or ient ed Met r ics Number of scenario scripts (use-cases) Number of support classes (required to
implement the system but are not immediately related to the problem domain)
Average number of support classes per key class (analysis class)
Number of subsystems (an aggregation of classes that support a function that is visible to the end-user of a system)
35
WebE Pr oj ect Met r ics Number of static Web pages (the end-user has no control over
the content displayed on the page) Number of dynamic Web pages (end-user actions result in
customized content displayed on the page) Number of internal page links (internal page links are pointers
that provide a hyperlink to some other Web page within the WebApp)
Number of persistent data objects Number of external systems interfaced Number of static content objects Number of dynamic content objects Number of executable functions
36
Measur ing Qualit y Correctness — the degree to which a
program operates according to specification Maintainability—the degree to which a
program is amenable to change Integrity—the degree to which a program is
impervious to outside attack Usability—the degree to which a program is
easy to use
37
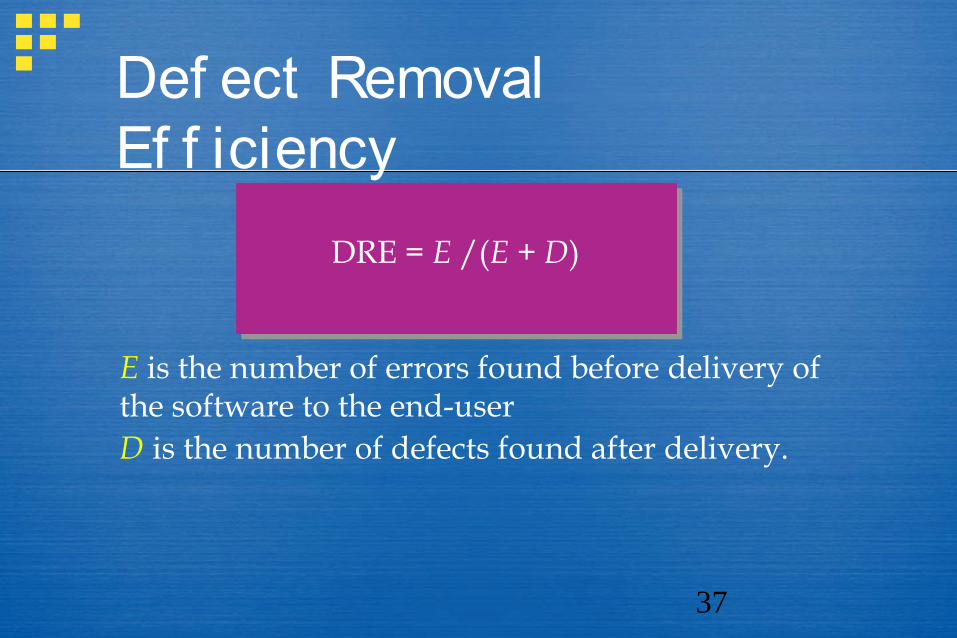
Def ect Removal Ef f iciency
DRE = E /(E + D)
E is the number of errors found before delivery of the software to the end-user D is the number of defects found after delivery.
38
Met r ics f or Small Or ganizat ions time (hours or days) elapsed from the time a request is made
until evaluation is complete, tqueue. effort (person-hours) to perform the evaluation, Weval. time (hours or days) elapsed from completion of evaluation to
assignment of change order to personnel, teval. effort (person-hours) required to make the change, Wchange. time required (hours or days) to make the change, tchange. errors uncovered during work to make change, Echange. defects uncovered after change is released to the customer
base, Dchange.
39
Est ablishing a Met r ics Pr ogr am Identify your business goals. Identify what you want to know or learn. Identify your subgoals. Identify the entities and attributes related to your subgoals. Formalize your measurement goals. Identify quantifiable questions and the related indicators that you will
use to help you achieve your measurement goals. Identify the data elements that you will collect to construct the indicators
that help answer your questions. Define the measures to be used, and make these definitions
operational. Identify the actions that you will take to implement the measures. Prepare a plan for implementing the measures.
40
Chapt er 23Est imat ion f or Sof t war e
Pr oj ect s Software Engineering: A Practitioner’s Approach, 6th editionby Roger S. Pressman
41
Sof t war e Pr oj ect Planning
The overall goal of project planning is to The overall goal of project planning is to establish a pragmatic strategy for controlling, establish a pragmatic strategy for controlling, tracking, and monitoring a complex technical tracking, and monitoring a complex technical project.project.
Why?Why?
So the end result gets done on time, with quality!So the end result gets done on time, with quality!
42
Pr oj ect Planning Task Set -I Establish project scope Determine feasibility Analyze risks Define required resources
Determine require human resources Define reusable software resources Identify environmental resources
43
Pr oj ect Planning Task Set -I I Estimate cost and effort
Decompose the problem Develop two or more estimates using size,
function points, process tasks or use-cases Reconcile the estimates
Develop a project schedule Establish a meaningful task set Define a task network Use scheduling tools to develop a timeline chart Define schedule tracking mechanisms
44
Est imat ion Estimation of resources, cost, and schedule for a
software engineering effort requires experience access to good historical information (metrics the courage to commit to quantitative predictions
when qualitative information is all that exists Estimation carries inherent risk and this risk leads to
uncertainty
45
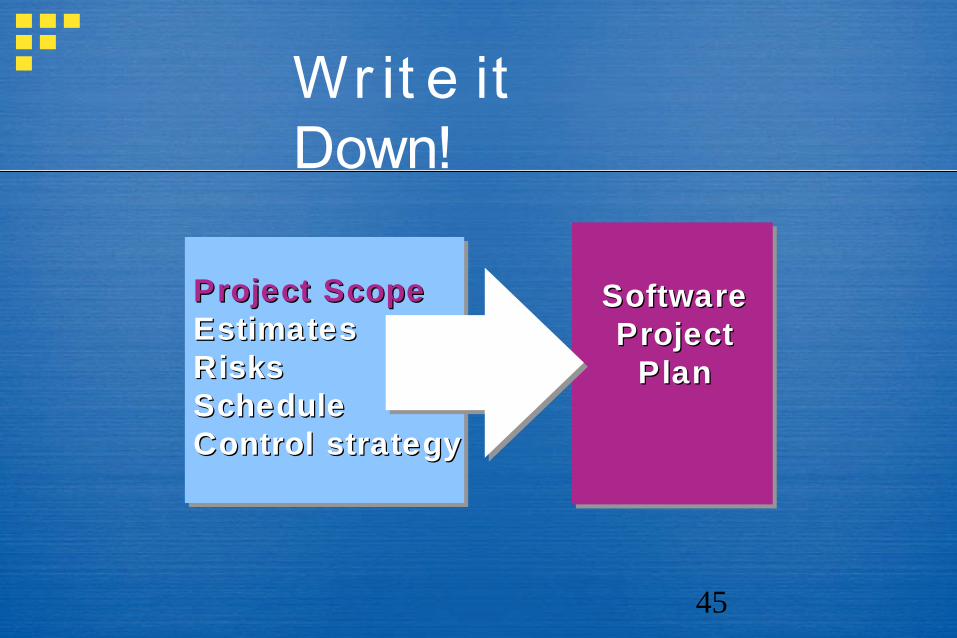
Wr it e it Down!
SoftwareSoftwareProjectProject
PlanPlan
Project ScopeProject ScopeEstimatesEstimatesRisksRisksScheduleScheduleControl strategyControl strategy
46
To Under st and Scope ... Understand the customers needs understand the business context understand the project boundaries understand the customer’s motivation understand the likely paths for change understand that ...
Even when you understand,Even when you understand,nothing is guaranteed!nothing is guaranteed!
47
What is Scope? Software scope describes
the functions and features that are to be delivered to end-users
the data that are input and output the “content” that is presented to users as a consequence of
using the software the performance, constraints, interfaces, and reliability that
bound the system. Scope is defined using one of two techniques:
A narrative description of software scope is developed after communication with all stakeholders.
A set of use-cases is developed by end-users.
48
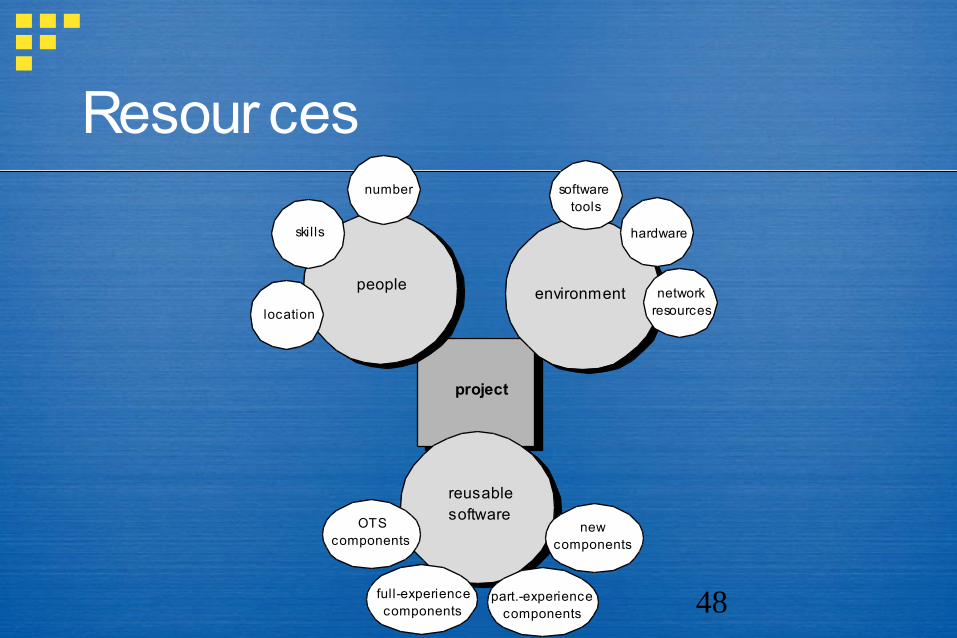
Resour ces
project
people
skills
number
location
reusable software
OTS components
full-experience components
new components
part.-experience components
environment
hardware
software tools
network resources
49
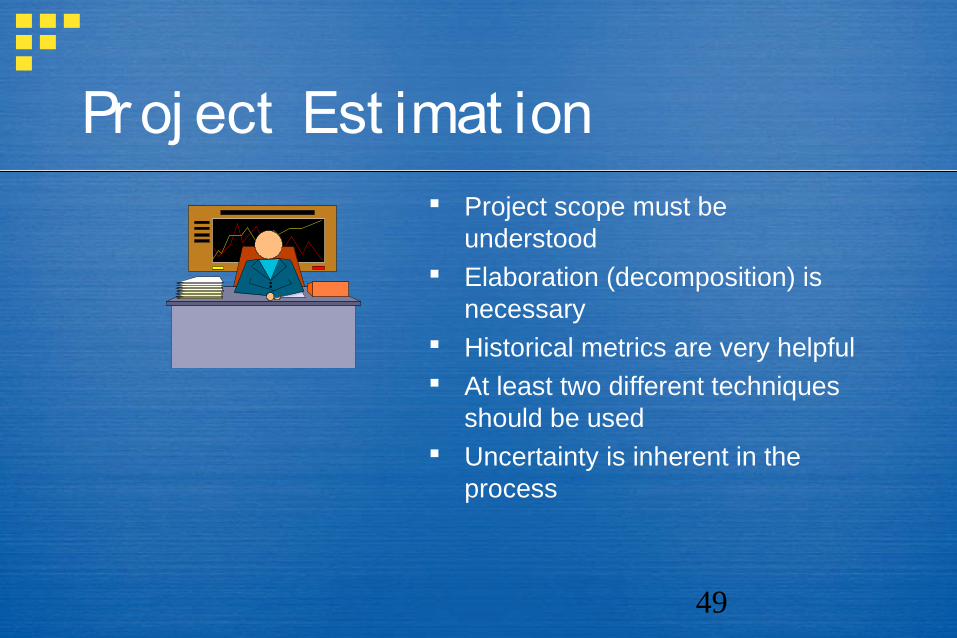
Pr oj ect Est imat ion Project scope must be
understood Elaboration (decomposition) is
necessary Historical metrics are very helpful At least two different techniques
should be used Uncertainty is inherent in the
process
50
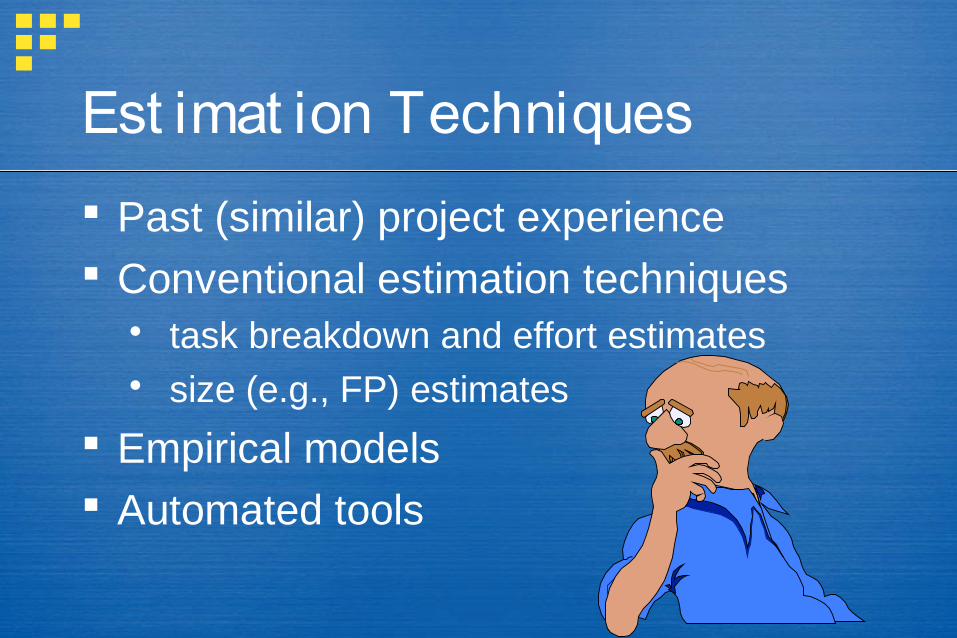
Est imat ion Techniques Past (similar) project experience Conventional estimation techniques
task breakdown and effort estimates size (e.g., FP) estimates
Empirical models Automated tools
51
Est imat ion Accur acy Predicated on …
the degree to which the planner has properly estimated the size of the product to be built
the ability to translate the size estimate into human effort, calendar time, and dollars (a function of the availability of reliable software metrics from past projects)
the degree to which the project plan reflects the abilities of the software team
the stability of product requirements and the environment that supports the software engineering effort.
52
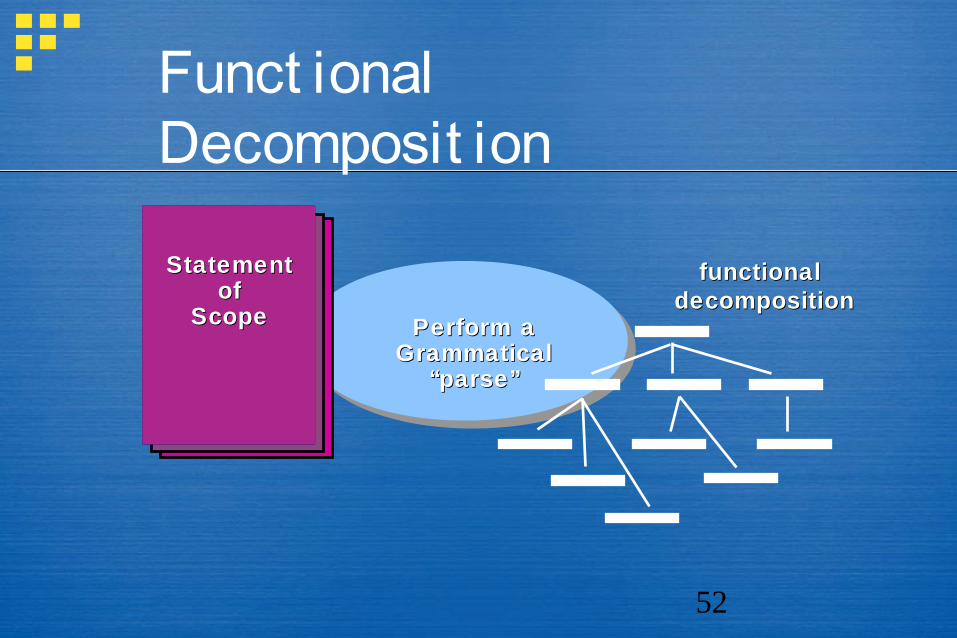
Funct ional Decomposit ion
functional functional decompositiondecomposition
StatementStatementofof
ScopeScope Perform a Perform a Grammatical Grammatical
“parse”“parse”
53
Convent ional Met hods:LOC/ FP Appr oach
compute LOC/FP using estimates of information domain values
use historical data to build estimates for the project
54
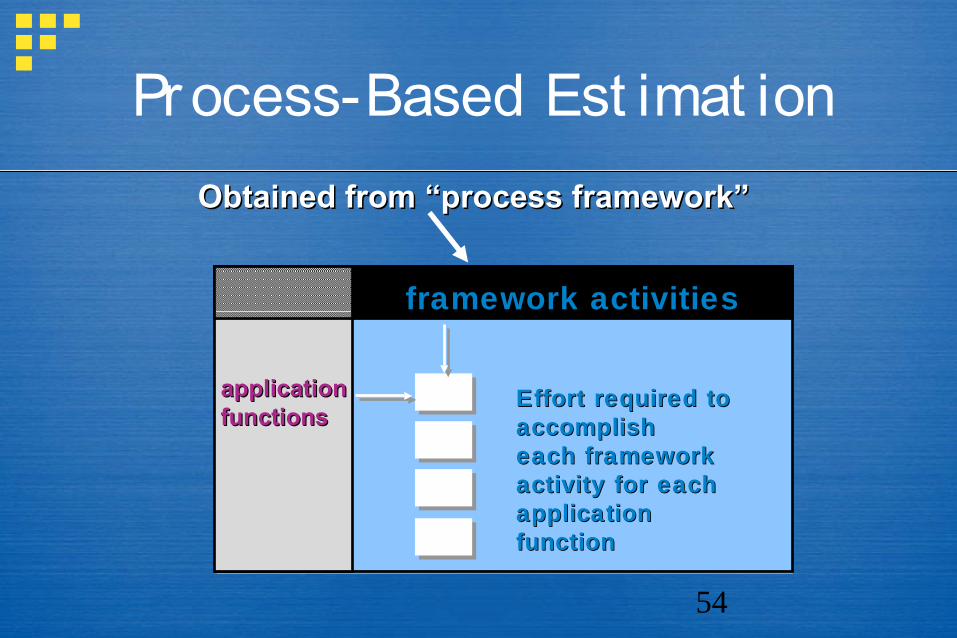
Pr ocess-Based Est imat ionObtained from “process framework”Obtained from “process framework”
applicationapplicationfunctionsfunctions
framework activitiesframework activities
Effort required to Effort required to accomplishaccomplisheach framework each framework activity for each activity for each application application functionfunction
55
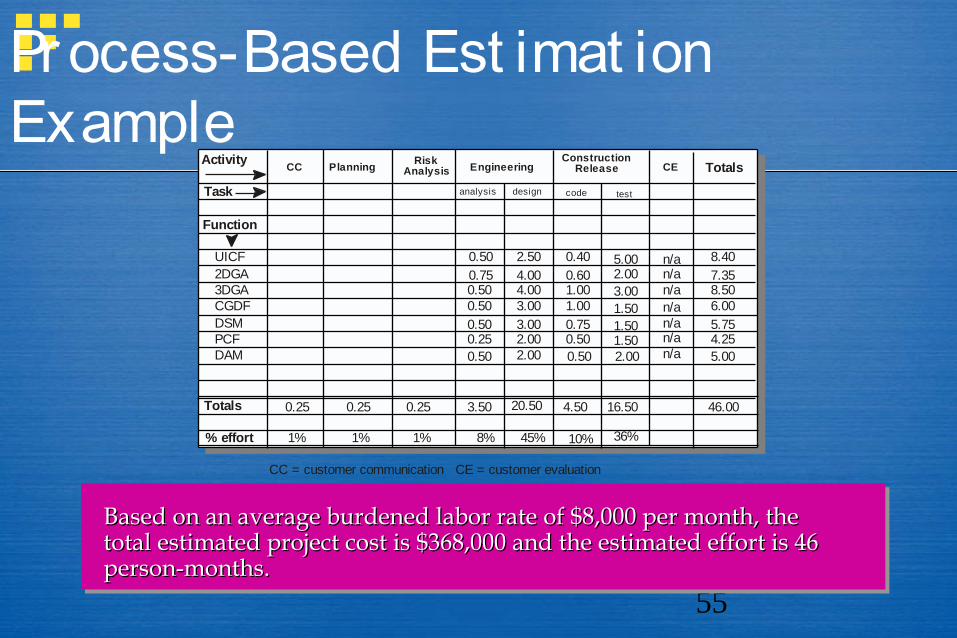
Pr ocess-Based Est imat ion Example
Activity
Task
Function
UICF2DGA3DGA
DSMPCF
CGDF
DAM
Totals
% effort
CC PlanningRisk
Analysis EngineeringConstruction
Release TotalsCE
analysis design code test
0.25 0.25 0.25 3.50 20.50 4.50 16.50 46.00
1% 1% 1% 8% 45% 10% 36%
CC = customer communication CE = customer evaluation
0.500.750.500.500.500.25
2.504.004.003.003.002.00
0.400.601.001.000.750.50
5.002.003.001.501.501.50
8.407.358.506.005.754.25
0.50 2.00 0.50 2.00 5.00
n/an/an/an/an/an/an/a
Based on an average burdened labor rate of $8,000 per month, the Based on an average burdened labor rate of $8,000 per month, the total estimated project cost is $368,000 and the estimated effort is 46 total estimated project cost is $368,000 and the estimated effort is 46 person-months.person-months.
56
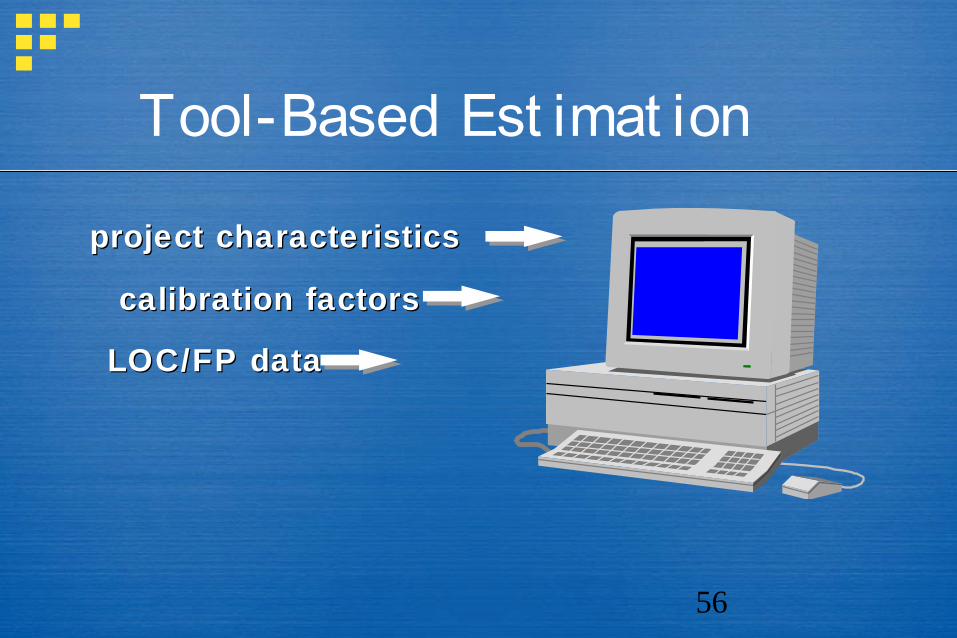
Tool-Based Est imat ion
project characteristicsproject characteristics
calibration factorscalibration factors
LOC/FP dataLOC/FP data
57
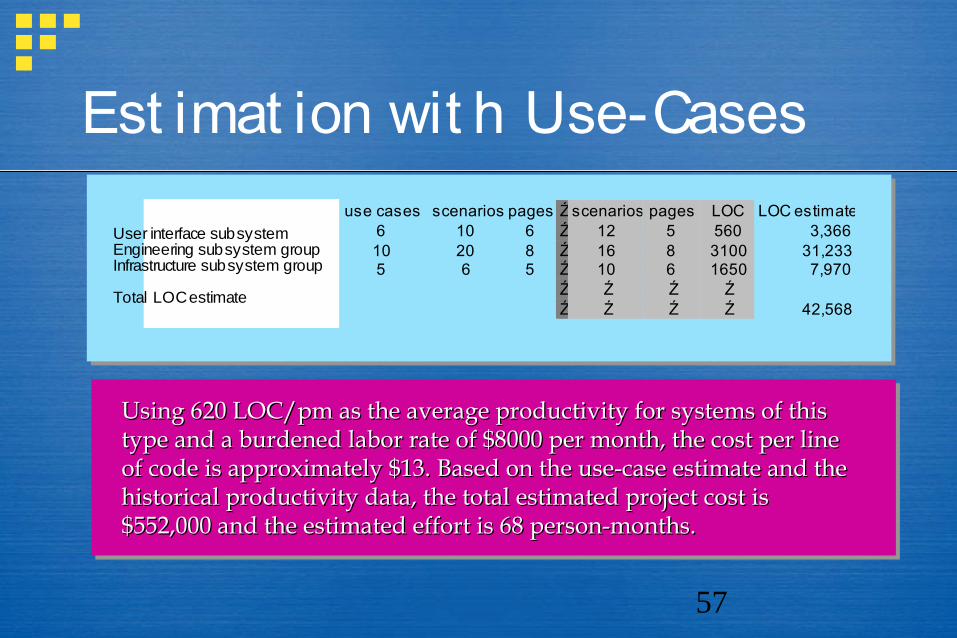
Est imat ion wit h Use-Casesuse cases scenarios pages Ź scenarios pages LOC LOC estimate
e subsystem 6 10 6 Ź 12 5 560 3,366subsystem group 10 20 8 Ź 16 8 3100 31,233e subsystem group 5 6 5 Ź 10 6 1650 7,970
Ź Ź Ź Źstimate Ź Ź Ź Ź 42,568
User interface subsystem Engineering subsystem group Infrastructure subsystem group
Total LOC estimate
Using 620 LOC/pm as the average productivity for systems of this Using 620 LOC/pm as the average productivity for systems of this type and a burdened labor rate of $8000 per month, the cost per line type and a burdened labor rate of $8000 per month, the cost per line of code is approximately $13. Based on the use-case estimate and the of code is approximately $13. Based on the use-case estimate and the historical productivity data, the total estimated project cost is historical productivity data, the total estimated project cost is $552,000 and the estimated effort is 68 person-months.$552,000 and the estimated effort is 68 person-months.
58
Empir ical Est imat ion Models
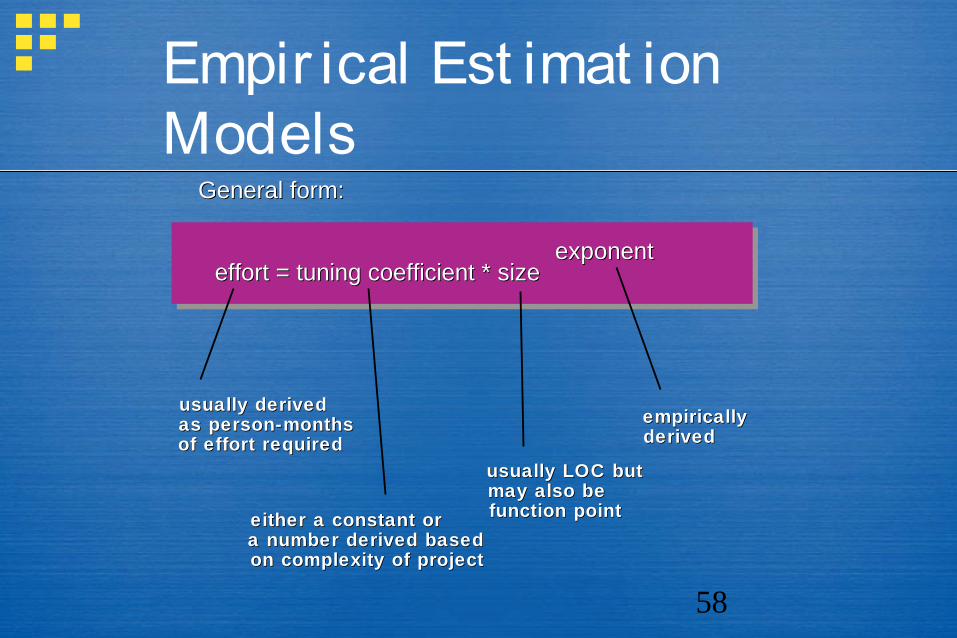
General form:General form:
effort = tuning coefficient * sizeeffort = tuning coefficient * sizeexponentexponent
usually derivedusually derivedas person-monthsas person-monthsof effort requiredof effort required
either a constant oreither a constant ora number derived based a number derived based on complexity of projecton complexity of project
usually LOC butusually LOC butmay also bemay also befunction pointfunction point
empiricallyempiricallyderivedderived
59
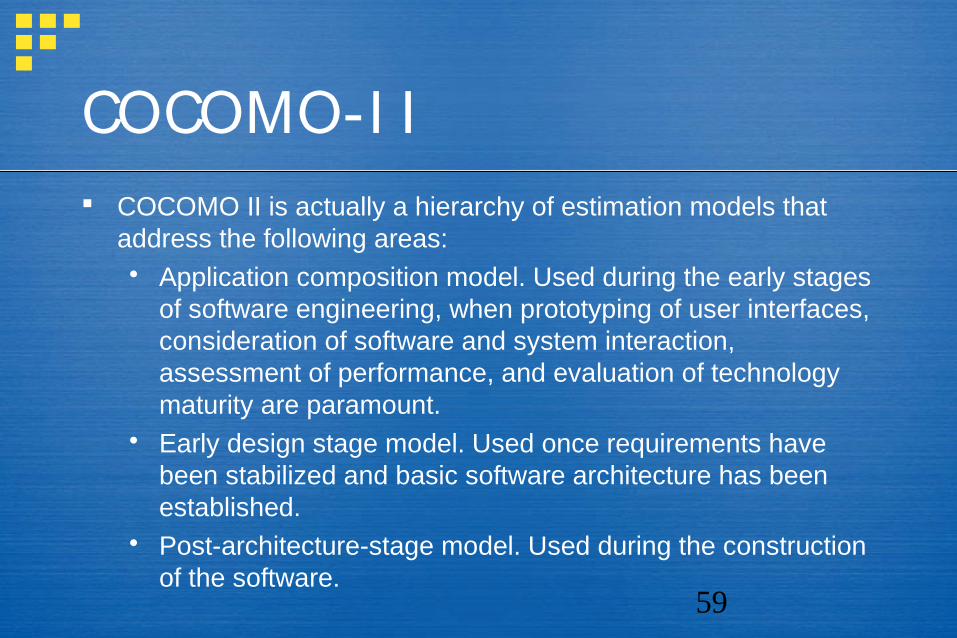
COCOMO-I I COCOMO II is actually a hierarchy of estimation models that
address the following areas: Application composition model. Used during the early stages
of software engineering, when prototyping of user interfaces, consideration of software and system interaction, assessment of performance, and evaluation of technology maturity are paramount.
Early design stage model. Used once requirements have been stabilized and basic software architecture has been established.
Post-architecture-stage model. Used during the construction of the software.
60
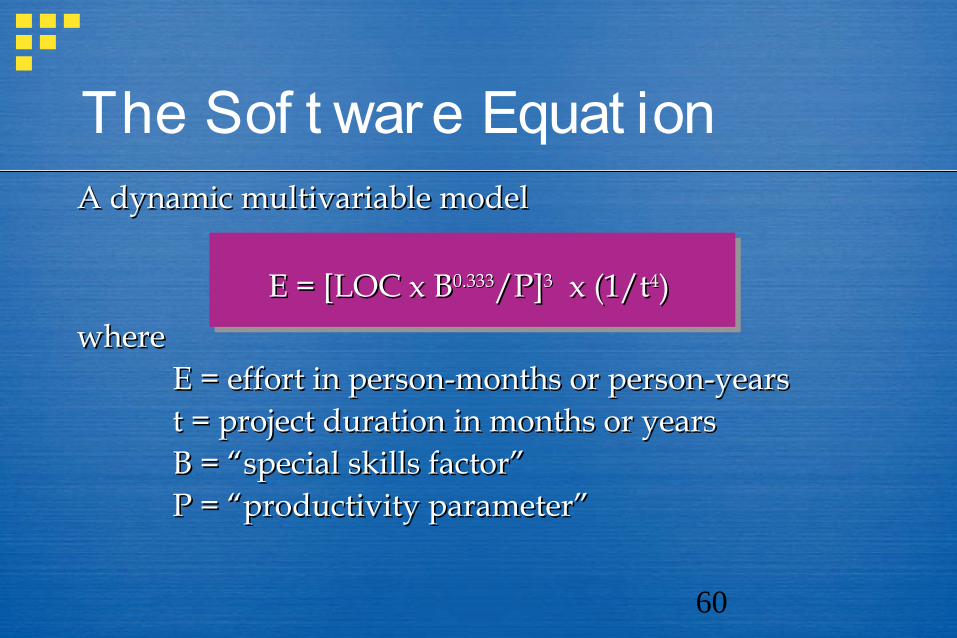
The Sof t war e Equat ionA dynamic multivariable modelA dynamic multivariable model
E = [LOC x BE = [LOC x B0.3330.333/P]/P]33 x (1/t x (1/t44))
where where E = effort in person-months or person-yearsE = effort in person-months or person-yearst = project duration in months or yearst = project duration in months or yearsB = “special skills factor”B = “special skills factor”P = “productivity parameter”P = “productivity parameter”
61
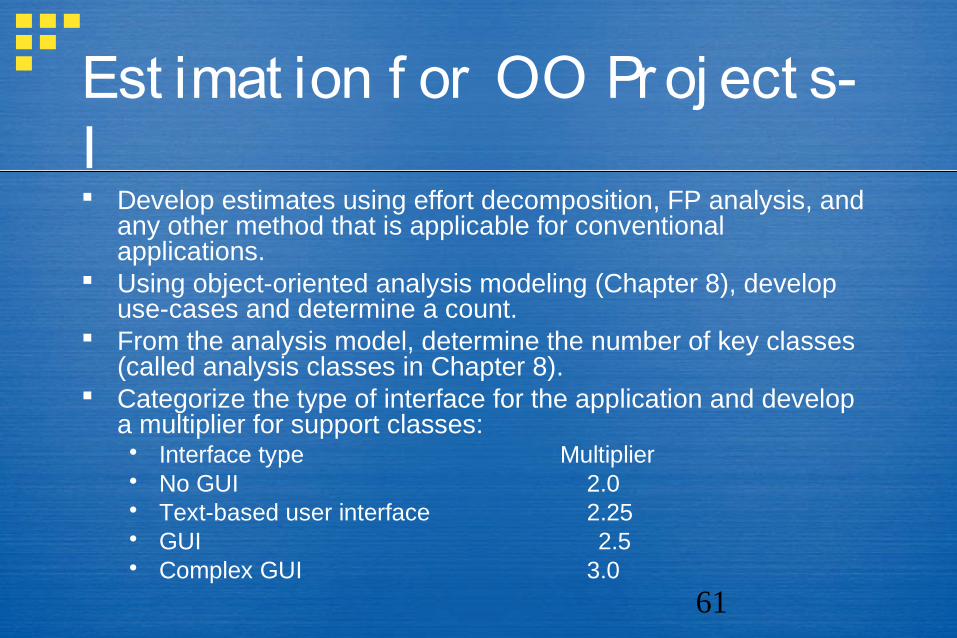
Est imat ion f or OO Pr oj ect s-I Develop estimates using effort decomposition, FP analysis, and
any other method that is applicable for conventional applications.
Using object-oriented analysis modeling (Chapter 8), develop use-cases and determine a count.
From the analysis model, determine the number of key classes (called analysis classes in Chapter 8).
Categorize the type of interface for the application and develop a multiplier for support classes: Interface type Multiplier No GUI 2.0 Text-based user interface 2.25 GUI 2.5 Complex GUI 3.0
62
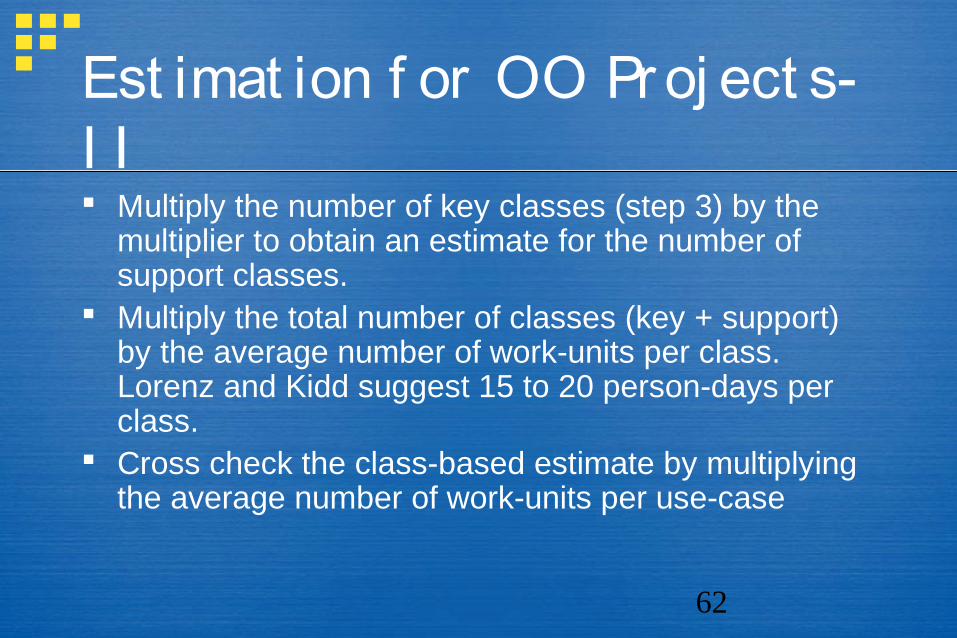
Est imat ion f or OO Pr oj ect s-I I Multiply the number of key classes (step 3) by the
multiplier to obtain an estimate for the number of support classes.
Multiply the total number of classes (key + support) by the average number of work-units per class. Lorenz and Kidd suggest 15 to 20 person-days per class.
Cross check the class-based estimate by multiplying the average number of work-units per use-case
63
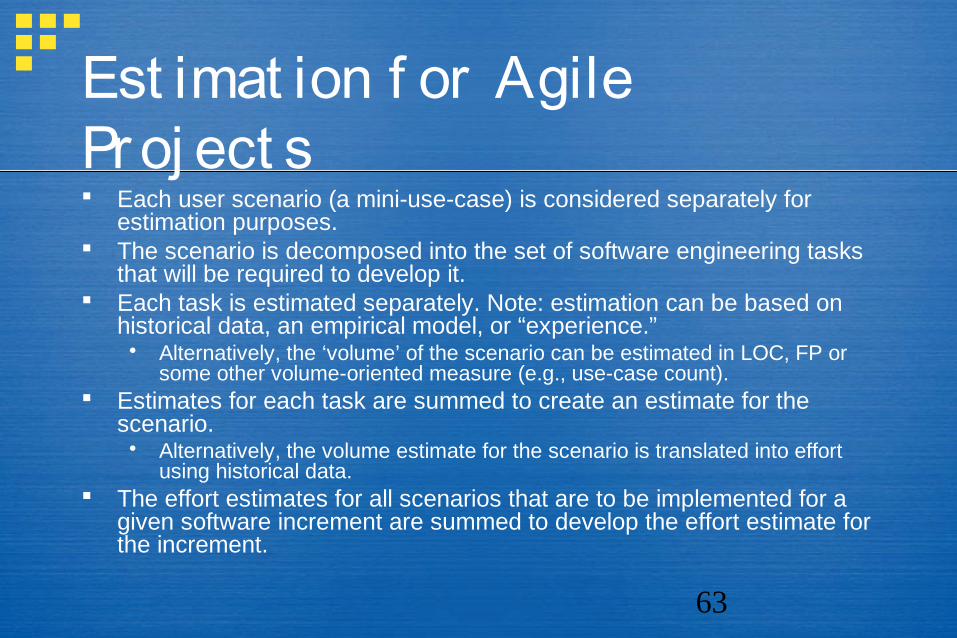
Est imat ion f or Agile Pr oj ect s Each user scenario (a mini-use-case) is considered separately for
estimation purposes. The scenario is decomposed into the set of software engineering tasks
that will be required to develop it. Each task is estimated separately. Note: estimation can be based on
historical data, an empirical model, or “experience.” Alternatively, the ‘volume’ of the scenario can be estimated in LOC, FP or
some other volume-oriented measure (e.g., use-case count). Estimates for each task are summed to create an estimate for the
scenario. Alternatively, the volume estimate for the scenario is translated into effort
using historical data. The effort estimates for all scenarios that are to be implemented for a
given software increment are summed to develop the effort estimate for the increment.
64
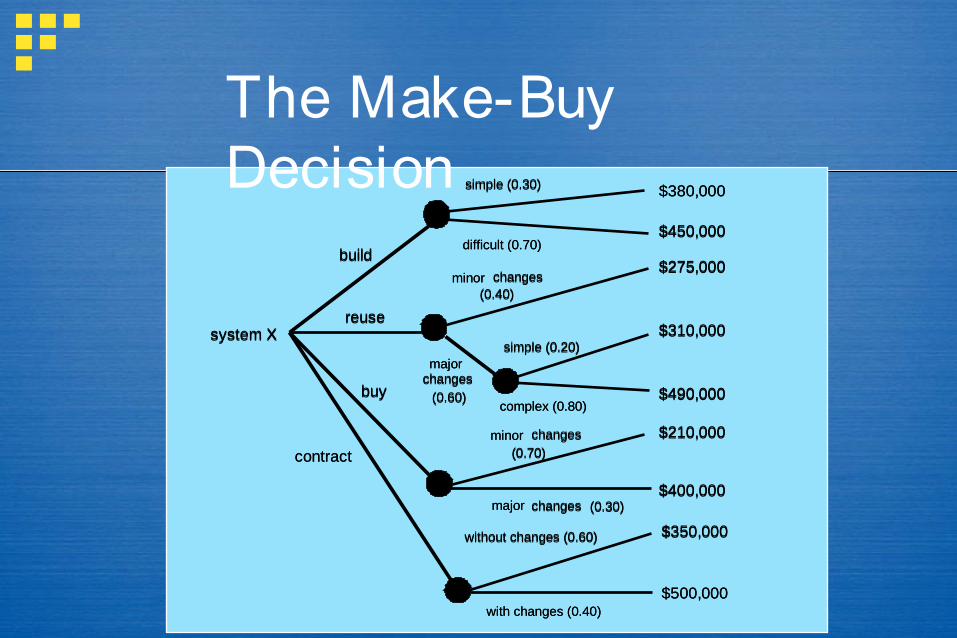
The Make-Buy Decision
system Xsystem Xreusereuse
simple (0.30)simple (0.30)
difficult (0.70)difficult (0.70)
minorminor changeschanges(0.40)(0.40)
majormajorchangeschanges
(0.60)(0.60)
simple (0.20)simple (0.20)
complex (0.80)complex (0.80)
majormajor changeschanges (0.30)(0.30)
minorminor changeschanges
(0.70)(0.70)
$380,000$380,000
$450,000$450,000
$275,000$275,000
$310,000$310,000
$490,000$490,000
$210,000$210,000
$400,000$400,000
buybuy
contractcontract
without changes (0.60)without changes (0.60)
with changes (0.40)with changes (0.40)
$350,000$350,000
$500,000$500,000
buildbuild
65
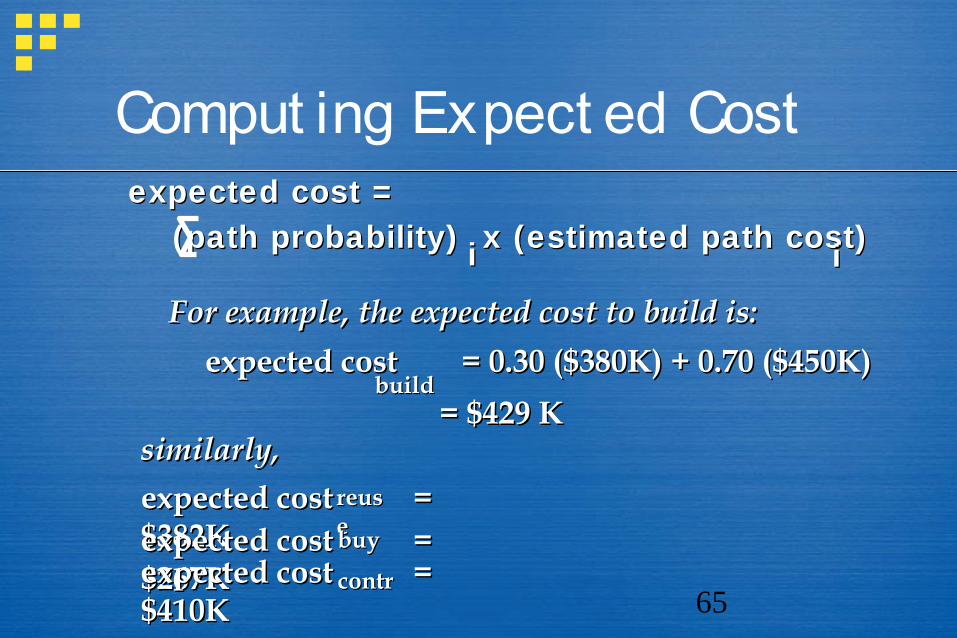
Comput ing Expect ed Cost
(path probability) x (estimated path cost) (path probability) x (estimated path cost) ii ii
For example, the expected cost to build is:For example, the expected cost to build is:
expected cost = 0.30 ($380K) + 0.70 ($450K) expected cost = 0.30 ($380K) + 0.70 ($450K)
similarly,similarly,
expected cost = expected cost = $382K$382Kexpected cost = expected cost = $267K$267Kexpected cost = expected cost = $410K$410K
buildbuild
reusreuseebuybuy
contrcontr
expected cost =expected cost =
= $429 K= $429 K