managing risk in the oil industry: credit and supply chain ... · 3. permission to reprint or...
TRANSCRIPT
Permission to reprint or distribute any content from this presentation requires the prior written approval of S&P Capital IQ. Not for distribution to the public.
Copyright © 2013 Standard & Poor’s Financial Services LLC, a subsidiary of The McGraw-Hill Companies, Inc. All rights reserved.
Managing Risk In The Oil Industry: Credit
And Supply Chain Management
Gustavo Tella, CFA, FRM
Head of EMEA Application Specialists
S&P Capital IQ
Platts Crude Oil Summit
London, May 14, 2013
2. Permission to reprint or distribute any content from this presentation requires the prior written approval of S&P Capital IQ. Not for distribution to the public.
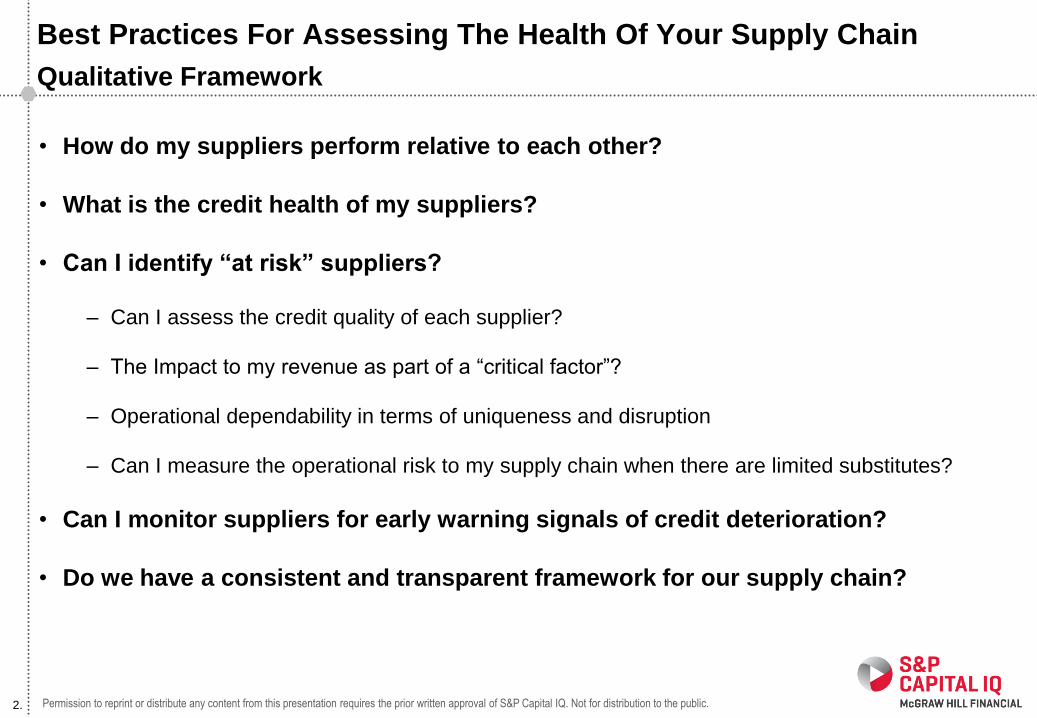
• How do my suppliers perform relative to each other?
• What is the credit health of my suppliers?
• Can I identify ―at risk‖ suppliers?
– Can I assess the credit quality of each supplier?
– The Impact to my revenue as part of a “critical factor”?
– Operational dependability in terms of uniqueness and disruption
– Can I measure the operational risk to my supply chain when there are limited substitutes?
• Can I monitor suppliers for early warning signals of credit deterioration?
• Do we have a consistent and transparent framework for our supply chain?
Best Practices For Assessing The Health Of Your Supply Chain
Qualitative Framework
3. Permission to reprint or distribute any content from this presentation requires the prior written approval of S&P Capital IQ. Not for distribution to the public.
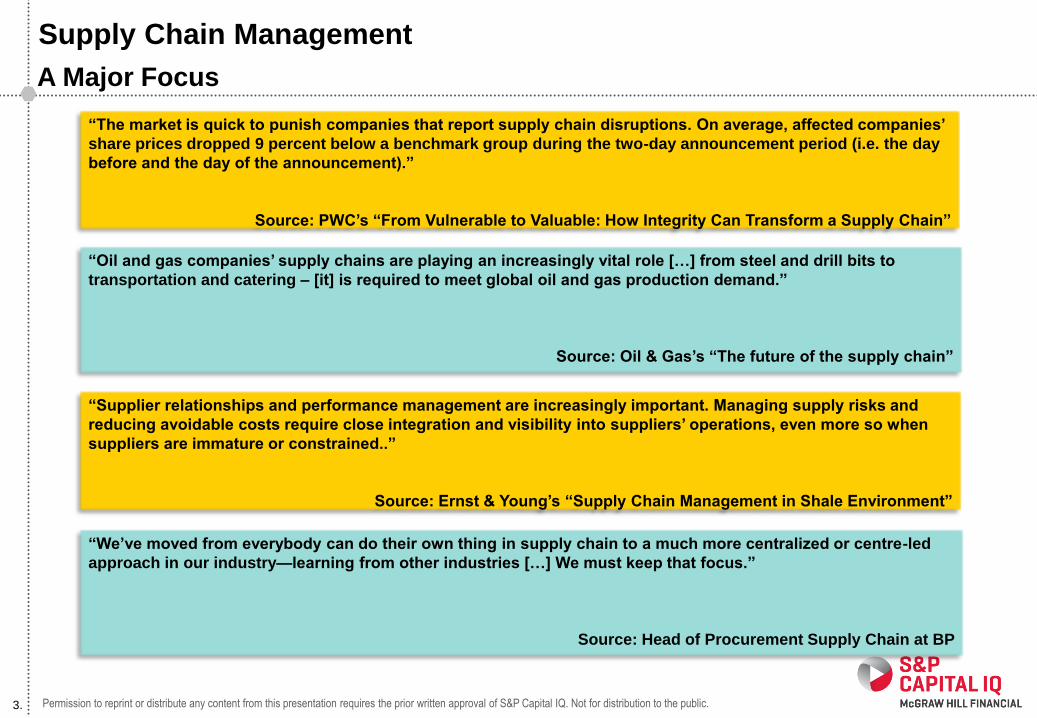
Supply Chain Management
A Major Focus
―Supplier relationships and performance management are increasingly important. Managing supply risks and
reducing avoidable costs require close integration and visibility into suppliers‘ operations, even more so when
suppliers are immature or constrained..‖
Source: Ernst & Young‘s ―Supply Chain Management in Shale Environment‖
―The market is quick to punish companies that report supply chain disruptions. On average, affected companies‘
share prices dropped 9 percent below a benchmark group during the two-day announcement period (i.e. the day
before and the day of the announcement).‖
Source: PWC‘s ―From Vulnerable to Valuable: How Integrity Can Transform a Supply Chain‖
―We‘ve moved from everybody can do their own thing in supply chain to a much more centralized or centre-led
approach in our industry—learning from other industries […] We must keep that focus.‖
Source: Head of Procurement Supply Chain at BP
―Oil and gas companies‘ supply chains are playing an increasingly vital role […] from steel and drill bits to
transportation and catering – [it] is required to meet global oil and gas production demand.‖
Source: Oil & Gas‘s ―The future of the supply chain‖

4. Permission to reprint or distribute any content from this presentation requires the prior written approval of S&P Capital IQ. Not for distribution to the public.
Accuracy
Coverage
RATED UNIVERSE
• Credit analysis driven by
qualitative and quantitative
inputs
PUBLIC UNRATED UNIVERSE
• Credit analysis driven by
fundamentals-based relative
analysis
• Supplemented by absolute
measures
PRIVATE UNRATED UNIVERSE
• Credit analysis driven by user
inputs to models
The Problem: Analysis Beyond The Rated Universe
The Coverage/Accuracy Tradeoff
5. Permission to reprint or distribute any content from this presentation requires the prior written approval of S&P Capital IQ. Not for distribution to the public.
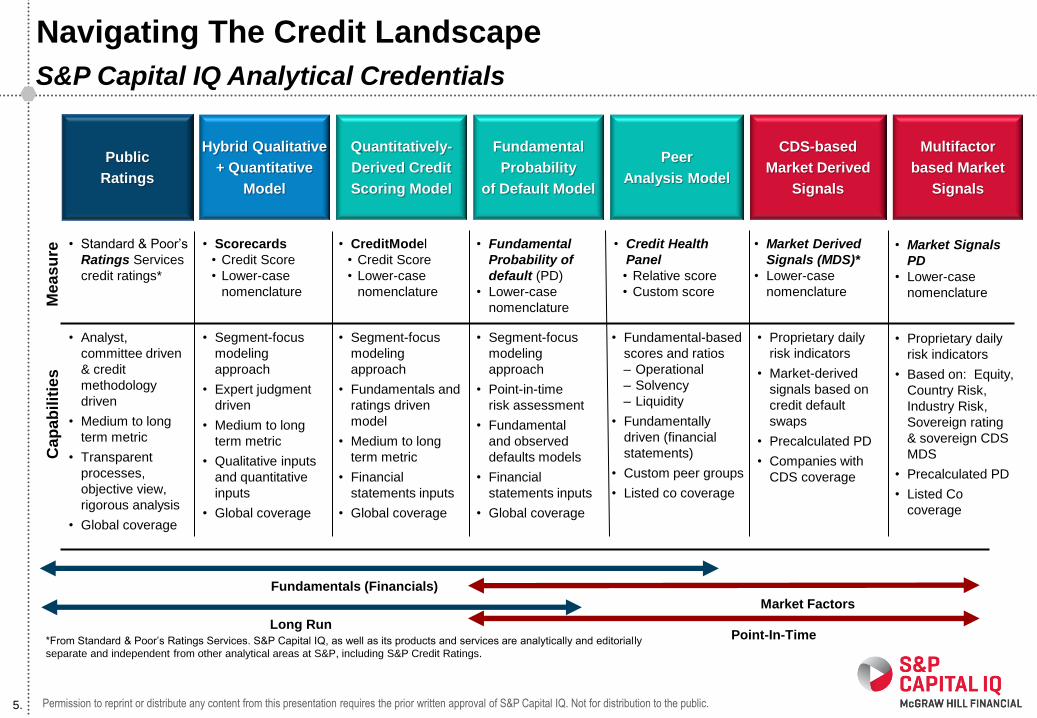
Navigating The Credit Landscape
*From Standard & Poor’s Ratings Services. S&P Capital IQ, as well as its products and services are analytically and editorially
separate and independent from other analytical areas at S&P, including S&P Credit Ratings.
Public
Ratings
Hybrid Qualitative
+ Quantitative
Model
Peer
Analysis Model
Fundamental
Probability
of Default Model
CDS-based
Market Derived
Signals
Fundamentals (Financials)
Market Factors
Long Run Point-In-Time
• Standard & Poor’s
Ratings Services
credit ratings*
• Scorecards
• Credit Score
• Lower-case
nomenclature
• Credit Health
Panel
• Relative score
• Custom score
• Market Derived
Signals (MDS)*
• Lower-case
nomenclature
Me
as
ure
• Proprietary daily
risk indicators
• Market-derived
signals based on
credit default
swaps
• Precalculated PD
• Companies with
CDS coverage
• Analyst,
committee driven
& credit
methodology
driven
• Medium to long
term metric
• Transparent
processes,
objective view,
rigorous analysis
• Global coverage
• Segment-focus
modeling
approach
• Expert judgment
driven
• Medium to long
term metric
• Qualitative inputs
and quantitative
inputs
• Global coverage
• Fundamental-based
scores and ratios
– Operational
– Solvency
– Liquidity
• Fundamentally
driven (financial
statements)
• Custom peer groups
• Listed co coverage
• Segment-focus
modeling
approach
• Point-in-time
risk assessment
• Fundamental
and observed
defaults models
• Financial
statements inputs
• Global coverage
Cap
ab
ilit
ies
• Fundamental
Probability of
default (PD)
• Lower-case
nomenclature
Multifactor
based Market
Signals
• Market Signals
PD
• Lower-case
nomenclature
• Proprietary daily
risk indicators
• Based on: Equity,
Country Risk,
Industry Risk,
Sovereign rating
& sovereign CDS
MDS
• Precalculated PD
• Listed Co
coverage
Quantitatively-
Derived Credit
Scoring Model
• CreditModel
• Credit Score
• Lower-case
nomenclature
• Segment-focus
modeling
approach
• Fundamentals and
ratings driven
model
• Medium to long
term metric
• Financial
statements inputs
• Global coverage
S&P Capital IQ Analytical Credentials
6. Permission to reprint or distribute any content from this presentation requires the prior written approval of S&P Capital IQ. Not for distribution to the public.
Assessing Supply Chain Risk: BP Case Study
7. Permission to reprint or distribute any content from this presentation requires the prior written approval of S&P Capital IQ. Not for distribution to the public.
Fundamentals Based Peer Analysis:
BP European Suppliers
Industry: Energy
• 54 suppliers in Europe: 43 unrated, 11 rated by Standard & Poor‘s Rating
Services
• Unrated companies have limited information compared to rated, therefore
they need to be assessed in a different manner and from a different
perspective:
– Monitoring changes in suppliers’ financial strength and credit quality
– Relative peer analysis of BP’s Energy suppliers
– Credit Scoring Models, Stress Testing, and Probability of Default evaluation
highlights the level of risk in BP’s supply chain
Supplier Credit Assessment
8. Permission to reprint or distribute any content from this presentation requires the prior written approval of S&P Capital IQ. Not for distribution to the public.
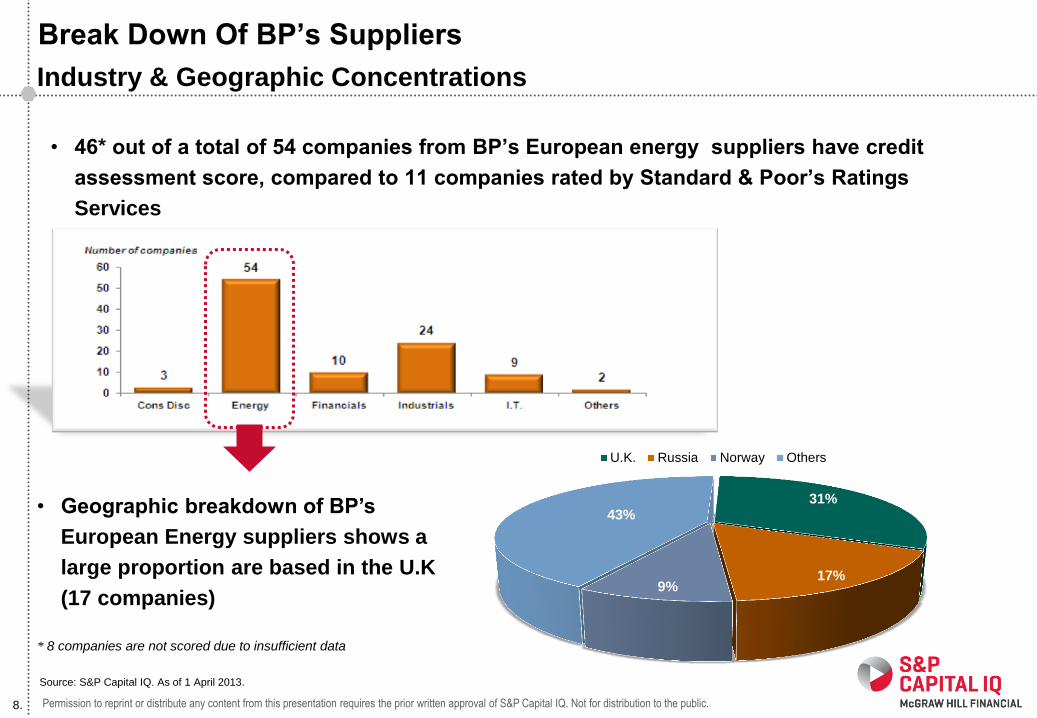
Break Down Of BP‘s Suppliers
• 46* out of a total of 54 companies from BP‘s European energy suppliers have credit
assessment score, compared to 11 companies rated by Standard & Poor‘s Ratings
Services
Industry & Geographic Concentrations
• Geographic breakdown of BP‘s
European Energy suppliers shows a
large proportion are based in the U.K
(17 companies)
31%
17% 9%
43%
U.K. Russia Norway Others
* 8 companies are not scored due to insufficient data
Source: S&P Capital IQ. As of 1 April 2013.
9. Permission to reprint or distribute any content from this presentation requires the prior written approval of S&P Capital IQ. Not for distribution to the public.
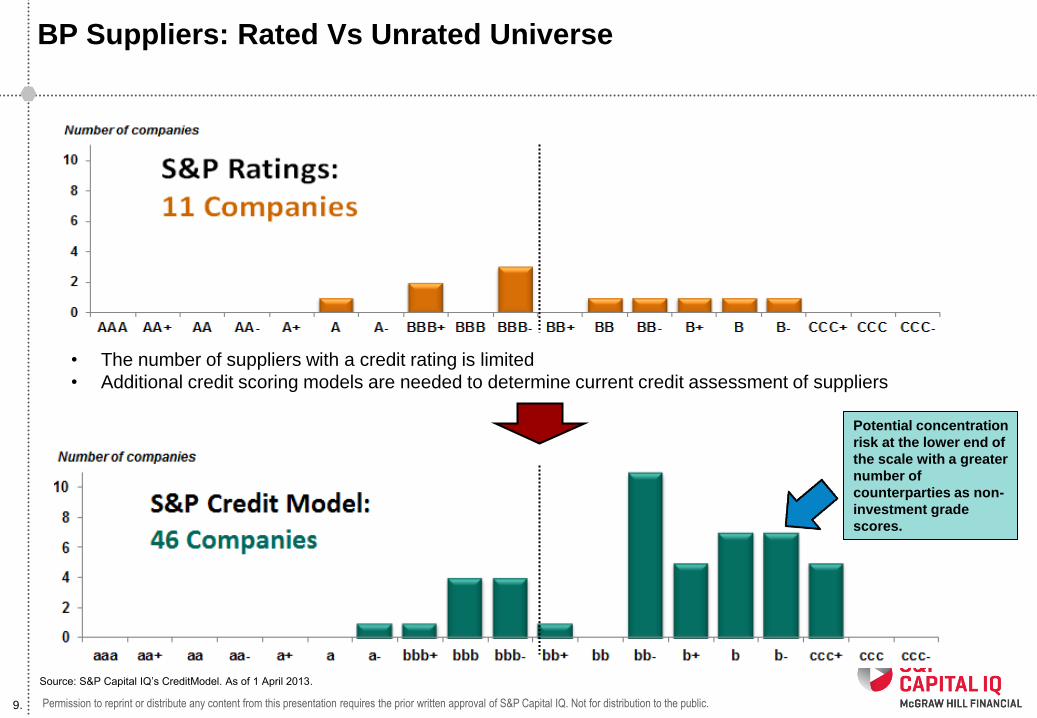
BP Suppliers: Rated Vs Unrated Universe
• The number of suppliers with a credit rating is limited
• Additional credit scoring models are needed to determine current credit assessment of suppliers
Potential concentration
risk at the lower end of
the scale with a greater
number of
counterparties as non-
investment grade
scores.
Source: S&P Capital IQ’s CreditModel. As of 1 April 2013.
10. Permission to reprint or distribute any content from this presentation requires the prior written approval of S&P Capital IQ. Not for distribution to the public.
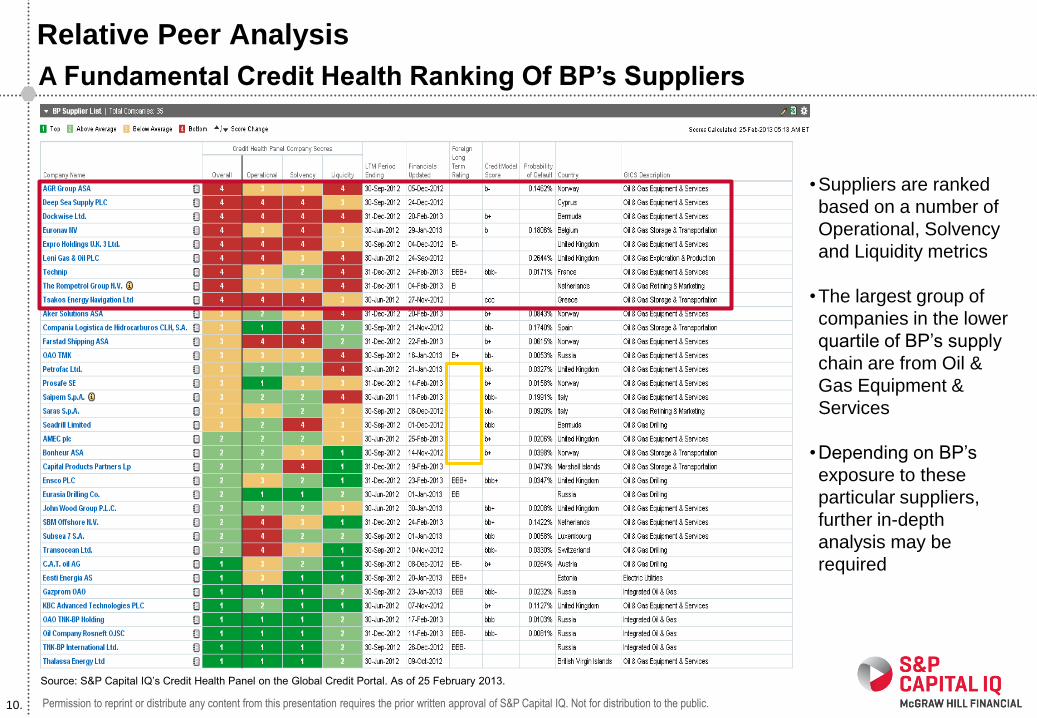
Relative Peer Analysis
A Fundamental Credit Health Ranking Of BP‘s Suppliers
•Suppliers are ranked
based on a number of
Operational, Solvency
and Liquidity metrics
•The largest group of
companies in the lower
quartile of BP’s supply
chain are from Oil &
Gas Equipment &
Services
•Depending on BP’s
exposure to these
particular suppliers,
further in-depth
analysis may be
required
Source: S&P Capital IQ’s Credit Health Panel on the Global Credit Portal. As of 25 February 2013.
11. Permission to reprint or distribute any content from this presentation requires the prior written approval of S&P Capital IQ. Not for distribution to the public.
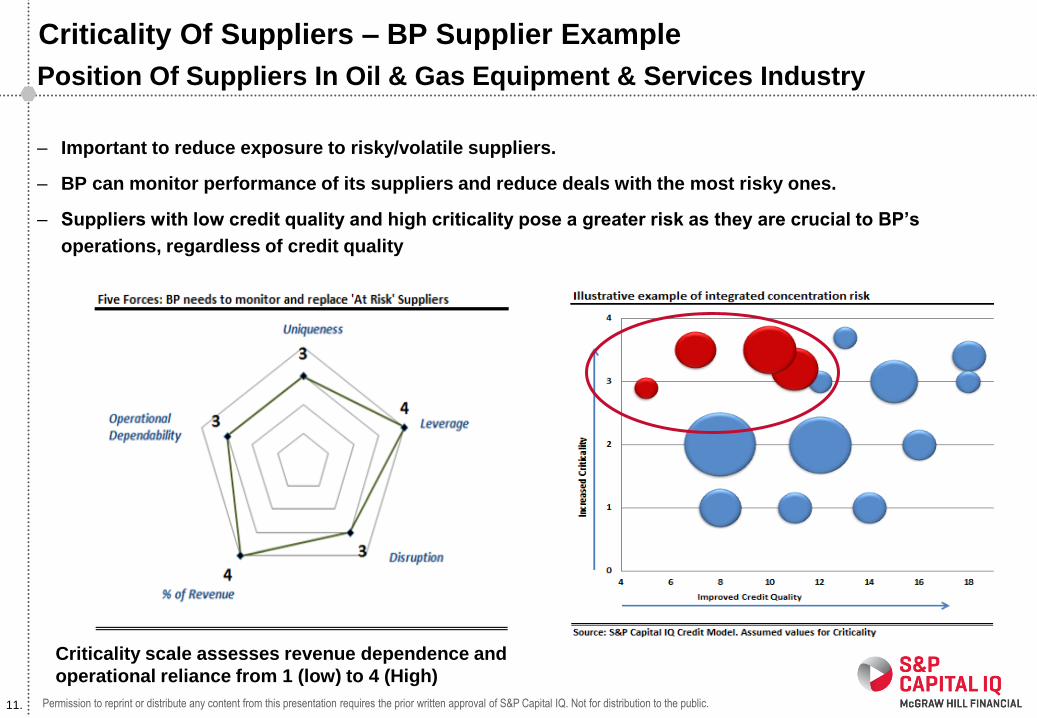
Criticality Of Suppliers – BP Supplier Example
– Important to reduce exposure to risky/volatile suppliers.
– BP can monitor performance of its suppliers and reduce deals with the most risky ones.
– Suppliers with low credit quality and high criticality pose a greater risk as they are crucial to BP‘s
operations, regardless of credit quality
Position Of Suppliers In Oil & Gas Equipment & Services Industry
Criticality scale assesses revenue dependence and
operational reliance from 1 (low) to 4 (High)
12. Permission to reprint or distribute any content from this presentation requires the prior written approval of S&P Capital IQ. Not for distribution to the public.
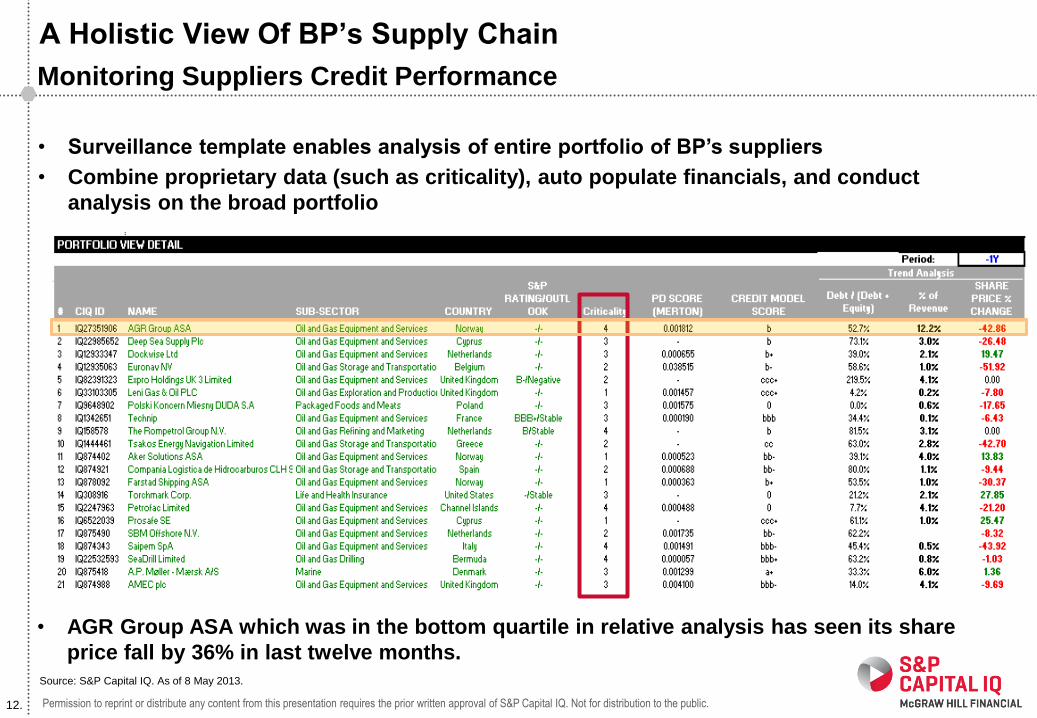
A Holistic View Of BP‘s Supply Chain
Monitoring Suppliers Credit Performance
• Surveillance template enables analysis of entire portfolio of BP‘s suppliers
• Combine proprietary data (such as criticality), auto populate financials, and conduct
analysis on the broad portfolio
• AGR Group ASA which was in the bottom quartile in relative analysis has seen its share
price fall by 36% in last twelve months.
Source: S&P Capital IQ. As of 8 May 2013.
13. Permission to reprint or distribute any content from this presentation requires the prior written approval of S&P Capital IQ. Not for distribution to the public.
Supplier Credit Surveillance Example: AGR Group ASA
14. Permission to reprint or distribute any content from this presentation requires the prior written approval of S&P Capital IQ. Not for distribution to the public.
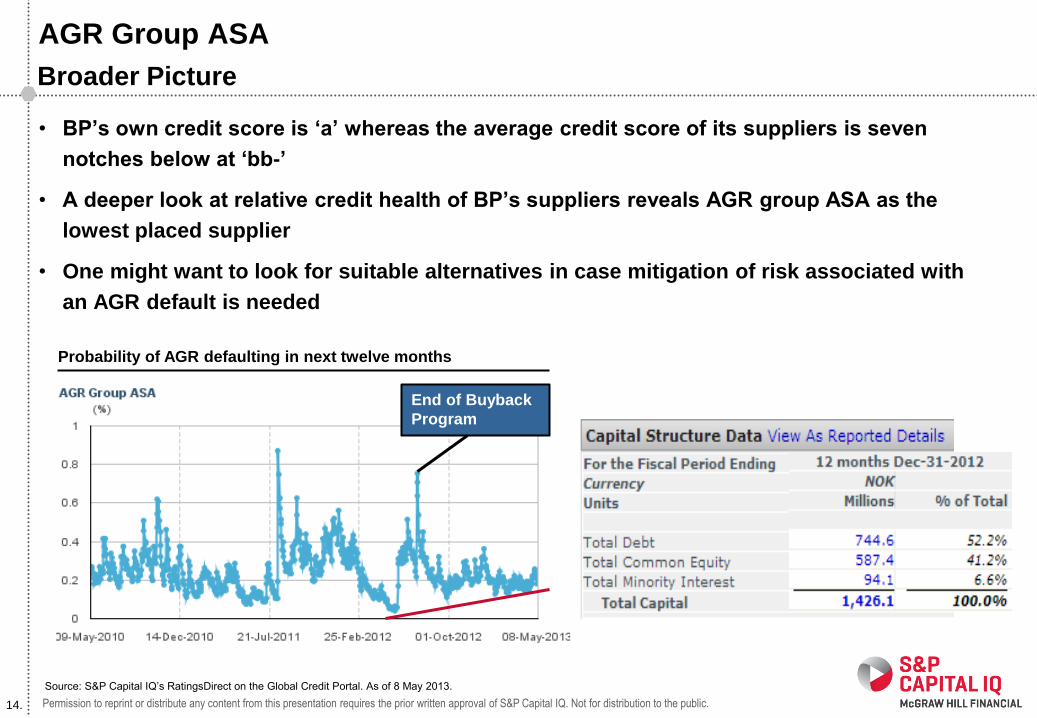
AGR Group ASA
• BP‘s own credit score is ‗a‘ whereas the average credit score of its suppliers is seven
notches below at ‗bb-‘
• A deeper look at relative credit health of BP‘s suppliers reveals AGR group ASA as the
lowest placed supplier
• One might want to look for suitable alternatives in case mitigation of risk associated with
an AGR default is needed
Probability of AGR defaulting in next twelve months
Source: S&P Capital IQ’s RatingsDirect on the Global Credit Portal. As of 8 May 2013.
Broader Picture
End of Buyback
Program
15. Permission to reprint or distribute any content from this presentation requires the prior written approval of S&P Capital IQ. Not for distribution to the public.
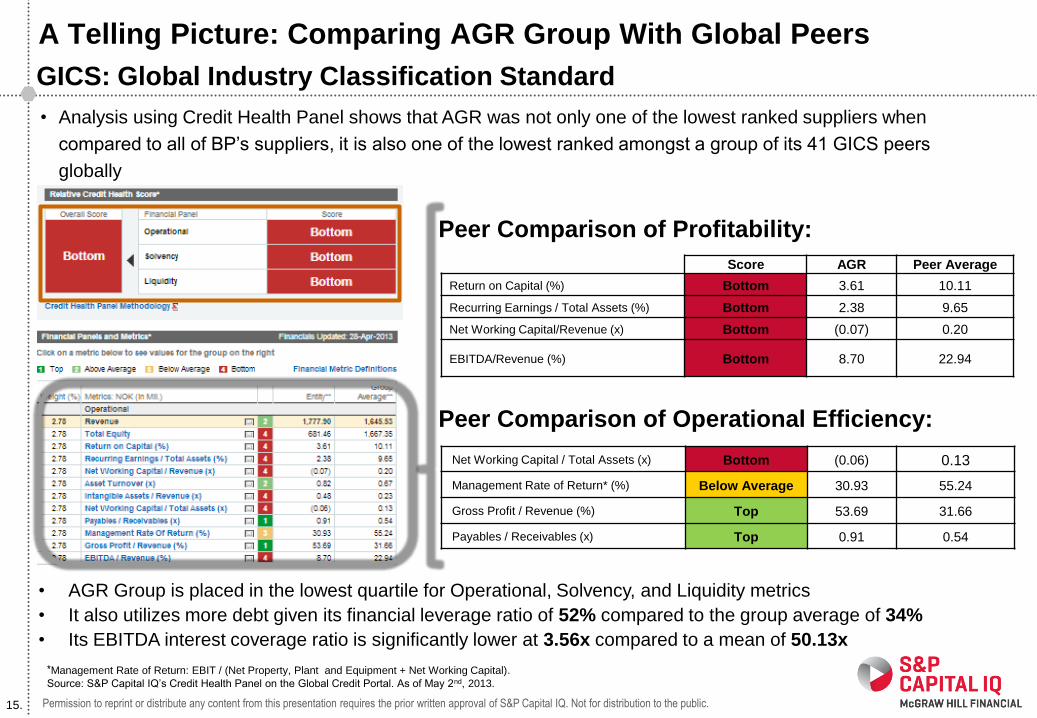
A Telling Picture: Comparing AGR Group With Global Peers
Score AGR Peer Average
Return on Capital (%) Bottom 3.61 10.11
Recurring Earnings / Total Assets (%) Bottom 2.38 9.65
Net Working Capital/Revenue (x) Bottom (0.07) 0.20
EBITDA/Revenue (%) Bottom 8.70 22.94
Net Working Capital / Total Assets (x) Bottom (0.06) 0.13
Management Rate of Return* (%) Below Average 30.93 55.24
Gross Profit / Revenue (%) Top 53.69 31.66
Payables / Receivables (x) Top 0.91 0.54
Peer Comparison of Profitability:
Peer Comparison of Operational Efficiency:
• Analysis using Credit Health Panel shows that AGR was not only one of the lowest ranked suppliers when
compared to all of BP’s suppliers, it is also one of the lowest ranked amongst a group of its 41 GICS peers
globally
• AGR Group is placed in the lowest quartile for Operational, Solvency, and Liquidity metrics
• It also utilizes more debt given its financial leverage ratio of 52% compared to the group average of 34%
• Its EBITDA interest coverage ratio is significantly lower at 3.56x compared to a mean of 50.13x
*Management Rate of Return: EBIT / (Net Property, Plant and Equipment + Net Working Capital).
Source: S&P Capital IQ’s Credit Health Panel on the Global Credit Portal. As of May 2nd, 2013.
GICS: Global Industry Classification Standard
16. Permission to reprint or distribute any content from this presentation requires the prior written approval of S&P Capital IQ. Not for distribution to the public.
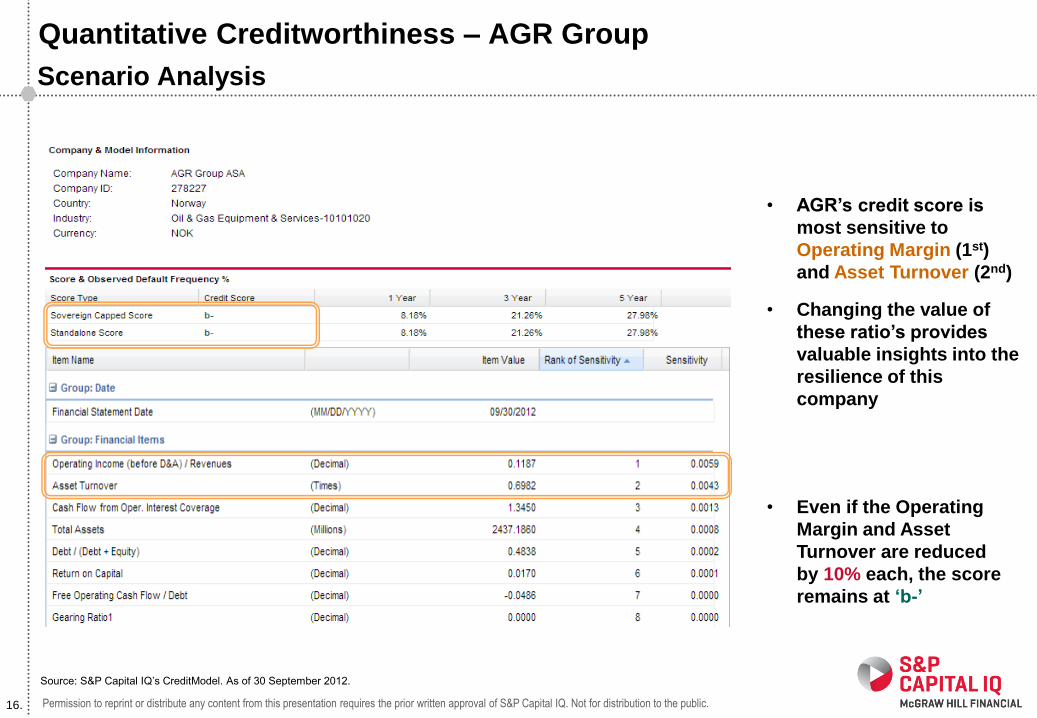
Quantitative Creditworthiness – AGR Group
• AGR‘s credit score is
most sensitive to
Operating Margin (1st)
and Asset Turnover (2nd)
• Changing the value of
these ratio‘s provides
valuable insights into the
resilience of this
company
Scenario Analysis
• Even if the Operating
Margin and Asset
Turnover are reduced
by 10% each, the score
remains at ‗b-‘
Source: S&P Capital IQ’s CreditModel. As of 30 September 2012.
17. Permission to reprint or distribute any content from this presentation requires the prior written approval of S&P Capital IQ. Not for distribution to the public.
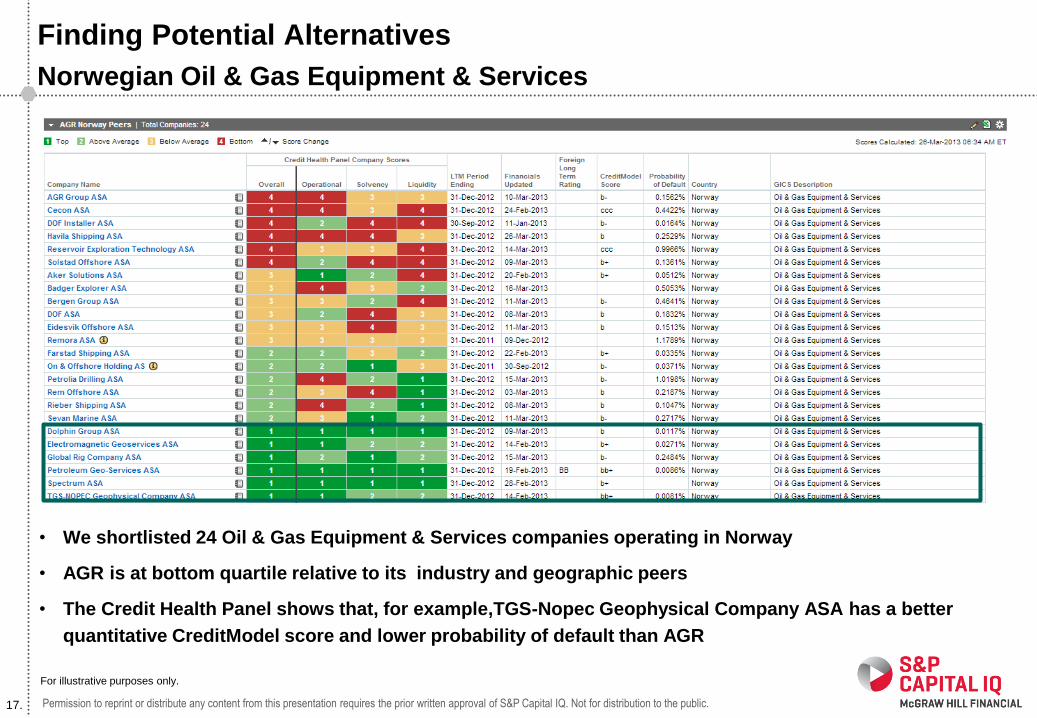
Finding Potential Alternatives
• We shortlisted 24 Oil & Gas Equipment & Services companies operating in Norway
• AGR is at bottom quartile relative to its industry and geographic peers
• The Credit Health Panel shows that, for example,TGS-Nopec Geophysical Company ASA has a better
quantitative CreditModel score and lower probability of default than AGR
Norwegian Oil & Gas Equipment & Services
For illustrative purposes only.
18. Permission to reprint or distribute any content from this presentation requires the prior written approval of S&P Capital IQ. Not for distribution to the public.
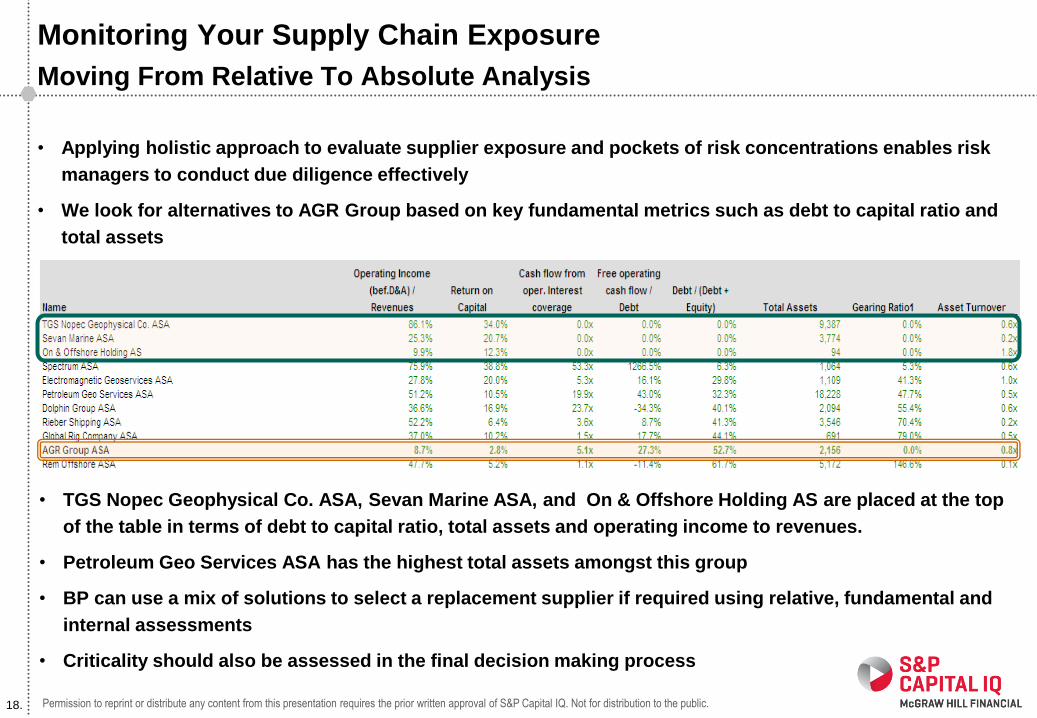
Monitoring Your Supply Chain Exposure
• Applying holistic approach to evaluate supplier exposure and pockets of risk concentrations enables risk
managers to conduct due diligence effectively
• We look for alternatives to AGR Group based on key fundamental metrics such as debt to capital ratio and
total assets
Moving From Relative To Absolute Analysis
• TGS Nopec Geophysical Co. ASA, Sevan Marine ASA, and On & Offshore Holding AS are placed at the top
of the table in terms of debt to capital ratio, total assets and operating income to revenues.
• Petroleum Geo Services ASA has the highest total assets amongst this group
• BP can use a mix of solutions to select a replacement supplier if required using relative, fundamental and
internal assessments
• Criticality should also be assessed in the final decision making process
19. Permission to reprint or distribute any content from this presentation requires the prior written approval of S&P Capital IQ. Not for distribution to the public.
Summary And Uses Of BP‘s Supply Chain Risk Management
• Out of BP‘s 54 European Suppliers in Energy industry, only 11 are currently rated. This
requires using other risk assessment metrics to evaluate financial strength of suppliers
• Using quantitatively driven models such as Credit Model, we extend the coverage to 46
companies with credit scores.
• Using absolute quantitative models you can stress test financial ratio‘s to determine how the
creditworthiness changes in an adverse scenario
• Relative peer analysis identifies AGR group, which is placed at the lower end of BP‘s
suppliers and within its own industry
• Looking for potential alternatives, we shortlisted Norwegian Oil & Gas Equipment & Services
companies and focus on top quadrant in relative analysis, before we perform an absolute
analysis.
• TGS-Nopec, Sevan Marine, On & Offshore Holding and Petroleum Geo Services can be
potential alternatives to AGR Group based on industry, geography and fundamentals
20. Permission to reprint or distribute any content from this presentation requires the prior written approval of S&P Capital IQ. Not for distribution to the public.
Contact Us
If you have any questions or would like more information about
S&P Capital IQ solutions, please contact us:
Gustavo Tella, CFA, FRM Head of EMEA Application Specialists
General Enquiries
www.spcapitaliq.com
21. Permission to reprint or distribute any content from this presentation requires the prior written approval of S&P Capital IQ. Not for distribution to the public.
Copyright © 2013 by Standard & Poor’s Financial Services LLC (S&P), a subsidiary of The McGraw-Hill Companies, Inc. All rights reserved. No content (including ratings, valuations, credit-related analyses and data, model, software or other application or output therefrom) or any part thereof (Content) may be modified, reverse engineered, reproduced or distributed in any form by any means, or stored in a database or retrieval system, without the prior written permission of Standard & Poor’s Financial Services LLC or its affiliates (collectively, S&P). The Content shall not be used for any unlawful or unauthorized purposes. S&P and any third-party providers, as well as their directors, officers, shareholders, employees or agents (collectively S&P Parties) do not guarantee the accuracy, completeness, timeliness or availability of the Content. S&P Parties are not responsible for any errors or omissions (negligent or otherwise), regardless of the cause, for the results obtained from the use of the Content, or for the security or maintenance of any data input by the user. The Content is provided on an “as is” basis. S&P PARTIES DISCLAIM ANY AND ALL EXPRESS OR IMPLIED WARRANTIES, INCLUDING, BUT NOT LIMITED TO, ANY WARRANTIES OF MERCHANTABILITY OR FITNESS FOR A PARTICULAR PURPOSE OR USE, FREEDOM FROM BUGS, SOFTWARE ERRORS OR DEFECTS, THAT THE CONTENT’S FUNCTIONING WILL BE UNINTERRUPTED OR THAT THE CONTENT WILL OPERATE WITH ANY SOFTWARE OR HARDWARE CONFIGURATION. In no event shall S&P Parties be liable to any party for any direct, indirect, incidental, exemplary, compensatory, punitive, special or consequential damages, costs, expenses, legal fees, or losses (including, without limitation, lost income or lost profits and opportunity costs or losses caused by negligence) in connection with any use of the Content even if advised of the possibility of such damages.
Credit-related and other analyses, including ratings, and statements in the Content are statements of opinion as of the date they are expressed and not statements of fact. S&P’s opinions, analyses and rating acknowledgment decisions (described below) are not recommendations to purchase, hold, or sell any securities or to make any investment decisions, and do not address the suitability of any security. S&P assumes no obligation to update the Content following publication in any form or format. The Content should not be relied on and is not a substitute for the skill, judgment and experience of the user, its management, employees, advisors and/or clients when making investment and other business decisions. S&P does not act as a fiduciary or an investment advisor except where registered as such. While S&P has obtained information from sources it believes to be reliable, S&P does not perform an audit and undertakes no duty of due diligence or independent verification of any information it receives.
To the extent that regulatory authorities allow a rating agency to acknowledge in one jurisdiction a rating issued in another jurisdiction for certain regulatory purposes, S&P reserves the right to assign, withdraw or suspend such acknowledgement at any time and in its sole discretion. S&P Parties disclaim any duty whatsoever arising out of the assignment, withdrawal or suspension of an acknowledgment as well as any liability for any damage alleged to have been suffered on account thereof.
S&P keeps certain activities of its business units separate from each other in order to preserve the independence and objectivity of their respective activities. As a result, certain business units of S&P may have information that is not available to other S&P business units. S&P has established policies and procedures to maintain the confidentiality of certain non-public information received in connection with each analytical process.
S&P may receive compensation for its ratings and certain analyses, normally from issuers or underwriters of securities or from obligors. S&P reserves the right to disseminate its opinions and analyses. S&P’s public ratings and analyses are made available on its Web sites, www.standardandpoors.com (free of charge), and www.ratingsdirect.com and www.globalcreditportal.com (subscription), and may be distributed through other means, including via S&P publications and third-party redistributors. Additional information about our ratings fees is available at www.standardandpoors.com/usratingsfees.
www.spcapitaliq.com