managing quality
DESCRIPTION
Tools of Total Quality ManagementTRANSCRIPT
Chapter 6: Managing Quality
ÖZGE ÇELİK8th April 2011
Learning Objectives
• Explain quality robust products and Taguchi concepts
• Use the seven tools of TQM 1. Check Sheets 2. Scatter Diagrams 3. Cause-and-Effect Diagrams 4. Pareto Charts 5. Flowcharts 6. Histograms 7. Statistical Process Control Charts
Taguchi Concepts
• Engineering and experimental design methods to improve product and process design- Identify key component and process variables
affecting product variation
• Taguchi Concepts- Quality robustness- Quality loss function- Target-oriented quality
Quality Robustness
• Ability to produce products uniformly in adverse manufacturing and environmental conditions- Remove the effects of adverse conditions
- Small variations in materials and process do not destroy product quality

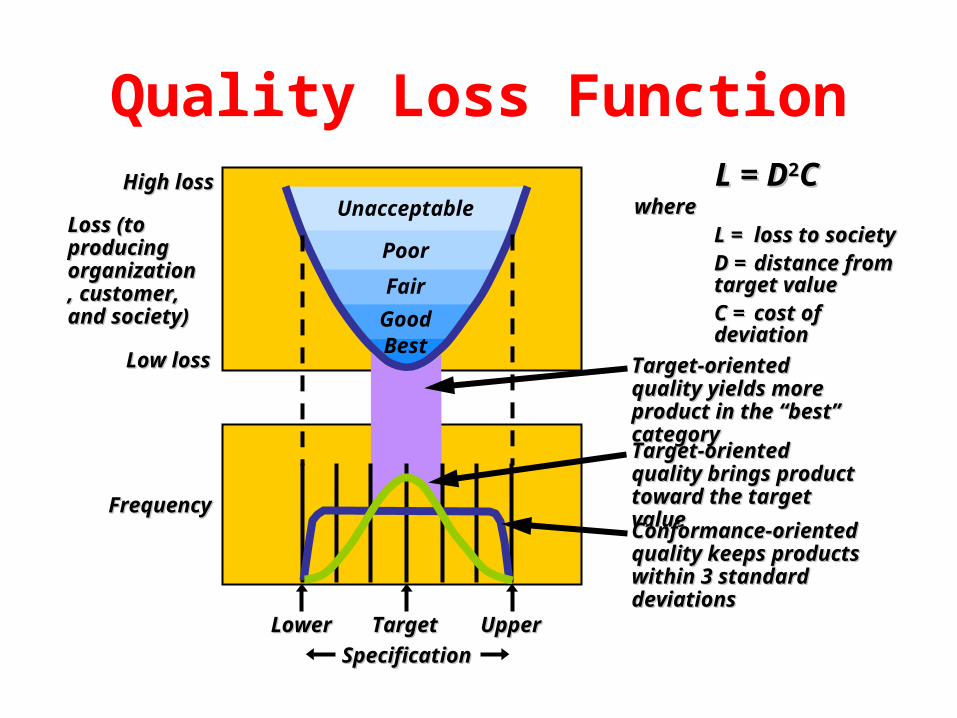
Quality Loss Function
• Shows that costs increase as the product moves away from what the customer wants
• Costs include customer dissatisfaction, warranty
and service, internal scrap and repair, and costs to society
• Traditional conformance specifications are too simplistic
Target-Target-
oriented oriented
qualityquality
Unacceptable
Poor
GoodBest
Fair
Quality Loss FunctionHigh lossHigh loss
Loss (to Loss (to producing producing organization, organization, customer, customer, and society)and society)
Low lossLow loss
FrequencyFrequency
LowerLower TargetTarget UpperUpper
SpecificationSpecification
Target-oriented quality Target-oriented quality yields more product in yields more product in the “best” categorythe “best” category
Target-oriented quality Target-oriented quality brings product toward brings product toward the target valuethe target value
Conformance-oriented Conformance-oriented quality keeps products quality keeps products within 3 standard within 3 standard deviationsdeviations
L = DL = D22CCwherewhere
L =L = loss to loss to societysocietyD =D = distance from distance from target valuetarget valueC =C = cost of cost of deviationdeviation
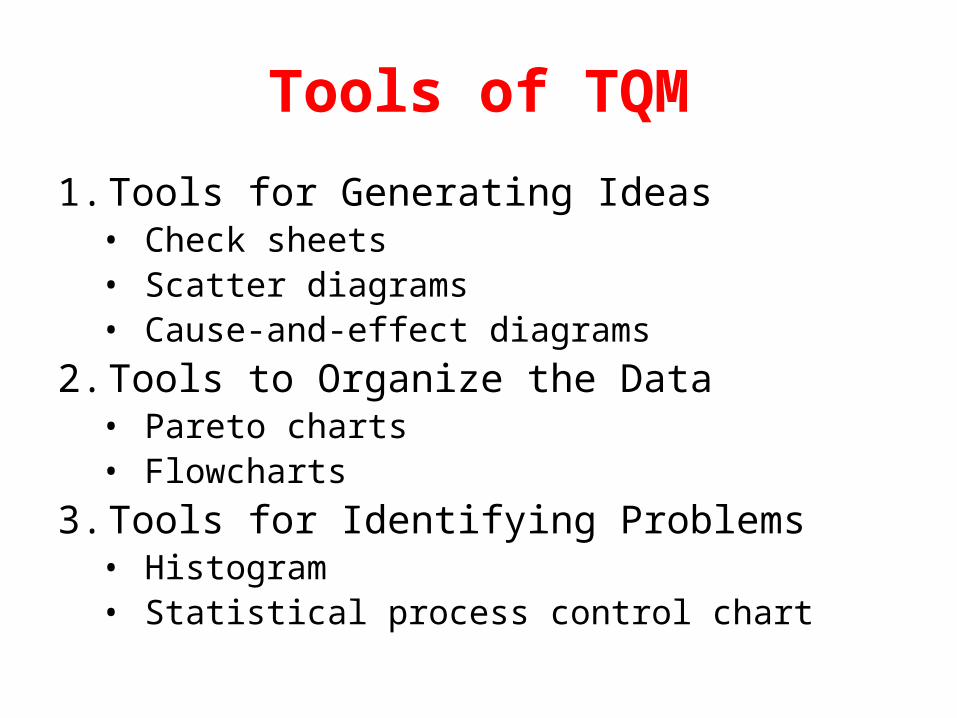
Tools of TQM
1. Tools for Generating Ideas• Check sheets• Scatter diagrams• Cause-and-effect diagrams
2. Tools to Organize the Data• Pareto charts• Flowcharts
3. Tools for Identifying Problems• Histogram• Statistical process control chart
/
/
/ / /// /
// ///
// ////
///
//
/
Hour
Defect 1 2 3 4 5 6 7 8
A
B
C
/
/
//
/
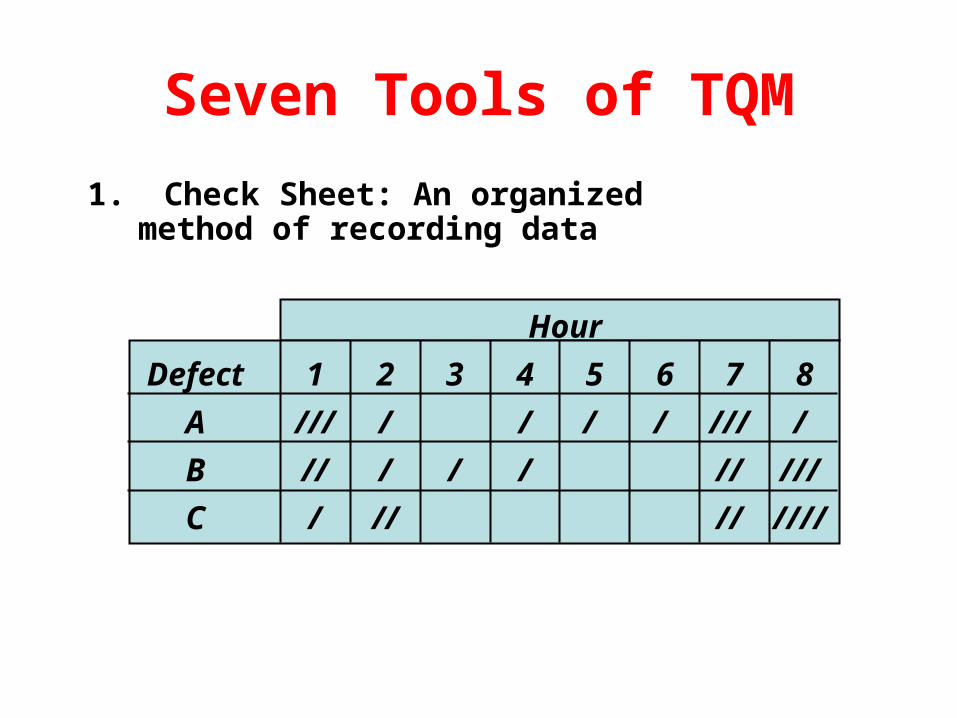
Seven Tools of TQM
1. Check Sheet: An organized method of recording data

Seven Tools of TQM
2. Scatter Diagram: A graph of the value of one variable vs. another variable
AbsenteeismAbsenteeism
Pro
du
cti
vit
yP
rod
uc
tiv
ity

Seven Tools of TQM
3. Cause-and-Effect Diagram: A tool that identifies process elements (causes) that might effect an outcome
CauseCause
MaterialsMaterials MethodsMethods
ManpowerManpower MachineryMachinery
EffectEffect

Cause-and-Effect Diagrams
MaterialMaterial(ball)(ball)
MethodMethod(shooting process)(shooting process)
MachineMachine(hoop &(hoop &
backboard)backboard)
ManpowerManpower(shooter)(shooter)
Missed Missed free-throwsfree-throws
Rim alignmentRim alignment
Rim sizeRim size
Backboard Backboard stabilitystability
Rim heightRim height
Follow-throughFollow-through
Hand positionHand position
Aiming pointAiming point
Bend kneesBend knees
BalanceBalance
Size of ballSize of ball
LopsidednessLopsidedness
Grain/Feel Grain/Feel (grip)(grip)
Air pressureAir pressure
TrainingTraining
ConditioningConditioning MotivationMotivation
ConcentrationConcentration
ConsistencyConsistency
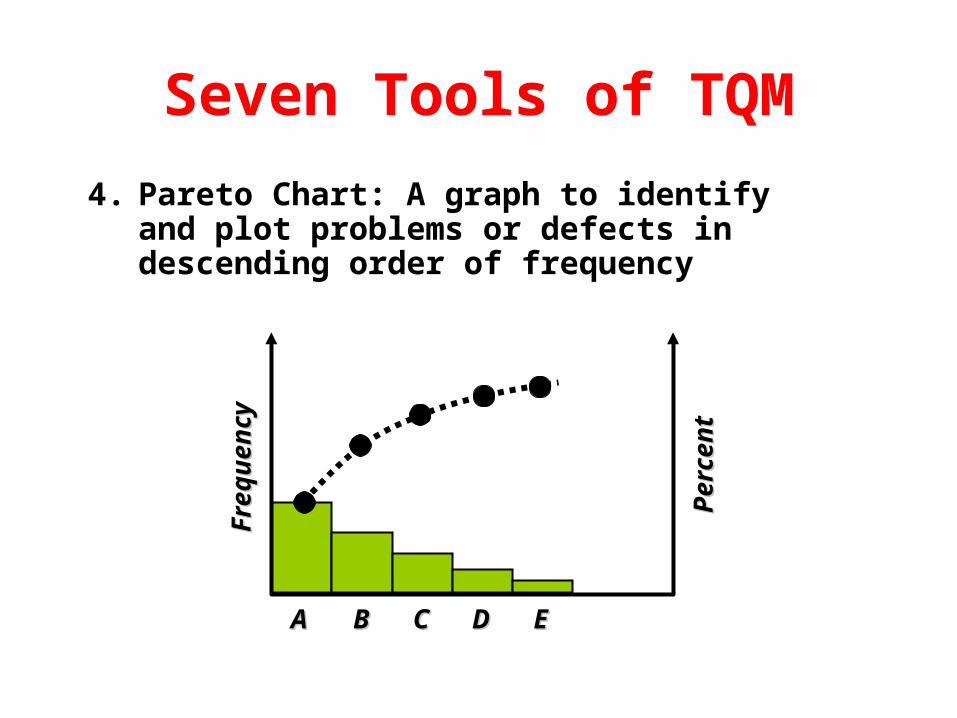
Seven Tools of TQM
4. Pareto Chart: A graph to identify and plot problems or defects in descending order of frequency
Fre
qu
en
cyF
req
ue
ncy
Pe
rce
nt
Pe
rce
nt
AA BB CC DD EE
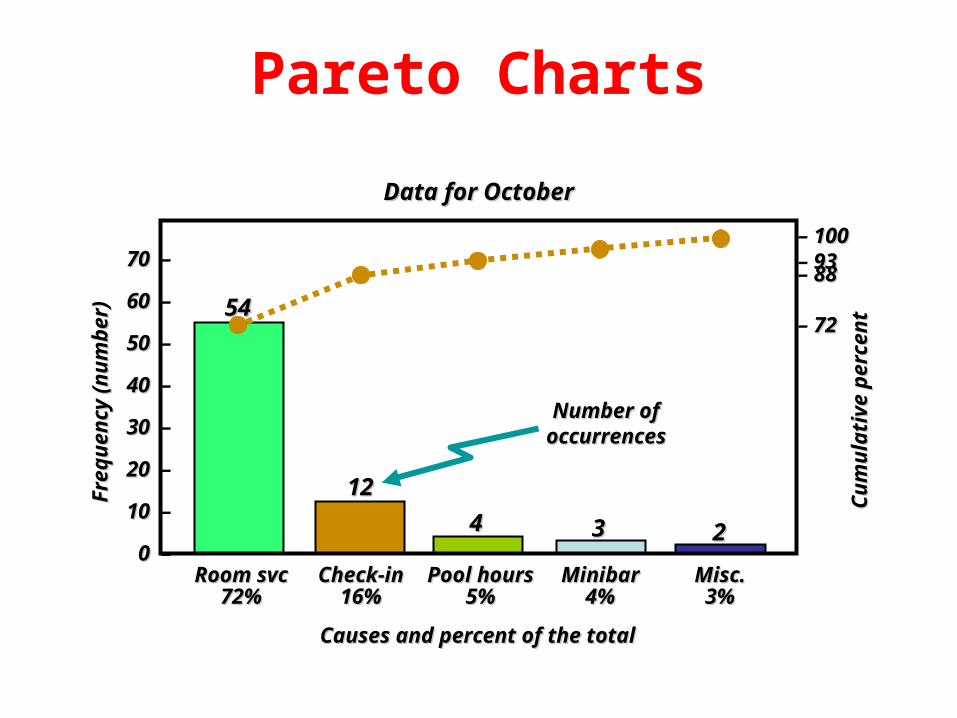
Pareto Charts
Number of Number of occurrencesoccurrences
Room svcRoom svc Check-inCheck-in Pool hoursPool hours MinibarMinibar Misc.Misc.72%72% 16%16% 5%5% 4%4% 3%3%
1212
44 33 22
5454
– 100100– 9393– 8888
– 7272
70 70 –
60 60 –
50 50 –
40 40 –
30 30 –
20 20 –
10 10 –
0 0 –
Fre
qu
ency
(n
um
ber
)F
req
uen
cy (
nu
mb
er)
Causes and percent of the totalCauses and percent of the total
Cu
mu
lati
ve p
erce
nt
Cu
mu
lati
ve p
erce
nt
Data for OctoberData for October
Seven Tools of TQM
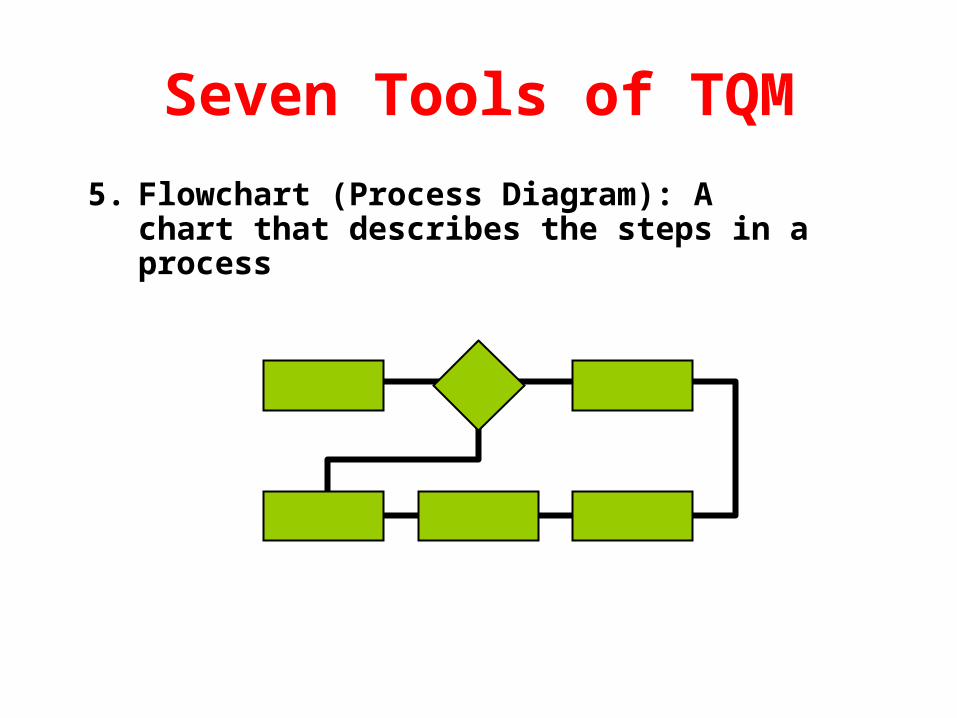
5. Flowchart (Process Diagram): A chart that describes the steps in a process
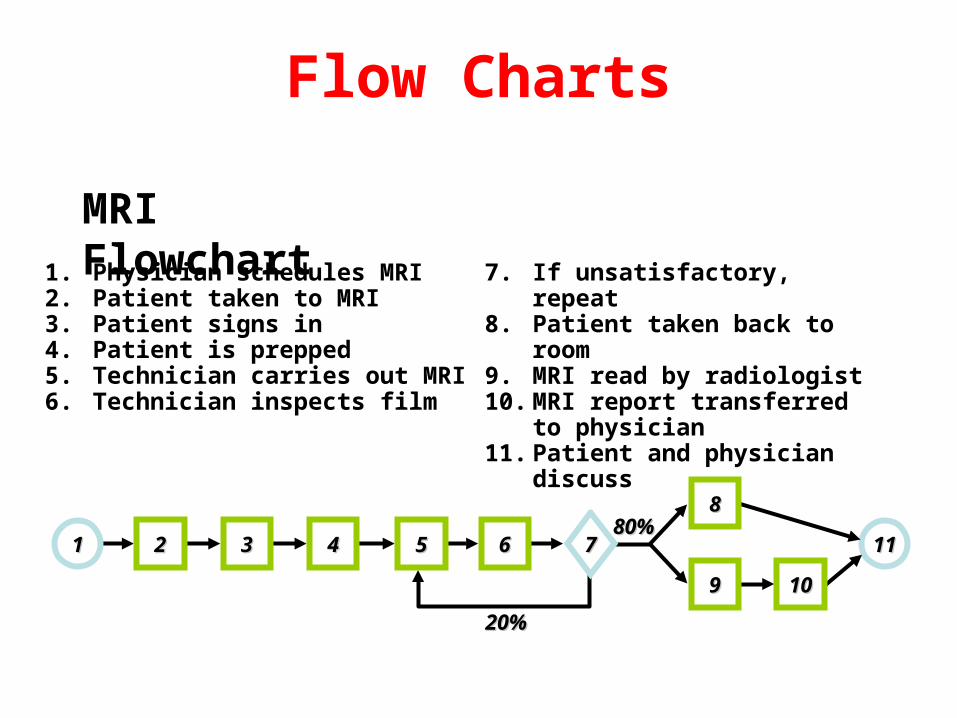
Flow Charts
MRI Flowchart1. Physician schedules MRI2. Patient taken to MRI3. Patient signs in4. Patient is prepped5. Technician carries out MRI6. Technician inspects film
7. If unsatisfactory, repeat8. Patient taken back to room9. MRI read by radiologist10. MRI report transferred to
physician11. Patient and physician discuss
1111
1010
20%20%
99
8880%80%
11 22 33 44 55 66 77
Seven Tools of TQM
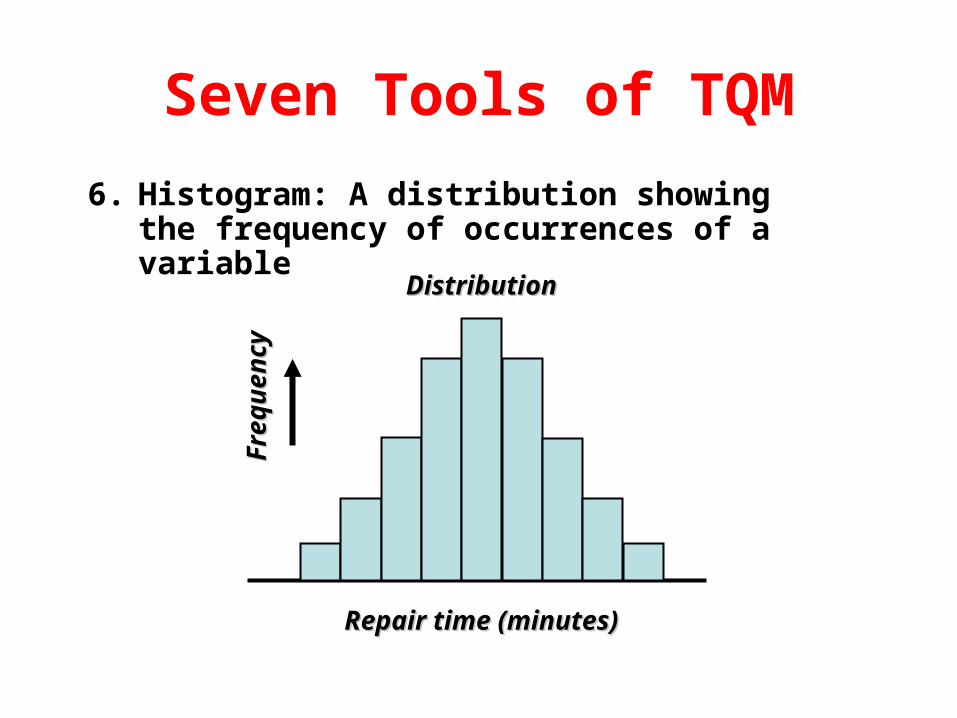
6. Histogram: A distribution showing the frequency of occurrences of a variable
DistributionDistribution
Repair time (minutes)Repair time (minutes)
Fre
qu
en
cyF
req
ue
ncy

Seven Tools of TQM
7. Statistical Process Control Chart: A chart with time on the horizontal axis to plot values of a statistic
Upper control limitUpper control limit
Target valueTarget value
Lower control limitLower control limit
TimeTime
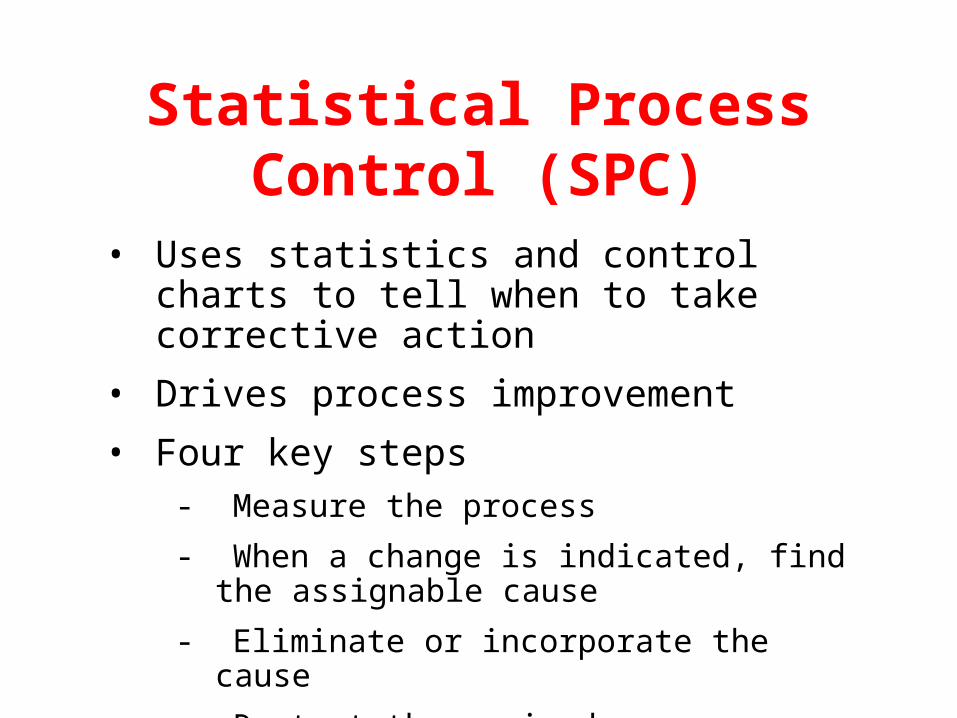
Statistical Process Control (SPC)
• Uses statistics and control charts to tell when to take corrective action
• Drives process improvement
• Four key steps- Measure the process
- When a change is indicated, find the assignable cause
- Eliminate or incorporate the cause
- Restart the revised process
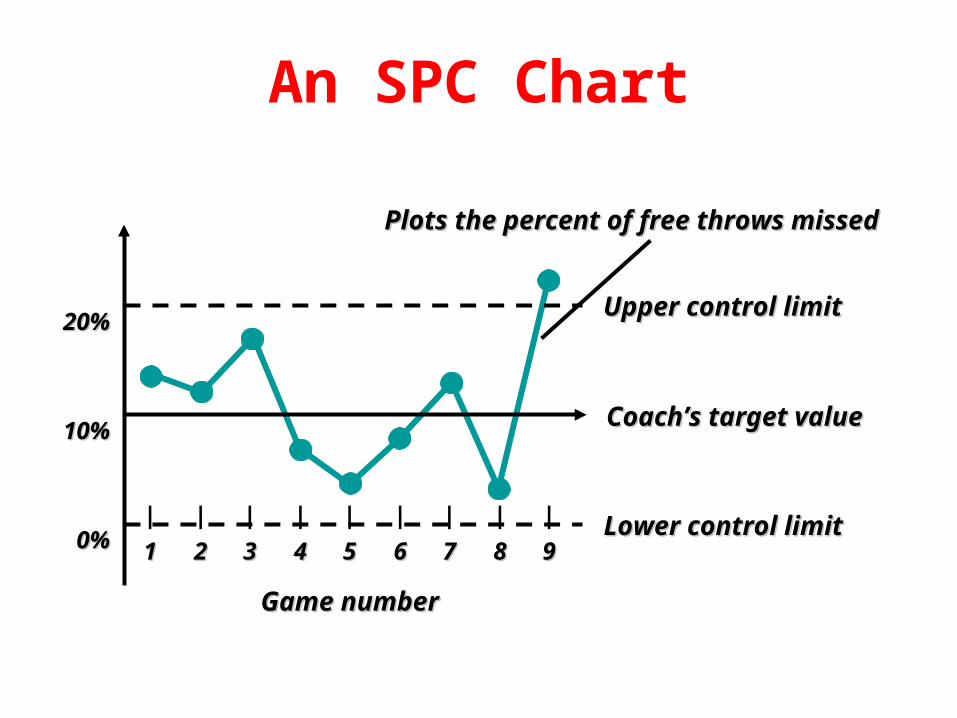
An SPC Chart
Upper control limitUpper control limit
Coach’s target valueCoach’s target value
Lower control limitLower control limit
Game numberGame number
| | | | | | | | |
11 22 33 44 55 66 77 88 99
20%20%
10%10%
0%0%
Plots the percent of free throws missedPlots the percent of free throws missed
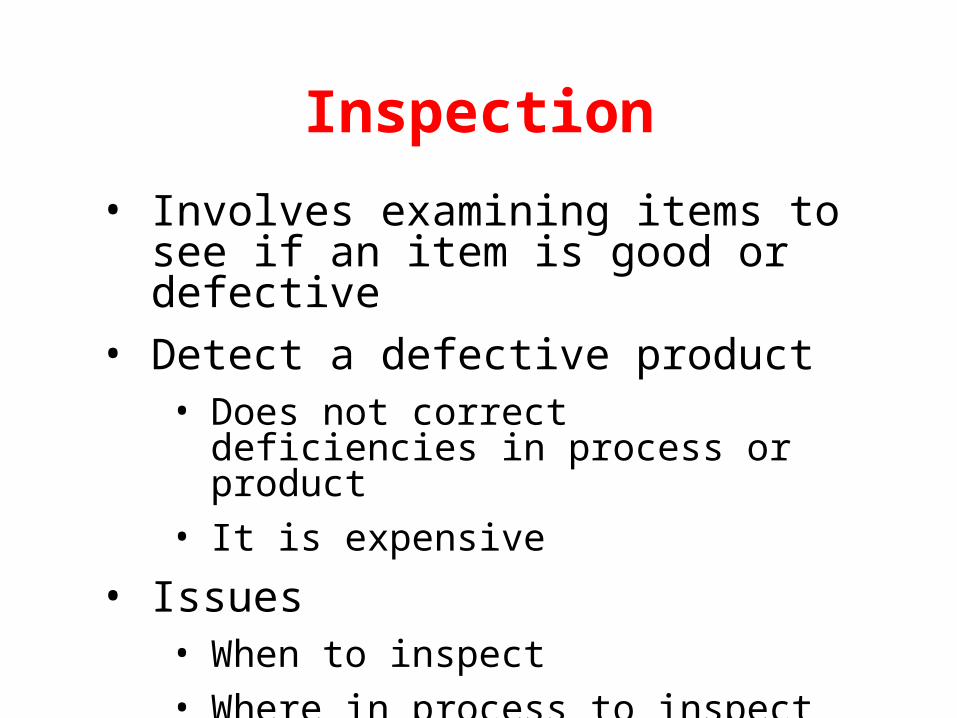
Inspection
• Involves examining items to see if an item is good or defective
• Detect a defective product• Does not correct deficiencies in
process or product
• It is expensive
• Issues• When to inspect
• Where in process to inspect
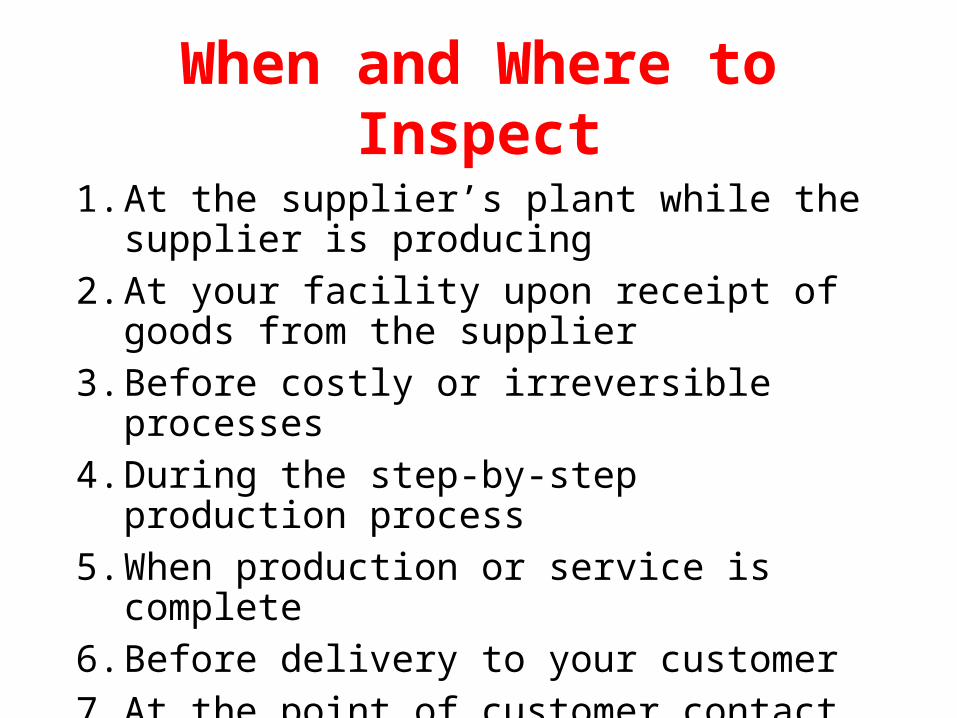
When and Where to Inspect
1. At the supplier’s plant while the supplier is producing
2. At your facility upon receipt of goods from the supplier
3. Before costly or irreversible processes4. During the step-by-step production process5. When production or service is complete6. Before delivery to your customer7. At the point of customer contact
Inspection
• Many problems• Worker fatigue
• Measurement error
• Process variability
• Cannot inspect quality into a product
• Robust design, empowered employees, and sound processes are better solutions
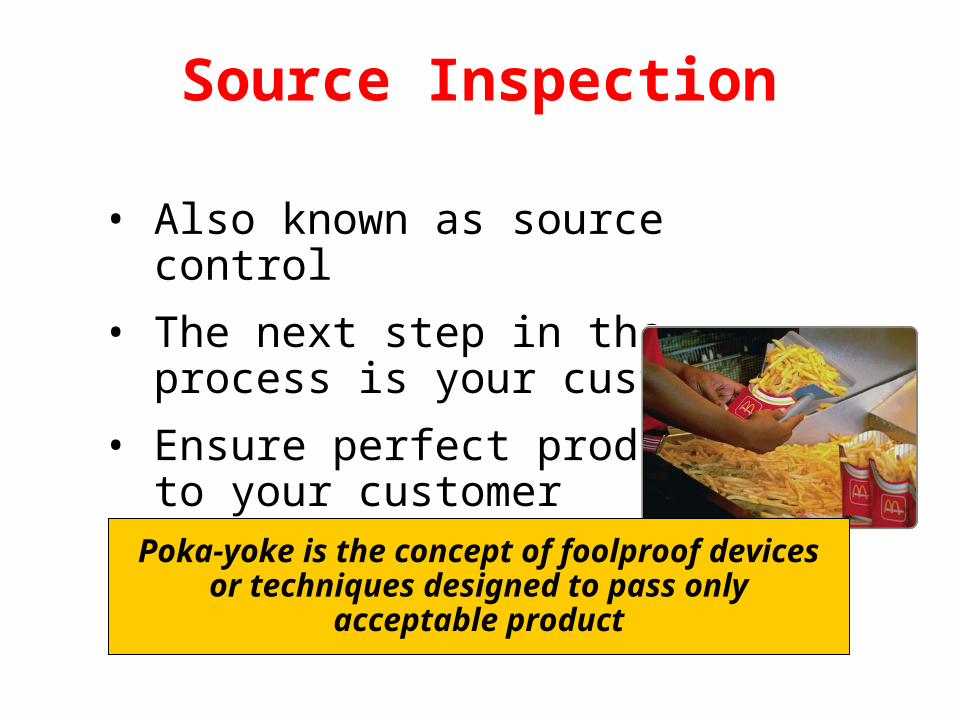
Source Inspection
• Also known as source control
• The next step in the process is your customer
• Ensure perfect product to your customer
Poka-yoke is the concept of foolproof devices or techniques designed to pass only
acceptable product

Service Industry Inspection
OrganizationWhat is
InspectedStandard
Nordstrom Department Store
Display areas
Stockrooms
Salesclerks
Attractive, well-organized, stocked, good lighting
Rotation of goods, organized, clean
Neat, courteous, very knowledgeable

Attributes Versus Variables
• Attributes• Items are either good or bad, acceptable
or unacceptable• Does not address degree of failure
• Variables• Measures dimensions such as weight,
speed, height, or strength• Falls within an acceptable range
• Use different statistical techniques

TQM In Services
• Service quality is more difficult to measure than the quality of goods
• Service quality perceptions depend on • Intangible differences between products
• Intangible expectations customers have of those products
Service Quality
The operations manager must recognize:
1. The tangible component of services is important
2. The service process is important
3. The service is judged against the customer’s expectations
4. Exceptions will occur

Determinants of Service Quality
Reliability
Responsiveness
Competence
Access
Courtesy
Communication
Credibility
Security
Understanding/ knowing the customer
Tangibles
Service Recovery Strategy
• Managers should have a plan for when services fail
• Marriott’s LEARN routine• Listen• Empathize• Apologize• React• Notify

Managerial Implications
• We will have plan for when services fail.
• We will recognize that the service is judged against the customer’s expentations.