managing productions across supply chain
TRANSCRIPT

MANAGING PRODUCTIONS ACROSS SUPPLY CHAIN
SUSHANT SINHASUSHOVAN BEJ
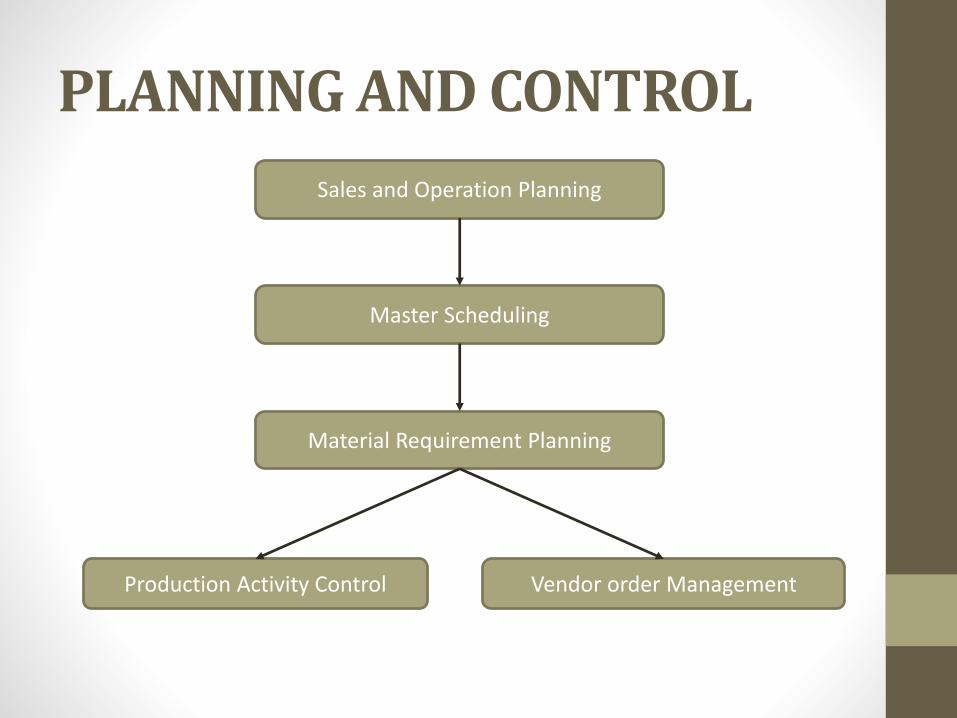
PLANNING AND CONTROL
Sales and Operation Planning
Master Scheduling
Vendor order ManagementProduction Activity Control
Material Requirement Planning
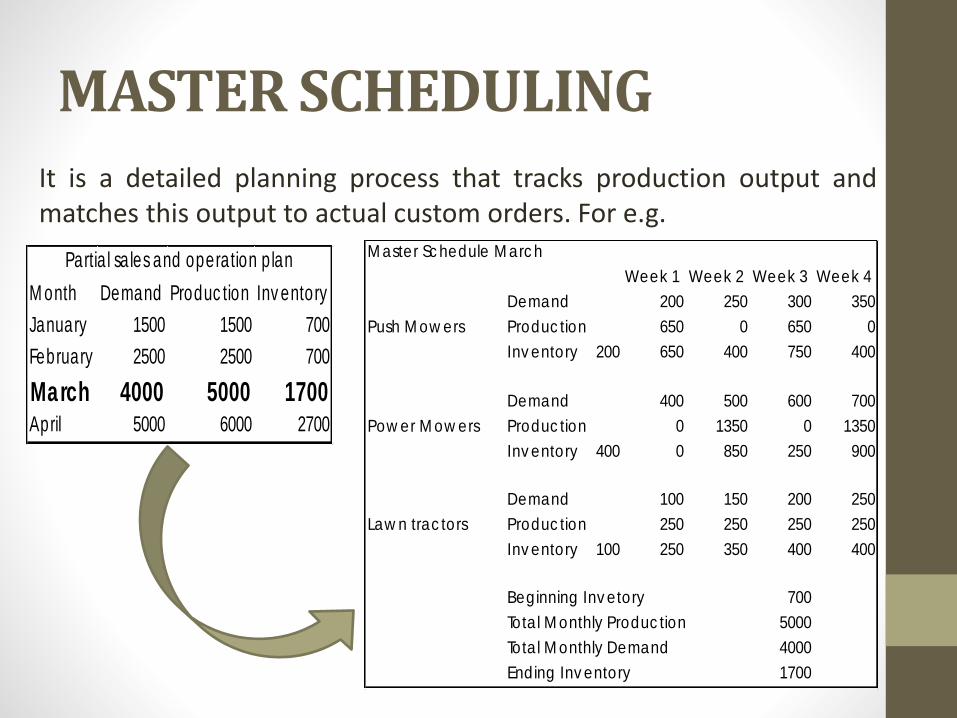
MASTER SCHEDULINGIt is a detailed planning process that tracks production output andmatches this output to actual custom orders. For e.g.
M onth Demand Produc tion Inv entory
January 1500 1500 700
February 2500 2500 700
March 4000 5000 1700April 5000 6000 2700
Partia l sa les and operation p lan M aster Sc hedule M arc h
Week 1 Week 2 Week 3 Week 4
Demand 200 250 300 350
Push M ow ers Produc tion 650 0 650 0
Inv entory 200 650 400 750 400
Demand 400 500 600 700
Pow er M ow ers Produc tion 0 1350 0 1350
Inv entory 400 0 850 250 900
Demand 100 150 200 250
Law n trac tors Produc tion 250 250 250 250
Inv entory 100 250 350 400 400
700
5000
4000
1700
Beginning Inv etory
Tota l M onthly Produc tion
Tota l M onthly Demand
Ending Inv entory
MASTER SCHEDULE RECORD
Most master schedule or Master Production Schedule record trackseveral key pieces of information as following :
• Forecasted Demand
• Booked Orders
• Projected Inventory Levels
• Production Quantities
• Units still available to meet customer need (available to promise)
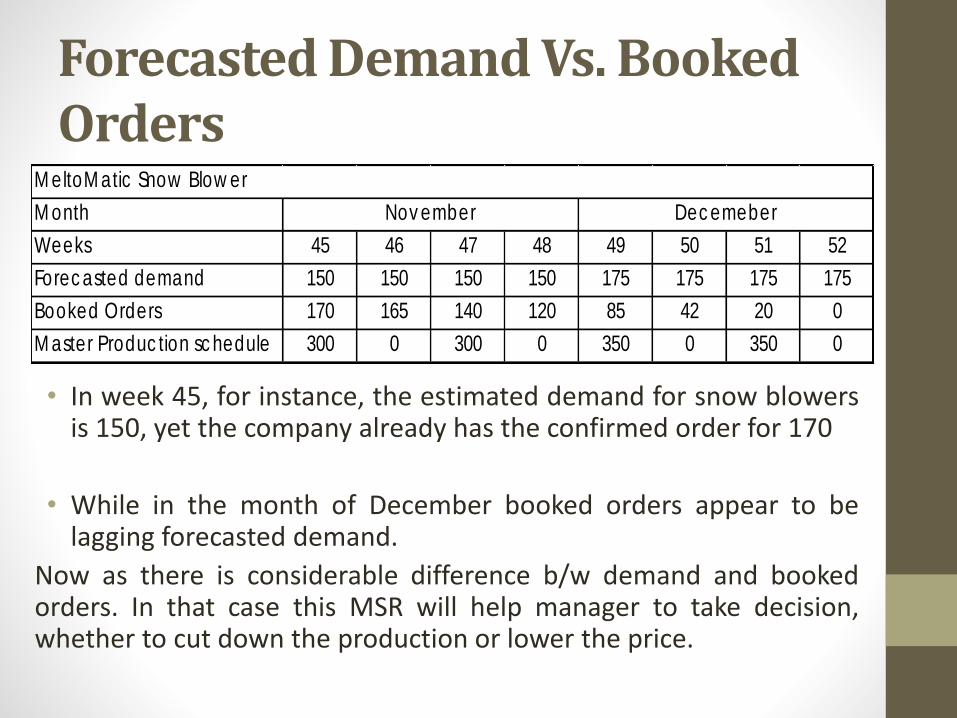
Forecasted Demand Vs. Booked Orders
• In week 45, for instance, the estimated demand for snow blowersis 150, yet the company already has the confirmed order for 170
• While in the month of December booked orders appear to belagging forecasted demand.
Now as there is considerable difference b/w demand and bookedorders. In that case this MSR will help manager to take decision,whether to cut down the production or lower the price.
M onth
Weeks 45 46 47 48 49 50 51 52
Forec asted demand 150 150 150 150 175 175 175 175
Booked Orders 170 165 140 120 85 42 20 0
M aster Produc tion sc hedule 300 0 300 0 350 0 350 0
Nov ember Dec emeber
M eltoM atic Snow Blow er
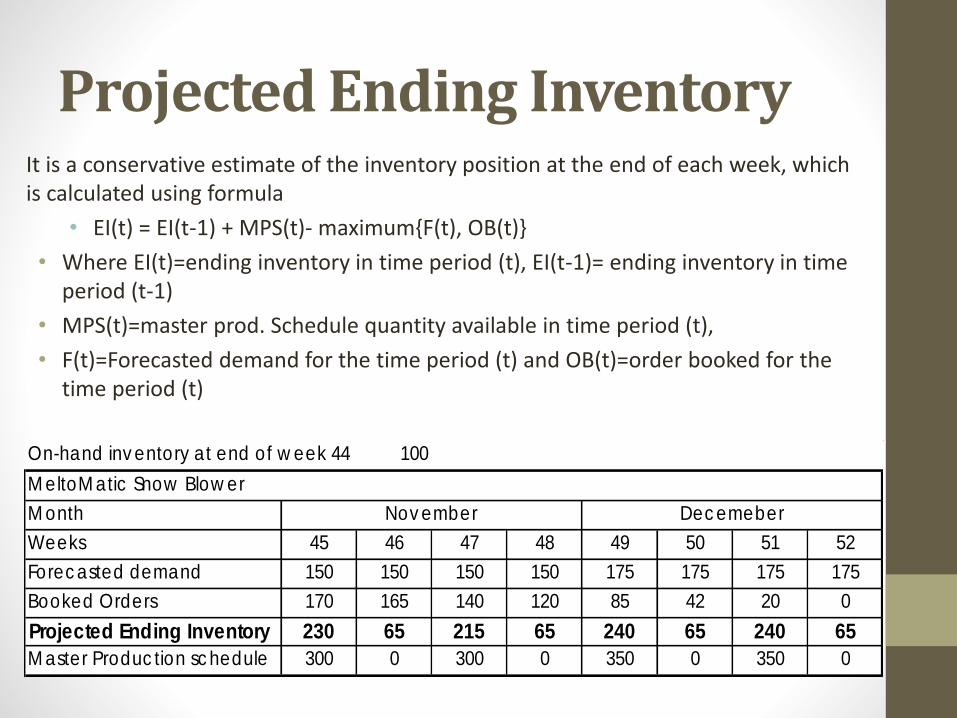
Projected Ending InventoryIt is a conservative estimate of the inventory position at the end of each week, which is calculated using formula
• EI(t) = EI(t-1) + MPS(t)- maximum{F(t), OB(t)}
• Where EI(t)=ending inventory in time period (t), EI(t-1)= ending inventory in time period (t-1)
• MPS(t)=master prod. Schedule quantity available in time period (t),
• F(t)=Forecasted demand for the time period (t) and OB(t)=order booked for the time period (t)
On-hand inv entory at end of w eek 44 100
M onth
Weeks 45 46 47 48 49 50 51 52
Forec asted demand 150 150 150 150 175 175 175 175
Booked Orders 170 165 140 120 85 42 20 0
Projected Ending Inventory 230 65 215 65 240 65 240 65
M aster Produc tion sc hedule 300 0 300 0 350 0 350 0
M eltoM atic Snow Blow er
Nov ember Dec emeber

Available to PromiseIt indicates the number of units that are available for sale each week, given those thathave already been promised to customer
• ATP(t) = EI(t) + MPS(t) - ∑OB(t)
• ATP(t)= Available to promise in week ‘t’
• ∑OB(t)= sum of all orders booked from week ‘t’ until week ‘z’
On-hand inv entory at end of w eek 44 100
M onth
Weeks 45 46 47 48 49 50 51 52
Forec asted demand 150 150 150 150 175 175 175 175
Booked Orders 170 165 140 120 85 42 20 0
Projec ted Ending Inv entory 230 65 215 65 240 65 240 65
M aster Produc tion sc hedule 300 0 300 0 350 0 350 0
Available to Promise 65 40 223 330
M eltoM atic Snow Blow er
Nov ember Dec emeber
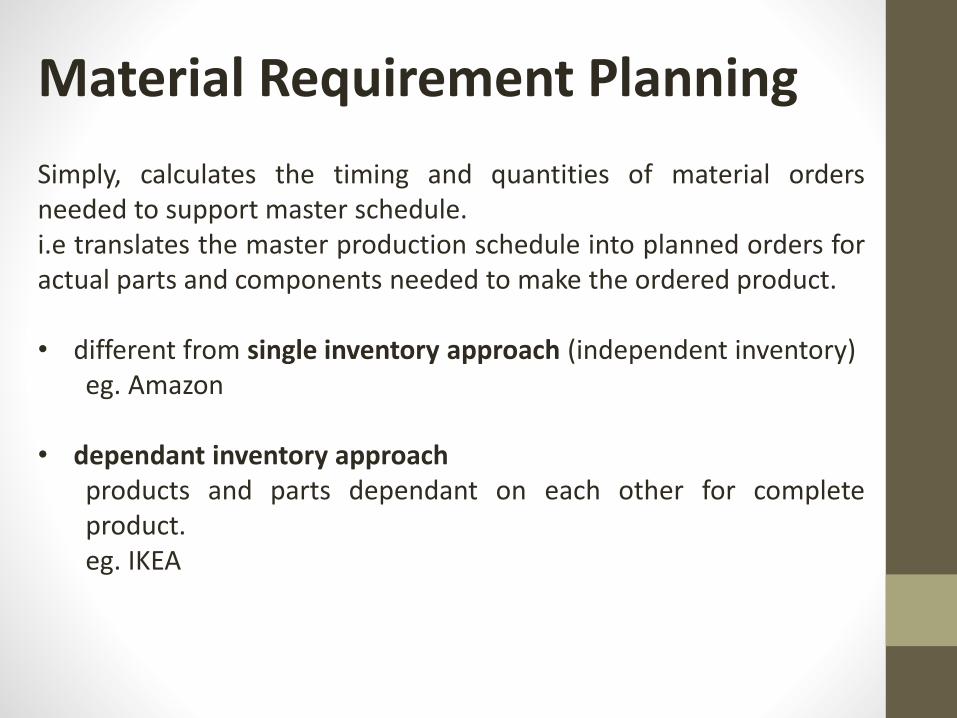
Material Requirement Planning
Simply, calculates the timing and quantities of material ordersneeded to support master schedule.i.e translates the master production schedule into planned orders foractual parts and components needed to make the ordered product.
• different from single inventory approach (independent inventory)eg. Amazon
• dependant inventory approachproducts and parts dependant on each other for completeproduct.eg. IKEA
MRP is different in managing inventory than EOQ ( Economic OrderQuantity ) i.e economic system in which the inventory is managedusing less space. MRP is based on :
• Bill of Material• Backward Scheduling• Explosion of Bill of Material
BILL OF MATERIAL
It is a listing of all the subassemblies, intermediate parts, and rawmaterials that go into a parent assembly, showing the quantity ofeach required to make an assembly.• Involves PLANNING LEAD TIME i.e time from when a component
or material is ordered until it arrives and is ready to use
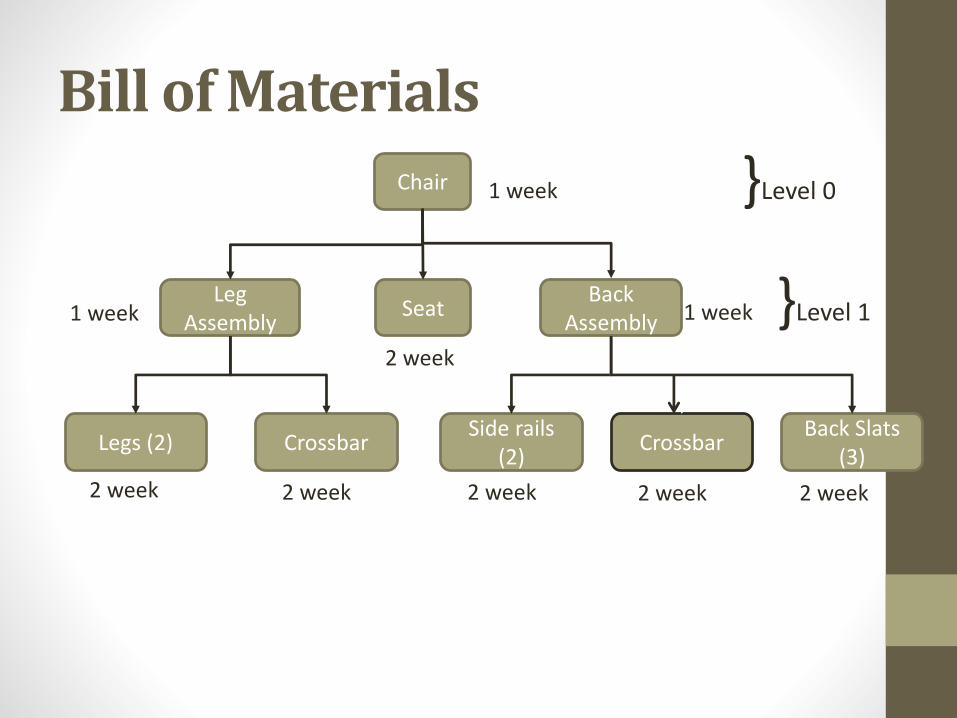
Bill of Materials
Chair
SeatBack
AssemblyLeg
Assembly
Legs (2) CrossbarSide rails
(2)Crossbar
Back Slats (3)
1 week
1 week
2 week
1 week
2 week 2 week 2 week 2 week 2 week
}Level 0
}Level 1
BACKWARD SCHEDULING
Calculating the deadline by working backward in time so that thecomponent or material is ready to use in time.
EXPLODING OF BILL OF MATERIAL
The process by which one works backward from master schedule todetermine the quantity and time for receiving all the variouscomponents and sub- assemblies.
MRP RECORD
A record needs to be maintained for the various components andsub-assemblies.
GROSS REQUIREMENT (GR)
The number of products needed for the order.Eg. 500 wooden chairs is the gross requirement
This depends on:• Inventory carried over / closing stock (EI)• Scheduled receipts / units already on order (SR)• Planned receipts / new ordersThis helps to determine any new orders need to be placedi.e NET REQUIREMENTS (NR)
NR(t) = GR(t) - EI(t) – SR(t)

ADVANTAGES OF MRP
• Directly tied to the master production and indicates exact timing and quantity of orders of all components.
• Allows managers to trace every order for lower level items through all the levels of the BOM.
• Tells precisely to the firm and the supplier what needs to be made when.
CONSIDERATIONS FOR MRP
• Requires organizational discipline.
• Must have accurate information ( Master schedule, BOM etc. ).
• Must also incorporate uncertainty so as to offer reliable service.Because a change in a single step can cause drastic effects on thecomplete procedure ( MRP nervousness ).
Production Activity Control & Vendor Order Mgmt. System
• In this emphasis shifts from planning to execution
• Other capabilities of the system
• Route & prioritize jobs going through the supply chain
• Coordinate the flow of goods and materials b/w a facility and othersupply chain partners
• Provide supply chain partners with performance data on operationand supply chain activities
Job Sequencing
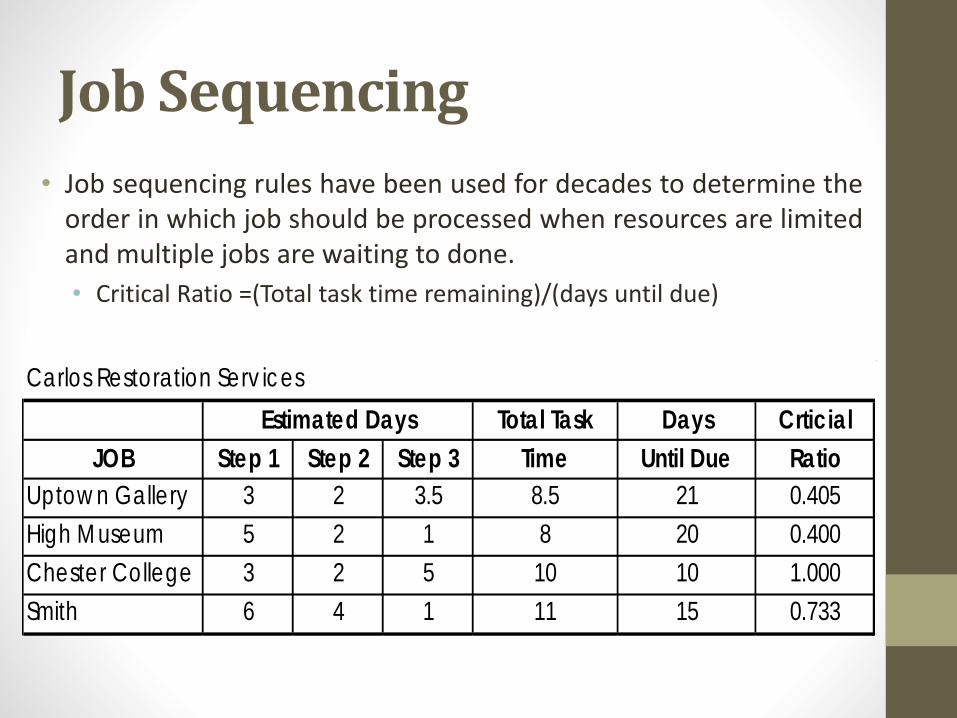
• Job sequencing rules have been used for decades to determine theorder in which job should be processed when resources are limitedand multiple jobs are waiting to done.
• Critical Ratio =(Total task time remaining)/(days until due)
Carlos Restoration Serv ic es
Total Task Days Crticial
JOB Step 1 Step 2 Step 3 Time Until Due Ratio
Uptow n Gallery 3 2 3.5 8.5 21 0.405
High M useum 5 2 1 8 20 0.400
Chester College 3 2 5 10 10 1.000
Smith 6 4 1 11 15 0.733
Estimated Days
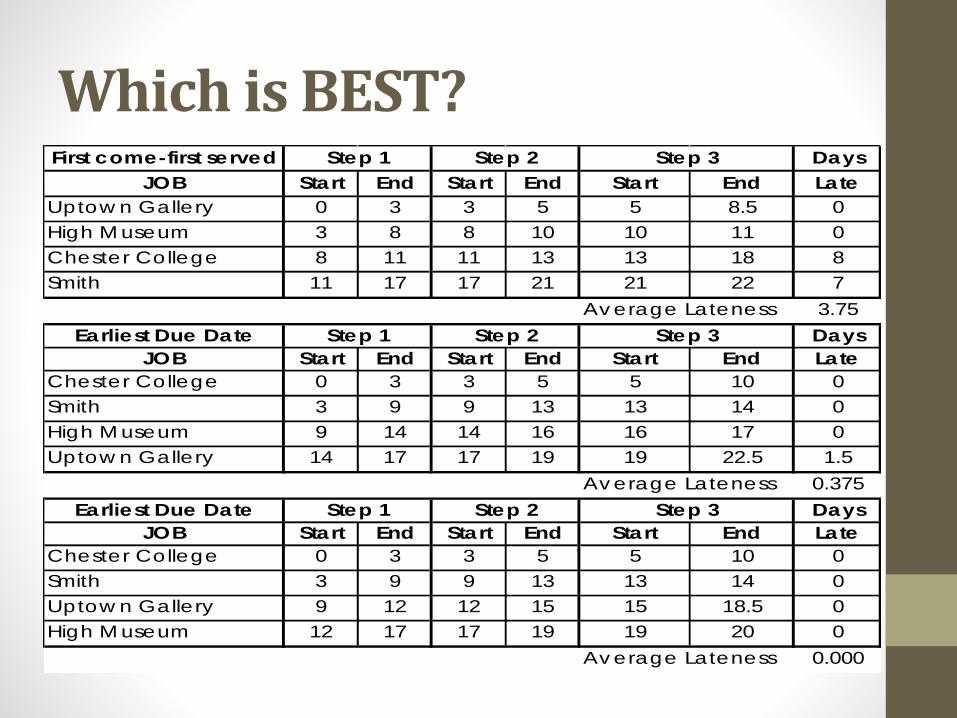
Which is BEST?First come-first served Days
JOB Start End Start End Start End Late
Uptow n Gallery 0 3 3 5 5 8.5 0
High M useum 3 8 8 10 10 11 0
Chester College 8 11 11 13 13 18 8
Smith 11 17 17 21 21 22 7
Av erage Lateness 3.75
Earliest Due Date Days
JOB Start End Start End Start End Late
Chester College 0 3 3 5 5 10 0
Smith 3 9 9 13 13 14 0
High M useum 9 14 14 16 16 17 0
Uptow n Gallery 14 17 17 19 19 22.5 1.5
Av erage Lateness 0.375
Earliest Due Date Days
JOB Start End Start End Start End Late
Chester College 0 3 3 5 5 10 0
Smith 3 9 9 13 13 14 0
Uptow n Gallery 9 12 12 15 15 18.5 0
High M useum 12 17 17 19 19 20 0
Av erage Lateness 0.000
Step 1 Step 2 Step 3
Step 1 Step 2 Step 3
Step 1 Step 2 Step 3
Monitoring & Tracking Technology
• Recently, Radio Frequency Identification (RFID), bar coding andonline order tracking system have been developed to trace themovement and location of materials in the supply chain and reporton the progress of specific jobs.
• Beside helping the company to control its operation and supplychain activities, these system also alert managers to potentialproblems.
• For e.g. It could help in provide users with real-time information aboutthe status of manufacturing jobs and required materials. If a shortageof materials threatens to delay job, the system flags the problem andindicates which jobs will be affected.
SYNCHRONISING PLANNING AND CONTROLACROSS SUPPLY CHAIN
This is done using:• Distribution Requirement Planning (DRP)• KANBAN
DRP helps to synchronize supply chain partners at the MASTERSCHEDULE level.
Kanban helps to synchronize supply chain partners at thePRODUCTION ACTIVITY CONTROL and VENDOR ORDERMANAGEMENT level.
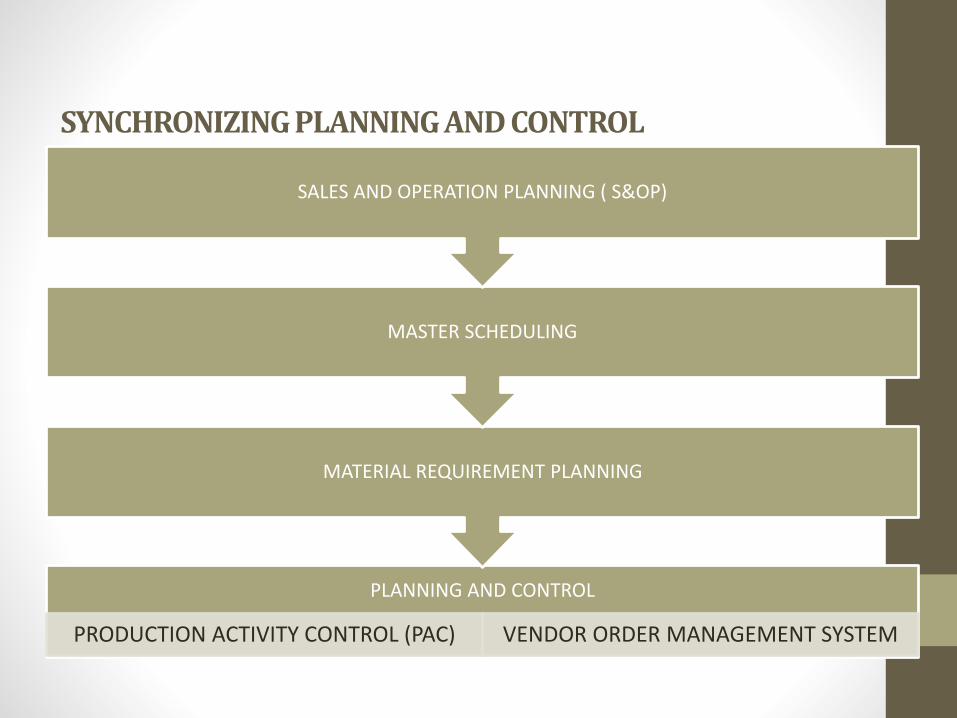
SYNCHRONIZING PLANNING AND CONTROL
PLANNING AND CONTROL
PRODUCTION ACTIVITY CONTROL (PAC) VENDOR ORDER MANAGEMENT SYSTEM
MATERIAL REQUIREMENT PLANNING
MASTER SCHEDULING
SALES AND OPERATION PLANNING ( S&OP)
DISTRIBUTION REQUIREMENT PLANNING
• Time based planning approach similar to MRP
• Observe planned orders at the point of demand ( warehouse ) todetermine forecaster demand at source level ( plant )
• Uses MRP style logic to feed accurate demand information intothe master schedule
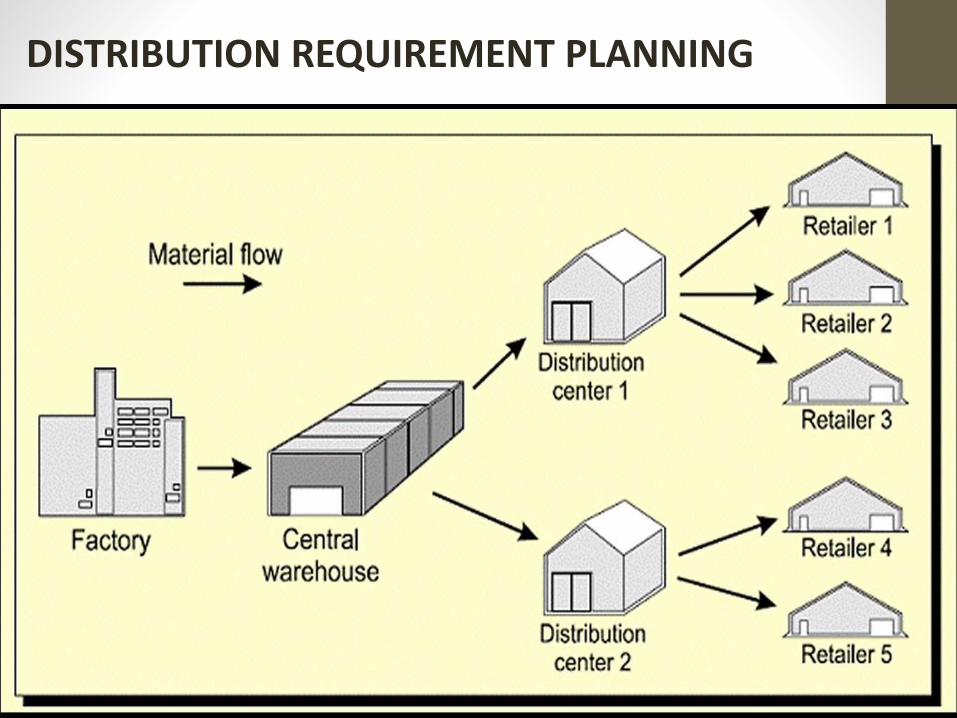
DISTRIBUTION REQUIREMENT PLANNING
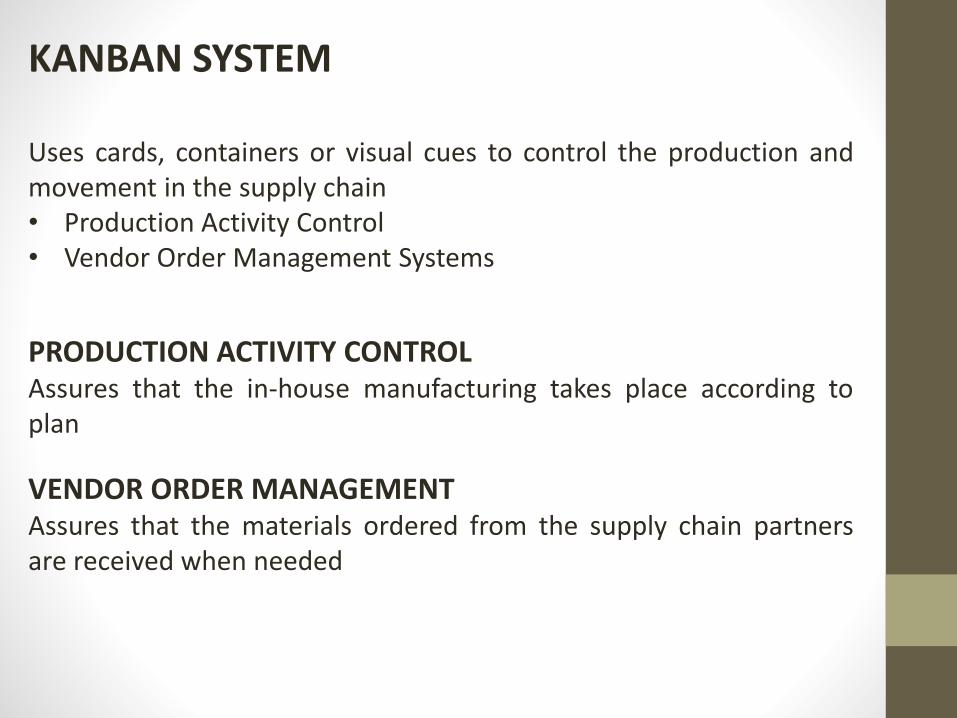
KANBAN SYSTEM
Uses cards, containers or visual cues to control the production andmovement in the supply chain• Production Activity Control• Vendor Order Management Systems
PRODUCTION ACTIVITY CONTROLAssures that the in-house manufacturing takes place according toplan
VENDOR ORDER MANAGEMENTAssures that the materials ordered from the supply chain partnersare received when needed
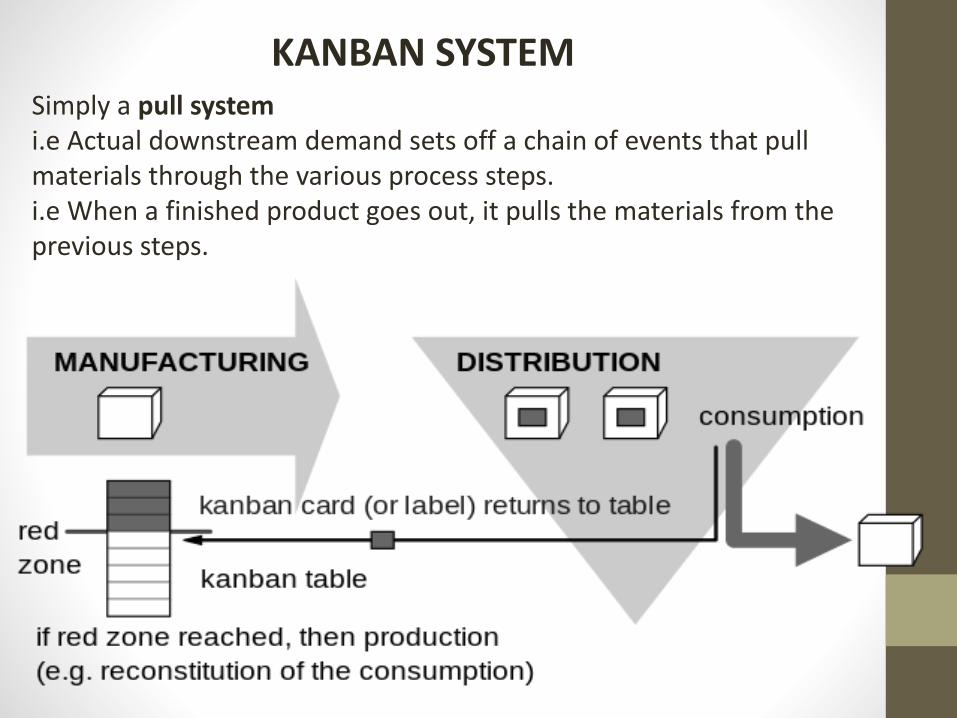
KANBAN SYSTEMSimply a pull systemi.e Actual downstream demand sets off a chain of events that pull materials through the various process steps.i.e When a finished product goes out, it pulls the materials from the previous steps.