managing for sustainability in an uncertain future · trends analysis primarily using mann-kendall,...
TRANSCRIPT

Managing for Water Sustainability in an Uncertain Future
Fraser Shilling
Department of Environmental Science and Policy UC Davis
Presentation to the California Water Quality Monitoring Council, February 19, 2014
Iara Lacher, Susana Cardenas, & David Waetjen (UC Davis) with Abdul Khan, Rich Juricich, & Kamyar Guivetchi (DWR) Vance Fong & Don Hodge (USEPA) Council for Watershed Health & SAWPA Pacific Institute, Sacramento River Watershed Program, Napa County, and South Yuba River Citizens League
indicators.ucdavis.edu

Previous Work with Indicators
∗ SF Bay Score Card (bay.org) ∗ Beach Report Card (brc.healthebay.org) ∗ Ski Resort Report Card (SNA et al.) ∗ SGC Regional Reports (SGC.ca.gov)
∗ Caltrans (CTP), CA Dept Education
(SARC), CDPH (HCI) ∗ CalFire (FRA), CDFW (CWAP)
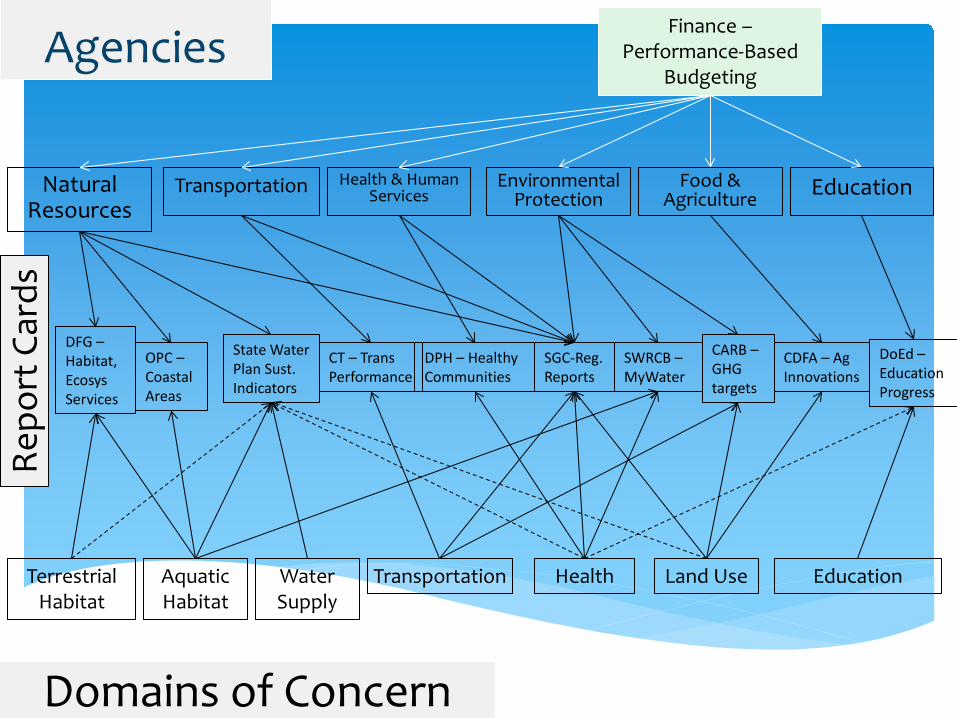
Agencies
Natural Resources
Domains of Concern
Transportation Health & Human Services
Environmental Protection
Food & Agriculture
Finance – Performance-Based
Budgeting
Terrestrial Habitat
Aquatic Habitat
Water Supply
Transportation Land Use Health Education
SGC-Reg. Reports
State Water Plan Sust. Indicators
OPC – Coastal Areas
DPH – Healthy Communities
CT – Trans Performance
DFG – Habitat, Ecosys Services
CARB – GHG targets
CDFA – Ag Innovations
DoEd – Education Progress
Education
SWRCB – MyWater
Repo
rt C
ards

My Previous Work with Sustainability Indicators
∗ Measuring whole system condition and performance
∗ Consistent with global literature, while breaking new ground
∗ Test cases in Yuba River, Lower Sacramento River, Feather River, Napa River, and Los Angeles River

Report Cards


Analytical details
Trends analysis primarily using Mann-Kendall, Seasonal Kendall, Regional Kendal. Sen slope estimation
Quantitative targets must be defined, existing distance to target is then measured for each metric or indicator on a 0-100 scale.
Spatially co-located sites are compared and potentially lumped. Typically, scores are derived from raw data at the resolution of the raw data, then lumped to a sub-watershed reporting scale
Confidence is based upon quantitative estimates (e.g., standard deviation of the mean) and qualitative determinations of certainty about the indicators themselves, the data quality and relevance to the indicator
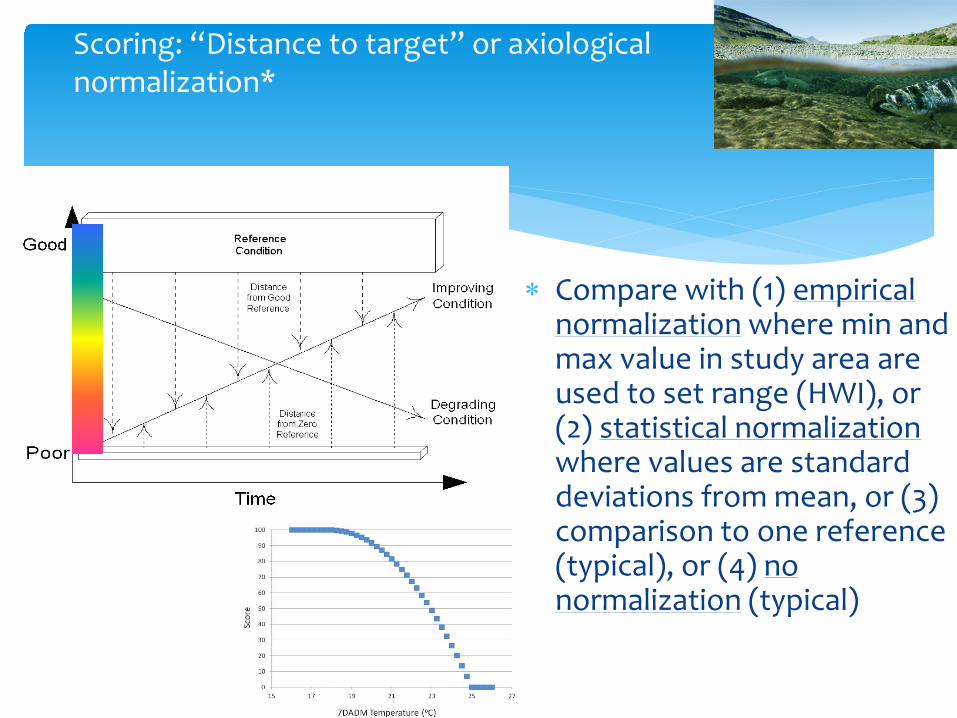
∗ Compare with (1) empirical normalization where min and max value in study area are used to set range (HWI), or (2) statistical normalization where values are standard deviations from mean, or (3) comparison to one reference (typical), or (4) no normalization (typical)
Scoring: “Distance to target” or axiological normalization*

Sco
re
Sur
viva
l (%
)
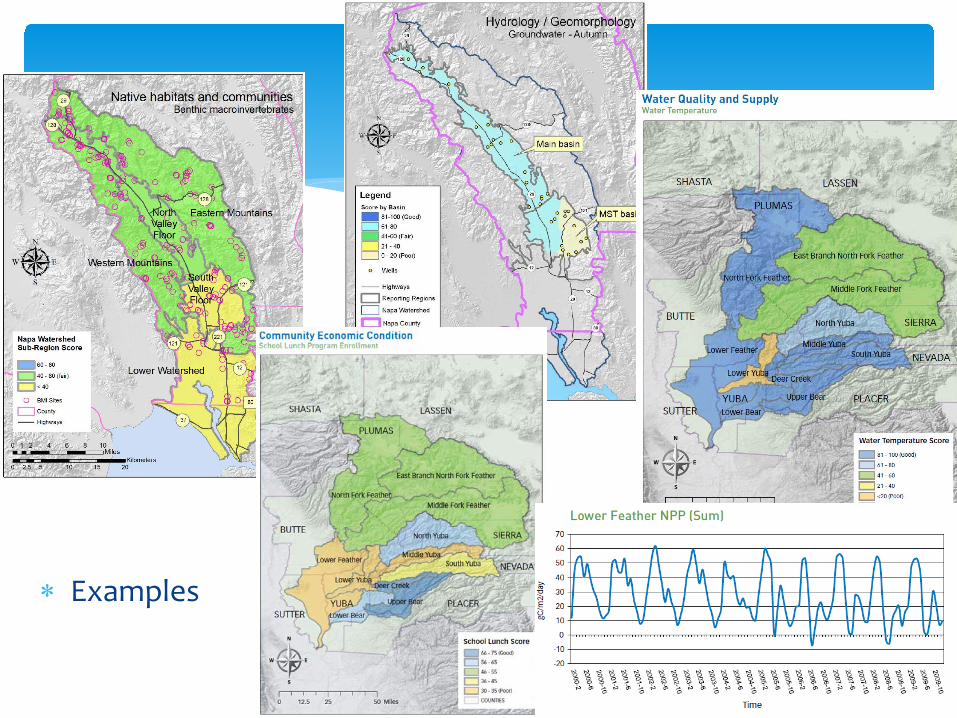
∗ Examples
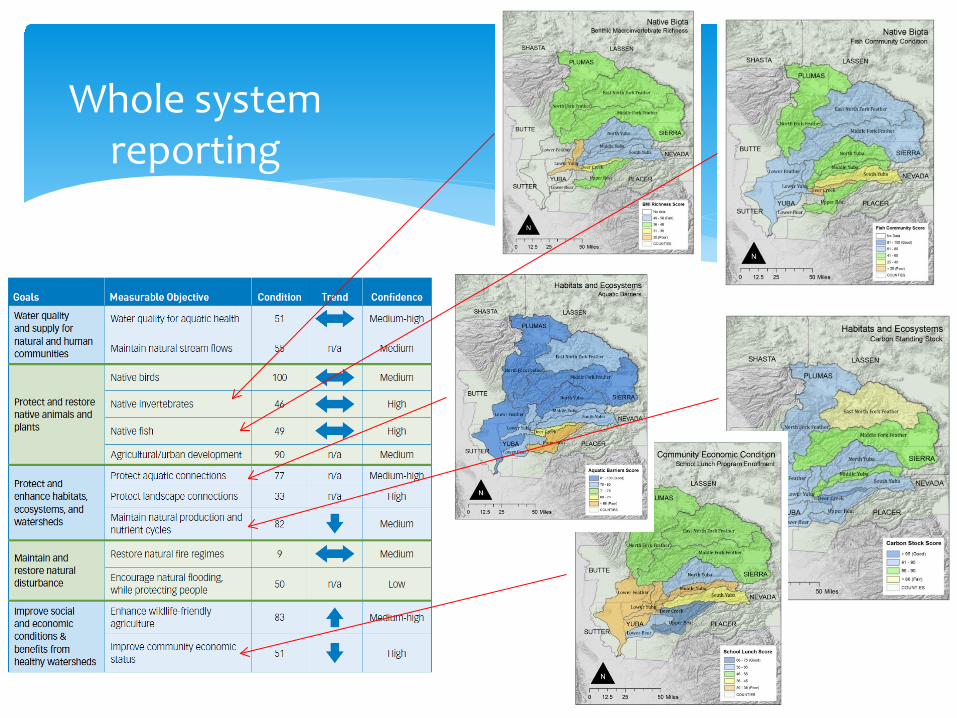
Whole system reporting
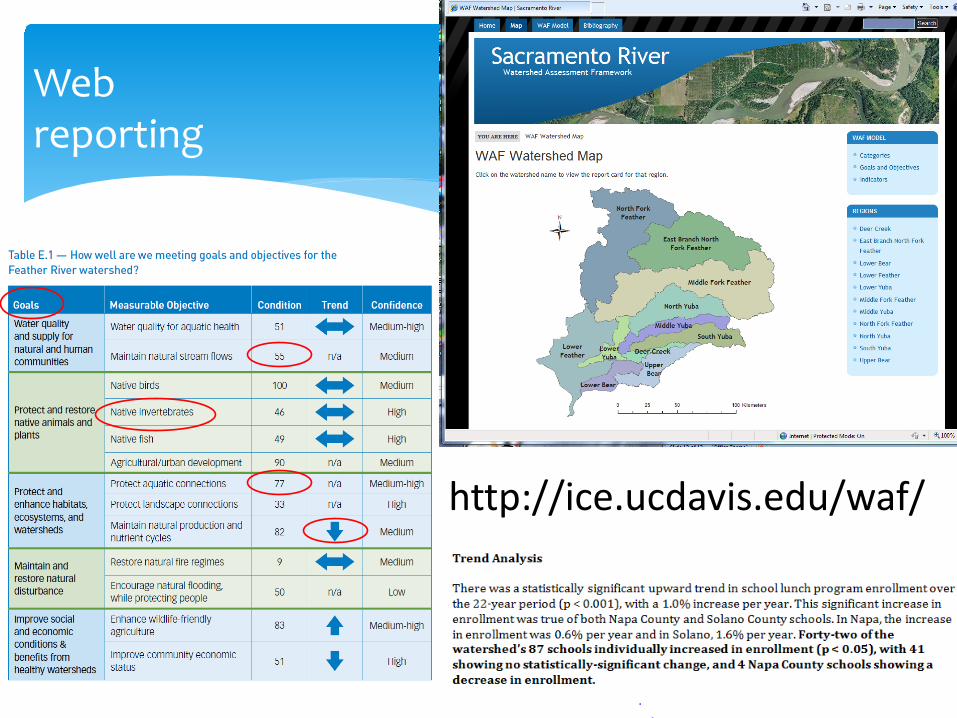
Web reporting
http://ice.ucdavis.edu/waf/

Next Stage: California Water Plan Update 2013 Water Sustainability Indicator Framework

State and Region Pilots
∗ State project was advised by Water Plan staff, members of the Inter-Agency Steering Committee, the Public Advisory Committee, and the Tribal Advisory Committee
∗ Pilot was a result of partnership with Santa Ana Watershed Project Authority and Council for Watershed Health
∗ Associated with the “One Water One Watershed 2.0” process
Santa Ana Watershed Project Authority

Themes/categories/domains
∗ Water Supply Reliability ∗ Water Quality ∗ Ecosystem Health ∗ Social Benefits and Equity ∗ Adaptive and Sustainable Management

Goal 1. Manage and make decisions about water in a way that integrates water availability, environmental conditions, and community well-being for future generations. Goal 2. Improve water supply reliability to meet human needs, reduce energy demand, and restore and maintain aquatic ecosystems and processes. Goal 3. Improve beneficial uses and reduce impacts associated with water management. Goal 4. Improve quality of drinking water, irrigation water, and in-stream flows to protect human and environmental health.
Goal 5. Protect and enhance environmental conditions by improving watershed, floodplain, and aquatic condition and processes. Goal 6. Integrate flood risk management with other water and land management and restoration activities. Goal 7. Employ adaptive decision-making, especially in light of uncertainties, that support integrated regional water management and flood management systems.
CA Water Sustainability Goals California Water Plan Update 2013

Indicator Name Sustainability Goals
Aquatic Fragmentation 5 Baseline Water Stress 1,2 California Stream Condition Index 5 CalEnviroScreen-Groundwater Threats 4 Geomorphic Condition 5,6 Groundwater Quality-Nitrate 4 Groundwater Stress 2 Historical Drought Severity 2,5 Historical Flooding 6 Interannual variability 2,5,7 Native Fish Species 5 Public Perceptions of Water 7 Return Flows 2,3 Threats to Amphibians 5 Upstream Protected Lands 2,4 Upstream Storage 2,3 Water Footprint 1,2,7 Water Quality Index 4 Water Use and Availability 2
Sustainability Indicators: California
State pilot indicators and indices and corresponding Sustainability Goals. 19 of 120 indicators in the Water Plan Sustainability Indicators Framework

SAWPA Water Sustainability Goals
Goal 1: Maintain reliable and resilient water supplies and reduce dependency on imported water
Goal 2: Manage at the watershed scale for preservation and enhancement of the natural hydrology to benefit human and natural communities
Goal 3: Preserve and enhance the ecosystem services provided by open space and habitat within the watershed
Goal 4: Protect beneficial uses to ensure high quality water for human and natural communities
Goal 5: Accomplish effective, equitable and collaborative integrated watershed management in a cost-effective manner
SAWPA One Water One Watershed 2.0
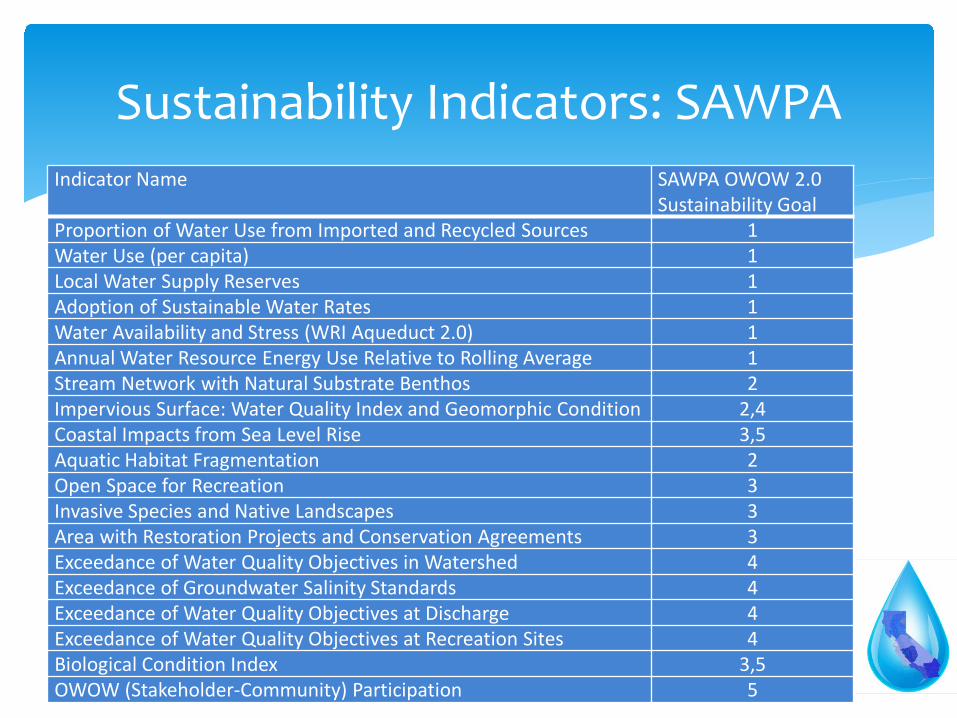
Sustainability Indicators: SAWPA Indicator Name SAWPA OWOW 2.0
Sustainability Goal Proportion of Water Use from Imported and Recycled Sources 1 Water Use (per capita) 1 Local Water Supply Reserves 1 Adoption of Sustainable Water Rates 1 Water Availability and Stress (WRI Aqueduct 2.0) 1 Annual Water Resource Energy Use Relative to Rolling Average 1 Stream Network with Natural Substrate Benthos 2 Impervious Surface: Water Quality Index and Geomorphic Condition 2,4 Coastal Impacts from Sea Level Rise 3,5 Aquatic Habitat Fragmentation 2 Open Space for Recreation 3 Invasive Species and Native Landscapes 3 Area with Restoration Projects and Conservation Agreements 3 Exceedance of Water Quality Objectives in Watershed 4 Exceedance of Groundwater Salinity Standards 4 Exceedance of Water Quality Objectives at Discharge 4 Exceedance of Water Quality Objectives at Recreation Sites 4 Biological Condition Index 3,5 OWOW (Stakeholder-Community) Participation 5
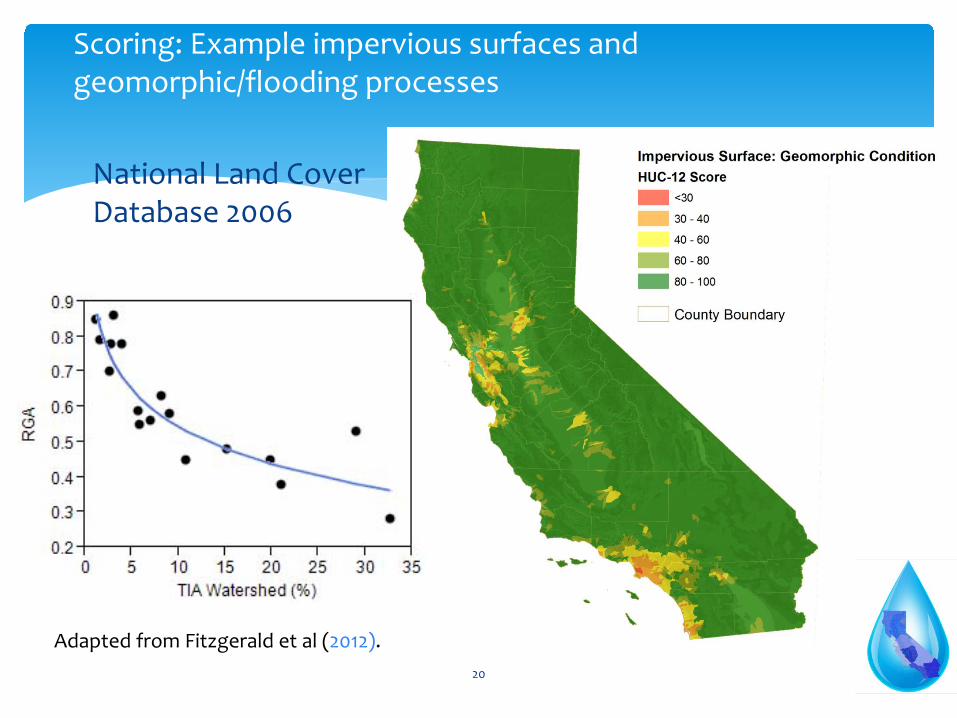
Scoring: Example impervious surfaces and geomorphic/flooding processes
20
Adapted from Fitzgerald et al (2012).
National Land Cover Database 2006

Scoring: Changing the scoring model
21
Nitrate concentration less than or equal to the background nitrate concentration in groundwater in the Central Valley (9 mg/L; Harter et al., 2012) receive a score of 100. Nitrate concentrations greater than 45 mg/L (MCL) receive a score of 0.

Scoring: Changing the scoring model
22
Nitrate concentrations less than the MCL receive a score of 100 and concentrations >45 mg/L up to the mean of all groundwater samples in California’s water supply wells in 2012 (87 mg/L; score = 0) receive scores proportional to concentration.

Scoring: Changing the scoring model
23
Nitrate concentration of 0 mg/L gets a score of 100, concentrations above the MCL receive a score of 0, and intermediate concentrations receive proportionally intermediate scores.
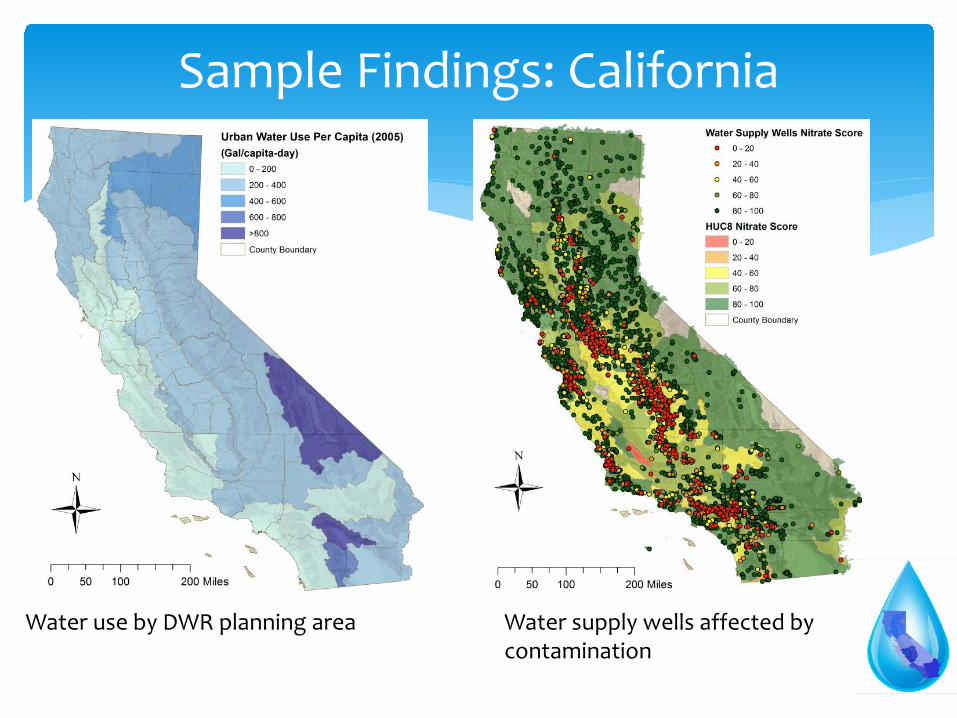
Sample Findings: California
Water use by DWR planning area Water supply wells affected by contamination

Sample Findings: California
Current presence of native fish species relative to historic presence.
Aquatic fragmentation from road-stream crossings

Findings: Public views on water systems and investments
Public Perception by Region of Seriousness of Threats to the Public Water Supply (December 2012, sample = 7,315)
26
Public Perception of Security of Future Water Supplies (December 2009, sample = 1,825)
Public Perception of Effects of Climate Change on Future Water Supplies (July 2011, sample = 4,580)
Data Source: Public Policy Institute of California

Plant Growth Index
Ecological Footprint Data Sources: JPL, Global Footprint Network, CSUMB-NASA/AMES
Groundwater-GRACE
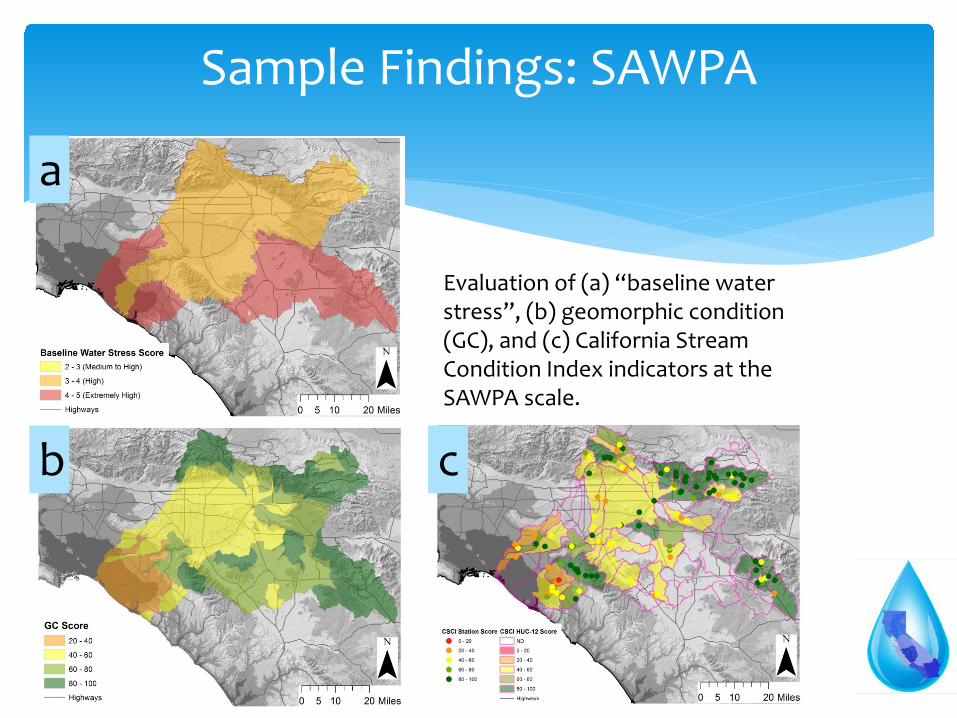
Evaluation of (a) “baseline water stress”, (b) geomorphic condition (GC), and (c) California Stream Condition Index indicators at the SAWPA scale.
a
b c
Sample Findings: SAWPA
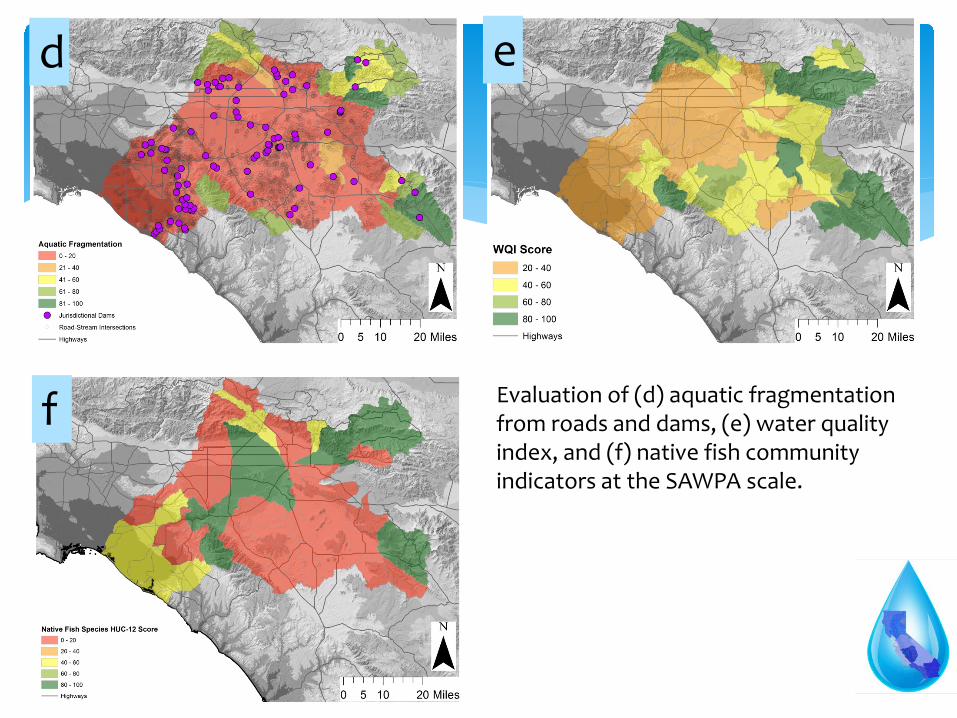
Evaluation of (d) aquatic fragmentation from roads and dams, (e) water quality index, and (f) native fish community indicators at the SAWPA scale.
e
f
d

Evaluation of (g) sea level rise threats to infrastructure, wetlands, and population and (h) nitrate in groundwater indicators at the SAWPA scale.
g
h

31
Water Footprint
• Blue, green, and grey • Water consumption • Internal and external

32
Examples
Units = liters/pound/serving Source: http://virtualwater.eu/

32 18 14
Blue 28
13
8
67
Green 72
0
10
20
30
40
50
60
70
80
90
100
Footprint of productsproduced in California
Footprint of productsproduced in California and
exported
Footprint of productsimported and consumed in
California
Total Water Footprint ofCalifornia
Mill
ion
Acr
e-Fe
et P
er Y
ear
California’s Water Footprint in 2010 (*gray water footprint not calculated)
33
Internal Water Footprint External WF

California’s Water Footprint, 1992- 2010
34
-
20
40
60
80
100
120
1992 1997 2002 2007 2010
Mill
ion
Acr
e-Fe
et P
er Y
ear
External WF(Foreign)
External WF(USA)
Internal WF
Exports

Like all measurements, the water footprint has several types and sources of variation. An individual’s WF can vary with income, diet, and consumption patterns. California’s WF for agricultural production varied due to variations in crop-specific irrigation and evapotranspiration rates, which affects the WF.
Sources of Variation
35
Table 1. % Change in CA Water Footprint and its components due to variability of water footprints of the nine main crops statewide 1992 1997 2002 2007
% Change in CA Water Footprint of Agricultural Production Lower bound* -27% -27% -27% -26% Upper bound* +33% +33% +34% +33%
% Change in CA Blue Water Footprint Lower bound* -24% -24% -20% -23% Upper bound* +29% +29% +25% +29%
% Change in CA Water Footprint Lower bound* -12% -10% -7% -8% Upper bound* +14% +12% +9% +10%
Note: * Lower and upper bounds of the 95% confidence interval.

Web-Based Decision Support Tool
∗ Global indicators catalog ∗ Water Plan indicators ∗ Evaluated indicators at state and region scales ∗ Geo-portal ∗ What-if scenarios
http://indicators.ucdavis.edu

Structure
Home
Global Sustainability
Indicators Catalog CA Sustainability
Indicators
Open Layers Map
Tool
Recommended WP Indicators
Evaluated WP Indicators
Results Narrative Data
Data Store


Ecosystem Tools
Land/Community Mapping Tools
Water Supply Tools
Water Quality Tools
California Water Sustainability
Decision Support Tool (UCD, DWR,
USEPA)
Queryable map web-
service
EPA Sustainability
Tools: Ecological footprint, water
footprint, Vegetation
index, Ground-water
assessment
Water Data Library (DWR)
IWRIS (DWR)
Water PIE (DWR)
CDEC (DWR)
NWIS-Flows (USGS)
Healthy Watershed
Initiative (USEPA)
WQX (EPA/USGS)
CSCI (SWRCB)
CASIL
Searchable indicator
library
BIOSIS (DFG)
NLCD (USGS)
Transportation (Caltrans)
Census
Searchable indicator
results
CALVEG (DFG)
MyWater Portals
(SWRCB)
CALFIRE CEDEN (SWRCB)
DRINC, GAMA (DPH/SWRCB)
PISCES (UCD)

∗ Support integrated, federated water information system for CA (potentially useful in times of drought), for example My Water Quality + Water PIE + DRINC
∗ Support development of real-time/automated indicators, integrated with information systems (saves $)
∗ Support annual water sustainability report cards for water flows, supplies, replenishment, quality, biota, cycling, use, etc.
∗ Support agency/academy collaboration to report on sustainability in general
CWQMC Opportunities
