managing diversity by creating team identity - usc create · managing diversity by creating team...
TRANSCRIPT
Journal of Economic Behavior & OrganizationVol. 58 (2005) 371–392
Managing diversity by creating team identity
Catherine C. Eckela,1, Philip J. Grossmanb,∗a Department of Economics, Virginia Tech, 3016 Pamplin Hall, Blacksburg, VA 24061, USA
b Department of Economics, St. Cloud State University, 720 4th Avenue South,SH 386, St. Cloud, MN 56301, USA
Received 13 August 2002; received in revised form 9 May 2003; accepted 28 January 2004Available online 21 January 2005
Abstract
This paper explores the extent to which team identity can deter shirking and free-riding behavior ina team production setting. Team identity is manufactured and identification is enhanced by a variety ofmeans. Created team identity is chosen over existing team identity to ensure that all subjects recognizetheir own (and others’) team identity. Subjects then participate in a repeated-play public goods game,framed as a team production problem. Analysis of the experiments compares aggregate team decisionsbased on the strength of team identity.© 2004 Elsevier B.V. All rights reserved.
JEL classification: C92; M54
Keywords: Diversity; Experiments; Identity; Public goods; Teams
1. Introduction
An increasingly common feature of the workplace is the use (and centrality) of teamsin the production process.Gordon (1992)reports that 82 percent of companies with 100 ormore employees use teams.Lawler et al. (1995)find more than a doubling between 1987and 1993 in the percentage of Fortune 1000 companies reporting the use of self-managing
∗ Corresponding author. Tel.: +1 320 255 4232; fax: +1 320 255 2228.E-mail addresses: [email protected] (C.C. Eckel), [email protected] (P.J. Grossman).
1 Tel.: 1 540 231 7707; fax: 1 540 231 5097.
0167-2681/$ – see front matter © 2004 Elsevier B.V. All rights reserved.doi:10.1016/j.jebo.2004.01.003
372 C.C. Eckel, P.J. Grossman / J. of Economic Behavior & Org. 58 (2005) 371–392
teams (from 28 percent to 68 percent). The premise motivating the growing use of teams isthat they provide an efficient and flexible way to coordinate production requiring a diversityof skills, talents, and information.
Another increasingly common feature of the workplace is the degree of diversity in theworkforce. The concept of diversity has multiple dimensions (McGrath et al., 1995). Onedimension has been categorized as informational diversity (Jehn et al., 1999). Informationaldiversity encompasses the mix of information set, talents, skills, or visions that differentworkers bring to a team. As no one individual is likely to possess the full complement oftask-related characteristics necessary to achieve the desired goals, team diversity may permitgreater productivity than could be achieved by individual effort. The cross-fertilizationpossible in a diverse work team leads to more creativity; diverse teams are more effective(Northcraft et al., 1996). Furthermore, diverse work teams make each team member moreefficient; the productivity of any team member is greater as a result of the interactionwith other team members. Team members complement one another rather than serve assubstitutes for one another.
A second dimension of diversity, and the focus of this paper, is social category (de-mographic) diversity. Team members may be of different sexes, racial groups, or ethnic,social, or cultural backgrounds. Social identity theory suggests that members of a team thatis heterogeneous with respect to social categories may find it difficult to integrate their di-verse backgrounds, values, and norms and work together (seeJehn et al., 1999, for a reviewof some of the findings). As Northcraft et al. note, “the discomfort or apprehension thatindividuals experience when interacting with members of a different social category is anatural consequence of social identification processes” (80). In general, people feel morecomfortable working with and are more likely to trust and cooperate with those whom theyidentify with, and they are more likely to identify with members of their own characteristicgroup.
Whether along sex, race, or ethnic lines, the degree of social category diversity in theworkplace is increasing. Over the past four or five decades, women’s labor force partic-ipation rate has steadily risen relative to men’s (from 33.9 percent versus 86.4 percentfor women and men, respectively, in 1950 to 60.0 percent versus 74.7 percent in 1999).1
At the same time, the choice of occupations open to women and minorities has widenedconsiderably. For example, between 1983 and 1998, women, Blacks, and Hispanics in-creased their representation in managerial and professional specialty occupations from40.9, 5.6, and 2.6 percent, respectively, to 49.5, 8.0, and 5.0 percent. All three groupsalmost doubled their shares in the engineering profession from 5.8, 2.7, and 2.2 per-cent, respectively, to 10.6, 4.6, and 3.5 percent. Similar advances were made in healthdiagnosis (physicians and dentists) and legal occupations (U.S. Census Bureau, 2000b,Table 669).
A comparison of the 1990 and 2000 Census of Population gives a further indicationof the extent of the racial diversification that the workplace has already undergone and islikely to undergo in the future. Between 1990 and 2000, the U.S. population grew by 13.2percent (32.7 million persons). The fastest growing major racial groups are Hispanic orLatino, 57.9 percent (13.0 million persons); Asian, 52.4 (3.5 million persons); and Black
1 Council of Economic Advisors (2001, TableB-39).
C.C. Eckel, P.J. Grossman / J. of Economic Behavior & Org. 58 (2005) 371–392 373
or African American, 16.2 percent (4.7 million persons). By comparison, Whites haveincreased by 3.4 percent (6.4 million persons).2
If the maximum benefits are to be obtained from team production, it is imperative thatdistrust, lack of cooperation, and general unwillingness to work with others created bysocial category diversity be overcome. Effective teamwork requires members to recognizethe team as a unit with common goals, values, and norms (Lembke and Wilson, 1998). Themore that team members identify with one another, the more likely they are to believe theyhold similar goals, values, and norms, and the more willing they will be to cooperate andwork together as a team. An individual who perceives herself as a member of a team ismore likely to perceive the fate of the team as her own (Ashforth and Mael, 1989). Thiscommonality is more likely to be recognized if team members are, or perceive themselvesto be, of the same social category.
While many aspects of a person’s social identity (age, race, sex, or ethnicity) are im-mutable, work in social identity theory suggests that social identity can be manufactured.Gaertner et al. (1993)found that manipulations of seemingly irrelevant variables createdcommon group identity sufficient to diminish or eliminate negative bias arising from diver-sity in other social category factors.
This paper reports the results of a series of laboratory experiments designed to testwhether manufactured team identity can increase subjects’ tendency towards cooperativebehavior. We conduct a series of repeated-play, public goods experiments framed as a teamproduction problem to test the impact of team identification on cooperative behavior. Teammembership is by random assignment. Team identity is varied from none (random assign-ment with no team identification) to weak (random assignment with team identification),to strong (random assignment with team identification, prior team goal attainment, andingroup/outgroup conflict). We find that cooperation is unaffected by simple, and artifi-cial, team identity (i.e. assignment to an identifiable team), but does increase significantlywhen team identification is enhanced by having team members cooperate on achieving anunrelated, preproduction goal.
2. Team production and shirking
Team production “is production in which (1) several types of resources are used and(2) the product is not a sum of separable outputs of each cooperating resource” (Alchianand Demsetz, 1972, p. 779). The problem of shirking arises if the resources are ownedby more than one person. If the joint output is shared among the team and the marginalproduct of individual team members is not observable, agents have an incentive to shirk(i.e. to withhold their inputs from the team).Holmstrom (1982)has shown that there existsno sharing rule that will yield an efficient outcome when the joint output is fully sharedamong the agents.3
2 The figures cited represent the minimum change in population for each race between 1990 and 2000. See,U.S.Census Bureau (1990, 2000a).
3 There is a considerable literature that examines ways to eliminate shirking via incentive mechanisms that aredesigned to elicit optimal effort (see, for example,Groves, 1973; Holmstrom, 1979, 1982; Itoh, 1991, andRadner,1986).
374 C.C. Eckel, P.J. Grossman / J. of Economic Behavior & Org. 58 (2005) 371–392
Economic theory suggests that in the absence of effective monitoring, team productionmethods should not be able to exist (seeHolmstrom, 1982). Nevertheless, team productionis a relatively common method of production used across a wide spectrum of industries.Among organizations employing teams, an average of 50 percent of all employees are mem-bers of a team (Gordon). The stereotypical sports team is a standard example.Katzenbachand Smith (1994)reference 47 examples of team production from a variety of differentindustries.4
The importance of team interest, the role this factor may play in team production, andhow to accentuate team orientation are considered by Alchian and Demsetz. They argue that“[I]f one could enhance a common interest in non-shirking in the guise of a team loyaltyor team spirit, the team would be more efficient” (790). In their guide to building teamsand enhancing team production, Katzenbach and Smith continually stress the importanceof a team purpose; common purpose, performance goals, and approach; and a set of rulesand commitments plus roles and responsibilities. Their “requirements” for productive teamperformance are just another way of defining the factors that social psychologists wouldargue help to define a group and give a group cohesion: common attitudes, values, andnorms.
3. Team identity and cooperative behavior
The theory of team behavior from social psychology offers a possible explanation forthe presence or absence of cooperative behavior by members of teams that produce jointgoods. The basis for economic analysis is rational choice theory, which begins with a utility-maximizing individual. Individuals interact with other individuals only if they maximizeutility by doing so. However, while, “in the final analysis, ‘individuals’ deal with ‘indi-viduals’, they are not necessarily dealing with each other as individuals; quite often theybehave primarily as members of well-defined and clearly distinct social categories” (Tajfel,1978, p. 27). Discrimination is an obvious example of individuals dealing with others notas individuals but as members of a group. The landlord who refuses to rent his apartment toa prospective tenant may balk, not because of individual characteristics, but rather becausethe individual is of the “wrong” racial, religious, or social group. Group, or social, iden-tification “is the perception of oneness with or belongingness to some human aggregate”(Ashforth and Mael, 21). A feeling of membership in a group can create the perception thatthe group’s fate and one’s own fate are the same.
A person’s social identity (how others see and react to her) is determined in part bythe different groups she is identified with and whether she is of the same group(s) as theidentifier. A person’s attitudes, values, and norms may be shaped by the groups to which shebelongs. How two people interact will be affected by a commonality in attitudes, values,and norms and their ability to predict the existence of such a commonality. One factorinfluencing the ability (actual or perceived) to predict commonality is group identity. Thebehavior of a fellow group member may be perceived to be more predictable than the
4 Evidence of shirking in team production is offered byLatane et al. (1979)andWeldon and Gargano (1988).
C.C. Eckel, P.J. Grossman / J. of Economic Behavior & Org. 58 (2005) 371–392 375
behavior of someone outside one’s own group. Members of a group are thought to possesssimilar beliefs, and persons are likely to be categorized into groups based on visual clues(Wilder, 1986).
Research in social psychology offers considerable evidence that group identity condi-tions individuals’ interactions.Campbell (1958)suggests that one possible consequence ofsorting individuals into groups, either on a random or more formal basis, is to enhance thecooperative tendencies of individuals. At one level, the mere act of categorizing of peopleinto groups leads to more positive assessments of fellow group members (seeDowning andMonaco, 1986).
At another level, the act of categorization may have economic implications. Can groupidentification suppress self-interest in favor of collective interest?Cox et al. (1991)andEspinoza and Garza (1985)find greater cooperative play on the part of subjects from mi-nority ethnic groups when playing with partners of the same or other minority ethnic groupsthan when playing in mixed Anglo/minority groups.Leung and Bond (1984)report morecooperative behavior among university students in Hong Kong than among American uni-versity students.5 Cox et al. and Leung and Bond ascribe the enhanced level of cooperationto an expectation on the part of subjects that other subjects coming from the same “collec-tivist culture” would share a collectivist orientation, determining that it was safe to play acooperative strategy.Eckel and Grossman (2001)find that women are more accepting ofoffers from other women,ceteris paribus, in ultimatum games, a result that is likely to bebased on gender-identified expectations.6
A second set of studies employs artificially created group identity. Often group identitywas created by no more than the random assignment of subjects into different groups.Allen and Wilder (1975)assign subjects to two groups based on “aesthetic preference.”Subjects are given a task of dividing rewards between in- and out-group members. In-groupmembers are favored under all conditions.Rabbie and Horwitz (1969)find that a simplecoin flip to decide receipt of a gift generated significant in-group bias. In a series of threedifferent dilemma games,Wit and Wilke (1992)find that randomly assigned subjects aresignificantly more cooperative with in-group members.
In two studies of group identity in commons dilemma games (Kramer and Brewer,1984, andBrewer and Kramer, 1986), individual restraint (cooperation) is greatest whengroup identity is most salient. This is true both when group identity is defined by naturallyoccurring categories and when group identity is manipulated by the researchers.Brewer(1979)reviews a series of papers reporting such in-group bias. The reported results supportthe proposal that “one effect of group identification may be that individuals attach greaterweight to collective outcomes. . . making it less likely that individuals will make sharpdistinctions between their own and others’ welfare” (Kramer and Brewer, 1984, p. 1045).
Group identity may also be defined by status. Status differentials may result in an indi-vidual acting differently towards in-group members (others of equal status) than he doestowards out-group members (others of lesser or higher status).Turner (1978)says this is
5 Only in the Leung and Bond study were subjects’ earnings a function of their decisions made in the experiment.6 A study byKachelmeier and Shehata (1992)looked at the effects of culture (China, Canada, and U.S.A.) on
competitive markets. While they observed some cultural differences in price convergence trends, there were nocultural differences in price levels.
376 C.C. Eckel, P.J. Grossman / J. of Economic Behavior & Org. 58 (2005) 371–392
because people attach a positive value to being able to differentiate themselves from others,especially in a positive light.Brewer and Brown (1998)argue that conferring status on agroup legitimizes their superiority and makes them feel that they deserve, and thus shouldwork to obtain, better outcomes for members of their group.7
In our experiments, we induce team identity using several different procedures. Fromthe results of earlier research, we anticipated that it would be relatively easy to induceteam identity and to get greater cooperation among members of the teams so formed. Wealso introduced an unrelated team task to enhance subjects’ team identification. Finally, weintroduce ingroup/outgroup competition by conducting the experiment under tournamentconditions.
4. Experimental design
Subjects participated in a public good experiment framed as a team production problem.8
In each decision period, a subject was provided 100 time units (TUs). TUs could beallocated between either leisure activities, where they earned the subject $0.005 perTU, or to teamwork. Each TU allocated to teamwork produced a unit of output, andthe total output produced by the team determined the size of the team bonus. EachTU produced one unit of output, and each unit of output sold for $0.01. All sub-jects shared equally in any team bonus. Subjects played one practice decision period,which did not count towards their final earnings, and then fifteen decision periods forpay. (An appendix of representative experiment instructions is available on the JEBOwebsite.)9
The experiments were conducted under six different treatments designed to test theimpact of team identity on team production.
4.1. ID1—baseline procedure
Subjects were recruited to one room and randomly assigned to teams of five. Subjectswere told that their team consists of themselves and four other subjects. The membershipof the team was not revealed. Teams were referred to as team 1, 2, 3, or 4. Subjects thenreceived instructions for the experiment.
7 Studies byCommins and Lockwood (1979), Hoffman and Spitzer (1985), Sachdev and Bourhis (1987), andHagendoorn and Henke (1991)support these arguments.
8 Framing the experiment as an individual versus team production problem, as opposed to the individual versusgroup investment framing of the more typical public goods games (see, for example, the sample instructions inDavis and Holt, 1993, pp. 370–374), allows for a test of the impact of framing on subject behavior. In the proposedexperiment, the actions taken by subjects are identical to those taken in a typical public goods game, the onlydifference being the reference to team production as opposed to group investment. This is a much more delicatetest of the framing hypothesis.
9 In treatmentsID1–ID2, subjects received 80 TUs; each TU allocated to leisure activities earned the subject$0.01, while output produced by the team sold for $0.02 per unit. Data were analyzed in terms of percent of TUscontributed to teamwork, so this difference should have only minimal effect.
C.C. Eckel, P.J. Grossman / J. of Economic Behavior & Org. 58 (2005) 371–392 377
4.2. ID2—team color treatment
In this treatment, subjects were randomly assigned to one of four teams (blue, gold,green, or red) and seated at five tables with four subjects per table. One subject from eachteam was seated at each table. Teams were identified by an appropriate colored tag wornby each subject during the course of the experiment. During the experiment, experimenterscontinually referred to subjects by their group color. As with treatmentID2, subjects couldidentify fellow team members, but there was no interaction amongst team members.
4.3. ID3—quiz treatment
Subjects in this treatment completed a five-question trivia quiz and were told that theirscores would determine the allocation of subjects to teams. (Subjects were not told howtheir scores would be determined.) Quiz questions required numerical answers. Scores weredetermined by summing the answers given with those subjects with the “highest” score beingallocated to team one, etc. Subjects could identify fellow team members by colored tags,but there was no interaction among team members.
4.4. ID4—puzzle treatment
Subjects were randomly allocated to a team with team membership indicated by a coloredtag. To create a stronger sense of team identity, teams participated in an unpaid group taskrequiring cooperation before the start of the team production problem. Each subject in agroup was given an envelope containing parts from one or more of five equal sized squares.Group members had to leave their tables and go about the room to seek each other out andwork together, exchanging pieces until each member had constructed a square. After allteams had completed their squares, the team production exercise began.
4.5. ID5—wage treatment
This treatment followed the same procedures ofID4, with the added incentive to allocateunits to teamwork of a nominal private return for doing so. In addition to a share in the teambonus, a subject also received a “wage” for the teamwork performed. For every time unitallocated to teamwork, the subject received a wage of $0.001 in addition to the subject’sshare of the team bonus.
4.6. ID6—tournament treatment
Finally, to enhance team identity even further by creating ingroup/outgroup conflict, theID5 treatment was repeated but under tournament conditions. The first five decision periodsof the team production problem were conducted as a tournament. Two teams were pairedoff (e.g. blue against gold, green against red) with the team producing the higher total teamoutput receiving a team bonus of $1.00 per team member. The team with the lower totalteam output was penalized $1.00 per team member. Cumulative team output was postedafter each of the first five decision periods so subjects could assess their teams’ relative
378 C.C. Eckel, P.J. Grossman / J. of Economic Behavior & Org. 58 (2005) 371–392
performance. The final ten decision periods were conducted in the same manner as in theother treatments.
5. Data analysis: strong identity versus weak identity
A total of 450 subjects were recruited from undergraduate courses in economics, an-thropology, geography, sociology, and business and by word of mouth at the University ofTexas—Arlington and Saint Cloud State University. All subjects received a $5 appearancefee and earnings averaged $13.70 per subject. Four sessions of theID1 procedure (witha total of 16 teams), three sessions of theID2 procedure (with a total of six teams), twosessions of theID3 procedure (with a total of eight teams), six sessions of theID4 procedure(with a total of 12 teams), eight sessions of theID5 procedure (with a total of 27 teams),and six sessions of theID6 procedure (with a total of 21 teams) were conducted.
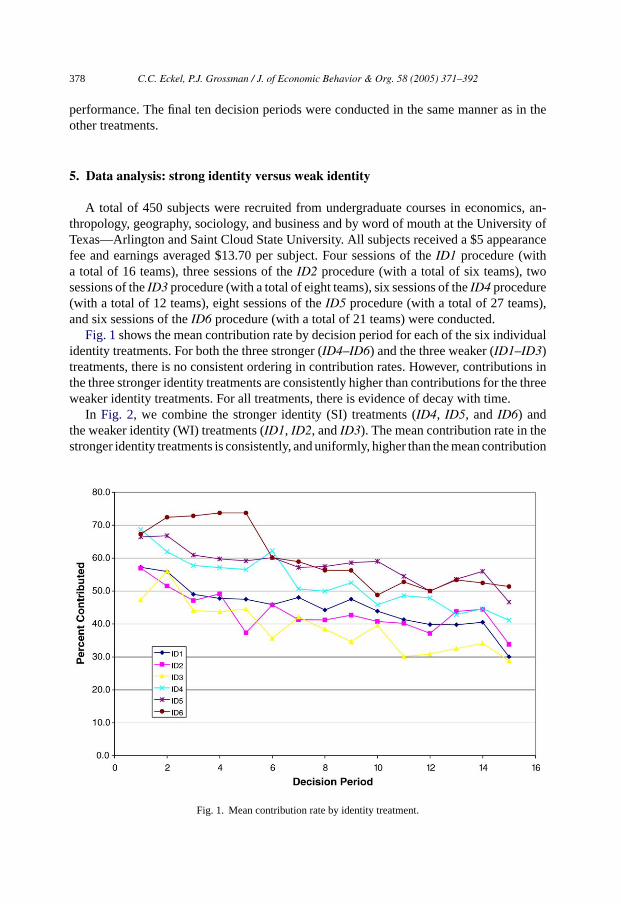
Fig. 1shows the mean contribution rate by decision period for each of the six individualidentity treatments. For both the three stronger (ID4–ID6) and the three weaker (ID1–ID3)treatments, there is no consistent ordering in contribution rates. However, contributions inthe three stronger identity treatments are consistently higher than contributions for the threeweaker identity treatments. For all treatments, there is evidence of decay with time.
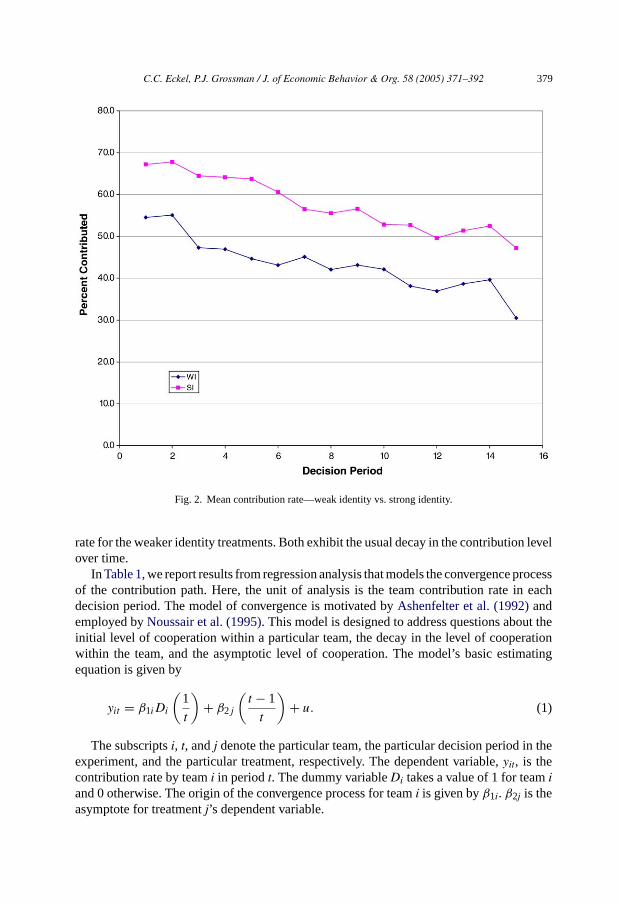
In Fig. 2, we combine the stronger identity (SI) treatments (ID4, ID5, and ID6) andthe weaker identity (WI) treatments (ID1, ID2, andID3). The mean contribution rate in thestronger identity treatments is consistently, and uniformly, higher than the mean contribution
Fig. 1. Mean contribution rate by identity treatment.
C.C. Eckel, P.J. Grossman / J. of Economic Behavior & Org. 58 (2005) 371–392 379
Fig. 2. Mean contribution rate—weak identity vs. strong identity.
rate for the weaker identity treatments. Both exhibit the usual decay in the contribution levelover time.
In Table 1, we report results from regression analysis that models the convergence processof the contribution path. Here, the unit of analysis is the team contribution rate in eachdecision period. The model of convergence is motivated byAshenfelter et al. (1992)andemployed byNoussair et al. (1995). This model is designed to address questions about theinitial level of cooperation within a particular team, the decay in the level of cooperationwithin the team, and the asymptotic level of cooperation. The model’s basic estimatingequation is given by
yit = β1iDi
(1
t
)+ β2j
(t − 1
t
)+ u. (1)
The subscriptsi, t, andj denote the particular team, the particular decision period in theexperiment, and the particular treatment, respectively. The dependent variable,yit, is thecontribution rate by teami in periodt. The dummy variableDi takes a value of 1 for teamiand 0 otherwise. The origin of the convergence process for teami is given byβ1i. β2j is theasymptote for treatmentj’s dependent variable.
380 C.C. Eckel, P.J. Grossman / J. of Economic Behavior & Org. 58 (2005) 371–392
Table 1Convergence points for contributions to the team (standard errors in parentheses)
Model 1
ID1 ID2 ID3 ID4 ID5 ID6
Convergencepoint(standarderror)
39.92 (1.28) 35.39 (2.89) 33.69 (1.48) 46.23 (1.57) 53.58 (1.23) 59.89 (1.50)
N 1350Log
Likelihood−5215.53
All teams
Model 2A Model 2B
Convergence point (standard error) 48.54 (0.66) 39.65 (0.85)Wage (standard error) . . . 16.41 (1.28)N 1350 1350Log Likelihood −5253.76 −5226.73Likelihood ratio test (vs. model 1) 76.46 22.40p-Value <0.001 <0.001Likelihood ratio test (model 2A vs. model 2B) 54.06p-Value <0.001
Model 3A Model 3B
Weak identityteams
Strong identityteams
Weak identityteams
Strong identityteams
Convergence point(standard error)
37.11 (0.97) 53.52 (0.82) 37.11 (0.97) 56.23 (1.57)
Wage (standard error) . . . . . . 9.83 (1.83)N 1350 1350Log Likelihood −5227.87 −5222.06Likelihood ratio test (vs. model 1) 24.68 13.06p-Value <0.001 <0.025Likelihood ratio test (model 3A vs.
model 3B)11.62
p-Value <0.001
Model 4
Weak identity teams ID4 ID5 ID6
Convergence point (standard error) 37.11 (0.97) 46.23 (1.57) 53.28 (1.23) 59.89 (1.50)N 1350Log Likelihood −5217.99Likelihood ratio test (vs. model 1) 4.92p-Value <0.09Likelihood ratio test (vs. model 3A) 19.68p-Value <0.001
Note: Estimated starting points for each team are suppressed.
C.C. Eckel, P.J. Grossman / J. of Economic Behavior & Org. 58 (2005) 371–392 381
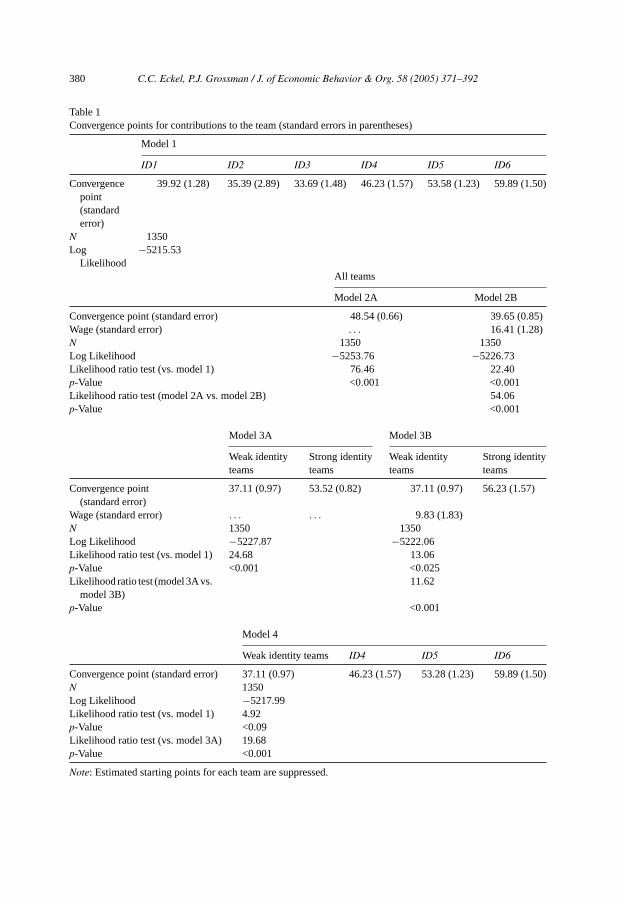
We use this technique to examine the impact of the treatment (team identity) on theending point on the convergence path.10 We estimated the starting point for each team and:(1) asymptotes (convergence points) for each of the identity treatments (model 1), (2) acommon convergence point for all six identity treatments (models 2A and 2B), (3) commonconvergence points for the combined weak identity (WI) treatments and for the combinedstrong identity (SI) treatments (models 3A and 3B), and (4) common convergence pointsfor the combined weak identity (WI) treatments and separate convergence points for eachof the strong identity treatments.11 Table 1suppresses the starting points and reports onlythe convergence values.
Models 2A and 2B and 3A and 3B differ only in the inclusion of a dummy variable,WAGE, indicating whether a wage was paid to subjects contributing work units to teamwork(WAGE = 1 if yes, 0 otherwise). Inclusion of WAGE controls for the private incentive tocontribute to teamwork beyond the team solidarity incentive.
The results reported for model 1 indicate that the convergence points for the threeweak identity treatments are consistently below the convergence points for the threestrong identity treatments. While there is little variation in convergence points amongthe WI treatments, the convergence points for the SI treatments are directly relatedto the strength of team identity. The results suggest that minimal team identification(i.e. assignment of a team label) is alone insufficient to overcome self-interest. Anenhanced sense of identification created by working together on an unrelated and unpaidproject significantly enhances the subjects’ cooperative tendencies relative to theirself-interest.
A Likelihood ratio test of the unrestricted model 1 to model 4, which restricts theID1,ID2, andID3 treatments to a common convergence point, cannot reject, at the 95 percentconfidence level, the null hypothesis of a common convergence point (χ2(2) = 4.92,p-value = 0.085). A Likelihood ratio test, unreported, of the unrestricted model 1 to one thatrestricts theID4, ID5, ID6 treatments to a common convergence point rejects the nullhypothesis (χ2(2) = 19.78,p-value < 0.001).
To highlight the importance of a strong sense of team identity, we compared model 2A(common convergence point for all treatments) to model 3A (separate common convergencepoints for WI treatments and for SI treatments). The convergence level of contributions byteams in the WI treatments averaged approximately 30 percent less than the convergencelevel of contributions by teams in the SI treatments (37.1 percent versus 53.5 percent). ALikelihood ratio test rejects the null hypothesis of a common convergence point for the WIand SI treatments (χ2(2) = 51.78,p-value < 0.001).
Finally, in models 2B and 3B, we control for the impact of the private wages paid tocontributors of work units to teamwork. Wages were only paid to teams in theID5 andID6 treatments. In both models, WAGES significantly increases contributions to teamwork.
10 As Noussair et al. note, “analysis of the data. . . encounters some classical problems that exist in the analysisof almost all data produced in experimental markets. . . a convergence process that is not understood theoretically[and] this means that serial correlation is present, and heteroscedasticity may be present” (472). The method ofcorrection employed isKmenta (1986)cross-sectionally heteroskedastic and time-wise autoregressive model (seepages 618–622). SHAZAM is the statistical package used to estimate the model.11 Other models were estimated, but the results have been suppressed as they added nothing to the findings.
382 C.C. Eckel, P.J. Grossman / J. of Economic Behavior & Org. 58 (2005) 371–392
Table 2Pair-wise Mann–Whitney test statistics
Treatment ID1 ID2 ID3 ID4 ID5
ID2 0.40ID3 1.52 0.86ID4 0.56 0.81 1.91ID5 2.40* 2.10* 3.52* 1.57ID6 2.86* 2.46* 3.87* 2.03* 0.66
* p-Value < 0.05.
However, as evident from a comparison of models 3A and 3B, the payment of wages doesnot significantly alter the convergence point for SI teams.
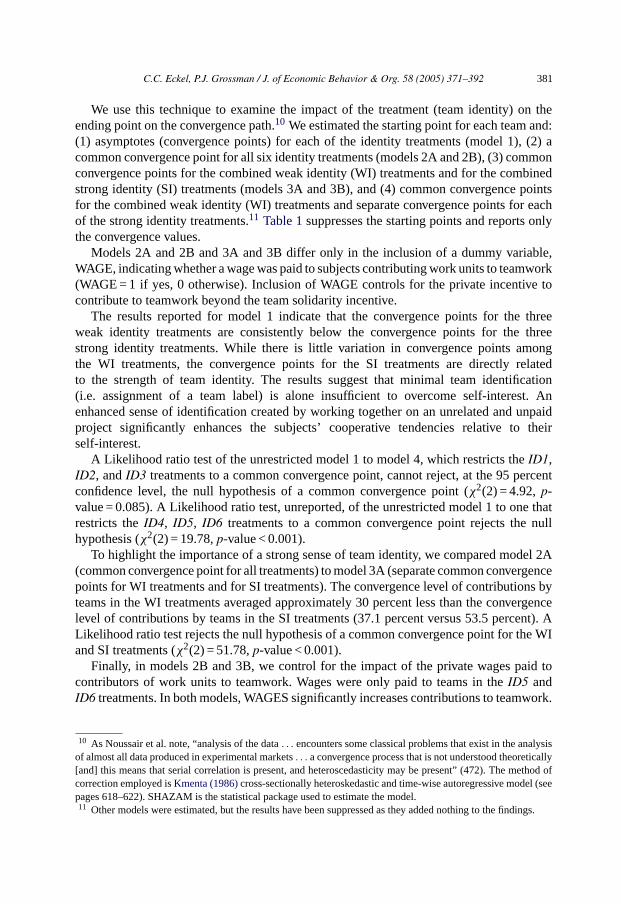
Finally, we conducted nonparametric tests that confirm our regression results.12 Afterestimating Eq.(1) separately for each team and generating individual team convergencepoints, we conducted a Kruskal–Wallis test of the null hypothesis that the population distri-bution functions are identical for all six treatments,ID1–ID6. The test statisticχ2 = 19.64(critical valueχ2(5) = 11.07,p-value < 0.05) indicates the rejection of the null hypothesis.We then conducted pair-wise Mann–Whitney tests (seeTable 2for the calculatedz statis-tics). The null hypothesis that the pair-wise samples are drawn from the same populationcan only be rejected forID5 teams andID1–ID3 teams andID6 teams andID1–ID4 teams.We then combined the weaker identity teams and the stronger identity teams and conducteda Mann–Whitney test. The test statistic,z = 3.77 (p-value < 0.001) indicates the rejection ofthe null hypothesis that the population distributions are identical.
6. Data analysis: tournaments
Nalbantian and Schotter (1997)have shown that [T]ournament-based group incentivemechanisms that create competition between subgroups. . . determine higher mean outputs. . .” (315). They, however, applied the tournament incentives to all decision periods. Inthis study, we were concerned with whether or not initial cooperation fostered by tourna-ment incentives would create sustained team identification even after these incentives wereremoved.
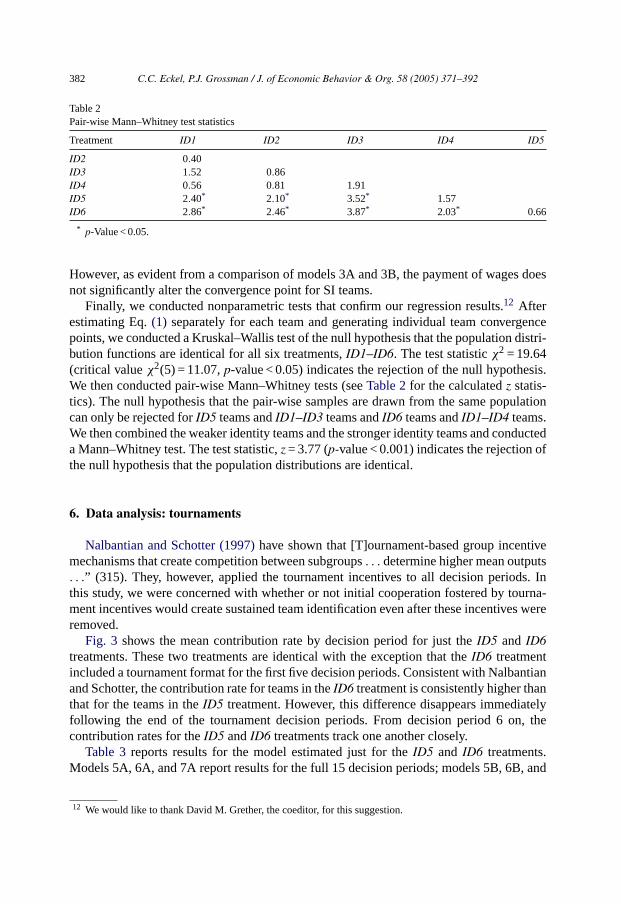
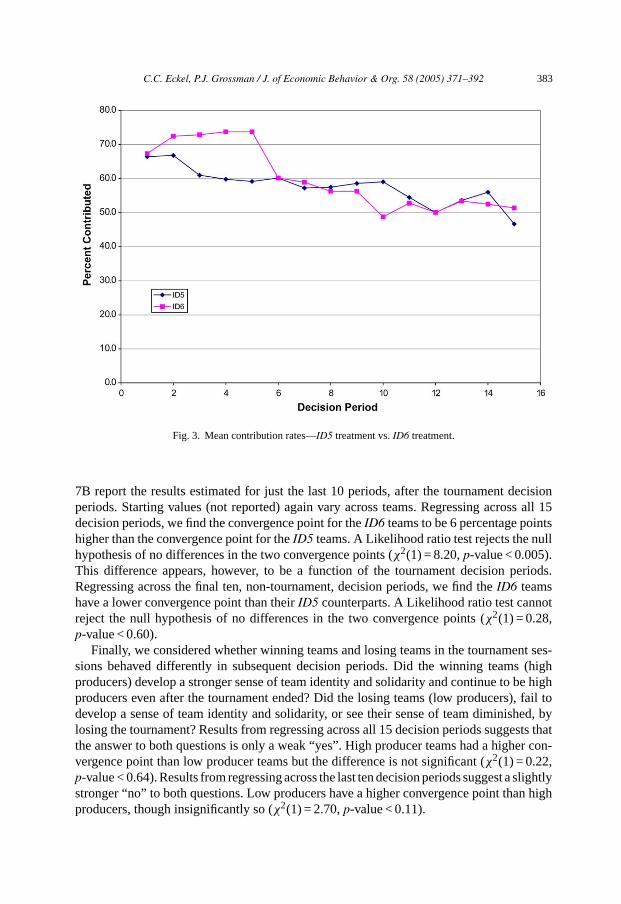
Fig. 3 shows the mean contribution rate by decision period for just theID5 and ID6treatments. These two treatments are identical with the exception that theID6 treatmentincluded a tournament format for the first five decision periods. Consistent with Nalbantianand Schotter, the contribution rate for teams in theID6 treatment is consistently higher thanthat for the teams in theID5 treatment. However, this difference disappears immediatelyfollowing the end of the tournament decision periods. From decision period 6 on, thecontribution rates for theID5 andID6 treatments track one another closely.
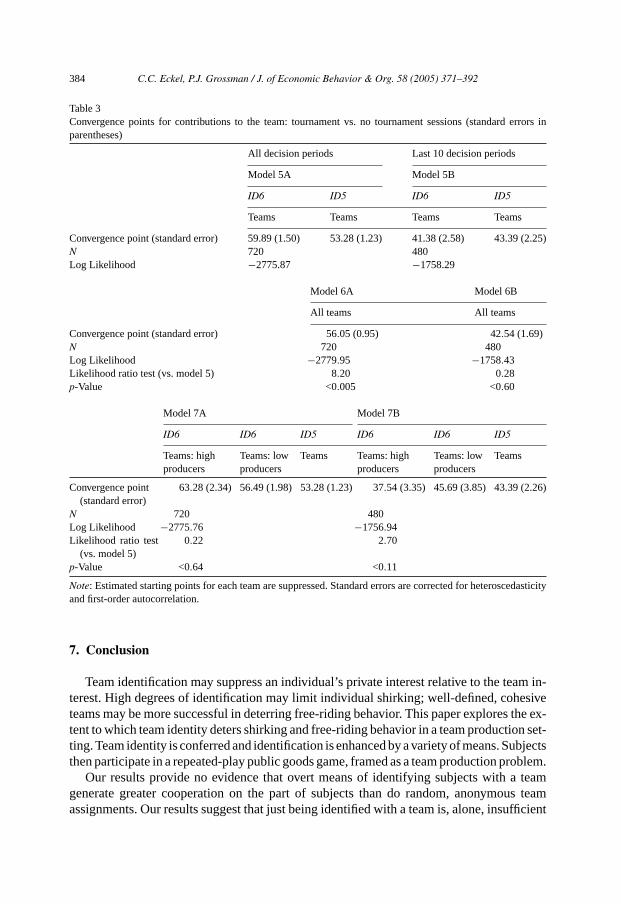
Table 3reports results for the model estimated just for theID5 and ID6 treatments.Models 5A, 6A, and 7A report results for the full 15 decision periods; models 5B, 6B, and
12 We would like to thank David M. Grether, the coeditor, for this suggestion.
C.C. Eckel, P.J. Grossman / J. of Economic Behavior & Org. 58 (2005) 371–392 383
Fig. 3. Mean contribution rates—ID5 treatment vs.ID6 treatment.
7B report the results estimated for just the last 10 periods, after the tournament decisionperiods. Starting values (not reported) again vary across teams. Regressing across all 15decision periods, we find the convergence point for theID6 teams to be 6 percentage pointshigher than the convergence point for theID5 teams. A Likelihood ratio test rejects the nullhypothesis of no differences in the two convergence points (χ2(1) = 8.20,p-value < 0.005).This difference appears, however, to be a function of the tournament decision periods.Regressing across the final ten, non-tournament, decision periods, we find theID6 teamshave a lower convergence point than theirID5 counterparts. A Likelihood ratio test cannotreject the null hypothesis of no differences in the two convergence points (χ2(1) = 0.28,p-value < 0.60).
Finally, we considered whether winning teams and losing teams in the tournament ses-sions behaved differently in subsequent decision periods. Did the winning teams (highproducers) develop a stronger sense of team identity and solidarity and continue to be highproducers even after the tournament ended? Did the losing teams (low producers), fail todevelop a sense of team identity and solidarity, or see their sense of team diminished, bylosing the tournament? Results from regressing across all 15 decision periods suggests thatthe answer to both questions is only a weak “yes”. High producer teams had a higher con-vergence point than low producer teams but the difference is not significant (χ2(1) = 0.22,p-value < 0.64). Results from regressing across the last ten decision periods suggest a slightlystronger “no” to both questions. Low producers have a higher convergence point than highproducers, though insignificantly so (χ2(1) = 2.70,p-value < 0.11).
384 C.C. Eckel, P.J. Grossman / J. of Economic Behavior & Org. 58 (2005) 371–392
Table 3Convergence points for contributions to the team: tournament vs. no tournament sessions (standard errors inparentheses)
All decision periods Last 10 decision periods
Model 5A Model 5B
ID6 ID5 ID6 ID5
Teams Teams Teams Teams
Convergence point (standard error) 59.89 (1.50) 53.28 (1.23) 41.38 (2.58) 43.39 (2.25)N 720 480Log Likelihood −2775.87 −1758.29
Model 6A Model 6B
All teams All teams
Convergence point (standard error) 56.05 (0.95) 42.54 (1.69)N 720 480Log Likelihood −2779.95 −1758.43Likelihood ratio test (vs. model 5) 8.20 0.28p-Value <0.005 <0.60
Model 7A Model 7B
ID6 ID6 ID5 ID6 ID6 ID5
Teams: highproducers
Teams: lowproducers
Teams Teams: highproducers
Teams: lowproducers
Teams
Convergence point(standard error)
63.28 (2.34) 56.49 (1.98) 53.28 (1.23) 37.54 (3.35) 45.69 (3.85) 43.39 (2.26)
N 720 480Log Likelihood −2775.76 −1756.94Likelihood ratio test
(vs. model 5)0.22 2.70
p-Value <0.64 <0.11
Note: Estimated starting points for each team are suppressed. Standard errors are corrected for heteroscedasticityand first-order autocorrelation.
7. Conclusion
Team identification may suppress an individual’s private interest relative to the team in-terest. High degrees of identification may limit individual shirking; well-defined, cohesiveteams may be more successful in deterring free-riding behavior. This paper explores the ex-tent to which team identity deters shirking and free-riding behavior in a team production set-ting. Team identity is conferred and identification is enhanced by a variety of means. Subjectsthen participate in a repeated-play public goods game, framed as a team production problem.
Our results provide no evidence that overt means of identifying subjects with a teamgenerate greater cooperation on the part of subjects than do random, anonymous teamassignments. Our results suggest that just being identified with a team is, alone, insufficient
C.C. Eckel, P.J. Grossman / J. of Economic Behavior & Org. 58 (2005) 371–392 385
to overcome self-interest. We do find, however, that actions designed to enhance team iden-tification contribute to higher levels of team cooperation. Working together on an unrelatedand unpaid project prior to the team production task significantly enhanced the subjects’cooperative tendencies relative to their self-interest. We also find evidence, consistent withthat reported byNalbantian and Schotter (1997)that tournament-based incentive mecha-nisms significantly improved team production. This increase was, however, only temporary,lasting only as long as the tournament-based incentive mechanisms were in effect. Once theincentives returned to normal, team production returned to a level similar to that for teamsthat had never operated under the tournament-based incentives.
Acknowledgements
Grossman was supported by the National Science Foundation, SBR#97-14943. We wouldlike to thank Mark Isaac and the coeditor David M. Grether, for their helpful comments andsuggestions.
Appendix A
The following instructions are for theID1—baseline procedure. The additional instruc-tions received by subjects in the strong identity treatment are included in Italics.
Instructions
Each of you has been given, at random, a packet containing pieces of cardboard. Thesepieces of cardboard will be used for forming squares. When the experimenter gives thesignal to begin, the task of your team is to form five squares of equal size. The task will notbe complete until each team member has before him/her a perfect square of the same sizeas that held by all other team members.
The following rules must be obeyed during the course of this exercise:
1. Team members may give pieces to other team members but may not take pieces fromother team members.
2. You may not simply throw pieces into the center for others to take; you must give thepiece directly to one other team member.
3. It is permissible for a team member to give away all the pieces to his/her puzzle, even ifhe/she has not already formed a square.
Please observe these rulesYou are asked to participate in a study of team and individual behavior. The instructions
are simple and if you follow them carefully and allocate your time units wisely, you mayearn a considerable amount of money. You are free to make as much money as you can.You will be paid in cash in private at the end of the session.
386 C.C. Eckel, P.J. Grossman / J. of Economic Behavior & Org. 58 (2005) 371–392
This study has been designed to maintain the anonymity of each subject’s decision andeach subject’s cash earnings. Only the proctors running the experiment will know a subject’sdecisions and cash earnings. To preserve this anonymity, we ask that from this point on,there be no talking among the subjects and that all subjects take precautions to maintain theconfidentiality of their materials.
Before we begin, please verify that you have the following items before you on yourdesk.
1 Subject’s instructions packet21 Time unit allocation forms1 Time unit record form1 Earnings receipt form
The allocation problem
You and four other people in this room have been assigned to one team. The compositionof your team will be the same for every decision period. In this study, we will conduct up to20 decision periods in which you and your fellow team members will be asked to allocateyour time between leisure activities and working for the team.
You and four other people with the same colored tags have been assigned to one team.The composition of your team will be the same for at least the first five decision periods.At the end of the fifth decision period, teams may be reconstituted for the remainder of thesession. In this study, we will conduct up to 20 decision periods in which you and your fellowteam members will be asked to allocate your time between leisure activities and workingfor the team.
In each decision period, every team member will begin with 100 time units (TUs). Yourtask is to decide how many of your TUs to allocate to LEISURE ACTIVITIES and howmany TUs to allocate to TEAM WORK. You are free to allocate some TUs to LEISUREACTIVITIES and some to TEAM WORK. Alternatively, you can allocate all of your TUsto LEISURE ACTIVITIES or all to TEAM WORK.
1. TUs allocated to LEISURE ACTIVITIES have a value of $0.005 (½ cent per TU)2. (a) For every TU you allocate to TEAM WORK you will be paid a wage of $0.001 (1/10
cent per TU). (b) In addition, all team members will share in a bonus earned by theteam. All team members will share equally in the bonus, regardless of how many TUsthey contributed to TEAM WORK. The bonus earned will be determined by the units ofoutput (we will not specify what the output is) produced by the team. TUs allocated toTEAM WORK are used to produce units of output. Each TU allocated to TEAM WORKproduces one (1) units of output. Units of output produced by the team will be sold atthe end of each decision period at the price of $0.01 (1 cent) per unit of output. Thus,the more the team is able to produce, the higher will be the team bonus.
Performance bonus/penalty
At the end of the first five decision periods, the team with the higher total team output willreceive a team bonus and the team with the lower total team output will be penalized. Each
C.C. Eckel, P.J. Grossman / J. of Economic Behavior & Org. 58 (2005) 371–392 387
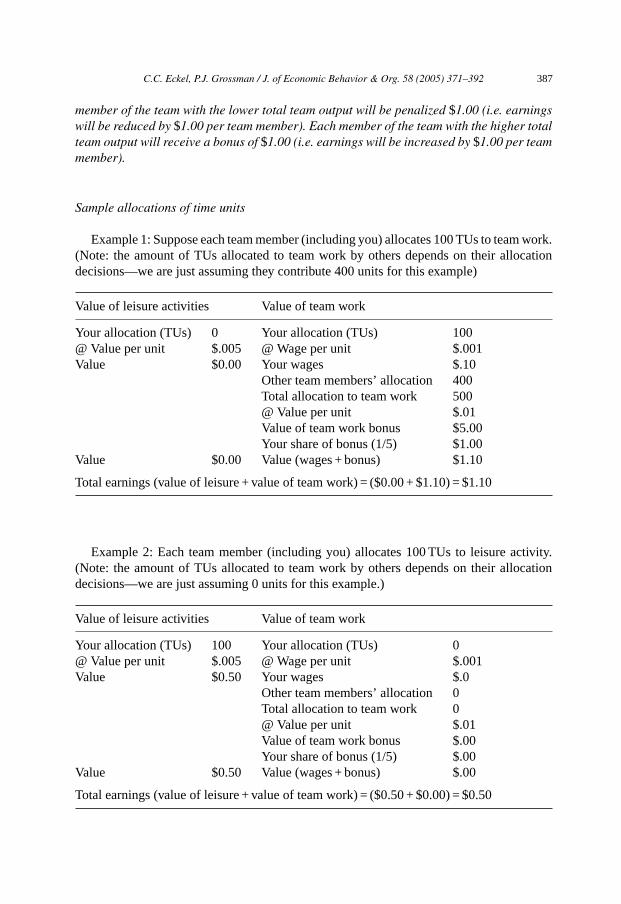
member of the team with the lower total team output will be penalized $1.00 (i.e. earningswill be reduced by $1.00 per team member). Each member of the team with the higher totalteam output will receive a bonus of $1.00 (i.e. earnings will be increased by $1.00 per teammember).
Sample allocations of time units
Example 1: Suppose each team member (including you) allocates 100 TUs to team work.(Note: the amount of TUs allocated to team work by others depends on their allocationdecisions—we are just assuming they contribute 400 units for this example)
Value of leisure activities Value of team work
Your allocation (TUs) 0 Your allocation (TUs) 100@ Value per unit $.005 @ Wage per unit $.001Value $0.00 Your wages $.10
Other team members’ allocation 400Total allocation to team work 500@ Value per unit $.01Value of team work bonus $5.00Your share of bonus (1/5) $1.00
Value $0.00 Value (wages + bonus) $1.10
Total earnings (value of leisure + value of team work) = ($0.00 + $1.10) = $1.10
Example 2: Each team member (including you) allocates 100 TUs to leisure activity.(Note: the amount of TUs allocated to team work by others depends on their allocationdecisions—we are just assuming 0 units for this example.)
Value of leisure activities Value of team work
Your allocation (TUs) 100 Your allocation (TUs) 0@ Value per unit $.005 @ Wage per unit $.001Value $0.50 Your wages $.0
Other team members’ allocation 0Total allocation to team work 0@ Value per unit $.01Value of team work bonus $.00Your share of bonus (1/5) $.00
Value $0.50 Value (wages + bonus) $.00
Total earnings (value of leisure + value of team work) = ($0.50 + $0.00) = $0.50
388 C.C. Eckel, P.J. Grossman / J. of Economic Behavior & Org. 58 (2005) 371–392
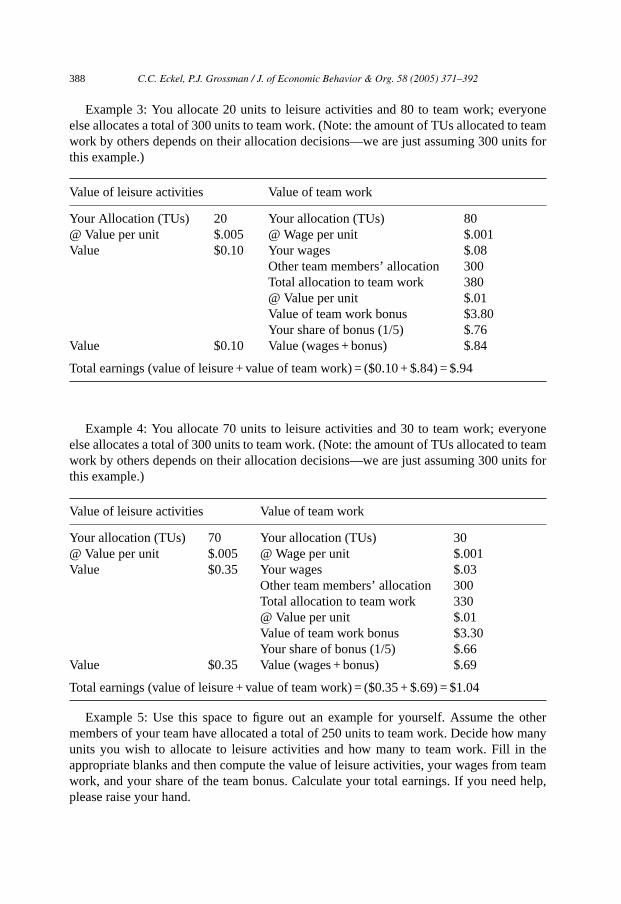
Example 3: You allocate 20 units to leisure activities and 80 to team work; everyoneelse allocates a total of 300 units to team work. (Note: the amount of TUs allocated to teamwork by others depends on their allocation decisions—we are just assuming 300 units forthis example.)
Value of leisure activities Value of team work
Your Allocation (TUs) 20 Your allocation (TUs) 80@ Value per unit $.005 @ Wage per unit $.001Value $0.10 Your wages $.08
Other team members’ allocation 300Total allocation to team work 380@ Value per unit $.01Value of team work bonus $3.80Your share of bonus (1/5) $.76
Value $0.10 Value (wages + bonus) $.84
Total earnings (value of leisure + value of team work) = ($0.10 + $.84) = $.94
Example 4: You allocate 70 units to leisure activities and 30 to team work; everyoneelse allocates a total of 300 units to team work. (Note: the amount of TUs allocated to teamwork by others depends on their allocation decisions—we are just assuming 300 units forthis example.)
Value of leisure activities Value of team work
Your allocation (TUs) 70 Your allocation (TUs) 30@ Value per unit $.005 @ Wage per unit $.001Value $0.35 Your wages $.03
Other team members’ allocation 300Total allocation to team work 330@ Value per unit $.01Value of team work bonus $3.30Your share of bonus (1/5) $.66
Value $0.35 Value (wages + bonus) $.69
Total earnings (value of leisure + value of team work) = ($0.35 + $.69) = $1.04
Example 5: Use this space to figure out an example for yourself. Assume the othermembers of your team have allocated a total of 250 units to team work. Decide how manyunits you wish to allocate to leisure activities and how many to team work. Fill in theappropriate blanks and then compute the value of leisure activities, your wages from teamwork, and your share of the team bonus. Calculate your total earnings. If you need help,please raise your hand.
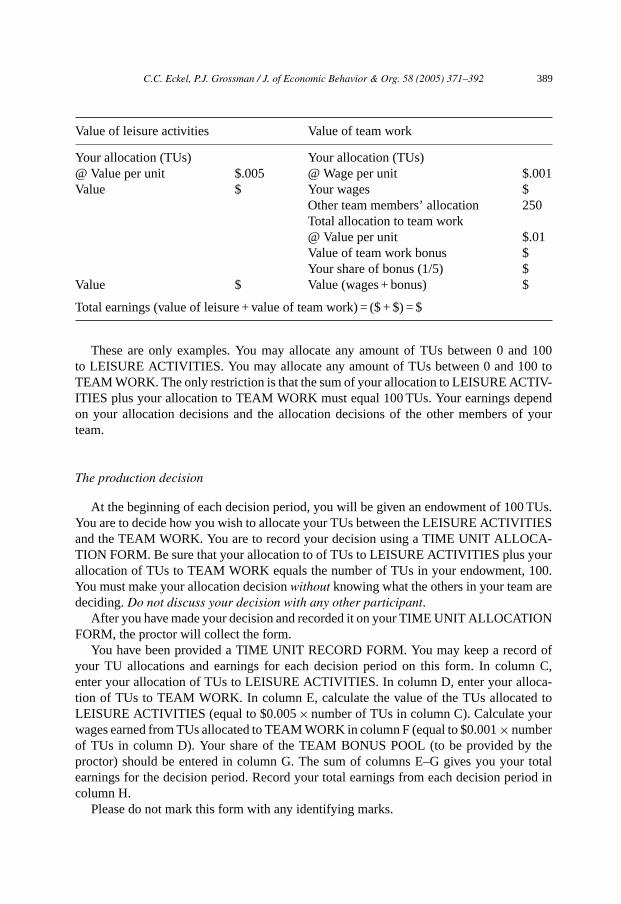
C.C. Eckel, P.J. Grossman / J. of Economic Behavior & Org. 58 (2005) 371–392 389
Value of leisure activities Value of team work
Your allocation (TUs) Your allocation (TUs)@ Value per unit $.005 @ Wage per unit $.001Value $ Your wages $
Other team members’ allocation 250Total allocation to team work@ Value per unit $.01Value of team work bonus $Your share of bonus (1/5) $
Value $ Value (wages + bonus) $
Total earnings (value of leisure + value of team work) = ($ + $) = $
These are only examples. You may allocate any amount of TUs between 0 and 100to LEISURE ACTIVITIES. You may allocate any amount of TUs between 0 and 100 toTEAM WORK. The only restriction is that the sum of your allocation to LEISURE ACTIV-ITIES plus your allocation to TEAM WORK must equal 100 TUs. Your earnings dependon your allocation decisions and the allocation decisions of the other members of yourteam.
The production decision
At the beginning of each decision period, you will be given an endowment of 100 TUs.You are to decide how you wish to allocate your TUs between the LEISURE ACTIVITIESand the TEAM WORK. You are to record your decision using a TIME UNIT ALLOCA-TION FORM. Be sure that your allocation to of TUs to LEISURE ACTIVITIES plus yourallocation of TUs to TEAM WORK equals the number of TUs in your endowment, 100.You must make your allocation decisionwithout knowing what the others in your team aredeciding.Do not discuss your decision with any other participant.
After you have made your decision and recorded it on your TIME UNIT ALLOCATIONFORM, the proctor will collect the form.
You have been provided a TIME UNIT RECORD FORM. You may keep a record ofyour TU allocations and earnings for each decision period on this form. In column C,enter your allocation of TUs to LEISURE ACTIVITIES. In column D, enter your alloca-tion of TUs to TEAM WORK. In column E, calculate the value of the TUs allocated toLEISURE ACTIVITIES (equal to $0.005× number of TUs in column C). Calculate yourwages earned from TUs allocated to TEAM WORK in column F (equal to $0.001× numberof TUs in column D). Your share of the TEAM BONUS POOL (to be provided by theproctor) should be entered in column G. The sum of columns E–G gives you your totalearnings for the decision period. Record your total earnings from each decision period incolumn H.
Please do not mark this form with any identifying marks.
390 C.C. Eckel, P.J. Grossman / J. of Economic Behavior & Org. 58 (2005) 371–392
After all TIME UNIT ALLOCATON FORMS have been collected, the proctor willrecord the allocation decisions. The TEAM BONUS POOL and team member shareswill be calculated and posted. The proctor will maintain a record of each subject’s totalearnings.
A practice decision period (for which your earnings will not count) plus up to 20 decisionperiods (for which your earnings will count) will be conducted.
Cash payments
At the end of the study, please complete your EARNINGS RECEIPT FORM. Collectall other materials and place them in the folder.
You will be called out into the hallway where you will receive her earnings. Afterconfirming that the amount is correct, please complete and sign your EARNINGS RECEIPTFORM. You may now leave.
This procedure will be repeated for the remaining subjects. The study is then completed.
References
Alchian, A.A., Demsetz, H., 1972. Production, information costs, and economic organization. American EconomicReview 62, 777–795.
Allen, V.L., Wilder, D.A., 1975. Categorization, belief similarity, and intergroup discrimination. Journal of Per-sonality and Social Psychology 32, 971–977.
Ashenfelter, O., Currie, J., Farber, H.S., Spiegel, M., 1992. An experimental comparison of dispute rates inalternative arbitration systems. Econometrica 60, 1407–1434.
Ashforth, B.E., Mael, F., 1989. Social identity theory and the organization. Academy of Management Review 14,20–39.
Brewer, M.B., 1979. In-group bias in the minimal intergroup situation: a cognitive-motivational analysis. Psycho-logical Bulletin 86, 307–324.
Brewer, M.B., Brown, R.J., 1998. Intergroup relations. In: Gilbert, D., Fiske, S.T., Lindzey, G. (Eds.), The Hand-book of Social Psychology, vol. II. McGraw Hill, New York, pp. 554–594.
Brewer, M.B., Kramer, R.M., 1986. Choice behavior in social dilemmas: effects of social identity, group size, anddecision framing. Journal of Personality and Social Psychology 50, 543–549.
Campbell, D.T., 1958. Common fate, similarity, and other indices of the status of aggregates of persons as socialentities. Behavioral Science 3, 14–25.
Commins, B., Lockwood, J., 1979. The effects of status differences, favoured treatment and equity on intergroupcomparisons. European Journal of Social Psychology 9, 281–289.
Council of Economic Advisors, 2001. Economic Report of the President. United States Printing Office, Washington.Cox, T.H., Lobel, S.A., McLeod, P.L., 1991. Effects of ethnic group cultural differences on cooperative and
competitive behavior on a group task. Academy of Management Journal 34, 827–847.Davis, D.D., Holt, C.A., 1993. Experimental Economics. Princeton University Press, Princeton.Downing, L.L., Monaco, N.R., 1986. In-group/out-group bias as a function of differential contact and authoritarian
personality. The Journal of Social Psychology 126, 445–452.Eckel, C.C., Grossman, P.J., 2001. Chivalry and solidarity in ultimatum games. Economic Inquiry 39, 171–
188.Espinoza, J.A., Garza, R.T., 1985. Social group salience and interethnic cooperation. Journal of Experimental
Social Psychology 21, 380–392.Gaertner, S.J., Dovidio, J., Anastasio, P., Bachman, B., Rust, M., 1993. The common ingroup identity
model: recategorization and the reduction of intergroup bias. European Review of Social Psychology 4,1–26.
C.C. Eckel, P.J. Grossman / J. of Economic Behavior & Org. 58 (2005) 371–392 391
Gordon, J., 1992. Work teams: how far have we come? Training 29, 59–65.Groves, T., 1973. Incentives in teams. Econometrica 41, 617–632.Hagendoorn, L., Henke, R., 1991. The effect of multiple category membership on interproup evaluations
in a North Indian context: class, caste, and religion. British Journal of Social Psychology 30, 247–260.
Hoffman, E., Spitzer, M.L., 1985. Entitlements, rights and fairness: an experimental examination of subjects’concepts of distributive justice. Journal of Legal Studies 14, 259–297.
Holmstrom, B., 1979. Moral hazard and observability. Econometrica 10, 74–91.Holmstrom, B., 1982. Moral hazard in teams. Econometrica 13, 324–340.Itoh, H., 1991. Incentives to help in multi-agent situations. Econometrica 59, 611–636.Jehn, K.A., Northcraft, G.B., Neale, M.A., 1999. Why differences make a difference: a field study of diversity,
conflict, and performance in workgroups. Administrative Science Quarterly 44, 741–763.Kachelmeier, S.J., Shehata, M., 1992. Culture and competition: a laboratory market comparison between China
and the West. Journal of Economic Behavior and Organization 19, 145–168.Katzenbach, J.R., Smith, D.K., 1994. The Wisdom of Teams: Creating the High-Performance Organization. Harper-
Collins, New York.Kmenta, J., 1986. Elements of Econometrics, second ed. MacMillan, New York.Kramer, R.M., Brewer, M.B., 1984. Effects of group identity on resource use in a simulated commons dilemma.
Journal of Personality and Social Psychology 46, 1044–1057.Latane, B., Williams, K., Harkins, S., 1979. Many hands make light the work: the causes and consequences of
social loafing. Journal of Personality and Social Psychology 37, 822–832.Lawler, E.E., Mohrman, S.A., Ledford, G.E., 1995. Creating high performance organizations: practices and re-
sults of employee involvement and total quality management in Fortune 1000 companies. Jossey-Bass, SanFrancisco.
Lembke, S., Wilson, M.G., 1998. Putting the “team” into teamwork: alternative theoretical contributions forcontemporary management practice. Human Relations 51, 927–944.
Leung, K., Bond, M.H., 1984. The impact of cultural collectivism on reward allocation. Journal of Personalityand Social Psychology 47, 793–804.
McGrath, J.E., Berdahl, J.L., Arrow, H., 1995. Traits, expectations, culture, and clout: the dynamics in work groups.In: Jackson, S.E., Roderman, M.N. (Eds.), Diversity in Work Teams: Research Paradigms for a ChangingWorkplace. APA, Washington, D.C., pp. 17–45.
Nalbantian, H.R., Schotter, A., 1997. Productivity under group incentives: an experimental study. American Eco-nomic Review 87, 314–341.
Northcraft, G.B., Polzer, J.T., Neale, M.A., Kramer, R.M., 1996. Diversity, social identity, and perfor-mance: Emergent social dynamics in cross-functional teams. In: Jackson, S.E., Roderman, M.N. (Eds.),Diversity in Work Teams: Research Paradigms for a Changing Workplace. APA, Washington, D.C.,pp. 69–96.
Noussair, C.N., Plott, C.R., Riezman, R.G., 1995. An experimental investigation of the patterns of internationaltrade. American Economic Review 85, 462–491.
Rabbie, J.M., Horwitz, M., 1969. Arousal of ingroup–outgroup bias by a chance win or loss. Journal of Personalityand Social Psychology 13, 269–277.
Radner, R., 1986. Repeated partnership games with imperfect monitoring and no discounting. Review of EconomicStudies 53, 43–57.
Sachdev, I., Bourhis, R.Y., 1987. Status differentials and intergroup behavior. European Journal of Social Psychol-ogy 17, 277–293.
Tajfel, H., 1978. Interindividual behaviour and intergroup behaviour. In: Tajfel, H. (Ed.), Differentiation BetweenSocial Groups. Academic Press, London, pp. 27–60.
Turner, J., 1978. Social categorization and social discrimination in the minimal group paradigm. In: Tajfel, H.(Ed.), Differentiation Between Social Groups. Academic Press, London, pp. 101–140.
U.S. Census Bureau, 1990. Census of Population. United States Printing Office, Washington.U.S. Census Bureau, 2000a. Census of Population. United States Printing Office, Washington.U.S. Census Bureau, 2000b. Statistical Abstract of the United States. United States Printing Office,
Washington.

392 C.C. Eckel, P.J. Grossman / J. of Economic Behavior & Org. 58 (2005) 371–392
Weldon, E., Gargano, G.M., 1988. Cognitive loafing: the effects of accountability and shared responsibility oncognitive Effort. Personality and Social Psychology Bulletin 14, 159–171.
Wilder, D.A., 1986. Social categorization: implications for creation of intergroup bias. Advances in ExperimentalSocial Psychology 19, 291–355.
Wit, A.P., Wilke, H.A.M., 1992. The effect of social categorization on cooperation in three types of social dilemmas.Journal of Economic Psychology 13, 135–151.