management by objectives for road safety work road administration’s management by objectives for...
TRANSCRIPT

Management by objectives for road safety work
– Analysis of the road safety development
Result conference 2009
publiCAtion 2009:113

title: Management by objectives for road safety work – Analysis of the road safety developmentsutvecklingen
publication: 2009:113
Date of publication: 2009-09
publisher: Vägverket
Cover layout: Ateljén, Vägverket
Cover photo: Vägverket, Bildarkivet.se
print: Vägverket
iSSn: 1401-9612
Distribution: Vägverket

Preface This report has been produced with the aim of producing supporting data for the 2009 result conference, “Stakeholder collaboration for the new interim target 2020”. The starting point is to analyse the development of road safety on the basis of the number of fatalities and injuries in addition to the 13 indicators. Furthermore, the analysis shall show which state is in the greatest need of change in order for the road safety targets to be achieved by 2020. This is in accordance with the government proposal, Target for Future Travel and Transportation (prop. 2008/09:93) and the proposal in the Swedish Road Administration’s Management by objectives for road safety work (2008:31). The report has been compiled by an analysis group consisting of analysts from the Swedish Transport Agency, the Swedish Institute for Transport and Communications Analysis (SIKA), the Swedish National Road and Transport Research Institute (VTI) and the Swedish Road Administration. The following persons have participated in the analysis work: Jan Ifver (The Swedish Transport Agency), Hans-Yngve Berg (The Swedish Transport Agency), Peter Larsson (The Swedish Transport Agency), Åsa Forsman (VTI), Anna Vadeby (VTI), Ulf Brüde (VTI), Marcus Hugosson (SIKA), Johan Strandroth (The Swedish Road Administration), Östen Johansson (The Swedish Road Administration), Magnus Lindholm (The Swedish Road Administration), Anders Tennlind (The Swedish Road Administration) and Ylva Berg (The Swedish Road Administration).
3

Summary In accordance with the government proposal 2008/09:9, the number of traffic fatalities should be reduced by 50% between 2007 and 2020. This corresponds to a maximum of 220 deaths in 2020. The Government also proposes that the number of serious traffic injuries should be reduced by 25%. In order to achieve this, the road safety development shall be followed-up systematically at the annual result conference. This report has been produced with the aim of producing supporting data for the 2009 result conference, “Stakeholder collaboration for the new interim target 2020”. Road safety development is described on the basis of the outcome of the number of fatalities, serious injuries and the 13 indicators, in accordance with the proposal in the report Management by objectives for road safety work (The Swedish Road Administration 2008:31). The current situation for 2008 and the proposed target levels for the indicators are reported in the table below. Indicator Starting point 2008 Target 2020
Share of vehicle kilometrage within the speed restrictions 43 % - 80 %
Share of vehicle kilometrage within the speed restrictions 52 % - Increase of
86 % Share of vehicle kilometrage with sober drivers 99.76 % - 99.9 %
Share of passengers using seat belts in the front seat of a passenger car
96 % 95 % 99 %
Share of cyclists wearing a helmet 27 % 28 % 70 %
Share of new passenger cars sales with the highest EuroNCAP score
66 % 71 % 100 %
Share of new heavy vehicles with automatic braking system
0 % 0 % 100 %
Share of vehicle kilometrage on roads with speed limits over 80km/h of dual-carriageway roads
50 % 52 % 75 %
Share of safe pedestrian, cycle and moped passages for the main municipal street network
Approx 25 % - Not defined
Percentage of safe junctions on the main municipal street network
Approx 50 % - Not defined
Average time from injury to adequate rescue/medical care - 12.3 min Not defined
Share of drivers who stated that they have fallen asleep or nearly fallen asleep while driving
11.9 %
12.7 %
6 %
Prioritisation of road safety - - Not defined Since the end of 2008 it has become more and more evident that we are in a period with historically few number of traffic fatalities in Sweden. In addition to the executed road safety measures there is
4

reason to believe that a large part of this reduction is due to the present economic situation. Thus, in order for the number of fatalities to fall by a further 50 per cent by 2020 it is important not to become complacent and to focus on executing the measures which affect the indicators assessed as most important in the quest to achieve the target. The indicators which have been individually assessed to give the greatest effect on the number of fatalities are speed compliance, safe passenger cars and safe state roads. The indicator, sober driver, has also been assessed as being of particular importance as drivers under the influence of alcohol have been killed in accidents many times and furthermore it is prevalent that they have driven over the speed limits and have not used a belt. Despite the large majority of traffic being driven in a sober state, the relative few who drive under the influence of alcohol cause a high rate of accidents. Of these four indicators, the most disturbing state and developments are within the area of speed and sober drivers. In order to achieve the target of speed compliance on state roads, a 100 per cent increase in motorists who adhere to the regulated speed limits and a reduction in average speed of 5 km/h are required. The problem with drivers under the influence of alcohol has for the most part remained unchanged since the end of the 1990s. The order to achieve the target for 2020 the problems with motorcycle and moped riders must be addressed. It has been assessed that for the target of a 25 per cent reduction in the number of serious accidents to be achieved a bicycle helmet law is necessary. This analysis report is the first of its kind that has been produced with the framework for the newly-proposed interim target for road safety up to the year 2020. The analysis work will be developed within the framework of the joint efforts to establish the management by objectives, which is currently run by the Swedish Road Administration. In the coming years the measures taken by the different stakeholders to increase road safety will make up an additional basis to explain and discuss the fulfilment of the objectives and what is required in order to achieve the targets.
5

Contents 1 Background ........................................................................................................................ 7
1.1 Aim .............................................................................................................................. 7 1.2 Demarcation ................................................................................................................. 8
2 Number of fatalities and serious injuries ............................................................................ 8 2.1 Fatalities ....................................................................................................................... 8 2.2 Serious injuries .......................................................................................................... 10
3 Surrounding factors .......................................................................................................... 12 4 Follow up of Road Safety Performance Indicators .......................................................... 15
4.1 Speed compliance – state road network .................................................................... 16 4.2 Speed compliance – municipal road network ............................................................ 18 4.3 Sober drivers .............................................................................................................. 19 4.4 Seat belt usage ........................................................................................................... 22 4.5 Bicycle helmet usage ................................................................................................. 25 4.6 Safe passenger cars .................................................................................................... 28 4.7 Safe heavy vehicles ................................................................................................... 30 4.8 Safe state roads .......................................................................................................... 32 4.9 Safe municipal streets – Pedestrian, bicycle and moped passages ............................ 34 4.10 Safe municipal streets – junctions .......................................................................... 35 4.11 Prompt and proper rescue/care ............................................................................... 35 4.12 Non-fatigued drivers .............................................................................................. 37 4.13 High Prioritisation of Road Safety ......................................................................... 38
5 Conclusions and Discussion ............................................................................................. 39 6 References ........................................................................................................................ 40
6

1 Background In accordance with the government proposal 2008/09:9, the number of traffic fatalities should be reduced by half between 2007 and 2020. This corresponds to a maximum of 220 deaths in 2020. The Government also proposes that the number of serious traffic injuries will be reduced by a quarter. The basis for this is the commission of the Swedish Road Administration by the Government to propose new interim targets for road safety development. The commission also included drawing up basic data for continuing road safety work in accordance with Vision Zero. (The Swedish Road Administration 2008:31). The Swedish Road Administrations proposal was based on the system of Management by objectives for road safety work, more measure-related interim targets and annual result conferences where road safety development and target achievements are evaluated. The aim is to create long-term and systematic road safety efforts. The proposal was produced after cooperation with other stakeholders. In the proposal 2008/09:93, the Government consolidated the Swedish Road Administration’s suggestion of target levels and the system of Management by objectives for road safety work. The Government highlighted among others the annual systematic result follow-ups as a significant instrument to be able to continue to follow the development. In the efforts to reach the 2007 interim targets the lack of clear annual follow-ups has been highlighted as one of the causes of not achieving the targets. The management by objectives is based on the measuring and following-up of different indicators against the targets that have been set in advance. These combined targets correspond to a collective objective for road safety development. The target of the indicators signifies follow-ups of a more operational nature. The suggested indicators in the report, Management by objectives for road safety work, below and the respective target levels are reproduced in section 5.
1. Speed compliance, state roads 2. Speed compliance, municipal roads 3. Sober drivers 4. Seat belt usage 5. Bicycle helmet usage 6. Car safety 7. Safe heavy vehicles 8. Safe state roads 9. Safe municipal streets – Pedestrian, Cycle and Moped passages 10. Safe municipal streets - crossings 11. Prompt and proper rescue/care 12. Non-fatigued driver 13. Prioritisation of road safety
1.1 Aim This report has been produced with the aim of drawing up basic data for the 2009 result conference, “Stakeholder collaboration for the new interim target 2020”. The analysis report shall describe and analyse road safety development and give answers as to which state is the most important to change in order to increase road safety and half the number of fatalities by 2020. The road safety development is described on the basis of the outcome of the number of fatalities, serious injuries and the 13 performance indicators. The analysis looks for an explanation for the current road safety situation in the measures taken and in the different factors that may have influenced the outcome (for example, demographic and economic changes). The analysis refers to the Management by objectives for road safety work which proposes measures for the improvement of the road safety work.
7

1.2 Demarcation The choice of indicators and their relation of effect that forms the basis for the target levels have been produced by the Swedish Road Administration and are reproduced in the report Management by objectives for road safety work. The analysis is conducted on the basis of this on the pre-designated conditions. The analyses during the period up until 2020 shall also be able to be used to draw up data for the new indicators or a change in structure of the current indicators. It is also important to be able to describe which road safety measures have been the most effective and which measures and volume of operations will be needed to be carried out in the future. As the 2009 result conference is the first of its kind, this year’s analysis will not address these issues.
2 Number of fatalities and serious injuries The Government proposes in the Target for future travel and transportation (prop. 2008/09:93) a new interim target: Within the road transport system the number of fatalities should be reduced by 50% and the number of serious injuries reduced by 25 % between 2007 and 2020 (with the base year calculated as the average value for the years 2006-2008). In particular, measures that aim to improve the road safety of children should be prioritised.
2.1 Fatalities The information regarding fatalities in road traffics has been obtained from OLY1 for the period 1996-2002 and from STRADA2 for 2003-2008. The official statistics which SIKA3 is responsible for, from 2003 do not include those who have died from illness. As a basis for deciding whether a person has died from an illness or due to a collision information from the RMV autopsy register4 is used in the first case. In order to gain comparability, those who according to the Police have died from an illness shall not be included for years 1996-2000. For years 2001-2002 those who have died from an illness are excluded from the information from the Swedish Road Administration’s in-depth studies.
Currently (March 2009), there is no official information regarding the number of fatalities for 2008. In order to gain comparability with the rest estimation has been carried out for 2008. In addition to this estimation, six pedestrians have died as a result of injuries incurred after they had fallen over on or near the road and 1 person has died after being run over on a tramline. These types of accidents are not included in the official statistics and neither are they included in the analysis below.
According to the preliminary information, over 400 persons died in road traffic in 2008, which is 14 per cent fewer than in 2007 and 20 per cent fewer than in 1996. Compared to the period 1996-1998 when approx. 500 persons on average died per year, the number of fatalities has decreased by 12 per cent to approx. 440 deaths per year for the period 2006-2008. In order to even out the annual variations a mean average is used for the three years 2006-2008 as a starting point for the interim target. Accordingly, a 50% reduction means that the number of deaths should be reduced from approx. 440 to a maximum of 220 by year 2020.
1 The Swedish Road Administration’s previous accident register 2 Swedish Traffic Accident Data Acquisition 3 Swedish Institute for Transport and Communications Analysis 4 The National Board of Forensic Medicine
8

Expected development Former interim targetActual development
Number
20202016201220082004 2000 1996
600
500
400
300
200
100
0
Diagram 1 Number of fatalities (excl. illness) in road traffic accidents 1996-2008 (2008 estimated) and expected development up to the year 2020.
The previous interim target of max 270 fatalities for 2007 was not reached and was exceeded by 74 per cent. In total there were 6 055 fatalities in road traffic during the period 1996-2007 which is just over 1 500 more than the number parliament, through its decision on the interim target 2007, assessed as a fair adjustment taking into account the other society targets. (Swedish Road Traffic Inspectorate 2008). In order to reach the target of a maximum of 220 fatalities by 2020 an annual reduction of 5 per cent in the number of fatalities is required.
Pedestrian
Cyclist
Moped user
Motorcyclist
Passenger.
Motorist
Number
20082007200620052004200320022001 20001999199819971996
300
250
200
150
100
50
0
Diagram 2. Number of fatalities (excl. illness) split into road-user categories. 1996-2008
During 2008 the number of fatalities fell for all road-user categories. The primary reduction was in the motorist category with more than 40 fewer fatalities. The number of pedestrian fatalities was reduced by 22 per cent to approx. 50.
9

The average number of pedestrian fatalities per year fell by 25 per cent from 1996-1998 to 2006-2008. The average number of cyclist fatalities per year fell by 37 per cent during the same period. The average number of motorcyclist fatalities per year has on the other hand increased by 40 per cent while the number of fatalities among moped users remained unchanged at 13 per year.
The average number of fatalities among passenger car users per year has fallen by 15 per cent from 1996-1998 to 2006-2008. The number of fatalities among passenger car users in the types of accidents head on collision/overtaking has fallen from a yearly average of 124 to 101 from 1999-2001 to 2006-2008, a reduction of 18 per cent. Even in the group other types of accidents the number of fatalities among passenger car users has fallen. However, the number of fatalities in single accidents increased from 104 to 107 on average per year during the corresponding period.
2.2 Serious injuries In the target for 2020 in addition to the fatalities there are also serious injuries, which shall be reduced by 25%. In 2006 the Swedish Road Administration received the commission to improve the description of road traffic accidents impact on health. The commission was published 1 October 2007 and included a proposal for the definition of serious injuries (The Swedish Road Administration 2006). The Swedish Road Administration proceeded from the term medical impairment which is used by insurance companies to evaluate different types of function impairment irrespective of the cause. The proposal means that a person who in connection with a road traffic accident receives an injury ≥ 1% in accordance with the disability scale is considered to be seriously injured. The Government backs this proposal of the definition in its prop. 2008/09:93.
pedestrian)(incl fallsExpected development
pedestrian)
Expected development(excl falls
Serious injuries(excl falls pedestrians)
(incl fallspedestrians)
Serious injuriesNumber
2020201620122008200420001996
12 000
10 000
8 000
6 000
4 000
2 000
0
Diagram 3. Number of serious injuries 2006-2008 and the expected development up until the year 2020 (including/excl pedestrians who have fallen over on the road). *2006 is not entirely comparable with 2007 and 2008 due to a new classification system (AIS 2005).
For 2006 the Swedish Road Administration estimated the number of serious injuries at approx. 10 000 (The Swedish Road Administration 2008). This estimation included pedestrians who had slipped or stumbled and fallen over on or near to the road or who had been run over by a tram without any road vehicle being involved. Such types of accidents are not included, as mentioned previously, in the official statistics. As more than one in four of the serious injuries in the road transport system is a pedestrian who has fallen over on or near the road this is such a considerable problem that it must be mentioned. (The Swedish Road Administration, 2007). A new estimation for the years 2006-2008
10
shows that the number of serious injuries (excl. pedestrians who have fallen over on or near the road) on average amounted to approx. 7 000. On the basis of this calculation, the number of serious injuries may not exceed 5 250 by 2020 which corresponds to an annual reduction of 2.2 per cent.
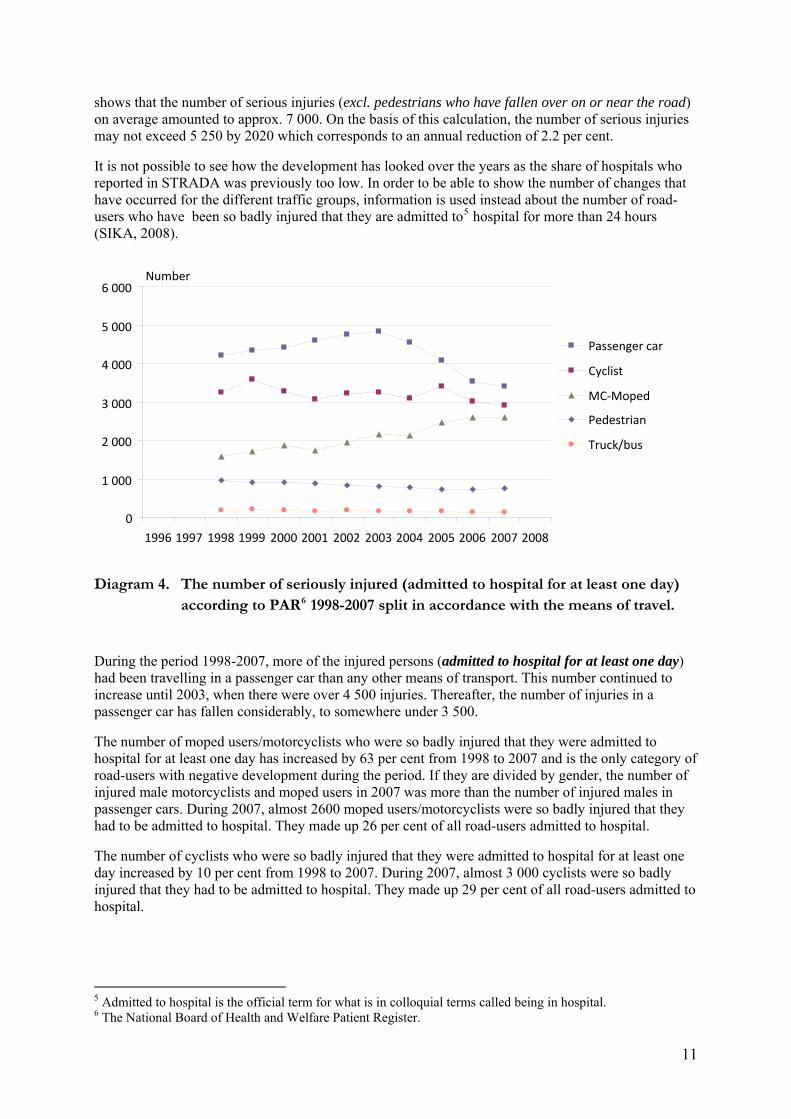
It is not possible to see how the development has looked over the years as the share of hospitals who reported in STRADA was previously too low. In order to be able to show the number of changes that have occurred for the different traffic groups, information is used instead about the number of road-users who have been so badly injured that they are admitted to5 hospital for more than 24 hours (SIKA, 2008).
Truck/bus
Pedestrian
MC‐Moped
Cyclist
Passenger car
Number
200820072006200520042003200220012000199919981997 1996
6 000
5 000
4 000
3 000
2 000
1 000
0
Diagram 4. The number of seriously injured (admitted to hospital for at least one day) according to PAR6 1998-2007 split in accordance with the means of travel.
During the period 1998-2007, more of the injured persons (admitted to hospital for at least one day) had been travelling in a passenger car than any other means of transport. This number continued to increase until 2003, when there were over 4 500 injuries. Thereafter, the number of injuries in a passenger car has fallen considerably, to somewhere under 3 500.
The number of moped users/motorcyclists who were so badly injured that they were admitted to hospital for at least one day has increased by 63 per cent from 1998 to 2007 and is the only category of road-users with negative development during the period. If they are divided by gender, the number of injured male motorcyclists and moped users in 2007 was more than the number of injured males in passenger cars. During 2007, almost 2600 moped users/motorcyclists were so badly injured that they had to be admitted to hospital. They made up 26 per cent of all road-users admitted to hospital.
The number of cyclists who were so badly injured that they were admitted to hospital for at least one day increased by 10 per cent from 1998 to 2007. During 2007, almost 3 000 cyclists were so badly injured that they had to be admitted to hospital. They made up 29 per cent of all road-users admitted to hospital.
5 Admitted to hospital is the official term for what is in colloquial terms called being in hospital. 6 The National Board of Health and Welfare Patient Register.
11

The number of pedestrians who were so badly injured that they were admitted to hospital for at least one day decreased by 21 per cent from 1998 to 2007. In the National Board of Health and Welfare’s patient register of those admitted to hospital there is also information pertaining to the number of pedestrians who were injured on or near to the road (including pavements) without any vehicle being involved. On average approx. 2200 cases of such injury have occurred annually during the period 2000-2005. Persons 65 and older account for 53 per cent of the injury cases and for 76 per cent of the medical care time. The number of injured road-users by other means of transport (bus, truck, or other) has been low during this period and has even fallen somewhat, from a total of around 600 to around 460 from 1998 to 2007.
3 Surrounding factors The road transport system is an open system where a number of more or less non-controllable surrounding factors influence the safety and by that the cases of injury. The growth of the economy is of great significance to car owners and the total vehicle kilometrage and it is maybe the surrounding factor that is most significant for the cases of injury. Other important factors include the age of the population, the number of new drivers and climate changes in both the short-term and the long-term. Even changes in travel routines which affect the split of vehicle kilometrage between the different road-user categories such as passenger car, cycle, moped, motorcycle are of great significance. In the diagram below the total vehicle kilometrage is shown for the past 12 months.
Vehicle kilometrage Passenger cars account for more than 90 per cent of the vehicle kilometrage. Motorcycle traffic has in recent years increased at a fast rate but still accounts for only one per cent of the vehicle kilometrage on the roads. If you put the different kinds of traffic together it amounts to an average annual increase of just over one per cent.
Index
BusPassenger carsHeavy trucksLight trucksMC
2008200720062005200420032002200120001999199819971996
240
220
200
180
160
140
120
100
80
Diagram 5. Vehicle kilometrage for different means of transport. Source: The Swedish Road Administration/VTI
It has been observed that with a moderate traffic growth of 1-2 per cent per year the number of fatalities has decreased by 3 per cent. So far there has been no more than short periods with unchanged
12

or reduced kilometrage. During these periods with falling GDP and reduced vehicle kilometrage the number of traffic fatalities has often fallen by 5-10 per cent per year. This points to the fact that there is a clear connection between recession and cases of injury. The clear reduction in the number of fatalities seen during 2008 fits into the previous pattern
Economic development GDP per capita fell for the first 3 years of the 1990s. Thereafter, the GDP has increased every year until 2008. In 2009 the GDP is expected to fall by 0.9 per cent. At the end of 2010 the international recession is expected to have reached its climax. (SCB, the National Institute of Economic Research)
Shown below is what is known as the economy barometer which reflects the expectations of citizens and companies. Here it is clear that after autumn 2007 everything points towards a recession in the economy.
60
70
80
90
100
110
120
130
1996 1997 1998 1999 2000 2001 2002 2003 2004 2005 2006 2007 2008
Index
Diagram 6. The economic development expectations of the citizens and companies. Source: The National Institute of Economic Research
Periods with recession bring about an increase in unemployment. Hardest hit are youngsters who have yet to establish themselves on the employment market and consequently there is a reduction in purchasing power and a reduction in car owners. As this group can be seen as a high risk group, the total effect is increased road safety due to reduced vehicle kilometrage by youngsters. After a recession there is a pent-up need among those groups hardest hit by unemployment to acquire a car and this happens when the economy is on the up.
Changes in travel routines Even change in travel routines between different types of traffic affects road safety, as travel by different means different risks. Increased travel by, for example, passenger cars, as a rule, increases road safety if it replaces travel by bicycle, moped or motorcycle. Safety would be increased further if more used the public transportation of buses and trains instead of passenger cars.
Historically, major changes have happened in the way of travel routines. Before the emergence of the car in the 1950s many people cycled or travelled by moped or motorcycle. As the car became more common, adult travel by moped and motorcycle decreased. Youngsters up to the age of 18 have however continued to cycle and ride mopeds. Increased car ownership means that we are close to a situation where there is one car per adult of working age, it also means that fewer and fewer cycle or
13

ride mopeds. With two cars per household there are greater possibilities to drive the children to nursery, school and recreational activities. Over the last 10 years the interest in acquiring mopeds and motorcycles has increased, which has had a negative effect on the number of fatalities.
Age The age structure of the population has also had an effect on road safety as different age groups have different risks of being injured or not. The age structure of society is determined for the most part by the high number of people born in the 1940s. When these large age groups have families it results in more large age groups. They then grow up and the pattern repeats itself. The large age groups in the ages 15 – 24 have caused an upturn in the number of traffic injuries. From 2010 the group of 15-24 year olds decreases, whereas the number of persons over 65 increases by 200 000. See the diagram below.
Number
0-14 yrs.
15-24 yrs.
25-64 yrs.
65- yrs.
2020201620122008200420001996
6 000 000
5 000 000
4 000 000
3 000 000
2 000 000
1 000 000
0
Diagram 7. Age structure of the population. Source: SCB
Climate and climate changes The impact of climate variations over a number of years affects the number of fatalities, partially as it affects the exposure of motor vehicle and of unprotected road-users and partially due to rain, snow and strong frosts that affect the risks (Ifver, Rydgren and Brorsson, 1986).
Climate changes in the long-term can also affect road safety. Cars have until recently been driven 100 per cent with fossil fuels In order to reduce the long-term climate impact of car traffic a development is expected that will lead to lighter cars and the use of other fuels. This is a surrounding factor which can affect all journeys within the next 20-50 and the impact on the number of fatalities can be both positive and negative depending on which changes occur. One scenario is that more and more choose to cycle, ride mopeds or buy small light cars, which could lead to an increase in traffic fatalities. If instead more choose to travel by train, which is much safer and more energy efficient, the number of road traffic fatalities would decrease.
14

4 Follow up of Road Safety Performance Indicators
To only use the number of fatalities and serious injuries as a measurement of the development of road safety is associated with certain problems. This is because the measurement is sensitive to surrounding factors and is not directly connected to road safety operations. In the report Management by objectives for road safety work it describes why the target should also be formulated for a number of indicators which are important for the development of road safety. These targets are more measure-related and make it easier for the different stakeholders to see which operations are effective. In order for the number of fatalities to fall by 50 per cent by 2020 the Swedish Road Administration in the report Management by objectives for road safety work has estimated the different levels that must be reached for the respective indicators. The sum of these levels has thereafter been recalculated with a factor of 0.6 in order to adjust the double calculation.
Road traffic states, proposed target levels and calculated road safety potentials
Indicator EffectMeasurement Objective
level Fatalities
1. Speed compliance, state roads
Percentage of traffic work within the speed restrictions
80 %
88
2. Speed compliance municipal streets
Increased share of vehicle kilometrage within the speed restrictions
86 % 29
3. Sober drivers Share of vehicle kilometrage with sober drivers (under 0.2 BAC level)
99.90% 30
4. Use of seat belt Share of belted drivers and passengers in passenger cars
99 % 40
5. Use of bicycle helmet Share of cyclists using a helmet 70 % 10
6. Safe passenger cars Share of new passenger cars with the highest safety rating in Euro NCAP
100 % 90
7. Safe heavy vehicles Share of new heavy vehicles with automatic braking system
100 % 25
8. Safe state roads Total
Share of vehicle kilometrage on roads with speed limits over 80km/h of dual-carriageway roads Other
75 % 50 12 62
9. Safe pedestrian, bicycle and moped passages on the main municipal street network
Share of safe pedestrian, cycle and moped passages for the municipal network
- 7
-
10. Safe junctions on the main municipal street network
Share of safe junctions for the municipal network - 8 -
Total for indicators 9 and 10 30
7 It remains to define the quantified target for safe municipal streets 8 It remains to define the quantified target for safe municipal streets
15

Indicator EffectMeasurement Objective
level Fatalities
11. Prompt and proper rescue/care
Time from the injury to adequate emergency care -9 -
12. Non-fatigued driver Share of drivers who stated that they have fallen asleep or nearly fallen asleep while driving
6 % -
13. Prioritisation of road safety
Increase of index for reply to attitude issue regarding road safety
-10 -
Total for indicators 10, 11 and 12
20
Total potential (fewer fatalities) Revised for double calculation (factor 0.6)
424 254
It is important to highlight that the indicators and target levels above are produced as support to be able to estimate a reasonable aim level in the comprehensive interim target for the development of road safety and not to calculate the precise levels.
The indicators and respective target levels are not designed to be easy to measure and follow-up. This means that the indicators are not currently measured in a manner that entirely corresponds to how the targets are formulated. However, these measurements operate well enough to be able to see the trend within the concerned indicator. The aim is to develop the measuring method where this is missing in order to be able to follow-up if the set targets have been reached. A description of how the indicators are currently measured is made in the respective indicator sections below.
4.1 Speed compliance – state road network
2004 2008 Target 2020 Share of vehicle kilometrage within the speed limits
43 % - 80 %
The set target is that 80 per cent of vehicle kilometrage shall be within the applicable speed limit 2020 and the effect of this is estimated at approx. 90 fewer fatalities per year.
To be able to reflect the problems of speed within the road system it is important to follow both the share of traffic which drives within/over the speed limit and average speed. The former is a measurement of how well the road user follows the current rules and the latter is a measurement of the road safety levels. The main measurement is however sensitive for levels on the applicable speed limits and can therefore be made worse, despite road safety being improved. This means that if a large share of distances receive reduced speed limits the percentage that drive too fast probably increases, but it leads to a lower average speed. However, the measurements show the compliance of the speed limits.
Carrying out the risk representative measurements for the speed levels is costly. No such measurements of the level for excess speed or average speed have been carried out since 2004. Whereas a speed index has been produced, which measures the changes of speed at a number of measurement points (The Swedish Road Administration Adviser: Speed index). The measurements are
9 It remains to define the quantified target for the time from the accident to adequate emergency care 10 It remains to define the quantified target for the evaluation of road safety
16

not representative of the entire network, but work well to be able to follow in whichever direction the speed development points.
The Swedish Road Administration plans to carry out three national representative measurements of speed levels during the period up until 2020. The aim is to be able to carry out the first measurement in 2010.
Development and projection to advisable level The most recent national representative measurements of vehicle speeds carried out in 2004 showed that the share of vehicle kilometrage within the speed limits was 43 per cent on the state road network. Such a low acceptance for speed limits is unique in comparison to other European countries. In order to reach the target of 80 per cent within current speed limits it will require almost a 100% increase in the number of road users who keep to the speed limits. Based on the speed limits of 2004 it corresponds to a reduction of average speed by 5 km/h from the level of 2004.
Share (%)
Expected developmentShare within speed limit
2020201620122008200420001996
100
90 80
70
60 50
40 30
20
10 0
Diagram 8. Share of vehicle kilometrage within the speed limits 1996 to 2004 and the expected development by till 2020. Source: The Swedish Road Administration
Analysis According to the speed index, the share of road users who exceed the speed limits has fallen during the last three years. This has also meant a reduction in the average speed. The measurements also show that it is the most serious breaches of speed which have decreased the most.
Increased fines implemented in 2006 are assessed to be a factor that has contributed to the percentage of road users who exceed the current speed limits decreasing. The effects of the road safety cameras (ATK) and reduced speed limits are not shown in the speed index but are other measures with clearly documented speed reducing effects.
Heavy vehicles do not seem to have reduced their speed to the same extent as the average traffic. Even the so-called stakeholder measurements carried out by different haulage contractors indicated this.
17

0,88
0,9
0,92
0,94
0,96
0,98
1
1,02
1,04
1996 1998 2000 2002 2004 2006 2008
Share over speed limit
Average speed total traffic
Average speed heavy trucks
* the majority of trucks (measures traffic other than passenger cars)
Index
Diagram 9. Relative development of the share of kilometrage over the speed limit and the average speed, state road network 1996-2008 (Index 1996=1) Source: The Swedish Road Administration
Speeding comparisons for passenger cars and motorcycles (The Swedish Road Administration Advisor: Speeds motorcycle traffic, 2008) shows that 32 per cent of motorcyclists keep to the applicable speed limits, the corresponding percentage for passenger cars is 41 per cent. It is almost the same relationship between cars and motorcycles as the previous year.
During 2009 the Swedish Road Administration aims to reduce speed limits on 15 000 kilometres of road and erect an additional 100 road safety cameras (ATK). It will probably mean that more road users break the speed limits but the average speed will be further reduced.
A host of different proposals for increased speed compliance on the state road network can be found in the report Management by objectives for road safety work. The measures assessed to have the greatest road safety potential are the continued expansion of ATK, manual observation, mobile ATK and an insurance system with penalties for speeding.
4.2 Speed compliance – municipal road network 2004 2008 Target 2020
Share of vehicle kilometrage within the speed limit
- - Increase of 86 %
At present there is no collective measurement to describe the present situation of the speed compliance on the municipal streets and roads. The target has therefore been formulated so that the rule compliance shall increase at the same pace as that proposed for state roads, from 43 to 80 per cent, which corresponds to an increase of 86 per cent. The road safety potential for state roads has been assessed as 30 fewer fatalities. Previous measurements carried out on the municipal road network have in principle only included main routes in urban areas. The area that needs to be developed within this indicator is therefore a
18

method that reflects the entire municipal road network. The Swedish Road Administration plans to develop a method to measure speed compliance on the municipal road network so that a first measurement can be carried out during 2011.
Development and projection to advisable level In the report Management by objectives for road safety work its only states how much the target levels are expected to increase for the targets to be achieved. Analysis Measurements carried out by the Swedish Road Administration in 2003 on non- state roads (main routes) in urban areas showed that 52 per cent of vehicle kilometrage was within the speed limits. However, the differences are considerable between the roads with speed limits of 50 km/hour and 70 km/hour. On the latter the rule compliance is almost double so high. Speeding is most prevalent in areas with speed limits of 30 km/hour. The greatest road safety benefit of increased compliance of the current speed on the municipal road network primarily concerns unprotected road users. Around 60 per cent of fatalities on the municipal road network are cyclists and pedestrians in conflict with motor vehicles, then there are 15 per cent of motorcycle and moped fatalities
4.3 Sober drivers
Share of kilometrage with sober drivers 99.76 % - 99.9 %
The target for road sobriety is that 99.9 per cent of the vehicle kilometrage shall take place with sober drivers by 2020, as a sober driver is defined as a driver with a blood alcohol concentration under 0.2 BAC level. The annual effect is estimated to be 30 fewer fatalities. According to a newly conducted random sampling in three counties the share of traffic with non-sober drivers over the drink driving limit amounts to 0.24 per cent, that is to say, 99.76 per cent of traffic occurs with sober drivers (Forsman et.al, 2007). The rule compliance is also good but it still corresponds to an average daily distance of approx. 420 000 km with non-sober passenger car drivers, (calculated on the vehicle kilometrage of 2007).
However, it is not possible to follow the development of how large the share of traffic takes place with sober drivers as the measurements are not carried out on a regular basis. The measurements, which currently give the best answers for the development of the scope of non-sober drivers in traffic are based on the results of questionnaires. Until further notice the results from the Swedish Road Administration’s road safety network shall therefore be used as a measurement for this indicator. It is hoped to produce a better measurement which reflects the total extent of drink-driving. The Swedish Road Administration hope to find a method that can use the information obtained from the police in our operations to improve the follow-up of the share of sober road users. Development and projection to advisable level In diagram 10 the share of persons who answered no, to the question” Have you at anytime during the last 12 months driven a car after having drunk alcohol apart from low-alcohol beer?” The level cannot be compared with the results that the observation measurements in the field should show, as they do not measure the same thing. More and more state that they have not driven in a non-sober state, the share of 95 per cent over the last two years is the highest since measurements started in 1981.
19

Share (%)
Share who responded no
2020201620122008200420001996
100
90
80
70
60
50
Diagram 10. Share of persons (18-74 years old) who responded no to the question” Have you at anytime during the last 12 months driven a car after having drunk alcohol apart from low-alcohol beer?”. Source: The Swedish Road Administration’s Road Safety Questionnaire.
Analysis The share of persons who state they have not driven in a non-sober state has increased during the period 1996 to 2008. For this measurement there is no target level to compare with but a continued increase is of course desirable. The results from the reported studies must however be interpreted with caution, in particular if the questions can be deemed as sensitive which is the case here. The development in time can however be representative if the realised expectations do not change and the extent of the coverage relating to the research is the same.
The share of negative (sober) tests in the police checks was at its lowest in 2001 and has since increased from 98.6 per cent to 99.2 per cent. This information is difficult to interpret as it affects the monitoring strategy of the police and the increase coincides with a substantial increase in the number of breathalyser tests.
Another indirect measurement of the extent of drink-driving can be taken from the in-depth study of fatal accidents from the Road Administration in-depth study of fatal accidents. Diagram 11, shows the number and share of non-sober passenger car driver fatalities for the period 1997-2007. From 1997 up to and including 2003, there was an increase in the number of non-sober drivers of almost 50 per cent. After 2003 the number decreased again and in 2007 it was just over the total of 1997. The share has developed in a similar manner but the decrease was not as substantial after 2003, which was due to the total number of passenger car drivers also decreasing.
20

0
5
10
15
20
25
30
0
10
20
30
40
50
60
70
1997 1998 1999 2000 2001 2002 2003 2004 2005 2006 2007
number of fatalities share of fatalities
Number Share(%)
Diagram 11. The number of non-sober passenger car driver fatalities and the share of the total number of passenger car driver fatalities (alcohol > 0.2 BAC level), 1997–2007. Source: The Swedish Road Administrations in-depth study
The reason for the break in the negative trend is difficult to know, but two things which may have had an impact are the general change in alcohol consumption and increased monitoring. The development of alcohol consumption is shown in diagram 12. At the beginning of the twenty-first century a rather sharp increase occurred then levelled out and from 2004 the consumption has decreased somewhat. With regards to monitoring the number of breathalyser test carried out by the police has increased by approx. 200 000 tests per year since 2001, from 1.1 million to 2.5 million in 2008.
12
10
Liters per person15 yrs. and older
8
6
4
2
0 1999 2000 1998 2001 2002 2003 2004 2005 2006 2007 2008
Diagram 12. Total alcohol consumption in Sweden. Calculated in litres of pure alcohol per inhabitant 15 years old and other. Source: www.sorad.su.se.
21

The total number of fatalities in accidents with non-sober drivers of motor vehicles (over 0.2 BAC level) amounts to around 80 per year. Of these around 20 were passenger fatalities in a car, other than the one driven by the non-sober driver or unprotected road users (minority). Around 330 persons die every year in cars and on motorcycles, this means that approx. 25 per cent of these die in alcohol-related accidents.
In the report Management by objectives for road safety work, a number of different measures are proposed. Those which are assessed to have the greatest potential are an alcohol technology law (for example, an alcohol lock) in new cars, an alcohol lock programme for drivers with drink problems and monitoring and checks.
4.4 Seat belt usage
2007 2008 Target 2020 Share of belted passengers in a passenger car
96 % 95 % 99 %
The target for seat belts is for 99 per cent of all drivers and front seat passengers in a passenger car to use a seat belt by 2020. The Swedish Road Administration has assessed that 40 lives per year can be saved if the target level is achieved. As supporting data to follow the development the results from VTI’s observation measurements and the indicator defined as the share of belted observed drivers and front seat passengers are used (Cedersund & Karlsson, 2008). The measurements are designed to follow the development over time. The level of seat belt usage shall not be seen as representative for drivers and passengers in general in Sweden. In order to increase the spread of measurement points nationwide an investigation of VTI’s measurements can be complemented with the measurements carried out by NTF.
Development and projection to advisable level The results from the measurements show that 95 per cent of the observed persons in the front seat were belted 2008 (Diagram 13). The share has increased gradually from 1996 when it was 89 per cent. The diagram even shows the expected development between 2007 and 2020 in order to reach the target level of 99 per cent, signifying an annual increase of 0.2 per cent. Between 2007 and 2008 the share decreased somewhat, but in 2007 the share was extremely high, so this is not important for the long-term ascension of the curve.
22

Expected development towards 2020Passengers front seats
Share (%)
2020201620122008200420001996
100
90 80
70
60
50
40
30
20 10
0
Diagram 13. Share of persons who were belted when observed in the front seat of a passenger car. Source: VTI’s observation measurements.
Diagram 14 shows that children in the back seats and taxi drivers now use seat belts in great numbers, 95 and 91 per cent 2008. Whereas the numbers for adults in the back seat are lower, 74 per cent 2008.
In heavy vehicles without trailers the share was 41 per cent 2008 and in heavy vehicles with trailers 48 per cent. The use of seat belts in heavy vehicles has not been measured in an entirely comparable manner during the period but a considerable increase is clear. In 1996 the share of belted drivers was only a couple of per cent.
Heavy trucks withouttrailer* Heavy trucks withtrailer*
Taxi, drivers
Children in backseat
Adults in backseats
Pass. front seat
Motorists
Share (%)
2008200620042002200019981996
100
90
80
70
60
50
40
30
20
10
0
*Observations of heavy vehicles from 2007 are not entirely comparable with previous observations.
Diagram 14. Use of seat belt in passenger car and heavy vehicles. Source: VTI’s observation measurements. Source: VTI’s observation measurements.
23

Analysis The use of seat belts is also measured in the Swedish Road Administrations road safety questionnaire which is sent out randomly to the Swedish population. The measurement includes the share of persons who state that they invariably use the seat belt in the front seat. The results show similar developments to the observation measurements with a stabile positive development over the years.
The results from the Swedish Road Administration’s in-depth study show that the share of passenger car driver fatalities who were belted at the time of the accident varied between approx. 50 and 60 per cent since 1997 (Diagram 15). There is no clear trend in the development, but in 2008 the value was 63 per cent and it was the first time during the period that the value had been over 60 per cent. The reason for the share of belted persons being so low among the fatalities than among the car drivers and passengers generally shows the positive protection properties. One element of the difference can be that persons who do not use a belt have behaviour which is generally of the type that increases the risk of being involved in an accident or an increased risk of being killed if involved in an accident.
Share of passenger car driver fatalities who were belted
Share (%)
2008 20062004200220001998 1996
100
90
80
70
60
50
40
30
20
10
0
Diagram 15. Share of passenger car driver fatalities that were belted at the time of the accident. Source: The Swedish Road Administration’s in-depth study
The results from the in-depth studies also show that there is great life-saving potential if the use of seat belts increases further, despite it currently being very high already. The number of passenger fatalities has been approx. 260-280 per year in recent years and between 40 and 50 per cent were not belted. Previous estimations showed that the risk of death decreases by 50 per cent though the use of a seat belt (Elvik & Vaa, 2007). This gives a somewhat higher effect than the estimation carried out by the Swedish Road Administration in the report, Management by objectives for road safety work.
When comparing the share of belted drivers in traffic and the share of belted passenger cars driver fatalities it shows that increased seat belt usage in traffic does not reflect among the fatalities. One possible explanation is that there are drivers with hazardous behaviour who are not affected by the measures taken and continue to drive without a belt, at least in certain situations. Another explanation can be that the use of a seat belt is primarily observed during the daytime while many fatal accidents with unbelted drivers occur at night. Accordingly, we do not know how the use of seat belts at night has changed.
24

An effective measure to increase the use of seat belts is a seat belt reminder. A previous study showed approx. 99 per cent of passenger car drivers who had a seat belt reminder were belted (Krafft et. al 2006). As older cars are gradually replaced the share of seat belt reminders in the car fleet increases as a whole which in turn leads to a continued increase in usage.
The target refers to seat belt usage in the front seat but it also important the seat belt usage in the back seats also increases and the potential is estimated for both drivers and passengers. Most journeys are made with only the driver or the driver and one passenger. Thus the use of seat belts in the back seats has had a limit impact on the total potential.
The measures assessed to have the greatest road safety potential in the rapport Management by objectives for road safety work are effective seat belt reminders on all seats in the car and monitoring and checking of the seat belt usage.
4.5 Bicycle helmet usage
2007 2008 Target 2020 Share of observed cyclists wearing helmet 27 % 28 % 70 %
The target for the use of bicycle helmets is 70 per cent by 2020. The prerequisite for the achievement of this target is, according to the report Management by objectives for road safety work implementation of a general bicycle helmet law for all cyclists. If a bicycle helmet law is not implemented the target changes to 35 per cent of cyclists wearing a helmet 2020. In Sweden around 35 cyclists are killed in traffic each year. By increasing the wearing of bicycle helmets the number of cycle fatalities can be reduced. As a measurement for the wearing off bicycle helmets the share of observed cyclists who wear a bicycle helmet in VTI’s annual measurements is used (Larsson, 2009). The aim of the measurements is to describe how bicycle helmet wearing has changed over the years. The measurement does not intend to estimate the total wearing of bicycle helmets in Sweden in a representative manner, but it is sufficient to give a picture of the approximate level.
Development and projection to advisable level Diagram 16 shows the development of the observed wearing of bicycle helmets from 1996-2008. 27 per cent of the observed cyclists wore a helmet in 2007, the share has increased gradually from 1996 when it was 15 per cent. The diagram also shows how the wearing of a bicycle helmet needs to change between 2007 and 2020 in order to reach the target level of 70 per cent (with the new bicycle helmet law) and 35 per cent (with the current bicycle helmet law only for children), to be reached. This means an annual increase of 7.6 per cent or 2.0 per cent. In 2008 the observed wearing of bicycle helmets was 28 per cent. This is a positive development and the level lies somewhat over the expected development provided that no bicycle helmet law is legislated.
25

Share (%)
Expected development not about the law
Expected development about the law Bicycle helmet usage
2020 20162012200820042000 1996
100
90
80
70
60
50
40
30
20
10
0
Diagram 16. Share of observed cyclists with cycle helmet and expected development shown with and without a new general bicycle helmet law. VTI’s observation measurements.
Analysis The wearing of bicycle helmets in Sweden lies at fairly modest level, especially for adults. The total share of observed cyclists wearing a bicycle helmet was 28 per cent in VTI’s observation measurements, 2008. On the other hand there is a huge potential to increase the share of bicycle helmet users. When the bicycle helmet law for children under 15 years old came into force 1 January 2005 there was an increase primarily among children under 10 years old, where the share increased from 35 per cent 2004 to 65 per cent 2005. Even the share of bicycle helmet users in comprehensive schools (children 6-15 years old) increased from 36.6 per cent to 45.3 per cent. No corresponding increase was seen among adults for the same period.
Diagram 17 shows that the observed wearing of bicycle helmets in 2008 was 73 per cent for children under 10 years old in residential area and 47 per cent for children 6-15 years old who cycle to and from school. For adults the observed wearing of bicycle helmets was significantly lower: in 2008 it was 21 per cent of journeys made to and from work and 23 per cent for general cycling distances.
26

Share (%)
Adults, cycle paths
Adults, bus. trips
Children, pr.sch.trips
Children, <10, residential area.
2008200620042002200019981996
100
90
80
70
60
50
40
30
20
10
0
Diagram 17. Bicycle helmet usage for different groups. Source: VTI’s observation measurements.
Diagram 18 shows data from the Swedish Road Administrations in-depth studies of the share of fatalities among cyclists who were wearing a helmet at the time of the accident. A relatively large increase took place between 2005 and 2006 when the share increased from 11 to 24 per cent. During 2007 and 2008 the share has fallen to a level of just over 17 per cent 2008.
Share (%)
Share of those who used a helmet %
2008200720062005200420032002200120001999
100
90
80 70
60
50
40
30
20
10
0
Diagram 18. Share of cyclist fatalities who were wearing a bicycle helmet at the time of the accident. Source: The Swedish Road Administrations in-depth studies
27

As previously reported, of the injuries in 2007 almost 3 000 cyclists were so badly injured that they had to be admitted to hospital. An increase in the wearing of bicycle helmets should be able to reduce this number of injured cyclists, table 1 shows data from STRADA medical care of the share of cyclist wearing a helmet at the time of the accident. For injuries with ISS11 9-15 and 16 we can see that the wearing of bicycle helmets is considerably lower than for injuries with an ISS less than 8. Among those with the highest ISS number for cycle accidents there are significantly fewer who were wearing a helmet compared to those who were not seriously injured (ISS<9).
Table 1: Share of injured cyclists who were wearing a bicycle helmet at the time of accident, split according to the ISS rating. Source: STRADA medical care Nov 2007-Oct 2008.
Wearing bicycle helmet ISS interval Yes No/unknown Total Yes/no Share with helmet
(%) 0 33 106 139 23.7 1–3 1036 2863 3899 26.6 4–8 553 1494 2047 27.0 9–15 67 253 320 20.9 16– 8 53 61 13.1 Total 1697 4769 6466 26.2 In the report Management by objectives for road safety work it has been assessed that in order to increase the wearing of bicycle helmets to a significantly higher level than today a general bicycle helmet law must be implemented to cover all cyclists.
If such a law is implemented the Swedish Road Administration has made the assessment that a reasonable target level for user frequency of bicycle helmets 2020 is 70 per cent. Increased wearing of bicycle helmets leads to a reduced risk for skull injuries in the event of a cycle accident. Previous Swedish research has shown that the wearing of a bicycle helmet reduces the risk of fatal skull injuries by approx. 40 per cent (Björnstig et.al 1992 quoted in Nolén 1998). Based on the estimated road safety potential of approx. 10 fewer fatalities per year for bicycle helmet wearing of 70 per cent. If a general helmet law is not implemented the Swedish Road Administration assesses in the report Management by objectives for road safety work that the target level must be reduced to 35 per cent. This would also imply that the road safety potential also decreases.
There are a number of measures which can affect this indicator. The measures which are assessed to have the greatest road safety potential in the report Management by objectives for road safety work are a bicycle helmet law for all cyclist and monitoring. Previous research has even shown that combining a general bicycle helmet law (including a penalty system) with information and educational measures can result in a substantial increase in the wearing of bicycle helmets (see Thomas and Vadeby (2007) for a summary).
4.6 Safe passenger cars
2007 2008 Target 2020 Share of passenger cars in new car sales with the highest Euro NCAP score
66 % 71 % 100 %
11 ISS (Injury Severity Score) is an anatomical scoring system or the severity of injuries. It states how high the risk is of death from the accident and can vary from 0 to 9. 9 is rated as a serious accident in the official statistics.
28

The target is for 100 per cent of new cars to have the highest safety rating in accordance with Euro NCAP (including new technology where active and passive safety is integrated). The estimated potential of the proposed target levels is about 90 fewer deaths per year through improved active and passive safety. The estimated maximum potential is about 150 fewer deaths.
The contribution of passenger car safety development to achieve road safety’s target has previously often been measured by the share of new cars with the highest safety rating in Euro NCAP and the share of new cars equipped with traction control. Known efficiency associations show that the risk of being seriously injured or killed in new cars during the period 1996-2007 has decreased by 30 per cent by improved collision safety and by 20 per cent through the introduction of traction control, or about 40 percent together (Lie & Tingvall, 2002). From 2009 onwards, however, the share of new cars that have highest safety rating in accordance with Euro NCAP will be the primary gauge. The reason is that the effect of active safety systems such as Electronic Stability Programme will be included in Euro NCAP's rating. Seat belt reminders are also included.
It would be advisable to not only follow the development of the share of new cars but also the share of vehicle kilometrage by cars with highest safety rating, or share of cars in the vehicle fleet of the highest safety rating. Something which currently has proven difficult to implement, but which will become more important in a few years when the outflow of the vehicle fleet includes cars tested by Euro NCAP, as well as cars with traction control etc.
To get a complete picture of how security development in cars affects fatal accidents, development of the share of fatalities in cars with the highest safety rating will also be followed. The SRA’s depth studies will be used for this purpose but are not yet developed to provide data this year.
Development and projection to advisable level The first cars that achieved the highest safety rating were tested and entered the market in 2001. Towards the end of 2007, 66 per cent of all new cars sold in Sweden had the highest safety rating in Euro NCAP. The target level of 100 per cent in 2020 then implies an increase of over 2.5 percentage units per year which was achieved by a wide margin 2007-2008 when the share increased by 5 per cent units.
Share (%)
Expected development
The share of newly‐tested passenger cars with the highest safety rating in Euro NCAP
2020201620122008200420001996
100 90
80
70
60
50
40
30
20
10
0
Diagram 19. Share of new cars with the highest safety rating in Euro NCAP Source: Bilsweden, Euro NCAP
29

Analysis Collision safety for passenger cars has progressed strongly which can be understood by running a 90 per cent lower risk of being killed in today's modern cars than in a car from the early 1980s (Folksam). In addition to collision safety, passenger car safety has also been improved by the introduction of smart systems that help motorists avoid collisions or mitigate its consequences. This development will in all certainty continue and be of great significance something which is also shown by Euro NCAP including this in their ratings.
The share of cars with the highest safety rating in Euro NCAP has in recent years experienced strong development in Sweden. From a Vision Zero at the beginning of the 21st century to that just over 7 out of 10 cars sold have the highest safety rating. With this development of an approximate 10 per cent increase per year, it seems reasonable to believe that the target of 100 per cent will be reached in the not-too-distant future. However, there are several reasons to believe that the increase will not continue at the same pace as before. Firstly, it will be probably become more and more difficult the closer to the target of 100 per cent one gets since car customers are probably least likely to prioritise safety. Secondly, the average rating for cars tested in the Euro NCAP has steadily increased since the beginning which indirectly raises the safety rating of new cars sold. This increase of the average rating may now be here to stay with the introduction of new assessment criteria where it is more difficult to achieve the highest rating. However, this has nothing to do with the measurement of road safety potential when the value of each star is probably increased in comparison with previous test results. Euro NCAP can be expected to develop their systems over time, which should be considered in the assessment of the measurement’s development. It is already known today that Euro NCAP is altering its rating system in 2009, 2010 and 2012.
The share of new cars with the highest safety rating sold in Sweden is higher than the average in the Euro NCAP (50 per cent compared to Sweden 66 per cent in 2007). This shows that the increased safety of new cars in Sweden is not solely the result of a vehicle safety development, but also a result of car buyers in Sweden choosing safe cars, perhaps more than elsewhere in Europe.
One explanation for this may be that Swedes prioritise buying Swedish-made cars, which usually have a high safety standard and therefore indirectly choose cars with high safety. But conversely, it may also be that Swedish customers choose the Swedish-made cars based on their good safety properties and thus more consciously include safety as an important assessment criterion when selecting a car. Euro NCAP’s rating has also become a natural and integral part of new car model marketing in Sweden and prompts development. Active advocacy has also led to more stringent procurement requirements with regard to vehicle safety, road safety policies in governments and companies, etc. Additional advantageous effects proposed in the report Management by objectives for road safety work may be obtained with differentiated insurance systems, taxation for the benefit of safety equipment and possibly legislation of certain protective equipment.
4.7 Safe heavy vehicles
2007 2008 Target 2020 Share of new heavy vehicles with an automatic emergency braking system
0 % 0 % 100 %
The target is for 100 per cent of new heavy vehicles to be equipped with an automatic emergency brake system. The estimated potential of the proposed target levels is about 25 fewer deaths per year. The primary benchmark for this indicator is the share of new heavy vehicles equipped with an automatic emergency brake system. Additional steps are the share of new heavy vehicles / carriages equipped with traction control and the share of road user fatalities in collisions with heavy vehicles,
30

where their vehicle was equipped with an automatic emergency braking system respective other active safety systems.
There is currently no technical support on the market with the potential to save 25 lives a year. There are variations of the emergency braking system with a bearing on accident prevention, but the greatest potential lies in emergency braking systems that prevent or relieve head-on collisions and collisions between vehicles at junctions. It has not been possible to evaluate the share of, new heavy vehicles equipped with traction control this year. What complicates this assessment is that heavy vehicles can consist of only a traction vehicle or equipage of traction vehicle and trailer, with the exception of buses. It is hoped to be able to do this in future years and then also track the development a few years back in time.
It would also be desirable for heavy vehicles in the future to follow the development of safety - not only for new vehicles but also for the vehicle fleet as an entirety.
Development and projection to advisable level The starting position for the main measurement is therefore a Vision Zero which means that the number of new heavy vehicles with an automatic emergency brake system should increase by an average of just over 8 per cent in order to achieve the target of 100 per cent in 2020. Since it will probably take several years before the automatic emergency brake system with great potential is available on the market, the pace until then needs to be even higher.
Share (%)
Expected development
2020201620122008
100
90
80 70
60
50 40
30
20
10 0
Diagram 20. Share of new heavy vehicles with automatic emergency braking
Analysis As the primary measurement is not applicable in the current situation it is not possible to evaluate the share of road users killed in collisions with heavy vehicles where the heavy vehicle was equipped with an automatic emergency braking system respective other active safety systems. Nor is it possible to obtain a good basis for estimating the share of the new heavy vehicles with traction control.
The explanation for the lack of the base is that the technical support systems for heavy vehicles lay the ground for the measurements, such as automatic emergency braking, Electronic Stability Programme and lane assist, are relatively new or do not even exist yet. Therefore, a certain method development in the measurements is required. Hopefully methods will be developed in the near future, which can then be used to track the development including a couple of years back in time.
31

Since the development of technical support systems is moving rapidly for heavy vehicles as well as for passenger cars, there is reason to believe market penetration will be quick. One factor that may delay this is that the market is primarily demanding safety for the occupants of the truck, and not for fellow road users, where the great potential number of lives saved is found. On the other hand, replacement of the vehicle fleet is faster among heavy vehicles, which argues for more rapid development.
Recommended actions in the report Management by objectives for road safety work for safer heavy vehicles include safety requirements in purchasing and differentiated speed limits associated with new technologies.
4.8 Safe state roads
2007 2008 Target 2020 Share of vehicle kilometrage on roads with speed limits over 80km/h of dual-carriageway roads
50 % 52 % 75 %
The share of vehicle kilometrage on roads with a speed limit over 80 km/h and flow-separator with a central barrier will increase from 52 to 75 per cent. The annual impact is then estimated to be 50 fewer deaths. Other measures in the state road network, primarily rambled strips and narrow overtaking opportunities, are expected to result in a reduction of another 12 deaths.
The decrease of 50 fewer deaths is achieved by reconstructing approx. 2200 km of 90/110 km/h roads to flow-separated roads with rail guards, and by lowering the speed limits to 80 km/h on 4000 km of non-flow-separated roads which are 90 km/h today. Speed revisions in 2009 and later shall provide in accordance with an estimate from 2007 a total of 18 fewer deaths while physical median separation produces 32 fewer deaths. The further reduction of 12 deaths is achieved by reconstructing 1600 km of ordinary roads to 2 +1 roads with grooved median lines, solid centre line and 20 per cent overtaking stretches. This results in 9 fewer deaths. 80 per cent of this road will become a road with 1 +1 lane. Various minor measures on links and junctions produce an additional 3 and thus achieve a total of 62 fewer deaths.
When the TØI analysed the current situation in Sweden, potential and also opportunities in 12 years to build a road constructed on rural land the potential for physical measures was deemed as "large / medium" and the possibility to achieve the desired result was 8 on a 10 point scale (TØI, 2007). The cost of rebuilding the road in the countryside in order to achieve such physical separation is estimated at approx. 23 billion. The required annual contribution then becomes exactly 2 billion. If a traffic economical calculation of today's valuation of travel time benefits, safety benefits, etc. is made, it results in positive returns.
Development and projection to advisable level At the end of 2008 52 per cent of state road network with speed limit over 80 km/h were flow-separated, which is above the expected development of the target of 75 per cent (diagram 21). In the last 12 years 40 km of motorway have opened per year and the last 8 years, approx. 200 km of 2 +1 road per year. The opened motorways so far have had a traffic flow of 10-12 000 vehicles per day while opened 2 +1 roads have had a traffic flow of about 8 000 vehicles per day. The shifted vehicle kilometrage then annually amounts to 730 million vehicle km (mvkm). Since there is a base which in 1998 amounted to approx. 31 000 mvkm, this equates to 2 per cent change per year.
During 2008 400 km of roads have been signposted down to 80 km/h. This is assessed to lead to 1000 mvkm are moved from 90 to 80 km/h. As a result, the base for calculating the state measurement becomes lower and follow-up measure for 2008 further increases by this reaching a level of 52 per cent.
32

Share (%)
Expected development Share flow-separated roads
2020201620122008200420001996
100
90
80
70
60
50
40
30
20
10
0
Diagram 21. Share of vehicle kilometrage on flow-separated roads of all roads with a speed limit over 80 km/h. Source: Swedish Road Administration
Analysis Until now, the busiest and most cost-effective objects have been rebuilt. To reach the target of 75 per cent in 12 years through progressively lower traffic flow it is required to rebuild 250-350 km of regular roads to flow separated lanes each year. In order to affect the indicator, physical separation of oncoming traffic is then required in the form of a central barrier. Building the 2 +1 road with narrow overtaking and grooved median strip as well as central line can further contribute to reaching a total of 62 fewer deaths in a 12-year period.
With figures from the road databank, the road network’s status per 1998 and 2008 for the stretches of different road types and different speed limits can be illustrated. The following major changes can be observed for the 8000 km national road network.
− The amount of motorway has increased by 380 km. − 330 km of motorway now have a speed limit of 120 km/h − All sections which were motorway routes in 1998, are now converted to a flow separated
motorway routes. − 400 km of public roads have now been reduced to a speed limit of 80 km/h − 1200 km of regular road has been rebuilt to a flow separated road and usually with speed limit
100 km/h.
Changes have been much smaller on the regional road network. In 10 years 430 km of public road have been built to a flow separated road. During 2009, the regional roads will obtain the speed limit tested against the new criteria.
In 2009, a short-term possibility has also opened to maintain 90 km/h if physical measures improve the lateral area to such a high extent that it gives the same effect as a reduction from 90 to 80 km/h. This may mean that some of the great effect which until now has been calculated by speed limit reductions in 2009 does not occur. Longer term, however, reconstruction with median separation or reduced speed to 80 km/h is required.
33

4.9 Safe municipal streets – Pedestrian, bicycle and moped passages
2007 2008 Target 2020 Share of safe pedestrian, cycle and moped passages in the main municipal network
Approx. 25 % - Not
defined
Indicators for safe municipal streets are in contrast to most other indicators not set in relation to vehicle kilometrage, but in relation to the road network. Instead of pointing out how large a share of road users who should be travelling on safe municipal streets, the indicator points to how a large part of the municipal road network should look. This means that the indicators for safe municipal streets aim directly at the municipal road bodies and encourages them to take action. Measures to increase the share of safe pedestrian, cycle and moped passages and safe junctions on the main municipal network for passenger cars are estimated to together may lead to a saving of 30 lives. For which target level this is implied for the share of safe pedestrian, cycle and moped pedestrian, cycle and moped is not determined at this time. A pedestrian, cycle and moped passage should be classified as safe if it is graded or where 85 per cent of motorists drive a maximum of 30 km/h. This is a classification derived from the municipal road safety audits. The ambition is that all the pedestrian, cycle and moped passages on the designated road network are inventoried and entered as a new phenomenon, the national road database (NVDB). Thereafter the data is updated each year. The data includes information so that you can determine whether the passage is safe or not. The only evidence in the current situation available to study this indicator comes from the road safety audits which have been conducted in some 30 municipalities. Compiled data from these can be used to obtain an indication of the situation, but is not considered to be representative in any respect. Development and projection to advisable level In the report Management by objectives for road safety work the share of safe pedestrian, cycle and moped passages on the main municipal network is estimated at 25 per cent. However, this is a very rough estimate because no comprehensive data collection for this indicator has been conducted. Analysis The self-reported data from road safety audits indicate the distribution between different municipalities in terms of the share of safe pedestrian, bicycle and moped passages . In the larger municipalities it is assessed that between 20 and 40 per cent are safe, with an average value of 27 per cent. In the smaller municipalities in the data base the distribution is even greater, but the average value roughly the same. It thus does not appear that the share of safe passages would be lower in population centres, which probably have a greater number of passages to manage.
34

4.10 Safe municipal streets – junctions
2007 2008 Target 2020 Share of safe junctions on the main municipal car network
Approx. 50 % - Not
defined
Like the indicator for safe pedestrian, cycle and moped passages in the current situation there is no objective for the share of safe junctions. A junction shall be classified as safe if it is physically speed secured or where 85 per cent of motorists drive a maximum of 50 km/h. It is a classification derived from the local road safety audits. Measurement is supposed to be via NVDB in a manner similar to the pedestrian, bicycle and moped passages . The current situation only contains data from completed road safety audits.
Development and projection to advisable level In the report Management by objectives for road safety work the share of safe junctions on the main municipal network is estimated at 50 per cent. However, this is a very rough estimate because no comprehensive data collection for this indicator has been conducted. Analysis The self-reported data from road safety audits indicate a large distribution between different municipalities in terms of the share of safe junctions. In the larger municipalities it is assessed that between 10 to 60 per cent are safe, with an average of 24 per cent. For the smallest municipalities in the data information the distribution is 0 to 100 per cent but the average value is only 5 per cent. It thus does not appear that the share of safe junctions would be lower in population centres which probably have a greater number of junctions to manage. Nor does it seem that the estimation of approximately 50% of the junctions on the main municipal network would be safe (in accordance with the specified starting position for the indicator) is based on these data.
4.11 Prompt and proper rescue/care
2007 2008 Target 2020 The average time from injury to appropriate rescue/care
- 12.3 min Not defined
Of those who die as a result of traffic injuries approximately 2/3 die at the collision site and approximately 1/3 at the hospital. A few die during ambulance transport. There is no basis for a current state description in terms of time from an accident until an injured person receives proper emergency medical attention. A general guideline is that if an injured person receives proper treatment within the "golden hour" the chance of survival increases and the risk of permanent damage decreases. Relevant medical attention can be defined as care by ambulance personal at the scene of the accident or in the ambulance. These guidelines still apply, but discussions are being held today whether some injuries cannot receive proper medical attention in the ambulance. This is especially true for head injuries. Because there are certain diagnoses that cannot receive proper medical attention in the ambulance, but may be given at all emergency hospitals, the measurement should be time from injury to the ambulance (or equivalent) on the scene, and until the injured party has arrived at emergency ward at a hospital. In STRADA it is possible to infer time from injury to arrival at the emergency hospital, but not time from injury until the ambulance (or equivalent) arrives the scene.
35

Development and projection to advisable level As there is currently no basis for a current state description in terms of time from accident until an injured person receives proper emergency medical attention in the ambulance (or otherwise) no description is made of the development and projection to an advisable level.
Analysis To obtain a baseline, time from injury until arrival at the emergency hospital should be used. In reference to the ISS 0-3, statistics show for 2007 that slightly more than 42 per cent of injured persons arrive at the hospital within one hour of the injury’s/injuries’ occurrence. Those injured with a higher ISS-level have a much quicker arrival to the emergency hospital. Of the injured with ISS 4-8, closer to 59 per cent arrive at the hospital within an hour while the corresponding share among the injured with ISS greater than 9 is just over 57 per cent. Diagram (22) shows individual time from injury to treatment in an emergency hospital divided on by ISS. The diagram shows that an even greater share of people with severe injuries receives hospital care within an hour compared with those who are less seriously injured.
Since many injuries can receive adequate medical attention when the ambulance is on the scene development work that makes it possible to measure this should be implemented. In this way, all injuries are divided by time from injury to proper medical attention, something that currently is not possible.
0
5
10
15
Share (%)
ISS 16-ISS 9-14ISS 4-8ISS 1-3ISS 0
1 w - <7 d3 d -
<3 d2 d -
<2 d1 d -
<1 d12 h -
<12 h8 h -
<8 h5 h -
<5 h 4 h -
<4 h3 h -2 h -
<3 h 1.5 h -<2 h <1.5 h
1 h -- <1 h
31 min min
<=30
45
40
35
30
25
20
Diagram 22. People's time from injury in the road transport system to medical attention at an emergency hospital divided by ISS, irrespective of means of travel to the hospital. Source: STRADA
Relating to persons who received ambulance transport to hospital, no significant difference is seen however, between the injuries’ degree of severity and time from injury to hospital arrival. Almost 65 per cent of the injured who were transported by ambulance arrived at the hospital within an hour and nearly 90 per cent within 1.5 hours. Perhaps one can discern from the diagram that uninjured people (ISS 0) and those with the most serious injuries (ISS> 16) to a lesser extent than other ISS groups reach the hospital within one hour For the part of the uninjured perhaps a portion of the explanation may be that the ambulance did not need to drive as fast as when transporting injured persons.
36

Cumulative per cent
100
90
80
70
60
50
40
30
20
10
02 d - <=30 31 min 1 h - 1.5 h - 2 h - 3 h - 4 h - 5 h - 8 h - 12 h - 1 d - 1 w - 3 d -
<1.5 h <2 h <7 d min - <1 h <3 h <4 h <5 h <8 h <12 h <1 d <2 d <3 d
ISS 0 ISS 1-3 ISS 4-8 ISS 9-14 ISS 16-
Diagram 23. People's time from injury in the road transport system to medical attention at an emergency hospital after being transported to a hospital by ambulance, divided by ISS. Source: STRADA
More information on time from injury to proper medical attention can, at least descriptively, be obtained from SOS Alarm, which measures the time from the incoming alarms to its rescue vehicles arriving at the accident scene. In 2008, the average time was 12.3 minutes, but this varied between different emergency service centres. The variation is primarily considered due to geographical reasons, when the emergency service centres with shorter latency time are located in areas with higher population density structure than those with longer latency time. The Swedish Road Administration has had preliminary contact with SOS Alarm in terms of ability to access their data. Closer cooperation is likely to be initiated between the Swedish Road Administration and SOS Alarm during 2009.
4.12 Non-fatigued drivers
2007 2008 Target 2020 Share of drivers who state that they had fallen asleep or almost fallen asleep
11.9 % 12.7 % 6 %
Accident research shows that fatigue may be the cause of 15-30 per cent of all accidents involving motor vehicles. The problem is considered to be of the same magnitude as drink driving. Sending out questionnaires and then creating an index of fatigue is easy, as there is a well-functioning organisation for this. The action now used to measure the fatigue problem when driving a car (in the Swedish Road Administration’s road safety survey) needs to be validated against the problem in real traffic and be linked to methods improving the problem. Otherwise, the risk is that the measure will miss both strategic and tactical and operational effectiveness.
37

Development and projection to advisable level Of those who drive cars, about 12-13 per cent say in the 2006, 2007 and 2008 road surveys that over the past 12 months they had fallen asleep or almost fallen asleep while driving on one or more occasions (Diagram 24). The target is not broken down by group, but if a comparison is made between men and women the distribution is about 15 per cent for men and 9 per cent for women, i.e. a factor of 2 to the disadvantage of men.
Share (%) 20 18 16 14 12 10 86420
2006 2008 2010 2012 2014 2016 2018 2020
Expected development Slept/almost slept
Diagram 24. Share of those stating that they had fallen asleep or almost fallen asleep
while driving during the past 12 months for the years 2006, 2007 and 2008, and expected development. Source: The Swedish Road Administration’s road safety survey
Analysis The differences between 2006, 2007 and 2008 are small and no slowdown can be seen from undesirable development. The report Target Control of road safety work shows that the share of those who say they had fallen asleep or almost fallen asleep when driving in the past year will be halved until 2020. To the target be accessed is therefore an improvement of about six percentage points. It requires an even greater improvement for men than for women. There are also more men than women who drive car and an improvement in the group of men is probably more powerful than the group of women.
4.13 High Prioritisation of Road Safety
2007 2008 Target for 2020 Measurement of the indicator is not defined - - Not
defined
An attempt has been made to measure the score from a score of issues of SRA's annual road safety questionnaire. The idea was to create an index reflecting people's valuation of road safety. The result shows that the idea of creating an index based on existing issues is not working. Development work to produce a method that measures the prioritisation of road safety and linking the results to the indicators' development needs to be carried out.
38

5 Conclusions and Discussion Since the end of 2008, it has become increasingly clear that we are now in a period of historically low number of traffic fatalities in Sweden. From December 2008 up to and including March 2009 the number of deaths has fallen by over 40 per cent over the corresponding period a year earlier.
Besides implemented road safety measures there is reason to believe that much of this decline is due to the current economic situation. Reduced traffic and changing travel patterns for different groups on the road are considered to be a significant reason. It is of great importance to develop models and an association around market influence on development of road safety, preferably in cooperation with other countries, to recognize an explanation as to what is now happening. In order to implement a 50 % reduction in the number of fatalities by 2020, it is therefore important not to be complacent but to now focus on implementing measures that affect the indicators judged to have the greatest road safety impact. The indicators which are assessed individually to give the greatest effect on the number of deaths are Speed compliance, Safe vehicles and Safe public roads. The indicator “Sober Drivers” is also believed to be particularly important when it was observed that intoxicated drivers who were killed in an accident many times also drove both too fast and without a belt. The state and development are most alarming within Speed and Sober drivers. To reach the target of 80 per cent of the speed limit on state road, it requires a 100 per cent increase in motorists who adhere to the regulated speed limits and a reduction in average speed of 5 km/h.. This means that a substantial change of road user rule compliance. As for the indicator Sober drivers, the vast majority of those in traffic are sober but the relatively few who drink drive have a significantly increased risk. The problem is basically the same as at the beginning of last interim target period. The measure implemented in densely built-up areas which had the greatest impact on road safety development was the speed safeguarding of junction points. Although the municipalities so far have introduced major changes to the street environment there is potential for significant gains in the road safety indicators Safe junctions and safe pedestrian, cycle and moped passages. For severely injured motorcyclists and moped riders problems are worrying. Between 1998 and 2007 the number of people seriously injured increased by 63 per cent, while the number decreased in all other road user groups. The number of injured male motorcyclists and moped riders are, on an annual basis, more than the number of injured men in passenger cars. To draw attention to this problem, it is important to develop analyses and measurement methods. To reduce the number of those seriously injured by one-fourth in 2020, a substantial increase in bicycle helmet use is required. Today, approximately 25 percent use bicycle helmets and to reach the target level of 70 per cent in all probability, a law on mandatory bicycle helmet use is needed.
It is important for the continued monitoring of the road safety work that target levels are defined and measurements established for all of the indicators that are proposed in the report Management by objectives for road safety work.
39

6 References
Cedersund, H.-Å. & Karlsson B.O. (2008) Bilbältesanvändningen i Sverige 2007. VTI noted 23-2008. National Road and Transport Research Institute, Linköping.
Elvik, R. & Vaa, T. (2007). Trafiksikkerhetshåndboken, taken 2009-03-27 from: http://tsh.toi.no.
Folksam (2009), taken 2009-03-31 www.folksam.se/testergodarad/caren/krocktest/statistik#
Forsman, Å., Gustafsson, S. and Varedian, M. (2007) Rattfylleriets omfattning. En metodstudie i Södermanlands, Örebro and Östergötlands län. VTI report 599. National Road and Transport Research Institute, VTI. Linköping. Ifver, Rydgren, Brorsson TSV (1986). ”Injuries from single-vehicle crashes and snow depth”. Accident Analysis and Prevention 1986.
Krafft, M., Kullgren, A., Lie, A. and Tingvall, C. (2006) “The Use of Seat Belts in Cars with Smart Seat Belt Reminders - Results of an Observational Study”. Traffic Injury Prevention, 7:2, 125–129.
Lie A, Tingvall C (2002). “How Do Euro NCIRKAP Results Correlate with Real-Life Injury Risks? A Paired Comparison Study of Cirkar-to-Cirkar Crashes” Traffic Injury Prevention, 3:288–293, 2002. Larsson, J. (2009) Cykelhjälmsanvändning i Sverige 1988–2008. Results from VTI’s most recent observation study. PM.
Nolén, S. (1998) Trafiksäkerhetspotential av ökad cykelhjälmsanvändning i Sverige. VTI Noted 34-1998.
Norström T. “Law enforcement and alcohol consumption policy as countermeasures against drunken driving: Possibilities and limitations”, Accident Analysis & Prevention, Volume 15, Issue 6, December 1983, Pages 513-521
Proposition 2008/09:93 Mål för framtidens resor and transporter
”Samband mellan total alkoholkonsumtion and rattfylleri”. The primary source is an article by Tor Norström in Accident Analysis and Prevention 1983.
SCB and Konjunkturinstitutet: Ekonomisk utveckling, konjunkturprognos (SCB [Central Bureau of Statistics] and KI [NIER, the National Institute for Economic Research]): Economic development, economic forecast
SCB: Befolkning and befolkningsprognos (Population and population projection)
SIKA publication 2008:27 Vägtrafikskador 2007
Sörensen, M., Elvik, R., Kobensvedt, M and Assum, T. (2007) Nyt etappemål för trafiksikkerhed i Sverige. (SM/1892/2007), TransportØkonomisk Institutt, Oslo Thomas, A. and Vadeby, A. (2007) Sammanställning av 34 trafiksäkerhetsåtgärder. VTI Report 577.
The Swedish Road Administration Publication 2007:149 Fallolyckor i Skåne län 2005-2006 The Swedish Road Administration Publication 2008:31 Målstyrning av trafiksäkerhetsarbetet – Aktörssamverkan mot nya etappmål år 2020
40

41
The Swedish Road Administration, 2006 Att beskriva vägtrafikolyckornas hälsopåverkan The Swedish Road Administration: Hastighetsindex (Speed index) The Swedish Road Administration Publication 2008:114 Resultat från 2008 års trafiksäkerhetsenkät The Swedish Road Administration Advisory, 2008 Hastigheter motorcykeltrafik


lotta

VägverketSwedish Road Administration SE-781 78 Borlänge, Sweden www.vv.se. [email protected].
Phone: +46 771 119 119. Textphone: +46 243 750 30. Fax: +46 243 785 28.