mammalian cell cytotoxicity and - us epa · mammalian cell cytotoxicity and genotoxicity of new...
TRANSCRIPT


EPA Region 5July 2004
1
Mammalian Cell Cytotoxicity and Genotoxicity of New Drinking Water
Disinfection By-Products
U.S. EPA Region 5 ORD STAR Seminar
Dr. Michael J. PlewaProfessor of Genetics
University of Illinois at Urbana-Champaign

EPA Region 5July 2004
2
Water is the best of all things. Pindar (438 BC), Olympian Odes

EPA Region 5July 2004
3
EPA Region 5July 2004
4
Safe Drinking Water:Benefits and Risks
Drinking water disinfection was a major public health triumph of the 20th century. The disinfectants greatly reduced the incidence of typhoid, cholera and other waterborne diseases. However, there is an unintended consequence of disinfection, the generation of chemical disinfectionby-products (DBPs).
EPA Region 5July 2004
5
Drinking Water Disinfection By-Products (DBPs)
• DBPs are compounds formed during drinking water disinfection as a result of the reaction between naturally occurring organic materials, synthetic organic contaminants and disinfectants.
• Between 51% and 92% of DBP products are unknown in the halogenated organic fraction (TOX) depending on the disinfection process.
EPA Region 5July 2004
6
Regulation of DBPs
• The health risks due to DBPs are not fully known, however, a substantial number of these agents were demonstrated to be toxic in many biological assays. In 1979 the EPA began the formal regulation of DBPs.
• The regulation was extended in 1998 with the publication of the Stage 1 Disinfectants/Disinfection Byproducts Rule.
• Stage 2 of the Rule is in the process of finalization. • Although over 600 DBPs have been isolated and
identified, this represents only a fraction of the halogenated organic material that can be isolated after the disinfection of raw waters.
EPA Region 5July 2004
7
No DBP Toxicity Database• In 1999 the U.S. EPA, the National Institute of Environmental
Health Sciences and the U.S. Army called for a comprehensive biological and mechanistic DBP database.
• EPA employed a computer model-based structure-activity relationship (SAR) analysis of hundreds of DBPs. The SAR analysis was used to rank the carcinogenic potential of DBPsand identify a group of priority DBPs for further chemical and biological analysis.
• The EPA also conducted a Nationwide DBP Occurrence Study. A list of priority DBPs was drawn up of approximately 50 agents that were not included in the Information Collection Rule and were estimated to be the most toxic. A second group of approximately 20 DBPs of similar chemical structure to the priority compounds was also defined. Also from the surveyed water treatment plants, 28 new DBPs were structurally identified.
• There is virtually no toxicity data for most of these priority and new DBPs.
EPA Region 5July 2004
8
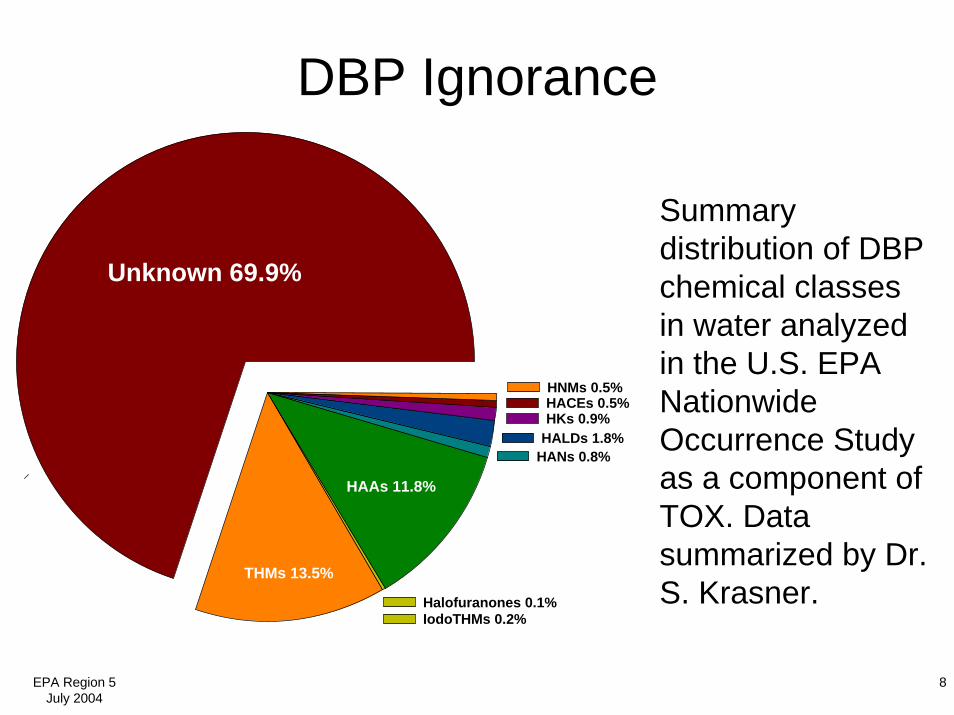
DBP Ignorance
Unknown 69.9%
THMs 13.5%
HAAs 11.8%
Halofuranones 0.1%IodoTHMs 0.2%
HANs 0.8%HALDs 1.8%HKs 0.9%HACEs 0.5%HNMs 0.5%
Summary distribution of DBP chemical classes in water analyzed in the U.S. EPA Nationwide Occurrence Study as a component of TOX. Data summarized by Dr. S. Krasner.
EPA Region 5July 2004
9
In a Recent Issue of theJournal Epidemiology
• A panel of international experts stated, “These findings strengthen the hypothesis that the risk of bladder cancer is increased with long-term exposure to disinfection byproducts at levels currently observed in many industrialized countries.”
• Epidemiology 2004, 15:357-367

EPA Region 5July 2004
10
Objectives of This Study
• Analyze the cytotoxicity of the individual DBPs with Chinese hamster ovary (CHO) cells.
• Determine the cytotoxic rank order of the DBPs.• Analyze the genotoxicity of the individual DBPs
with CHO cells.• Determine the genotoxic rank order of the DBPs.• Employ these data in a U.S. Environmental
Protection Agency risk assessment program.

EPA Region 5July 2004
11
Mammalian Cell Chronic Cytotoxicity Assay
Chronic mammalian cell cytotoxicity is an important measure of the toxic impact of a test agent in which cells are continuously exposed throughout several cell divisions. Standard plating methods to measure toxicity are laborious, time consuming and require large amounts of sample. To address these problems we developed a rapid, semi-automated microplate-based, chronic cytotoxicity assay that measured the impact of a specific water DBP on cell survivorship.
EPA Region 5July 2004
12
Mammalian Cell ChronicCytotoxicity Assay
CHO Cells per Microplate Well0 20000 40000 60000 80000C
HO
Cel
l Den
sity
as
Abs
orba
ncy
at 5
95 n
m0.0
0.1
0.2
0.3
0.4
0.5
0.6
0.7
Wavelength (nm)400 600 800
CV
Abs
orba
ncy
0.00
0.05
0.10
0.15
0.20 A
B
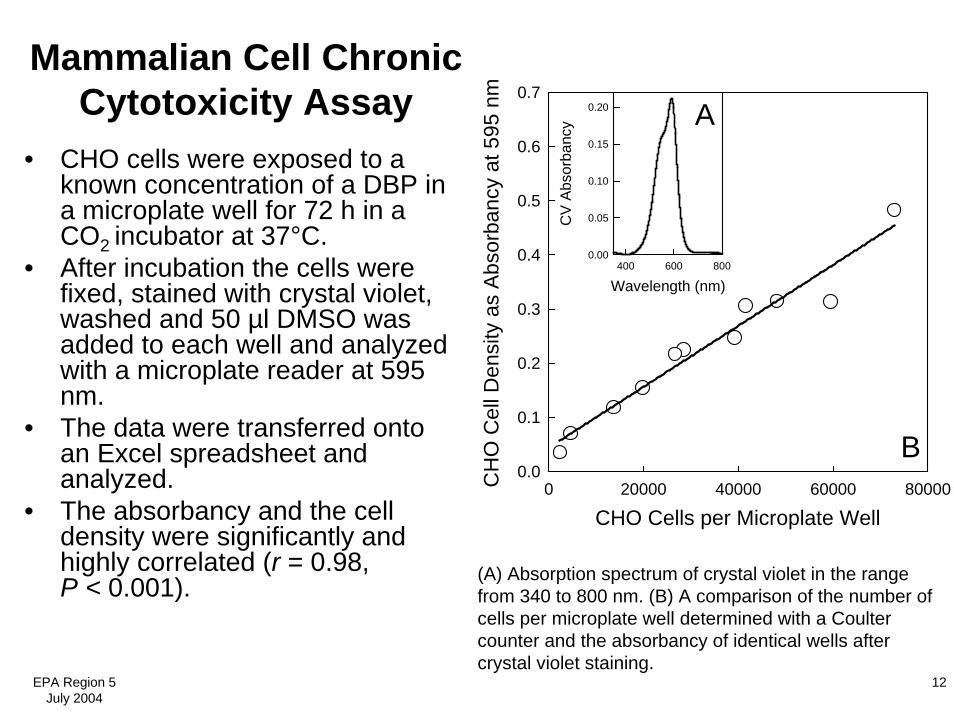
• CHO cells were exposed to a known concentration of a DBP in a microplate well for 72 h in a CO2 incubator at 37°C.
• After incubation the cells were fixed, stained with crystal violet, washed and 50 µl DMSO was added to each well and analyzed with a microplate reader at 595 nm.
• The data were transferred onto an Excel spreadsheet and analyzed.
• The absorbancy and the cell density were significantly and highly correlated (r = 0.98, P < 0.001). (A) Absorption spectrum of crystal violet in the range
from 340 to 800 nm. (B) A comparison of the number of cells per microplate well determined with a Coulter counter and the absorbancy of identical wells after crystal violet staining.
EPA Region 5July 2004
13
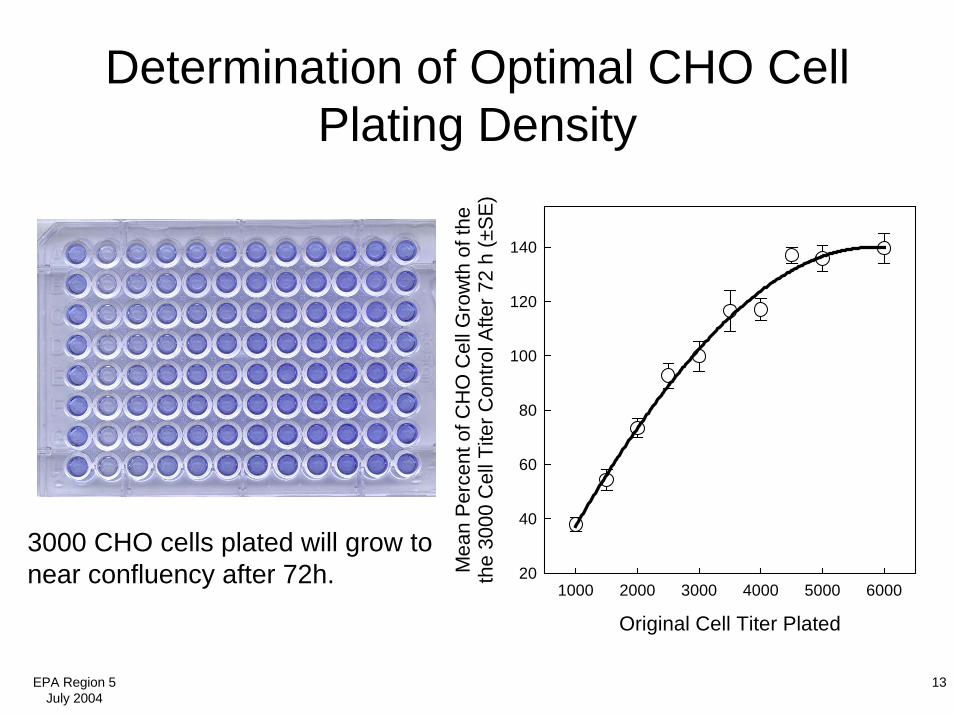
Determination of Optimal CHO Cell Plating Density
Original Cell Titer Plated
1000 2000 3000 4000 5000 6000
Mea
n Pe
rcen
t of C
HO
Cel
l Gro
wth
of t
heth
e 30
00 C
ell T
iter C
ontro
l Afte
r 72
h (±
SE)
20
40
60
80
100
120
140
3000 CHO cells plated will grow to near confluency after 72h.
EPA Region 5July 2004
14
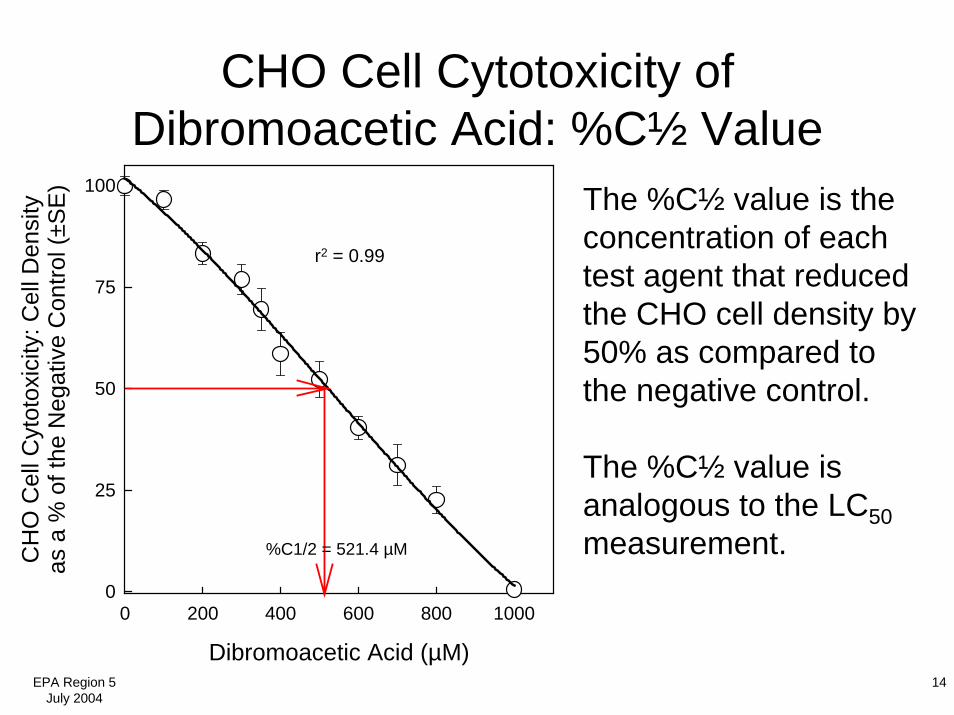
CHO Cell Cytotoxicity of Dibromoacetic Acid: %C½ Value
Dibromoacetic Acid (µM)
0 200 400 600 800 1000
CH
O C
ell C
ytot
oxic
ity: C
ell D
ensi
tyas
a %
of t
he N
egat
ive
Con
trol (
±SE
)
0
25
50
75
100
%C1/2 = 521.4 µM
r2 = 0.99
The %C½ value is the concentration of each test agent that reduced the CHO cell density by 50% as compared to the negative control.
The %C½ value is analogous to the LC50measurement.
EPA Region 5July 2004
15
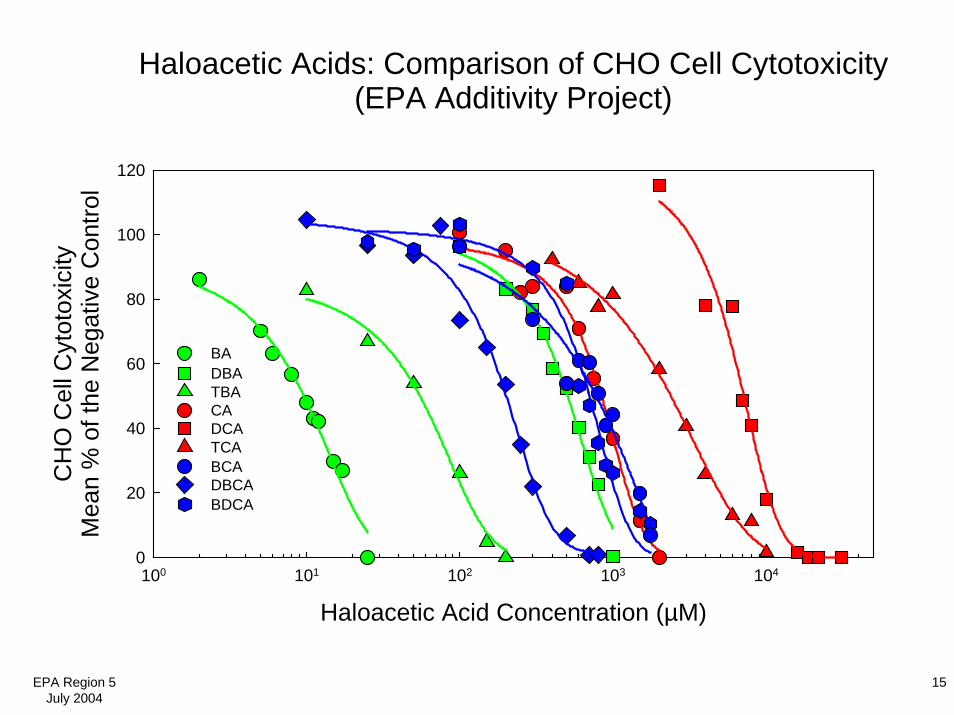
Haloacetic Acids: Comparison of CHO Cell Cytotoxicity(EPA Additivity Project)
Haloacetic Acid Concentration (µM)100 101 102 103 104
CH
O C
ell C
ytot
oxic
ityM
ean
% o
f the
Neg
ativ
e C
ontro
l
0
20
40
60
80
100
120
BADBATBACADCATCA
DBCABDCA
BCA
EPA Region 5July 2004
16
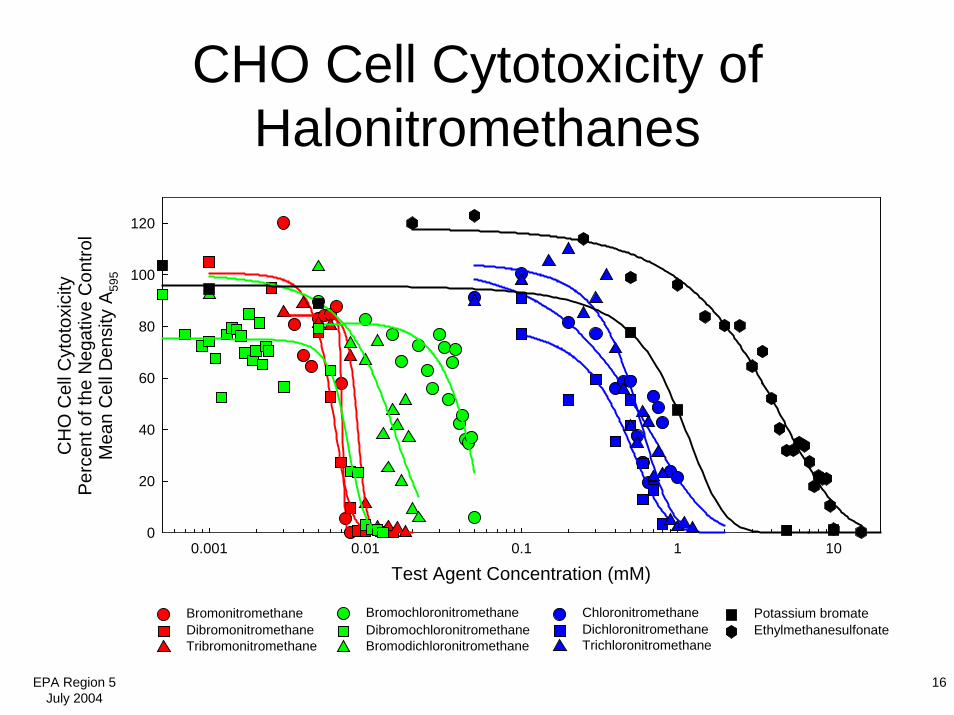
CHO Cell Cytotoxicity of Halonitromethanes
Test Agent Concentration (mM)0.001 0.01 0.1 1 10
CH
O C
ell C
ytot
oxic
ityP
erce
nt o
f the
Neg
ativ
e C
ontro
lM
ean
Cel
l Den
sity
A59
5
0
20
40
60
80
100
120
Potassium bromateEthylmethanesulfonate
BromonitromethaneDibromonitromethaneTribromonitromethane
BromochloronitromethaneDibromochloronitromethaneBromodichloronitromethane
ChloronitromethaneDichloronitromethane Trichloronitromethane
EPA Region 5July 2004
17
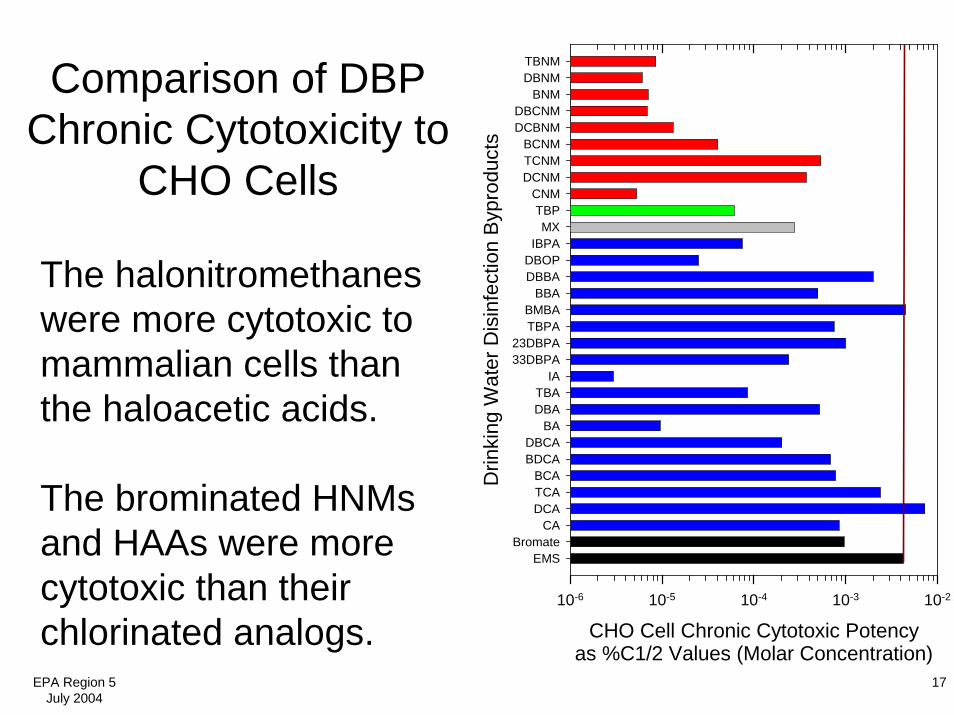
CHO Cell Chronic Cytotoxic Potencyas %C1/2 Values (Molar Concentration)
10-6 10-5 10-4 10-3 10-2
Drin
king
Wat
er D
isin
fect
ion
Byp
rodu
cts
EMSBromate
CADCATCABCA
BDCADBCA
BADBATBA
IA33DBPA23DBPA
TBPABMBA
BBADBBADBOP
IBPAMX
TBPCNM
DCNMTCNMBCNM
DCBNMDBCNM
BNMDBNMTBNMComparison of DBP
Chronic Cytotoxicity to CHO Cells
The halonitromethaneswere more cytotoxic to mammalian cells than the haloacetic acids.
The brominated HNMsand HAAs were more cytotoxic than their chlorinated analogs.
EPA Region 5July 2004
18
DBP-Induced Mammalian Cell Cytotoxicity: Summary
• Our microplate-based method allows for the analysis of a large number of concentrations per test agent and a large number of replicates per concentration.
• Chronic mammalian cell cytotoxicity is an important toxicological measurement and is being used for risk assessment by the US EPA.
• The cytotoxic potency (%C½ value) permits a quantitative comparison and rank ordering of the DBPs.
• The HNMs were more cytotoxic than HAAs.• Brominated HNMs and HAAs were more cytotoxic than
their chlorinated analogs.
EPA Region 5July 2004
19
Genomic DNA Damage Induced by Drinking Water
Disinfection By-Products
Single Cell Gel Electrophoresis
The target is the genome, not just a gene.
EPA Region 5July 2004
20
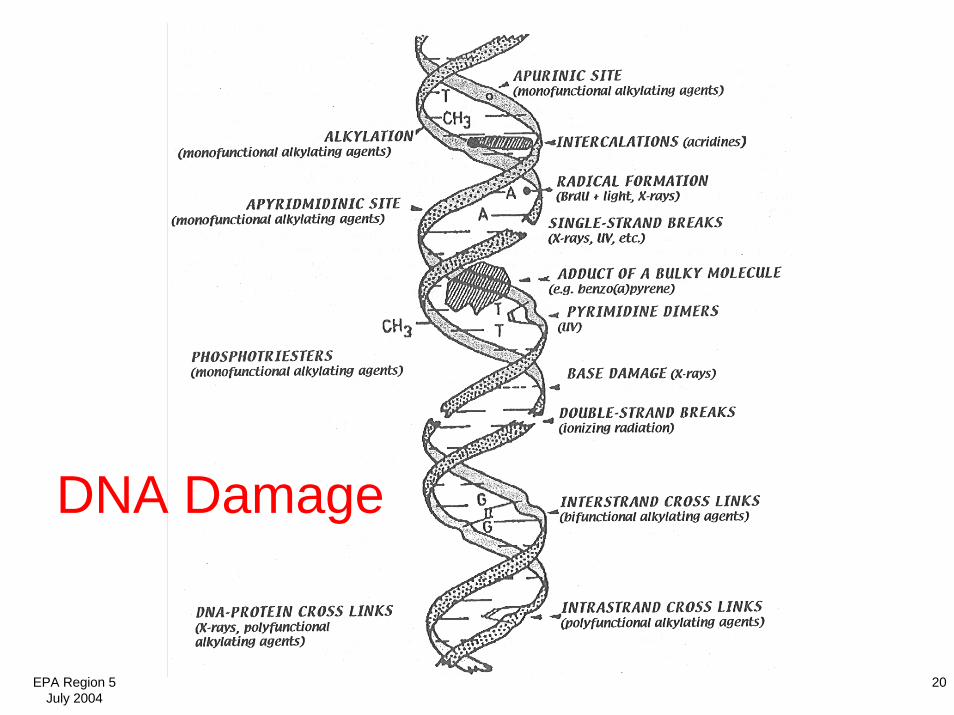
DNA Damage

EPA Region 5July 2004
21
SCGE Analysis of 2AAAF(in isolated nuclei from control and treated CHO cells)
Negative ControlNegative Control 800 800 nMnM 2AAAF2AAAF
EPA Region 5July 2004
22
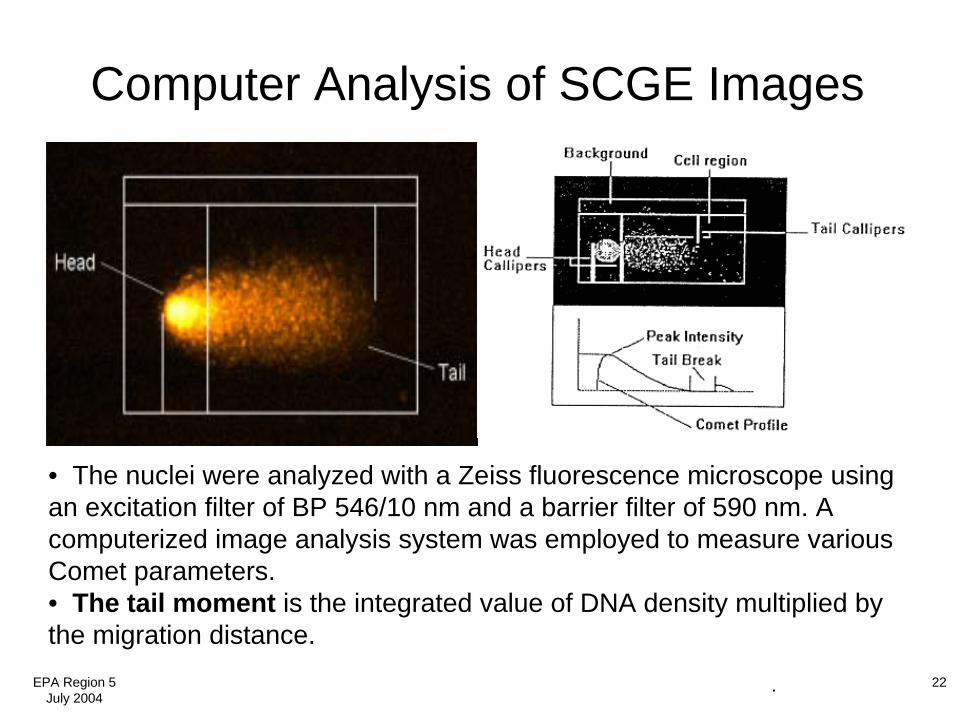
Computer Analysis of SCGE Images
• The nuclei were analyzed with a Zeiss fluorescence microscope using an excitation filter of BP 546/10 nm and a barrier filter of 590 nm. A computerized image analysis system was employed to measure various Comet parameters. • The tail moment is the integrated value of DNA density multiplied by the migration distance.
..
EPA Region 5July 2004
23
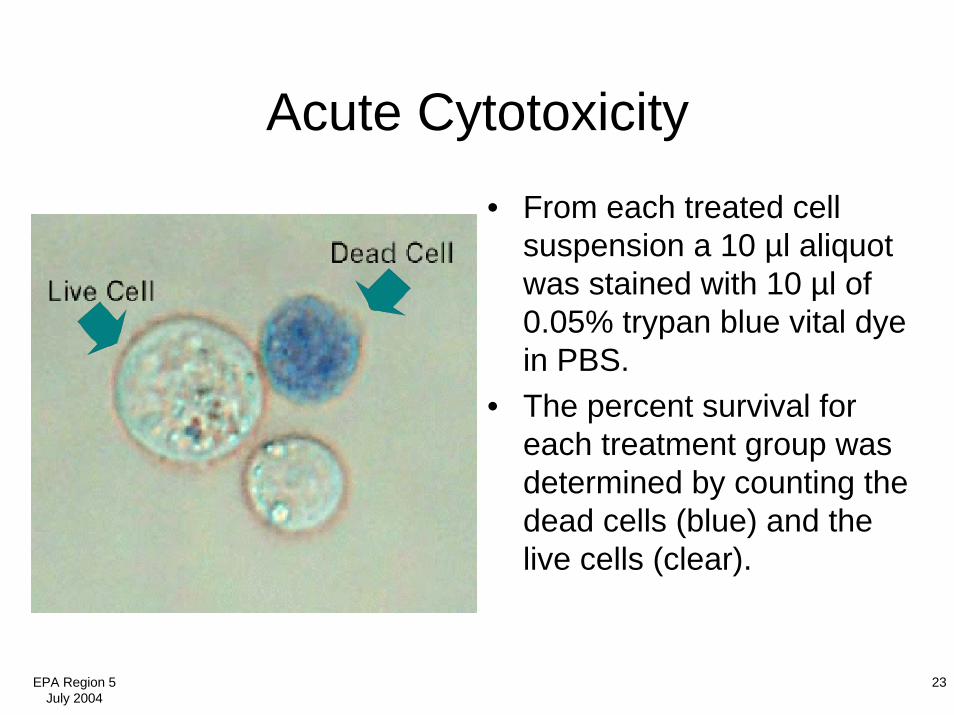
Acute Cytotoxicity• From each treated cell
suspension a 10 µl aliquot was stained with 10 µl of 0.05% trypan blue vital dye in PBS.
• The percent survival for each treatment group was determined by counting the dead cells (blue) and the live cells (clear).
EPA Region 5July 2004
24
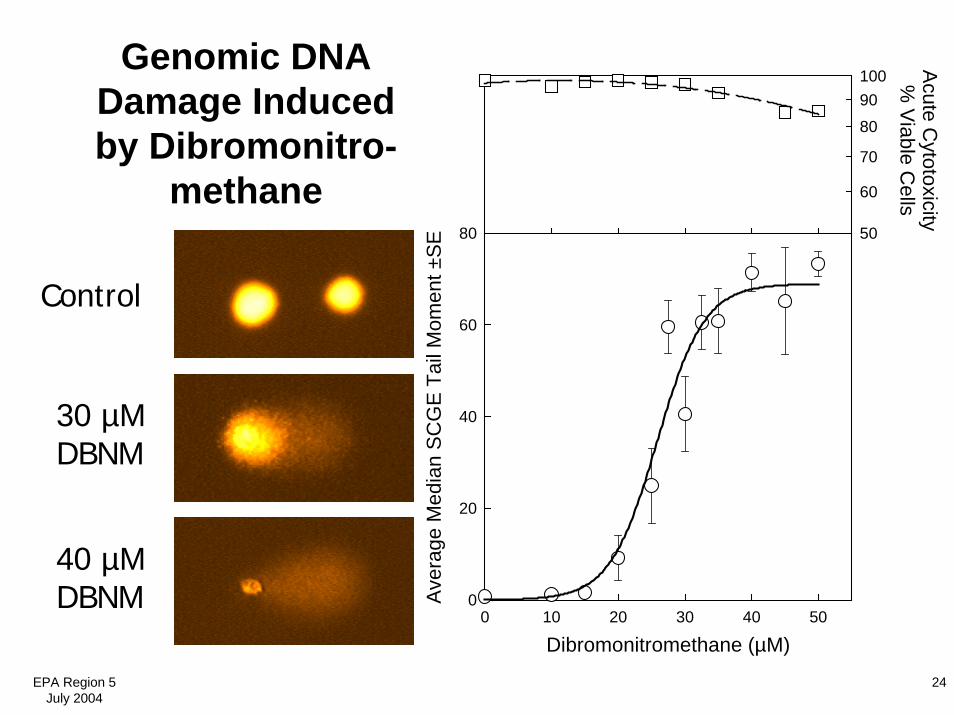
Genomic DNA Damage Inducedby Dibromonitro-
methane
Dibromonitromethane (µM)0 10 20 30 40 50
Ave
rage
Med
ian
SC
GE
Tai
l Mom
ent ±
SE
0
20
40
60
80
Acute C
ytotoxicity%
Viable C
ells
50
60
70
8090100
Control
30 µMDBNM
40 µMDBNM
EPA Region 5July 2004
25
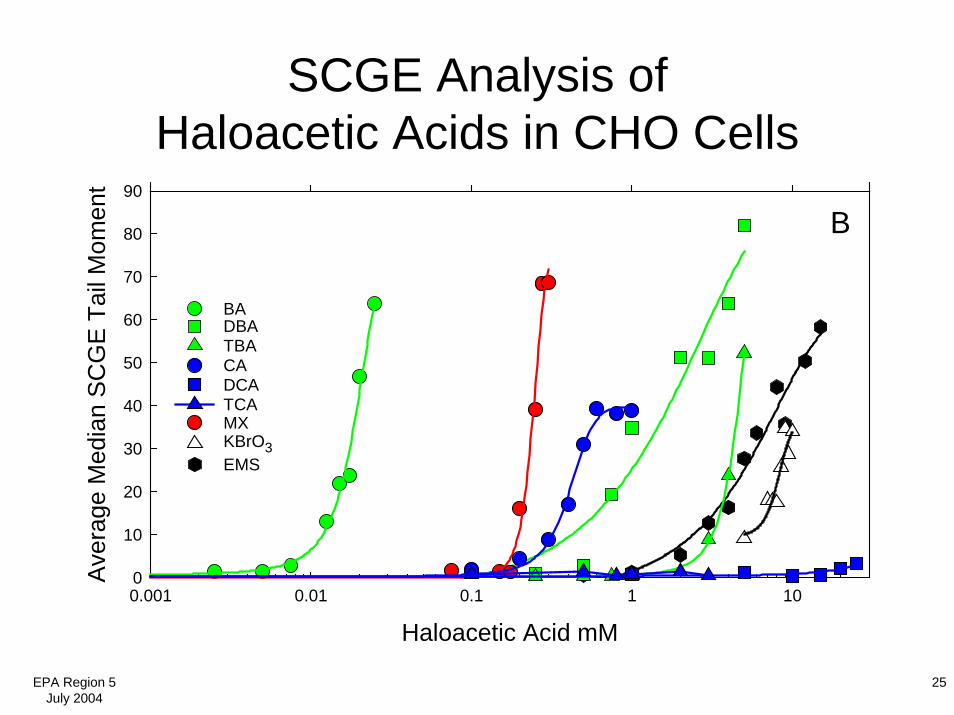
SCGE Analysis ofHaloacetic Acids in CHO Cells
Haloacetic Acid mM0.001 0.01 0.1 1 10
Aver
age
Med
ian
SCG
E T
ail M
omen
t
0
10
20
30
40
50
60
70
80
90
B
BADBATBACADCATCAMX
EMSKBrO3

EPA Region 5July 2004
26
SCGE Analysis ofHalonitromethanes in CHO Cells
Concentration (mM)0.01 0.1 1 10
Ave
rage
Med
ian
SC
GE
Tai
l Mom
ent
0
10
20
30
40
50
60
70
80
90
DibromonitromethaneBromonitromethane
Tribromonitromethane
BromochloronitromethaneDibromochloronitromethaneBromodichloronitromethane Trichloronitromethane
DichloronitromethaneChloronitromethane Ethylmethanesulfonate
KBrO3
EPA Region 5July 2004
27
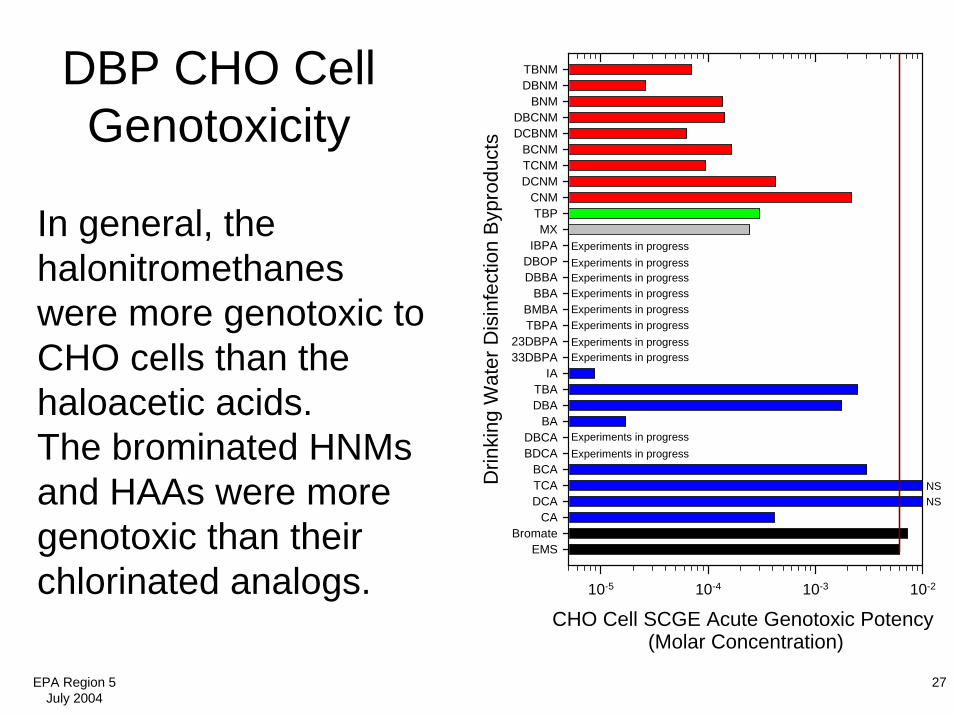
DBP CHO Cell Genotoxicity
CHO Cell SCGE Acute Genotoxic Potency (Molar Concentration)
10-5 10-4 10-3 10-2
Drin
king
Wat
er D
isin
fect
ion
Byp
rodu
cts
EMSBromate
CADCATCABCA
BDCADBCA
BADBATBA
IA33DBPA23DBPA
TBPABMBA
BBADBBADBOP
IBPAMX
TBPCNM
DCNMTCNMBCNM
DCBNMDBCNM
BNMDBNMTBNM
NSNS
Experiments in progressExperiments in progressExperiments in progressExperiments in progressExperiments in progress
Experiments in progress
Experiments in progressExperiments in progressExperiments in progress
Experiments in progress
In general, the halonitromethaneswere more genotoxic to CHO cells than the haloacetic acids.The brominated HNMsand HAAs were more genotoxic than their chlorinated analogs.
EPA Region 5July 2004
28
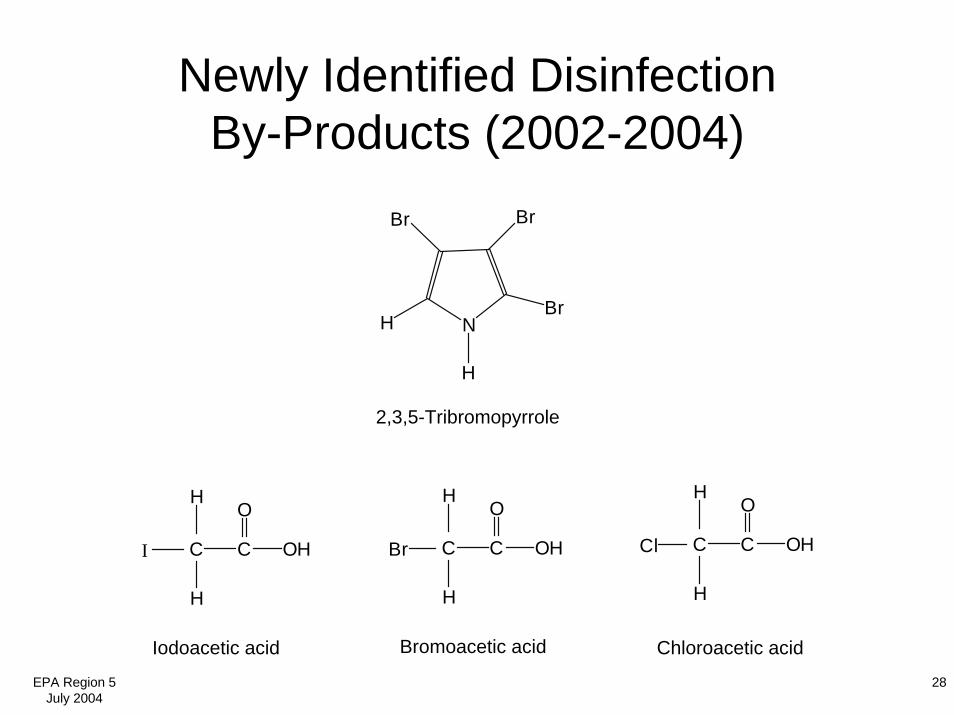
Newly Identified DisinfectionBy-Products (2002-2004)
N
BrBr
HBr
H
2,3,5-Tribromopyrrole
C C
O
OH
H
I
H H
Cl
H
OH
O
C C
H
Br
H
OH
O
C C
Iodoacetic acid Bromoacetic acid Chloroacetic acid

EPA Region 5July 2004
29
Trbrpy_b #217-238 RT: 8.52-8.87 AV: 22 SB: 101 7.55-8.18, 9.05-10.10 NL: 8.71E5T: + c Full ms [ 45.00-450.00]
50 100 150 200 250 300 350 400 450m/z
0
5
10
15
20
25
30
35
40
45
50
55
60
65
70
75
80
85
90
95
100
Rel
ativ
e A
bund
ance
302.9
224.0
222.1226.0 301.0
306.8197.0
195.1
144.1118.163.1227.0 307.8115.1 161.279.1 300.0 446.1401.0342.0 358.8
Mass Spectra of 2,3,5-Tribromopyrrole and
Iodoacetic Acid
Tribromopyrrole
40 50 60 70 80 90 100 110 120 130 140 150 160 170 180 190 200 210 220m/z0
100
%
73
42
345958
5150 65
61 68
200
141
127
10878 8582 9389 109140
128
169
168142 201
CH
O3
52
(-I)
HCH
I 2-C(O)OCH3
CH
OI
22
-OCH3
CH
OI
35
2
Iodoacetic acid methyl ester
EPA Region 5July 2004
30
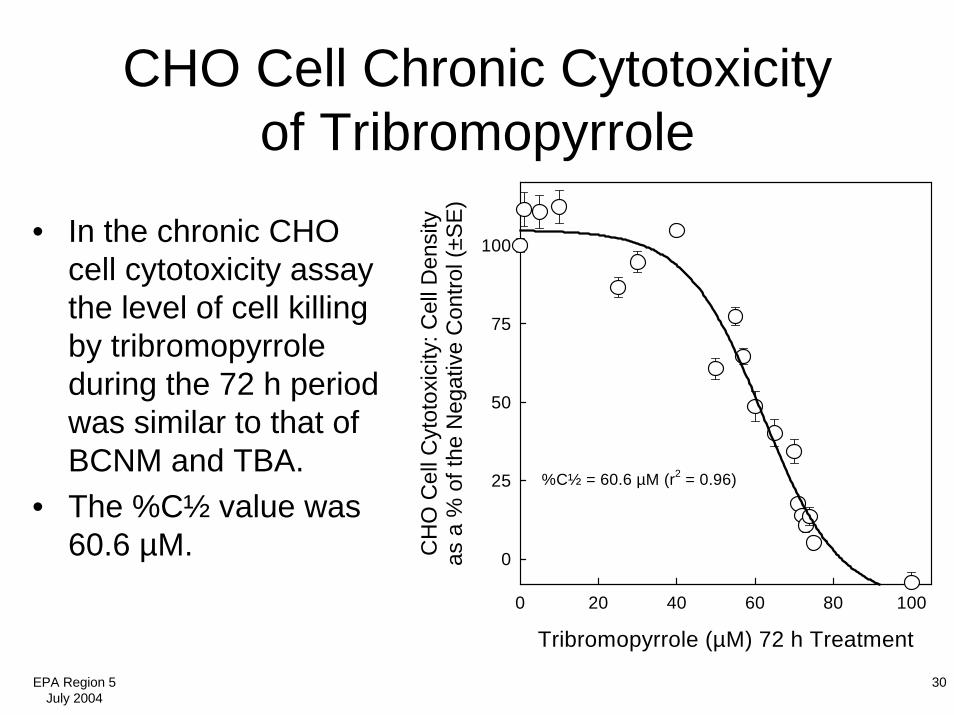
CHO Cell Chronic Cytotoxicity of Tribromopyrrole
Tribromopyrrole (µM) 72 h Treatment
0 20 40 60 80 100
CH
O C
ell C
ytot
oxic
ity: C
ell D
ensi
tyas
a %
of t
he N
egat
ive
Con
trol (
±SE
)
0
25
50
75
100
%C½ = 60.6 µM (r2 = 0.96)
• In the chronic CHO cell cytotoxicity assay the level of cell killing by tribromopyrroleduring the 72 h period was similar to that of BCNM and TBA.
• The %C½ value was 60.6 µM.
EPA Region 5July 2004
31
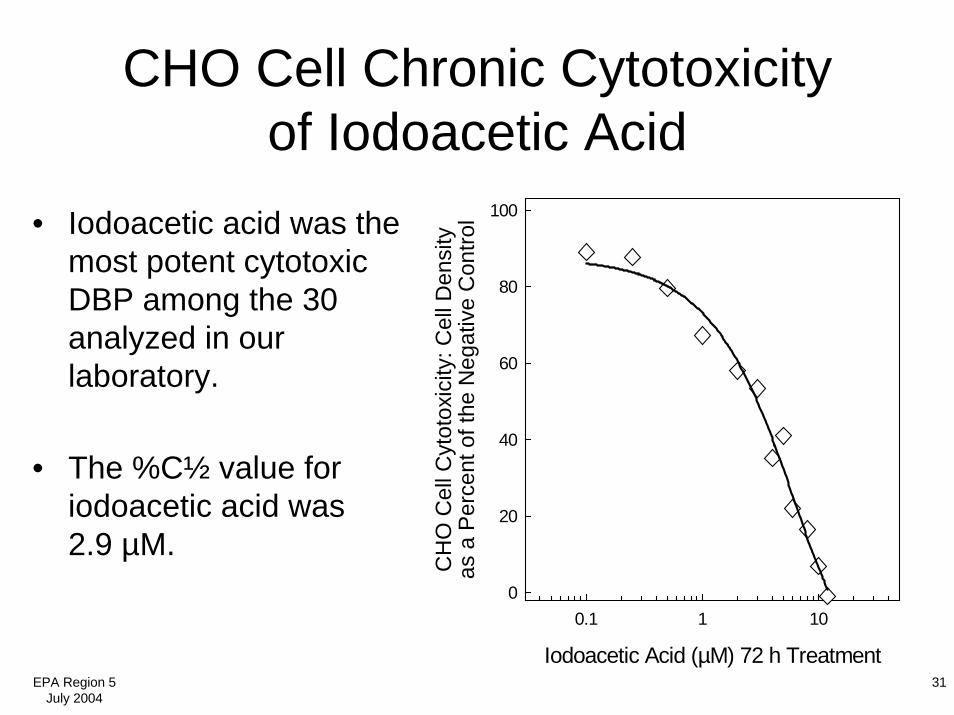
CHO Cell Chronic Cytotoxicity of Iodoacetic Acid
Iodoacetic Acid (µM) 72 h Treatment
0.1 1 10
CH
O C
ell C
ytot
oxic
ity: C
ell D
ensi
tyas
a P
erce
nt o
f the
Neg
ativ
e C
ontro
l
0
20
40
60
80
100• Iodoacetic acid was the most potent cytotoxic DBP among the 30 analyzed in our laboratory.
• The %C½ value for iodoacetic acid was 2.9 µM.
EPA Region 5July 2004
32
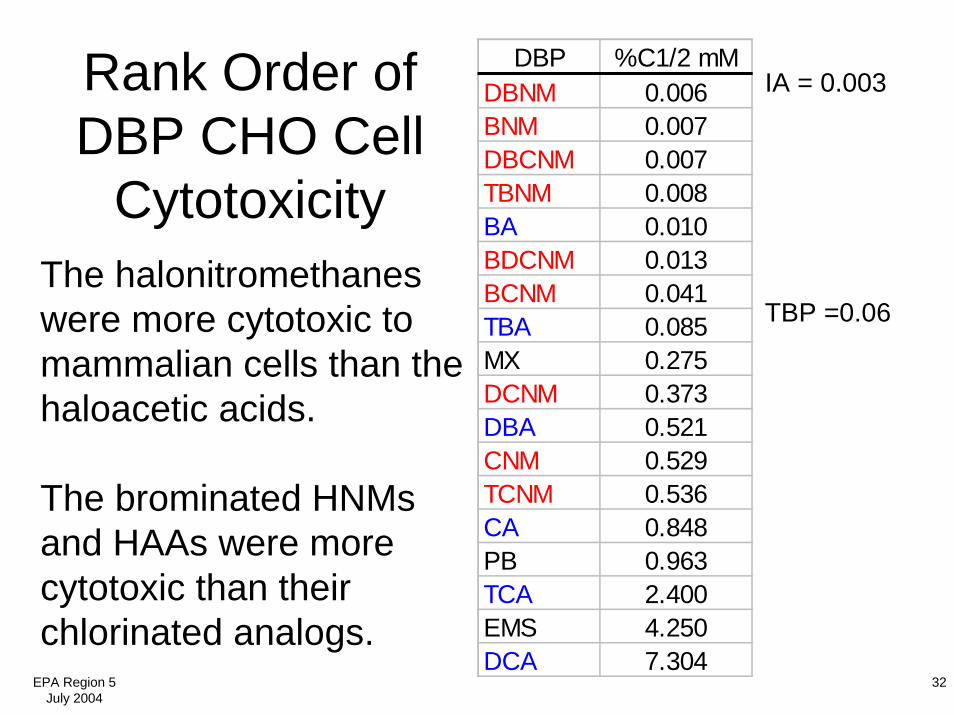
Rank Order of DBP CHO Cell
Cytotoxicity
DBP %C1/2 mMDBNM 0.006BNM 0.007DBCNM 0.007TBNM 0.008BA 0.010BDCNM 0.013BCNM 0.041TBA 0.085MX 0.275DCNM 0.373DBA 0.521CNM 0.529TCNM 0.536CA 0.848PB 0.963TCA 2.400EMS 4.250DCA 7.304
IA = 0.003
The halonitromethaneswere more cytotoxic to mammalian cells than the haloacetic acids.
The brominated HNMsand HAAs were more cytotoxic than their chlorinated analogs.
TBP =0.06
EPA Region 5July 2004
33
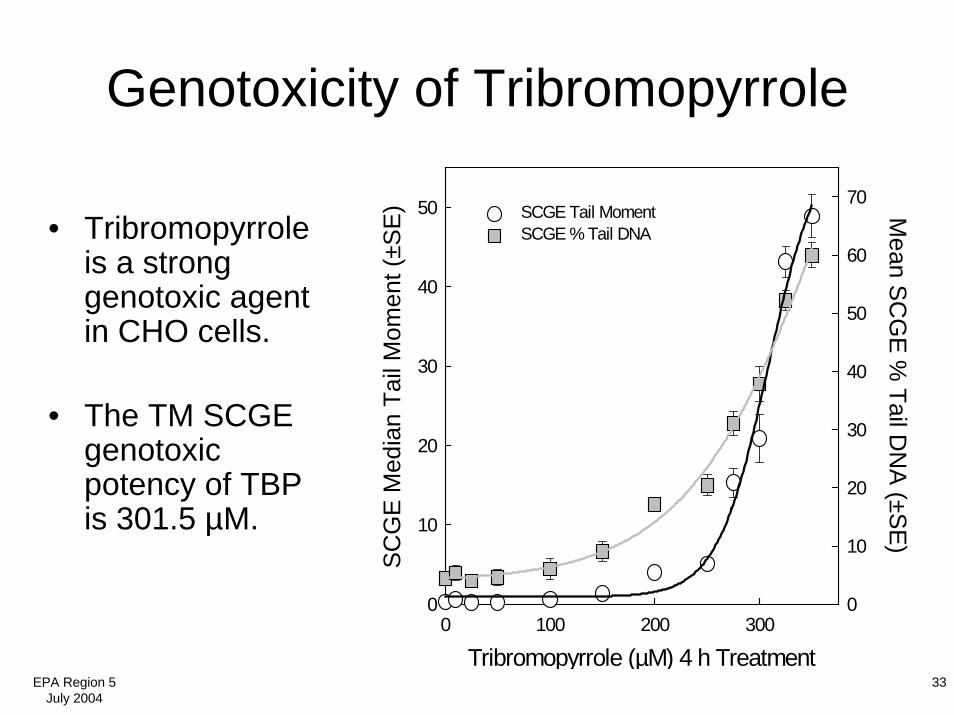
Genotoxicity of Tribromopyrrole
Tribromopyrrole (µM) 4 h Treatment0 100 200 300
SC
GE
Med
ian
Tail
Mom
ent (
±SE)
0
10
20
30
40
50 Mean S
CG
E %
Tail DN
A (±S
E)
0
10
20
30
40
50
60
70SCGE Tail MomentSCGE % Tail DNA• Tribromopyrrole
is a strong genotoxic agent in CHO cells.
• The TM SCGE genotoxic potency of TBP is 301.5 µM.

EPA Region 5July 2004
34
Genotoxicity of Iodoacetic Acid
Iodoacetic Acid (µM)
0 5 10 15 20
Aver
age
Med
ian
Tail
Mom
ent (
±SE)
0
10
20
30
40
50
60
Average SCG
E % Tail D
NA (±SE)
0
10
20
30
40
50
60
70
• Iodoacetic acid is the most potent genotoxic DBP (of 22) that we analyzed in CHO cells.
• The TM SCGE genotoxic potency of iodoacetic acid is 7.9 µM.
EPA Region 5July 2004
35
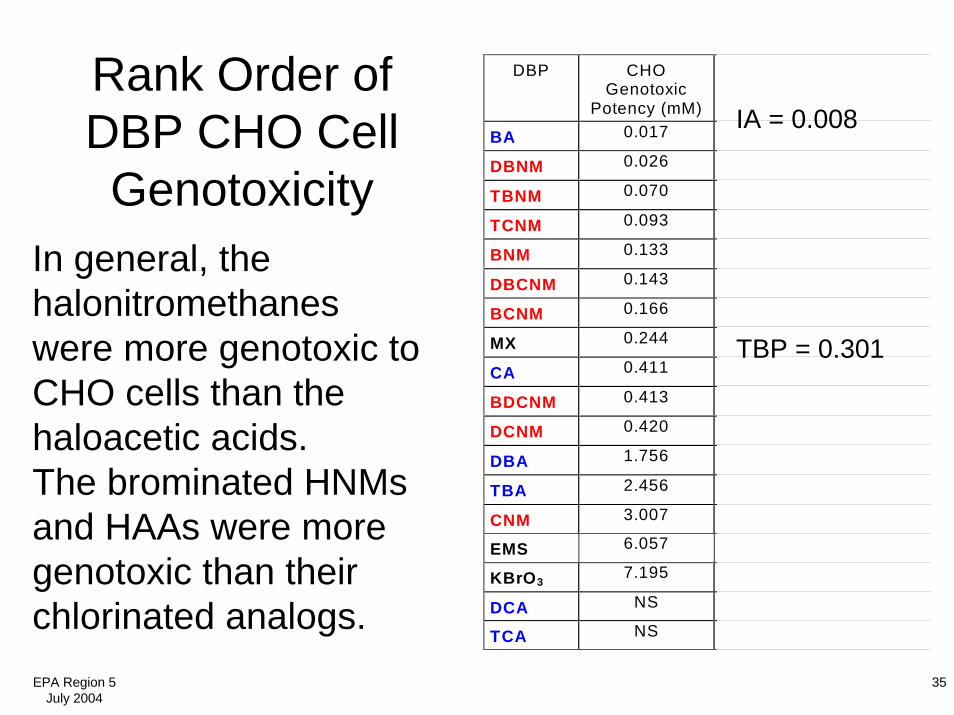
Rank Order of DBP CHO Cell Genotoxicity
DBP CHOGenotoxic
Potency (mM)
BA 0.017
DBNM 0.026
TBNM 0.070
TCNM 0.093
BNM 0.133
DBCNM 0.143
BCNM 0.166
MX 0.244
CA 0.411
BDCNM 0.413
DCNM 0.420
DBA 1.756
TBA 2.456
CNM 3.007
EMS 6.057
KBrO37.195
DCA NS
TCA NS
IA = 0.008
In general, the halonitromethaneswere more genotoxic to CHO cells than the haloacetic acids.The brominated HNMsand HAAs were more genotoxic than their chlorinated analogs.
TBP = 0.301
EPA Region 5July 2004
36
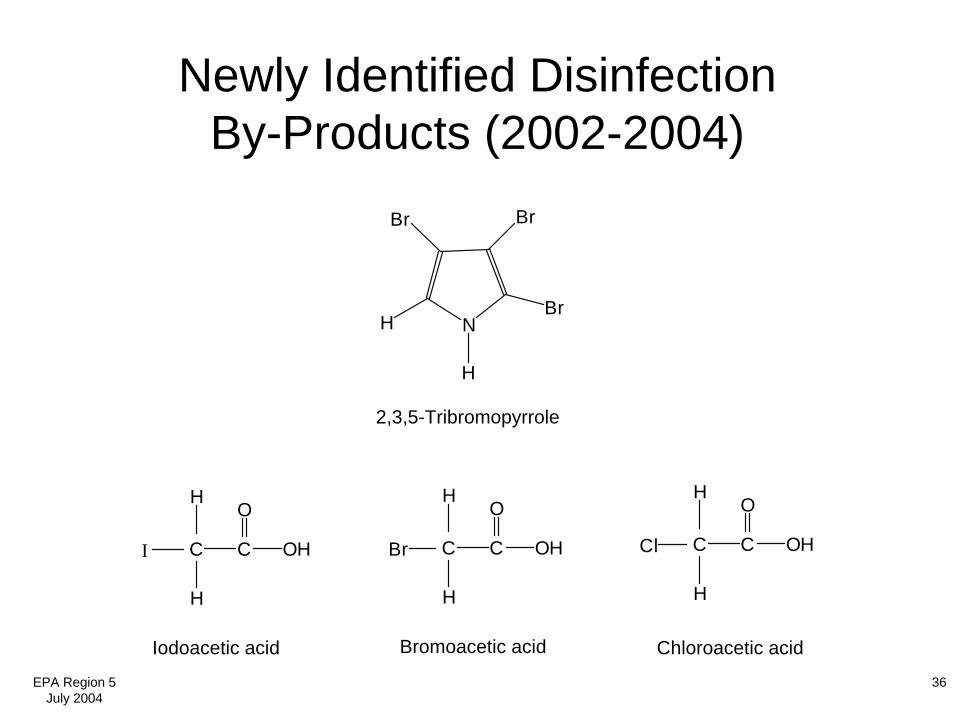
Newly Identified DisinfectionBy-Products (2002-2004)
N
BrBr
HBr
H
2,3,5-Tribromopyrrole
C C
O
OH
H
I
H H
Cl
H
OH
O
C C
H
Br
H
OH
O
C C
Iodoacetic acid Bromoacetic acid Chloroacetic acid
EPA Region 5July 2004
37
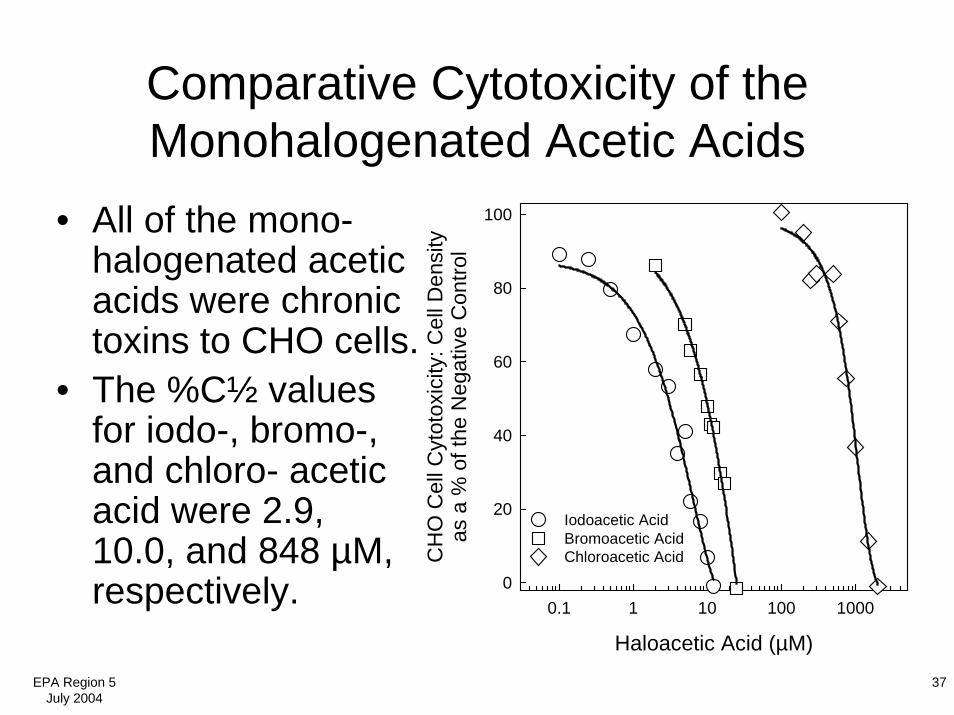
Comparative Cytotoxicity of the Monohalogenated Acetic Acids
• All of the mono-halogenated acetic acids were chronic toxins to CHO cells.
• The %C½ values for iodo-, bromo-, and chloro- acetic acid were 2.9, 10.0, and 848 µM, respectively.
Haloacetic Acid (µM)
0.1 1 10 100 1000
CH
O C
ell C
ytot
oxic
ity: C
ell D
ensi
tyas
a %
of t
he N
egat
ive
Con
trol
0
20
40
60
80
100
Iodoacetic AcidBromoacetic AcidChloroacetic Acid
EPA Region 5July 2004
38
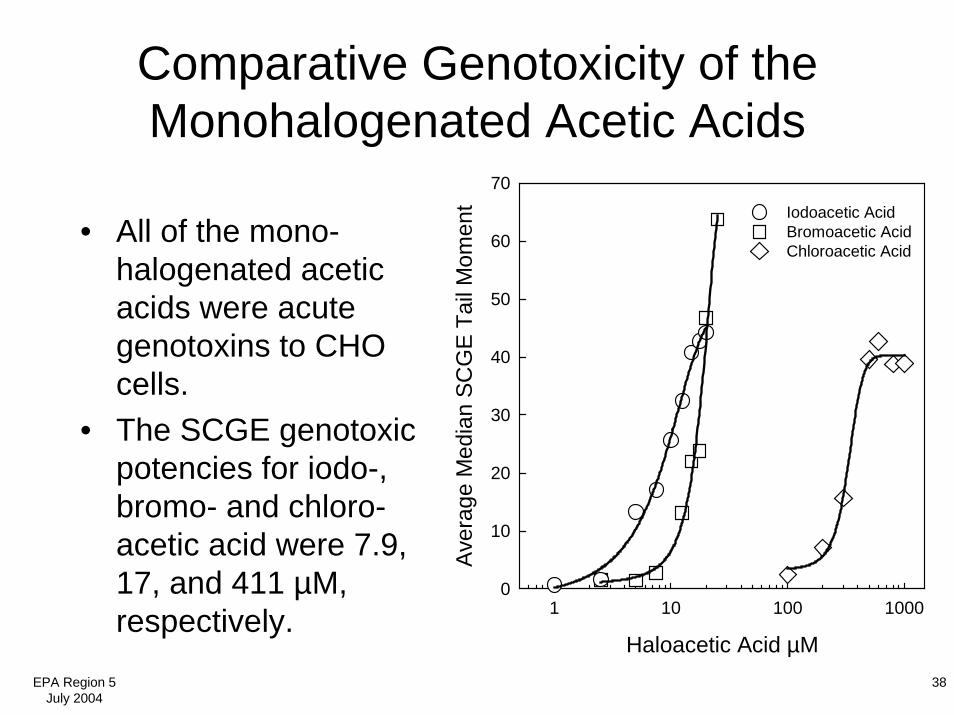
Comparative Genotoxicity of the Monohalogenated Acetic Acids
Haloacetic Acid µM
1 10 100 1000
Aver
age
Med
ian
SCG
E Ta
il M
omen
t
0
10
20
30
40
50
60
70Iodoacetic AcidBromoacetic AcidChloroacetic Acid
• All of the mono-halogenated acetic acids were acute genotoxins to CHO cells.
• The SCGE genotoxic potencies for iodo-, bromo- and chloro-acetic acid were 7.9, 17, and 411 µM, respectively.
EPA Region 5July 2004
39
DBP-Induced Mammalian Cell Genotoxicity: Summary
• The mammalian cell microplate SCGE method allows for the quantitative genotoxic analysis of small amounts of test agent.
• In general the HNMs are more genotoxic than HAAs.• The genotoxic potency for both the HNMs and HAAs
is highest for the brominated analogs, followed by the bromo-chloro analogs, and then the chlorinated analogs.
• New DBPs, such as tribromopyrrole and iodoaceticacid, can be rapidly analyzed for their cytotoxic and genotoxic activity in mammalian cells.
EPA Region 5July 2004
40
Mechanisms of Haloacetic Acid Genotoxicity
• No DNA adducts have been identified.• Haloacetic acids (HAAs) induce mutation
in Salmonella and mammalian cells.• HAAs are good inducers of DNA strand
breaks in mammalian cells.• In rodent cancer studies HAAs caused
peroxisome proliferation and may induce oxidative stress.
EPA Region 5July 2004
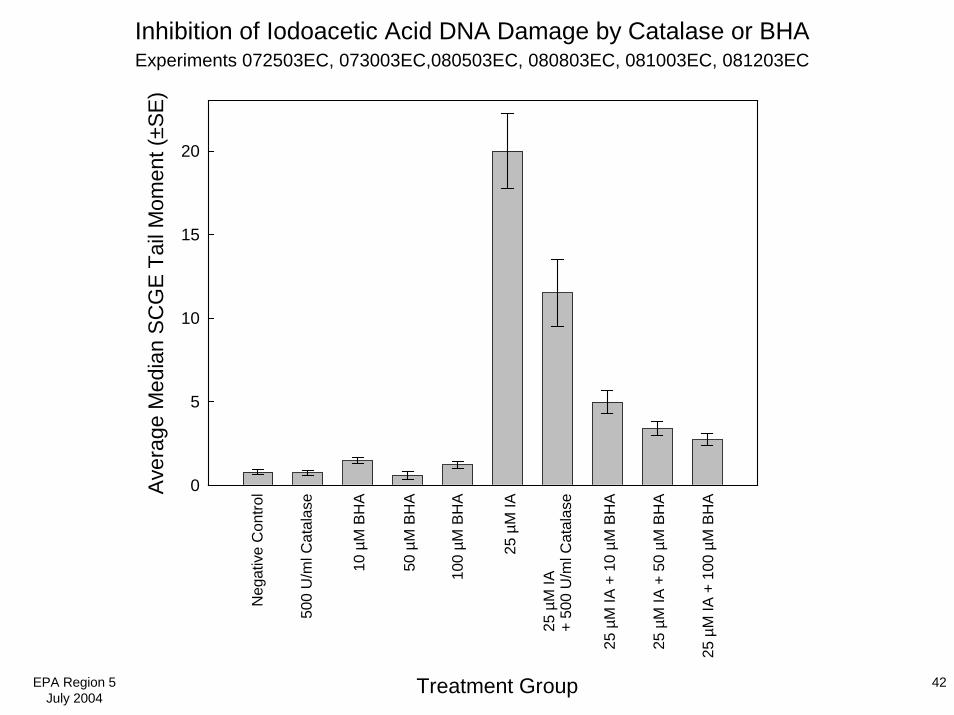
41
Effect of Catalase or BHA on Modulating Iodoacetic Acid Genotoxicity
• Catalase is an enzyme that specifically degrades H2O2.
• Butylated hydroxyanisole is a potent radical scavenger.
• We treated CHO cells with iodoaceticacid and catalase or BHA and determined SCGE DNA damage.
EPA Region 5July 2004
42
Aver
age
Med
ian
SCG
E Ta
il M
omen
t (±S
E)
0
5
10
15
20
Treatment Group
Neg
ativ
e C
ontro
l
500
U/m
l Cat
alas
e
10 µ
M B
HA
50 µ
M B
HA
100
µM B
HA
25 µ
M IA
25 µ
M IA
+
500
U/m
l Cat
alas
e
25 µ
M IA
+ 1
0 µM
BH
A
25 µ
M IA
+ 5
0 µM
BH
A
25 µ
M IA
+ 1
00 µ
M B
HA
Inhibition of Iodoacetic Acid DNA Damage by Catalase or BHAExperiments 072503EC, 073003EC,080503EC, 080803EC, 081003EC, 081203EC
EPA Region 5July 2004
43
Take-Home Message
• Chemical disinfection of water reduced the incidence of waterborne diseases.
• Disinfection unfortunately generates a large number of halogenated DBPs.
• Epidemiological studies have linked consumption of water containing DBPswith enhanced risks of spontaneous abortion, birth defects and cancer.

EPA Region 5July 2004
44
Take-Home Message• The vast majority of DBPs that comprise
TOX have not been chemically or biologically characterized.
• The U.S. EPA has a high priority to identify DBPs and determine their toxicity.
• We demonstrated that CHO cell microplate cytotoxicity and SCGE assays were sensitive and accurate when working with small amounts of DBPs.
EPA Region 5July 2004
45
Take-Home Message• The halonitromethanes (HNM) were both more
cytotoxic and genotoxic as compared to the haloacetic acids.
• The brominated and iodinated HAAs and HNMswere more cytotoxic and genotoxic than their chlorinated analogs.
• HAAs induce their genotoxic damage via an oxidative stress mechanism.
• The goal is to engineer drinking water disinfection technologies that generate the lowest levels of highly toxic DBPs. Our work is a step in this direction.
EPA Region 5July 2004
46
This research was funded in part by AWWARF grant 554,U.S. EPA grants R825966, R83069501, and NSF grant INT97-26617