malta congenital anomalies registry - … congenital anomalies registry report - 1993 -1997 _____ 6...
TRANSCRIPT

Department of Health Information
______________________________________________________________________________1
_____________________________________________________________________________________
MALTA CONGENITALANOMALIES REGISTRY
CONGENITAL ANOMALIES REPORT-1993 TO 1997
Compiled by: Dr. Miriam Gatt
August 2000
© Department of Health InformationISBN: 99932-609-0-8

Malta Congenital Anomalies Registry Report - 1993 -1997
______________________________________________________________________________2
__________________________________________________________________________________________________________________

Department of Health Information
______________________________________________________________________________3
_____________________________________________________________________________________
ACKNOWLEDGEMENTS
The data in this report come from several sources and its compilation would not have been possible withoutthe co-operation of all departments and sections involved and the hard working staff at the Department ofHealth Information.
Acknowledgements go to all doctors and paramedics who notify cases of congenital anomalies, to St.Luke’s and Gozo General Hospitals and the various sections which provide access to their records namelythe Maternity and Paediatric wards, Cardiac Lab, Genetics clinic, St. Luke’s Hospital Activity AnalysisDatabase and National Obstetric Information Systems Database. Thanks go to the maternity sections ofthe private hospitals: Capua Palace, St. James’and St. Philip’s Hospitals which report any baby born withcongenital anomaly. Thanks also go to Prof Alfred Cuschieri for his expertise and advice.
Special thanks go to the staff of the Malta Congenital Anomalies Registry: Ms. Vivienne Parnis and Ms.Josephine Farrugia, Dr. Joe Pace the guru in software and technical support, Dr. Victor Grech for hishelpful hints and all the staff of the Department of Health Information for their support, especially Dr.Hugo Agius Muscat.
Dr. Miriam GattPrincipal Medical OfficerMalta Congenital Anomalies Registry

Malta Congenital Anomalies Registry Report - 1993 -1997
______________________________________________________________________________4
__________________________________________________________________________________________________________________

Department of Health Information
______________________________________________________________________________5
_____________________________________________________________________________________
TABLE OF CONTENTSError! Bookmark not defined.
LIST OF TABLES
LIST OF FIGURES
INTRODUCTIONPART ONE - DEFINITIONS AND METHODS
The study populationAscertainment methodsDefinitions and exclusionsCase informationCoding of congenital anomaliesCalculation of prevalence rates and statistical methods
PART TWO - SUMMARY ANALYSISPART THREE - TABLESA - ANALYSIS OF INFANTS WITH ANOMALIES
Livebirths and fetal deathsDistribution of Infants/fetuses with congenital anomaly according toDistribution of infants/fetuses with congenital anomalies by
Time of diagnosisSource of informationGenderMaternal ageMonth of birthGeographical distribution
B - ANALYSIS OF ANOMALIES
PART FOUR - SPECIFIC ANOMALY GROUPSNeural tube defects (NTD)Cleft lip with or without cleft palateCleft PalateCongenital heart diseaseAnomalies of the digestive system
TABLE OF CONTENTS

Malta Congenital Anomalies Registry Report - 1993 -1997
______________________________________________________________________________6
__________________________________________________________________________________________________________________
Table 1 - Gender distribution of babies registered as having an anomaTable 2 - Average maternal ages for all deliveries and deliveries of ba
(1993-97)Table 3 - Distribution of babies/fetuses with major anomalies registere
according to the group/system(s) affectedTable 4 - Distribution of livebirths and stillbirths in all babies and in b
Maltese Islands from 1993-1997.Table 5 - Proportion of fetal deaths with a congenital anomaly recorde
deathTable 6 - Proportion of babies dying with a congenital anomaly record
death from livebirth to 1 week of ageTable 7 - Proportion of babies dying with a congenital anomaly record
death after 1 week to 1 year of ageTable 8 - Number of registered children according to diagnostic categ
anomalies and per year of birthTable 9 - Distribution of babies according to time of diagnosisTable 10 - Distribution of babies registered with anomaly by first sourcTable 11 - Distribution of babies with anomaly (livebirths and fetal deaTable 12 - Distribution of all babies with congenital anomalies accordinTable 13 - Distribution of babies with non chromosomal defects accordTable 14 - Distribution of babies with chromosomal defects according Table 15 - Distribution of babies registered with congenital anomalies aTable 16 - Distribution of babies with congenital anomaly according to
birthTable 17 - All anomalies registered in Malta from 1993-1997 (as at DeTable 18 -Comparison of prevalence rates of congenital anomalies in to
(1993-97), EUROCAT Registries (1990-94).Table 19 - Distribution of NTD according to locality of residence of moTable 20 - Time trend of total prevalence of NTDs Malta and EUROCATable 21 - Distribution of Cleft lip with or without cleft palate accordin
motherTable 22 - Time trend of total prevalence of cleft lip Malta and EUROCTable 23 - Distribution of Cleft Palate according to locality of residenc
LIST OF TABLES

Department of Health Information
______________________________________________________________________________7
_____________________________________________________________________________________
Table 37 - Distribution of Limb reduction defects according to locality Table 38 - Time trend of total prevalence of limb reduction defects: Ma
comparedTable 39 - Distribution of polydactyly according to locality of residencTable 40 - Time trend of total prevalence of polydactyly: Malta and EUTable 41 - Distribution of syndactyly according to locality of residenceTable 42 - Time trend of total prevalence of syndactyly: Malta and EURTable 43 - Distribution of diaphragmatic hernia according to locality ofTable 44 - Time trend of total prevalence of diaphragmatic hernia: Mal
comparedTable 45 - Distribution of maternal ages for babies with Down syndromTable 46 - Distribution of Down syndrome according to locality of resiTable 47 - Time trend of total prevalence of Down syndrome all ages M
comparedTable 48 - Prevalence of Down syndrome in Malta with maternal age uTable 49 - Time trend of prevalence of Down syndrome with maternal
EUROCAT average comparedTable 50 - Prevalence of Down syndrome in Malta with maternal age 3Table 51 - Time trend of prevalence of Down syndrome with maternal
and EUROCAT average compared
LIST OF TABLES (contd.)

Malta Congenital Anomalies Registry Report - 1993 -1997
______________________________________________________________________________8
__________________________________________________________________________________________________________________
Figure 1 - Data collection and management by the Malta Congenital AFigure 2 - Distribution of babies according to number of major congenFigure 3 - Time of diagnosis of babies with major congenital anomalieFigure 4 - Main sources of information for babies diagnosed with conFigure 5 - Differences in variation of maternal age groups for all anom
chromosomal anomalies and chromosomal defects (1993-9Figure 6 - Monthly distribution of babies registered with congenital anFigure 7 - Geographical distribution of all babies registered with cong
Gozo from 1993-1997. Prevalence rates given per 1,000 toFigure 8 - Distribution (%) of anomalies registered in Malta from 199
group/system affected (Data source: Table 3).Figure 9 - Distribution of babies registered with congenital anomalies
anomalies (1993-1997)Figure 10 - Geographical distribution of NTD (1993-97)Figure 11 - Prevalence of NTD over time Malta and EUROCAT AveraFigure 12 - Geographical distribution of Cleft lip with or without cleft pFigure 13 - Prevalence of cleft lip with or without cleft palate over time
AverageFigure 14 - Geographical distribution of Cleft Palate (1993-97)Figure 15 - Prevalence of cleft palate over time Malta and EUROCAT Figure 16 - Geographical distribution of congenital heart disease (1993Figure 17 - Prevalence of Congenital heart disease over time Malta andFigure 18 - Geographical distribution of defects of the digestive systemFigure 19 - Prevalence of defects of the digestive system over time MaFigure 20 - Geographical distribution of pyloric stenosis (1993-97)Figure 21 - Prevalence of defects of pyloric stenosis over time Malta anFigure 22 - Geographical distribution of anorectal atresia and stenosis (Figure 23 - Prevalence of defects of anorectal atresia and stenosis over
AverageFigure 24 - Geographical distribution of defects of the internal urogenitFigure 25 - Prevalence of defects of the internal urogenital system over
AverageFigure 26 - Geographical distribution of cystic kidney disease (1993-97
LIST OF FIGURES

Department of Health Information
______________________________________________________________________________9
_____________________________________________________________________________________

Malta Congenital Anomalies Registry Report - 1993 -1997
______________________________________________________________________________10
__________________________________________________________________________________________________________________

Department of Health Information
______________________________________________________________________________11
_____________________________________________________________________________________
INTRODUCTION
MALTA CONGENITAL ANOMALIES REGISTER
This is the first in a series of regular reports on congenital anomalies to be issued by the Malta CongenitalAnomalies Registry. The register of congenital anomalies was first started in 1983 with data being collectedfrom St. Luke’s Hospital as part of a research project funded by the University of Malta. In 1997, therunning of the register was assumed by the Department of Health Information and a computerised databasewas developed with computerised data being backdated to 1993. The register presently collects data from allhospitals on the Maltese Islands and utilises multiple sources of information including information from ma-ternity wards at SLH, Doctors notifications, National Obstetric Information Systems database, Cardiac lab.records, Hospital Activity Analysis database, information from the genetics clinic and others.
The aims of the Malta register are:� to collect data about all fetal deaths and infants with a diagnosis of congenital anomalies on the islands of
Malta and Gozo;� to detect any changes in occurrence of congenital anomalies;� to keep a register of all cases of congenital anomalies diagnosed until one year of age;� to provide data which may be required for epidemiological studies;� to issue regular reports and provide physicians and the general public with information they may need,
always respecting strict confidentiality.
The Malta Congenital Anomalies Registry issues regular six-monthly reports which are widely distributed to allmedical practitioners, interested departments and organisations. The aim of these reports is not only to providestatistical information but also to discuss particular topics of interest in the field of congenital anomalies.
The registry also compiles ad hoc Department of Health Information (DHI) Fact Sheets, participates inconferences and responds to specific requests related to congenital anomalies made by parliament, inter-ested individuals, organisations or students.
The Malta Congenital Anomalies Register also has a web site address at:http://www.magnet.mt/services/health/mcar1..
International relationships:
European Registration of Congenital Anomalies (EUROCAT)The Malta Congenital Anomalies Register is a full member of the EUROCAT programme (http://www.lshtm.ac.uk/php/eeu/eurocat/eurocat.htm), regularly transmitting anonymised data to this programme.
The EUROCAT project is a programme supported by the European Union, represented by the Commissionof the European Community for the epidemiologic surveillance of congenital anomalies in Europe. The mainobjectives are to detect and investigate trends in the frequency of congenital anomalies that could be due toenvironmental teratogens or mutagens and to evaluate the effectiveness and efficiency of neonatal andperinatal health services.
As congenital anomalies have a relatively low prevalence and good quality exhaustive data is expensive anddifficult to collect, a standard European system allows countries using data from regional registries to pooltheir data for studies and to exploit their differences by comparing them. All registries considered as fullmembers of EUROCAT follow standardised guidelines as defined by the programme. EUROCAT followsthe general principles set out by the Assembly of the European Science Foundation (1980 and 1985) con-cerning the protection of privacy and use of personal data for research1.

Malta Congenital Anomalies Registry Report - 1993 -1997
______________________________________________________________________________12
__________________________________________________________________________________________________________________
The EUROCAT programme started as a concerted action in 1979. Until 1991, EUROCAT was funded bythe EC-DG XII (Directorate General for Science, Research and Development Joint Research Centre, Medi-cal Research Division) and from 1991 to 1998 by the EC-DG V (Directorate General for the Employment,Industrial Relations and Social Affairs, Health and Safety Directorate). Since then local registries and theScientific Institute of Public Health have been participating in the management of EUROCAT. Surveillanceis based on a network of regional registries co-ordinated by a Central Registry which, as from January 2000,is situated in the Environmental Epidemiology Unit, Department of Public Health and Policy, London Schoolof Hygiene and Tropical Medicine in London, UK. Presently there are over 40 regional registries in Europeparticipating in EUROCAT, either as full or associate members.
The specific objectives of the EUROCAT registration are:� to provide baseline epidemiologic information on congenital anomalies in Europe;� to detect and investigate trends in the frequency of congenital anomalies in order to assess the impact of
known or suspected risk factors particularly related to exogenic agents, as drugs and the environment,including occupational exposure;
� to evaluate the effectiveness and efficiency of health services (primary prevention, PND and termina-tion of pregnancy, treatment);
� to provide a well documented data base for aetiologic and clinical research;� to act as information centre which could respond to specific needs, such as the assessment of the impact
of environmental accidents or change, or the suspicion of teratogenic influences from food, drugs, orother exposures.
International Clearinghouse of Birth Defects Monitoring Systems (ICBDMS)The Malta Congenital Anomalies Register is presently applying for associate membership to the ICBDMS;this application is to be approved in September 2000.
The ICBDMS (http://www.icbd.org/index.html) is a non-governmental organization in official relations withthe World Health Organization representing more than 30 malformation monitoring programs worldwide.Member programs are actively engaged in the systematic collection and analysis of data for the comprehen-sive monitoring of congenital malformations.
The organization was established in 1974, at a meeting in Helsinki, Finland, where representatives of malfor-mation monitoring systems in ten countries were present. The mission of the Clearinghouse is to help identifyand to prevent birth defects and the spread of an epidemic of congenital malformations by serving as an earlywarning system. To accomplish this the Clearinghouse has three main objectives:� exchange of routine information in the prevalence of congenital malformations;� collaborative epidemiologic research;� expert consultation and assistance for existing monitoring systems to investigate outbreaks and to
establish new monitoring systems.
World Health Organisation (WHO)Aggregated data from the Malta Congenital Anomalies Register is regularly sent to WHO regarding specificanomalies for inclusion in their datasets.

Department of Health Information
______________________________________________________________________________13
_____________________________________________________________________________________
Projects
The Malta Congenital Anomalies Registry is currently involved in two international studies being co-ordinatedby the ICBDMS. These are:
Prevention strategies based on periconceptional folic acid supplementationThis project is being funded by a grant from the CDC (Centres for Disease Control) and is being co-ordinated by the International Clearinghouse for Birth Defects.The objectives of this International study are to systematically collect and analyze data from countries world-wide in order to:1) describe and compare public health policies regarding the use of folic acid or multivitamin supplements forthe primary prevention of neural tube defects and other birth defects, and to investigate the reasons whydifferent countries, working from the same published data, adopted different policies (or none);2) evaluate to what extent current public health policies are being implemented and explore the factorsinvolved in the compliance and acceptance of such policies;3) compare the prevalence of selected birth defects possibly preventable by folic acid supplementation suchas neural tube defects, oral clefts, cardiac defects, and limb deficiencies, before and after initiation of folateprevention strategies, and to determine whether different strategies are associated with variations in theprevalence of these defects.
International study of sex ratio of malformed infantsCongenital malformations have still not been extensively studied with regard to the sex distribution. Thepurpose of this study is to measure the sex ratio of major malformations by registry and by year and tocompute the sex ratio for these malformations.
Because the shifts in sex ratio, at least in the general population, are relatively slight, large numbers areneeded in order to reach statistically valid results. The Clearinghouse offers the opportunity of a largesample size, allowing the study of sex ratio for specific malformations.
Progress regarding the above two studies will be reported in the six-monthly reports issued by the registry.

Malta Congenital Anomalies Registry Report - 1993 -1997
______________________________________________________________________________14
__________________________________________________________________________________________________________________

Department of Health Information
______________________________________________________________________________15
_____________________________________________________________________________________
PART ONE -
DEFINITIONS AND METHODS

Malta Congenital Anomalies Registry Report - 1993 -1997
______________________________________________________________________________16
__________________________________________________________________________________________________________________

Department of Health Information
______________________________________________________________________________17
_____________________________________________________________________________________
THE STUDY POPULATIONThe Malta Congenital Anomalies Register is population based and covers all births on the islands of Maltaand Gozo which amount to just under 5000 births per year. All infants, until one year of age, who arediagnosed or suspected of having a congenital anomaly until one year of age are included.
The small size and population of the islands (Area: 316 km2, Population: 376,513 in 1997); the geographicallywell defined boundaries, absence of significant ethnic minority groups and illegality of termination of preg-nancy make the islands ideal for epidemiological studies.
This report covers all births diagnosed with congenital anomaly from 1993 to 1997 and registered at theRegistry by December, 1999. Denominator data of total livebirths and stillbirths were obtained from therelevant Demographic Review of the Maltese Islands2.
ASCERTAINMENT METHODS
To ensure as complete an ascertainment as possible, the Malta Congenital Anomalies Register makes use ofactive case finding and multiple sources of information. Cases of congenital anomalies diagnosed in the firstfew days of life in babies born at St. Luke’s Hospital are recorded by staff from the registry who visit thepostnatal wards daily. Gozo General Hospital and private hospitals (St. Philip’s Hospital, Capua PalaceHospital and St. James’ Hospital) notify any cases of congenital anomalies using a standardised report form(Annex 1). All paediatricians, paediatric surgeons and other medical doctors are encouraged to report anyinfants with congenital anomalies under their care to the registry. Other sources of information used in thisreport include: Echocardiography Lab., Genetics Clinic, St. Luke’s Hospital Maternity Systems Database, St.Luke’s Hospital Activity Analysis Register, National Mortality Register, Pathology Autopsy reports, Con-genital Heart Defects Register, National Cancer Register and the Hypothyroid screening programme. Theprocess of data collection and management is outlined in Figure 1.
Every effort is made to record all cases of congenital anomalies. However it is extremely difficult, if notimpossible, for any registration system to claim complete case ascertainment or complete accuracy of infor-mation. First of all, neither ascertainment nor accuracy are absolute in a world of changing diagnosticmethods and diagnostic definitions. Furthermore, depending on the malformation, some cases may escapethe system.
Ascertainment of livebirths and fetal deathsLivebirths with congenital anomalies are not always diagnosed at birth or in the early neonatal period, particu-larly certain cardiac anomalies, internal urogenital system anomalies, central nervous system anomalies, eyeanomalies (cataract) and pyloric stenosis for example. For this reason all anomalies diagnosed until one yearof age are included in the register, this is inkeeping with EUROCAT guidelines.
Fetal deaths include all registered malformed cases of spontaneous fetal deaths or stillbirths of 20 weeksgestational age or more.

Malta C
ongenital Anom
alies Registry R
eport - 1993 -1997
______________________________________________________________________________1
8
__________________________________________________________________________________________________________________Figure 1 - Data collection and management by the Malta Congenital Anomalies Registry (1993-97)
INPUT PROCESSING OUTPUT
Cardiac Laboratory
SLH wards: Labour/Postnatal/ SCBU
Notifications fromdoctors / hospitals
Mortality Register/Autopsy reports
Genetics clinic
National Cancer Register
SLH MaternitySystems Register
SLH Hospital ActivityAnalysis database
Hypothyroid screening
DEPTARTMENT OFHEALTHINFORMATION
- Identification of infantand maternal hospital files(if seen at St. Luke’s orGozo General hospitals).
- Retrieval of files tocomplete the EUROCATReport Form when detailsare not complete orverification is required.
- Coding of anomalies.
- Registering of infantswith anomalies and dataentry.
- Validation of data entry.
Reports:Six monthlyAnnualAd hoc reports / Fact sheets
Answering of parliamentaryquestions
Annual transmission of anonymiseddata to EUROCAT Central Registry
Internet home page:http://www.magnet.mt/services/health/mcar1.htm
Individual requests:DoctorsStudentsAssociations / GroupsMediaInterested Individuals

Department of Health Information
______________________________________________________________________________19
_____________________________________________________________________________________DEFINITIONS AND EXCLUSIONSIn this report the term ‘congenital anomalies’ refers to structural defects (congenital malformations,deformations, disruptions and dysplasias), chromosomal abnormalities, inborn errors of metabolism andhereditary diseases. This is the definition given by EUROCAT guidelines for the registration of congeni-tal anomalies.
Minor congenital anomalies are not normally included in congenital anomalies registers as they wouldmarkedly swell the incidence figures and dilute the significance of major anomalies. The precise line ofdemarcation between anomalies to be included and those to be excluded is not clear cut and may beinfluenced by subjective differences in interpretation. Minor anomalies do not in themselves have seri-ous medical or cosmetic consequences for the child. Some may nevertheless be of certain significance,since they can be predictive of major underlying pathologies. There is increasing awareness of dysmorphicsyndromes which present great diagnostic difficulties, not only in their precise identification, but also intheir recognition which may be delayed for many months before they are detected.
EUROCAT applies a standard list of minor and commonly occurring anomalies for exclusion; this list isgiven in Annex 2. These conditions are not registered unless occurring in combination with other majoranomalies.
It is necessary to exercise great care and attention to detail in distinguishing some of the anomalies listedfor exclusion from those which are to be registered. Thus glandular and coronal hypospadias areexcluded wheras penile and perineo-scrotal hypospadias are to be registered. Similarly, structural tal-ipes has to be distinguished from postural talipes which is excluded. Birthmarks are registered as skinanomalies only when they exceed an area of 4cm2.
Minor anomalies such as single palmar crease, low set or dysmorphic ears, slanting palpebral fissures, higharched palate, micrognathia, and other dysmorphic features of the face and lips are not included in the registerunless associated with other major defects. These anomalies are often difficult to define accurately andinterpretation may be highly subjective especially for those who are not experienced in dysmorphology;nevertheless they are highly significant in syndrome identification. Also excluded from the register arehernias, varicocele, undescended testes, spina bifida occulta and pre-auricular pits or tags.
CASE INFORMATIONFor each baby with an anomaly, information about the child, the diagnosis, the pregnancy, the parents,their occupation and risk factors (assisted conception, illness before pregnancy, habitual and unusualexposures, drugs), diagnosis of malformations, and family history is recorded. Annex 4 shows thedetails recorded on the EUROCAT Report Form. Case records are updated when necessary (e.g.diagnosis of later discovered anomalies, change or precision in diagnosis, knowledge of an additional riskfactor).
CODING OF CONGENITAL ANOMALIESThe Malta Congenital Anomalies Register codes anomalies using a six-digit EUROCAT code, which isa compatible expansion of the coding system of the British Paediatric Association Classification ofdiseases (BPA-9)1 . The BPA-9 is itself a five-digit extension of the 9th revision of the InternationalClassification of Diseases. Since 1998, anomalies have been coded using the Royal College of Paediat-rics and Child Health (RCPCH) Classification of Diseases which is a paediatric adaptation of ICD-10(International Classification of Diseases - 10th Edition).
Each anomaly is precisely and individually coded by a medical officer at the registry. As far as possibleall case histories are reviewed to ensure that all details are included in the registration form.
For reporting purposes, EUROCAT classification subgroups are defined4. These subgroups make theinterpretation of results more meaningful for the clinician and facilitates comparisons of prevalencerates between centres in the EUROCAT network. A list of EUROCAT classification subgroups isgiven in Annex 3.

Malta Congenital Anomalies Registry Report - 1993 -1997
______________________________________________________________________________20
__________________________________________________________________________________________________________________
CALCULATION OF PREVALENCE RATES AND STATISTICAL METHODSSince some babies are born with more than one anomaly, this report makes a clear distinction between theanalyses of the numbers of infants with one or more congenital anomalies and the analyses of the numbers ofindividual congenital anomalies. As some infants may have more than one anomaly, the number of anomaliesdo not add up to the number of infants.
When counting infants, each baby is considered once irrespective of how many anomalies he/she may have.Therefore, the prevalence of infants/fetuses with congenital anomalies is expressed as the number ofinfants/fetuses registered with one or more congenital anomalies divided by the total number of births - live,still or induced abortions in that period.
Prevalence of infants/fetal deathswith congenital anomalies* = Number of infants/fetal deaths registered with anomalies
Total number of infants/fetal deaths in that period
When counting anomalies, babies with more than one anomaly within a specific subgroup/ICD classificationgroup are counted only once within that class. Babies with anomalies affecting more than one specificsubgroup/classification group are counted once within each class. This method of counting anomalies is thatadopted by EUROCAT Central Registry for reporting purposes.
The total prevalence rate of congenital anomalies is expressed as the number of anomalies registered inlivebirths/fetal deaths divided by the total number of livebirths and fetal deaths in that period.
Total prevalence rate ofcongenital anomalies* = Total number of anomalies registered in livebirths/fetal deaths with anomaly
Total number of livebirths/fetal deaths in that period
The livebirth prevalence rate of congenital anomalies is expressed as the number of liveborn affectedbabies divided by the number of livebirths in that period.
Livebirth prevalence rate * = Total number of anomalies registered in livebirthsTotal livebirths in that period
* Expressed per 10,000 births
Whenever prevalence rates of other countries were considered, the number of induced abortions due toprenatal diagnosis of congenital anomaly were included with the number of fetal deaths due to anomaly. Thisis not applicable to Malta since termination of pregnancy is illegal.
Statistical interpretations were performed using the statistical packages Epi Info 6 and SPSS.

Department of Health Information
______________________________________________________________________________21
_____________________________________________________________________________________

Malta Congenital Anomalies Registry Report - 1993 -1997
______________________________________________________________________________22
__________________________________________________________________________________________________________________

Department of Health Information
______________________________________________________________________________23
_____________________________________________________________________________________
PART TWO -
SUMMARY ANALYSIS

Malta Congenital Anomalies Registry Report - 1993 -1997
______________________________________________________________________________24
__________________________________________________________________________________________________________________
Department of Health Information
______________________________________________________________________________25
_____________________________________________________________________________________
Summary AnalysisDue to the relatively small number of cases of congenital anomalies registered annually, interpretation of datafor one particular year may be unreliable. It is therefore important to analyse aggregated data for severalyears for more meaningful interpretation. This will minimise errors due to the fluctuation of small numberstatistics.
PrevalenceIn 1997 there were 4,864 total births (live and fetal deaths) on the Maltese Islands; of these 203 (4.2%)babies were registered as having one or more congenital anomalies giving a prevalence of 41.8 per 1,000total births. Between 1993-1997 there were 902 babies (482 males, 418 females and 2 with indeterminatesex) registered out of a total of 24,510 births. The overall prevalence of babies registered as having one ormore major congenital anomalies from 1993-1997 was therefore 36.8 /1,000 total births.
Fetal deathsDuring the year 1997, 4 out of the 203 babies registered with anomalies (2.0%) were fetal deaths whereasonly 29 out of the 4864 total births (0.6%) on the islands were fetal deaths. Using data from 1993-1997 thisgreater proportion of fetal deaths in babies with anomalies (22 out of 902 cases - 2.4%) when compared tothat for all babies (145 out of 24,510 births - 0.6%) is also apparent (Table 4). The difference is statisticallysignificant.
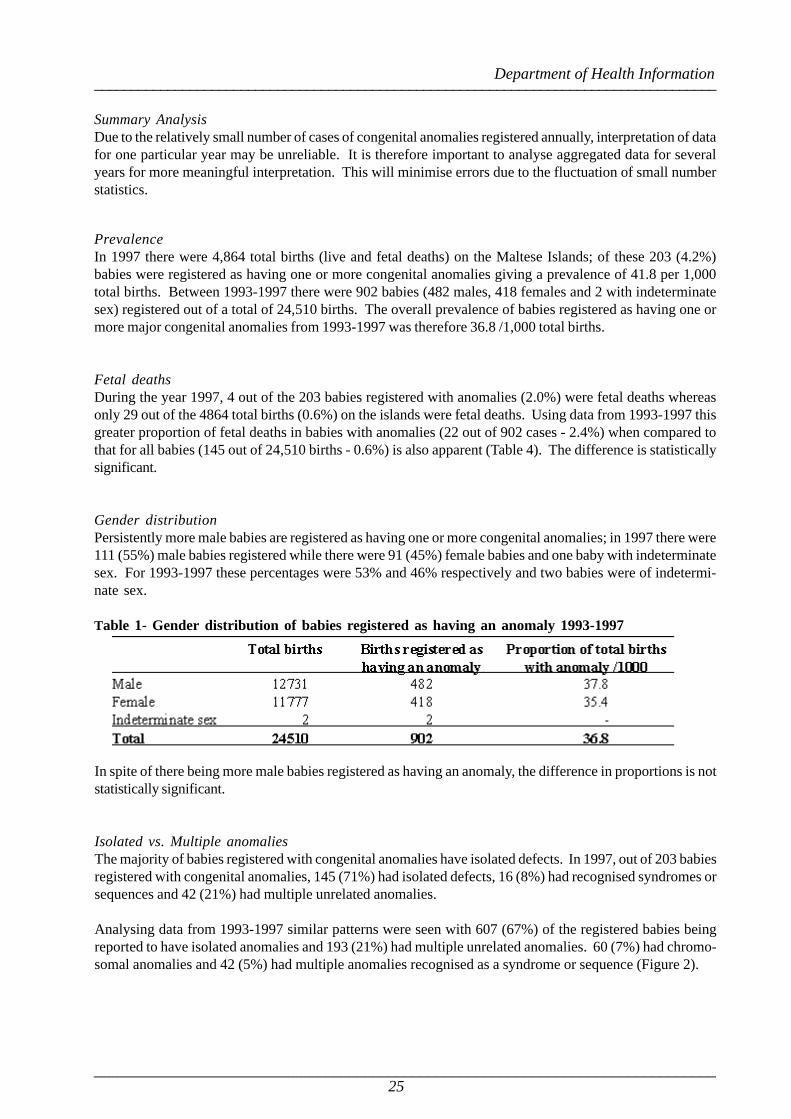
Gender distributionPersistently more male babies are registered as having one or more congenital anomalies; in 1997 there were111 (55%) male babies registered while there were 91 (45%) female babies and one baby with indeterminatesex. For 1993-1997 these percentages were 53% and 46% respectively and two babies were of indetermi-nate sex.
Table 1- Gender distribution of babies registered as having an anomaly 1993-1997
In spite of there being more male babies registered as having an anomaly, the difference in proportions is notstatistically significant.
Isolated vs. Multiple anomaliesThe majority of babies registered with congenital anomalies have isolated defects. In 1997, out of 203 babiesregistered with congenital anomalies, 145 (71%) had isolated defects, 16 (8%) had recognised syndromes orsequences and 42 (21%) had multiple unrelated anomalies.
Analysing data from 1993-1997 similar patterns were seen with 607 (67%) of the registered babies beingreported to have isolated anomalies and 193 (21%) had multiple unrelated anomalies. 60 (7%) had chromo-somal anomalies and 42 (5%) had multiple anomalies recognised as a syndrome or sequence (Figure 2).

Malta Congenital Anomalies Registry Report - 1993 -1997
______________________________________________________________________________26
__________________________________________________________________________________________________________________
Source: Table 9
Source: Table 8
Figure 2 - Distribution of babies according to number of major congenital anomalies (1993-97)
Time of diagnosisMost babies with major congenital anomalies are diagnosed at or soon after birth. In 1997, 87% of babiesregistered with anomalies were diagnosed in the perinatal period (ie. until one month of age).
The figure below shows the distribution of babies with congenital anomalies according to the time of diagno-sis. Between 1993-1997, 82% of babies were diagnosed in the perinatal period. A not insignificant propor-tion (17%) were however diagnosed after 1 month of age and before 1 year of age. This emphasises theimportance of the registry to follow up babies throughout the first year of life for purposes of registration ofcongenital anomalies.
Figure 3 - Time of diagnosis of babies with major congenital anomalies

Department of Health Information
______________________________________________________________________________27
_____________________________________________________________________________________
Sources of informationMultiple sources of information are employed to identify babies to be registered in the Malta CongenitalAnomalies Register. The main sources of information in 1997 were: active data collection from St. Luke’sHospital Maternity Wards (40 %) followed closely by data from Cardiac lab. records and the CongenitalHeart Diseases register (38 %).
Between 1993-97, the main source of information was active data collection from maternity wards in St.Luke’s Hospital (42%), followed by pick up from Cardiac records including Cardiac Lab and the CongenitalHeart Diseases Register (23%). The SLH Maternity Systems database and Hospital Activity Analysisdatabase were the sources of information for 13% and 5% of cases respectively. The National MortalityRegister and autopsy records accounted for 3% of cases; both doctor’s notifications and genetic clinicrecords accounted for 2% of cases each and 3% were from miscellaneous other sources. For the remaining7% of babies registered, the primary source of information was unrecorded.
Figure 4 - Main sources of information for babies diagnosed with congenital anomaly (1993-97)
Maternal agesIn 1997, the average maternal age for babies registered with congenital anomalies was 29 years, 35 years forbabies with chromosomal defects and 29 years for babies with non-chromosomal defects.
Analysis of 1993-1997 data showed that the average maternal ages of babies with non-chromosomal anoma-lies were not significantly different from those of all births. However average maternal ages of babies withchromosomal defects were significantly higher than the general population.
Table 2 - Average maternal ages for all deliveries and deliveries of babies registered withanomalies (1993-97)
Source - Table 10
*the difference in this average maternal age is statistically significant from that of all deliveries
Malta Congenital Anomalies Registry Report - 1993 -1997
______________________________________________________________________________28
__________________________________________________________________________________________________________________
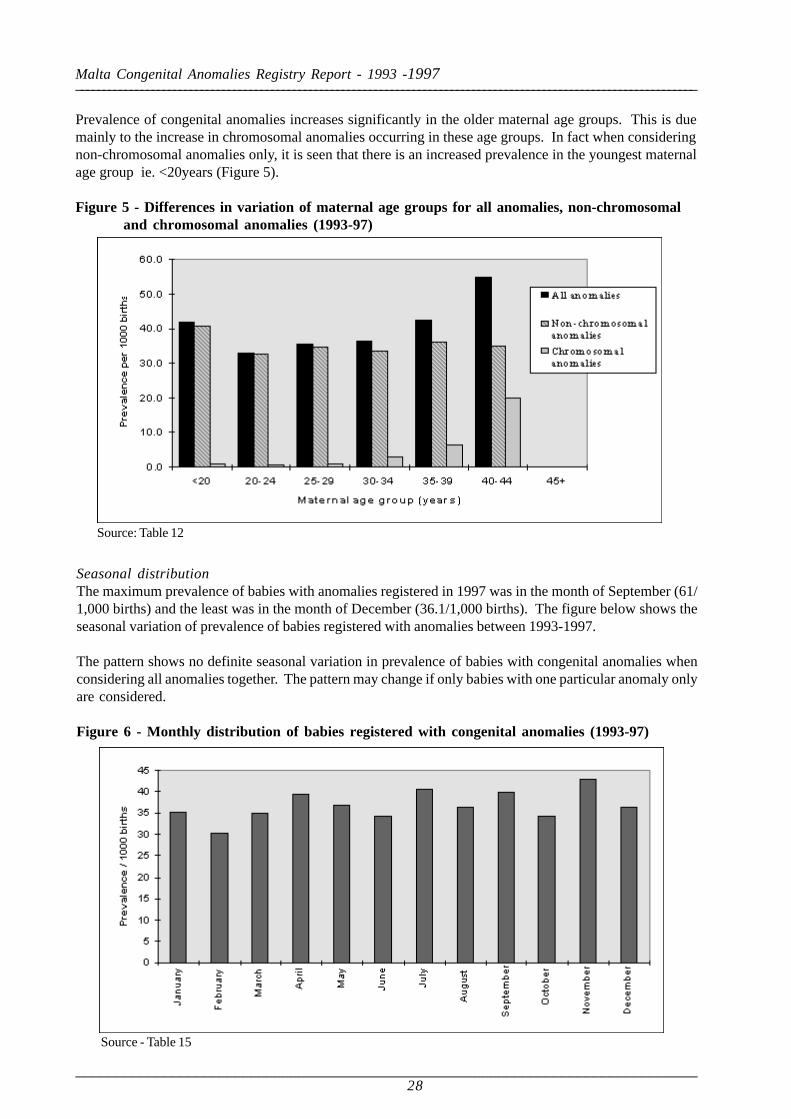
Prevalence of congenital anomalies increases significantly in the older maternal age groups. This is duemainly to the increase in chromosomal anomalies occurring in these age groups. In fact when consideringnon-chromosomal anomalies only, it is seen that there is an increased prevalence in the youngest maternalage group ie. <20years (Figure 5).
Figure 5 - Differences in variation of maternal age groups for all anomalies, non-chromosomaland chromosomal anomalies (1993-97)
Source: Table 12
Seasonal distributionThe maximum prevalence of babies with anomalies registered in 1997 was in the month of September (61/1,000 births) and the least was in the month of December (36.1/1,000 births). The figure below shows theseasonal variation of prevalence of babies registered with anomalies between 1993-1997.
The pattern shows no definite seasonal variation in prevalence of babies with congenital anomalies whenconsidering all anomalies together. The pattern may change if only babies with one particular anomaly onlyare considered.
Figure 6 - Monthly distribution of babies registered with congenital anomalies (1993-97)
Source - Table 15

Department of Health Information
______________________________________________________________________________29
_____________________________________________________________________________________
Geographic distributionMalta and Gozo may divided into 11 regions (see Annex 5). In 1997 the highest prevalence of livebirths withcongenital anomalies was in the Central East Region (44.9/1,000births) and the lowest was in the CentralWest (30.3/1,000 births) see Table 16.
The map below shows the distribution of the prevalence of all babies registered with congenital anomaliesbetween 1993-1997. There are no statistically significant differences between the various regions.
Figure 7 - Geographical distribution of all babies registered with congenital anomalies in Maltaand Gozo from 1993-1997.
Prevalence per 1000 birthsCentral East (CE) - 44.9South (S) - 42.8Central (C) - 42.1West (W) - 38.7North (N) - 38.3Gozo (G) - 37.9Central North(CN) - 34.5Harbour (GH) - 34.5Central South (CS) - 33.9East (E) - 32.5Central West (CW)- 30.3

Malta Congenital Anomalies Registry Report - 1993 -1997
______________________________________________________________________________30
__________________________________________________________________________________________________________________
Distribution of anomaliesOne baby may have one or more different anomalies affecting the same or different systems. The totalnumber of anomalies registered, therefore, does not add up to the same number of babies with anomalies.The table below gives a breakdown of infants/fetuses according to anomaly groups. In this tabulation, a babyhaving more than one anomaly classified within the same EUROCAT subgroup was counted only oncewithin this group. However a baby/fetus with anomalies in different EUROCAT subgroups was countedonce within each subgroup. The distribution of anomalies in decreasing order of frequency is depicted inFigure 8.
The main anomalies encountered in babies/fetuses in 1997 were cardiovascular (37.9%) followed by limband musculoskeletal defects (12.4% and 7.4% respectively). This pattern is similar to that encountered inprevious years.
Table 3 - Distribution of babies/fetuses with major anomalies registered in Malta from 1993-1997 according to the group/system(s) affected

Department of Health Information
______________________________________________________________________________31
_____________________________________________________________________________________
Figure 8 - Distribution (%) of infants/fetuses registered in Malta from 1993-1997 according tothe group/system affected (Data source: Table 3).

Malta Congenital Anomalies Registry Report - 1993 -1997
______________________________________________________________________________32
__________________________________________________________________________________________________________________
Department of Health Information
______________________________________________________________________________33
_____________________________________________________________________________________
A - ANALYSIS OF INFANTS WITH ANOMALIES
B - ANALYSIS OF ANOMALIES
PART THREE -
TABLES

Malta Congenital Anomalies Registry Report - 1993 -1997
______________________________________________________________________________34
__________________________________________________________________________________________________________________

Department of Health Information
______________________________________________________________________________35
_____________________________________________________________________________________
*Taken from Demographic Reviews of the Maltese Islands 1993 to 1997
* Data taken from National Mortality Register
Table 7 - Proportion of babies dying with a congenital anomaly recorded as underlying cause ofdeath after 1 week to 1 year of age
* Data taken from National Mortality Register
Table 6 - Proportion of babies dying with a congenital anomaly recorded as underlying cause ofdeath from livebirth to 1 week of age
* Data taken from National Mortality Register
A - ANALYSIS OF INFANTS WITH ANOMALIES
LIVEBIRTHS AND FETAL DEATHS
(for residents of the Maltese Islands)
Table 4 - Distribution of livebirths and stillbirths in all babies and in babies with anomalies inthe Maltese Islands from 1993-1997.
Table 5 - Proportion of fetal deaths with a congenital anomaly recorded as underlying cause ofdeath

Malta Congenital Anomalies Registry Report - 1993 -1997
______________________________________________________________________________36
__________________________________________________________________________________________________________________
DISTRIBUTION OF INFANTS/FETUSES WITH CONGENITAL ANOMALY ACCORDING TO DIAGNOSTIC CATEGORY
The overall diagnosis of an infant/fetus may be classified as having aI Single anomaly Infant or fetus with an isolated major anomalyII Syndromes Infant or fetus with a pattern of more than one anomaly,
recognised as a syndrome, sequence, or metabolic disorder.Recognised associations (with unknown aetiology) are also included here.
III Multiple AnomaliesInfants or fetuses with more than one anomaly, not recognisedas a syndrome or sequence.
Table 8 - Number of registered children according to diagnostic category of the congenitalanomalies and per year of birth
This distribution is represented graphically in the following figure.

Departm
ent of Health Inform
ation
______________________________________________________________________________37
_____________________________________________________________________________________Figure 9 - Distribution of babies registered with congenital anomalies according to number of anomalies (1993-1997)
Isolated major anomalies
607 (67%)
With no associatedminor anomaly
575 (64%)
All babies with congenital anomalies
902 (100%)
With associatedminor anomaly
32 (3%)
Chromosomedisorders60 (7%)
Syndromes andSequences42 (5%)
Multiple unrelatedanomalies
193 (21%)
Multiple major anomalies and syndromes
295 (33%)
With associatedmajor anomaly
40 (5%)
With no associatedmajor anomaly
20 (2%)
With associatedmajor anomaly
29 (3%)
With no associatedmajor anomaly
13 (2%)
With TWOanomalies119 (13%)
With THREEanomalies39 (4%)
With FOUR+anomalies35 (4%)
Samesystem69 (8%)
DifferentSystems50 (5%)

Malta Congenital Anomalies Registry Report - 1993 -1997
______________________________________________________________________________38
__________________________________________________________________________________________________________________
DISTRIBUTION OF INFANTS/FETUSES WITH CONGENITAL ANOMALIES BY
TIME OF DIAGNOSIS
Table 9 - Distribution of babies according to time of diagnosis
SOURCE OF INFORMATION
Table 10 - Distribution of babies registered with anomaly by first source of information
GENDER
Table 11 - Distribution of babies with anomaly (livebirths and fetal deaths) by sex (1993-97)

Department of Health Information
______________________________________________________________________________39
_____________________________________________________________________________________
n/a - not applicable
MATERNAL AGE
Table 12 - Distribution of all babies with congenital anomalies according to maternal age
Table 13 - Distribution of babies with non-chromosomal defects according to maternal age
Table 14 - Distribution of babies with chromosomal defects according to maternal age
n/a - not applicable
n/a - not applicable

Malta Congenital Anomalies Registry Report - 1993 -1997
______________________________________________________________________________40
__________________________________________________________________________________________________________________
MONTH OF BIRTH
Table 15 - Distribution of babies registered with congenital anomalies according to month ofbirth
GEOGRAPHICAL DISTRIBUTION
Table 16 - Distribution of babies with congenital anomaly according to locality of mother at timeof birth

Department of Health Information
______________________________________________________________________________41
_____________________________________________________________________________________

Malta Congenital Anomalies Registry Report - 1993 -1997
______________________________________________________________________________42
__________________________________________________________________________________________________________________
B - ANALYSIS OF ANOMALIES

Department of Health Information
______________________________________________________________________________43
_____________________________________________________________________________________

Malta Congenital Anomalies Registry Report - 1993 -1997
______________________________________________________________________________44
__________________________________________________________________________________________________________________

Department of Health Information
______________________________________________________________________________45
_____________________________________________________________________________________

Malta Congenital Anomalies Registry Report - 1993 -1997
______________________________________________________________________________46
__________________________________________________________________________________________________________________

Department of Health Information
______________________________________________________________________________47
_____________________________________________________________________________________

Malta Congenital Anomalies Registry Report - 1993 -1997
______________________________________________________________________________48
__________________________________________________________________________________________________________________

Department of Health Information
______________________________________________________________________________49
_____________________________________________________________________________________

Malta Congenital Anomalies Registry Report - 1993 -1997
______________________________________________________________________________50
__________________________________________________________________________________________________________________

Department of Health Information
______________________________________________________________________________51
_____________________________________________________________________________________

Malta Congenital Anomalies Registry Report - 1993 -1997
______________________________________________________________________________52
__________________________________________________________________________________________________________________

Department of Health Information
______________________________________________________________________________53
_____________________________________________________________________________________
Malta C
ongenital Anom
alies Registry R
eport - 1993 -1997
______________________________________________________________________________5
4
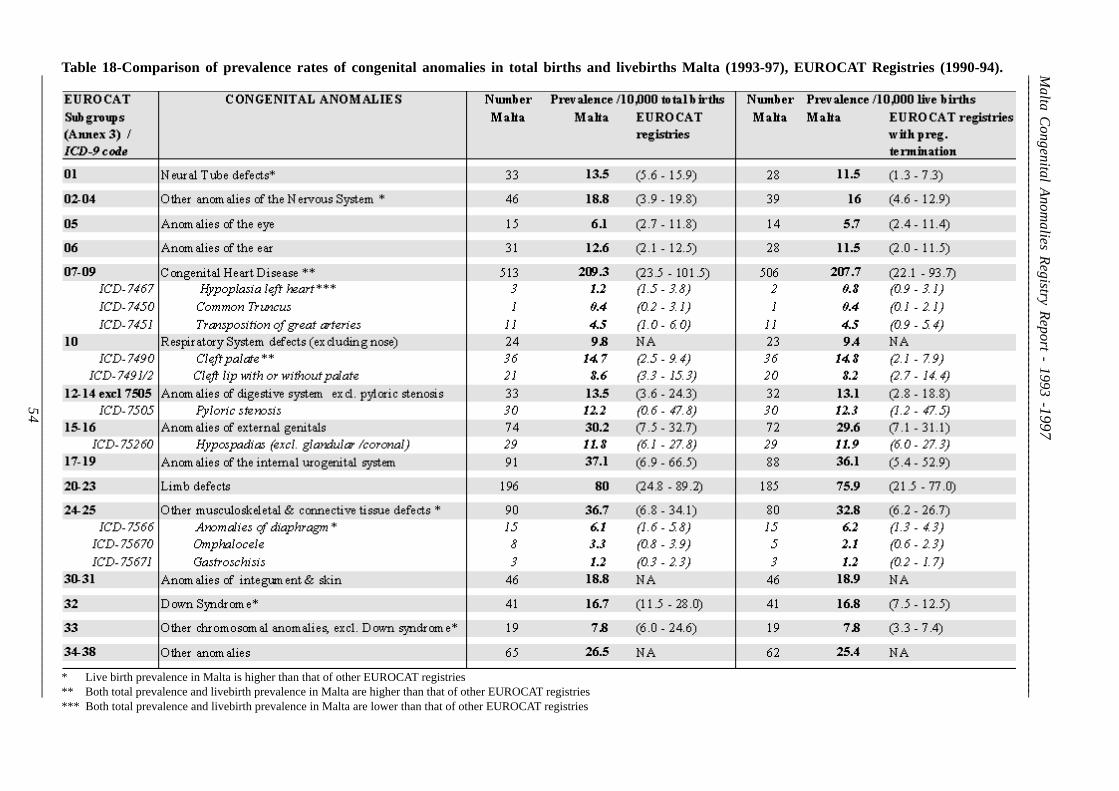
__________________________________________________________________________________________________________________Table 18-Comparison of prevalence rates of congenital anomalies in total births and livebirths Malta (1993-97), EUROCAT Registries (1990-94).
* Live birth prevalence in Malta is higher than that of other EUROCAT registries** Both total prevalence and livebirth prevalence in Malta are higher than that of other EUROCAT registries*** Both total prevalence and livebirth prevalence in Malta are lower than that of other EUROCAT registries

Department of Health Information
______________________________________________________________________________55
_____________________________________________________________________________________

Malta Congenital Anomalies Registry Report - 1993 -1997
______________________________________________________________________________56
__________________________________________________________________________________________________________________

Department of Health Information
______________________________________________________________________________57
_____________________________________________________________________________________
PART FOUR -
SPECIFIC ANOMALY GROUPS

Malta Congenital Anomalies Registry Report - 1993 -1997
______________________________________________________________________________58
__________________________________________________________________________________________________________________
Figure 10 - Geographical distribution of NTD (1993-97)
NEURAL TUBE DEFECTS (NTD)Neural tube defects include anencephaly, encephalocele, spina bifida and iniencephaly (ICD-9 codes7400 - 7420)1.
Geographical distribution
Table 19 - Distribution of NTD according to locality of residence of mother
The differences in prevalence do not reach statistical significance.
North West17.7 /10,000
South East9.2 /10,000
Gozo5.7 /10,000

Department of Health Information
______________________________________________________________________________59
_____________________________________________________________________________________
Time trends for NTD: Malta & EUROCAT
Table 20 - Time trend of total prevalence of NTDs Malta and EUROCAT average compared
*Data taken from EUROCAT Report 7 1
Figure 11 - Prevalence of NTD over time Malta and EUROCAT Average
Prevalence in Malta vs EUROCAT
Prevalence in Malta 1993-1997 - 13.5/10,000 total births (95% CI 9.4 to 19.1)EUROCAT average 1990-1994 - 10.1/10,000 total births
Range of prevalence in EUROCAT registries 1990-1994 (5.6* to 15.9** /10,000 births)* The lowest prevalence recorded was in the EUROCAT registry of - Switzerland** The highest prevalence recorded was in the EUROCAT registry of - Glasgow

Malta Congenital Anomalies Registry Report - 1993 -1997
______________________________________________________________________________60
__________________________________________________________________________________________________________________
CLEFT LIP WITH OR WITHOUT CLEFT PALATE
These include clefting of the upper lip with or without clefting of the maxillary alveolar process anhard and soft palate (ICD-9 codes: 7491 - 7492)1.
Geographical distribution
Table 21 - Distribution of Cleft lip with or without cleft palate according to locality of residenceof mother
Figure 12 - Geographical distribution of Cleft lip with or without cleft palate (1993-97)
The difference in prevalence between the regions is not statistically significant.
North West8.5 /10,000
South East7.2 /10,000
Gozo17.0 /10,000

Department of Health Information
______________________________________________________________________________61
_____________________________________________________________________________________
Time trends for Cleft Lip with or without cleft palate: Malta & EUROCAT
Table 22 - Time trend of total prevalence of cleft lip Malta and EUROCAT average compared
*Data taken from EUROCAT Report 7 1
Figure 13 - Prevalence of cleft lip with or without cleft palate over time Malta and EUROCATAverage
Prevalence in Malta vs EUROCAT
Prevalence in Malta 1993-1997 - 8.6/10,000 total births (95% CI 5.4 to 13.3)EUROCAT average 1990-1994 - 8.9/10,000 total births
Range of prevalence in EUROCAT registries 1990-1994 - 3.3* to 15.3** /10,000 births* The lowest prevalence recorded was in the EUROCAT registry of - Belfast** The highest prevalence recorded was in the EUROCAT registry of - Northern Netherlands

Malta Congenital Anomalies Registry Report - 1993 -1997
______________________________________________________________________________62
__________________________________________________________________________________________________________________
CLEFT PALATE
This includes fissure defects of the soft and / or hard palate(s) or submucous cleft without cleft lip(ICD-9 code: 7490)1.
Geographical distribution
Table 23 - Distribution of Cleft Palate according to locality of residence of mother
Figure 14 - Geographical distribution of Cleft Palate (1993-97)
The difference in prevalence between the regions is not statistically significant.
North West12.3 /10,000
South East16.4 /10,000
Gozo22.6 /10,000

Department of Health Information
______________________________________________________________________________63
_____________________________________________________________________________________
Time trends for Cleft palate: Malta & EUROCAT
Table 24 - Time trend of total prevalence of cleft palate Malta and EUROCAT average compared
*Data taken from latest published data: EUROCAT Report 7 1
Figure 15 - Prevalence of cleft palate over time Malta and EUROCAT Average
Prevalence in Malta vs EUROCAT
Prevalence in Malta 1993-1997 - 14.7/10,000 total births (95% CI 10.4 to 20.6)EUROCAT average 1990-1994 - 6.4/10,000 total births
Range of prevalence in EUROCAT registries 1990-1994 - 2.5* to 9.4** /10,000 births* The lowest prevalence recorded was in the EUROCAT registry of - Belfast** The highest prevalence recorded was in the EUROCAT registry of - Glasgow
Comments:The prevalence of cleft palate in Malta is significantly higher than that reported by other European registries.All cases of cleft palate from 1993-97 in Malta were found as isolated defects.
Malta Congenital Anomalies Registry Report - 1993 -1997
______________________________________________________________________________64
__________________________________________________________________________________________________________________
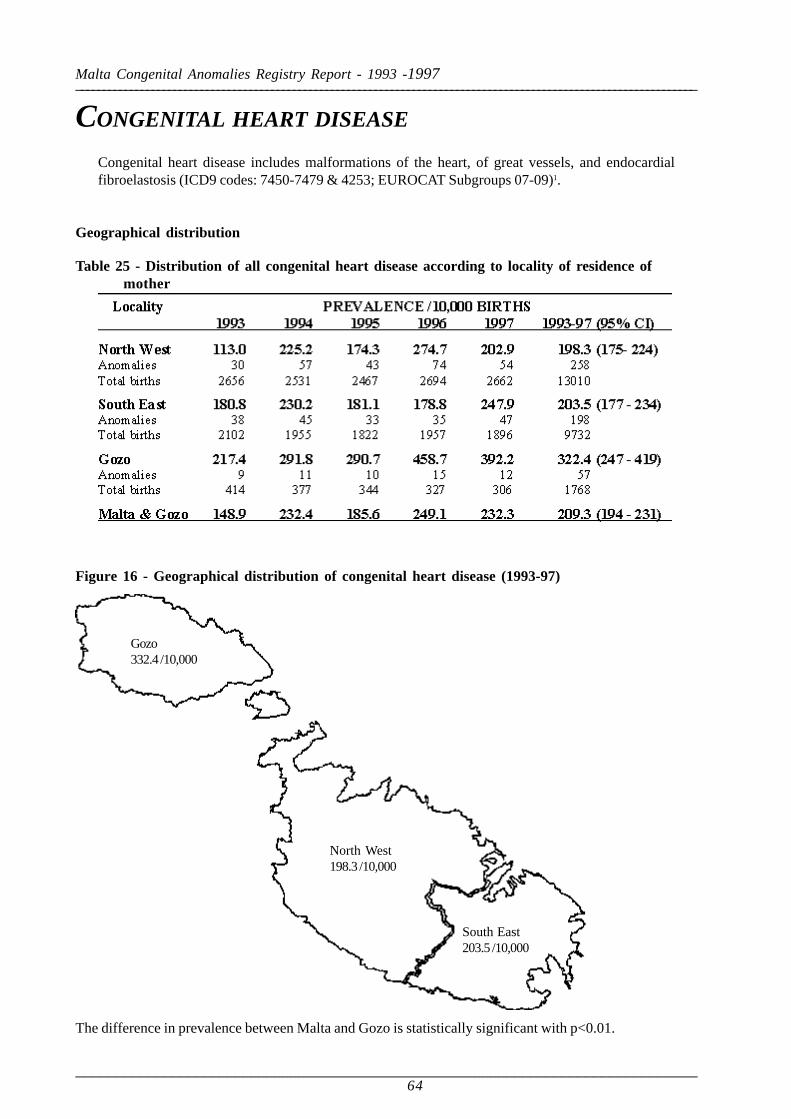
CONGENITAL HEART DISEASE
Congenital heart disease includes malformations of the heart, of great vessels, and endocardialfibroelastosis (ICD9 codes: 7450-7479 & 4253; EUROCAT Subgroups 07-09)1.
Geographical distribution
Table 25 - Distribution of all congenital heart disease according to locality of residence ofmother
Figure 16 - Geographical distribution of congenital heart disease (1993-97)
The difference in prevalence between Malta and Gozo is statistically significant with p<0.01.
North West198.3 /10,000
South East203.5 /10,000
Gozo332.4 /10,000

Department of Health Information
______________________________________________________________________________65
_____________________________________________________________________________________
Time trends for Congenital heart disease: Malta & EUROCAT
Table 26 - Time trend of total prevalence of Congenital heart disease Malta and EUROCATaverage compared
*Data taken from latest published data: EUROCAT Report 7 1
Figure 17- Prevalence of Congenital heart disease over time Malta and EUROCAT Average
Prevalence in Malta vs EUROCAT
Prevalence in Malta 1993-1997 - 209/10,000 total births (95% CI 194 to 231 )EUROCAT average 1990-1994 - 59/10,000 total births
Range of prevalence in EUROCAT registries 1990-1994 - 23.5* to 101.5** /10,000 births* The lowest prevalence recorded was in the EUROCAT registry of - Belfast** The highest prevalence recorded was in the EUROCAT registry of - Strasbourg

Malta Congenital Anomalies Registry Report - 1993 -1997
______________________________________________________________________________66
__________________________________________________________________________________________________________________
ANOMALIES OF THE DIGESTIVE SYSTEM
These include tracheo-oesophageal fistula, oesophageal atresia and stenosis , atresia and stenosis ofsmall intestine, Meckel’s diverticulum, colon disorders, anomalies of intestinal fixation and anomaliesof gallbladder, bile ducts and liver , congenital pyloric stenosis excluded (EUROCAT subgroups 12,13, 14 excluding pyloric stenosis)1.
Geographical distribution
Table 27 - Distribution of defects of the digestive system according to locality of residence ofmother
Figure 18 - Geographical distribution of defects of the digestive system (1993-97)
The differences in prevalence are not statistically significant.
North West13.8 /10,000
South East15.4 /10,000
Gozo0.0 /10,000

Department of Health Information
______________________________________________________________________________67
_____________________________________________________________________________________
Time trends for defects of the digestive system: Malta & EUROCAT
Table 28 - Time trend of total prevalence of defects of the digestive system Malta andEUROCAT average compared
*Data taken from latest published data: EUROCAT Report 7 1
Figure 19- Prevalence of defects of the digestive system over time Malta and EUROCATAverage
Prevalence in Malta vs EUROCAT
Prevalence in Malta 1993-1997 - 13.5/10,000 total births (95% CI 9.4 to 19.1)EUROCAT average 1990-1994 - 13.9/10,000 total births
Range of prevalence in EUROCAT registries 1990-1994 - 3.6* to 24.3** /10,000 births* The lowest prevalence recorded was in the EUROCAT registry of - Belfast** The highest prevalence recorded was in the EUROCAT registry of - Glasgow

Malta Congenital Anomalies Registry Report - 1993 -1997
______________________________________________________________________________68
__________________________________________________________________________________________________________________
Figure 20 - Geographical distribution of pyloric stenosis (1993-97)
The differences in prevalence are not statistically significant.
PYLORIC STENOSIS
This is hypertrophy of muscular pylorus mainly detected after one month of life (ICD9 code:7505)1.
Geographical distribution
Table 29 - Distribution of congenital pyloric stenosis according to locality of residence ofmother
North West13.1 /10,000
South East11.3 /10,000
Gozo11.3 /10,000

Department of Health Information
______________________________________________________________________________69
_____________________________________________________________________________________
Time trends for pyloric stenosis: Malta & EUROCAT
Table 30 - Time trend of total prevalence of congenital pyloric stenosis Malta and EUROCATaverage compared
*Data taken from latest published data: EUROCAT Report 7 1
Figure 21- Prevalence of defects of pyloric stenosis over time Malta and EUROCAT Average
Prevalence in Malta vs EUROCAT
Prevalence in Malta 1993-1997 - 12.2/10,000 total births (95% CI 8.4 to 17.7)EUROCAT average 1990-1994 - 5.9/10,000 total births
Range of prevalence in EUROCAT registries 1990-1994 - 0* to 47.8** /10,000 births* The lowest prevalence recorded was in the EUROCAT registry of - Odense, Paris, Hainaut-Namur** The highest prevalence recorded was in the EUROCAT registry of - Antwerp
Malta Congenital Anomalies Registry Report - 1993 -1997
______________________________________________________________________________70
__________________________________________________________________________________________________________________
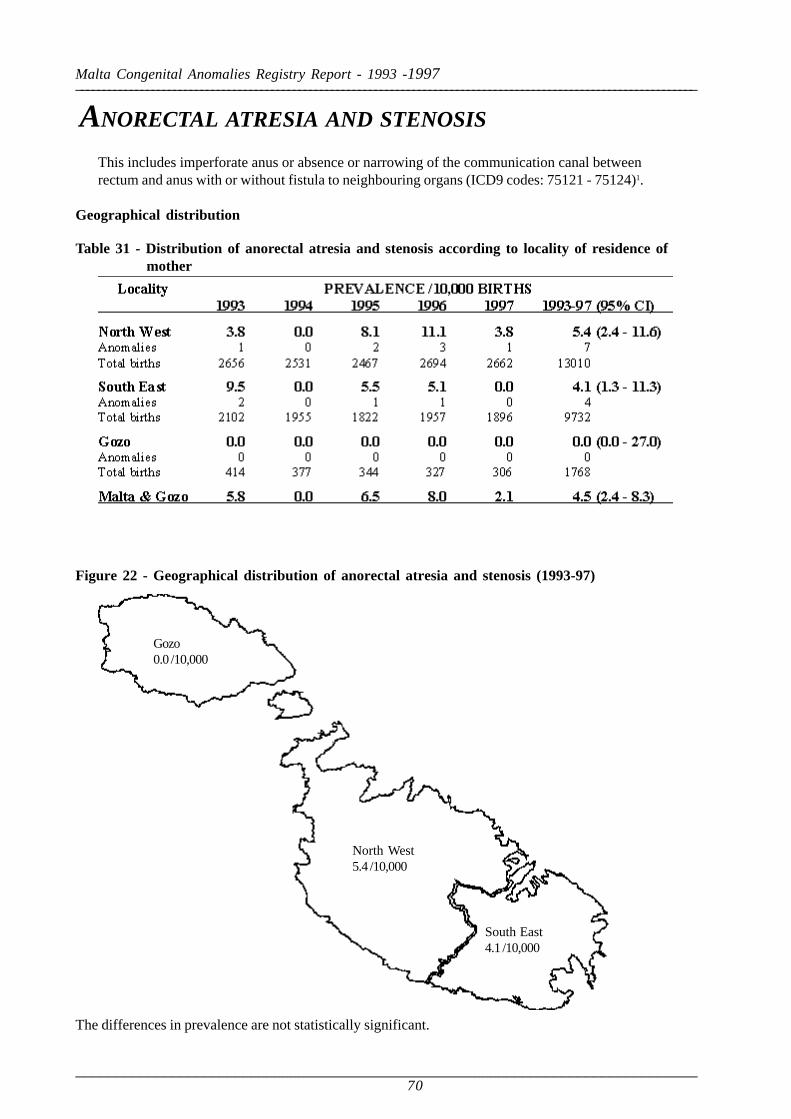
ANORECTAL ATRESIA AND STENOSIS
This includes imperforate anus or absence or narrowing of the communication canal betweenrectum and anus with or without fistula to neighbouring organs (ICD9 codes: 75121 - 75124)1.
Geographical distribution
Table 31 - Distribution of anorectal atresia and stenosis according to locality of residence of mother
Figure 22 - Geographical distribution of anorectal atresia and stenosis (1993-97)
The differences in prevalence are not statistically significant.
North West5.4 /10,000
South East4.1 /10,000
Gozo0.0 /10,000

Department of Health Information
______________________________________________________________________________71
_____________________________________________________________________________________
Time trends for anorectal atresia and stenosis: Malta & EUROCAT
Table 32 - Time trend of total prevalence of anorectal atresia and stenosis Malta andEUROCAT average compared
*Data taken from latest published data: EUROCAT Report 7 1
Figure 23- Prevalence of defects of anorectal atresia and stenosis over time Malta andEUROCAT Average
Prevalence in Malta vs EUROCAT
Prevalence in Malta 1993-1997 - 4.5/10,000 total births (95% CI 2.4 to 8.3)EUROCAT average 1990-1994 - 3.3/10,000 total births
Range of prevalence in EUROCAT registries 1990-1994 - 1.3* to 5.4** /10,000 births* The lowest prevalence recorded was in the EUROCAT registry of - Belfast** The highest prevalence recorded was in the EUROCAT registry of - Odense

Malta Congenital Anomalies Registry Report - 1993 -1997
______________________________________________________________________________72
__________________________________________________________________________________________________________________
ANOMALIES OF THE INTERNAL UROGENITAL SYSTEM
These include anomalies of ovaries, uterus and renal system (EUROCAT Subgroups 17-19)1.
Geographical distribution
Table 33 - Distribution of defects of the internal urogenital system according to locality ofresidence of mother
Figure 24 - Geographical distribution of defects of the internal urogenital system (1993-97)
The differences in prevalence are statistically significant with p<0.05.
North West47.7 /10,000
South East28.8 /10,000
Gozo5.7 /10,000

Department of Health Information
______________________________________________________________________________73
_____________________________________________________________________________________
Time trends for defects of the internal urogenital system: Malta & EUROCAT
Table 34 - Time trend of total prevalence of defects of the internal urogenital system Malta andEUROCAT average compared
*Data taken from latest published data: EUROCAT Report 7 1
Figure 25- Prevalence of defects of the internal urogenital system over time Malta andEUROCAT Average
Prevalence in Malta vs EUROCAT
Prevalence in Malta 1993-1997 - 37.1/10,000 total births (95% CI 30.0 to 45.8)EUROCAT average 1990-1994 - 32.6/10,000 total births
Range of prevalence in EUROCAT registries 1990-1994 - 6.9* to 66.5** /10,000 births* The lowest prevalence recorded was in the EUROCAT registry of - Belfast** The highest prevalence recorded was in the EUROCAT registry of - Paris

Malta Congenital Anomalies Registry Report - 1993 -1997
______________________________________________________________________________74
__________________________________________________________________________________________________________________
CYSTIC KIDNEY DISEASE
This includes presence of single or multiple cyst(s) infantile type, and enlarging kidney tissue (ICD9code:7531)1.
Geographical distribution
Table 35 - Distribution of cystic kidney defects according to locality of residence of mother
Figure 26 - Geographical distribution of cystic kidney disease (1993-97)
The differences in prevalence are not statistically significant.
North West4.6 /10,000
South East5.1 /10,000
Gozo0.0 /10,000

Department of Health Information
______________________________________________________________________________75
_____________________________________________________________________________________
Time trends for cystic kidney disease: Malta & EUROCAT
Table 36 - Time trend of total prevalence of cystic kidney disease: Malta and EUROCAT aver-age compared
*Data taken from latest published data: EUROCAT Report 7 1
Figure 27- Prevalence of cystic kidney disease over time Malta and EUROCAT Average
Prevalence in Malta vs EUROCAT
Prevalence in Malta 1993-1997 - 4.5/10,000 total births (95% CI 2.3 to 8.3)EUROCAT average 1990-1994 - 4.7/10,000 total births
Range of prevalence in EUROCAT registries 1990-1994 - 0.3* to 8.4** /10,000 births* The lowest prevalence recorded was in the EUROCAT registry of - Odense** The highest prevalence recorded was in the EUROCAT registry of - Paris

Malta Congenital Anomalies Registry Report - 1993 -1997
______________________________________________________________________________76
__________________________________________________________________________________________________________________
LIMB REDUCTION DEFECTS
This includes total or partial absence or severe hypoplasia of skeletal structure of the limbs (ICD9codes: 7552-7554)1.
Geographical distribution
Table 37 - Distribution of limb reduction defects according to locality of residence of mother
Figure 28 - Geographical distribution of limb reduction defects (1993-97)
Differences in prevalence are not statistically significant.
North West3.8 /10,000
South East7.2 /10,000
Gozo0.0 /10,000

Department of Health Information
______________________________________________________________________________77
_____________________________________________________________________________________
Time trends for limb reduction defects: Malta & EUROCAT
Table 38 - Time trend of total prevalence of limb reduction defects: Malta and EUROCATaverage compared
*Data taken from latest published data: EUROCAT Report 7 1
Figure 29- Prevalence of limb reduction defects over time Malta and EUROCAT Average
Prevalence in Malta vs EUROCAT
Prevalence in Malta 1993-1997 - 4.9/10,000 total births (95% CI 2.7 to 8.8)EUROCAT average 1990-1994 - 6.1/10,000 total births
Range of prevalence in EUROCAT registries 1990-1994 - 1.5* to 9.8** /10,000 births* The lowest prevalence recorded was in the EUROCAT registry of - Galway** The highest prevalence recorded was in the EUROCAT registry of - Asturias

Malta Congenital Anomalies Registry Report - 1993 -1997
______________________________________________________________________________78
__________________________________________________________________________________________________________________
POLYDACTYLY
Partial or total extra digit on the radial (pre-axial), cubital (post axial) side of the hand or axial location,between 2nd, 3rd or 4th finger (ICD9 code: 7550)1.
Geographical distribution
Table 39 - Distribution of polydactyly according to locality of residence of mother
Figure 30 - Geographical distribution of polydactyly (1993-97)
The differences in prevalence are not statistically significant.
North West22.3 /10,000
South East14.4 /10,000
Gozo0.0 /10,000

Department of Health Information
______________________________________________________________________________79
_____________________________________________________________________________________
Time trends for polydactyly: Malta & EUROCAT
Table 40 - Time trend of total prevalence of polydactyly: Malta and EUROCAT averagecompared
*Data taken from latest published data: EUROCAT Report 7 1
Figure 31- Prevalence of polydactyly over time Malta and EUROCAT Average
Prevalence in Malta vs EUROCAT
Prevalence in Malta 1993-1997 - 17.5/10,000 total births (95% CI 12.9 to 23.9)EUROCAT average 1990-1994 - 8.2/10,000 total births
Range of prevalence in EUROCAT registries 1990-1994 - 4.1* to 18.0** /10,000 births* The lowest prevalence recorded was in the EUROCAT registry of - Belfast** The highest prevalence recorded was in the EUROCAT registry of - Paris

Malta Congenital Anomalies Registry Report - 1993 -1997
______________________________________________________________________________80
__________________________________________________________________________________________________________________
SYNDACTYLY
Includes partial or total webbing between two or more digits and includes minor forms (ICD9 code:7551).
Geographical distribution
Table 41 - Distribution of syndactyly according to locality of residence of mother
Figure 32 - Geographical distribution of syndactyly (1993-97)
There is a significant difference in prevalence between North West and South East Malta and Gozo withp<0.05.
North West4.6 /10,000
South East12.3 /10,000
Gozo11.3 /10,000

Department of Health Information
______________________________________________________________________________81
_____________________________________________________________________________________
Time trends for syndactyly: Malta & EUROCAT
Table 42 - Time trend of total prevalence of syndactyly: Malta and EUROCAT averagecompared
*Data taken from latest published data: EUROCAT Report 7 1
Figure 33- Prevalence of syndactyly over time Malta and EUROCAT Average
Prevalence in Malta vs EUROCAT
Prevalence in Malta 1993-1997 - 8.2/10,000 total births (95% CI 5.1 to 12.9)EUROCAT average 1990-1994 - 5.3/10,000 total births
Range of prevalence in EUROCAT registries 1990-1994 - 0.8* to 8.5** /10,000 births* The lowest prevalence recorded was in the EUROCAT registry of - Galway** The highest prevalence recorded was in the EUROCAT registry of - Glasgow
Malta Congenital Anomalies Registry Report - 1993 -1997
______________________________________________________________________________82
__________________________________________________________________________________________________________________
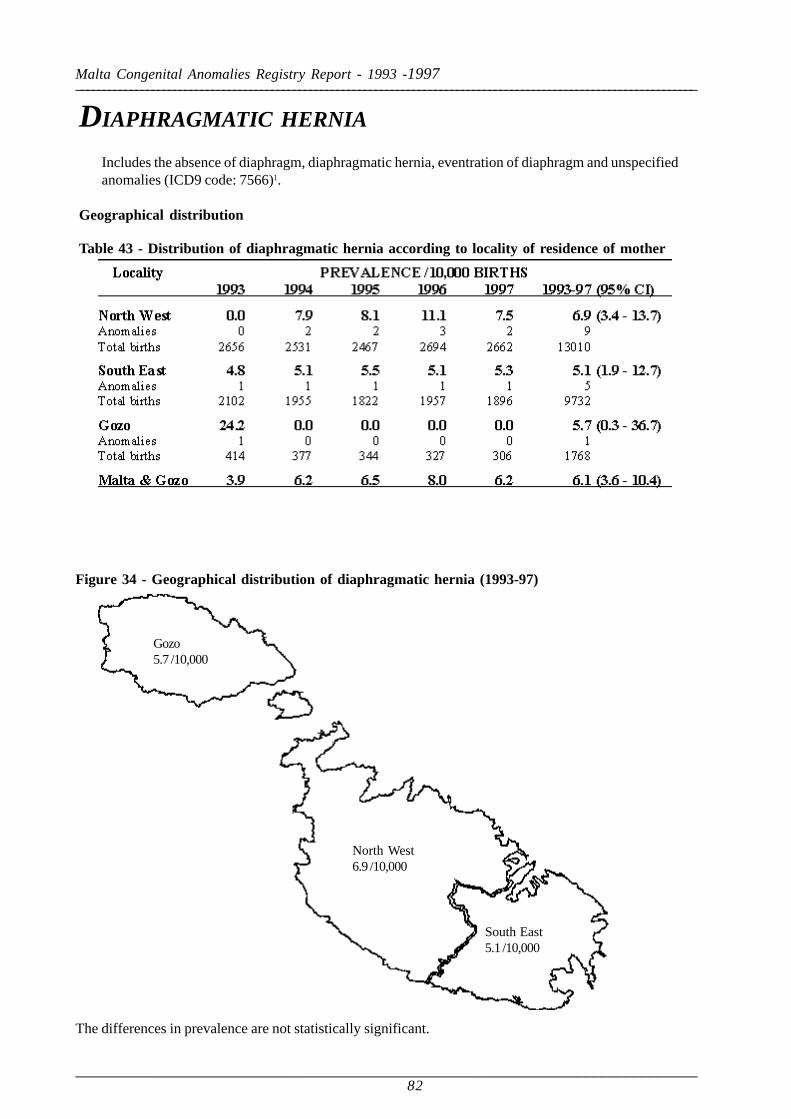
DIAPHRAGMATIC HERNIA
Includes the absence of diaphragm, diaphragmatic hernia, eventration of diaphragm and unspecifiedanomalies (ICD9 code: 7566)1.
Geographical distribution
Table 43 - Distribution of diaphragmatic hernia according to locality of residence of mother
Figure 34 - Geographical distribution of diaphragmatic hernia (1993-97)
The differences in prevalence are not statistically significant.
North West6.9 /10,000
South East5.1 /10,000
Gozo5.7 /10,000

Department of Health Information
______________________________________________________________________________83
_____________________________________________________________________________________
Time trends for diaphragmatic hernia: Malta & EUROCAT
Table 44 - Time trend of total prevalence of diaphragmatic hernia: Malta and EUROCATaverage compared
*Data taken from latest published data: EUROCAT Report 7 1
Figure 35- Prevalence of diaphragmatic hernia over time Malta and EUROCAT Average
Prevalence in Malta vs EUROCAT
Prevalence in Malta 1993-1997 - 6.1/10,000 total births (95% CI 3.6 to 10.4)EUROCAT average 1990-1994 - 3.5/10,000 total births
Range of prevalence in EUROCAT registries 1990-1994 - 1.6* to 5.8** /10,000 births* The lowest prevalence recorded was in the EUROCAT registry of - Belfast, Tuscany** The highest prevalence recorded was in the EUROCAT registry of - Strasbourg

Malta Congenital Anomalies Registry Report - 1993 -1997
______________________________________________________________________________84
__________________________________________________________________________________________________________________
DOWN SYNDROME ALL AGESDown syndrome / Trisomy 21 is the most frequently encountered chromosomal defect and a majorcause of intellectual impairment. Due to the relationship between this defect and maternal age,prevalence is described separately for all maternal ages, maternal ages under 30 years and 35 yearsor more (ICD9 code: 7580).
Table 45- Distribution of maternal ages for babies with Down syndrome 1993-1997
Geographical distribution
Figure 36 - Geographical distribution of Down syndrome all ages (1993-97)
The differences in prevalence are not statistically significant.
Table 46 - Distribution of Down syndrome according to locality of residence of mother
North West13.8 /10,000
South East19.5 /10,000
Gozo22.6 /10,000

Department of Health Information
______________________________________________________________________________85
_____________________________________________________________________________________
Time trends for Down syndrome all ages: Malta & EUROCAT
Table 47 - Time trend of total prevalence of Down syndrome all ages Malta and EUROCATaverage compared
*Data taken from latest published data: EUROCAT Report 7 1
Figure 37- Prevalence of Down syndrome all ages over time Malta and EUROCAT Average
Prevalence in Malta vs EUROCAT
Prevalence in Malta 1993-1997 - 16.7/10,000 total births (95% CI 12.2 to 22.9 )EUROCAT average 1990-1994 - 16.8/10,000 total births
Range of prevalence in EUROCAT registries 1990-1994 - 11.5* to 28.0** /10,000 births* The lowest prevalence recorded was in the EUROCAT registry of - Antwerp** The highest prevalence recorded was in the EUROCAT registry of - Paris

Malta Congenital Anomalies Registry Report - 1993 -1997
______________________________________________________________________________86
__________________________________________________________________________________________________________________
DOWN SYNDROME WITH MATERNAL AGE UNDER 30 YEARS
Time trends for Down syndrome with maternal age under 30 years: Malta & EUROCAT
Table 48 - Prevalence of Down syndrome in Malta with maternal age under 30 years
Table 49 - Time trend of prevalence of Down syndrome with maternal age under 30 yearsMalta and EUROCAT average compared
*Data taken from latest published data: EUROCAT Report 7 1
Figure 38- Prevalence of Down syndrome with maternal age under 30 years over timeMalta and EUROCAT Average
Prevalence in Malta vs EUROCAT
Prevalence in Malta 1993-1997 - 2.1/10,000 total births (95% CI 0.5 to 6.6)EUROCAT average 1990-1994 - 7.8/10,000 total births
Range of prevalence in EUROCAT registries 1990-1994 - 5.2* to 11.2** /10,000 births* The lowest prevalence recorded was in the EUROCAT registry of - Odense** The highest prevalence recorded was in the EUROCAT registries of - Paris, Glasgow

Department of Health Information
______________________________________________________________________________87
_____________________________________________________________________________________
DOWN SYNDROME WITH MATERNAL AGE 35 YEARS OR OVER
Time trends for Down syndrome with maternal ages 35 years and over: Malta & EUROCAT
Table 50 - Prevalence of Down syndrome in Malta with maternal age 35 years and over
Table 51 - Time trend of prevalence of Down syndrome with maternal ages 35 years andover Malta and EUROCAT average compared
*Data taken from latest published data: EUROCAT Report 7 1
Figure 39- Prevalence of Down syndrome with maternal ages 35 years and more over timeMalta and EUROCAT Average
Prevalence in Malta vs EUROCAT
Prevalence in Malta 1993-1997 - 73.2/10,000 total births (95% CI 48.9 to 108.7 )EUROCAT average 1990-1994 - 61.2/10,000 total births
Range of prevalence in EUROCAT registries 1990-1994 - 35.7* to 81.7** /10,000 births* The lowest prevalence recorded was in the EUROCAT registry of - Antwerp** The highest prevalence recorded was in the EUROCAT registry of - Paris

Malta Congenital Anomalies Registry Report - 1993 -1997
______________________________________________________________________________88
__________________________________________________________________________________________________________________
REFERENCES
1 A EUROCAT Working Group. 15 years of Surveillance of Congenital Anomalies in Europe 1980-1994 -Report 7 and Addendum. Brussels, Institute of Hygiene and Epidemiology, 1997: pp 10-149.
2 Demographic Review for the Maltese Islands for the years 1993 to 1997. Malta: Central Office of Statis-tics (Annual Publications).
3 British Paediatric Association Classification of Diseases. London, The British Paediatric Association,1979: pp 1-220.
4 EUROCAT Central Registry. EUROCAT Guide 1: Instructions for the Registration of Congenital Anoma-lies. Brussels, Department of Epidemiology, Catholic University of Louvain, 1990: pp 1-59.

Department of Health Information
______________________________________________________________________________89
_____________________________________________________________________________________
ANNEX 1 LOCAL REPORT FORM
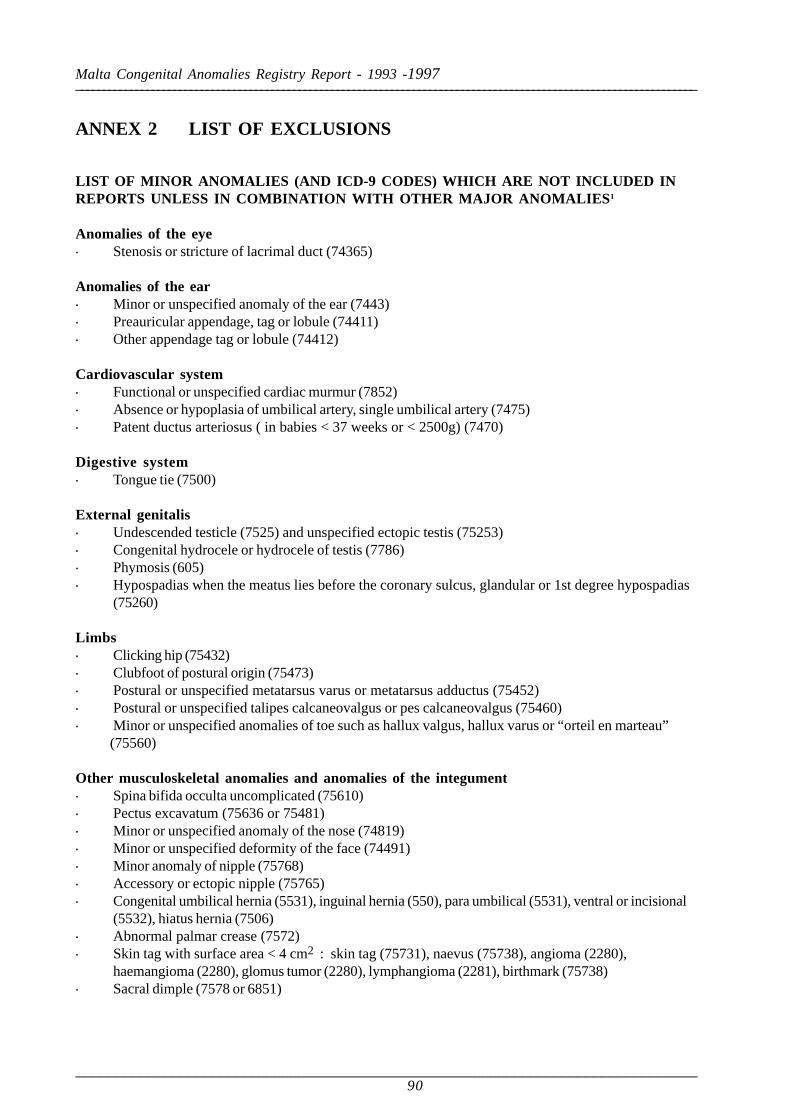
Malta Congenital Anomalies Registry Report - 1993 -1997
______________________________________________________________________________90
__________________________________________________________________________________________________________________
ANNEX 2 LIST OF EXCLUSIONS
LIST OF MINOR ANOMALIES (AND ICD-9 CODES) WHICH ARE NOT INCLUDED INREPORTS UNLESS IN COMBINATION WITH OTHER MAJOR ANOMALIES1
Anomalies of the eye· Stenosis or stricture of lacrimal duct (74365)
Anomalies of the ear· Minor or unspecified anomaly of the ear (7443)· Preauricular appendage, tag or lobule (74411)· Other appendage tag or lobule (74412)
Cardiovascular system· Functional or unspecified cardiac murmur (7852)· Absence or hypoplasia of umbilical artery, single umbilical artery (7475)· Patent ductus arteriosus ( in babies < 37 weeks or < 2500g) (7470)
Digestive system· Tongue tie (7500)
External genitalis· Undescended testicle (7525) and unspecified ectopic testis (75253)· Congenital hydrocele or hydrocele of testis (7786)· Phymosis (605)· Hypospadias when the meatus lies before the coronary sulcus, glandular or 1st degree hypospadias
(75260)
Limbs· Clicking hip (75432)· Clubfoot of postural origin (75473)· Postural or unspecified metatarsus varus or metatarsus adductus (75452)· Postural or unspecified talipes calcaneovalgus or pes calcaneovalgus (75460)· Minor or unspecified anomalies of toe such as hallux valgus, hallux varus or “orteil en marteau” (75560)
Other musculoskeletal anomalies and anomalies of the integument· Spina bifida occulta uncomplicated (75610)· Pectus excavatum (75636 or 75481)· Minor or unspecified anomaly of the nose (74819)· Minor or unspecified deformity of the face (74491)· Minor anomaly of nipple (75768)· Accessory or ectopic nipple (75765)· Congenital umbilical hernia (5531), inguinal hernia (550), para umbilical (5531), ventral or incisional
(5532), hiatus hernia (7506)· Abnormal palmar crease (7572)· Skin tag with surface area < 4 cm2 : skin tag (75731), naevus (75738), angioma (2280),
haemangioma (2280), glomus tumor (2280), lymphangioma (2281), birthmark (75738)· Sacral dimple (7578 or 6851)

Department of Health Information
______________________________________________________________________________91
_____________________________________________________________________________________
ANNEX 3 EUROCAT SUBGROUPS

Malta Congenital Anomalies Registry Report - 1993 -1997
______________________________________________________________________________92
__________________________________________________________________________________________________________________
ANNEX 4 EUROCAT REPORT FORM

Department of Health Information
______________________________________________________________________________93
_____________________________________________________________________________________
ANNEX 5 GEOGRAPHICAL REGIONS
GEOGRAPHICAL REGIONS ACCORDING TO DEPARTMENT OF HEALTH INFORMA-TION DIVISIONS

Malta Congenital Anomalies Registry Report - 1993 -1997
______________________________________________________________________________94
__________________________________________________________________________________________________________________