malnutrition ebd12
TRANSCRIPT
Environmental Burden of Disease Series, No. 12 Malnutrition Quantifying the health impact at national and local levels Monika Blössner Mercedes de Onis Series Editors Annette Prüss-Üstün, Diarmid Campbell-Lendrum, Carlos Corvalán, Alistair Woodward
World Health Organization Nutrition for Health and Development Protection of the Human Environment Geneva 2005
A Microsoft Excel spreadsheet for calculating the estimates described in this document can be obtained from WHO/PHE. E-mail contact: [email protected]
WHO Library Cataloguing-in-Publication Data Blössner, Monika.
Malnutrition : quantifying the health impact at national and local levels / Monika Blössner and Mercedes de Onis. (Environmental burden of disease series / series editors: Annette Prüss-Üstün ... [et al.] ; no. 12)
1.Malnutrition 2.Cost of illness 3. Child nutrition disorders - epidemiology 4.Maternal nutrition - epidemiology 5.Policy making 6.Risk assessment 7.Epidemiologic studies 8.Nepal I.Onis, Mercedes de II.Prüss-Üstün, Annette III.Title IV.Series.
ISBN 92 4 159187 0 (NLM classification: WS 115) ISSN 1728-1652 Suggested Citation Blössner, Monika, de Onis, Mercedes. Malnutrition: quantifying the health impact at national and local levels. Geneva, World Health Organization, 2005. (WHO Environmental Burden of Disease Series, No. 12).
© World Health Organization 2005
All rights reserved. Publications of the World Health Organization can be obtained from Marketing and Dissemination, World Health Organization, 20 Avenue Appia, 1211 Geneva 27, Switzerland (tel: +41 22 791 2476; fax: +41 22 791 4857; email: [email protected]). Requests for permission to reproduce or translate WHO publications – whether for sale or for noncommercial distribution – should be addressed to Marketing and Dissemination, at the above address (fax: +41 22 791 4806; email: [email protected]).
The designations employed and the presentation of the material in this publication do not imply the expression of any opinion whatsoever on the part of the World Health Organization concerning the legal status of any country, territory, city or area or of its authorities, or concerning the delimitation of its frontiers or boundaries. Dotted lines on maps represent approximate border lines for which there may not yet be full agreement.
The mention of specific companies or of certain manufacturers’ products does not imply that they are endorsed or recommended by the World Health Organization in preference to others of a similar nature that are not mentioned. Errors and omissions excepted, the names of proprietary products are distinguished by initial capital letters.
All reasonable precautions have been taken by WHO to verify the information contained in this publication. However, the published material is being distributed without warranty of any kind, either express or implied. The responsibility for the interpretation and use of the material lies with the reader. In no event shall the World Health Organization be liable for damages arising from its use.
The named authors alone are responsible for the views expressed in this publication.
Printed by the WHO Document Production Services, Geneva, Switzerland.
Malnutrition
iii
Table of contents Preface ........................................................................................................................ v
Affiliations and acknowledgements ..................................................................................... vi
Glossary and abbreviations.................................................................................................. vii
Summary ..................................................................................................................... viii
1. Introduction.................................................................................................................... 1
1.1 What is malnutrition?........................................................................................ 1 1.2 Malnutrition in women and children................................................................. 1 1.3 Malnutrition and child growth .......................................................................... 3 1.4 Why measure the disease burden of malnutrition? ........................................... 4
2. Dose−response relationships.......................................................................................... 5
2.1 Child malnutrition............................................................................................. 7 2.2 Maternal malnutrition ....................................................................................... 8
3. Estimating the burden of disease and mortality associated with malnutrition............... 9
3.1 Summary of the method.................................................................................... 9 3.2 Step 1: assess exposure ................................................................................... 13 3.3 Step 2: calculate the percentages of children severely, moderately and
mildly malnourished ....................................................................................... 18 3.4 Step 3: calculate the attributable fractions for child mortality using
relative risk estimates...................................................................................... 19 3.5 Step 4: calculate the attributable fractions for child morbidity using
relative risk estimates...................................................................................... 21 3.6 Step 5: calculate the percentage of IUGR-LBW children from the
percentage of LBW children ........................................................................... 21 3.7 Step 6: calculate the percentage of women with low pre-pregnancy BMI
(< 20 kg/m2 ) ................................................................................................... 22 3.8 Step 7: calculate the attributable fraction of IUGR due to low BMI from
the odds ratio for IUGR and the percentage of women with low pre-pregnancy BMI ............................................................................................... 23
3.9 Step 8: calculate the attributable fraction of neonatal deaths due to IUGR-LBW by applying a risk ratio of 6.0 to the estimated incidence of IUGR-LBW................................................................................................................ 23
3.10 Step 9: multiply the attributable fractions from Steps 7 and 8........................ 24 3.11 Steps 10 and 11: calculate the total burden of underweight............................ 24
4. Uncertainty .................................................................................................................. 26
5. Calculating the burden of disease for child malnutrition in Nepal: a numerical example .................................................................................................... 27
6. Policy action ................................................................................................................ 34
References ...................................................................................................................... 35
Annex 1 Summary results of the global assessment of the disease burden from malnutrition..................................................................................................... 39
Malnutrition
iv
List of Tables Table 3.1 Relative risks and 95% confidence intervals for mortality associated
with low weight-for-age, by severity and cause of death ............................. 20 Table 3.2 Relative risk of morbidity associated with child weight-for-age below -2
SD from the NCHS/WHO reference median................................................ 21 Table 5.1 Underweight in children younger than five years......................................... 28 Table 5.2 Population attributable fractions for cause-specific mortality associated
with underweight in children 0−4 years of age............................................. 28 Table 5.3 Population attributable fractions for cause-specific morbidity associated
with underweight in children 0−4 years of age............................................. 29 Table 5.4 Percentage of IUGR-LBW children.............................................................. 29 Table 5.5 Women of reproductive age with a BMI below 20 kg/m2 ............................ 29 Table 5.6 Population attributable fraction of IUGR due to low BMI for females of
reproductive age, by age group.................................................................... 30 Table 5.7 Population attributable fractions of neonatal deaths due to IUGR for
females of reproductive age, by age group .................................................. 30 Table 5.8 Population attributable fractions of neonatal deaths due to low maternal
BMI............................................................................................................... 31 Table 5.9 Total burden associated with child and maternal underweight .................... 32 Table A1 Country groupings for the assessment of the global disease burden, by WHO subregion............................................................................................ 40 Table A2 Proportion of children younger than five years with weight-for-age
below -2 SD from the reference median ....................................................... 41 Table A3 Mortality and DALYs attributable to underweight in children, by WHO
subregion....................................................................................................... 42 Table A4 Selected population attributable fractions for malnutrition, by disease
and sex .......................................................................................................... 42 Table A5 Attributable mortality and DALYs from malnutrition, by sex ..................... 43 List of Figures Figure 1.1 Causal framework for child malnutrition........................................................ 2 Figure 1.2 Proportional mortality in children younger than five years old ...................... 3 Figure 2.1 Child mortality for selected diseases, by level of malnutrition....................... 5 Figure 2.2 Predicted mean ages for motor development milestones as a function of
level of malnutrition (weight-for-age) ............................................................ 6 Figure 2.3 Deviation from sex-specific mean literacy rates as a function of the level
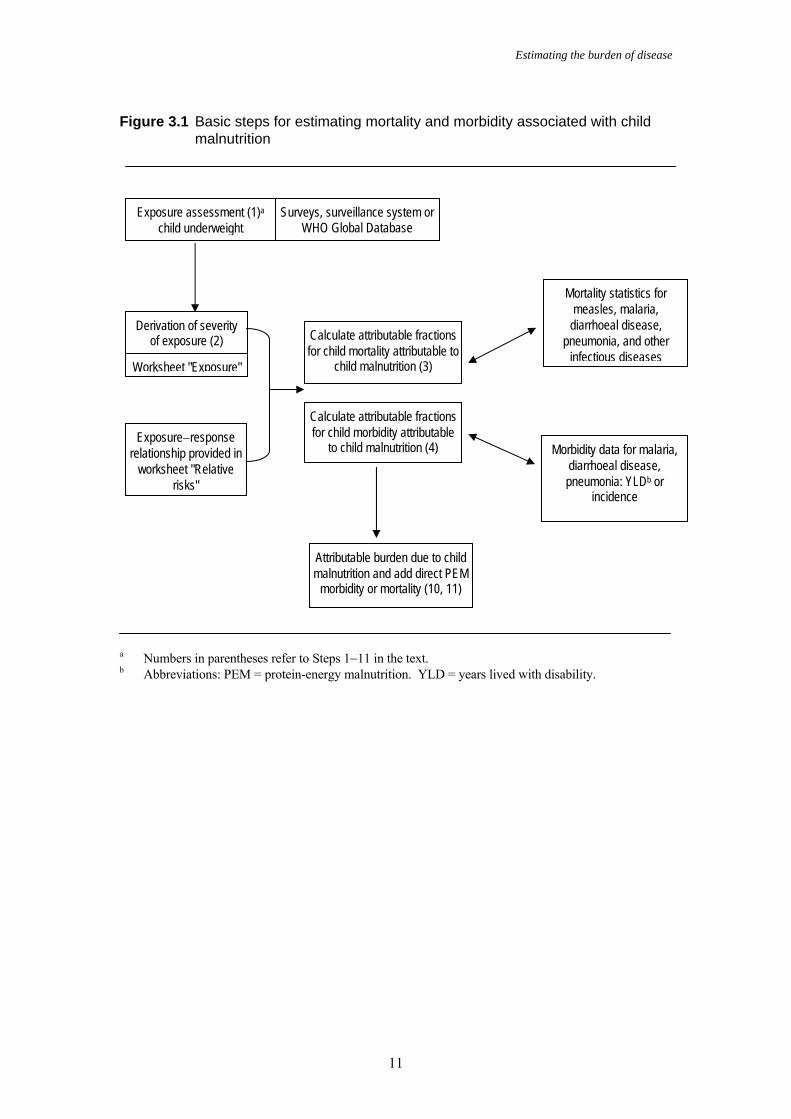
of malnutrition ................................................................................................ 6 Figure 3.1 Basic steps for estimating mortality and morbidity associated with child
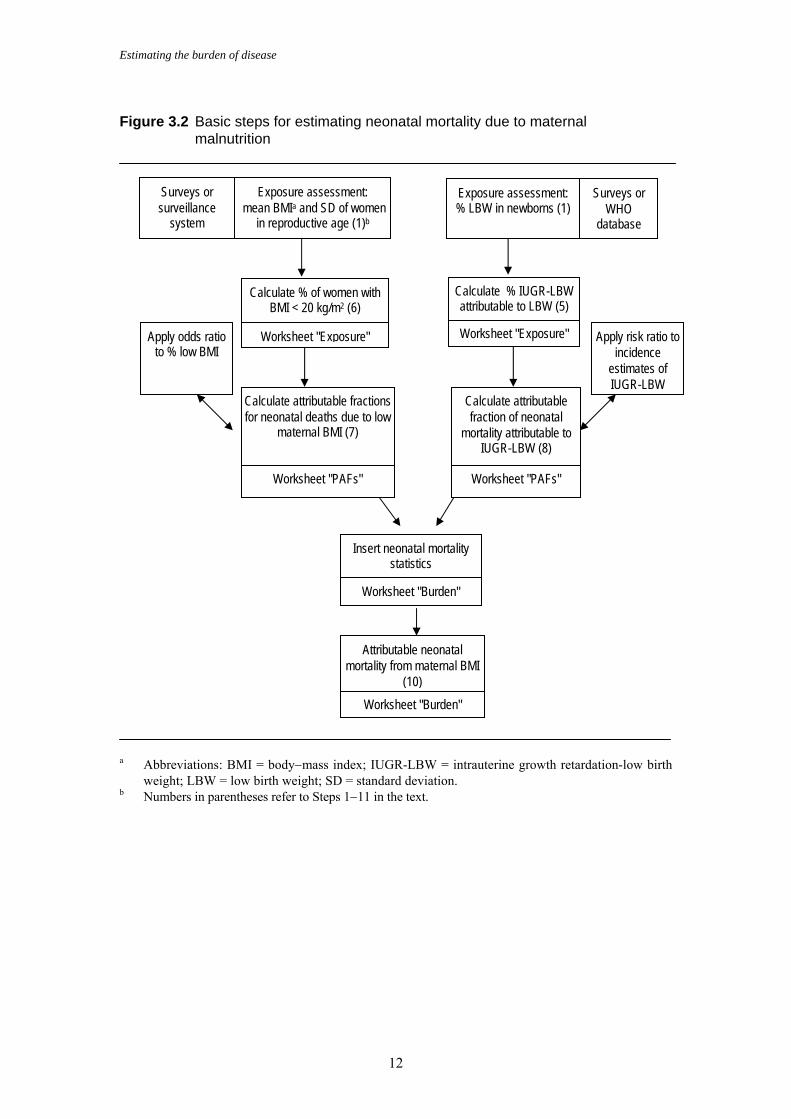
malnutrition................................................................................................... 11 Figure 3.2 Basic steps for estimating neonatal mortality due to maternal
malnutrition................................................................................................... 12 Figure 3.3 Normal distribution of child growth for the NCHS/WHO reference
population...................................................................................................... 18 Figure A1 Subregional country groupings for the global disease burden ................... 39
Malnutrition
v
Preface The disease burden of a population, and how that burden is distributed across different subpopulations (e.g. infants, women), are important pieces of information for defining strategies to improve population health. For policy-makers, disease burden estimates provide an indication of the health gains that could be achieved by targeted action against specific risk factors. The measures also allow policy-makers to prioritize actions and direct them to the population groups at highest risk. To help provide a reliable source of information for policy-makers, WHO recently analysed 26 risk factors worldwide in the World Health Report (WHO, 2002). The Environmental Burden of Disease (EBD) series continues this effort to generate reliable information by presenting methods for assessing the burden of disease related to the environment at national and local levels. The methods in the series use the general framework for global assessments described in the World Health Report (WHO, 2002). The introductory volume in the series outlines the general method (Prüss-Üstün et al., 2003), while subsequent volumes address specific environmental risk factors. The guides on specific risk factors are organized similarly, first outlining the evidence linking the risk factor to health, and then describing a method for estimating the health impact of that risk factor on a population. All the guides take a practical, step-by-step approach and use numerical examples. The methods described in the guides can be adapted both to local and national levels, and can be tailored to suit data availability. In the present volume, we describe how to estimate the burden of malnutrition at national and local levels, using the framework described in the World Health Report. Estimates of the burden of malnutrition at global level have already been published (WHO, 2002; Fishman, 2004) and are summarized in Annex 1 of this guide. Unlike other risk factors addressed in the EBD series, malnutrition is only partly linked to the environment. Nevertheless, the environment can affect the nutritional status of individuals in several ways. Vector-borne diseases that cause diarrhoea, for example, are strongly influenced by the environment and they can undermine the ability of an individual to obtain adequate nutrition. This can be a particular problem for people living in poverty, who may already be undernourished. Malnutrition, in turn, can reinforce poverty and lead to unsustainable resource use and environmental degradation (WEHAB, 2002). Adverse environmental conditions, such as environmental contamination, destruction of ecosystems, loss of biodiversity, climate change and globalization can also affect the nutritional status of populations (Johns & Eyzaguirre, 2000). The effects of climate change on malnutrition are addressed in another volume of the EBD series.
Malnutrition
vi
Affiliations and acknowledgements This guide was prepared by Monika Blössner and Mercedes de Onis, and edited by Annette Prüss-Üstün, Diarmid Campbell-Lendrum, Carlos Corvalán and Alistair Woodward. Monika Blössner, Mercedes de Onis, Annette Prüss-Üstün, Diarmid Campbell-Lendrum and Carlos Corvalán are at the World Health Organization. Alistair Woodward is at the School of Population Health, University of Auckland, New Zealand. In preparing this guide, we drew on the methods developed for estimating the global burden of disease caused by malnutrition. We therefore thank the reviewers of that analysis. We also thank the United States of America Environmental Protection Agency for supporting the development of the approaches used in the EBD series. The present report has not been subjected to agency review and therefore does not necessarily reflect the views of the agency. Finally, we are grateful to Kevin Farrell and Eileen Brown who put this document into its final format.
Malnutrition
vii
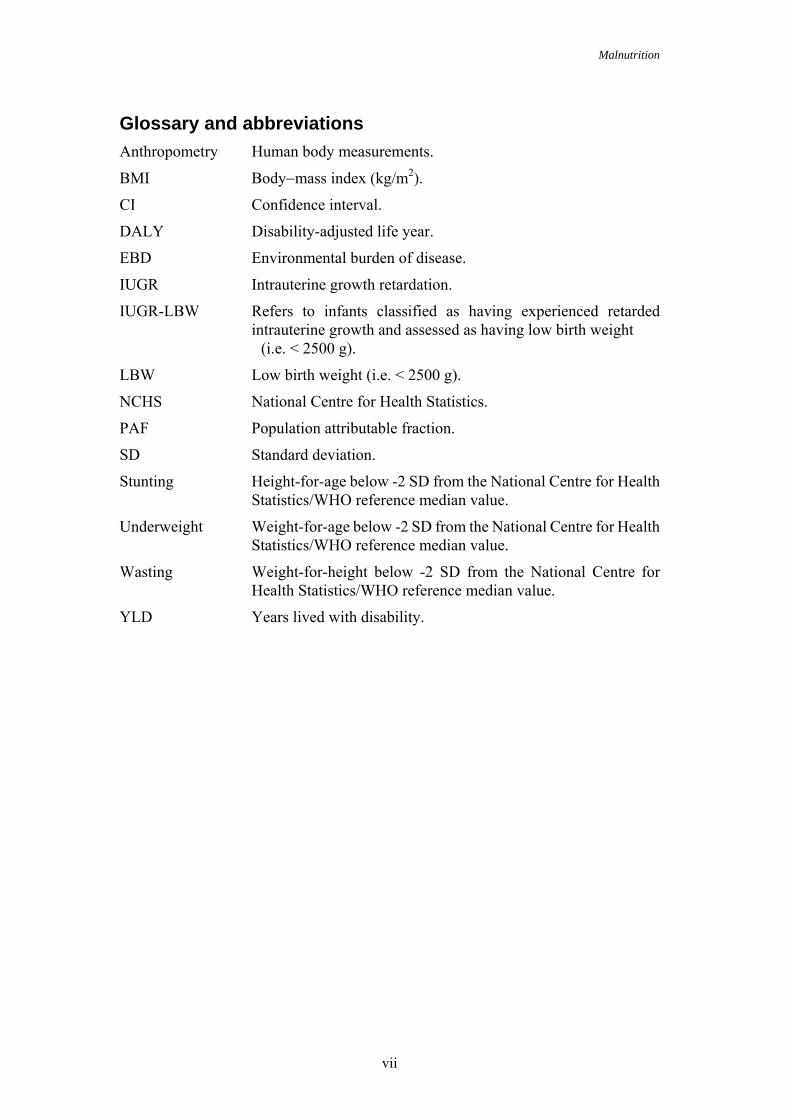
Glossary and abbreviations Anthropometry Human body measurements.
BMI Body−mass index (kg/m2).
CI Confidence interval.
DALY Disability-adjusted life year.
EBD Environmental burden of disease.
IUGR Intrauterine growth retardation.
IUGR-LBW Refers to infants classified as having experienced retarded intrauterine growth and assessed as having low birth weight
(i.e. < 2500 g).
LBW Low birth weight (i.e. < 2500 g).
NCHS National Centre for Health Statistics.
PAF Population attributable fraction.
SD Standard deviation.
Stunting Height-for-age below -2 SD from the National Centre for Health Statistics/WHO reference median value.
Underweight Weight-for-age below -2 SD from the National Centre for Health Statistics/WHO reference median value.
Wasting Weight-for-height below -2 SD from the National Centre for Health Statistics/WHO reference median value.
YLD Years lived with disability.
Malnutrition
viii
Summary Malnutrition, defined as underweight, is a serious public-health problem that has been linked to a substantial increase in the risk of mortality and morbidity. Women and young children bear the brunt of the disease burden associated with malnutrition. In Africa and south Asia, 27−51% of women of reproductive age are underweight (ACC/SCN, 2000), and it is predicted that about 130 million children will be underweight in 2005 (21% of all children) (de Onis et al., 2004a). Many of the 30 million low-birth-weight babies born annually (23.8% of all births) face severe short-term and long-term health consequences (de Onis, Blössner & Villar, 1998). In this guide we outline a method for estimating the disease burden at national or local level that is associated with maternal and child malnutrition. The goal is to help policy-makers and others quantify the increased risk associated with malnutrition, in terms of attributable mortality and morbidity, at country or local levels. The estimates will allow policy-makers to compare the disease burden of malnutrition for different countries, or regions within countries, and enable resources to be deployed more effectively. Repeated assessments will also allow trends to be monitored and the impact of interventions to be evaluated. To quantify the disease burden, population attributable fractions are derived from the assessed exposure (malnutrition) and from the relative risk estimates of disease and death associated with malnutrition. The level of malnutrition in the population groups is assessed by anthropometry (i.e. measurements of body size and composition), using as indicators low birth weight in newborns, low weight-for-age in preschool children, and low body mass index in women. Relative risk estimates for diarrhoea, malaria, measles, acute respiratory infections and other infectious diseases are based on a meta-analysis that was part of a global comparative risk assessment project conducted by the World Health Organization (WHO) and its partners. Checklists for collecting and analysing data are also suggested, and a step-by-step example of how to quantify the health impact associated with malnutrition is given for Nepal, a country in the WHO SEAR D subregion. Estimates of the disease burden of malnutrition give policy-makers an indication of the burden that could be avoided if malnutrition were to be eliminated. Disaggregated estimates (e.g. by age, sex, degree of malnutrition) can also help policy-makers identify the segments of a population most at risk, such as women and children, and direct resources where they will have the greatest effect. Although it is difficult to assess the avoidable burden because of the uncertainties around estimates of risk factors and disease burdens, the importance of the avoidable burden for policy-making justifies the effort (WHO, 2002).
Introduction
1
1. Introduction 1.1 What is malnutrition?
The term malnutrition generally refers both to undernutrition and overnutrition, but in this guide we use the term to refer solely to a deficiency of nutrition. Many factors can cause malnutrition, most of which relate to poor diet or severe and repeated infections, particularly in underprivileged populations. Inadequate diet and disease, in turn, are closely linked to the general standard of living, the environmental conditions, and whether a population is able to meet its basic needs such as food, housing and health care. Malnutrition is thus a health outcome as well as a risk factor for disease and exacerbated malnutrition (Fig. 1.1), and it can increase the risk both of morbidity and mortality. Although it is rarely the direct cause of death (except in extreme situations, such as famine), child malnutrition was associated with 54% of child deaths (10.8 million children) in developing countries in 2001 (Fig. 1.2; see also WHO, 2004). Malnutrition that is the direct cause of death is referred to as “protein-energy malnutrition” in this guide. Nutritional status is clearly compromised by diseases with an environmental component, such as those carried by insect or protozoan vectors, or those caused by an environment deficient in micronutrients. But the effects of adverse environmental conditions on nutritional status are even more pervasive. Environmental contamination (e.g. destruction of ecosystems, loss of biodiversity, climate change, and the effects of globalization) has contributed to an increasing number of health hazards (Johns & Eyzaguirre, 2000), and all affect nutritional status. Overpopulation, too, is a breakdown of the ecological balance in which the population may exceed the carrying capacity of the environment. This then undermines food production, which leads to inadequate food intake and/or the consumption of non-nutritious food, and thus to malnutrition. On the other hand, malnutrition itself can have far-reaching impacts on the environment, and can induce a cycle leading to additional health problems and deprivation. For example, malnutrition can create and perpetuate poverty, which triggers a cycle that hampers economic and social development, and contributes to unsustainable resource use and environmental degradation (WEHAB, 2002). Breaking the cycle of continuing poverty and environmental deterioration is a prerequisite for sustainable development and survival. 1.2 Malnutrition in women and children
The nutritional status of women and children is particularly important, because it is through women and their off-spring that the pernicious effects of malnutrition are propagated to future generations. A malnourished mother is likely to give birth to a low-birth-weight (LBW) baby susceptible to disease and premature death, which only further undermines the economic development of the family and society, and continues the cycle of poverty and malnutrition. Although child malnutrition declined globally during the 1990s, with the prevalence of underweight children falling from 27% to 22% (de Onis et al., 2004a), national levels of malnutrition still vary considerably (0% in Australia; 49% in Afghanistan)(WHO, 2003). The largest decline in the level of child malnutrition was in
Introduction
2
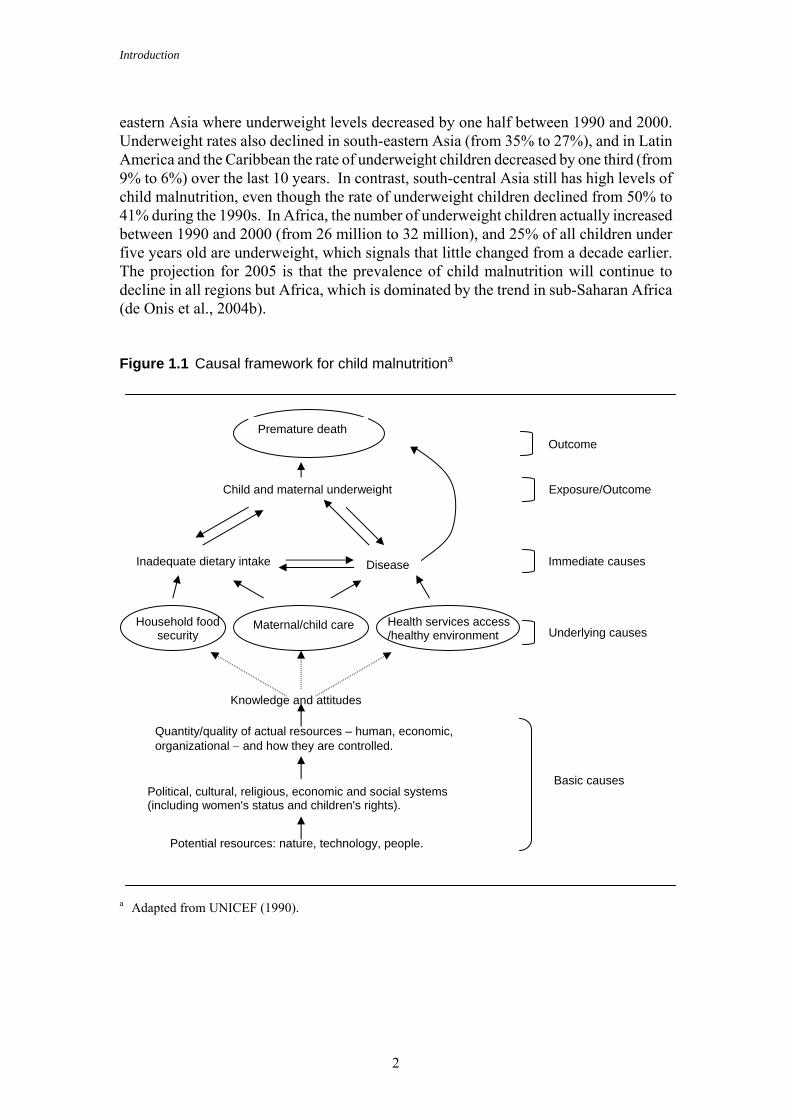
eastern Asia where underweight levels decreased by one half between 1990 and 2000. Underweight rates also declined in south-eastern Asia (from 35% to 27%), and in Latin America and the Caribbean the rate of underweight children decreased by one third (from 9% to 6%) over the last 10 years. In contrast, south-central Asia still has high levels of child malnutrition, even though the rate of underweight children declined from 50% to 41% during the 1990s. In Africa, the number of underweight children actually increased between 1990 and 2000 (from 26 million to 32 million), and 25% of all children under five years old are underweight, which signals that little changed from a decade earlier. The projection for 2005 is that the prevalence of child malnutrition will continue to decline in all regions but Africa, which is dominated by the trend in sub-Saharan Africa (de Onis et al., 2004b). Figure 1.1 Causal framework for child malnutritiona
a Adapted from UNICEF (1990).
Child and maternal underweight
Inadequate dietary intake Disease
Household food security Maternal/child care Health services access
/healthy environment
Potential resources: nature, technology, people.
Political, cultural, religious, economic and social systems (including women's status and children's rights).
Premature deathOutcome
Immediate causes
Basic causes
Quantity/quality of actual resources – human, economic, organizational − and how they are controlled.
Knowledge and attitudes
Exposure/Outcome
Underlying causes
Introduction
3
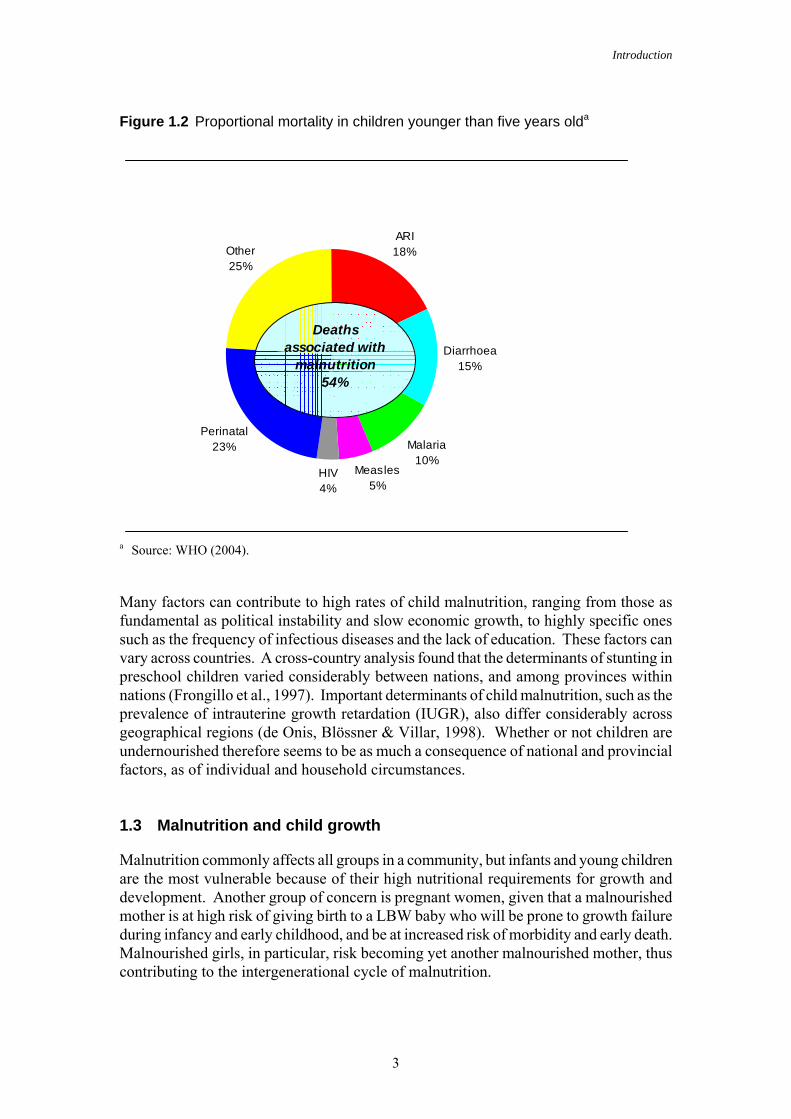
Figure 1.2 Proportional mortality in children younger than five years olda
ARI18%
Diarrhoea15%
Malaria10%
Measles5%
HIV4%
Perinatal23%
Other25%
Deaths associated with
malnutrition 54%
a Source: WHO (2004).
Many factors can contribute to high rates of child malnutrition, ranging from those as fundamental as political instability and slow economic growth, to highly specific ones such as the frequency of infectious diseases and the lack of education. These factors can vary across countries. A cross-country analysis found that the determinants of stunting in preschool children varied considerably between nations, and among provinces within nations (Frongillo et al., 1997). Important determinants of child malnutrition, such as the prevalence of intrauterine growth retardation (IUGR), also differ considerably across geographical regions (de Onis, Blössner & Villar, 1998). Whether or not children are undernourished therefore seems to be as much a consequence of national and provincial factors, as of individual and household circumstances. 1.3 Malnutrition and child growth
Malnutrition commonly affects all groups in a community, but infants and young children are the most vulnerable because of their high nutritional requirements for growth and development. Another group of concern is pregnant women, given that a malnourished mother is at high risk of giving birth to a LBW baby who will be prone to growth failure during infancy and early childhood, and be at increased risk of morbidity and early death. Malnourished girls, in particular, risk becoming yet another malnourished mother, thus contributing to the intergenerational cycle of malnutrition.
Introduction
4
In developing countries, poor perinatal conditions are responsible for approximately 23% of all deaths among children younger than five years old (Fig. 1.2). These deaths are concentrated in the neonatal period (i.e. the first 28 days after birth), and most are attributable to LBW (Kramer, 1987). LBW can be a consequence of IUGR, preterm birth, or both, but in developing countries most LBW births are due to IUGR (defined as below the tenth percentile of the Williams sex-specific weight-for-gestational age reference data). Although the etiology of IUGR is complex, a major determinant of IUGR in developing countries is maternal undernutrition. Evidence has shown that there is a greater incidence of IUGR births among women who are underweight or stunted prior to conception, or who fail to gain sufficient weight during pregnancy (Kramer, 1987; King & Weininger, 1989; WHO, 1995a; Bakketeig et al., 1998), compared to women with normal weight and weight gain. Growth assessment is the single measurement that best defines the health and nutritional status of a child, because disturbances in health and nutrition, regardless of their etiology, invariably affect child growth. There is ample evidence that the growth (height and weight) of well-fed, healthy children from different ethnic backgrounds and different continents is remarkably similar, at least up to six years of age (Habicht et al., 1974). Based on this finding, WHO has been recommending that a single international reference population be used worldwide, with common indicators and cut-offs, and that standard methods be used to analyse child growth data (Waterlow et al., 1977; WHO, 1995a). Moreover, growth assessment is universally applicable: it does not pose any cultural problems; measuring equipment is easy to transport; the tools are simple and robust, can be set up in any environment; users require little training; and the procedure is inexpensive and non-invasive (WHO, 1995a). 1.4 Why measure the disease burden of malnutrition?
National estimates of the burden of malnutrition, including estimates for child malnutrition, provide vital information on preventable ill-health, and indicate the health gains possible from interventions to prevent the risk factor (malnutrition, in this guide). The results also allow policy-makers to direct resources to the most vulnerable segments of the population, and thus make better use of resources. Methods for estimating the burden of malnutrition associated with poverty are outlined in the tenth volume of the EBD series (Blakely, Hales & Woodward, 2004). To illustrate how to calculate the national burden of malnutrition, we give a step-by-step numerical example for child malnutrition in Nepal, a developing country in the WHO SEAR D subregion. For a complete listing of countries by WHO subregions see Table A1 in the annex. The disease burden is estimated in terms of the mortality and morbidity associated with the principal causes of child death, i.e. diarrhoea, acute respiratory infections, measles, malaria, and perinatal risk factors; and with protein-energy malnutrition as a direct cause of death, and mortality associated with other infectious diseases.
Dose-response relationships
5
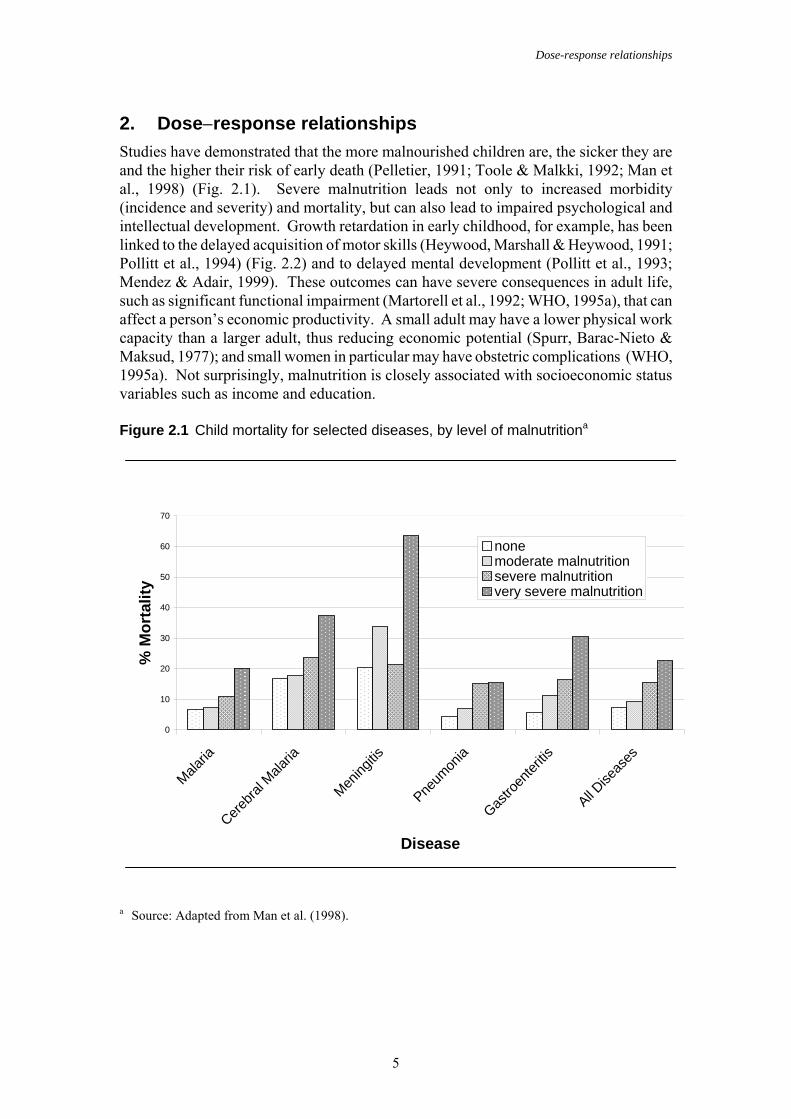
2. Dose−response relationships Studies have demonstrated that the more malnourished children are, the sicker they are and the higher their risk of early death (Pelletier, 1991; Toole & Malkki, 1992; Man et al., 1998) (Fig. 2.1). Severe malnutrition leads not only to increased morbidity (incidence and severity) and mortality, but can also lead to impaired psychological and intellectual development. Growth retardation in early childhood, for example, has been linked to the delayed acquisition of motor skills (Heywood, Marshall & Heywood, 1991; Pollitt et al., 1994) (Fig. 2.2) and to delayed mental development (Pollitt et al., 1993; Mendez & Adair, 1999). These outcomes can have severe consequences in adult life, such as significant functional impairment (Martorell et al., 1992; WHO, 1995a), that can affect a person’s economic productivity. A small adult may have a lower physical work capacity than a larger adult, thus reducing economic potential (Spurr, Barac-Nieto & Maksud, 1977); and small women in particular may have obstetric complications (WHO, 1995a). Not surprisingly, malnutrition is closely associated with socioeconomic status variables such as income and education. Figure 2.1 Child mortality for selected diseases, by level of malnutritiona
0
10
20
30
40
50
60
70
Malaria
Cerebra
l Mala
ria
Mening
itis
Pneum
onia
Gastro
enter
itis
All Dise
ases
Disease
% M
orta
lity
nonemoderate malnutritionsevere malnutritionvery severe malnutrition
a Source: Adapted from Man et al. (1998).
Dose-response relationships
6
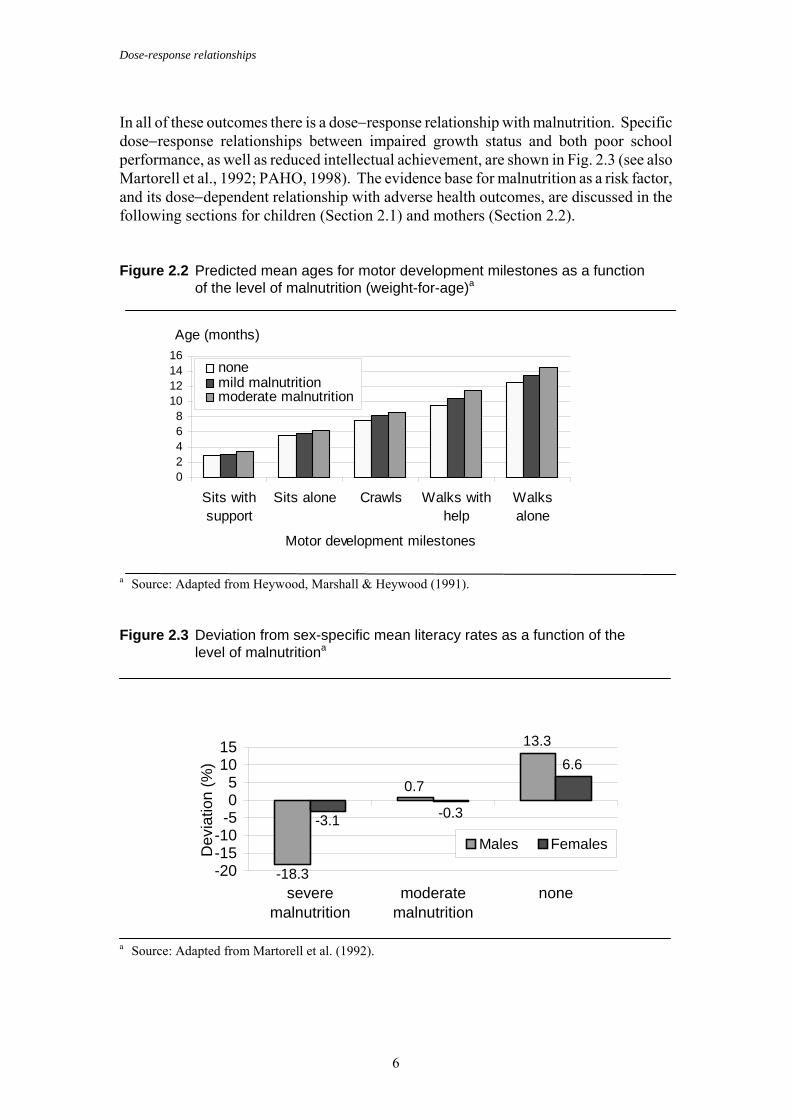
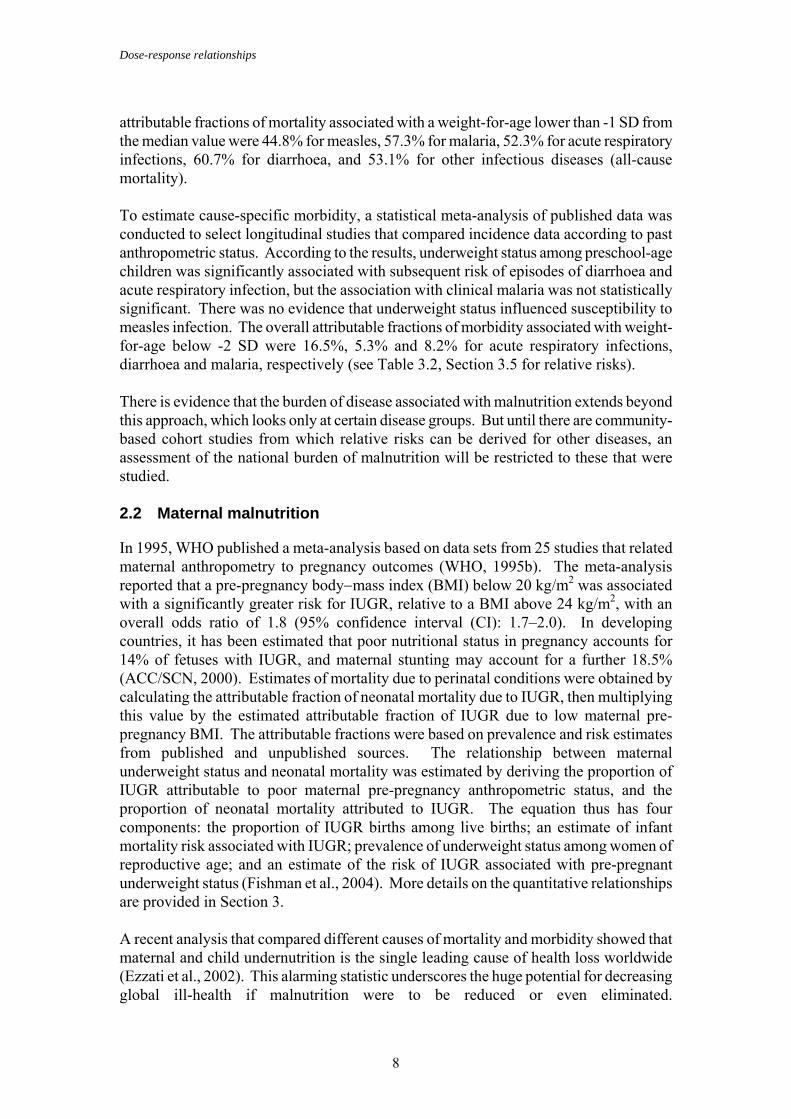
In all of these outcomes there is a dose−response relationship with malnutrition. Specific dose−response relationships between impaired growth status and both poor school performance, as well as reduced intellectual achievement, are shown in Fig. 2.3 (see also Martorell et al., 1992; PAHO, 1998). The evidence base for malnutrition as a risk factor, and its dose−dependent relationship with adverse health outcomes, are discussed in the following sections for children (Section 2.1) and mothers (Section 2.2). Figure 2.2 Predicted mean ages for motor development milestones as a function of the level of malnutrition (weight-for-age)a
02468
10121416
Sits withsupport
Sits alone Crawls Walks withhelp
Walksalone
Motor development milestones
Age (months)
nonemild malnutritionmoderate malnutrition
a Source: Adapted from Heywood, Marshall & Heywood (1991). Figure 2.3 Deviation from sex-specific mean literacy rates as a function of the level of malnutritiona
a Source: Adapted from Martorell et al. (1992).
13.3
0.7
-18.3
6.6
-0.3-3.1
-20-15-10-505
1015
severemalnutrition
moderatemalnutrition
none
Dev
iatio
n (%
)
Males Females

Dose-response relationships
7
2.1 Child malnutrition
Even though it has long been recognized that malnutrition is associated with mortality among children (Trowell, 1948; Gomez et al., 1956), a formal assessment of the impact of malnutrition as a risk factor was only recently carried out. In the early 1990s, results of the first epidemiological study on malnutrition showed that malnutrition potentiated the effects of infectious diseases on child mortality at population level (Pelletier, Frongillo & Habicht, 1993), a result that up until then had only been observed clinically. The methodology was based on the results of eight community-based prospective studies that looked at the relationship between anthropometry and child mortality in developing countries (Pelletier et al., 1994). The literature review used to select the eight studies was published separately (Pelletier, 1994). The results of the eight studies were consistent in showing that the risk of mortality was inversely related to weight-for-age, and that there was an elevated risk even at mild-to-moderate levels of malnutrition. In fact, most malnutrition-related deaths were associated with mild-to-moderate, rather than severe, malnutrition, because the mild-to-moderately malnourished population was much bigger than the severely malnourished population. The study also confirmed that malnutrition has a multiplicative effect on mortality. Taking into account all underlying causes of death, the results suggested that malnutrition was an associated cause in about one half of all child deaths in developing countries. From a national policy perspective, however, the epidemiological study had a limitation: the global estimate of malnutrition-associated mortality could not be applied to countries with distinct disease profiles. To fill this gap, a joint WHO/Johns Hopkins University working group was set up to estimate the contribution of malnutrition to cause-specific mortality in children. The first step was a literature review to collect data for estimating the relationship between malnutrition and mortality from diarrhoea, acute respiratory infections, malaria and measles (Rice et al., 2000). Cause-specific mortality was estimated by applying the method of Pelletier et al. (1994) to the data of 10 cohort studies that contained weight-for-age categories and cause-of-death information. The weight-for-age categories were based on the number of standard deviations (SDs) from the median value of the National Centre for Health Statistics (NCHS)/WHO international reference population (< -3 SD; -3 SD to < -2 SD; -2 SD to < -1 SD; and > -1 SD). All the included studies contributed information on weight-for-age and risk of diarrhoea, malaria, measles, acute respiratory infections and all-cause mortality (comprising other remaining infectious diseases besides HIV). These other infectious diseases include: tuberculosis, sexually transmitted disease excluding HIV, pertussis, poliomyelitis, diphtheria, tetanus, meningitis, hepatitis B and C, tropical-cluster diseases, leprosy, dengue, Japanese encephalitis, trachoma, intestinal nematode infections, upper respiratory infections and otitis media. By including these other infectious diseases, the burden estimates take into account, for example,malnutrition associated effects on immune system and consequent worsened prognosis of disease development. The relationship between weight-for-age and risk of death was estimated by calculating the logarithms of the mortality rates by cause and by anthropometric status for each country, and using weighted random effects models. Using these models, the working group derived the relative risks of dying for each cause and all causes. The detailed relative risks are provided in Table 3.1, Section 3.4. The
Dose-response relationships
8
attributable fractions of mortality associated with a weight-for-age lower than -1 SD from the median value were 44.8% for measles, 57.3% for malaria, 52.3% for acute respiratory infections, 60.7% for diarrhoea, and 53.1% for other infectious diseases (all-cause mortality). To estimate cause-specific morbidity, a statistical meta-analysis of published data was conducted to select longitudinal studies that compared incidence data according to past anthropometric status. According to the results, underweight status among preschool-age children was significantly associated with subsequent risk of episodes of diarrhoea and acute respiratory infection, but the association with clinical malaria was not statistically significant. There was no evidence that underweight status influenced susceptibility to measles infection. The overall attributable fractions of morbidity associated with weight-for-age below -2 SD were 16.5%, 5.3% and 8.2% for acute respiratory infections, diarrhoea and malaria, respectively (see Table 3.2, Section 3.5 for relative risks). There is evidence that the burden of disease associated with malnutrition extends beyond this approach, which looks only at certain disease groups. But until there are community-based cohort studies from which relative risks can be derived for other diseases, an assessment of the national burden of malnutrition will be restricted to these that were studied. 2.2 Maternal malnutrition
In 1995, WHO published a meta-analysis based on data sets from 25 studies that related maternal anthropometry to pregnancy outcomes (WHO, 1995b). The meta-analysis reported that a pre-pregnancy body−mass index (BMI) below 20 kg/m2 was associated with a significantly greater risk for IUGR, relative to a BMI above 24 kg/m2, with an overall odds ratio of 1.8 (95% confidence interval (CI): 1.7–2.0). In developing countries, it has been estimated that poor nutritional status in pregnancy accounts for 14% of fetuses with IUGR, and maternal stunting may account for a further 18.5% (ACC/SCN, 2000). Estimates of mortality due to perinatal conditions were obtained by calculating the attributable fraction of neonatal mortality due to IUGR, then multiplying this value by the estimated attributable fraction of IUGR due to low maternal pre-pregnancy BMI. The attributable fractions were based on prevalence and risk estimates from published and unpublished sources. The relationship between maternal underweight status and neonatal mortality was estimated by deriving the proportion of IUGR attributable to poor maternal pre-pregnancy anthropometric status, and the proportion of neonatal mortality attributed to IUGR. The equation thus has four components: the proportion of IUGR births among live births; an estimate of infant mortality risk associated with IUGR; prevalence of underweight status among women of reproductive age; and an estimate of the risk of IUGR associated with pre-pregnant underweight status (Fishman et al., 2004). More details on the quantitative relationships are provided in Section 3. A recent analysis that compared different causes of mortality and morbidity showed that maternal and child undernutrition is the single leading cause of health loss worldwide (Ezzati et al., 2002). This alarming statistic underscores the huge potential for decreasing global ill-health if malnutrition were to be reduced or even eliminated.
Estimating the burden of disease
9
3. Estimating the burden of disease and mortality associated with malnutrition
3.1 Summary of the method
To obtain an estimate of the burden of disease associated with malnutrition, in terms of deaths and morbidity, the severity of malnutrition status in the population is first determined, from which the attributable fractions can be calculated. The attributable fractions can then be applied to the health statistics. To assist with the calculations, a spreadsheet, Assessing burden due to malnutrition, has been developed by the WHO Department of Nutrition, which can be obtained at [email protected]. This approach is summarized in the following Steps 1−11 (see also Figures 3.1 and 3.2). Some of the steps refer to specific worksheets in the WHO spreadsheet, Assessing burden due to malnutrition. Step 1 Assess exposure in the study population (by population-based surveys or
surveillance systems) in terms of:
− the percentage of children younger than five years of age who have low weight-for-age compared to the median of the NCHS/WHO international growth reference
− the percentage of LBW newborns
− the mean and SD of the BMI for women 15−44 years old.
Step 2 Derive the percentages of children who are severely, moderately and mildly malnourished (i.e. the percentages in the SD cut-off intervals: < -3 SD; -3 SD to < -2 SD; -2 SD to < -1 SD, respectively). This is done by estimation, using the worksheet “Exposure”.
Step 3 Derive the attributable fractions for child mortality by estimation. Use the worksheet labelled “PAFs”, and the worksheet “Mortality”. The fixed relative risk values are included in the worksheet “Relative risks”.
Step 4 Derive the attributable fractions for child morbidity by estimation. Use the sheet labelled “PAFs”, and the worksheet “Morbidity”. The fixed relative risk values are included in the worksheet “Relative risks”.
Step 5 Estimate the percentage of children classified as having had intrauterine growth retardation and a low birth weight (IUGR-LBW), using the percentage of LBW children (birth weight < 2500 g) in the equation included in the worksheet “Exposure”.
Step 6 Estimate the percentage of women with low pre-pregnancy BMI (< 20 kg/m2), using the worksheet “Exposure”.
Step 7 Derive the attributable fraction of children with IUGR attributable to low BMI. This is done in the worksheets “Relative risks” and “PAFs”. Apply an odds ratio of 1.8 for IUGR to the percentage of women with low pre-pregnancy BMI.
Estimating the burden of disease
10
Step 8 Estimate the attributable fractions of neonatal deaths due to IUGR-LBW by applying a risk ratio of 6.0 (in the worksheet “Relative risks”) to the incidence estimate of IUBR-LBW in the worksheet “PAFs”.
Step 9 Obtain the total attributable fractions of neonatal deaths due to low maternal BMI by multiplying the attributable fractions from Steps 7 and 8, using the worksheet “PAFs”.
Step 10 Derive the total mortality burden due to malnutrition by multiplying the attributable fractions by the total cause-specific mortality rate for under-five year-olds in the worksheet “Burden”. Add to this figure the available estimate on direct mortality from protein-energy malnutrition.
Step 11 Derive the total morbidity burden due to malnutrition by multiplying the attributable fractions by the total cause-specific morbidity incidence for under-five year-olds in the worksheet “Burden”. Add to this figure direct estimates of morbidity due to protein-energy malnutrition, using local or national statistics.
These steps are described in more detail in the following Sections 3.2−3.11.
Estimating the burden of disease
11
Figure 3.1 Basic steps for estimating mortality and morbidity associated with child malnutrition
a Numbers in parentheses refer to Steps 1−11 in the text. b Abbreviations: PEM = protein-energy malnutrition. YLD = years lived with disability.
Derivation of severity of exposure (2)
Exposure−response relationship provided in
worksheet "Relative risks"
Calculate attributable fractions for child mortality attributable to
child malnutrition (3)
Mortality statistics for measles, malaria,
diarrhoeal disease, pneumonia, and other
infectious diseases
Surveys, surveillance system or WHO Global Database
Worksheet "Exposure"
Calculate attributable fractions for child morbidity attributable
to child malnutrition (4) Morbidity data for malaria, diarrhoeal disease, pneumonia: YLDb or
incidence
Attributable burden due to child malnutrition and add direct PEM
morbidity or mortality (10, 11)
Exposure assessment (1)a child underweight
Estimating the burden of disease
12
Figure 3.2 Basic steps for estimating neonatal mortality due to maternal malnutrition
a Abbreviations: BMI = body−mass index; IUGR-LBW = intrauterine growth retardation-low birth weight; LBW = low birth weight; SD = standard deviation.
b Numbers in parentheses refer to Steps 1−11 in the text.
Exposure assessment: mean BMIa and SD of women
in reproductive age (1)b
Calculate attributable fractions for neonatal deaths due to low
maternal BMI (7)
Surveys or surveillance
system
Insert neonatal mortality statistics
Attributable neonatal mortality from maternal BMI
(10)
Exposure assessment: % LBW in newborns (1)
Calculate % of women with BMI < 20 kg/m2 (6)
Apply odds ratio to % low BMI
Calculate % IUGR-LBW attributable to LBW (5)
Worksheet "Exposure"
Calculate attributable fraction of neonatal
mortality attributable to IUGR-LBW (8)
Apply risk ratio to incidence
estimates of IUGR-LBW
Worksheet "Exposure"
Worksheet "Burden"
Worksheet "Burden"
Worksheet "PAFs" Worksheet "PAFs"
Surveys or WHO
database
Estimating the burden of disease
13
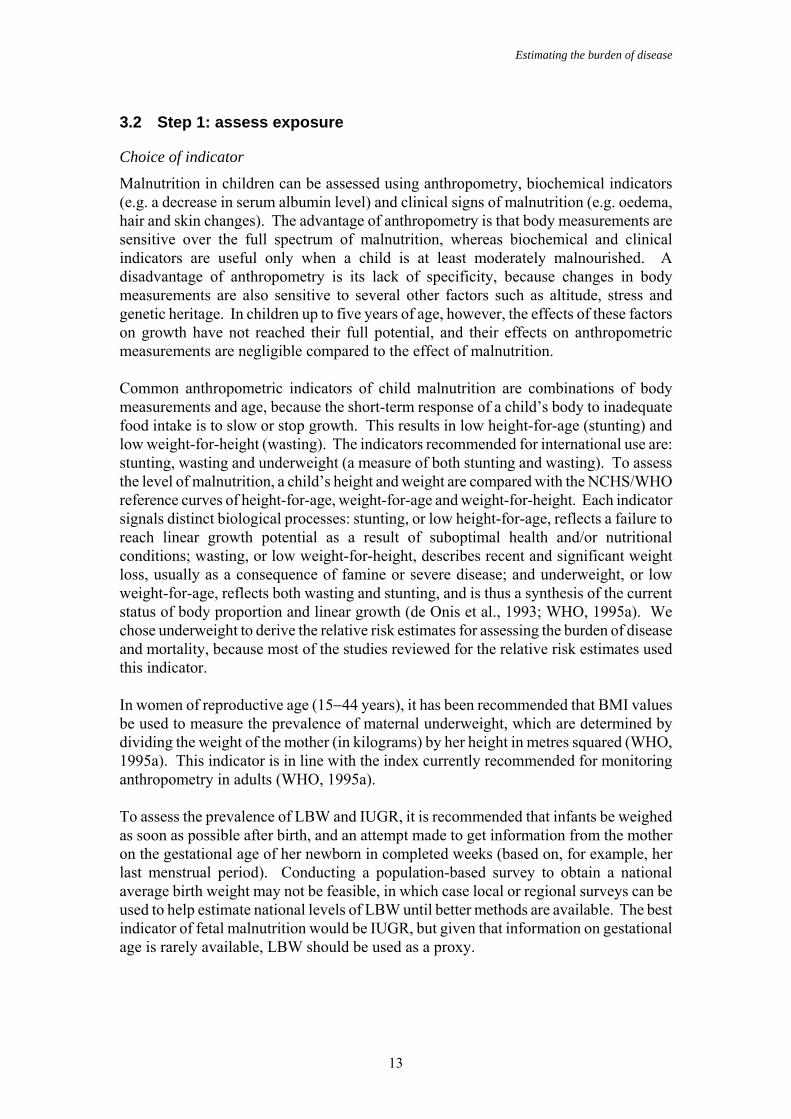
3.2 Step 1: assess exposure
Choice of indicator
Malnutrition in children can be assessed using anthropometry, biochemical indicators (e.g. a decrease in serum albumin level) and clinical signs of malnutrition (e.g. oedema, hair and skin changes). The advantage of anthropometry is that body measurements are sensitive over the full spectrum of malnutrition, whereas biochemical and clinical indicators are useful only when a child is at least moderately malnourished. A disadvantage of anthropometry is its lack of specificity, because changes in body measurements are also sensitive to several other factors such as altitude, stress and genetic heritage. In children up to five years of age, however, the effects of these factors on growth have not reached their full potential, and their effects on anthropometric measurements are negligible compared to the effect of malnutrition. Common anthropometric indicators of child malnutrition are combinations of body measurements and age, because the short-term response of a child’s body to inadequate food intake is to slow or stop growth. This results in low height-for-age (stunting) and low weight-for-height (wasting). The indicators recommended for international use are: stunting, wasting and underweight (a measure of both stunting and wasting). To assess the level of malnutrition, a child’s height and weight are compared with the NCHS/WHO reference curves of height-for-age, weight-for-age and weight-for-height. Each indicator signals distinct biological processes: stunting, or low height-for-age, reflects a failure to reach linear growth potential as a result of suboptimal health and/or nutritional conditions; wasting, or low weight-for-height, describes recent and significant weight loss, usually as a consequence of famine or severe disease; and underweight, or low weight-for-age, reflects both wasting and stunting, and is thus a synthesis of the current status of body proportion and linear growth (de Onis et al., 1993; WHO, 1995a). We chose underweight to derive the relative risk estimates for assessing the burden of disease and mortality, because most of the studies reviewed for the relative risk estimates used this indicator. In women of reproductive age (15−44 years), it has been recommended that BMI values be used to measure the prevalence of maternal underweight, which are determined by dividing the weight of the mother (in kilograms) by her height in metres squared (WHO, 1995a). This indicator is in line with the index currently recommended for monitoring anthropometry in adults (WHO, 1995a). To assess the prevalence of LBW and IUGR, it is recommended that infants be weighed as soon as possible after birth, and an attempt made to get information from the mother on the gestational age of her newborn in completed weeks (based on, for example, her last menstrual period). Conducting a population-based survey to obtain a national average birth weight may not be feasible, in which case local or regional surveys can be used to help estimate national levels of LBW until better methods are available. The best indicator of fetal malnutrition would be IUGR, but given that information on gestational age is rarely available, LBW should be used as a proxy.
Estimating the burden of disease
14
Choice of reference data
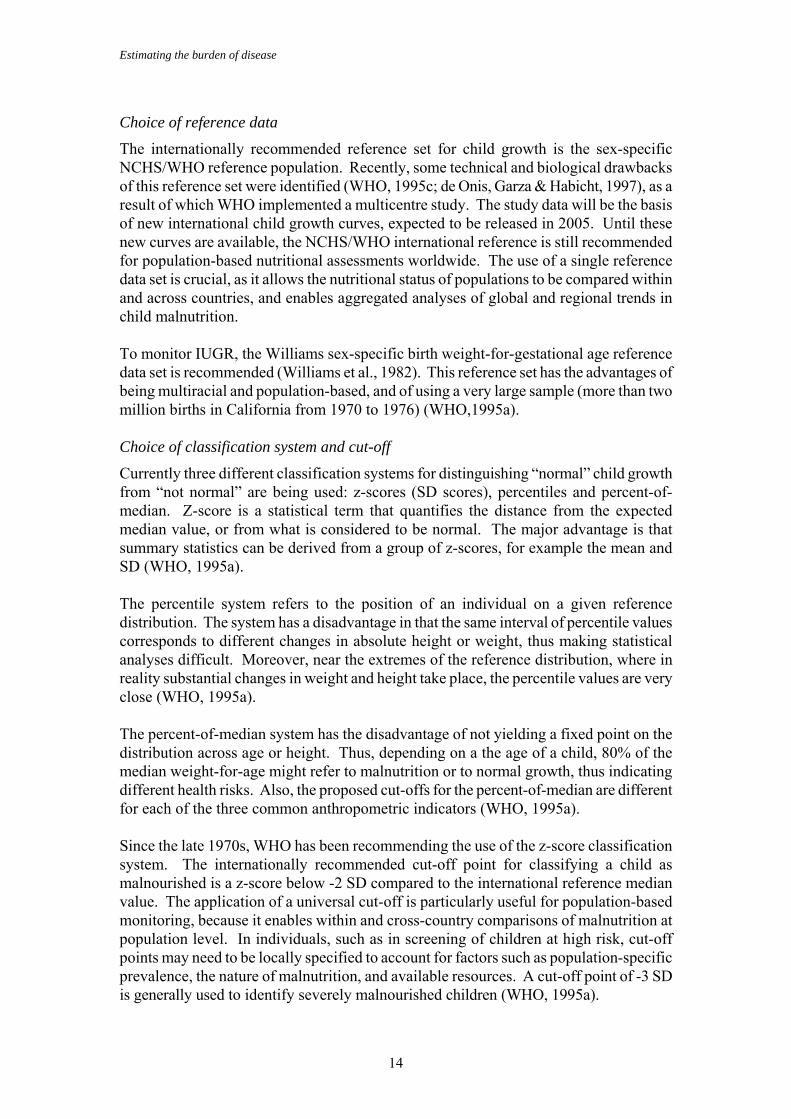
The internationally recommended reference set for child growth is the sex-specific NCHS/WHO reference population. Recently, some technical and biological drawbacks of this reference set were identified (WHO, 1995c; de Onis, Garza & Habicht, 1997), as a result of which WHO implemented a multicentre study. The study data will be the basis of new international child growth curves, expected to be released in 2005. Until these new curves are available, the NCHS/WHO international reference is still recommended for population-based nutritional assessments worldwide. The use of a single reference data set is crucial, as it allows the nutritional status of populations to be compared within and across countries, and enables aggregated analyses of global and regional trends in child malnutrition. To monitor IUGR, the Williams sex-specific birth weight-for-gestational age reference data set is recommended (Williams et al., 1982). This reference set has the advantages of being multiracial and population-based, and of using a very large sample (more than two million births in California from 1970 to 1976) (WHO,1995a). Choice of classification system and cut-off
Currently three different classification systems for distinguishing “normal” child growth from “not normal” are being used: z-scores (SD scores), percentiles and percent-of-median. Z-score is a statistical term that quantifies the distance from the expected median value, or from what is considered to be normal. The major advantage is that summary statistics can be derived from a group of z-scores, for example the mean and SD (WHO, 1995a). The percentile system refers to the position of an individual on a given reference distribution. The system has a disadvantage in that the same interval of percentile values corresponds to different changes in absolute height or weight, thus making statistical analyses difficult. Moreover, near the extremes of the reference distribution, where in reality substantial changes in weight and height take place, the percentile values are very close (WHO, 1995a). The percent-of-median system has the disadvantage of not yielding a fixed point on the distribution across age or height. Thus, depending on a the age of a child, 80% of the median weight-for-age might refer to malnutrition or to normal growth, thus indicating different health risks. Also, the proposed cut-offs for the percent-of-median are different for each of the three common anthropometric indicators (WHO, 1995a). Since the late 1970s, WHO has been recommending the use of the z-score classification system. The internationally recommended cut-off point for classifying a child as malnourished is a z-score below -2 SD compared to the international reference median value. The application of a universal cut-off is particularly useful for population-based monitoring, because it enables within and cross-country comparisons of malnutrition at population level. In individuals, such as in screening of children at high risk, cut-off points may need to be locally specified to account for factors such as population-specific prevalence, the nature of malnutrition, and available resources. A cut-off point of -3 SD is generally used to identify severely malnourished children (WHO, 1995a).
Estimating the burden of disease
15
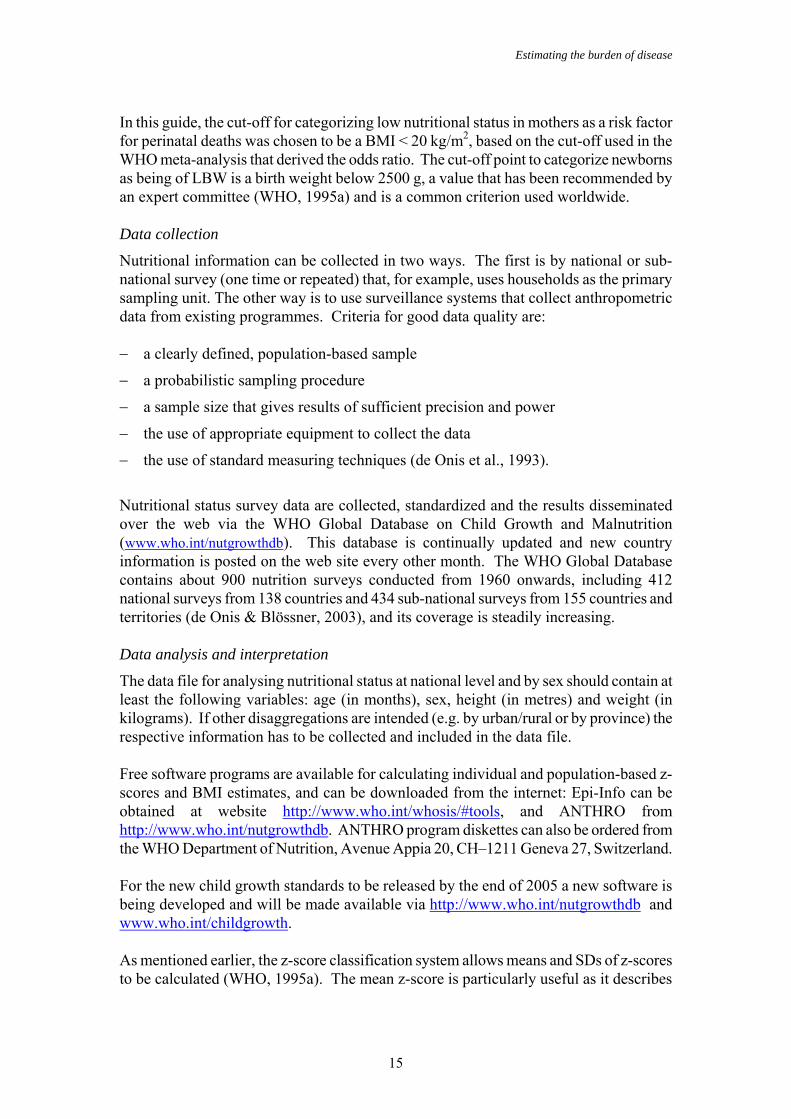
In this guide, the cut-off for categorizing low nutritional status in mothers as a risk factor for perinatal deaths was chosen to be a BMI < 20 kg/m2, based on the cut-off used in the WHO meta-analysis that derived the odds ratio. The cut-off point to categorize newborns as being of LBW is a birth weight below 2500 g, a value that has been recommended by an expert committee (WHO, 1995a) and is a common criterion used worldwide. Data collection
Nutritional information can be collected in two ways. The first is by national or sub-national survey (one time or repeated) that, for example, uses households as the primary sampling unit. The other way is to use surveillance systems that collect anthropometric data from existing programmes. Criteria for good data quality are: − a clearly defined, population-based sample
− a probabilistic sampling procedure
− a sample size that gives results of sufficient precision and power
− the use of appropriate equipment to collect the data
− the use of standard measuring techniques (de Onis et al., 1993).
Nutritional status survey data are collected, standardized and the results disseminated over the web via the WHO Global Database on Child Growth and Malnutrition (www.who.int/nutgrowthdb). This database is continually updated and new country information is posted on the web site every other month. The WHO Global Database contains about 900 nutrition surveys conducted from 1960 onwards, including 412 national surveys from 138 countries and 434 sub-national surveys from 155 countries and territories (de Onis & Blössner, 2003), and its coverage is steadily increasing. Data analysis and interpretation
The data file for analysing nutritional status at national level and by sex should contain at least the following variables: age (in months), sex, height (in metres) and weight (in kilograms). If other disaggregations are intended (e.g. by urban/rural or by province) the respective information has to be collected and included in the data file. Free software programs are available for calculating individual and population-based z-scores and BMI estimates, and can be downloaded from the internet: Epi-Info can be obtained at website http://www.who.int/whosis/#tools, and ANTHRO from http://www.who.int/nutgrowthdb. ANTHRO program diskettes can also be ordered from the WHO Department of Nutrition, Avenue Appia 20, CH–1211 Geneva 27, Switzerland. For the new child growth standards to be released by the end of 2005 a new software is being developed and will be made available via http://www.who.int/nutgrowthdb and www.who.int/childgrowth. As mentioned earlier, the z-score classification system allows means and SDs of z-scores to be calculated (WHO, 1995a). The mean z-score is particularly useful as it describes
Estimating the burden of disease
16
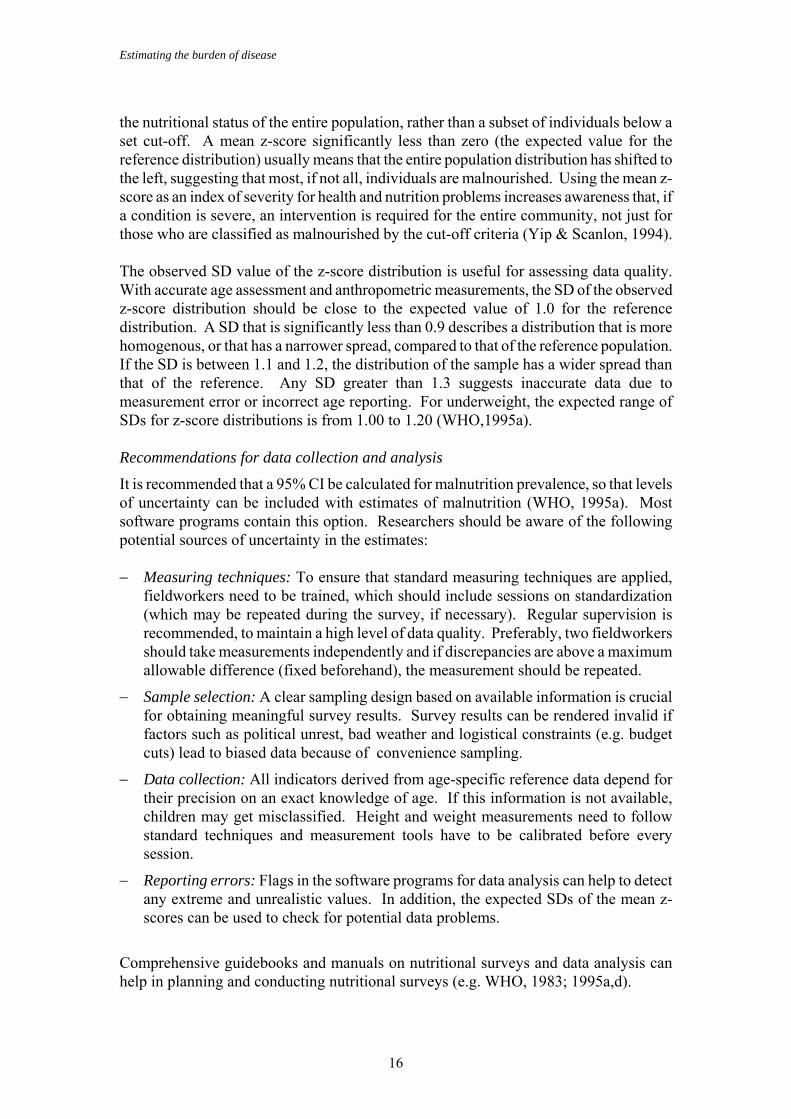
the nutritional status of the entire population, rather than a subset of individuals below a set cut-off. A mean z-score significantly less than zero (the expected value for the reference distribution) usually means that the entire population distribution has shifted to the left, suggesting that most, if not all, individuals are malnourished. Using the mean z-score as an index of severity for health and nutrition problems increases awareness that, if a condition is severe, an intervention is required for the entire community, not just for those who are classified as malnourished by the cut-off criteria (Yip & Scanlon, 1994). The observed SD value of the z-score distribution is useful for assessing data quality. With accurate age assessment and anthropometric measurements, the SD of the observed z-score distribution should be close to the expected value of 1.0 for the reference distribution. A SD that is significantly less than 0.9 describes a distribution that is more homogenous, or that has a narrower spread, compared to that of the reference population. If the SD is between 1.1 and 1.2, the distribution of the sample has a wider spread than that of the reference. Any SD greater than 1.3 suggests inaccurate data due to measurement error or incorrect age reporting. For underweight, the expected range of SDs for z-score distributions is from 1.00 to 1.20 (WHO,1995a). Recommendations for data collection and analysis
It is recommended that a 95% CI be calculated for malnutrition prevalence, so that levels of uncertainty can be included with estimates of malnutrition (WHO, 1995a). Most software programs contain this option. Researchers should be aware of the following potential sources of uncertainty in the estimates: − Measuring techniques: To ensure that standard measuring techniques are applied,
fieldworkers need to be trained, which should include sessions on standardization (which may be repeated during the survey, if necessary). Regular supervision is recommended, to maintain a high level of data quality. Preferably, two fieldworkers should take measurements independently and if discrepancies are above a maximum allowable difference (fixed beforehand), the measurement should be repeated.
− Sample selection: A clear sampling design based on available information is crucial for obtaining meaningful survey results. Survey results can be rendered invalid if factors such as political unrest, bad weather and logistical constraints (e.g. budget cuts) lead to biased data because of convenience sampling.
− Data collection: All indicators derived from age-specific reference data depend for their precision on an exact knowledge of age. If this information is not available, children may get misclassified. Height and weight measurements need to follow standard techniques and measurement tools have to be calibrated before every session.
− Reporting errors: Flags in the software programs for data analysis can help to detect any extreme and unrealistic values. In addition, the expected SDs of the mean z-scores can be used to check for potential data problems.
Comprehensive guidebooks and manuals on nutritional surveys and data analysis can help in planning and conducting nutritional surveys (e.g. WHO, 1983; 1995a,d).
Estimating the burden of disease
17
Information to include when reporting on infant, child and maternal malnutrition
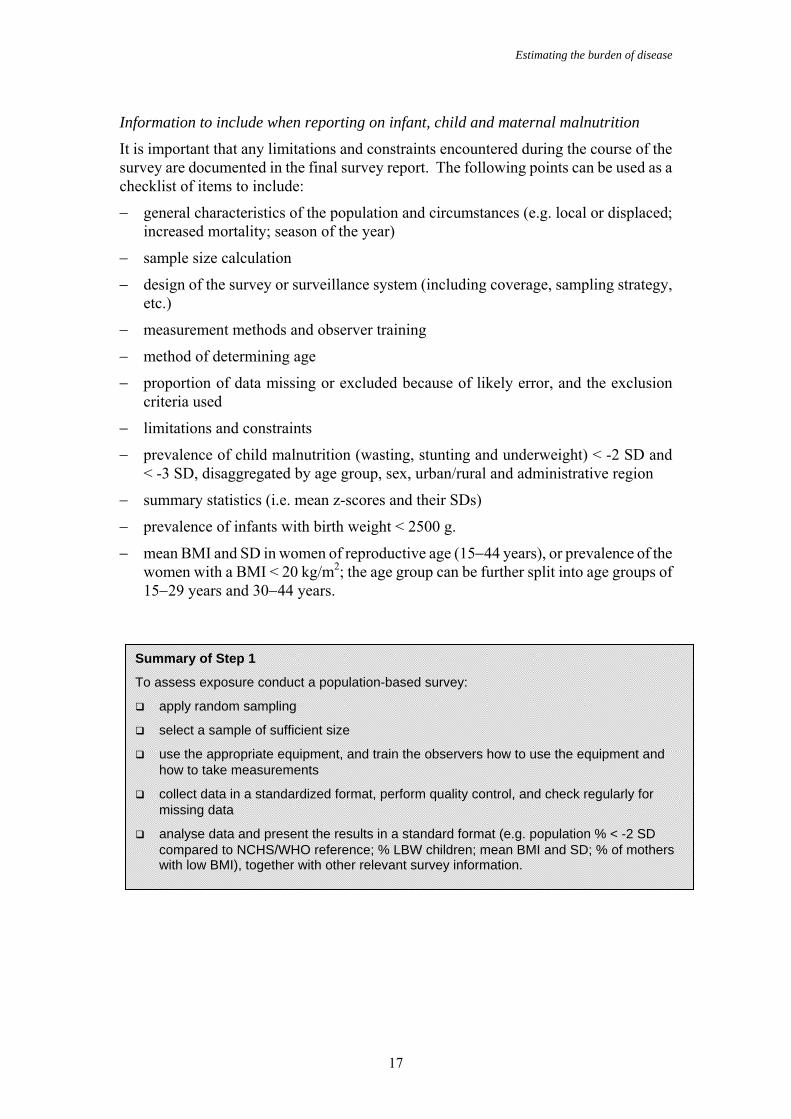
It is important that any limitations and constraints encountered during the course of the survey are documented in the final survey report. The following points can be used as a checklist of items to include:
− general characteristics of the population and circumstances (e.g. local or displaced; increased mortality; season of the year)
− sample size calculation
− design of the survey or surveillance system (including coverage, sampling strategy, etc.)
− measurement methods and observer training
− method of determining age
− proportion of data missing or excluded because of likely error, and the exclusion criteria used
− limitations and constraints
− prevalence of child malnutrition (wasting, stunting and underweight) < -2 SD and < -3 SD, disaggregated by age group, sex, urban/rural and administrative region
− summary statistics (i.e. mean z-scores and their SDs)
− prevalence of infants with birth weight < 2500 g.
− mean BMI and SD in women of reproductive age (15−44 years), or prevalence of the women with a BMI < 20 kg/m2; the age group can be further split into age groups of 15−29 years and 30−44 years.
Summary of Step 1
To assess exposure conduct a population-based survey:
apply random sampling
select a sample of sufficient size
use the appropriate equipment, and train the observers how to use the equipment and how to take measurements
collect data in a standardized format, perform quality control, and check regularly for missing data
analyse data and present the results in a standard format (e.g. population % < -2 SD compared to NCHS/WHO reference; % LBW children; mean BMI and SD; % of mothers with low BMI), together with other relevant survey information.
Estimating the burden of disease
18
3.3 Step 2: calculate the percentages of children severely, moderately and mildly malnourished
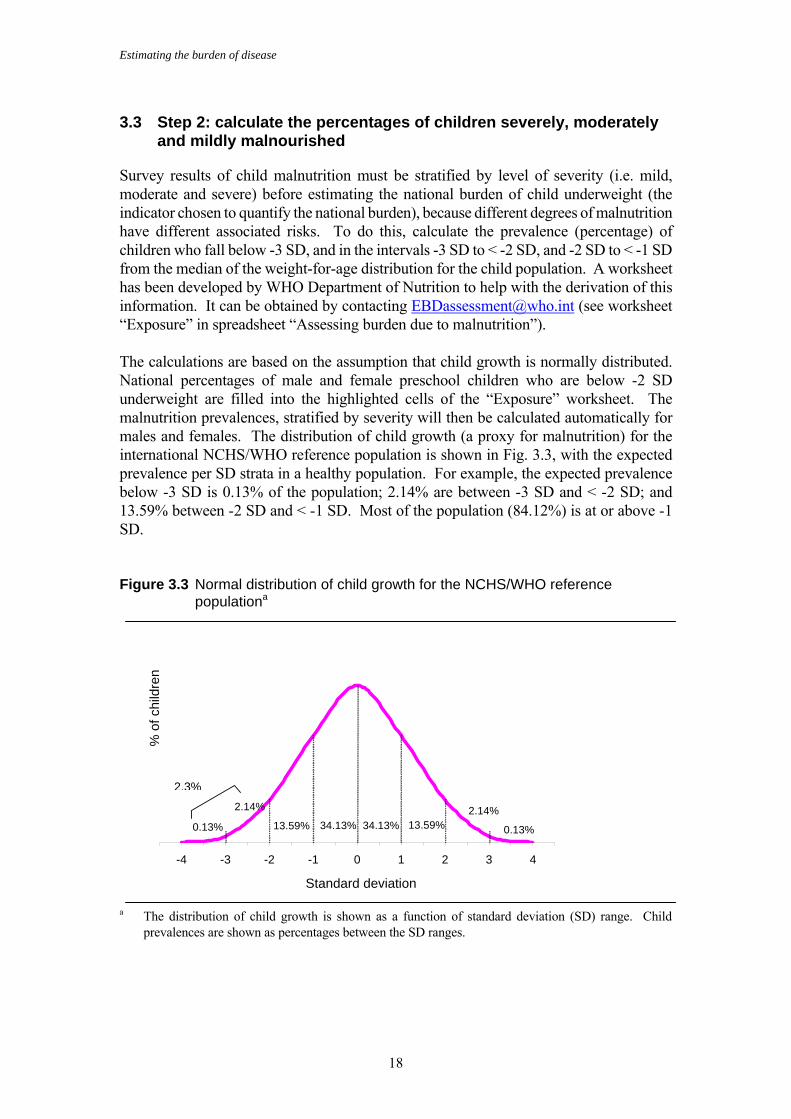
Survey results of child malnutrition must be stratified by level of severity (i.e. mild, moderate and severe) before estimating the national burden of child underweight (the indicator chosen to quantify the national burden), because different degrees of malnutrition have different associated risks. To do this, calculate the prevalence (percentage) of children who fall below -3 SD, and in the intervals -3 SD to < -2 SD, and -2 SD to < -1 SD from the median of the weight-for-age distribution for the child population. A worksheet has been developed by WHO Department of Nutrition to help with the derivation of this information. It can be obtained by contacting [email protected] (see worksheet “Exposure” in spreadsheet “Assessing burden due to malnutrition”). The calculations are based on the assumption that child growth is normally distributed. National percentages of male and female preschool children who are below -2 SD underweight are filled into the highlighted cells of the “Exposure” worksheet. The malnutrition prevalences, stratified by severity will then be calculated automatically for males and females. The distribution of child growth (a proxy for malnutrition) for the international NCHS/WHO reference population is shown in Fig. 3.3, with the expected prevalence per SD strata in a healthy population. For example, the expected prevalence below -3 SD is 0.13% of the population; 2.14% are between -3 SD and < -2 SD; and 13.59% between -2 SD and < -1 SD. Most of the population (84.12%) is at or above -1 SD. Figure 3.3 Normal distribution of child growth for the NCHS/WHO reference populationa
a The distribution of child growth is shown as a function of standard deviation (SD) range. Child
prevalences are shown as percentages between the SD ranges.
0.13%
2.14%13.59%34.13%34.13%13.59%
2.14%
0.13%
-4 -3 -2 -1 0 1 2 3 4
Standard deviation
2.3%
% o
f chi
ldre
n
Estimating the burden of disease
19
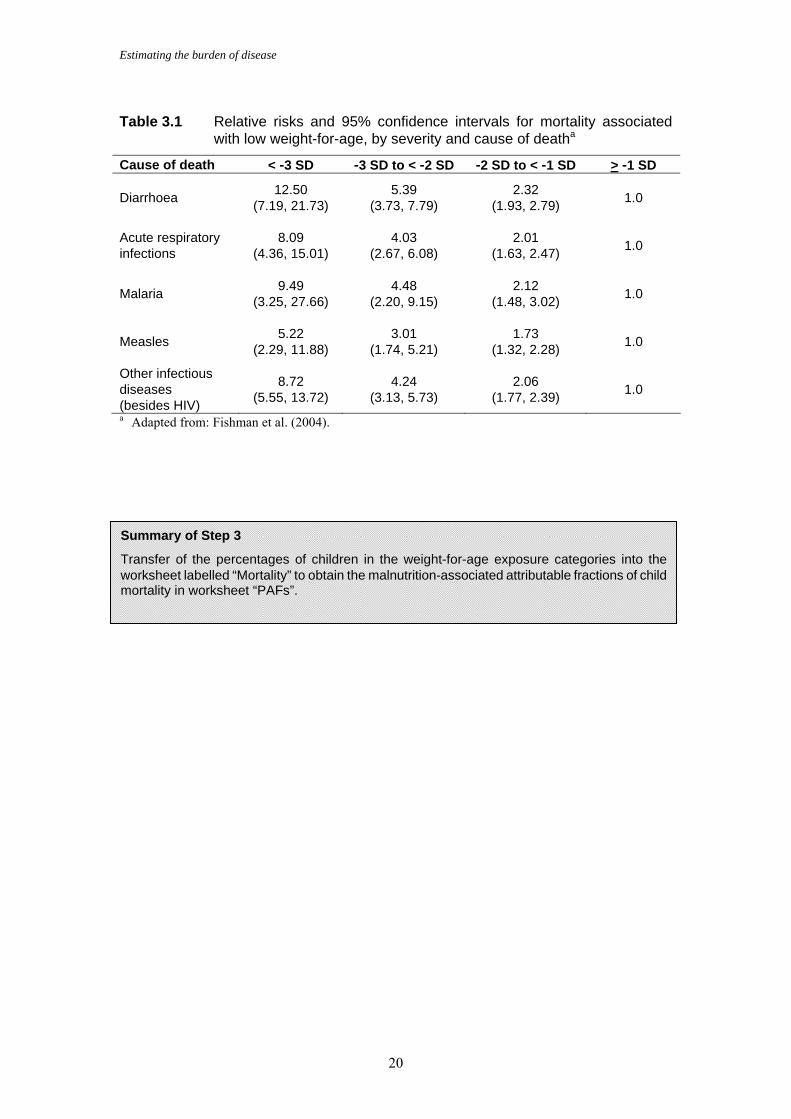
3.4 Step 3: calculate the attributable fractions for child mortality using relative risk estimates
To estimate, for example, the national burden of mortality from malnutrition, cause-specific relative risks (Table 3.1) are applied to the percentages of underweight male and female preschool children for each level of severity (from the worksheet “Exposure”), using the simplified formula for attributable fraction (or impact fraction) that is built into the worksheet:
AF = 11)-P(RR
1)-P(RR+
where: AF = attributable fraction. RR = relative risk. P = proportion of children exposed to malnutrition severity level. The worksheet derives national cause-specific attributable mortality fractions due to child malnutrition. These are the attributable fractions that could be prevented if child malnutrition were eliminated. The relative risk values are incorporated into the worksheet (labelled “Relative risks” in the same spreadsheet), and are already linked to the worksheet labelled “Mortality”. Resulting cause-specific attributable mortality fractions will appear in the worksheet labelled “PAFs”.
Summary of Step 2
Enter the fraction of children below -2 SD from the mean weight-for-age into the highlighted cell in worksheet "Exposure". The fraction is obtained by dividing the percentage value by 100. This is done separately for males and females. The percentages of children in the categories of child malnutrition (i.e. below -3 SD; -3 SD to < -2 SD; and -2 SD to < -1 SD) are then automatically derived by the spreadsheet.
Estimating the burden of disease
20
Table 3.1 Relative risks and 95% confidence intervals for mortality associated with low weight-for-age, by severity and cause of deatha
Cause of death < -3 SD -3 SD to < -2 SD -2 SD to < -1 SD > -1 SD
Diarrhoea 12.50 (7.19, 21.73)
5.39 (3.73, 7.79)
2.32 (1.93, 2.79) 1.0
Acute respiratory infections
8.09 (4.36, 15.01)
4.03 (2.67, 6.08)
2.01 (1.63, 2.47) 1.0
Malaria 9.49 (3.25, 27.66)
4.48 (2.20, 9.15)
2.12 (1.48, 3.02) 1.0
Measles 5.22 (2.29, 11.88)
3.01 (1.74, 5.21)
1.73 (1.32, 2.28) 1.0
Other infectious diseases (besides HIV)
8.72 (5.55, 13.72)
4.24 (3.13, 5.73)
2.06 (1.77, 2.39) 1.0
a Adapted from: Fishman et al. (2004).
Summary of Step 3
Transfer of the percentages of children in the weight-for-age exposure categories into the worksheet labelled “Mortality” to obtain the malnutrition-associated attributable fractions of child mortality in worksheet “PAFs”.
Estimating the burden of disease
21
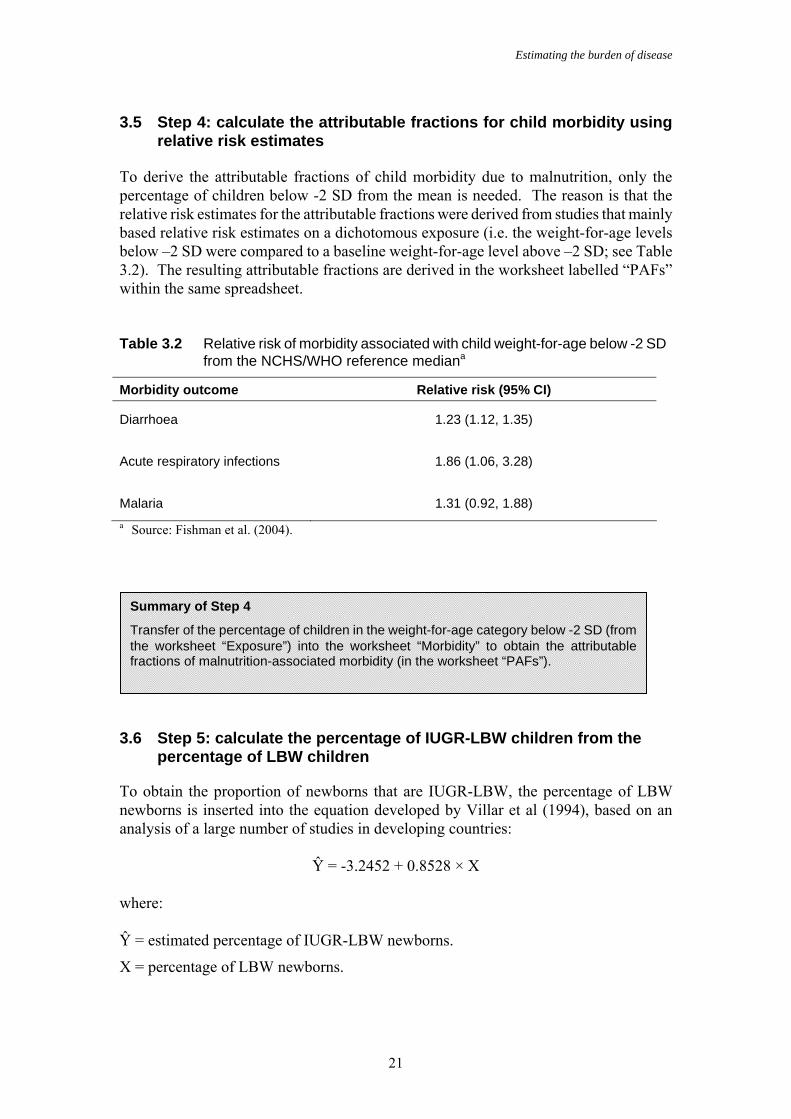
3.5 Step 4: calculate the attributable fractions for child morbidity using relative risk estimates To derive the attributable fractions of child morbidity due to malnutrition, only the percentage of children below -2 SD from the mean is needed. The reason is that the relative risk estimates for the attributable fractions were derived from studies that mainly based relative risk estimates on a dichotomous exposure (i.e. the weight-for-age levels below –2 SD were compared to a baseline weight-for-age level above –2 SD; see Table 3.2). The resulting attributable fractions are derived in the worksheet labelled “PAFs” within the same spreadsheet. Table 3.2 Relative risk of morbidity associated with child weight-for-age below -2 SD
from the NCHS/WHO reference mediana
Morbidity outcome Relative risk (95% CI)
Diarrhoea 1.23 (1.12, 1.35)
Acute respiratory infections 1.86 (1.06, 3.28)
Malaria 1.31 (0.92, 1.88) a Source: Fishman et al. (2004).
3.6 Step 5: calculate the percentage of IUGR-LBW children from the percentage of LBW children
To obtain the proportion of newborns that are IUGR-LBW, the percentage of LBW newborns is inserted into the equation developed by Villar et al (1994), based on an analysis of a large number of studies in developing countries:
Ŷ = -3.2452 + 0.8528 × X where: Ŷ = estimated percentage of IUGR-LBW newborns.
X = percentage of LBW newborns.
Summary of Step 4
Transfer of the percentage of children in the weight-for-age category below -2 SD (from the worksheet “Exposure”) into the worksheet “Morbidity” to obtain the attributable fractions of malnutrition-associated morbidity (in the worksheet “PAFs”).
Estimating the burden of disease
22
Note that this equation only applies to developing countries. The equation is already incorporated into the "Exposure" worksheet, so that only the percentage of LBW newborns has to be entered into the highlighted cell under the section header “Fetal underweight”. The percentage of IUGR-LBW newborns will be calculated by the worksheet (using the above formula), and the result will appear in the cell to the right under “%IUGR-LBW”. The result is automatically copied over to the worksheet “Mortality” into a cell under the same heading.
3.7 Step 6: calculate the percentage of women with low pre-pregnancy BMI (< 20 kg/m2 )
Attributable fractions of IUGR due to low pre-pregnancy BMI are based on the percentage of women with a BMI < 20 kg/m2. To obtain this percentage, the mean and SD values for BMI in women 15−44 years of age must be entered into the highlighted cells under the section heading “Maternal underweight” in the worksheet “Exposure”. The results appear to the right, under the cell “%< BMI 20”, and are automatically transferred to the worksheet “Mortality” under the heading “Mortality due to perinatal conditions”. If the percentage of women who have a low BMI is known, this value can be entered directly into the appropriate cell.
Summary of Step 6
Enter the mean and SD values for female BMI into worksheet “Exposure” for each age group. The worksheet automatically calculates the percentage of women of reproductive age who have a low BMI, which is needed to calculate the attributable fractions of neonatal mortality due to maternal malnutrition. Check that the correct estimates are transferred into the worksheet “Mortality”.
Summary of Step 5
Enter the percentage of LBW newborns into the appropriate cell in worksheet “Exposure” to derive the percentage of newborns estimated to be IUGR-LBW. Check that the correct estimates are transferred into the worksheet “Mortality”.
Estimating the burden of disease
23
3.8 Step 7: calculate the attributable fraction of IUGR due to low BMI from the odds ratio for IUGR and the percentage of women with low pre-pregnancy BMI
The attributable fraction of IUGR due to maternal malnutrition is calculated by applying an odds ratio of 1.8 (WHO, 1995b) to the percentage of women with low pre-pregnancy BMI (< 20 kg/m2 ), obtained in worksheet “Exposure”. The formula for this calculation is incorporated in worksheet “PAFs” and the result appears automatically next to “PAF of IUGR due to BMI”.
3.9 Step 8: calculate the attributable fraction of neonatal deaths due to IUGR-LBW by applying a risk ratio of 6.0 to the estimated incidence of IUGR-LBW
Attributable fractions of neonatal deaths due to IUGR-LBW are calculated by applying a risk ratio of 6.0 to the percentage of newborns classified as IUGR-LBW (obtained in Step 5), using the worksheet “Exposure”. The formula is incorporated into the worksheet “PAFs”, where the multiplication is performed.
Summary of Step 8
Ensure that the percentage of IUGR-LBW newborns derived in worksheet “Exposure” is correctly copied over into worksheets “Mortality” and “PAFs”. The attributable fraction of neonatal deaths appears automatically in the worksheet “PAFs”, next to “PAF of neonatal death due to IUGR”.
Summary of Step 7
The attributable fractions of neonatal mortality due to maternal malnutrition (i.e. low BMI) are obtained in the worksheet “PAFs”.
Estimating the burden of disease
24
3.10 Step 9: multiply the attributable fractions from Steps 7 and 8
To obtain the total attributable fraction of neonatal deaths due to low maternal BMI, multiply the attributable fraction of IUGR due to low pre-pregnancy BMI by the attributable fraction of neonatal deaths due to IUGR-LBW. An overall weighted mean attributable fraction can be obtained by inserting relative population weighting factors for each of the age groups of women of reproductive age (15−29 years and 30−44 years) into the highlighted cells at the bottom of worksheet “PAFs”. The result appears in the highlighted cell to the right.
3.11 Steps 10 and 11: calculate the total burden of underweight
Estimates of the attributable fractions, in terms of cause-specific mortality and morbidity, associated with underweight in the age group 0−4 years have been calculated in the “PAFs” worksheet. To derive total burden estimates, the following information must be entered into the highlighted cells in worksheet “Burden”: − all-cause mortality estimates for males and females 0−4 years of age
− cause-specific mortality estimates (i.e. national deaths due to measles, malaria, diarrhoeal diseases, acute lower respiratory infections (mostly pneumonia), protein-energy malnutrition, and all other infectious diseases (besides HIV), and the number of neonatal deaths
− national all-cause morbidity estimates, measured in years lived with disability (YLD, a component of the DALY) or in cases per year, for males and females 0−4 years of age
− cause-specific morbidity estimates, measured in YLD or in incidence, for diarrhoeal diseases, malaria, lower respiratory infections and protein-energy malnutrition.
These estimates may be available from national statistics. Preliminary estimates can also be requested from the WHO Evidence and Information for Policy Department (through [email protected]). Alternatively, rough estimates can be obtained from regional data (Prüss-Üstün et al., 2003). The burden of underweight (in terms of attributable numbers of cause-specific deaths and diseased) can be calculated from the estimates of attributable fractions, by multiplying them by the population attributable fractions derived in the worksheet “PAFs”. For protein-energy malnutrition no multiplication is needed as the numbers contribute 100%.
Summary of Step 9
The results of Steps 6 and 7 are multiplied in the spreadsheet “PAFs” to obtain the total population attributable fraction of neonatal deaths due to low maternal BMI. After adding population weights for the two age groups of women of reproductive age into the highlighted cells at the bottom of the spreadsheet, the spreadsheet calculates an overall mean population attributable fraction.
Estimating the burden of disease
25
The total attributable fraction of mortality among children under five years of age due to maternal and child underweight is calculated from the sum of the cause-specific attributable mortality estimates divided by the latest estimate of total deaths among children 0−59 months of age. This fraction includes deaths directly and indirectly attributable to undernutrition. In determining the fraction of deaths indirectly caused by undernutrition, the analysis differentiates post-neonatal deaths from neonatal deaths, with maternal undernutrition considered to be the risk factor for neonatal deaths. The last column in worksheet “burden” (highlighted) displays the proportions of all deaths associated with the specific factors. While mortality estimates represent the cause-specific deaths that are attributable to weight-for-age below -1 SD, morbidity estimates refer to the cause-specific episodes of illness attributable to weight-for-age below -2 SD. Similarly to mortality, the attributable fractions for morbidity due to malaria, acute respiratory infections and diarrhoea can be translated into burden estimates. After entering the national all-cause and cause-specific estimates of YLD, the worksheet derives the number of YLDs attributable to each cause. The user has to add the estimated direct morbidity based on protein-energy malnutrition.
Summary of Steps 10 and 11
□ The percentage of total deaths in children under five years of age associated with underweight is calculated in the worksheet “Burden” and appears in the bottom cell of the column “% of total deaths”.
□ The percentage of total morbidity in children under five years of age associated with underweight is calculated in the worksheet “Burden” and displays in the bottom cell of the column “% of total morbidity”.
Uncertainty
26
4. Uncertainty Uncertainty in the estimates of the burden of malnutrition can derive from:
− inaccurate measurements of exposure
− erroneous analysis of the empirical data
− flawed methodology in deriving relative risks and applying them to exposure estimates.
Ways to avoid mistakes in collecting and analysing exposure information have been outlined above. In this guide, a Monte Carlo analysis was used to obtain lower and upper confidence limits for estimates of the burden associated with malnutrition. This technique quantifies uncertainty in estimates both of relative risk and exposure level. However, the effort required to execute such an approach seems unsuitable for most local assessments, particularly as the additional information gained may not be substantial. If some presentation of uncertainty is required in the final results, then calculations for attributable fractions can be repeated with the lower and upper relative risk confidence intervals (see Tables 3.1 and 3.2), together with the central exposure level. The ranges that result for attributable fractions and burden cannot be interpreted in a statistical fashion. They serve simply as “low” and “high” scenarios, not lower and upper bounds around a central estimate, and only point to other possibilities for the actual impact.
A numerical example
27
5. Calculating the burden of disease for child malnutrition in Nepal: a numerical example
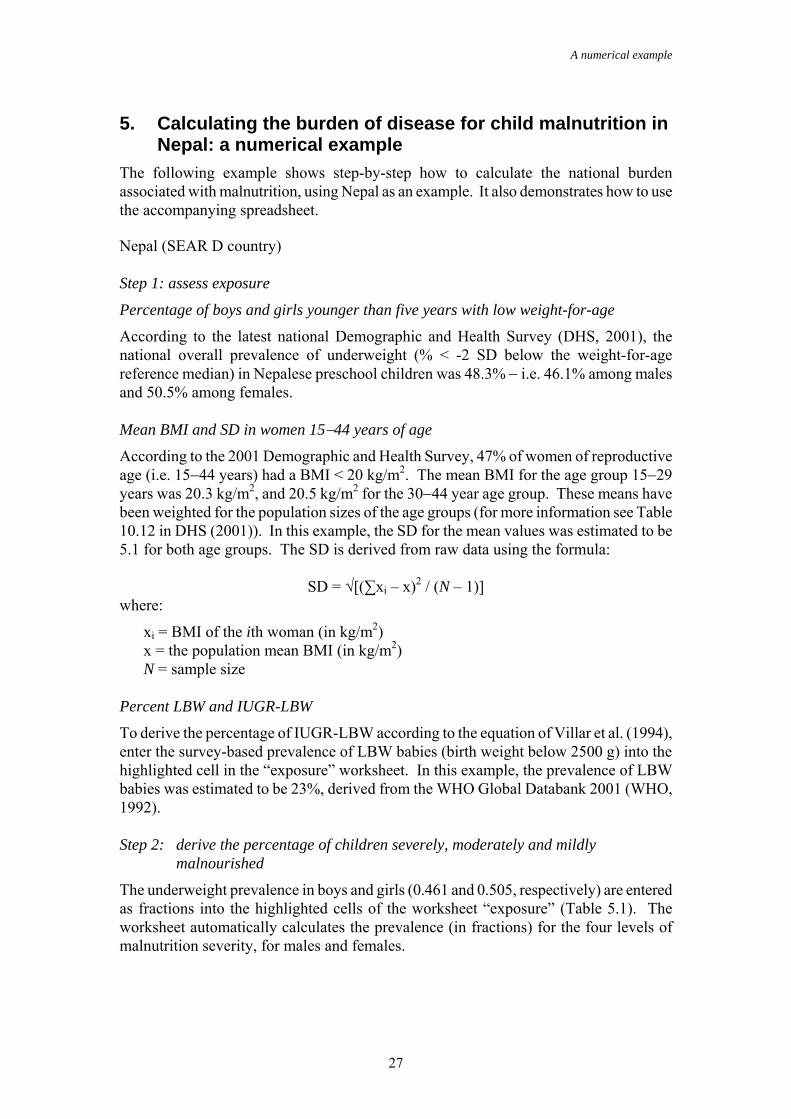
The following example shows step-by-step how to calculate the national burden associated with malnutrition, using Nepal as an example. It also demonstrates how to use the accompanying spreadsheet. Nepal (SEAR D country) Step 1: assess exposure
Percentage of boys and girls younger than five years with low weight-for-age
According to the latest national Demographic and Health Survey (DHS, 2001), the national overall prevalence of underweight (% < -2 SD below the weight-for-age reference median) in Nepalese preschool children was 48.3% − i.e. 46.1% among males and 50.5% among females. Mean BMI and SD in women 15−44 years of age
According to the 2001 Demographic and Health Survey, 47% of women of reproductive age (i.e. 15−44 years) had a BMI < 20 kg/m2. The mean BMI for the age group 15−29 years was 20.3 kg/m2, and 20.5 kg/m2 for the 30−44 year age group. These means have been weighted for the population sizes of the age groups (for more information see Table 10.12 in DHS (2001)). In this example, the SD for the mean values was estimated to be 5.1 for both age groups. The SD is derived from raw data using the formula:
SD = √[(∑xi – x)2 / (N – 1)] where:
xi = BMI of the ith woman (in kg/m2) x = the population mean BMI (in kg/m2) N = sample size
Percent LBW and IUGR-LBW
To derive the percentage of IUGR-LBW according to the equation of Villar et al. (1994), enter the survey-based prevalence of LBW babies (birth weight below 2500 g) into the highlighted cell in the “exposure” worksheet. In this example, the prevalence of LBW babies was estimated to be 23%, derived from the WHO Global Databank 2001 (WHO, 1992). Step 2: derive the percentage of children severely, moderately and mildly malnourished
The underweight prevalence in boys and girls (0.461 and 0.505, respectively) are entered as fractions into the highlighted cells of the worksheet “exposure” (Table 5.1). The worksheet automatically calculates the prevalence (in fractions) for the four levels of malnutrition severity, for males and females.
A numerical example
28
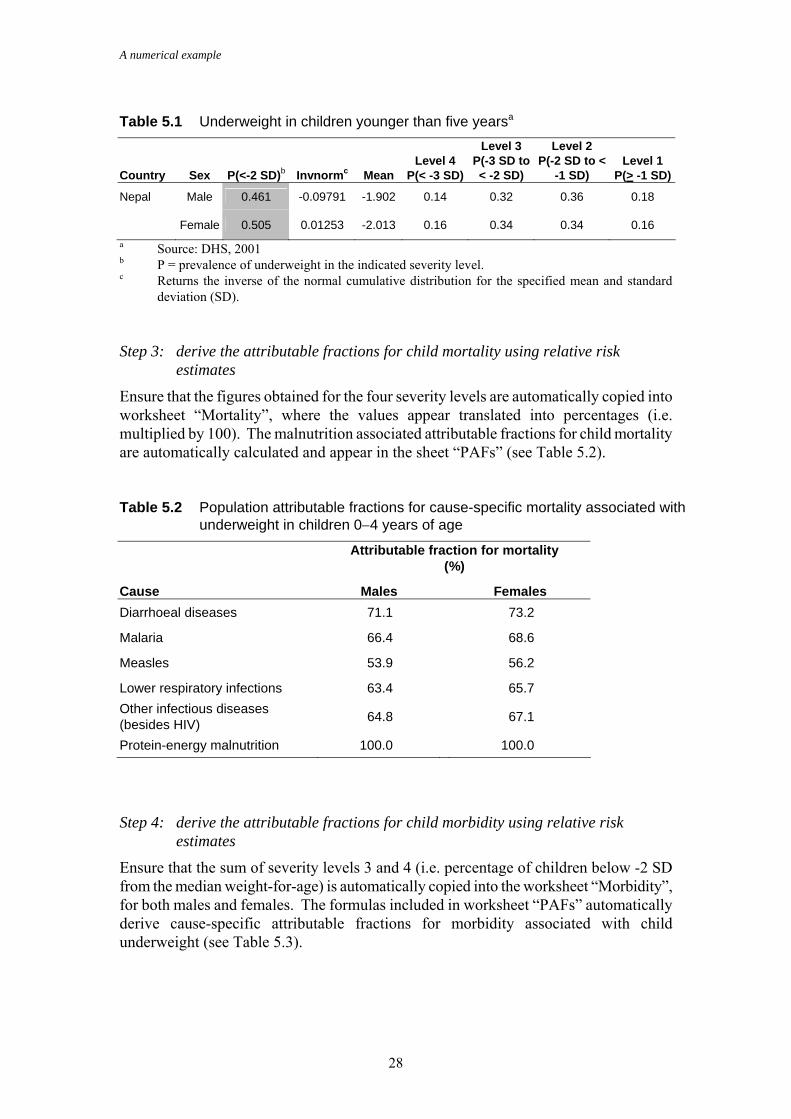
Table 5.1 Underweight in children younger than five yearsa
Country Sex P(<-2 SD)b Invnormc Mean Level 4
P(< -3 SD)
Level 3 P(-3 SD to < -2 SD)
Level 2 P(-2 SD to <
-1 SD) Level 1
P(> -1 SD)
Nepal Male 0.461 -0.09791 -1.902 0.14 0.32 0.36 0.18
Female 0.505 0.01253 -2.013 0.16 0.34 0.34 0.16 a Source: DHS, 2001 b P = prevalence of underweight in the indicated severity level. c Returns the inverse of the normal cumulative distribution for the specified mean and standard deviation (SD). Step 3: derive the attributable fractions for child mortality using relative risk estimates
Ensure that the figures obtained for the four severity levels are automatically copied into worksheet “Mortality”, where the values appear translated into percentages (i.e. multiplied by 100). The malnutrition associated attributable fractions for child mortality are automatically calculated and appear in the sheet “PAFs” (see Table 5.2). Table 5.2 Population attributable fractions for cause-specific mortality associated with underweight in children 0−4 years of age
Attributable fraction for mortality (%)
Cause Males Females Diarrhoeal diseases 71.1 73.2
Malaria 66.4 68.6
Measles 53.9 56.2
Lower respiratory infections 63.4 65.7 Other infectious diseases (besides HIV) 64.8 67.1
Protein-energy malnutrition 100.0 100.0
Step 4: derive the attributable fractions for child morbidity using relative risk estimates
Ensure that the sum of severity levels 3 and 4 (i.e. percentage of children below -2 SD from the median weight-for-age) is automatically copied into the worksheet “Morbidity”, for both males and females. The formulas included in worksheet “PAFs” automatically derive cause-specific attributable fractions for morbidity associated with child underweight (see Table 5.3).
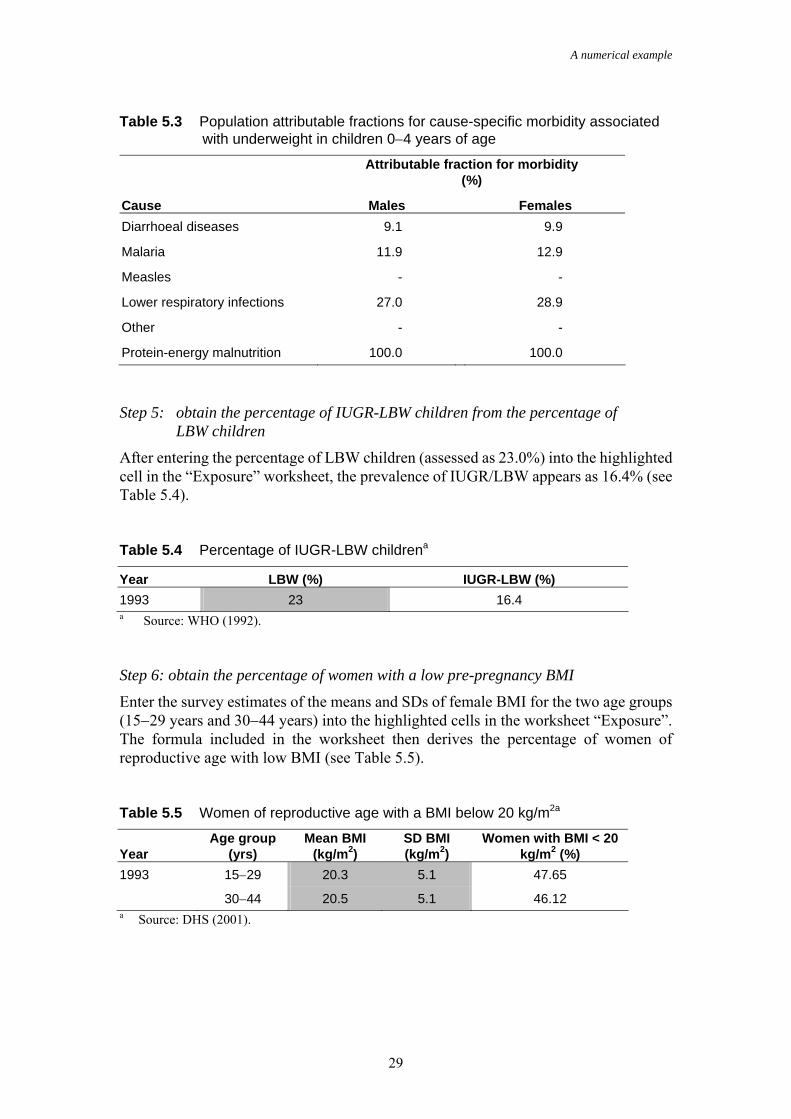
A numerical example
29
Table 5.3 Population attributable fractions for cause-specific morbidity associated with underweight in children 0−4 years of age
Attributable fraction for morbidity (%)
Cause Males Females Diarrhoeal diseases 9.1 9.9
Malaria 11.9 12.9
Measles - -
Lower respiratory infections 27.0 28.9
Other - -
Protein-energy malnutrition 100.0 100.0
Step 5: obtain the percentage of IUGR-LBW children from the percentage of LBW children
After entering the percentage of LBW children (assessed as 23.0%) into the highlighted cell in the “Exposure” worksheet, the prevalence of IUGR/LBW appears as 16.4% (see Table 5.4). Table 5.4 Percentage of IUGR-LBW childrena
Year LBW (%) IUGR-LBW (%) 1993 23 16.4 a Source: WHO (1992). Step 6: obtain the percentage of women with a low pre-pregnancy BMI
Enter the survey estimates of the means and SDs of female BMI for the two age groups (15−29 years and 30−44 years) into the highlighted cells in the worksheet “Exposure”. The formula included in the worksheet then derives the percentage of women of reproductive age with low BMI (see Table 5.5). Table 5.5 Women of reproductive age with a BMI below 20 kg/m2a
Year Age group
(yrs) Mean BMI
(kg/m2) SD BMI (kg/m2)
Women with BMI < 20 kg/m2 (%)
1993 15−29 20.3 5.1 47.65
30−44 20.5 5.1 46.12 a Source: DHS (2001).
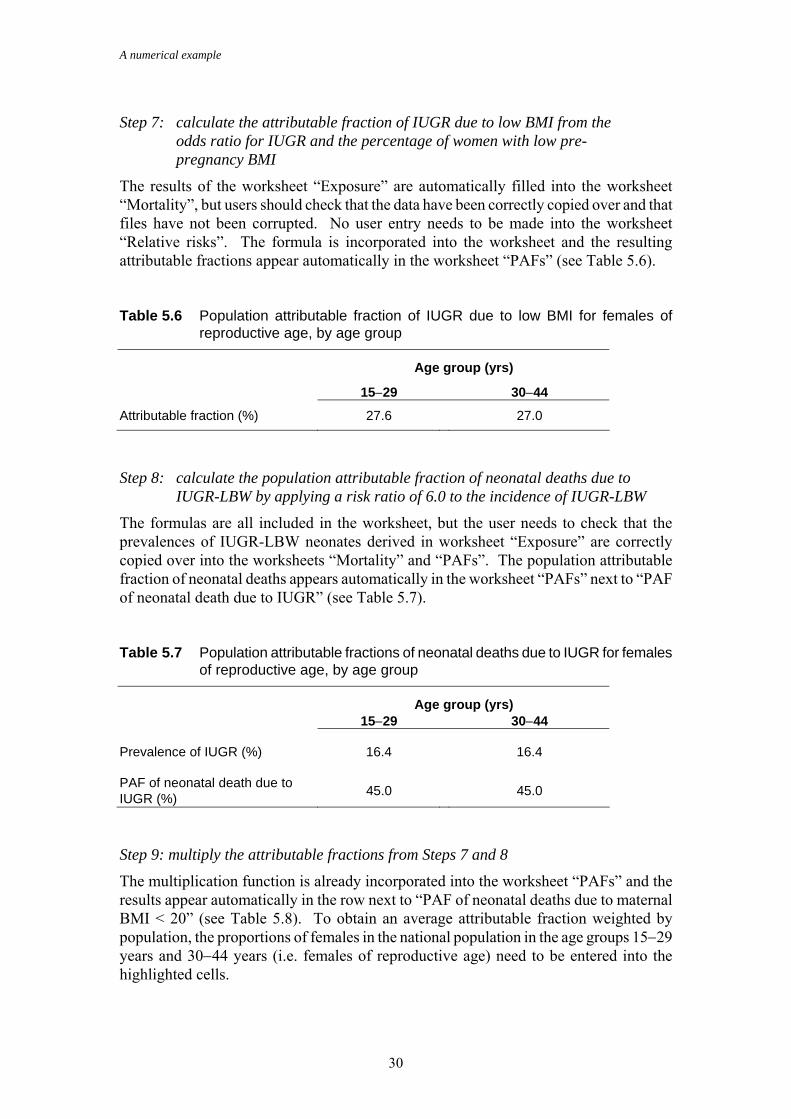
A numerical example
30
Step 7: calculate the attributable fraction of IUGR due to low BMI from the odds ratio for IUGR and the percentage of women with low pre- pregnancy BMI
The results of the worksheet “Exposure” are automatically filled into the worksheet “Mortality”, but users should check that the data have been correctly copied over and that files have not been corrupted. No user entry needs to be made into the worksheet “Relative risks”. The formula is incorporated into the worksheet and the resulting attributable fractions appear automatically in the worksheet “PAFs” (see Table 5.6). Table 5.6 Population attributable fraction of IUGR due to low BMI for females of reproductive age, by age group
Age group (yrs)
15−29 30−44
Attributable fraction (%) 27.6 27.0
Step 8: calculate the population attributable fraction of neonatal deaths due to IUGR-LBW by applying a risk ratio of 6.0 to the incidence of IUGR-LBW
The formulas are all included in the worksheet, but the user needs to check that the prevalences of IUGR-LBW neonates derived in worksheet “Exposure” are correctly copied over into the worksheets “Mortality” and “PAFs”. The population attributable fraction of neonatal deaths appears automatically in the worksheet “PAFs” next to “PAF of neonatal death due to IUGR” (see Table 5.7). Table 5.7 Population attributable fractions of neonatal deaths due to IUGR for females of reproductive age, by age group
Age group (yrs) 15−29 30−44
Prevalence of IUGR (%) 16.4 16.4
PAF of neonatal death due to IUGR (%) 45.0 45.0
Step 9: multiply the attributable fractions from Steps 7 and 8
The multiplication function is already incorporated into the worksheet “PAFs” and the results appear automatically in the row next to “PAF of neonatal deaths due to maternal BMI < 20” (see Table 5.8). To obtain an average attributable fraction weighted by population, the proportions of females in the national population in the age groups 15−29 years and 30−44 years (i.e. females of reproductive age) need to be entered into the highlighted cells.
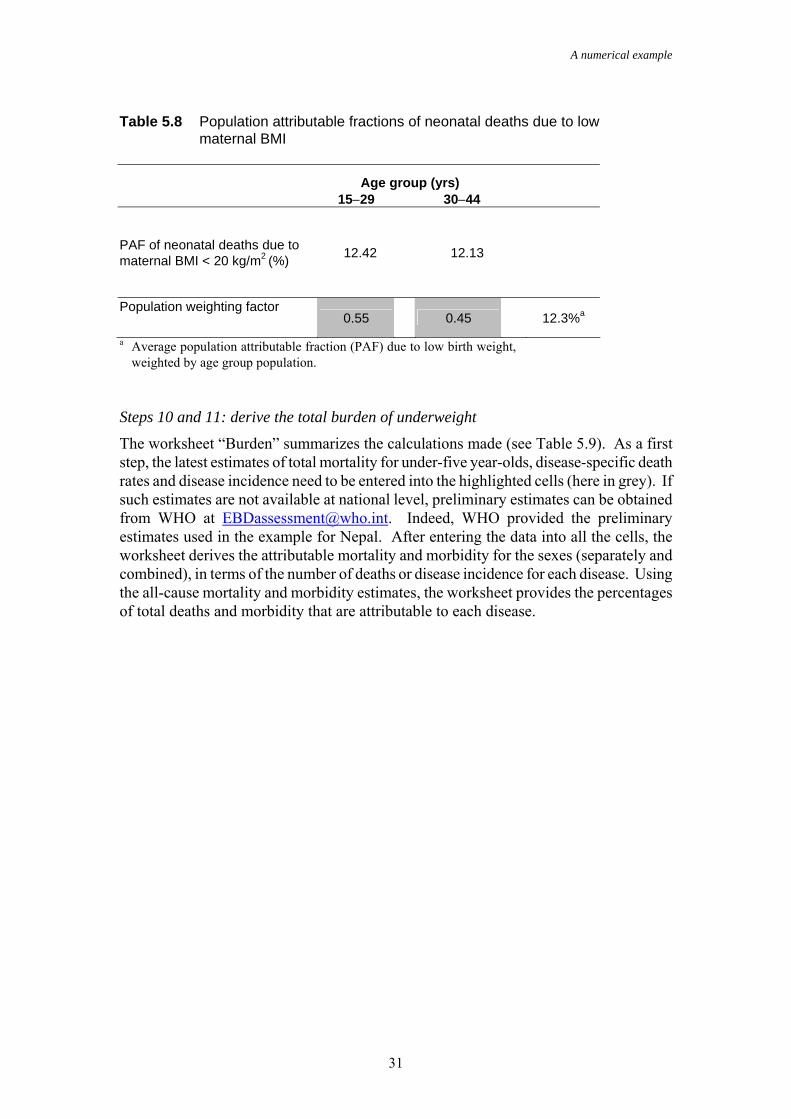
A numerical example
31
Table 5.8 Population attributable fractions of neonatal deaths due to low maternal BMI
Age group (yrs) 15−29 30−44
PAF of neonatal deaths due to maternal BMI < 20 kg/m2 (%) 12.42 12.13
Population weighting factor 0.55 0.45 12.3%a
a Average population attributable fraction (PAF) due to low birth weight, weighted by age group population.
Steps 10 and 11: derive the total burden of underweight
The worksheet “Burden” summarizes the calculations made (see Table 5.9). As a first step, the latest estimates of total mortality for under-five year-olds, disease-specific death rates and disease incidence need to be entered into the highlighted cells (here in grey). If such estimates are not available at national level, preliminary estimates can be obtained from WHO at [email protected]. Indeed, WHO provided the preliminary estimates used in the example for Nepal. After entering the data into all the cells, the worksheet derives the attributable mortality and morbidity for the sexes (separately and combined), in terms of the number of deaths or disease incidence for each disease. Using the all-cause mortality and morbidity estimates, the worksheet provides the percentages of total deaths and morbidity that are attributable to each disease.
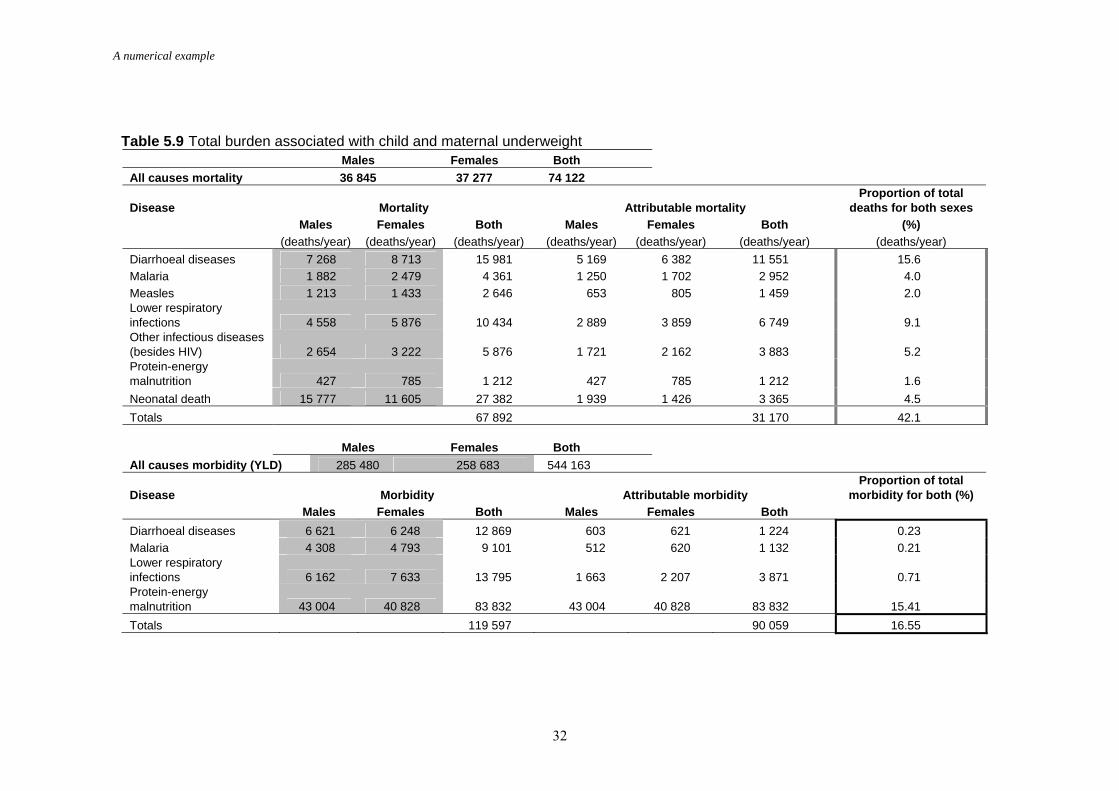
A numerical example
32
Table 5.9 Total burden associated with child and maternal underweight Males Females Both All causes mortality 36 845 37 277 74 122
Disease Mortality Attributable mortality Proportion of total
deaths for both sexes Males Females Both Males Females Both (%) (deaths/year) (deaths/year) (deaths/year) (deaths/year) (deaths/year) (deaths/year) (deaths/year) Diarrhoeal diseases 7 268 8 713 15 981 5 169 6 382 11 551 15.6 Malaria 1 882 2 479 4 361 1 250 1 702 2 952 4.0 Measles 1 213 1 433 2 646 653 805 1 459 2.0 Lower respiratory infections 4 558 5 876 10 434 2 889 3 859 6 749 9.1 Other infectious diseases (besides HIV) 2 654 3 222 5 876 1 721 2 162 3 883 5.2 Protein-energy malnutrition 427 785 1 212 427 785 1 212 1.6 Neonatal death 15 777 11 605 27 382 1 939 1 426 3 365 4.5 Totals 67 892 31 170 42.1 Males Females Both All causes morbidity (YLD) 285 480 258 683 544 163
Disease Morbidity Attributable morbidity Proportion of total
morbidity for both (%) Males Females Both Males Females Both
Diarrhoeal diseases 6 621 6 248 12 869 603 621 1 224 0.23 Malaria 4 308 4 793 9 101 512 620 1 132 0.21 Lower respiratory infections 6 162 7 633 13 795 1 663 2 207 3 871 0.71 Protein-energy malnutrition 43 004 40 828 83 832 43 004 40 828 83 832 15.41 Totals 119 597 90 059 16.55
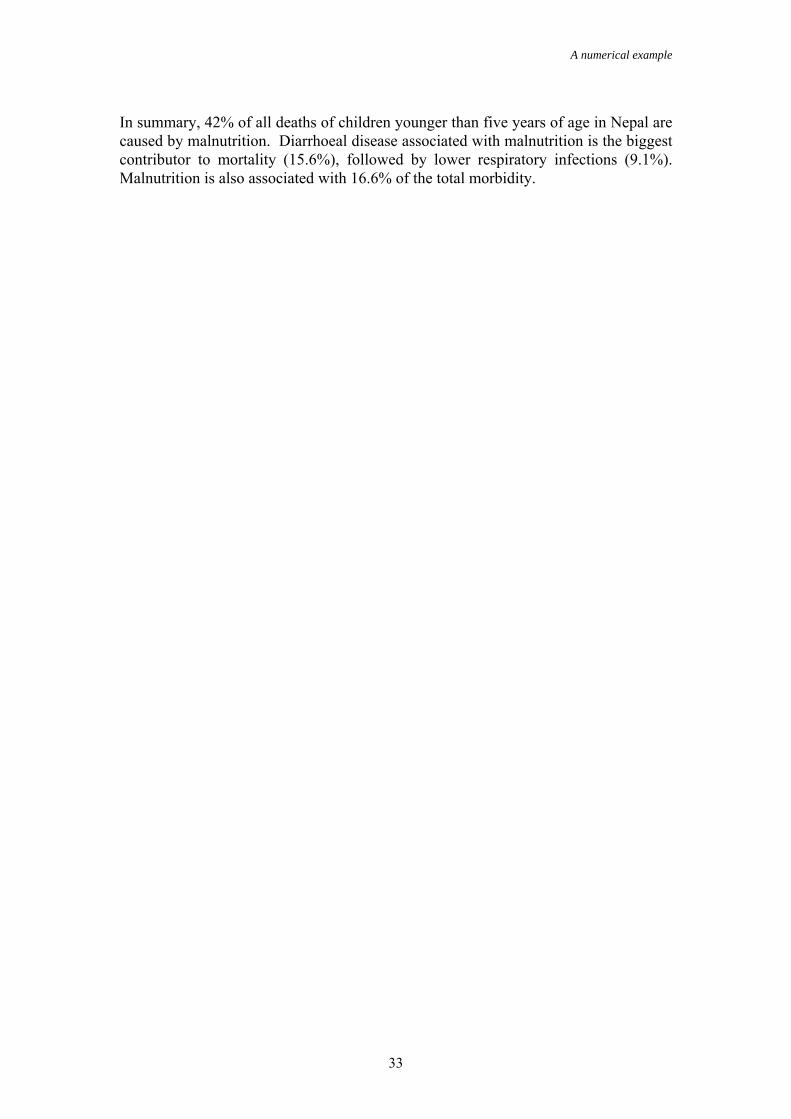
A numerical example
33
In summary, 42% of all deaths of children younger than five years of age in Nepal are caused by malnutrition. Diarrhoeal disease associated with malnutrition is the biggest contributor to mortality (15.6%), followed by lower respiratory infections (9.1%). Malnutrition is also associated with 16.6% of the total morbidity.
Policy action
34
6. Policy action It is of little value to assess child growth if the assessment is not followed-up by policy action to improve the health and nutritional status of children. Policy actions are likely to have the greatest impact on child malnutrition if they are directed at the early stages of child development (i.e. pre-natal, infancy and early childhood) (Shrimpton, 2001). A good start in life will pay off, both in terms of human capital and economic development. Interventions that improve the physical growth and mental development of children will not only decrease the prevalence of underweight, but also prevent its negative functional consequences throughout life. Reducing malnutrition thus not only benefits child health and development in the short term, it also promotes the future, long-term growth and economic progress of the nation. For these reasons, the nutritional status of children should be a primary indicator of socioeconomic development, and good child nutritional status should be considered a precondition for the long-term socioeconomic progress of a society. Children are the most vulnerable members of society and to allow their development to be affected by poor nutrition is to perpetuate the vicious cycle of poverty and malnutrition, and to waste human potential. Governments will be unable to accelerate economic development over the long term until their children are assured of optimal growth and development.
References
35
References ACC/SCN (2000). Fourth report on the world nutrition situation. Geneva, United
Nations Administrative Committee on Coordination/Subcommittee on Nutrition.
Bakketeig LS, Butte N, de Onis M, Kramer M, O'Donnell A, Prada JA, Hoffman HJ (1998). Report of the IDECG Working Group on definitions, classifications, causes, mechanisms and prevention of IUGR. European Journal of Clinical Nutrition, 52(Suppl. 1):S94−S96.
Blakely T, Hales S, Woodward A (2004). Socioeconomic status: assessing the distribution of health risks by socioeconomic position at national and local levels. Geneva, World Health Organization (WHO Environmental Burden of Disease Series, No. 10).
de Onis M, Blössner M (2003). The World Health Organization Global Database on Child Growth and Malnutrition: methodology and applications. International Journal of Epidemiology, 32:518−526.
de Onis M, Garza B, Habicht J-P (1997). Time for a new growth reference. Pediatrics, 100(5):E8.
de Onis M, Blössner M, Villar J (1998). Levels and patterns of intrauterine growth retardation in developing countries. European Journal of Clinical Nutrition, 52(S1):S5−S15.
de Onis M, Monteiro CA, Akre J, Clugston G (1993). The worldwide magnitude of protein-energy malnutrition: an overview from the WHO Global Database on Child Growth. Bulletin of the World Health Organization, 71:703−712.
de Onis M, Blössner M, Borghi E, Morris R, Frongillo E (2004a). Methodology for estimating regional and global trends of child malnutrition. International Journal of Epidemiology (in press).
de Onis M, Blössner M, Borghi E, Frongillo E, Morris R (2004b). Estimates of global prevalence of childhood underweight in 1990 and 2015. Journal of the American Medical Association, 291:2600−2606.
DHS (2001). Nepal demographic and health survey 2001. Calverton, MD, USA, Family Health Division, Ministry of Health [Nepal], New ERA, and ORC Macro, 2002.
Ezzati M, Lopez AD, Rodgers A, Vander Hoorn S, Murray CJ (2002). Comparative Risk Assessment Collaborating Group. Selected major risk factors and global and regional burden of disease. Lancet, 360(9343):1347−1360.
Fishman S, Caulfield LE, de Onis M, Blossner M, Mullany L, Black RE. (2004). Childhood and maternal underweight. In: Ezzati M, Lopez AD, Rodgers A, Murray CJL, eds. Comparative quantification of health risks: global and regional burden of disease attributable to selected major risk factors. Geneva, World Health Organization (in press).
Frongillo EA Jr., de Onis M, Hanson KMP (1997). Socioeconomic and demographic factors are associated with worldwide patterns of stunting and wasting of children. Journal of Nutrition, 127:2302−2309.
References
36
Gomez J, Ramos GR, Frenk S, Cravioto J, Chavez R, Vazquez J (1956). Mortality in second and third degree malnutrition. The Journal of Tropical Pediatrics, 2:77−83.
Habicht JP, Martorell R, Yarbrough C, Malina RM, Klein RE (1974). Height and weight standards for preschool children. How relevant are ethnic differences in growth potential. Lancet, i:611−614.
Heywood AH, Marshall T, Heywood PF (1991). Motor development and nutritional status of young children in Madang, Papua New Guinea. Papua New Guinea Medical Journal, 34:109−116.
Johns T, Eyzaguirre PB (2000). Nutrition for sustainable environments. SCN News, 21:25−29.
King JC, Weininger J (1989). Nutrition during pregnancy. Seminars in Perinatology, 13(3):162−168.
Kramer MS (1987). Determinants of low birth weight: methodological assessment and meta-analysis. Bulletin of the World Health Organization, 65(5):663–737.
Man WD, Weber M, Palmer A, Schneider G, Wadda R, Jaffar S, Mulholland EK, Greenwood BM (1998). Nutritional status of children admitted to hospital with different diseases and its relationship to outcome in The Gambia, West Africa. Tropical Medicine and International Health, 3:678−686.
Martorell R, Rivera J, Kaplowitz H, Pollitt E (1992). Long-term consequences of growth retardation during early childhood. In: Hernandez M, Argente J, eds. Human growth: basic and clinical aspects. Amsterdam, Elsevier Science Publishers, pp. 143−149. Mendez MA, Adair LS (1999). Severity and timing of stunting in the first two years of life affect performance on cognitive tests in late childhood. Journal of Nutrition, 129:1555−1562.
PAHO (1998). Nutrition, health and child development. Washington, DC, Pan American Health Organization (Scientific Publication No. 566).
Pelletier D (1991). Relationships between child anthropometry and mortality in developing countries. Ithaca, NY, Cornell University (Cornell Food and Nutrition Policy Program, Monograph 12).
Pelletier DL (1994). The relationship between child anthropometry and mortality in developing countries: implications for policy, programs and future research. Journal of Nutrition, 124(Suppl. 10):2047S−2081S.
Pelletier DL, Frongillo EA Jr, Habicht JP (1993). Epidemiologic evidence for a potentiating effect of malnutrition on child mortality. American Journal of Public Health, 83:1130−1133.
Pelletier DL, Frongillo EA Jr, Schroeder DG, Habicht JP (1994). A methodology for estimating the contribution of malnutrition to child mortality in developing countries. Journal of Nutrition, 124(Suppl. 10):2106S−2122S.
Pollitt E, Gorman KS, Engle PL, Martorell R, Rivera J (1993). Early supplementary feeding and cognition. Monographs of the Society for Research in Child Development, 58:1−99.
References
37
Pollitt E, Husaini MA, Harahap H, Halati S, Nugraheni A, Sherlock AO (1994). Stunting and delayed motor development in rural West Java. American Journal of Human Biology, 6:627−635.
Prüss-Üstün A, Mathers C, Corvalán, Woodward A (2003). Introduction and methods: assessing the environmental burden of disease at national and local levels. Geneva, World Health Organization, (WHO Environmental Burden of Disease Series, No. 1).
Rice AL, Sacco L, Hyder A, Black RE (2000). Malnutrition as an underlying cause of childhood deaths associated with infectious diseases in developing countries. Bulletin of the World Health Organization, 78:1207−1221.
Shrimpton R, Victora CG, de Onis M, Lima RC, Blossner M, Clugston G (2001). Worldwide timing of growth faltering: implications for nutritional interventions. Pediatrics, 107(5). Internet communication at http://www.pediatrics.org/cgi/content/full/107/5/e75.
Spurr GB, Barac-Nieto M, Maksud MG (1977). Productivity and maximal oxygen consumption in sugar cane cutters. American Journal of Clinical Nutrition, 30:316−321.
Toole MF, Malkki RM (1992). Famine-affected, refugee, and displaced populations: recommendations for public health issues. Morbidity and Mortality Weekly Report, 41:1−25.
Trowell HC (1948). Malignant malnutrition (kwashiorkor). Transactions of the Royal Society of Tropical Medicine and Hygiene, 42:417.
UNICEF (1990). Strategy for improved nutrition of children and women in developing countries. New York, NY, United Nations Children’s Fund.
Villar J, Ezcurra EJ, Gurtner de la Fuente V, Campodonico L (1994). Pre-term delivery syndrome: the unmet need. Research and Clinical Forums, 16:9−38.
Waterlow JC, Buzina R, Keller W, Lane JM, Nichaman MZ, Tanner JM (1977). The presentation and use of height and weight data for comparing the nutritional status of groups of children under the age of 10 years. Bulletin of the World Health Organization, 55:489−498.
WEHAB (2002). A framework for action on health and the environment. World Summit on Sustainable Development, Johannesburg, South Africa, August 2002.
WHO (1983). Measuring change in nutritional status. Geneva, World Health Organization.
WHO (1992). Low birth weight – a tabulation of available information. Geneva, World Health Organization (Maternal Health and Safe Motherhood Programme, WHO/MCH/92.2). Updated version of 2001.
WHO (1995a). Physical status: the use and interpretation of anthropometry. Report of a WHO Expert Committee. Geneva, World Health Organization (Technical Report Series No. 854).
WHO (1995b). Maternal anthropometry and pregnancy outcomes – a WHO collaborative study. Bulletin of the World Health Organization, 73(Suppl.):1−98.
References
38
WHO (1995c). WHO working group on infant growth. An evaluation of infant growth: the use and interpretation of anthropometry in infants. Bulletin of the World Health Organization, 73:165−74.
WHO (1995d). Field guide on rapid nutritional assessment in emergencies. Alexandria, World Health Organization Regional Office for the Eastern Mediterranean.
WHO (2002). World Health Report 2002. Geneva, World Health Organization.
WHO (2003). Global database on child growth and malnutrition. Geneva, World Health Organization (www.who.int/nutgrowthdb, accessed January 2003).
WHO (2004). Inheriting the world. The atlas of children's health and the environment. Geneva, World Health Organization.
Williams RL, Creasy RK, Cunningham GC, Hawes WE, Norris FD, Tashiro M (1982). Fetal growth and perinatal viability in California. Obstetrics and Gynecology, 59:624−632.
Yip R, Scanlon K (1994). The burden of malnutrition: a population perspective. Journal of Nutrition, 124:2043S−2046S.
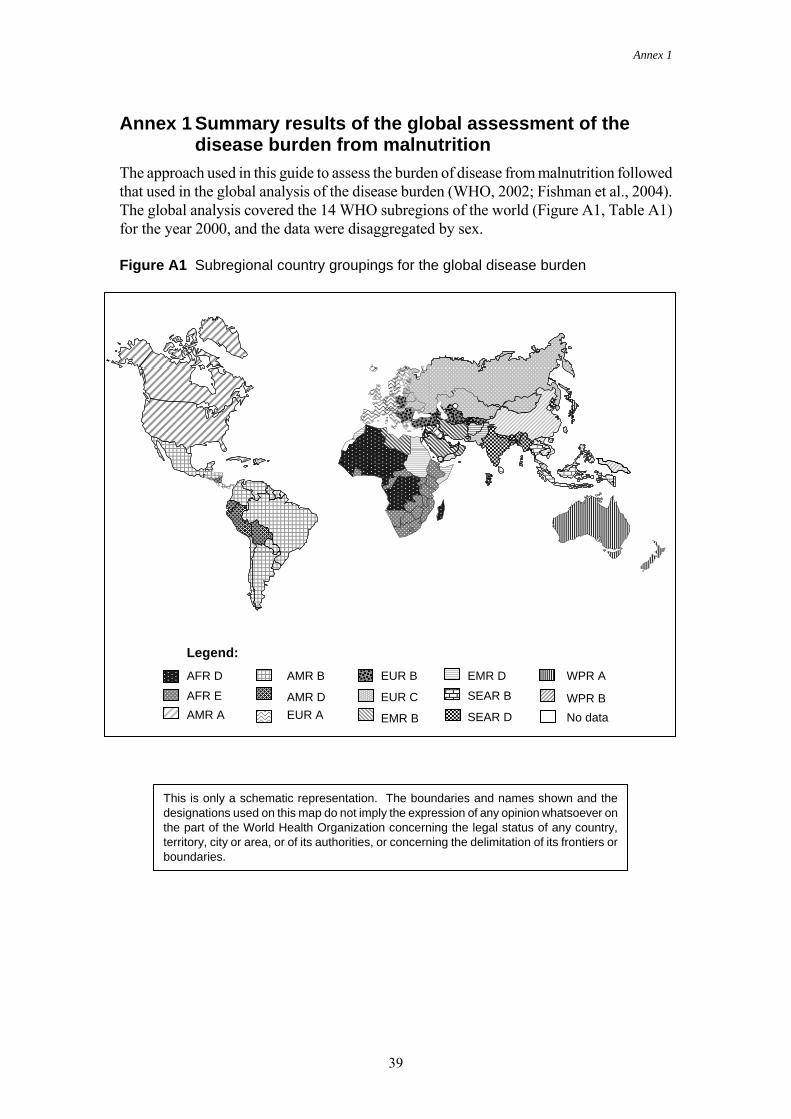
Annex 1
39
Annex 1 Summary results of the global assessment of the disease burden from malnutrition
The approach used in this guide to assess the burden of disease from malnutrition followed that used in the global analysis of the disease burden (WHO, 2002; Fishman et al., 2004). The global analysis covered the 14 WHO subregions of the world (Figure A1, Table A1) for the year 2000, and the data were disaggregated by sex. Figure A1 Subregional country groupings for the global disease burden
AMR B
AMR D EUR A
EMR D
SEAR B
SEAR D
WPR A
WPR B No data
Legend: AFR D
AFR E AMR A
EUR B
EUR C
EMR B
This is only a schematic representation. The boundaries and names shown and the designations used on this map do not imply the expression of any opinion whatsoever on the part of the World Health Organization concerning the legal status of any country, territory, city or area, or of its authorities, or concerning the delimitation of its frontiers or boundaries.
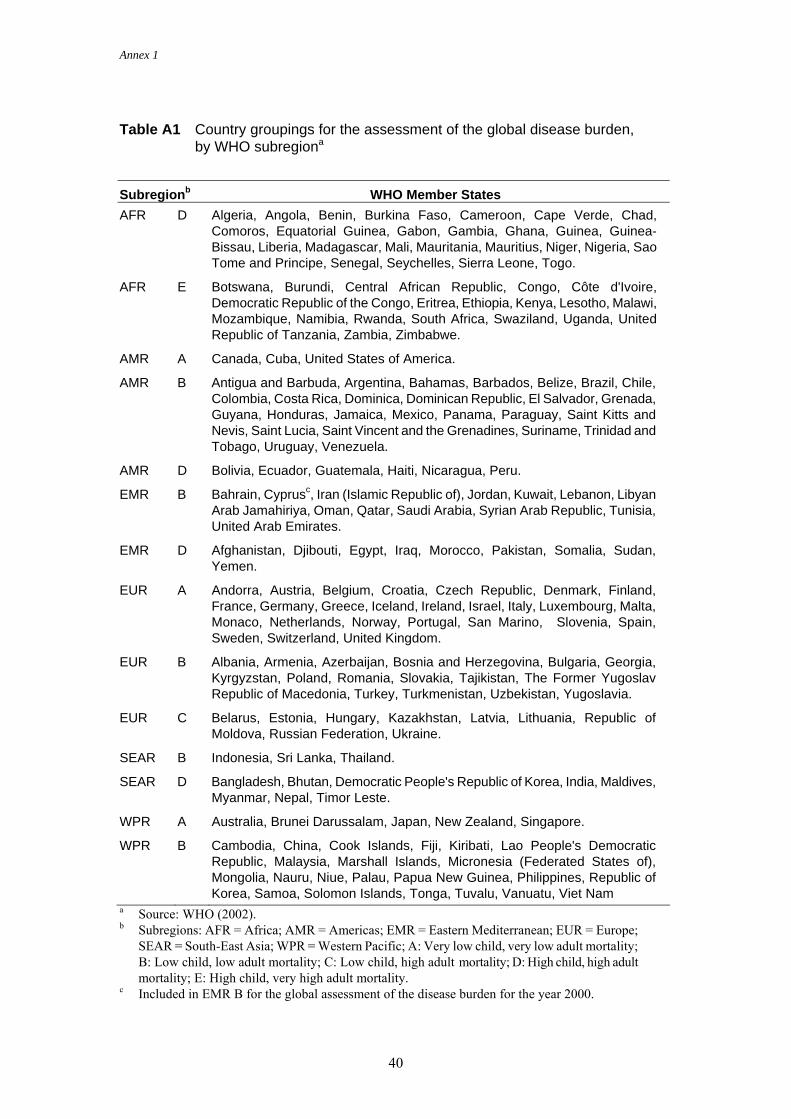
Annex 1
40
Table A1 Country groupings for the assessment of the global disease burden, by WHO subregiona
Subregionb WHO Member States AFR D Algeria, Angola, Benin, Burkina Faso, Cameroon, Cape Verde, Chad,
Comoros, Equatorial Guinea, Gabon, Gambia, Ghana, Guinea, Guinea-Bissau, Liberia, Madagascar, Mali, Mauritania, Mauritius, Niger, Nigeria, Sao Tome and Principe, Senegal, Seychelles, Sierra Leone, Togo.
AFR E Botswana, Burundi, Central African Republic, Congo, Côte d'Ivoire, Democratic Republic of the Congo, Eritrea, Ethiopia, Kenya, Lesotho, Malawi, Mozambique, Namibia, Rwanda, South Africa, Swaziland, Uganda, United Republic of Tanzania, Zambia, Zimbabwe.
AMR A Canada, Cuba, United States of America.
AMR B Antigua and Barbuda, Argentina, Bahamas, Barbados, Belize, Brazil, Chile, Colombia, Costa Rica, Dominica, Dominican Republic, El Salvador, Grenada, Guyana, Honduras, Jamaica, Mexico, Panama, Paraguay, Saint Kitts and Nevis, Saint Lucia, Saint Vincent and the Grenadines, Suriname, Trinidad and Tobago, Uruguay, Venezuela.
AMR D Bolivia, Ecuador, Guatemala, Haiti, Nicaragua, Peru.
EMR B Bahrain, Cyprusc, Iran (Islamic Republic of), Jordan, Kuwait, Lebanon, Libyan Arab Jamahiriya, Oman, Qatar, Saudi Arabia, Syrian Arab Republic, Tunisia, United Arab Emirates.
EMR D Afghanistan, Djibouti, Egypt, Iraq, Morocco, Pakistan, Somalia, Sudan, Yemen.
EUR A Andorra, Austria, Belgium, Croatia, Czech Republic, Denmark, Finland, France, Germany, Greece, Iceland, Ireland, Israel, Italy, Luxembourg, Malta, Monaco, Netherlands, Norway, Portugal, San Marino, Slovenia, Spain, Sweden, Switzerland, United Kingdom.
EUR B Albania, Armenia, Azerbaijan, Bosnia and Herzegovina, Bulgaria, Georgia, Kyrgyzstan, Poland, Romania, Slovakia, Tajikistan, The Former Yugoslav Republic of Macedonia, Turkey, Turkmenistan, Uzbekistan, Yugoslavia.
EUR C Belarus, Estonia, Hungary, Kazakhstan, Latvia, Lithuania, Republic of Moldova, Russian Federation, Ukraine.
SEAR B Indonesia, Sri Lanka, Thailand.
SEAR D Bangladesh, Bhutan, Democratic People's Republic of Korea, India, Maldives, Myanmar, Nepal, Timor Leste.
WPR A Australia, Brunei Darussalam, Japan, New Zealand, Singapore.
WPR B Cambodia, China, Cook Islands, Fiji, Kiribati, Lao People's Democratic Republic, Malaysia, Marshall Islands, Micronesia (Federated States of), Mongolia, Nauru, Niue, Palau, Papua New Guinea, Philippines, Republic of Korea, Samoa, Solomon Islands, Tonga, Tuvalu, Vanuatu, Viet Nam
a Source: WHO (2002). b Subregions: AFR = Africa; AMR = Americas; EMR = Eastern Mediterranean; EUR = Europe;
SEAR = South-East Asia; WPR = Western Pacific; A: Very low child, very low adult mortality; B: Low child, low adult mortality; C: Low child, high adult mortality; D: High child, high adult mortality; E: High child, very high adult mortality.
c Included in EMR B for the global assessment of the disease burden for the year 2000.
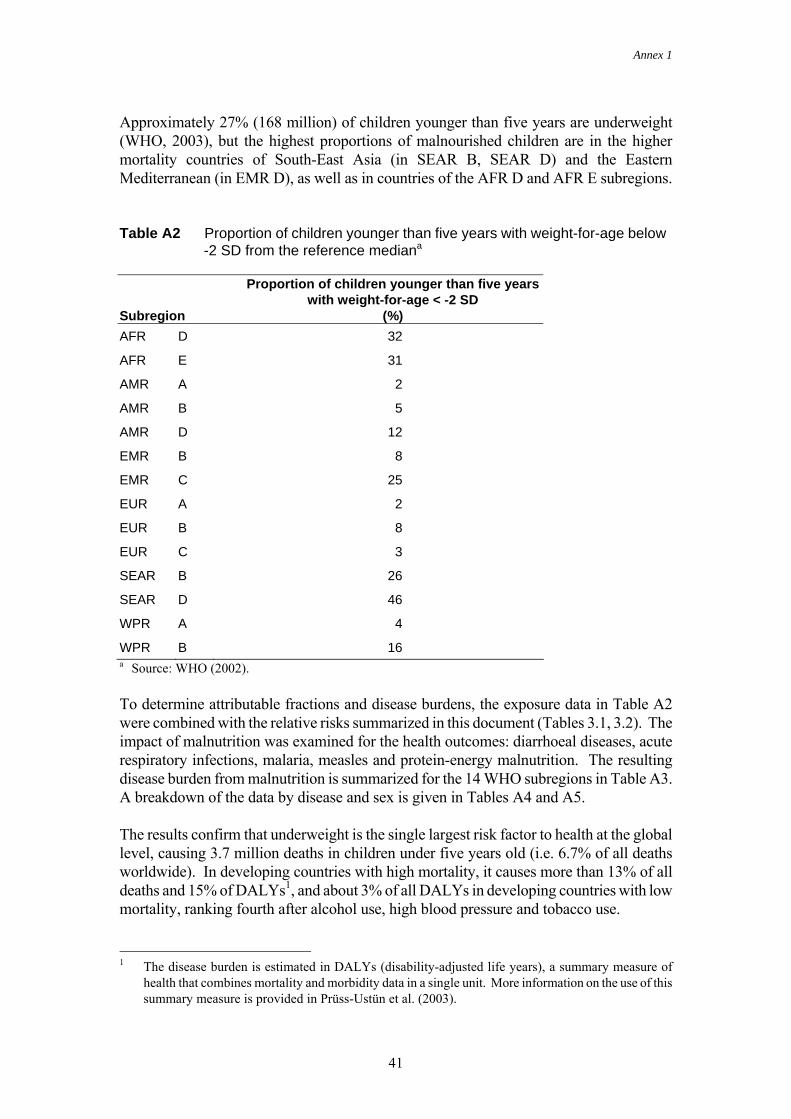
Annex 1
41
Approximately 27% (168 million) of children younger than five years are underweight (WHO, 2003), but the highest proportions of malnourished children are in the higher mortality countries of South-East Asia (in SEAR B, SEAR D) and the Eastern Mediterranean (in EMR D), as well as in countries of the AFR D and AFR E subregions. Table A2 Proportion of children younger than five years with weight-for-age below
-2 SD from the reference mediana
Subregion
Proportion of children younger than five years with weight-for-age < -2 SD
(%) AFR D 32
AFR E 31
AMR A 2
AMR B 5
AMR D 12
EMR B 8
EMR C 25
EUR A 2
EUR B 8
EUR C 3
SEAR B 26
SEAR D 46
WPR A 4
WPR B 16 a Source: WHO (2002). To determine attributable fractions and disease burdens, the exposure data in Table A2 were combined with the relative risks summarized in this document (Tables 3.1, 3.2). The impact of malnutrition was examined for the health outcomes: diarrhoeal diseases, acute respiratory infections, malaria, measles and protein-energy malnutrition. The resulting disease burden from malnutrition is summarized for the 14 WHO subregions in Table A3. A breakdown of the data by disease and sex is given in Tables A4 and A5. The results confirm that underweight is the single largest risk factor to health at the global level, causing 3.7 million deaths in children under five years old (i.e. 6.7% of all deaths worldwide). In developing countries with high mortality, it causes more than 13% of all deaths and 15% of DALYs1, and about 3% of all DALYs in developing countries with low mortality, ranking fourth after alcohol use, high blood pressure and tobacco use.
1 The disease burden is estimated in DALYs (disability-adjusted life years), a summary measure of
health that combines mortality and morbidity data in a single unit. More information on the use of this summary measure is provided in Prüss-Ustün et al. (2003).
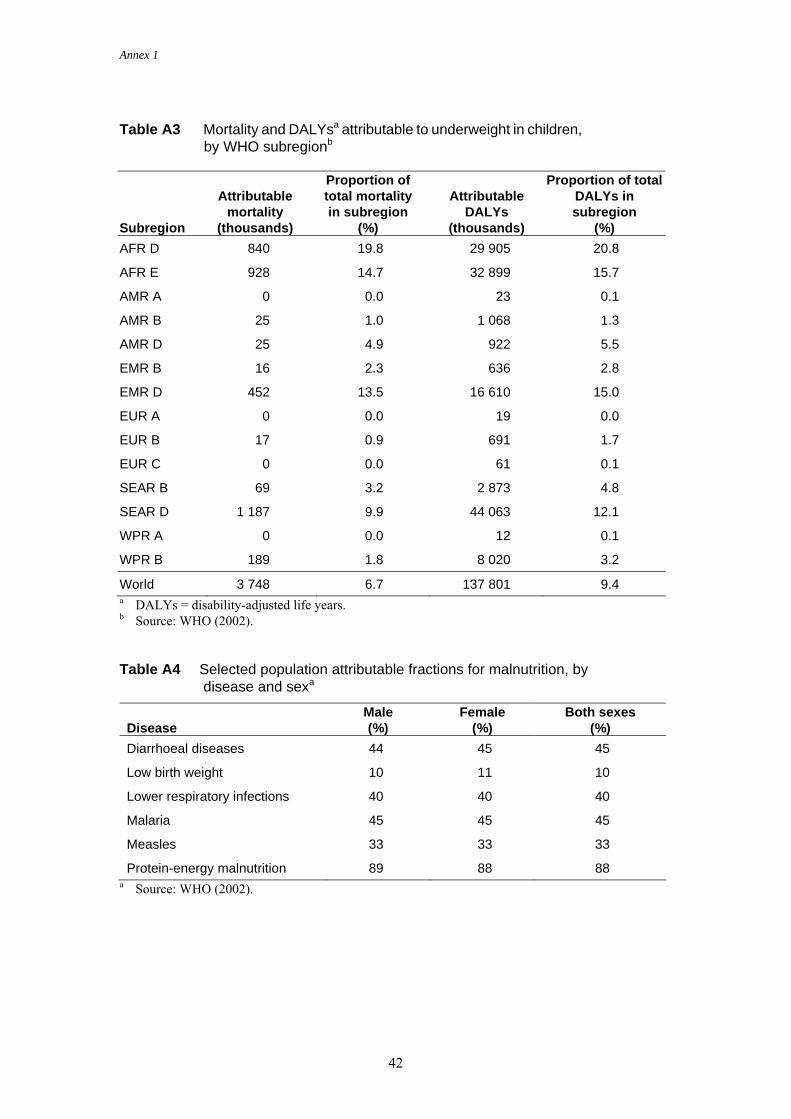
Annex 1
42
Table A3 Mortality and DALYsa attributable to underweight in children, by WHO subregionb
Subregion
Attributable mortality
(thousands)
Proportion of total mortality in subregion
(%)
Attributable DALYs
(thousands)
Proportion of total DALYs in subregion
(%) AFR D 840 19.8 29 905 20.8
AFR E 928 14.7 32 899 15.7
AMR A 0 0.0 23 0.1
AMR B 25 1.0 1 068 1.3
AMR D 25 4.9 922 5.5
EMR B 16 2.3 636 2.8
EMR D 452 13.5 16 610 15.0
EUR A 0 0.0 19 0.0
EUR B 17 0.9 691 1.7
EUR C 0 0.0 61 0.1
SEAR B 69 3.2 2 873 4.8
SEAR D 1 187 9.9 44 063 12.1
WPR A 0 0.0 12 0.1
WPR B 189 1.8 8 020 3.2
World 3 748 6.7 137 801 9.4 a DALYs = disability-adjusted life years. b Source: WHO (2002). Table A4 Selected population attributable fractions for malnutrition, by
disease and sexa
Male Female Both sexes Disease (%) (%) (%) Diarrhoeal diseases 44 45 45
Low birth weight 10 11 10
Lower respiratory infections 40 40 40
Malaria 45 45 45
Measles 33 33 33
Protein-energy malnutrition 89 88 88 a Source: WHO (2002).
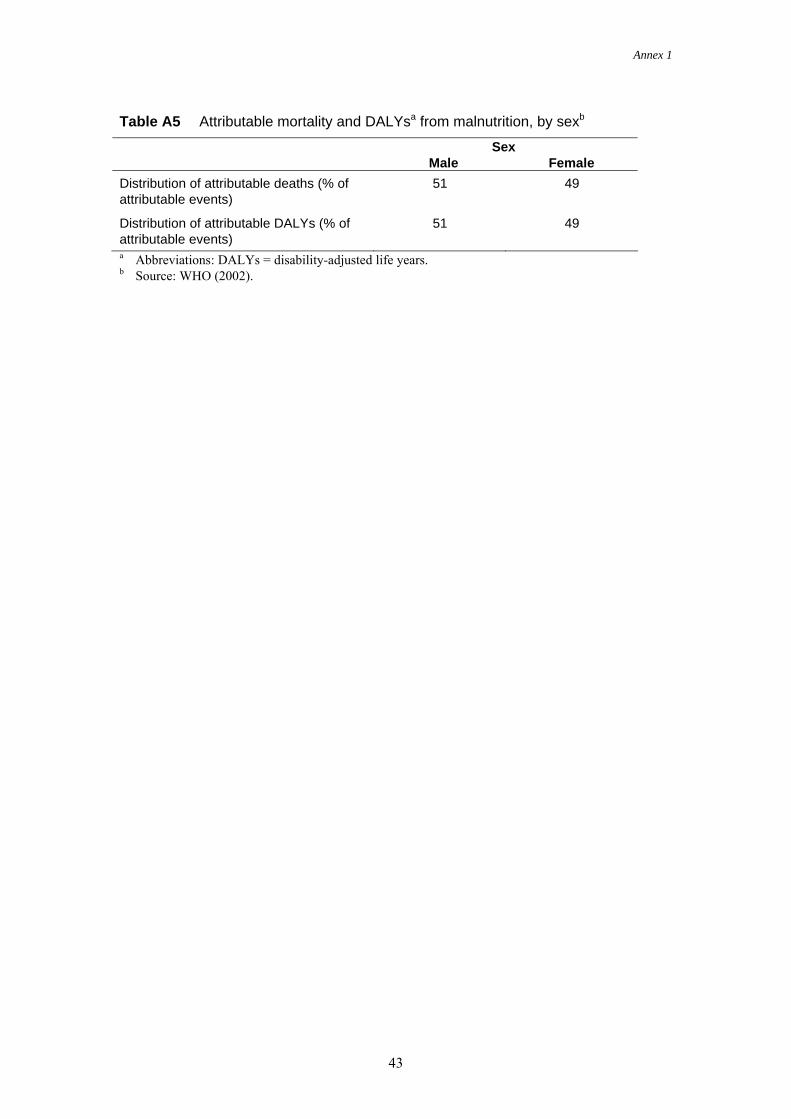
Annex 1
43
Table A5 Attributable mortality and DALYsa from malnutrition, by sexb
Sex Male Female
Distribution of attributable deaths (% of attributable events)
51 49
Distribution of attributable DALYs (% of attributable events)
51 49
a Abbreviations: DALYs = disability-adjusted life years. b Source: WHO (2002).