maldives household income and expenditure survey...
TRANSCRIPT
i
MALDIVES HOUSEHOLD INCOME AND EXPENDITURE SURVEY 2002/03
Table of Contents
Map of Maldives............................................................................................................... v List of Acronyms and Abbreviations................................................................................. xii Chapter 1: The Household Income and Expenditure Survey............................................ 1
1.1 Introduction..................................................................................................... 1 1.2 Main Aims and Purposes................................................................................ 2 1.3 Methodology................................................................................................... 2 1.3.1 Sample Design............................................................................................ 2 1.3.2 Enumeration and analytical problems.......................................................... 3 1.4 Data Entry, Editing and Processing........................................................ ……. 5 1.5 Limitations.............................................................................................. ……. 5 1.6 Structure of the Report.................................................................................... 6 1.7 Using the CD-ROM......................................................................................... 6
Chapter 2: Income Poverty............................................................................................... 7
2.1 Introduction..................................................................................................... 8 2.2 Concepts......................................................................................................... 9 2.2.1 Income versus Expenditure................................................................... 9 2.2.2 Imputing Own Produced Consumption......................................... ……. 10 2.2.3 Applied Concepts................................................................................... 11 2.2.4 Purchasing Power Parities (PPP)............................................................ 12 2.3 Income Levels................................................................................................. 13 2.4 Income Poverty....................................................................................... ……. 17 2.4.1 Headcount Ratios................................................................................... 18 2.4.2 Poverty Dominance with Unknown Poverty Lines................................... 19 2.4.3 Poverty Gap Ratios................................................................................ 21 2.5 Incomes Changes over Time.......................................................................... 22
Chapter 3: Working Age Population and Employment...................................................... 28
3.1 Introduction..................................................................................................... 28 3.2 Sectoral Employment...................................................................................... 30 3.3 Employment by occupational groups............................................................... 33 3.4 Access to Productive Employment by women................................................. 34
Chapter 4: Household Income and Expenditure............................................................... 35
4.1 Introduction..................................................................................................... 35 4.2 Expenditure patterns........................................................................................ 36 4.3 Expenditure patterns by income groups.......................................................... 37
Chapter 5: Household Savings, Finances and Wealth.............................................. …… 40
5.1 Introduction..................................................................................................... 41 5.2 Perceptions of household status and income changes.................................... 41 5.3 Household savings and their uses................................................................... 43 5.4 Consumer Durables........................................................................................ 44 5.5 Financial transactions of the households......................................................... 46
Appendix 1. Sampling design........................................................................................... 49
Introduction............................................................................................................ 49 Sample design....................................................................................................... 50 Stratification and allocation of sample.................................................................... 51 Selection method and effect on variance............................................................... 53 Survey procedure.................................................................................................. 54
ii
Estimation method................................................................................................. 56 Appendix 2. The Measurement of Vulnerability and Poverty............................................. 61
1.1 Introduction...................................................................................................... 61 1.2 Vulnerability and Poverty Indicators................................................................. 61 1.3 A Non-Dichotomous Concept of Vulnerability and Poverty.............................. 62 1.4 Measuring Poverty Dominance without Poverty Lines...................................... 63 1.5 The Theory of Poverty Dominance................................................................... 63
Attachment A. Atolls and Islands by Region......................................................................63 Attachment B. COICOP classification............................................................................... 72 Attachment C. Questionnaire set in English and Dhivehi..……………………………………76 Attachment D. Staff involved in the data collection and Survey Budget. . ….………………124 Statistical Annex …………………………………………………………………………………..127
iii
List of Tables and FiguresTable 1.3.1 Population Adjustment Factors by Area and Gender................................................3
Figure 2.2.1 Monthly rent by location and number of rooms......................................................11
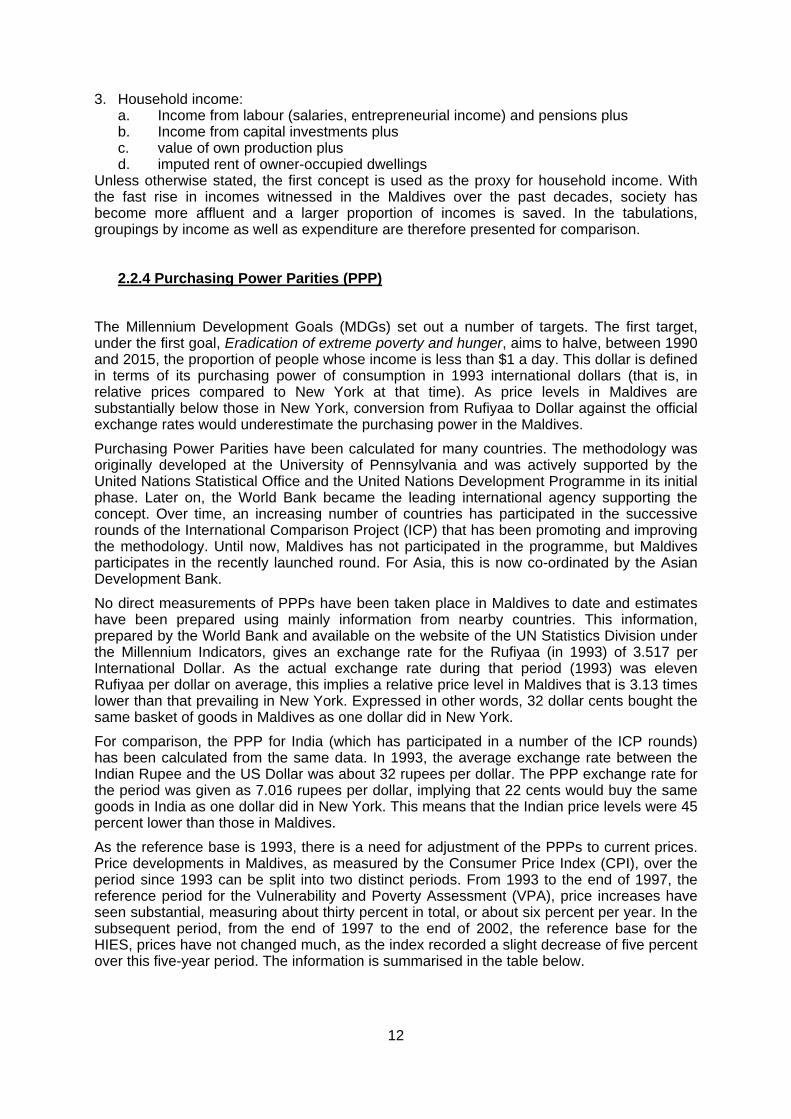
Table 2.2.2 Consumer Price Indices and PPPs in Maldives......................................................13
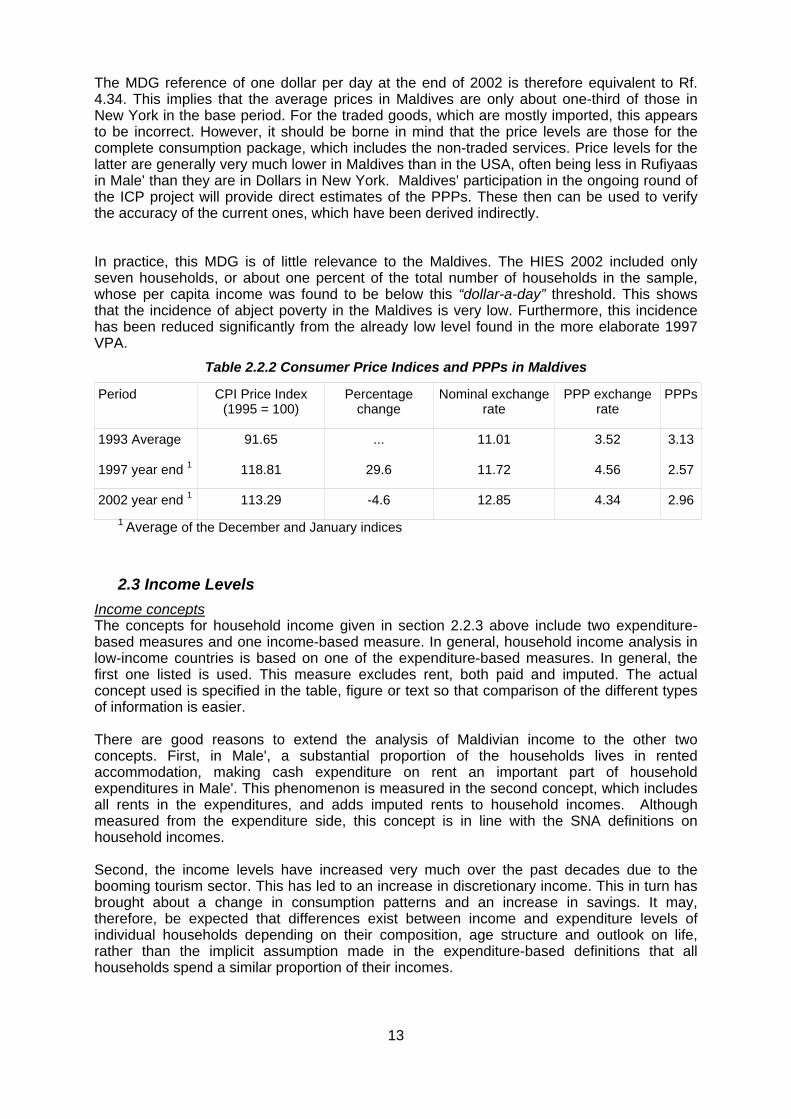
Table 2.3.1 Distribution of households by income and expenditure quintiles ............................14
Table 2.3.2 Intensity of purchases of household durables by income/expenditure quintiles .....15
Figure 2.3.3 Regional grouping of atolls ....................................................................................16
Figure 2.3.4 Household consumption expenditure per person per day, in Rufiyaa ...................17
Figure 2.4.1 Income distribution and averages for Maldives, 2002/03 ......................................17
Table 2.4.2 Average household income, (excluding imputed rent), 1997/98 & 2002/03 ...........18
Table 2.4.3 Population below various poverty lines, 1997/98 & 2002/03 ...................................19
Figure 2.4.4 Headcount ratio with a poverty line of half the median, or Rf. 18 pppd ..................19
Figure 2.4.5 Headcount ratios for different poverty lines including imputed rent ......................20
Figure 2.4.6 Headcount ratios for different poverty lines (excluding imputed rent)...................20
Figure 2.4.7 Poverty Gap Ratio with a poverty line of half the median, or Rf. 18 pppd .............22
Figure 2.5.1 Change in poverty at various poverty lines between 1997/98 and 2002/03 ...........23
Figure 2.5.2 Households reporting decrease/increase in income between 1997and 2002 ........24
Figure 2.5.3 Percentage of households reporting consumer durables in 1997and 2002 ...........24
Figure 2.5.4 Average per capita expenditures (excluding Rent) in 1997and 2002 ...................25
Figure 2.5.5 Average per capita expenditures by quintile, Male' and Atolls, 1997and 2002 .....25
Figure 2.5.6 Headcount ratios for poverty line of Rf. 7.5 (excluding imputed rent)....................26
Figure 2.5.7 Headcount ratios for poverty line of Rf. 15 (excluding imputed rent).....................27
Figure 3.1.1 Working-age population by activity status and sex................................................29
Figure 3.1.2 Estimated labour force participation rates by sex, Male' and atolls .......................29
Figure 3.1.3 Estimated labour force by sex, Male' and atolls ....................................................30
Figure 3.2.1 Summary of employment of Maldivians by economic activity................................31
Figure 3.2.2 Labour force shares by employment status...........................................................31
Figure 3.2.3 Labour force shares by employment status and sex .............................................32
Figure 3.2.4 Employment shares of Male' and atolls by economic activity ................................32
Figure 3.2.5 Employment by economic activity and region........................................................33
Figure 3.3.1 Employment by occupational groups.....................................................................34
Figure 3.4.1 Average monthly income by sex for Male' and the atolls (Rf. Per month) .............34
Figure 4.1.1 Household incomes by source ...............................................................................35
Figure 4.2.1 Cash expenditures by item group, Male' 1993, Male' and the atolls 2002/03 .......37
Table 4.2.2 Summary of expenditure by income group for Male' and the atolls .......................37
Figure 4.3.1 Expenditures by income and product groups for Male' .........................................38
Figure 4.3.2 Expenditures by income and product groups for the Atolls ..................................39
Figure 5.2.1 Perception of household economic status, Republic, Male' and Atolls .................41
iv
Figure 5.2.2 Perception of decrease and increase in Income by Income Group – Republic .....42
Figure 5.2.3 Change in income by region and income quintiles ................................................42
Figure 5.2.4 Actual income changes and perception of increases by income quintiles.............43
Figure 5.3.1 Use of excess funds as reported by individual earners .........................................43
Figure 5.3.2 Percentage of households reporting difficulties in balancing their budgets...........44
Table 5.4.1 Grouping of consumer durables..............................................................................44
Figure 5.4.2 Purchases of consumer durables as percentage of possessions..........................45
Figure 5.4.3 Purchases of consumer durables as percentage of total expenditures .................45
Figure 5.4.4 Purchases of consumer durables as percentage of household expenditures .......45
Figure 5.5.1 Construction expenditure compared to household consumption expenditures .....46
Figure 5.5.2 Borrowing and lending by households..................................................................46
Figure 5.5.3 Household borrowing and loan repayments during the year .................................47
A1. Table 1: Number of Households and Enumeration Blocks by Development Regions.........50
A1. Table 2: Allocation of Sample in Domains...........................................................................52
A1. Table 3: Allocation of Sample in Atoll Strata .......................................................................53
A1. Table 4: Overlapping of samples in Male ............................................................................55
A2. Figure 1. Frequency distributions for two regions A and B.................................................63
A2. Figure 2. Cumulative frequency distributions for two regions A and B ...............................64
A2. Figure 3. Intersecting cumulative frequency distributions for regions A and B....................64
A2. Figure 4 Poverty gap index for two regions A and B ...........................................................65

v
Map of Maldives
Note: A listing of the atolls and islands in each region is given as Attachment A to this report
vi
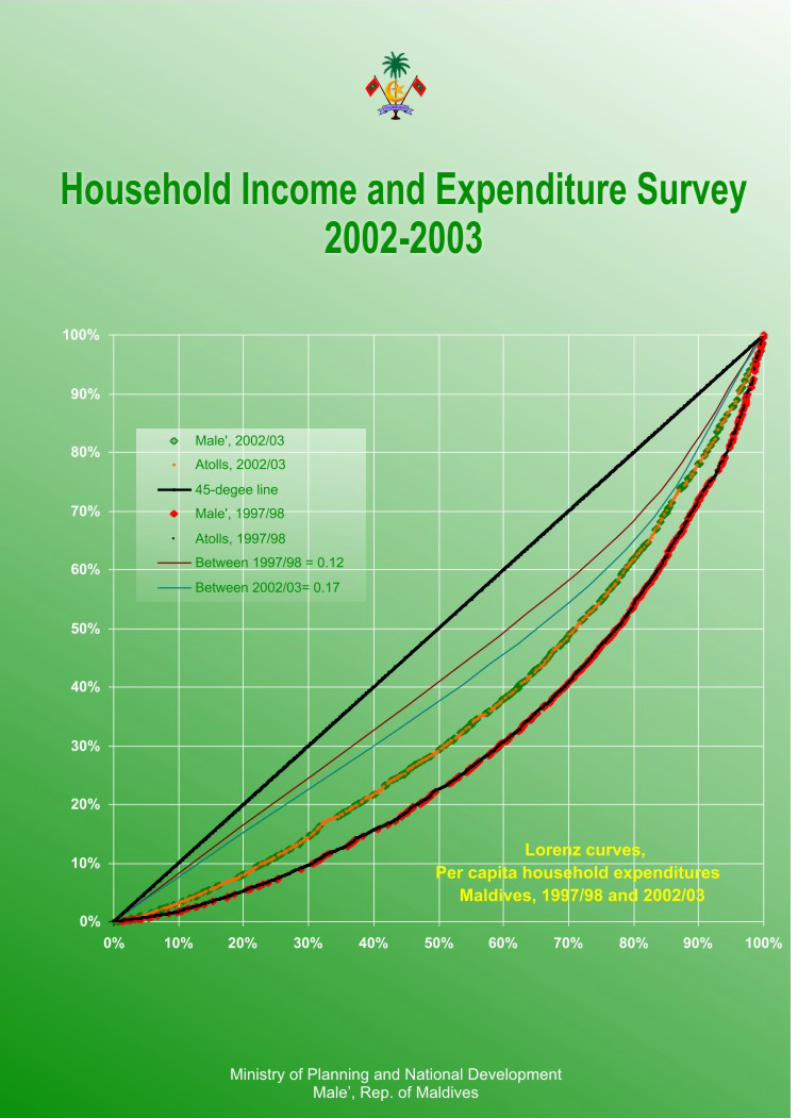
Summary of findings: Maldives Household Income and Expenditure Survey 2002/3 The Maldivian population has benefited from the fast economic growth witnessed during the past many years. In both the capital Male' and the Atolls, incomes have increased significantly from 1997. Between 1997/98 and 2002/03, per capita incomes in Northern and Central Regions went up by thirteen and seventeen percent respectively, while in the other regions and Male', these increased much more, by about fifty percent, over the same period. Chapter 1: The Household Income and Expenditure Survey The principal purposes of the Household Income and Expenditure Survey (HIES) 2002/03 were to obtain information on household expenditures for the national accounts; to prepare new weights for the Consumer Price Index (CPI) for Male' and introduce the CPI in some of the atoll capitals; and to measure income and poverty for different groups and regions, with special reference to the performance under the Millennium Development Goals (MDG). The survey was conducted in four rounds during the months of September and December 2002 and March and June 2003. It was designed as a scientific random sample with separate strata for Male' and the five development regions. A total of 834 households questionnaires were obtained during the survey, which was about 94% of the 880 in the design. In addition to post-enumeration adjustments to take care of this non-response, corrections were made to bring the survey population estimates to the level of the total estimated population at the end of 2002. The data quality of the expenditure estimates obtained from the recall and diary procedures was analysed and it was found that the information in the one-week diary was incomplete. Except for cross-checking and verification, this information was therefore not used. The quality of the information on quantities of consumption, expressed in terms of unit-values, showed such wide variations, even after significant edits, that it was concluded that nutritional values of the food expenditures could not be estimated with any degree of reliability. This subject has, therefore, not been included in the report. Chapter 2: Income Poverty Concepts and definitions Poverty has many dimensions, but in the HIES the analysis is limited to income poverty. Over time, poverty has been defined in many different ways. The concept of absolute poverty tries to determine the minimum income required to meet physical subsistence needs such as food, clothing and shelter, sometimes extended to essential services of health, education, transport, etc. It is usually based on nutritional requirements to derive a minimum food budget which is then raised for the other necessities. The concept of relative poverty defines poverty in relation to standards that exist in the society. A common poverty line in such cases is half the median per capita income. As the choice of where to set “the” poverty line is highly arbitrary, this report applies the concept of poverty dominance and has seven different poverty lines to measure the status in the different regions and population groups as well as the changes since the first measurements carried out during the Vulnerability and Poverty Assessment (VPA) 1998. The three poverty lines used in the VPA were set at Rf.7.5, Rf.10 and Rf.15 respectively. These lines were half the atoll median income for the lowest of the three and the median income for the highest respectively with the Rf.10 line used as in-between line. These lines were maintained for the HIES, without adjustments for inflation as this has been negligible during this period. In addition the dollar-a-day MDG poverty line was introduced, poverty lines based on nutrition requirements of 2000 kcal per person per day and food at one-third of total household expenditures were derived using regression analysis. Finally, the relative poverty line of half the median income in 2002/03 for the overall population was derived. These seven poverty lines ranged from Rf.4.34 for the MDG line to Rf.23 per person per day. It may be
vii
noted that the MDG line is measured in Purchasing Power Parity (PPP) dollars. The calculations used to derive the PPP exchange rate have been described in this chapter of the report. A number of methodological issues required special attention during the compilation of the report. These included the methods used to impute own-produced consumption of goods and house rents, the measurement of income in terms of either income or expenditures and the concepts used to measure this income. As for the consumption of own-produced goods, valuation was done at prices prevailing in the local markets. This information could not always be verified, especially on the smaller islands covered in the survey as few cash transactions take place for the most widely used local items such as fish, coconuts and other local produce. The extent of this problem was even larger for the estimation of rental values of owner-occupied dwellings on the islands as only a very small proportion of houses are rented out. In general, the measurement of expenditures is more accurate in household surveys in developing countries than the measurement of incomes, even if no under-reporting takes place. The main reasons are that incomes fluctuate more than expenditures and that self-employed people often report gross income (or turnover) from their activities without deducting the costs of goods, materials and services used. Therefore, the expenditure approach is generally used in analysis. For the poorest countries, where the marginal propensity to consume is close to one, the difference between income and expenditure is small and this approach will not result in bias. In Maldives, incomes have grown very fast over the past decade and all evidence shows that discretionary expenditures are now rather high. This means that there are substantial savings in the society, which means that using expenditures as a proxy for income introduces a downward bias in inequality and an over-estimate of poverty. Furthermore, an increasing share of the earnings is obtained from wage employment, thereby reducing the potential bias in the estimates from the income side. In the report, most of the analysis uses the expenditure approach, but in the final chapter, describing household savings and wealth, the income data have also been used. It may be noted that there is a rather close correlation between the income and expenditure data for the individual households. More than half of the households fall within the same quintile (20-percent group) when measured from either the income or expenditure side and about seven out of eight households are within the same or adjacent income groups. For national accounts purposes, imputed values of own-consumption of goods and housing rents are included in household consumption. However, given the small number of houses rented in the atolls and the relatively large share of housing costs in overall expenditures, this approach is not the most suitable for all uses of the data, especially with respect to poverty analysis. Therefore, most of the analysis in the report is presented twice, using the measures of income including and excluding rent. On a few occasions, only imputed rent is excluded from income. The actual measure used in each case is always given. Survey results Household consumption expenditures in Male' were about Rf.74 per person per day including rent and two-thirds of this, or fifty Rufiyaa per person per day excluding rents. Expenditures in the atolls are at roughly half this level on average. In the southern region incomes are highest. These are about twenty percent higher than those in the northern and central northern regions where they are lowest. These average incomes are in terms of the means. Using the median, that is the income at which half the population is above and half below the average, income in Male' is nearly twenty percent lower at Rf.61 per person per day including rent and in the atolls, some ten percent lower at Rf.31. Using the MDG dollar-a-day line, poverty in Maldives is negligible. At the lowest VPA line, Rf.7.5 or half the median in the atolls in 1998, only about four percent of the atoll population, and none in Male', were below this line five years later. In 1997/98, four times as many persons in the atolls were living below this poverty line. About one in six persons in Male' and

viii
nearly half the atoll population are below the highest poverty line, Rf.23 ($5 PPP) per person per day. These headcounts are based on expenditures excluding rent. As these average expenditures are about two thirds of those including rents, poverty measured with total income/expenditures is correspondingly lower with barely any persons below the Rf.7.5 poverty line and about one quarter of the atoll population below the Rf.23 line. The distribution of poverty in the atolls is similar at the different lines, with poverty highest in the central northern region, followed by the central southern region. Headcounts are lowest in the southern region at all poverty lines at either income concept. To summarise, it may be noted that barely any instances of abject poverty were found in Maldives in the survey. Only seven of the 740 actual households included in the sample (less than one percent of all the households) had a per capita income (measured as expenditures excluding imputed rents) of less than Rf.4.34 per day, which was equivalent to one PPP dollar at the end of 2002. This is the indicator used in the Millennium Development Goals for this purpose. While this result does not imply that there is no extreme poverty at all in the Maldives, it clearly indicates that such poverty is not widespread. It has reduced further from the already low levels in the 1997/98 VPA. Then, a total of one hundred twenty households, or slightly more than four and half percent of the households surveyed, were below this extreme poverty line of one PPP-dollar per day. At that time, this was equivalent to an estimated Fro. 4.56. The HIES results also show a substantial reduction in the inequality within the Maldives. The standard measure of this characteristic, the Gina coefficient derived from the VPA stood at 0.42 in 1997/98. The same indicator is 0.38 in the 2002/03 HIES, as shown with the Lorenz curves in the graph on the cover of this report. Over the same time, however, the between-Gina which is a measure of the difference between Male' and the Atolls, has increased from 0.12 to 0.17. As yet, it is unclear what caused this sharp change over such a short period of time. Incomes of the poorest quintile have increased fastest, except in Central region, with the Percentage increase in incomes of the richest quintile in the atolls only about two-thirds of that of the poorest twenty percent. In Male’, the difference is a little less with the richest quintile increasing by about three-quarters of the poorest fifth. These calculations are based on the expenditures excluding rent. As in both the atolls and Male’ the lowest income groups grew fastest, the inequality within each of these areas decreased. As already indicated, the inequality between Male’ and the atolls has increased significantly during the same period. Chapter 3: Working Age Population and Employment The working age population of Maldives was estimated at about 160 thousand persons. Slightly less than half of those were estimated to be in the labour force, but it may be noticed that the questions in the HIES are not exactly the same as those in the population census 2000 or the VPA. This may have resulted in slight differences in the estimates. About two-thirds of the male population was found to be in the labour force as against nearly one-third of the females. There was no difference in these patterns between Male' and the atolls. In Male', roughly one in three workers reported to have a second job, but this was the case for only about five percent of the workers in the atolls. The main activities that the Maldivian labour force was employed in are, in order of declining importance, manufacturing and public administration which each employed about one out of six workers, fishing, trade and education. These five activities together employed two-thirds of the Maldivian workers. It may be noted that the HIES did not cover expatriates, which make up as much as one third of the total labour force. These workers are employed mostly in the resorts, construction and trade. It was found that about one quarter of the working population was self-employed, which is low
ix
for developing nations. The distribution of self-employed between men and women is not even. Nearly four in ten employed women reported to be self-employed, while only one in six men reported this status. Conversely, the share of employees in the labour force is high at about sixty percent. Two-third of the men and more than half the women are employees. The labour force consists for about one-third of production workers, with roughly the same number of males and females. About one in six persons was agriculture/fisheries worker and another sixth were administrative workers. In the latter group, slightly more women than men were working, but in agriculture and fisheries only one in six of the workers were female. As mentioned, the share of women in the labour force was about half of that for men. In addition, fewer women were engaged in professional and technical fields. These differences are accentuated by the average monthly income reported by men and women, as women on average earned less than half the men's incomes in both the atolls and Male'. Chapter 4: Household Income and Expenditure Household incomes have been classified broadly into six groups. Imputed rents are estimated at about one-fifth of the total and the values are identical for incomes and expenditures. One quarter of total incomes is derived from business activities and forty four percent was reported as wages. Six percentage points of this are attributed to incomes earned by household members working in the resorts and Male' who cannot be at home regularly due to the geography of the country. This type of incomes has a three times as high share in the atolls than in Male'. The total value consumption of own-produced goods was estimated at only about four percent of income. Property incomes made up the remaining six percent of the total. Over the ten years since the first HIES was conducted in Male', the share of food expenditures has gone down from one-third to about one-quarter. At the same time, the share of housing costs (rents, utilities, etc.) has gone up from one-sixth to one quarter. Equally significant changes, but smaller as shares in total expenditures, took place in education and health. The largest drop was recorded for clothing, which went down over this period from about ten percent of the total in 1993 to only about four percent in 2003. No relative changes for the atolls can be presented as the 1993 HIES was limited in coverage to Male'. At the moment, expenditure on food makes up nearly forty percent of the total in the atolls while housing costs are at twelve percent are about half the share of Male'. No large differences occur for the other expenditure categories. Taking overall expenditures, including rents, per capita expenditures in Male' are roughly double those in the atolls for all five quintiles. In the atolls, average expenditure of the lowest 20-percent group was estimated at Rf.17 per person per day, which was about one quarter of the daily expenditures of the highest income group. In Male', the highest group spent about five times as much as the lowest. As might be expected, the highest income group spent less on food and housing and more on recreation, hotels and miscellaneous expenditures than the lower income groups. Chapter 5: Household Savings, Finances and Wealth Households were asked to report their relative economic status. While the perceived status broadly matched their actual status, with only few of the poorer households reporting to be well of or the reverse, overall the answers were somewhat optimistic. About one in five households felt that their status was above-average while only about one in seven reported a below-average status. These two shares should have been the same. Looking at the perceived change in income between 1998 and 2003 by income group, it was found that on average, poorer households were more pessimistic on the change in income than richer
x
households. The former under-estimated the changes while the latter over-estimated their income changes. In the survey, individual income earners were asked about the balance in incomes and expenditures. About nine percent of the earners reported difficulties in balancing their budget while a quarter of them indicated to have a surplus. As more single-earner households will have difficulties in balancing the budget, the share of households facing the difficulty is about fifteen percent. Among the poorest, it is about one in four households, while even among the richest group this stands at about six percent. In the atolls, the problem is much more severe than in Male' with on average a three times higher share reporting difficulties. Consumer Durables Probably the best indicator of the rapid change in well-being of the Maldivian population is the rapid growth in the possession of major consumer durables. In Male', this shows the fast increase in incomes, while in the atolls it also shows the rapid expansion of various infrastructure services such as the electricity and telephone networks. In Male', nearly all households now possess at least one TV set, which is double the Proportion recorded in the Vulnerability and Poverty Assessment (VPA) of 1997/98. About three-quarters of the households have at least one mobile phone, which were not in available at all five years earlier. Half the households now also own one or more motor cycles, nearly three times as much as five years before. Furthermore, three quarters of the households also report a regular fixed-line telephone, a doubling of the share over the five intervening years. More than one third also has a cable TV connection, a service that started only two years earlier. Nine out of every ten households have a washing machine, while nearly half of them have a computer in the house. In the Atolls, the possession of electrical equipment has increased extremely fast due to the expansion of the electricity supply. Three-quarters of the households now have a washing machine and two-thirds own a TV set. Many smaller electrical items are in more than half the households. Mobile phones are available to about one fifth of the households. Personal computers have also started to reach the islands; nearly ten percent of the households reported them. Financial transactions of the households Information was gathered on a limited number of financial transactions that households may be engaged in. These included giving out, obtaining and repaying loans as well as the financing of construction activities. Overall, about one quarter of the households reported to have borrowed and/or given out loans. The estimates show that the balance of borrowing and lending in total is close to zero, with large differences between income groups. Net borrowing is concentrated in the middle income groups with the highest income group providing all resources. The amounts involved are, however very small at less than two percent of household expenditures. Also a quarter of the population had financed construction activities around the house, mostly for additions. Twice as large a proportion of the atoll households had paid for construction as in Male'. On average, construction expenditures in the atolls were equivalent to about six percent of household consumption expenditures. The distribution of construction expenditures over the income groups was radically different between Male' and the atolls. In Male', the three lowest quintiles of the population barely spent any money on construction, while those expenditures for the highest quintile were equivalent to nearly fifteen percent of its household consumption expenditures. In the atolls, expenditures were equivalent to close of six percent of consumption expenditures for all quintiles.
xi
List of Acronyms and Abbreviations COICOP Classification of Individual Consumption by Purpose EA Enumeration Area (from the 2000 Population Census) HIES Household Income and Expenditure Survey (2002/03) MDG Millennium Development Goal PGR Poverty Gap Ratio ppp per person per day psu primary sampling unit SNA-93 System of National Accounts, 1993 revision usu ultimate (or secondary) sampling unit VPA Vulnerability and Poverty Assessment (1997/98)

1
Chapter 1: The Household Income and Expenditure Survey Summary
The principal purposes of the Household Income and Expenditure Survey (HIES) 2002/03 were to obtain information on household expenditures for the national accounts; to prepare new weights for the Consumer Price Index (CPI) for Male' and introduce the CPI in some of the atoll capitals; and to measure income and poverty for different groups and regions, with special reference to the performance under the Millennium Development Goals (MDG). The survey was conducted in four rounds during the months of September and December 2002, June and March 2003. It was designed as a scientific random sample with separate strata for Male' and the five development regions. A total of 834 households questionnaires were obtained during the survey, which was about 94% of the 880 in the design. In addition to post-enumeration adjustments to take care of this non-response, corrections were made to bring the survey population estimates to the level of the total estimated population at the end of 2002. The data quality of the expenditure estimates obtained from the recall and diary procedures was analysed and it was found that the information in the one-week diary was incomplete. Except for cross-checking and verification, this information was therefore not used. The quality of the information on quantities of consumption, expressed in terms of unit-values, showed such wide variations, even after significant edits, that it was concluded that nutritional values of the food expenditures could not be estimated with any degree of reliability. This subject has, therefore, not been included in the report.
1.1 Introduction This report describes the Household Income and Expenditure Survey (HIES 2002/3) that has been conducted in the Maldives during the period September 2002 to June 2003 in four quarterly rounds. The HIES covered both the capital Male' and the Atolls. A scientific sample design was used to ensure the sample drawn for the survey was representative for the Maldivian population at various levels of desegregation. A summary of the major design criteria and its implementation has been given in section 1.3 below, while the full sample design has been attached at Appendix 1 to this report. The experience with household surveys in Maldives is rather limited. In 1993, a household survey was conducted in Male', which was mainly used to derive the weights of the Consumer Price Index (CPI) that is currently published (with pricing base June 1995). In 1997/98, the Vulnerability and Poverty Survey (VPA 98) that was administered to a sample of households in all 200 inhabited islands in the Atolls as well as Male', included the same information on incomes and expenditures, but only a single round of visits was made to the households and all information collected was on recall basis. In conjunction with the VPA, a small household survey was started, covering three Atoll capitals (Khulhudhuffushi in Haa Dhaalu, Thinadhoo in Ghaafu Dhaalu and Hithadhoo in Seenu) and Male'. This survey was planned to be continued for twelve months, but was discontinued earlier due to logistical problems. The HIES 2002/03 therefore represents the first complete HIES conducted and successfully completed in the Maldives. In all major aspects, the information collected in this HIES is comparable with the 1997/98 Vulnerability and Poverty Assessment. The main differences are that information was collected from a sample of forty islands in the HIES rather than all inhabited islands in the VPA; that the questionnaire was much shorter, leaving out many of the social and demographic characteristics of the households; and that the HIES also did not include the island / community questionnaires used in the VPA.
2
1.2 Main Aims and Purposes The main purpose of the survey was to collect information on the economic well-being of the population. Specifically, the results will be used to bring about improvements in three broad areas of statistics, namely: National Accounts: • Estimation of household consumption expenditures • Imputed rents of owner-occupied dwellings • Limited information on household businesses Consumer Price Index: • Preparation of new weights set for Male’ • Additional weights sets for (broad) regional groupings • Overall weights to compile a national index Poverty and vulnerability: • Levels of income for different population groups (by region, occupation, etc.) • Extent of poverty, using alternative poverty lines • Distribution of income over the groups • Millennium Development Goals (MDG) performance on: • poverty ($1 per day) • deprivation (calorie intake)
1.3 Methodology
1.3.1 Sample Design Stratification The HIES was conducted in four quarterly rounds. The samples selected for each of the rounds were representative for Male' as well as the Atolls. However, with the rather small sample sizes at this level of desegregation, detailed analysis of the quarterly data generally results in statistical errors that are larger than normally acceptable. In this report, therefore, no data for the separate quarters are analysed. For grouping purposes, islands of each development region were listed in the ascending order of the distance from the respective atoll centres and within each atoll a median value was calculated for the number of households. Then each atoll was divided to Nearby and Remote islands, where both groups were of more or less equal size in terms of the number of households. The average distance of Nearby islands in different regions varied between 10 and 14 km and that of Remote islands was between 27 and 37 km. For each quarterly round of the survey, one Enumeration Area (EA) from one island in each of the ten sub-strata was selected. In each EA, fifteen households were selected at random. In total, therefore, this resulted in forty EA's from the Atolls, with six hundred households. In Male', each quarter there were seven EA's selected, two each in Heynveru and Maafannu and one each in the other three wards. In each of the selected EA's, ten households were enumerated. However, each of the selected households was surveyed during two rounds, so that 140 different households were included in the Male' sample. Post-Enumeration adjustments The sample design described above provides the appropriate raising factors for the households if the survey is carried out exactly according to the design and the sample totals (in this case, population) happen to coincide with the population estimates available from the census projections. In general, this is not the case.
3
First, some households do not want to co-operate while others do not provide all the information needed. Thus, the number of households actually enumerated is often smaller than the number selected in the sample, even when replacement households have been selected at the design stage. In some cases, the selected enumeration blocks on the islands actually contained fewer households than the fifteen to be enumerated, even though that number was present at the time of the population census which provided the sampling frame.
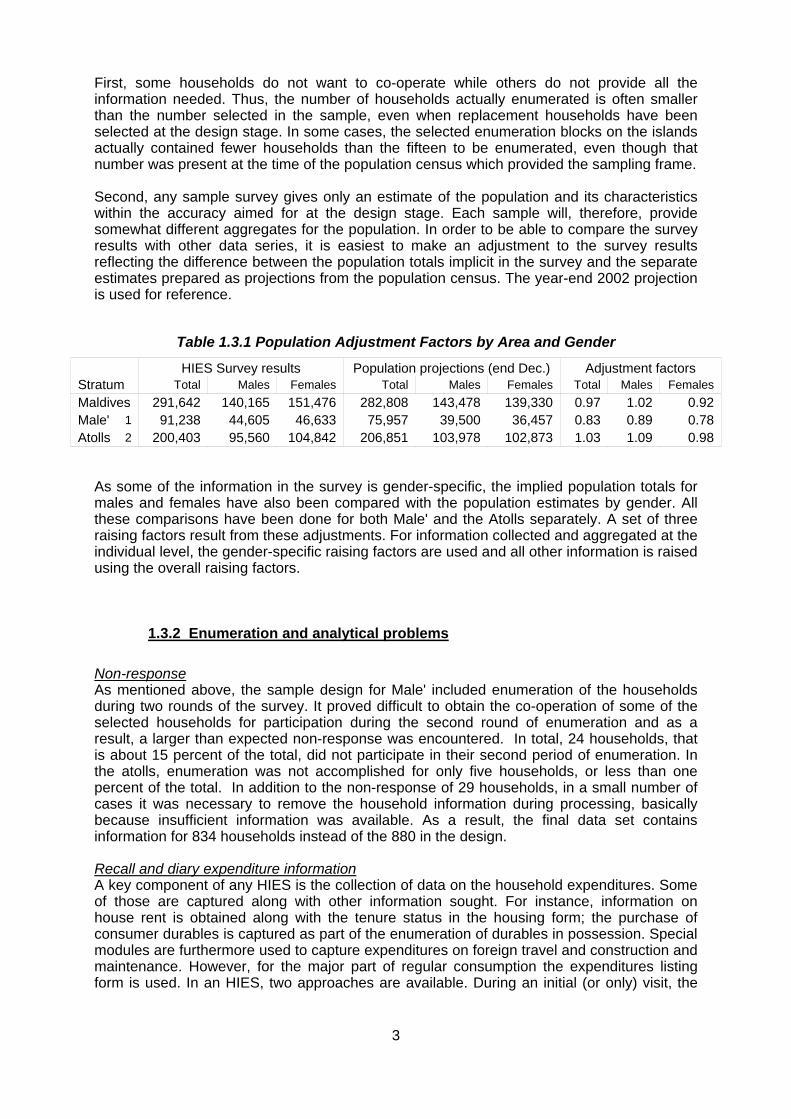
Second, any sample survey gives only an estimate of the population and its characteristics within the accuracy aimed for at the design stage. Each sample will, therefore, provide somewhat different aggregates for the population. In order to be able to compare the survey results with other data series, it is easiest to make an adjustment to the survey results reflecting the difference between the population totals implicit in the survey and the separate estimates prepared as projections from the population census. The year-end 2002 projection is used for reference.
Table 1.3.1 Population Adjustment Factors by Area and Gender
HIES Survey results Population projections (end Dec.) Adjustment factors Stratum Total Males Females Total Males Females Total Males Females Maldives 291,642 140,165 151,476 282,808 143,478 139,330 0.97 1.02 0.92Male' 1 91,238 44,605 46,633 75,957 39,500 36,457 0.83 0.89 0.78Atolls 2 200,403 95,560 104,842 206,851 103,978 102,873 1.03 1.09 0.98
As some of the information in the survey is gender-specific, the implied population totals for males and females have also been compared with the population estimates by gender. All these comparisons have been done for both Male' and the Atolls separately. A set of three raising factors result from these adjustments. For information collected and aggregated at the individual level, the gender-specific raising factors are used and all other information is raised using the overall raising factors.
1.3.2 Enumeration and analytical problems Non-response As mentioned above, the sample design for Male' included enumeration of the households during two rounds of the survey. It proved difficult to obtain the co-operation of some of the selected households for participation during the second round of enumeration and as a result, a larger than expected non-response was encountered. In total, 24 households, that is about 15 percent of the total, did not participate in their second period of enumeration. In the atolls, enumeration was not accomplished for only five households, or less than one percent of the total. In addition to the non-response of 29 households, in a small number of cases it was necessary to remove the household information during processing, basically because insufficient information was available. As a result, the final data set contains information for 834 households instead of the 880 in the design. Recall and diary expenditure information A key component of any HIES is the collection of data on the household expenditures. Some of those are captured along with other information sought. For instance, information on house rent is obtained along with the tenure status in the housing form; the purchase of consumer durables is captured as part of the enumeration of durables in possession. Special modules are furthermore used to capture expenditures on foreign travel and construction and maintenance. However, for the major part of regular consumption the expenditures listing form is used. In an HIES, two approaches are available. During an initial (or only) visit, the
4
consumption expenditure during the recent past can be obtained using a recall procedure. Thereby, the respondent is systematically asked from a list whether particular items were purchased during the reference period. As memory lapse is a common problem, the length of the recall period has been made dependent on the type of goods, with the period for more expensive items longer than those of daily needs. Information on current expenditures can also be collected using a diary where all household expenditures are recorded over a period of time. The HIES also used this approach, for a period of one week. The results were not very good as these records were generally substantially below the expenditures on the same type of items in the recall part of the survey. While the information was used in a number of cases for cross-checking, they have not been included in the analysis. Nutrition estimates derived from expenditures The goods purchasing practices in the islands are generally substantially different from those in Male'. In many smaller islands no shops, or shops with only a very limited range of products are available and many items are purchased in bulk from the atoll islands, itinerant merchants and from Male'. This makes it difficult to capture purchases by households as these are not very regular or frequent. At the overall levels of aggregation for the survey, this is of limited influence. The bulk purchases recorded by one household during the reference period that will be partially consumed only during the same period mostly cancel out against the households that did not purchase these commodities during the reference period and used available stocks for consumption. An arrangement had been made to capture as many of the bulk purchases as possible, but at the analysis stage it was clear that this had not always worked out in the expected manner. As a result, the calorie contents of the food consumption of individual households, based on the reported purchases, showed extremely large variations. At the lower end, the calculated calorie intakes were only a few hundred kcal per person per day while at the other extreme, close to ten thousand kcal was implied. As those extreme calorie intake levels were not at all correlated to reported income levels or other identifiable household characteristics, the problem most likely originated at the enumeration level. As no methods could be developed to adjust calorie intakes of individual households, the nutritional status of the population could not be analysed on the basis of the survey results. The second MDG target, under the first goal, is Eradication of extreme poverty and hunger. It aims to halve, between 1990 and 2015, the proportion of people who suffer from hunger. For measuring the progress in this regards, estimates of the calorie contents of consumption are normally prepared from household survey results. As described above, this information cannot reliably be derived from the results of the HIES 2002/03 and the performance measurement against this MDG target is not possible. Clustering for nearby and remote islands The sample design stratified the five regions into nearby and remote islands, whereby the classification was based on the population size of the different islands with a demarcation line drawn in such a way that about half the people living on nearby islands and half on remote islands. In practice, this resulted in a fairly wide distribution of the distance of the nearest “remote” island from the atoll centre. On smaller atolls sometimes islands were classified as remote that are actually within easy reach of the centre. The classification is therefore not suitable for policy purposes. As it was not possible to redraw the boundaries after the survey had been completed, it was decided to remove this level of stratification from the analysis and the data set.
1.4 Data Entry, Editing and Processing Data entry and editing of the HIES questionnaires was done on a continuous basis whenever new forms became available. As a result, a data set was available only a few weeks after the last round of data collection was completed. Further edit and consistency checks were then
5
carried out to ensure that all information was entered. Initial analysis showed that the information for a number of households was not enough, particularly the lack of expenditure information, to retain them in the data set. The editing at this stage also included the calculation of quantitative information on food expenditures by household and its conversion to calorie values. Some more households were removed from the data set because of inadequate information, such as expenditures that were limited to non-foods only. At the same time it was clear that the nutrition contents of some of the items of the Maldivian menu were not adequately recorded. This was especially important for coconuts and, in Male', for prepared foods. Tests were conducted to weigh the contents of these products and then calculate the average calorie values based on the weight of the individual ingredients. In addition, the classifications and coding lists used in the survey were cross-checked with the codes entered in the data set to ensure consistency. Where necessary, codes were modified, and sometimes added, to obtain the best possible results. Once the final data set was completed, the final component of the raising factors, that is the adjustment for the number of respondents compared with the design, could be calculated. The overall raising factors were then available and for ease of later tabulations and calculations, all value and quantity information for the individual households was raised to reflect their overall contribution to these characteristics. Thus, the total number of household members given in the household data set adds up to the total number of persons estimated for 2002/03 in the population projections, as given in Table 1 above. In order to ensure confidentiality of the information for the individual households, all identifiers were removed from the data set and a simple serial number was assigned to each household. This serial number forms the only link between the different tables in the data set. Only the basic identifying characteristics required for analysis of the survey results, such as survey round and region were retained.
1.5 Limitations All sample surveys are limited in that they are assumed to also represent the part of the population that was not included in the sample. As surveys have various sampling and non-sampling errors, such an assumption may not always be correct. In the HIES 2002/03, an important limitation is that the survey design was such that the results are representative for Male' and at the regional level (the five development regions) in the atolls. Thus, no conclusions can be drawn from the information on the situation in any particular atoll. Also, it is important to note that the sample size of the survey is rather small when analysing the information at the regional level where only 120 observations are available for each region. The presentation of the results therefore needs to be balanced for regional and other detail. Therefore, for instance, the tabulations by the twelve income or expenditure groups is done at the level of the nation and Male'/ Atolls only. Similarly, population deciles are used for the Maldives total while quintiles are used at lower levels of aggregation. It may be noted that the latter are calculated separately for each set of strata, that is Male' and atolls, and within the latter the five regions so that an equal1 number of persons is represented in each quintile within each of the strata. Enumeration and sample design problems, as described earlier, also led to a number of restrictions on the use of the information.
1 As the population numbers are derived from the sample households, minor variations from the
20% standard size of a quintile do occur due to variation in size of the households in the sample.
6
1.6 Structure of the Report In the following chapters, the (income) poverty situation in the country is analysed in Chapter 2. Working age population and employment is described in Chapter 3. Chapter 4 contains information on the household income and expenditure patterns of the population. Household savings, finance and wealth are enumerated in Chapter 5. In the Appendices, the sample design has been described in Appendix 1 and a note on poverty measurements has been given at Appendix 2. This technical note is a copy of the one given in the VPA report and has been repeated herewith for ease of reference as the poverty and inequality concepts used in both studies are the same. A set of detailed tables is also given while the main classifications used in the survey, that is, the atoll island list and the COICOP classification are attached. To the extent possible, all information is presented separately for Male' and the Atolls and also at the regional level for the atolls and comparisons are made with the 1997/98 VPA.
1.7 Using the CD-ROM This report and the full data base is given on the accompanying CD-Rom. The reports and prepared tables are presented in both Acrobat PDF format as well as MS-Office Word and Excel formats. The database information is given as Paradox tables (.db), dBase (.dbf) and as standard comma-delimited text files (.csv). A set of instructions for the use of the CD-Rom are given on the CD-Rom.
7
Chapter 2: Income Poverty Summary
Concepts and definitions Poverty has many dimensions, but in the HIES the analysis is limited to income poverty. Poverty has been defined in various ways. The concept of absolute poverty tries to determine the minimum income required to meet physical subsistence needs such as food, clothing and shelter, sometimes extended to essential services of health, education, transport, etc. It is usually based on nutritional requirements to derive a minimum food budget which is then raised for the other necessities. The concept of relative poverty defines poverty in relation to standards that exist in the society. A common poverty line in such cases is half the median per capita income. As the choice of where to set “the” poverty line is highly arbitrary, this report applies the concept of poverty dominance and has seven different poverty lines to measure the status in the different regions and population groups as well as the changes since the first measurements carried out during the Vulnerability and Poverty Assessment (VPA) 1998. The three poverty lines used in the VPA were set at Rf.7.5, Rf.10 and Rf.15 respectively. These lines were half the atoll median income for the lowest of the three and the median income for the highest respectively with the Rf.10 line used as in-between line. These lines were maintained for the HIES, without adjustments for inflation as this has been negligible during this period. In addition the dollar-a-day MDG poverty line was introduced, poverty lines based on nutrition requirements of 2000 kcal per person per day and food at one-third of total household expenditures were derived using regression analysis. Finally, the relative poverty line of half the median income in 2002/03 for the overall population was derived. These seven poverty lines ranged from Rf.4.34 for the MDG line to Rf.23 per person per day for half the median in the survey period. It may be noted that the MDG line is measured in Purchasing Power Parity (PPP) dollars. The calculations used to derive the PPP exchange rate have been described in this chapter of the report. A number of methodological issues required special attention during the compilation of the report. These included the methods used to impute own-produced consumption of goods and house rents, the measurement of income in terms of either income or expenditures and the concepts used to measure this income. As for the consumption of own-produced goods, valuation was done at prices prevailing in the local markets. This information could not always be verified, especially on the smaller islands covered in the survey as few cash transactions take place for the most widely used local items such as fish and coconuts. The extent of this problem was even larger for the estimation of rental values of owner-occupied dwellings on the islands as only a very small proportion of houses is rented out. In general, the measurement of expenditures is more accurate in household surveys in developing countries than the measurement of incomes, even if no under-reporting takes place. The main reasons are that incomes fluctuate more than expenditures and that self-employed people often report gross income (or turnover) from their activities without deducting the costs of goods, materials and services used. Therefore, the expenditure approach is generally used in analysis. For the poorest countries, where the marginal propensity to consume is close to one, the difference between income and expenditure is small and this approach will not result in bias. In Maldives, incomes have grown very fast over the past decade and all evidence shows that discretionary expenditures are now rather high. This means that there are substantial savings in the society, which means that using expenditures as a proxy for income introduces a downward bias in inequality and an over-estimate of poverty. Furthermore, an increasing share of the earnings is obtained from wage employment, thereby reducing the potential bias in the estimates from the income side. In the report, most of the analysis uses the expenditure approach, but in the final chapter, describing household savings and wealth, the income data have also been used. It may be noted that there is a rather close correlation between the income and expenditure data for the individual households. More than half of the households fall within the same quintile (20-percent group) when measured from either the income or expenditure side and about seven out of eight households are within the same or adjacent income groups. For national accounts purposes, imputed values of own-consumption of goods and housing rents are included in household consumption. However, given the small number of houses rented in the atolls and the relatively large share of housing costs in overall expenditures, this approach is not the most suitable for all uses of the data, especially with respect to poverty analysis. Therefore, most of the analysis in the report is presented twice, using the measures of income including and excluding rent.
8
On a few occasions, only imputed rent is excluded from income. The actual measure used in each case is always given. Survey results Household consumption expenditures in Male' were about Rf.74 per person per day including rent and two-thirds of this, or fifty Rufiyaa per person per day excluding rents. Expenditures in the atolls are at roughly half this level on average. In the southern region incomes are highest. These are about twenty percent higher than those in the northern and central northern regions where they are lowest. These average incomes are in terms of the means. Using the median, that is the income at which half the population is above and half below the average, income in Male' is nearly twenty percent lower at Rf.61 per person per day. In the atolls, the median is some ten percent lower at Rf.31. Using the MDG dollar-a-day line, poverty in Maldives is negligible. At the lowest VPA line, Rf.7.5 or half the mean in the atolls in 1998, only about four percent of the atoll population, and none in Male', were below this line five years later. In 1997/98, four times as many persons in the atolls were living below this poverty line. About one in six persons in Male' and nearly half the atoll population are below the highest poverty line, Rf.23 ($5 PPP) per person per day. These headcounts are based on expenditures excluding rent. As these average expenditures are about two thirds of those including rents, poverty measured with total income/expenditures is correspondingly lower with barely any persons below the Rf.7.5 poverty line and about one quarter of the atoll population below the Rf.23 line. The distribution of poverty in the atolls is similar at the different lines, with poverty highest in the central northern region, followed by the central southern region. Headcounts are lowest in the southern region at all poverty lines at either income concept. To summarise, it may be noted that barely any instances of abject poverty were found in Maldives in the survey. Only seven of the 740 actual households included in the sample (less than one percent of all the households) had a per capita income (measured as expenditures excluding imputed rents) of less than Rf.4.34 per day, which was equivalent to one PPP dollar at the end of 2002. This is the indicator used in the Millennium Development Goals for this purpose. While this result does not imply that there is no extreme poverty at all in the Maldives, it clearly indicates that such poverty is not widespread. It has reduced further from the already low levels in the 1997/98 VPA. Then, a total of one hundred twenty households, or slightly more than four and half percent of the households surveyed, were below this extreme poverty line of one PPP-dollar per day. At that time, this was equivalent to an estimated Rf. 4.56. The HIES results also show a substantial reduction in the inequality within the Maldives. The standard measure of this characteristic, the Gini coefficient derived from the VPA stood at 0.42 in 1997/98. The same indicator is 0.38 in the 2002/03 HIES, as shown with the Lorenz curves in the graph on the cover of this report. Over the same time, however, the between-Gini which is a measure of the difference between Male' and the Atolls, has increased from 0.12 to 0.17. As yet, it is unclear what caused this sharp change over such a short period of time. Incomes of the poorest quintile have increased fastest, except in Central region, with the percentage increase in incomes of the richest quintile in the atolls only about two-thirds of that of the poorest twenty percent. In Male’, the difference is a little less with the richest quintile increasing by about three-quarters of the poorest fifth. These calculations are based on the expenditures excluding rent. As in both the atolls and Male’ the lowest income groups grew fastest, the inequality within each of these areas decreased. As already indicated, the inequality between Male’ and the atolls has increased significantly during the same period.
2.1 Introduction It is realised that poverty is more than just low income. Many factors contribute to poverty. These include food security, environmental security, the availability of safe drinking water and the knowledge of how to compensate for water-borne health hazards, access to health care and education, access to a means of distribution of goods lacking on the islands, which, in turn, means transportation opportunities as well as a sufficient income margin to purchase goods and services. Nevertheless, the concept of poverty used in this report is confined to income poverty.
9
2.2 Concepts Poverty has over time and in different situations been defined in many different ways. The concept of absolute poverty defines poverty in terms of a minimum income required to meet minimal physical subsistence needs such as food, shelter and clothing. Subsistence is defined here as the maintenance of a basic level of living, a biological minimum, below which needs are not met. Minimal physical subsistence needs, such as the minimal number of calories per person per day required to survive are translated into money terms using the composition and the prices of the relevant food items from local market supplies. The so derived minimum food budget can further be raised with small amounts for clothing and housing and can be expanded even further from the minimum necessary for subsistence towards basic needs including not only food, housing and clothing, but also essential services such as education, health, transport, cultural facilities and safe drinking water and sanitation. The concept of relative poverty defines poverty in relation to the standards that exist elsewhere in society. Relative poverty defines the poor as not being able to participate in their own society due to low income. The relative poverty line is usually set at half the median per capita income.
Since the choice of where to set “the” income poverty line is highly arbitrary, this report applies various different income poverty lines and considers the sensitivity of the choice of these lines with regard to location of poverty. The following seven income poverty lines are considered: 1. Rf. 4.34 per person per day, which corresponds with the Millennium Development Goals
poverty line of $1 per person per day in purchasing power parity (PPP) terms 2. Rf.7.5 per person per day, as used in the Vulnerability and Poverty Assessment 1998
(VPA) as the low income poverty line set at half the atoll median per capita income in 1997/98
3. Rf. 10 per person per day as used in the VPA as the “in-between” income poverty line 4. Rf. 15 per person per day as used in the VPA as the high income poverty line set at the
level of the atoll median per capita income in 1998 5. Rf.15.8 per person per day, which is point of intersection of a regression line of calorie
intake with income per capita at a norm of 2000 calories per person per day 6. Rf. 18 per person per day, being half the median per capita income in 2002 7. Rf. 23 per person per day, which is point of intersection of a regression line of the food
share in household expenditures with household expenditures per capita below which the food share is higher than 1/3 of household expenditures.
2.2.1 Income Versus Expenditure In this report household consumption is used as a proxy for household income, rather than household income itself, for most of the analysis. This is the practice in most poverty studies based on household surveys. A number of reasons can be given for this preference. First, in many cases household consumption is more stable over time than household income. Second, the detailed measurement of household expenditures by item generally provides a good coverage of expenditures. On the income side, some respondents have a tendency to under-report their income for various reasons while others over-estimate their income, mainly because they do not understand the definition of income. This applies in particular to self-employed like fishermen and shopkeepers who often mention their sales as income, without taking into account the costs. This report uses the household as the unit of analysis, while all estimates are expressed in per capita values. Therefore the underlying assumption is that households distribute their welfare equally among all their members. A presentation of the concepts and methodology
10
underlying the study is provided in the Technical Note on The Measurement of Vulnerability and Poverty which is given at Appendix 2.
2.2.2 Imputing Own Produced Consumption General In a traditional society, many households are engaged in a range of productive activities. Sometimes, these are market-oriented and the major part of the production is sold. In other situations, such production is meant only for consumption within the own household. In the Maldives, there are very large differences between Male' and the islands in this respect. On Male', very little own production takes place, while on the islands many households have kitchen gardens, collect firewood from nearby uninhabited islands and are engaged in fishing, either for tuna in the open ocean or for reef fish in the lagoons. In order to correctly compare the income of households it is therefore necessary to take such home production into account. The System of National Accounts (SNA) has for this purpose drawn up a number of rules that determine which types of products should be included and how their valuation should be done. According to this SNA definition all goods produced, whether for sale or own production, are to be included. In terms of activities, those goods are the outputs of agriculture, fisheries, mining, manufacturing, utilities and construction (ISIC sections A to F), plus the imputed rent of owner-occupied dwellings. Services other than the imputed rent are valued only when these are actually sold. Valuation of output for own consumption is done on the basis of prevailing market prices. Sometimes, it is hard to find such price information but it is generally possible to approximate the prices, especially when a proportion of the production (in the community, not necessarily the household under observation (is sold or when the goods are available also on the local market. It should be observed that in some item-categories, such as fish and fruits, the number of purchases in the atolls is only about half the total number of transactions registered for these products. In the atolls, more than a quarter of all food “expenditures” were imputations, with a substantially larger share in the small islands. The validity of the prices used to value these transactions has not been checked beyond the standard editing applied to all expenditures. Imputed rent of owner-occupied dwellings The imputed rent of owner-occupied dwellings is treated differently from other services in the SNA. The need for shelter is a fundamental one. It can be obtained by renting a dwelling or by constructing one. Both options are widely used, and regularly also by the same households when they own property in one place and live for some time elsewhere, for instance because of work. In such instances, the own house is then often rented out while one is rented (or bought) at the new location. The imputed rent of owner-occupied dwellings can thus be expressed either as income foregone because the dwelling cannot be rented out, or as expenditure saved as no house rent needs to be paid. While the concept is easy in principle, it is sometimes difficult to imagine that houses can be rented out in the more remote islands. This will, however, be reflected in the value of the rents imputed, which is much lower in remote rural areas than in the urban environment. In practice, the rent levels have been estimated on the basis of the reported rent paid by tenants for the different types of housing units. On Male’, these have been grouped separately for houses and apartments, while for the atolls, only houses have been taken. In addition, the house rents for Male’ have been analysed separately for Male' island and Villingili, as rental levels differ substantially between those two areas of town, mainly
11
because Villingili is more remote and accessible only by ferry.
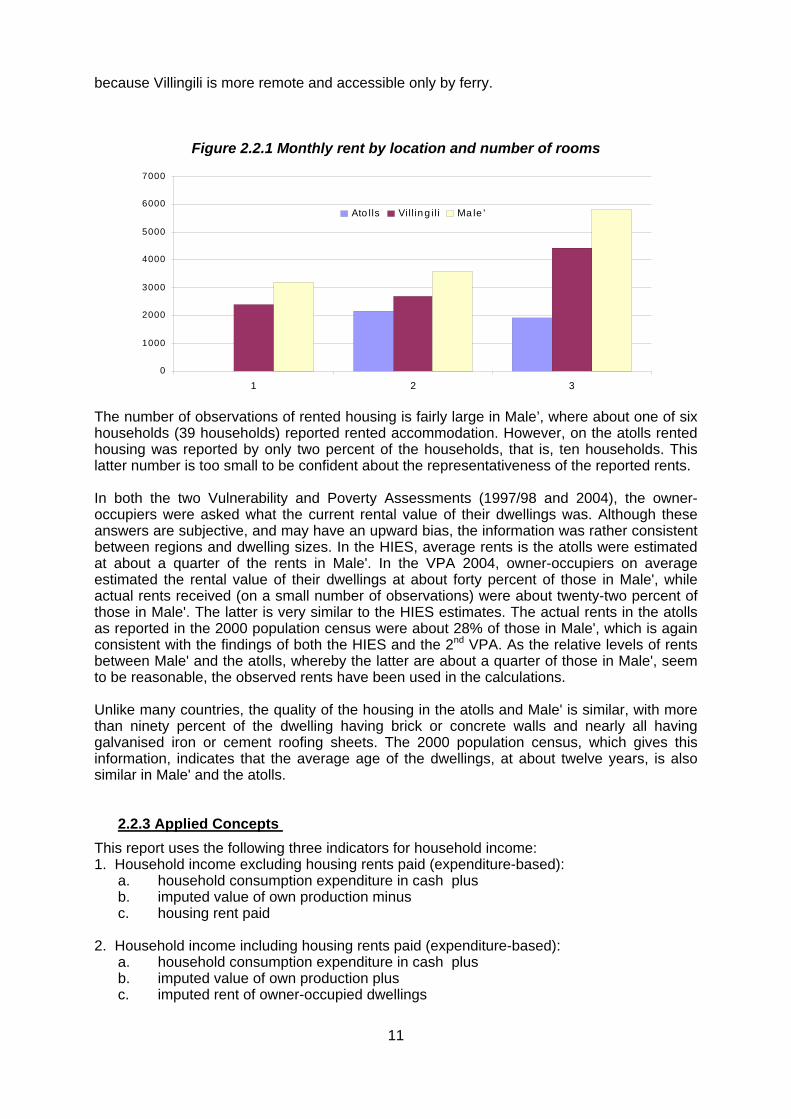
Figure 2.2.1 Monthly rent by location and number of rooms
0
1000
2000
3000
4000
5000
6000
7000
1 2 3
Ato lls Vill in g il i Ma le '
The number of observations of rented housing is fairly large in Male’, where about one of six households (39 households) reported rented accommodation. However, on the atolls rented housing was reported by only two percent of the households, that is, ten households. This latter number is too small to be confident about the representativeness of the reported rents. In both the two Vulnerability and Poverty Assessments (1997/98 and 2004), the owner-occupiers were asked what the current rental value of their dwellings was. Although these answers are subjective, and may have an upward bias, the information was rather consistent between regions and dwelling sizes. In the HIES, average rents is the atolls were estimated at about a quarter of the rents in Male'. In the VPA 2004, owner-occupiers on average estimated the rental value of their dwellings at about forty percent of those in Male', while actual rents received (on a small number of observations) were about twenty-two percent of those in Male'. The latter is very similar to the HIES estimates. The actual rents in the atolls as reported in the 2000 population census were about 28% of those in Male', which is again consistent with the findings of both the HIES and the 2nd VPA. As the relative levels of rents between Male' and the atolls, whereby the latter are about a quarter of those in Male', seem to be reasonable, the observed rents have been used in the calculations. Unlike many countries, the quality of the housing in the atolls and Male' is similar, with more than ninety percent of the dwelling having brick or concrete walls and nearly all having galvanised iron or cement roofing sheets. The 2000 population census, which gives this information, indicates that the average age of the dwellings, at about twelve years, is also similar in Male' and the atolls.
2.2.3 Applied Concepts This report uses the following three indicators for household income: 1. Household income excluding housing rents paid (expenditure-based): a. household consumption expenditure in cash plus b. imputed value of own production minus c. housing rent paid 2. Household income including housing rents paid (expenditure-based): a. household consumption expenditure in cash plus b. imputed value of own production plus c. imputed rent of owner-occupied dwellings
12
3. Household income: a. Income from labour (salaries, entrepreneurial income) and pensions plus b. Income from capital investments plus c. value of own production plus d. imputed rent of owner-occupied dwellings Unless otherwise stated, the first concept is used as the proxy for household income. With the fast rise in incomes witnessed in the Maldives over the past decades, society has become more affluent and a larger proportion of incomes is saved. In the tabulations, groupings by income as well as expenditure are therefore presented for comparison.
2.2.4 Purchasing Power Parities (PPP) The Millennium Development Goals (MDGs) set out a number of targets. The first target, under the first goal, Eradication of extreme poverty and hunger, aims to halve, between 1990 and 2015, the proportion of people whose income is less than $1 a day. This dollar is defined in terms of its purchasing power of consumption in 1993 international dollars (that is, in relative prices compared to New York at that time). As price levels in Maldives are substantially below those in New York, conversion from Rufiyaa to Dollar against the official exchange rates would underestimate the purchasing power in the Maldives. Purchasing Power Parities have been calculated for many countries. The methodology was originally developed at the University of Pennsylvania and was actively supported by the United Nations Statistical Office and the United Nations Development Programme in its initial phase. Later on, the World Bank became the leading international agency supporting the concept. Over time, an increasing number of countries has participated in the successive rounds of the International Comparison Project (ICP) that has been promoting and improving the methodology. Until now, Maldives has not participated in the programme, but Maldives participates in the recently launched round. For Asia, this is now co-ordinated by the Asian Development Bank. No direct measurements of PPPs have been taken place in Maldives to date and estimates have been prepared using mainly information from nearby countries. This information, prepared by the World Bank and available on the website of the UN Statistics Division under the Millennium Indicators, gives an exchange rate for the Rufiyaa (in 1993) of 3.517 per International Dollar. As the actual exchange rate during that period (1993) was eleven Rufiyaa per dollar on average, this implies a relative price level in Maldives that is 3.13 times lower than that prevailing in New York. Expressed in other words, 32 dollar cents bought the same basket of goods in Maldives as one dollar did in New York. For comparison, the PPP for India (which has participated in a number of the ICP rounds) has been calculated from the same data. In 1993, the average exchange rate between the Indian Rupee and the US Dollar was about 32 rupees per dollar. The PPP exchange rate for the period was given as 7.016 rupees per dollar, implying that 22 cents would buy the same goods in India as one dollar did in New York. This means that the Indian price levels were 45 percent lower than those in Maldives. As the reference base is 1993, there is a need for adjustment of the PPPs to current prices. Price developments in Maldives, as measured by the Consumer Price Index (CPI), over the period since 1993 can be split into two distinct periods. From 1993 to the end of 1997, the reference period for the Vulnerability and Poverty Assessment (VPA), price increases have seen substantial, measuring about thirty percent in total, or about six percent per year. In the subsequent period, from the end of 1997 to the end of 2002, the reference base for the HIES, prices have not changed much, as the index recorded a slight decrease of five percent over this five-year period. The information is summarised in the table below.
13
The MDG reference of one dollar per day at the end of 2002 is therefore equivalent to Rf. 4.34. This implies that the average prices in Maldives are only about one-third of those in New York in the base period. For the traded goods, which are mostly imported, this appears to be incorrect. However, it should be borne in mind that the price levels are those for the complete consumption package, which includes the non-traded services. Price levels for the latter are generally very much lower in Maldives than in the USA, often being less in Rufiyaas in Male' than they are in Dollars in New York. Maldives' participation in the ongoing round of the ICP project will provide direct estimates of the PPPs. These then can be used to verify the accuracy of the current ones, which have been derived indirectly. In practice, this MDG is of little relevance to the Maldives. The HIES 2002 included only seven households, or about one percent of the total number of households in the sample, whose per capita income was found to be below this “dollar-a-day” threshold. This shows that the incidence of abject poverty in the Maldives is very low. Furthermore, this incidence has been reduced significantly from the already low level found in the more elaborate 1997 VPA.
Table 2.2.2 Consumer Price Indices and PPPs in Maldives
Period CPI Price Index (1995 = 100)
Percentage change
Nominal exchange rate
PPP exchange rate
PPPs
1993 Average 91.65 ... 11.01 3.52 3.13
1997 year end 1 118.81 29.6 11.72 4.56 2.57
2002 year end 1 113.29 -4.6 12.85 4.34 2.96 1 Average of the December and January indices
2.3 Income Levels Income concepts The concepts for household income given in section 2.2.3 above include two expenditure-based measures and one income-based measure. In general, household income analysis in low-income countries is based on one of the expenditure-based measures. In general, the first one listed is used. This measure excludes rent, both paid and imputed. The actual concept used is specified in the table, figure or text so that comparison of the different types of information is easier. There are good reasons to extend the analysis of Maldivian income to the other two concepts. First, in Male', a substantial proportion of the households lives in rented accommodation, making cash expenditure on rent an important part of household expenditures in Male'. This phenomenon is measured in the second concept, which includes all rents in the expenditures, and adds imputed rents to household incomes. Although measured from the expenditure side, this concept is in line with the SNA definitions on household incomes. Second, the income levels have increased very much over the past decades due to the booming tourism sector. This has led to an increase in discretionary income. This in turn has brought about a change in consumption patterns and an increase in savings. It may, therefore, be expected that differences exist between income and expenditure levels of individual households depending on their composition, age structure and outlook on life, rather than the implicit assumption made in the expenditure-based definitions that all households spend a similar proportion of their incomes.
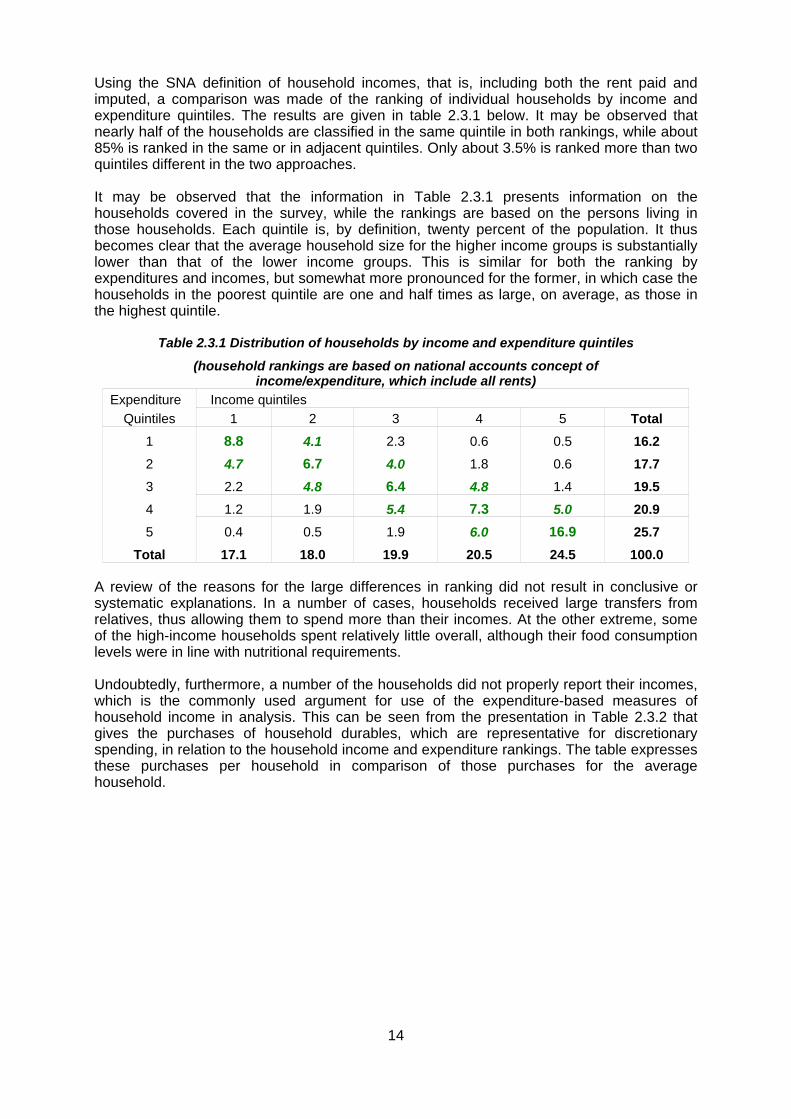
14
Using the SNA definition of household incomes, that is, including both the rent paid and imputed, a comparison was made of the ranking of individual households by income and expenditure quintiles. The results are given in table 2.3.1 below. It may be observed that nearly half of the households are classified in the same quintile in both rankings, while about 85% is ranked in the same or in adjacent quintiles. Only about 3.5% is ranked more than two quintiles different in the two approaches. It may be observed that the information in Table 2.3.1 presents information on the households covered in the survey, while the rankings are based on the persons living in those households. Each quintile is, by definition, twenty percent of the population. It thus becomes clear that the average household size for the higher income groups is substantially lower than that of the lower income groups. This is similar for both the ranking by expenditures and incomes, but somewhat more pronounced for the former, in which case the households in the poorest quintile are one and half times as large, on average, as those in the highest quintile.
Table 2.3.1 Distribution of households by income and expenditure quintiles
(household rankings are based on national accounts concept of income/expenditure, which include all rents)
Expenditure Income quintiles Quintiles 1 2 3 4 5 Total
1 8.8 4.1 2.3 0.6 0.5 16.2 2 4.7 6.7 4.0 1.8 0.6 17.7 3 2.2 4.8 6.4 4.8 1.4 19.5 4 1.2 1.9 5.4 7.3 5.0 20.9 5 0.4 0.5 1.9 6.0 16.9 25.7
Total 17.1 18.0 19.9 20.5 24.5 100.0
A review of the reasons for the large differences in ranking did not result in conclusive or systematic explanations. In a number of cases, households received large transfers from relatives, thus allowing them to spend more than their incomes. At the other extreme, some of the high-income households spent relatively little overall, although their food consumption levels were in line with nutritional requirements. Undoubtedly, furthermore, a number of the households did not properly report their incomes, which is the commonly used argument for use of the expenditure-based measures of household income in analysis. This can be seen from the presentation in Table 2.3.2 that gives the purchases of household durables, which are representative for discretionary spending, in relation to the household income and expenditure rankings. The table expresses these purchases per household in comparison of those purchases for the average household.

15
Table 2.3.2 Intensity of purchases of household durables by income/expenditure quintiles
(household rankings based on income/expenditure excluding imputed rent) Expenditure Income quintiles
Quintiles 1 2 3 4 5 Total 1 0.23 0.39 0.37 0.43 0.16 0.29 2 0.34 0.38 0.38 0.32 0.44 0.37 3 0.59 0.33 0.47 1.05 0.44 0.59 4 0.38 0.74 0.99 1.34 0.97 1.05 5 1.61 1.56 1.15 1.82 2.41 2.15
Total 0.34 0.44 0.65 1.30 1.91 1.00 A value above 1 therefore indicates that within that income/expenditure group households spent more than average and a value below 1 indicates spending below the average. It is then to be expected that the households in lower quintiles spend less than the average while households in the highest quintiles spend (much) more than the average. For this analysis, the first concept, namely expenditures excluding rent is used as this is a closer approximation of availability of money for discretionary expenditure. It may be remembered that imputed rent is an adjustment that adds the same value to income and expenditure, changing the relative position of the household in the rankings only. It can be observed that, in general, the higher quintiles have values of more than 1, while the lower quintiles mostly have values below 1. The most important numbers are those on the diagonal giving the same ranking for both incomes and expenditures (from upper left to lower right in the table) as these cells contain the highest number of households. The inconsistent numbers for some of the off-diagonal cells in the table sometimes are due to the low number of observations (e.g. the 0.16 against the one-but-last cell in the first row) and therefore are not significant. In summary, it may be concluded that there is merit in analysing the household characteristics in the Maldives by income as well as expenditure groupings, as there are clear indications that prosperity has increased to an extent that the basic assumption in the use of expenditures as an approximation of incomes, is no longer valid. This specifies, implicitly, that households in all income classes spend more or less the same proportion of their incomes. Measured (imperfectly) in terms of income groups, the lowest quintile spends less than half as much on consumer durables than the highest quintile, with probably equally large differences in savings behaviour. It is, however, not possible to use the income classification with confidence as there are clearly (under)reporting problems. However, this only indicates the need to improve the income and savings parts of future household surveys so that these important aspects can be included in the analysis.

16
Regional grouping Figure 2.3.3 Regional grouping of atolls
As mentioned earlier, the sample design of the survey was based on a regional stratification of the country. In addition, these regions were further stratified into nearby and remote sub-regions, but as explained earlier, this did not yield reliable information and the sub-stratification has, therefore, not been reflected in either the analysis in the following chapters or the tables in the Annex. The regional grouping has been marked on the map of the Maldives in the front of this publication. In terms of administrative atolls, the grouping is as given in the box at the right. The graphs and analysis presented in the following chapters generally are given with the regional detail following the outline of this table. Figure 2.3.4 below shows the average household consumption expenditure per person per day in the five regions and Male'. Average expenditure (mean) in Male' is about twice as high as that in the islands. The incomes in the different regions does not show large differences with the highest, Southern region, about twenty percent higher than that of the lowest, that is, Northern region.
* Note: In the HIES Faafu Atoll has been kept in the Central region. When the five development regions within the country were finalised Faafu Atoll is in the Central Southern region.
Region Alphabetic name Official name Northern Haa Alifu Atoll North Thiladhunmathi Haa Dhaalu Atoll South Thiladhunmathi Shaviyani Atoll North Miladhunmadhulu Central Northern Noonu Atoll South Miladhunmadhulu Raa Atoll North Maalhosmadhulu Baa Atoll South Maalhosmadhulu Lhaviyani Atoll Faadhippolhu Central Kaafu Atoll Male' Atoll Alifu Alifu Buri North Ari Atoll Alif Dhaalu South Ari Atoll Vaavu Atoll Felidhu Atoll Male' Capital Male' Male' Central Southern Meemu Atoll Mulakatholhu Faafu Atoll * North Nilandhe Atoll Dhaalu Atoll South Nilandhe Atoll Thaa Atoll Kolhumadhulu Laamu Atoll Hadhunmathi Southern Gaafu Alifu Atoll North Huvadhu Atoll Gaafu Dhaalu Atoll South Huvadhu Atoll Gnaviyani Atoll Fuvahmulah
Seenu Atoll Addu Atoll
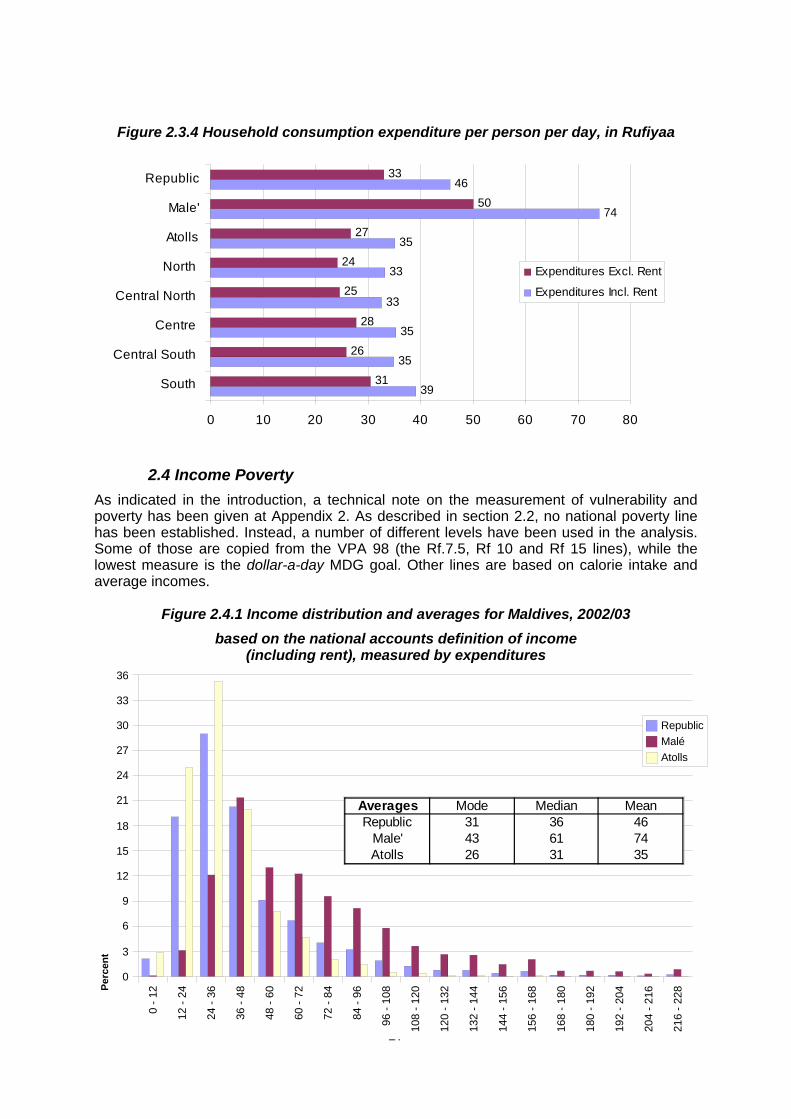
17
Figure 2.3.4 Household consumption expenditure per person per day, in Rufiyaa
39
35
35
33
33
35
74
46
31
26
28
25
24
27
50
33
0 10 20 30 40 50 60 70 80
South
Central South
Centre
Central North
North
Atolls
Male'
Republic
Expenditures Excl. Rent
Expenditures Incl. Rent
2.4 Income Poverty As indicated in the introduction, a technical note on the measurement of vulnerability and poverty has been given at Appendix 2. As described in section 2.2, no national poverty line has been established. Instead, a number of different levels have been used in the analysis. Some of those are copied from the VPA 98 (the Rf.7.5, Rf 10 and Rf 15 lines), while the lowest measure is the dollar-a-day MDG goal. Other lines are based on calorie intake and average incomes.
Figure 2.4.1 Income distribution and averages for Maldives, 2002/03
based on the national accounts definition of income (including rent), measured by expenditures
0 - 1
2
12 -
24
24 -
36
36 -
48
48 -
60
60 -
72
72 -
84
84 -
96
96 -
108
108
- 120
120
- 132
132
- 144
144
- 156
156
- 168
168
- 180
180
- 192
192
- 204
204
- 216
216
- 228
0
3
6
9
12
15
18
21
24
27
30
33
36
RepublicMaléAtolls
Perc
ent
Averages Mode Median MeanRepublic 31 36 46
Male' 43 61 74Atolls 26 31 35
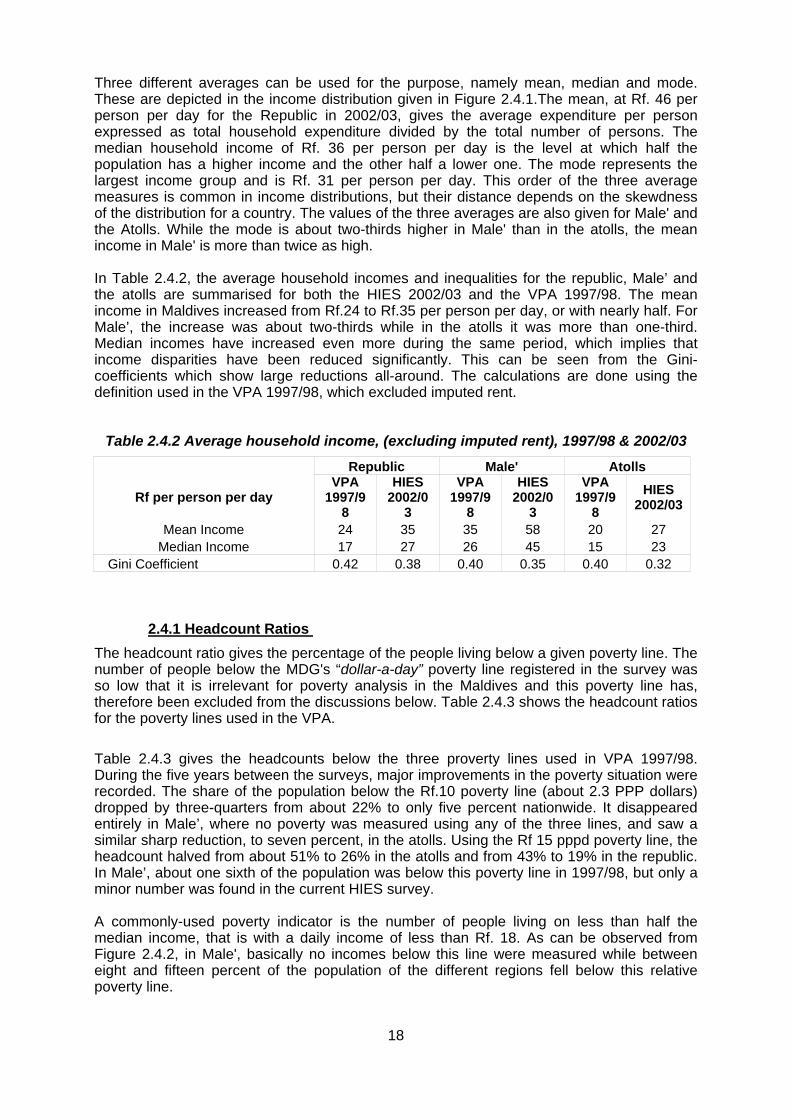
18
Three different averages can be used for the purpose, namely mean, median and mode. These are depicted in the income distribution given in Figure 2.4.1.The mean, at Rf. 46 per person per day for the Republic in 2002/03, gives the average expenditure per person expressed as total household expenditure divided by the total number of persons. The median household income of Rf. 36 per person per day is the level at which half the population has a higher income and the other half a lower one. The mode represents the largest income group and is Rf. 31 per person per day. This order of the three average measures is common in income distributions, but their distance depends on the skewdness of the distribution for a country. The values of the three averages are also given for Male' and the Atolls. While the mode is about two-thirds higher in Male' than in the atolls, the mean income in Male' is more than twice as high. In Table 2.4.2, the average household incomes and inequalities for the republic, Male’ and the atolls are summarised for both the HIES 2002/03 and the VPA 1997/98. The mean income in Maldives increased from Rf.24 to Rf.35 per person per day, or with nearly half. For Male’, the increase was about two-thirds while in the atolls it was more than one-third. Median incomes have increased even more during the same period, which implies that income disparities have been reduced significantly. This can be seen from the Gini-coefficients which show large reductions all-around. The calculations are done using the definition used in the VPA 1997/98, which excluded imputed rent.
Table 2.4.2 Average household income, (excluding imputed rent), 1997/98 & 2002/03
Republic Male' Atolls
Rf per person per day VPA
1997/98
HIES 2002/0
3
VPA 1997/9
8
HIES 2002/0
3
VPA 1997/9
8 HIES
2002/03
Mean Income 24 35 35 58 20 27 Median Income 17 27 26 45 15 23
Gini Coefficient 0.42 0.38 0.40 0.35 0.40 0.32
2.4.1 Headcount Ratios The headcount ratio gives the percentage of the people living below a given poverty line. The number of people below the MDG's “dollar-a-day” poverty line registered in the survey was so low that it is irrelevant for poverty analysis in the Maldives and this poverty line has, therefore been excluded from the discussions below. Table 2.4.3 shows the headcount ratios for the poverty lines used in the VPA. Table 2.4.3 gives the headcounts below the three proverty lines used in VPA 1997/98. During the five years between the surveys, major improvements in the poverty situation were recorded. The share of the population below the Rf.10 poverty line (about 2.3 PPP dollars) dropped by three-quarters from about 22% to only five percent nationwide. It disappeared entirely in Male’, where no poverty was measured using any of the three lines, and saw a similar sharp reduction, to seven percent, in the atolls. Using the Rf 15 pppd poverty line, the headcount halved from about 51% to 26% in the atolls and from 43% to 19% in the republic. In Male’, about one sixth of the population was below this poverty line in 1997/98, but only a minor number was found in the current HIES survey. A commonly-used poverty indicator is the number of people living on less than half the median income, that is with a daily income of less than Rf. 18. As can be observed from Figure 2.4.2, in Male', basically no incomes below this line were measured while between eight and fifteen percent of the population of the different regions fell below this relative poverty line.
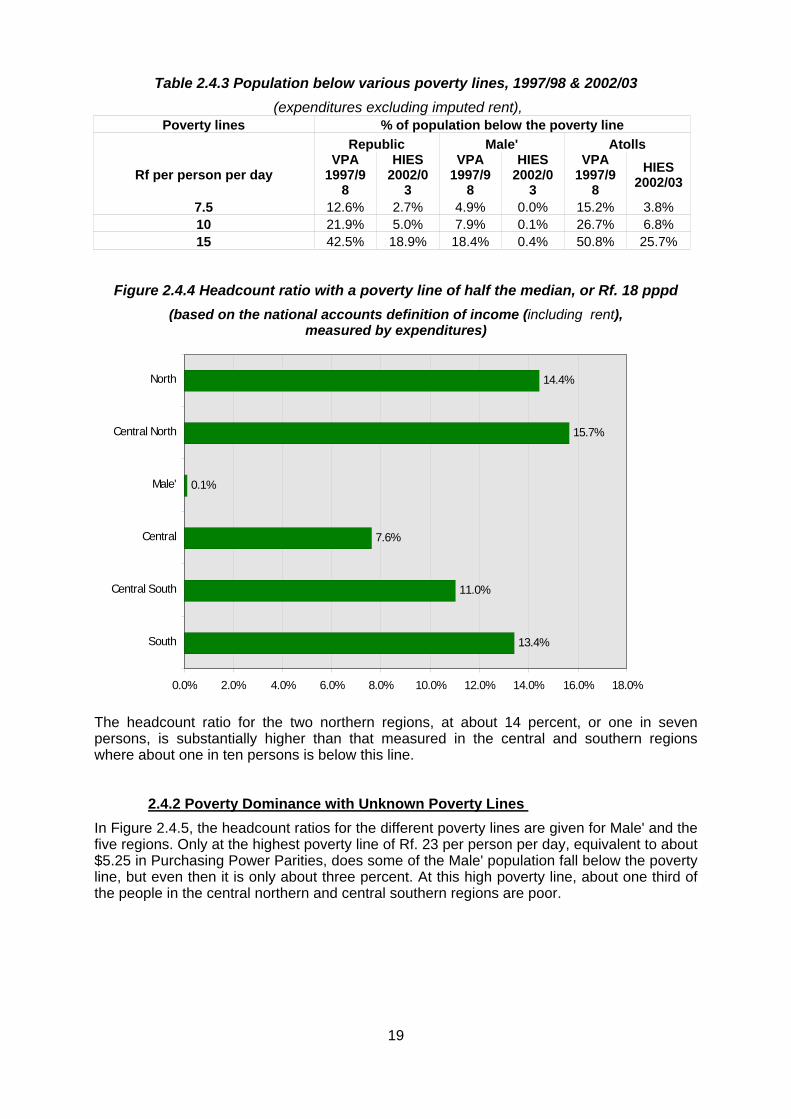
19
Table 2.4.3 Population below various poverty lines, 1997/98 & 2002/03 (expenditures excluding imputed rent),
Poverty lines % of population below the poverty line Republic Male' Atolls
Rf per person per day VPA
1997/98
HIES 2002/0
3
VPA 1997/9
8
HIES 2002/0
3
VPA 1997/9
8 HIES
2002/03
7.5 12.6% 2.7% 4.9% 0.0% 15.2% 3.8% 10 21.9% 5.0% 7.9% 0.1% 26.7% 6.8% 15 42.5% 18.9% 18.4% 0.4% 50.8% 25.7%
Figure 2.4.4 Headcount ratio with a poverty line of half the median, or Rf. 18 pppd (based on the national accounts definition of income (including rent),
measured by expenditures)
13.4%
11.0%
7.6%
0.1%
14.4%
15.7%
0.0% 2.0% 4.0% 6.0% 8.0% 10.0% 12.0% 14.0% 16.0% 18.0%
South
Central South
Central
Male'
Central North
North
The headcount ratio for the two northern regions, at about 14 percent, or one in seven persons, is substantially higher than that measured in the central and southern regions where about one in ten persons is below this line.
2.4.2 Poverty Dominance with Unknown Poverty Lines In Figure 2.4.5, the headcount ratios for the different poverty lines are given for Male' and the five regions. Only at the highest poverty line of Rf. 23 per person per day, equivalent to about $5.25 in Purchasing Power Parities, does some of the Male' population fall below the poverty line, but even then it is only about three percent. At this high poverty line, about one third of the people in the central northern and central southern regions are poor.

20
Figure 2.4.5 Headcount ratios for different poverty lines (including rent)
0% 10% 20% 30% 40% 50% 60% 70%
South
Central South
Central
Central North
North
Atolls
Male'
23
18
15.8
15
10
7.5
As mentioned earlier, only a minimal level of poverty was measured in Male' against the highest of the poverty lines used, which basically means that severe income poverty does not play an important part in Male'.
Figure 2.4.6 Headcount ratios for different poverty lines (excluding rent)
0% 10% 20% 30% 40% 50% 60% 70%
South
Central South
Central
Central North
North
Atolls
Male'
23
18
15.8
15
107.5
The difference between Figure 2.4.5 and Figure 2.4.6 is the definition of income. The definition used in Figure 2.4.5 includes rents, both actually paid as well as imputed, in the expenditures. As expenditures are treated as a proxy for income in this regard, incomes also includes the estimated rents.
21
In Male' more than one third of the households live in rented accommodation according to the 2000 population census. For Male', the best definition of income is therefore the one shown in Figure 2.4.5 as there is a ready market for housing and rental values can be estimated with a good degree of accuracy also for the households that live in their own houses. In the Atolls, only about one in forty households live in rented accommodation and estimating the rental values of owner-occupied dwellings is, therefore, much more difficult. It is, however, not impossible as even on many small islands some dwellings are rented out. For imputation in this HIES survey, the average rents received are used (see section 2.2.2). Using the income definition as expenditures excluding actual and imputed rents, Figure 2.4.6 gives the poverty situation measured against the same poverty lines as used in Figure 2.4.5. Of course, the situation in this case looks much worse as the cost of housing is an important expenditure category, whether or not it is imputed. As income is here measured from the expenditure side and the rents are excluded, the proportion of the population falling below the different poverty lines is by definition higher than when rents are included in income. But even then, less than three percent fall below the lowest poverty line of Rf. 7.5 per person per day. There are, however, large differences at the higher poverty lines, with close to half of the atoll population and one sixth of the population of Male' falling under the highest poverty line of Rf. 23 per person per day. From the information given in Figure 2.4.6 it can furthermore be deducted that poverty in the northern, central northern and central southern regions follows broadly the same pattern and is much worse than in the central and southern regions. Southern region has the lowest incidence of poverty at all poverty lines except at the Rf.15.8 and Rf.15 poverty lines, where central region has a lower headcount.
2.4.3 Poverty Gap Ratios The headcount ratio indicates the share of the population falling below each selected poverty line, but does not give an indication of the depth of the poverty. The headcount will be the same for example, when the average income is only half the poverty line or when it is just below the line. The average income shortfall on the other hand measures the average distance of the poor to the poverty line. Also this measure is deficient as it does not take into account the number of poor. A better measure, therefore, is the Poverty Gap Ratio (PGR) which takes care of both the incidence and depth of poverty. It is calculated as the product of headcount index and the average income shortfall.
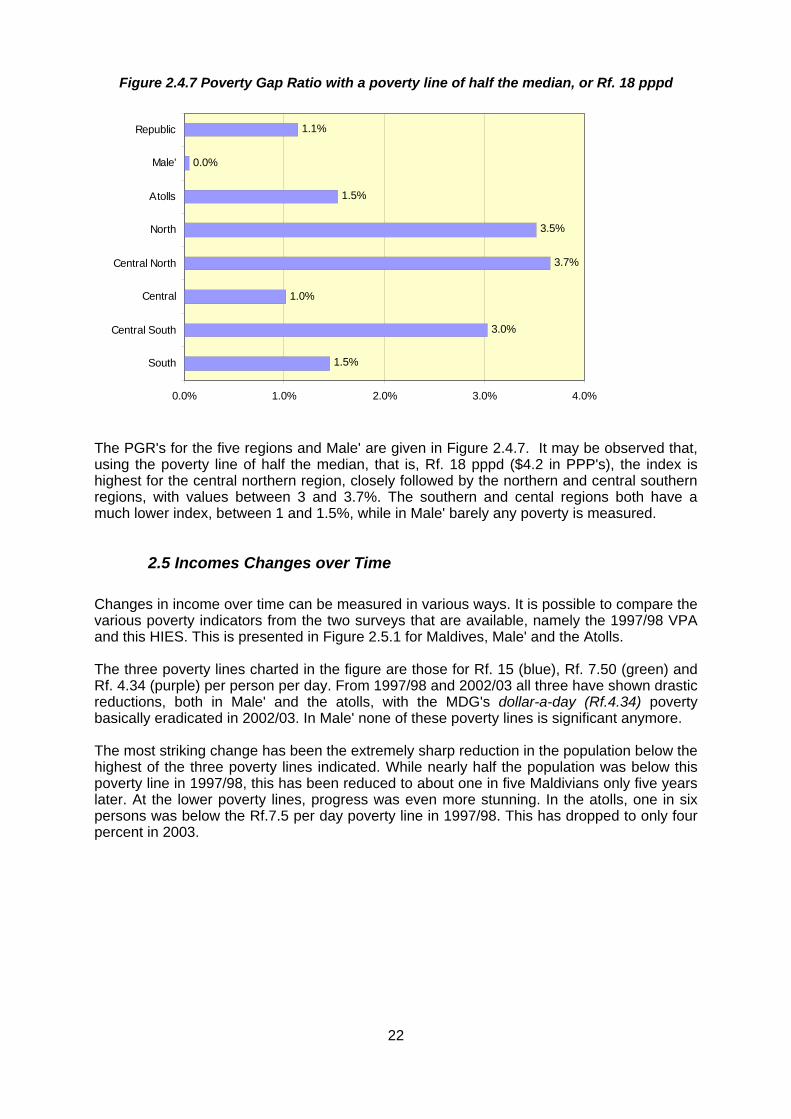
22
Figure 2.4.7 Poverty Gap Ratio with a poverty line of half the median, or Rf. 18 pppd
1.5%
3.0%
1.0%
3.7%
3.5%
1.5%
0.0%
1.1%
0.0% 1.0% 2.0% 3.0% 4.0%
South
Central South
Central
Central North
North
Atolls
Male'
Republic
The PGR's for the five regions and Male' are given in Figure 2.4.7. It may be observed that, using the poverty line of half the median, that is, Rf. 18 pppd ($4.2 in PPP's), the index is highest for the central northern region, closely followed by the northern and central southern regions, with values between 3 and 3.7%. The southern and cental regions both have a much lower index, between 1 and 1.5%, while in Male' barely any poverty is measured.
2.5 Incomes Changes over Time Changes in income over time can be measured in various ways. It is possible to compare the various poverty indicators from the two surveys that are available, namely the 1997/98 VPA and this HIES. This is presented in Figure 2.5.1 for Maldives, Male' and the Atolls. The three poverty lines charted in the figure are those for Rf. 15 (blue), Rf. 7.50 (green) and Rf. 4.34 (purple) per person per day. From 1997/98 and 2002/03 all three have shown drastic reductions, both in Male' and the atolls, with the MDG's dollar-a-day (Rf.4.34) poverty basically eradicated in 2002/03. In Male' none of these poverty lines is significant anymore. The most striking change has been the extremely sharp reduction in the population below the highest of the three poverty lines indicated. While nearly half the population was below this poverty line in 1997/98, this has been reduced to about one in five Maldivians only five years later. At the lower poverty lines, progress was even more stunning. In the atolls, one in six persons was below the Rf.7.5 per day poverty line in 1997/98. This has dropped to only four percent in 2003.

23
Figure 2.5.1 Change in poverty at various poverty lines between 1997/98 and 2002/03
Maldives
19%
3%0%
43%
13%
3%
0%
5%
10%
15%
20%
25%
30%
35%
40%
45%
50%
55%
1995 2000 2005
pove
rty
gap
ratio
's
Male'
0.4%
18%
0%
5%
1%0%
5%
10%
15%
20%
25%
30%
35%
40%
45%
50%
55%
1995 2000 2005
Atolls
4 %4 %
0 %
2 6 %
51%
15%
0 %
5%
10 %
15%
2 0 %
2 5%
3 0 %
3 5%
4 0 %
4 5%
50 %
55%
19 9 5 2 0 0 0 2 0 0 5
Another possibility to measure income changes over time is to ask the householders in a survey about their individual experiences. This has also been done in the HIES 2002/03. The summary of responses is given in Figure 2.5.2. It may be observed that about the same number of households reported increases and decreases of income in both the central northern and central regions. In the other regions, more households reported increases than decreases. The most significant change has occurred in the central southern region where twice as many households reported increases than decreases.
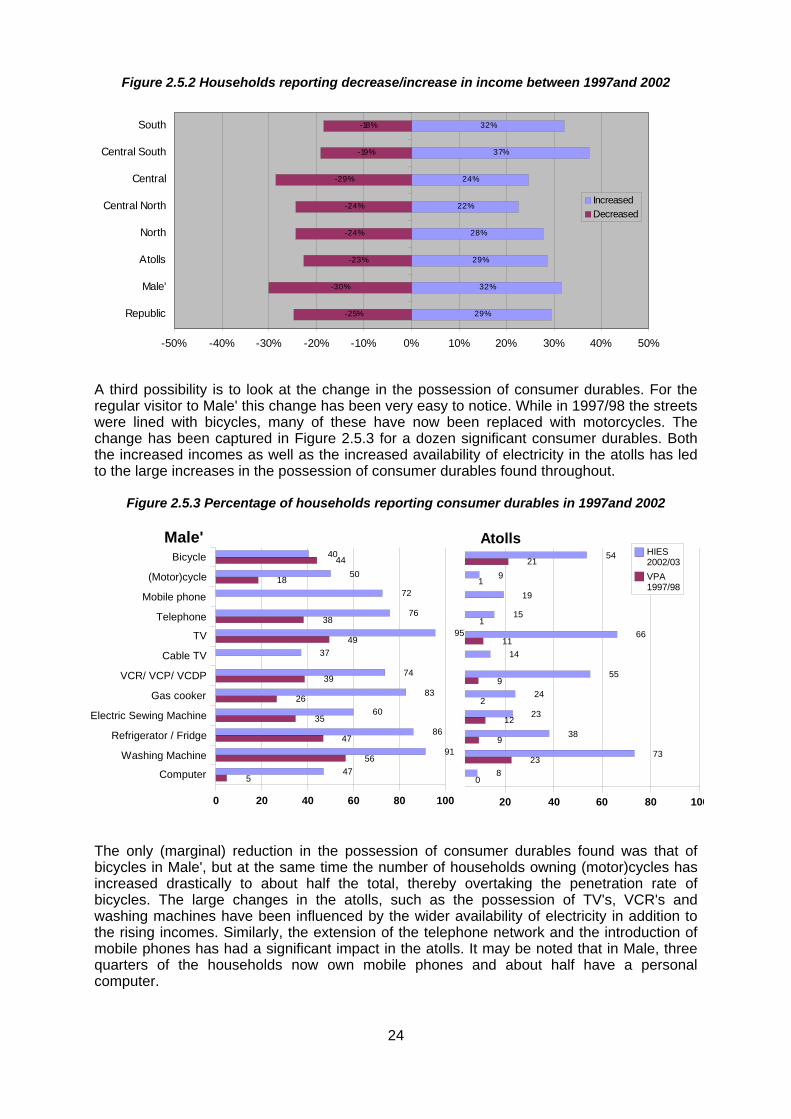
24
Figure 2.5.2 Households reporting decrease/increase in income between 1997and 2002
29%
32%
29%
28%
22%
24%
37%
32%
-25%
-30%
-23%
-24%
-24%
-29%
-19%
-18%
-50% -40% -30% -20% -10% 0% 10% 20% 30% 40% 50%
Republic
Male'
Atolls
North
Central North
Central
Central South
South
IncreasedDecreased
A third possibility is to look at the change in the possession of consumer durables. For the regular visitor to Male' this change has been very easy to notice. While in 1997/98 the streets were lined with bicycles, many of these have now been replaced with motorcycles. The change has been captured in Figure 2.5.3 for a dozen significant consumer durables. Both the increased incomes as well as the increased availability of electricity in the atolls has led to the large increases in the possession of consumer durables found throughout.
Figure 2.5.3 Percentage of households reporting consumer durables in 1997and 2002
The only (marginal) reduction in the possession of consumer durables found was that of bicycles in Male', but at the same time the number of households owning (motor)cycles has increased drastically to about half the total, thereby overtaking the penetration rate of bicycles. The large changes in the atolls, such as the possession of TV's, VCR's and washing machines have been influenced by the wider availability of electricity in addition to the rising incomes. Similarly, the extension of the telephone network and the introduction of mobile phones has had a significant impact in the atolls. It may be noted that in Male, three quarters of the households now own mobile phones and about half have a personal computer.
0 20 40 60 80 100
54
9
19
15
66
14
55
24
23
38
73
8
21
1
1
11
9
2
12
9
23
0
AtollsHIES 2002/03VPA 1997/98
Computer
Washing Machine
Refrigerator / Fridge
Electric Sewing Machine
Gas cooker
VCR/ VCP/ VCDP
Cable TV
TV
Telephone
Mobile phone
(Motor)cycle
Bicycle
0 20 40 60 80 100
40
50
72
76
95
37
74
83
60
86
91
47
44
18
38
49
39
26
35
47
56
5
Male'

25
Finally, the increase in household incomes can be measured by means of the reported expenditures. The results of this comparison have been given in Figure 2.5.4. While average household expenditures (excluding rents) have increased by about thirteen percent in the northern region and some seventeen percent in the central region, all other regions and Male' experienced increases of about half over the five-year period.
Figure 2.5.4 Average per capita expenditures (excluding Rent) in 1997and 2002
20
17
24
16
21
19
32
23
31
26
28
25
24
27
50
33
0 10 20 30 40 50 60
South
Central South
Centre
Central North
North
Atolls
Male'
Republic
Rf. per person per day
2002/03
1997/98
The same information by expenditure groups (defined on the basis of expenditures excluding rent) for Male' and the Atolls is given in Figure 2.5.5. It shows clearly that the disparity between Male' and the Atolls has increased significantly over this five year period, especially for the highest income groups.
Figure 2.5.5 Average per capita expenditures by quintile, Male' and Atolls, 1997and 2002
(expenditures excluding imputed rent)
0
20
40
60
80
100
120
140
Poorest 20% 2nd quintile 3rd quintile 4th quintile Richest 20%
Male' 1997/98 Male' 2002/03 Atolls 1997/98 Atolls 2002/03
All four approaches to measurement of the change in incomes over the five-year period between the two surveys yield broadly the same results. The fast rise in average incomes

26
during the period has led to a significant drop in poverty and a sharp increase in discretionary incomes as measured by the population below the various poverty lines and the increased possession of consumer durables respectively. Many more households also reported an increase in incomes rather than declines over the period, while the average expenditures per capita also showed large positive changes. These changes were, however, not equally distributed over the regions, nor the expenditure quintiles. When measuring progress in economic development, the change in headcount ratios can also be used. In Figure 2.5.6, the headcount ratios for the lowest poverty line, Rf.7.5 (US$ 1.75 PPP) are given for Male’, the atolls and the regions.
Figure 2.5.6 Headcount ratios for poverty line of Rf. 7.5 (excluding imputed rent)
7.8%
23.3%
5.2%
25.3%
12.0%
15.2%
4.9%
12.6%
0.6%
3.4%
2.5%
4.5%
7.5%
3.8%
2.7%
0.0%
0.0% 5.0% 10.0% 15.0% 20.0% 25.0% 30.0%
South
Central South
Central
Central North
North
Atoll
Male'
Republic
2002/031997/98
In Male’, poverty at this line completely disappeared while in the atolls it was reduced by three-quarters. The central northern and central southern regions showed major reductions of about eighty percent, but the change in the northern region was much more modest at about one third. The changes at the higher poverty line of Rf.15 per person per day in the atolls are lower, but at about half still very substantial. Here again, it is only the northern region that has a much lower reduction in poverty. The headcount ratios at this poverty line are given in Figure 2.5.7.
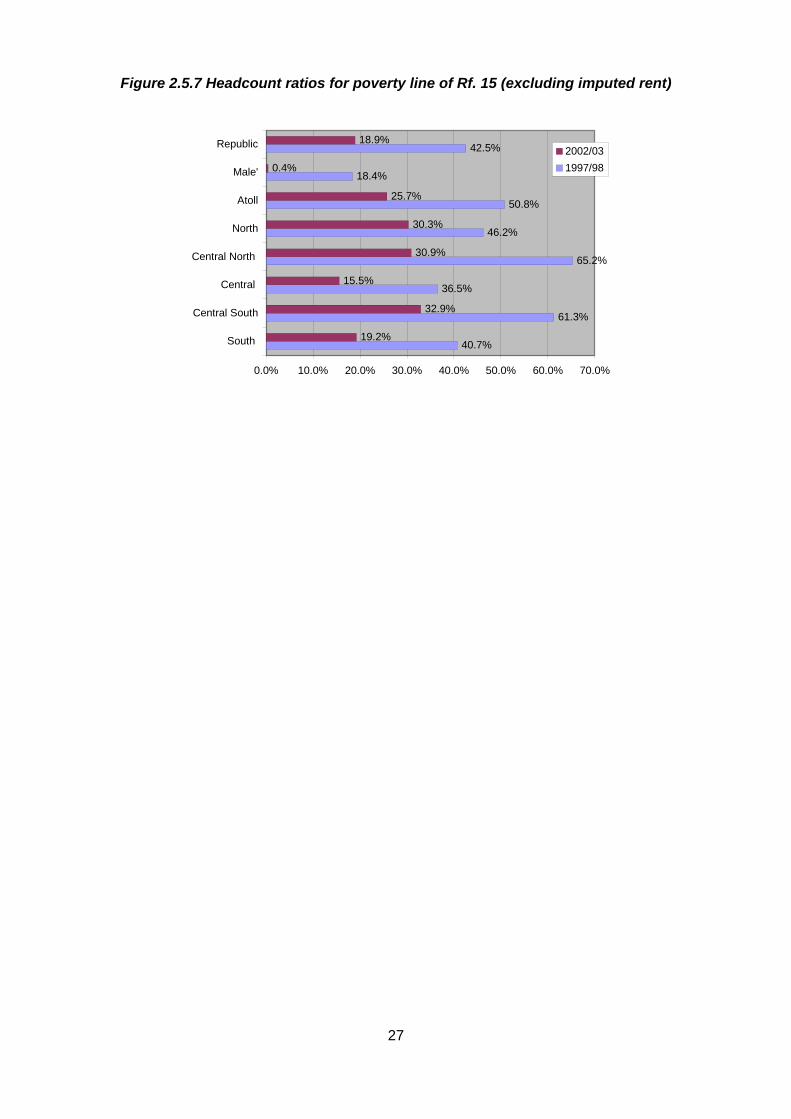
27
Figure 2.5.7 Headcount ratios for poverty line of Rf. 15 (excluding imputed rent)
40.7%
61.3%
36.5%
65.2%
46.2%
50.8%
18.4%
42.5%
19.2%
32.9%
15.5%
30.9%
30.3%
25.7%
0.4%
18.9%
0.0% 10.0% 20.0% 30.0% 40.0% 50.0% 60.0% 70.0%
South
Central South
Central
Central North
North
Atoll
Male'
Republic2002/031997/98
28
Chapter 3: Working Age Population and Employment Summary
The working age population of Maldives was estimated at about 160 thousand persons. Slightly less than half of those were estimated to be in the labour force, but it may be noticed that the questions in the HIES are not exactly the same as those in the population census 2000 or the VPA. This may have resulted in slight differences in the estimates. About two-thirds of the male population was found to be in the labour force as against nearly one-third of the females. There was no difference in these patterns between Male' and the atolls. In Male', roughly one in three workers reported to have a second job, but this was the case for only about five percent of the workers in the atolls. The main activities that the Maldivian labour force was employed in are, in order of declining importance, manufacturing and public administration which each employed about one out of six workers, fishing, trade and education. These five activities together employed two-thirds of the Maldivian workers. It may be noted that the HIES did not cover expatriates, which make up as much as one third of the total labour force. These workers are employed mostly in the resorts, construction and trade. It was found that about one quarter of the working population was self-employed, which is low for developing nations. The distribution of self-employed between men and women is not even. Nearly four in ten employed women reported to be self-employed, while only one in six men reported this status. Conversely, the share of employees in the labour force is high at about sixty percent. Two-third of the men and more than half the women are employees. The labour force consists for about one-third of production workers, with roughly the same number of males and females. About one in six persons was agriculture/fisheries worker and another sixth were administrative workers. In the latter group, slightly more women than men were working, but in agriculture and fisheries only one in six of the workers was female. As mentioned, the share of women in the labour force was about half of that for men. In addition, fewer women were engaged in professional and technical fields. These differences are accentuated by the average monthly income reported by men and women, as women on average earned less than half the men's incomes in both the atolls and Male'.
3.1 Introduction The working age population of the Maldives, defined as the persons of 15 years of age and above, is about 162,000 persons, with slightly more females than males. The number of persons reporting to be economically active is about 43 percent of the total. For males, it is 65 percent while for females it is slightly above 23 percent. Figure 3.1.1 furthermore shows that about a quarter of the working-age population, mostly female, is engaged in housework while a fifth is studying. About one-seventh of the adults specify that they are doing nothing specific. This includes amongst others the chronically ill, pensioners and other income earners. Between Male' and the atolls, the overall picture is the same. The main differences are the relatively higher share of women doing housework in the atolls and the higher share of students, both male and female, in the working age population of Male'. The population that reports to be economically active is the major, but not the only part of the labour force. The labour force also includes those persons that are working but whose main activity is reported as one of the three other categories (studying, house making and others). This group adds about fifteen percent to the number of workers. Furthermore, no information is included on the unemployed, unless they had reported themselves to be economically active.
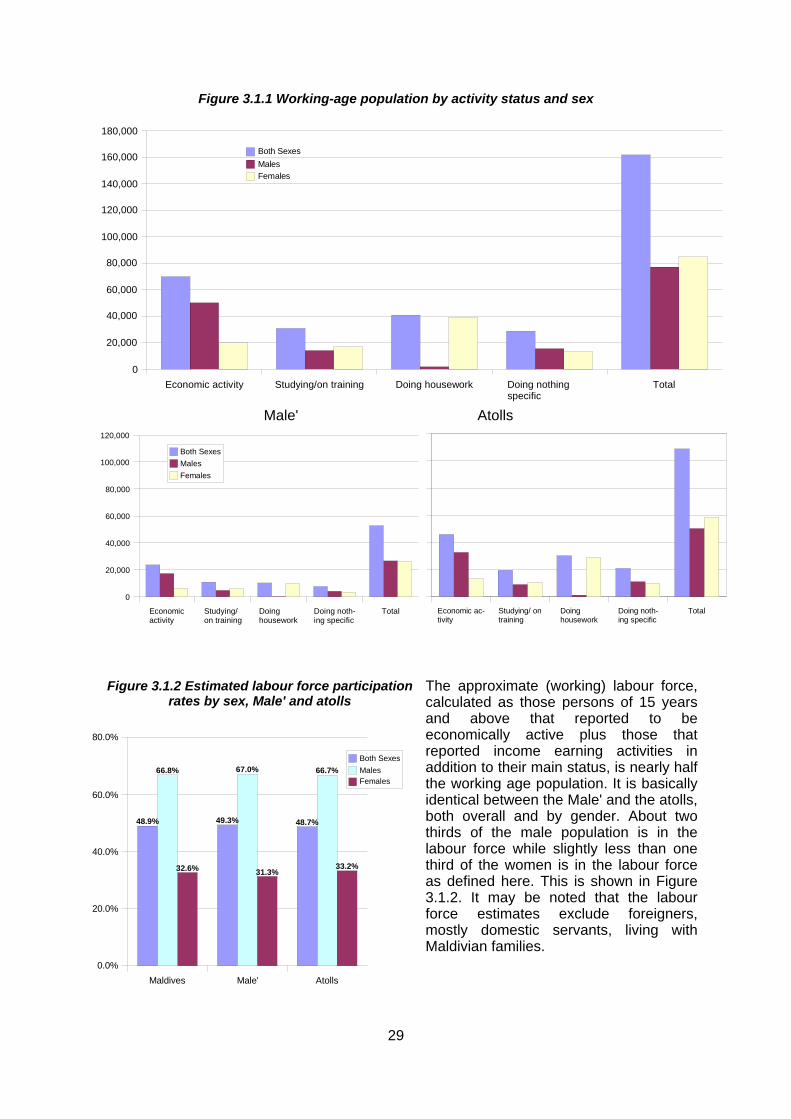
29
Figure 3.1.1 Working-age population by activity status and sex
Male' Atolls
The approximate (working) labour force, calculated as those persons of 15 years and above that reported to be economically active plus those that reported income earning activities in addition to their main status, is nearly half the working age population. It is basically identical between the Male' and the atolls, both overall and by gender. About two thirds of the male population is in the labour force while slightly less than one third of the women is in the labour force as defined here. This is shown in Figure 3.1.2. It may be noted that the labour force estimates exclude foreigners, mostly domestic servants, living with Maldivian families.
Economic activity Studying/on training Doing housework Doing nothing specific
Total0
20,000
40,000
60,000
80,000
100,000
120,000
140,000
160,000
180,000
Both SexesMalesFemales
Economic activity
Studying/ on training
Doing housework
Doing noth-ing specific
Total
0
20,000
40,000
60,000
80,000
100,000
120,000
Both SexesMalesFemales
Economic ac-tivity
Studying/ on training
Doing housework
Doing noth-ing specific
Total
Figure 3.1.2 Estimated labour force participation rates by sex, Male' and atolls
Maldives Male' Atolls0.0%
20.0%
40.0%
60.0%
80.0%
48.9% 49.3% 48.7%
66.8% 67.0% 66.7%
32.6% 31.3%33.2%
Both SexesMalesFemales

30
As indicated in Figure 3.1.3, males make up about two-thirds of the labour force while females make up the remainder. Slightly more than one third of the labour force is resident in Male' with the rest living in the atolls. In Male', about 35 percent of the working population reported to have a second job. With such opportunities much lower in the atolls, there only about five percent of the working population held a second job. The percentages of males and females having second jobs are the same in both Male' and the atolls.
3.2 Sectoral Employment Employment in Maldives comprises both Maldivian and expatriate workers. The number of expatriates employed is large and forms a substantial share of the total labour force. At the moment it is between one quarter and one third of the total and it continues to increase fast. Foreign households and institutional accommodation such as labour camps were excluded from the HIES. Therefore, no information on the foreign labour force except for a number of expatriate domestic servants living with Maldivian families and some foreigners married to Maldivians can be derived from the HIES. All foreigners have been excluded from the analysis in the following sections. Figure 3.2.1 shows the distribution of the Maldivian labour force by economic activity. One-sixth of the labour force in engaged in manufacturing activities. Another sixth is working in public administration. Another sixth is working in education and health services, mostly in the public sector. Fishing employs about an eight of the population with trade engaging about ten percent. Other activities are of lesser importance.
Figure 3.1.3 Estimated labour force by sex, Male' and atolls
Male' – malesAtolls – malesMale' – femalesAtolls – females
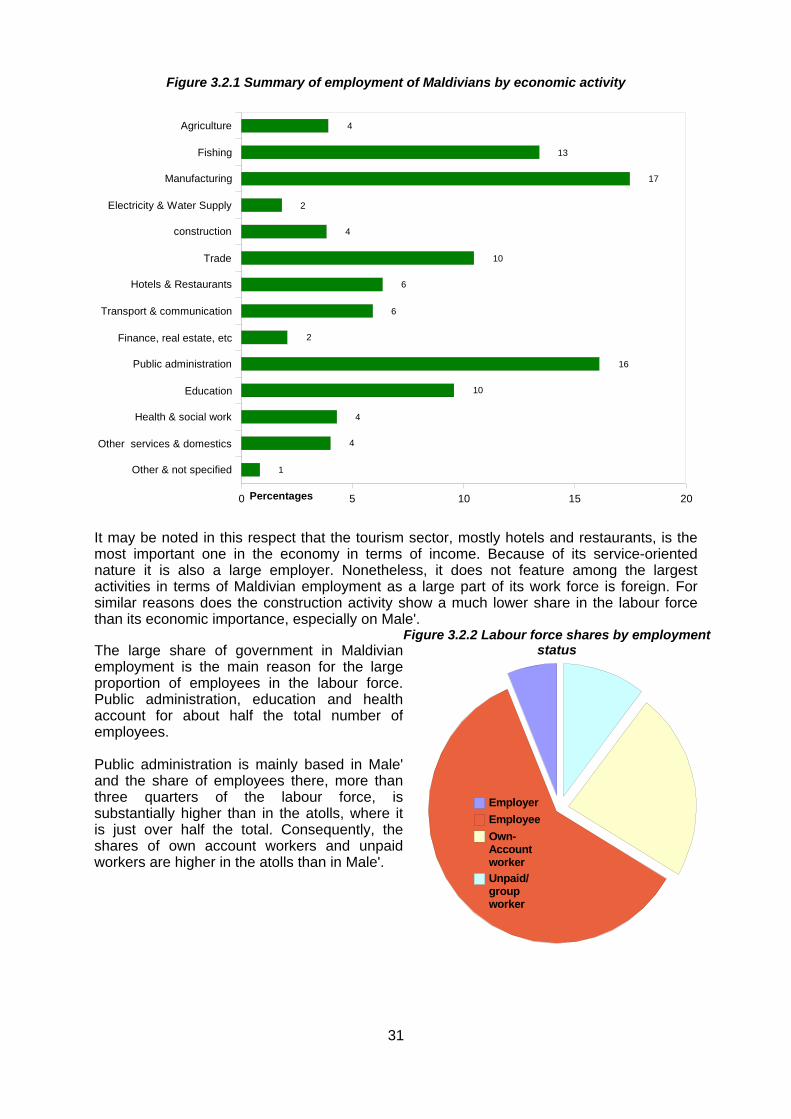
31
Figure 3.2.1 Summary of employment of Maldivians by economic activity
It may be noted in this respect that the tourism sector, mostly hotels and restaurants, is the most important one in the economy in terms of income. Because of its service-oriented nature it is also a large employer. Nonetheless, it does not feature among the largest activities in terms of Maldivian employment as a large part of its work force is foreign. For similar reasons does the construction activity show a much lower share in the labour force than its economic importance, especially on Male'. The large share of government in Maldivian employment is the main reason for the large proportion of employees in the labour force. Public administration, education and health account for about half the total number of employees. Public administration is mainly based in Male' and the share of employees there, more than three quarters of the labour force, is substantially higher than in the atolls, where it is just over half the total. Consequently, the shares of own account workers and unpaid workers are higher in the atolls than in Male'.
Other & not specified
Other services & domestics
Health & social work
Education
Public administration
Finance, real estate, etc
Transport & communication
Hotels & Restaurants
Trade
construction
Electricity & Water Supply
Manufacturing
Fishing
Agriculture
0 5 10 15 20
4
13
17
2
4
10
6
6
2
16
10
4
4
1
Percentages
Figure 3.2.2 Labour force shares by employment status
EmployerEmployeeOwn-Account workerUnpaid/ group worker
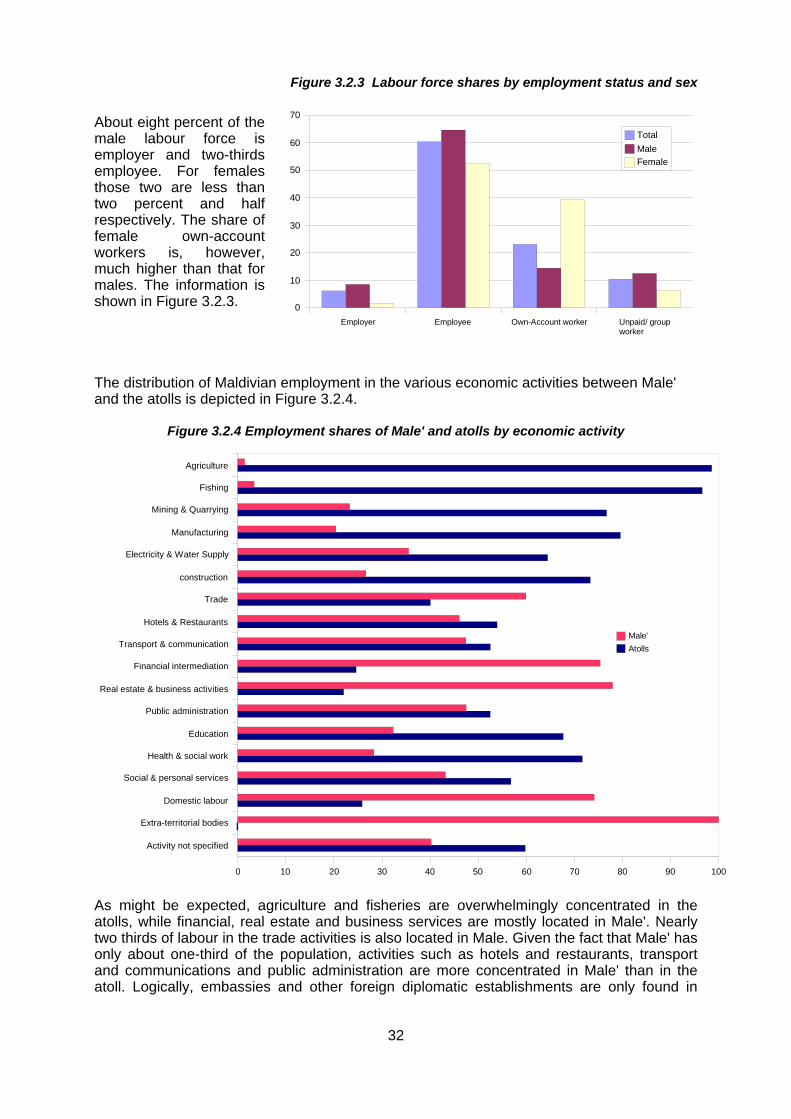
32
Figure 3.2.3 Labour force shares by employment status and sex
About eight percent of the male labour force is employer and two-thirds employee. For females those two are less than two percent and half respectively. The share of female own-account workers is, however, much higher than that for males. The information is shown in Figure 3.2.3. The distribution of Maldivian employment in the various economic activities between Male' and the atolls is depicted in Figure 3.2.4.
Figure 3.2.4 Employment shares of Male' and atolls by economic activity
As might be expected, agriculture and fisheries are overwhelmingly concentrated in the atolls, while financial, real estate and business services are mostly located in Male'. Nearly two thirds of labour in the trade activities is also located in Male. Given the fact that Male' has only about one-third of the population, activities such as hotels and restaurants, transport and communications and public administration are more concentrated in Male' than in the atoll. Logically, embassies and other foreign diplomatic establishments are only found in
Activity not specified
Extra-territorial bodies
Domestic labour
Social & personal services
Health & social work
Education
Public administration
Real estate & business activities
Financial intermediation
Transport & communication
Hotels & Restaurants
Trade
construction
Electricity & Water Supply
Manufacturing
Mining & Quarrying
Fishing
Agriculture
0 10 20 30 40 50 60 70 80 90 100
Male'Atolls
Employer Employee Own-Account worker Unpaid/ group worker
0
10
20
30
40
50
60
70
TotalMaleFemale
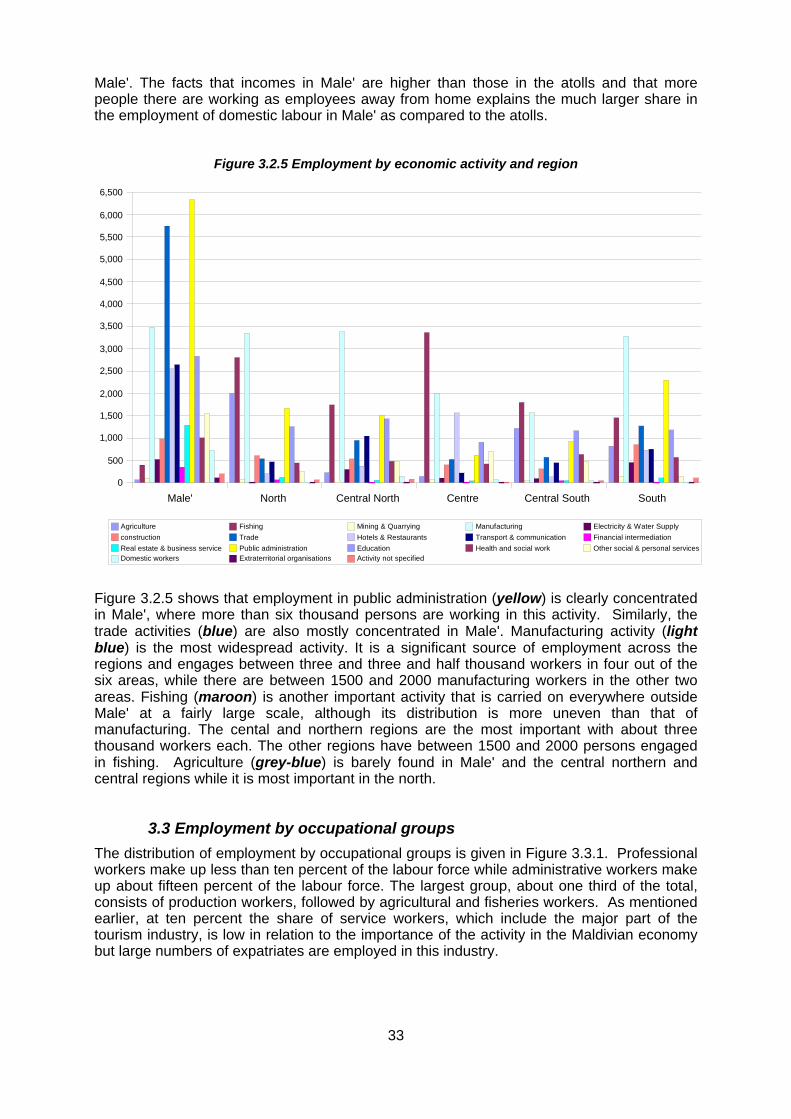
33
Male'. The facts that incomes in Male' are higher than those in the atolls and that more people there are working as employees away from home explains the much larger share in the employment of domestic labour in Male' as compared to the atolls.
Figure 3.2.5 Employment by economic activity and region
Figure 3.2.5 shows that employment in public administration (yellow) is clearly concentrated in Male', where more than six thousand persons are working in this activity. Similarly, the trade activities (blue) are also mostly concentrated in Male'. Manufacturing activity (light blue) is the most widespread activity. It is a significant source of employment across the regions and engages between three and three and half thousand workers in four out of the six areas, while there are between 1500 and 2000 manufacturing workers in the other two areas. Fishing (maroon) is another important activity that is carried on everywhere outside Male' at a fairly large scale, although its distribution is more uneven than that of manufacturing. The cental and northern regions are the most important with about three thousand workers each. The other regions have between 1500 and 2000 persons engaged in fishing. Agriculture (grey-blue) is barely found in Male' and the central northern and central regions while it is most important in the north.
3.3 Employment by occupational groups The distribution of employment by occupational groups is given in Figure 3.3.1. Professional workers make up less than ten percent of the labour force while administrative workers make up about fifteen percent of the labour force. The largest group, about one third of the total, consists of production workers, followed by agricultural and fisheries workers. As mentioned earlier, at ten percent the share of service workers, which include the major part of the tourism industry, is low in relation to the importance of the activity in the Maldivian economy but large numbers of expatriates are employed in this industry.
Male' North Central North Centre Central South South 0
500
1,000
1,500
2,000
2,500
3,000
3,500
4,000
4,500
5,000
5,500
6,000
6,500
Agriculture Fishing Mining & Quarrying Manufacturing Electricity & Water Supplyconstruction Trade Hotels & Restaurants Transport & communication Financial intermediationReal estate & business service Public administration Education Health and social work Other social & personal servicesDomestic workers Extraterritorial organisations Activity not specified

34
The distributions of male and female workers over the various occupational groups is quite different. Female workers make up only a very small proportion of the professional and technical workers They are also present in smaller numbers only amongst the agricultural and fisheries workers. On the other hand, there are more female administrative workers than males, while the share of female production workers is about fifteen percent higher than that of males.
Figure 3.3.1 Employment by occupational groups
3.4 Access to Productive Employment by women The female labour force participation rate, at about one-third of the working age population, is only half the rate for males. This is the case for both Male' and the atolls. In addition, the share of women in the higher level jobs in the professional and technical fields is only a fraction of that for males. The on average lower level jobs of women as well as their shorter average working hours together result in substantially lower average incomes for female than for male workers. This holds for Male' as well as the atolls and for all economic activities. Monthly average incomes in Male' and the atolls by gender are given in Figure 3.4.1.
Figure 3.4.1 Average monthly income by sex for Male' and the atolls (Rf. Per month)
Workers not classified
Production workers, etc
Agriculture & fisheries workers
Service workers
Sales workers
Clerical workers, etc
Administrative workers
Professional, Technical workers
0 10 20 30 40 50
8
14
10
5
10
18
32
3
7
7
7
3
7
15
18
2
1
8
3
3
3
3
15
1
Both GendersMalesFemales
Male' Atolls Average
0
1,000
2,000
3,000
4,000
5,000
6,000
7,000
Average Males Females
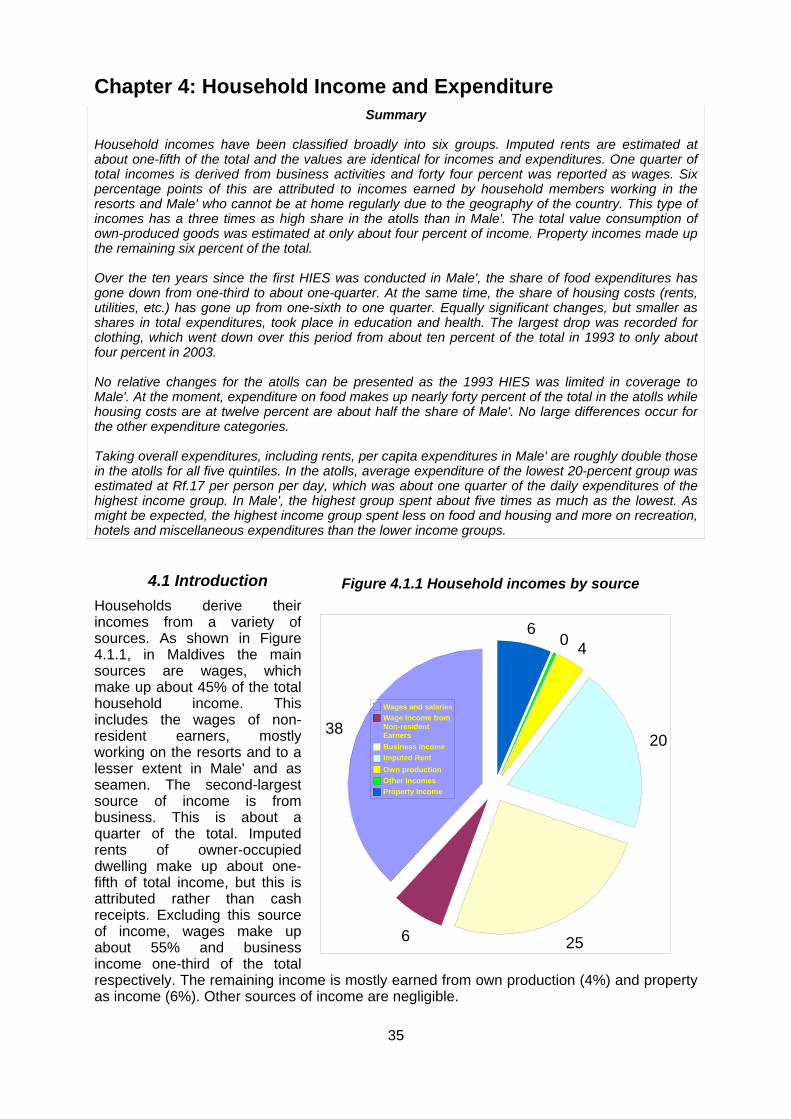
35
Chapter 4: Household Income and Expenditure Summary
Household incomes have been classified broadly into six groups. Imputed rents are estimated at about one-fifth of the total and the values are identical for incomes and expenditures. One quarter of total incomes is derived from business activities and forty four percent was reported as wages. Six percentage points of this are attributed to incomes earned by household members working in the resorts and Male' who cannot be at home regularly due to the geography of the country. This type of incomes has a three times as high share in the atolls than in Male'. The total value consumption of own-produced goods was estimated at only about four percent of income. Property incomes made up the remaining six percent of the total. Over the ten years since the first HIES was conducted in Male', the share of food expenditures has gone down from one-third to about one-quarter. At the same time, the share of housing costs (rents, utilities, etc.) has gone up from one-sixth to one quarter. Equally significant changes, but smaller as shares in total expenditures, took place in education and health. The largest drop was recorded for clothing, which went down over this period from about ten percent of the total in 1993 to only about four percent in 2003. No relative changes for the atolls can be presented as the 1993 HIES was limited in coverage to Male'. At the moment, expenditure on food makes up nearly forty percent of the total in the atolls while housing costs are at twelve percent are about half the share of Male'. No large differences occur for the other expenditure categories. Taking overall expenditures, including rents, per capita expenditures in Male' are roughly double those in the atolls for all five quintiles. In the atolls, average expenditure of the lowest 20-percent group was estimated at Rf.17 per person per day, which was about one quarter of the daily expenditures of the highest income group. In Male', the highest group spent about five times as much as the lowest. As might be expected, the highest income group spent less on food and housing and more on recreation, hotels and miscellaneous expenditures than the lower income groups.
4.1 Introduction Households derive their incomes from a variety of sources. As shown in Figure 4.1.1, in Maldives the main sources are wages, which make up about 45% of the total household income. This includes the wages of non-resident earners, mostly working on the resorts and to a lesser extent in Male' and as seamen. The second-largest source of income is from business. This is about a quarter of the total. Imputed rents of owner-occupied dwelling make up about one-fifth of total income, but this is attributed rather than cash receipts. Excluding this source of income, wages make up about 55% and business income one-third of the total respectively. The remaining income is mostly earned from own production (4%) and property as income (6%). Other sources of income are negligible.
Figure 4.1.1 Household incomes by source
38
6 25
20
406
Wages and salariesWage Income from Non-resident EarnersBusiness IncomeImputed RentOwn productionOther IncomesProperty Income
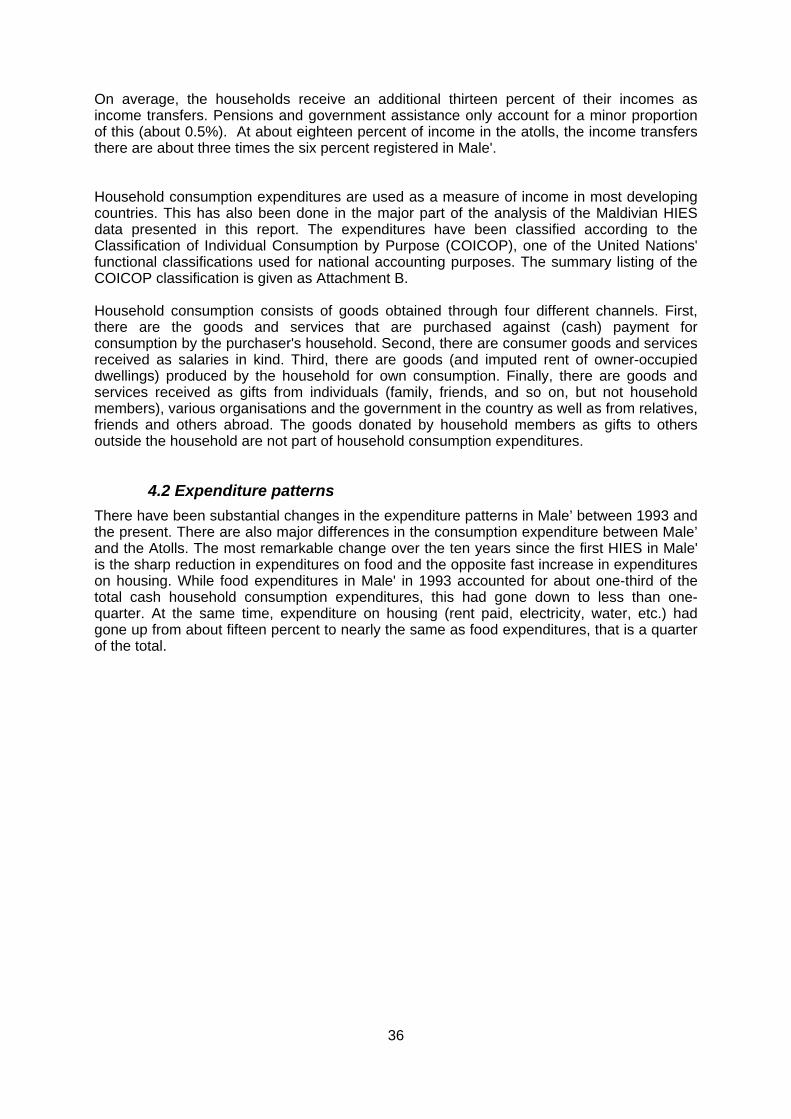
36
On average, the households receive an additional thirteen percent of their incomes as income transfers. Pensions and government assistance only account for a minor proportion of this (about 0.5%). At about eighteen percent of income in the atolls, the income transfers there are about three times the six percent registered in Male'. Household consumption expenditures are used as a measure of income in most developing countries. This has also been done in the major part of the analysis of the Maldivian HIES data presented in this report. The expenditures have been classified according to the Classification of Individual Consumption by Purpose (COICOP), one of the United Nations' functional classifications used for national accounting purposes. The summary listing of the COICOP classification is given as Attachment B. Household consumption consists of goods obtained through four different channels. First, there are the goods and services that are purchased against (cash) payment for consumption by the purchaser's household. Second, there are consumer goods and services received as salaries in kind. Third, there are goods (and imputed rent of owner-occupied dwellings) produced by the household for own consumption. Finally, there are goods and services received as gifts from individuals (family, friends, and so on, but not household members), various organisations and the government in the country as well as from relatives, friends and others abroad. The goods donated by household members as gifts to others outside the household are not part of household consumption expenditures.
4.2 Expenditure patterns There have been substantial changes in the expenditure patterns in Male’ between 1993 and the present. There are also major differences in the consumption expenditure between Male’ and the Atolls. The most remarkable change over the ten years since the first HIES in Male' is the sharp reduction in expenditures on food and the opposite fast increase in expenditures on housing. While food expenditures in Male' in 1993 accounted for about one-third of the total cash household consumption expenditures, this had gone down to less than one-quarter. At the same time, expenditure on housing (rent paid, electricity, water, etc.) had gone up from about fifteen percent to nearly the same as food expenditures, that is a quarter of the total.
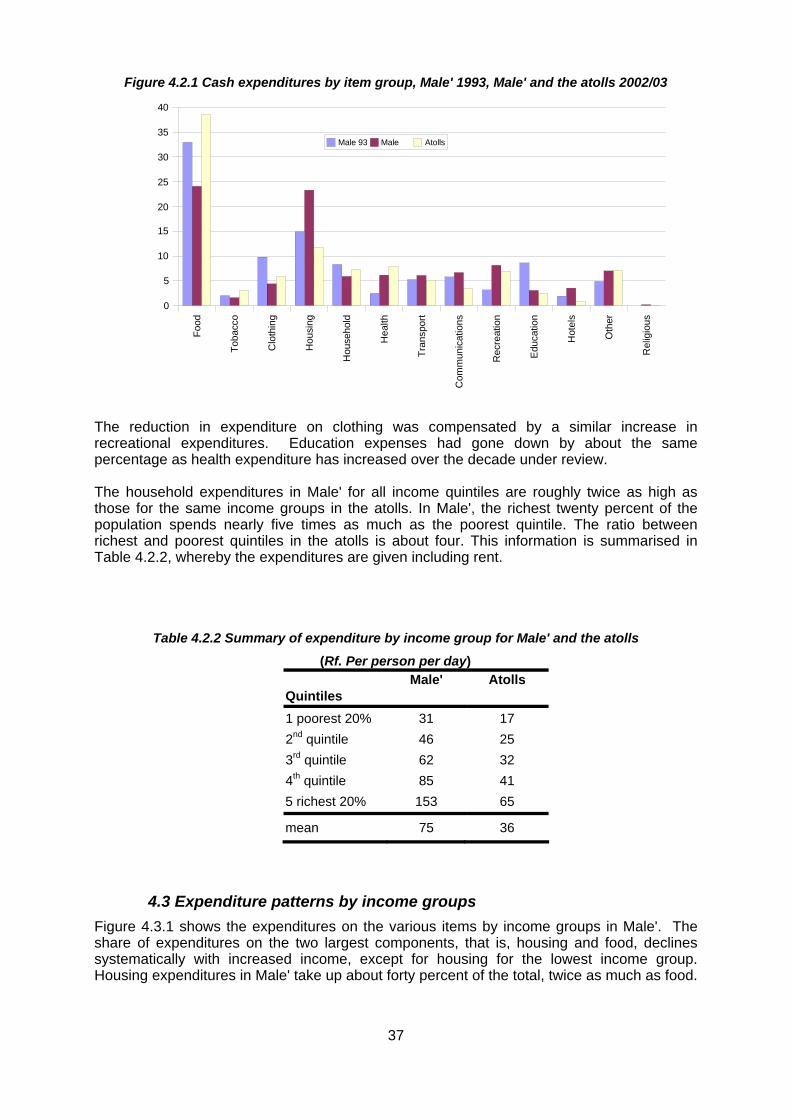
37
Figure 4.2.1 Cash expenditures by item group, Male' 1993, Male' and the atolls 2002/03
The reduction in expenditure on clothing was compensated by a similar increase in recreational expenditures. Education expenses had gone down by about the same percentage as health expenditure has increased over the decade under review. The household expenditures in Male' for all income quintiles are roughly twice as high as those for the same income groups in the atolls. In Male', the richest twenty percent of the population spends nearly five times as much as the poorest quintile. The ratio between richest and poorest quintiles in the atolls is about four. This information is summarised in Table 4.2.2, whereby the expenditures are given including rent.
Table 4.2.2 Summary of expenditure by income group for Male' and the atolls
(Rf. Per person per day) Male' Atolls
Quintiles 1 poorest 20% 31 17 2nd quintile 46 25 3rd quintile 62 32 4th quintile 85 41 5 richest 20% 153 65
mean 75 36
4.3 Expenditure patterns by income groups Figure 4.3.1 shows the expenditures on the various items by income groups in Male'. The share of expenditures on the two largest components, that is, housing and food, declines systematically with increased income, except for housing for the lowest income group. Housing expenditures in Male' take up about forty percent of the total, twice as much as food.
Food
Toba
cco
Clo
thin
g
Hou
sing
Hou
seho
ld
Hea
lth
Tran
spor
t
Com
mun
icat
ions
Rec
reat
ion
Educ
atio
n
Hot
els
Oth
er
Rel
igio
us
0
5
10
15
20
25
30
35
40
Male 93 Male Atolls
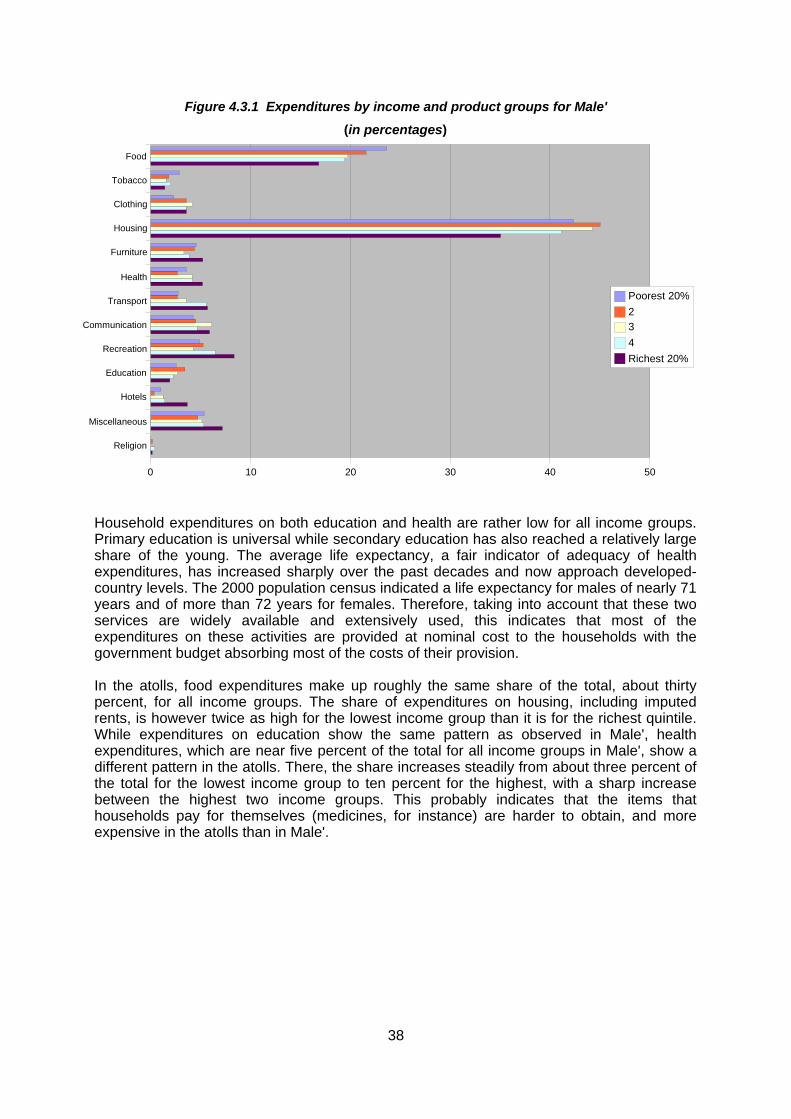
38
Figure 4.3.1 Expenditures by income and product groups for Male'
(in percentages)
Household expenditures on both education and health are rather low for all income groups. Primary education is universal while secondary education has also reached a relatively large share of the young. The average life expectancy, a fair indicator of adequacy of health expenditures, has increased sharply over the past decades and now approach developed-country levels. The 2000 population census indicated a life expectancy for males of nearly 71 years and of more than 72 years for females. Therefore, taking into account that these two services are widely available and extensively used, this indicates that most of the expenditures on these activities are provided at nominal cost to the households with the government budget absorbing most of the costs of their provision. In the atolls, food expenditures make up roughly the same share of the total, about thirty percent, for all income groups. The share of expenditures on housing, including imputed rents, is however twice as high for the lowest income group than it is for the richest quintile. While expenditures on education show the same pattern as observed in Male', health expenditures, which are near five percent of the total for all income groups in Male', show a different pattern in the atolls. There, the share increases steadily from about three percent of the total for the lowest income group to ten percent for the highest, with a sharp increase between the highest two income groups. This probably indicates that the items that households pay for themselves (medicines, for instance) are harder to obtain, and more expensive in the atolls than in Male'.
Religion
Miscellaneous
Hotels
Education
Recreation
Communication
Transport
Health
Furniture
Housing
Clothing
Tobacco
Food
0 10 20 30 40 50
Poorest 20%234Richest 20%

39
Figure 4.3.2 Expenditures by income and product groups for the Atolls
(in percentages)
As mentioned above, the COICOP classification has been used to group household expenditures. It may be observed that this classification does not have a provision for expenditures on religion as part of the household expenditures and all of the religious expenditures are classified as originating from non-profit institutions serving households. While the payments and contributions to religious organisations may be treated as transfer payments by households to those institutions, the same treatment cannot be applied to expenditures incurred for pilgrimages, which are an important item for Muslim households. These can hardly be classified as holiday or leisure travel and religious expenditures have been added as a separate group in the classification. While the expenditures recorded in the HIES were low, this is probably due more to the method of recording and coverage rather than its low significance.
Religion
Miscellaneous
Hotels
Education
Recreation
Communication
Transport
Health
Furniture
Housing
Clothing
Tobacco
Food
0 10 20 30 40 50
Poorest 20%234Richest 20%
40
Chapter 5: Household Savings, Finances and Wealth Summary
Households were asked to report their relative economic status. While the perceived status broadly matched their actual status, with only few of the poorer households reporting to be well of or the reverse, overall the answers were somewhat optimistic. About one in five households felt that their status was above-average while only about one in seven reported a below-average status. These two shares should have been the same. Looking at the perceived change in income between 1998 and 2003 by income group, it was found that on average, poorer households were more pessimistic on the change in income than richer households. The former under-estimated the changes while the latter over-estimated their income changes. In the survey, individual income earners were asked about the balance in incomes and expenditures. About nine percent of the earners reported difficulties in balancing their budget while a quarter of them indicated to have a surplus. As more single-earner households will have difficulties in balancing the budget, the share of households facing the difficulty is about fifteen percent. Among the poorest, it is about one in four households, while even among the richest group this stands at about six percent. In the atolls, the problem is much more severe than in Male' with on average a three times higher share reporting difficulties. Consumer Durables Probably the best indicator of the rapid change in well-being of the Maldivian population is the rapid growth in the possession of major consumer durables. In Male', this shows the fast increase in incomes, while in the atolls it also shows the rapid expansion of various infrastructure services such as the electricity and telephone networks. In Male', nearly all households now possess at least one TV set, which is double the proportion recorded in the Vulnerability and Poverty Assessment (VPA) of 1997/98. About three-quarters of the households have at least one mobile phone, which were not in available at all five years earlier. Half the households now also own one or more motor cycles, nearly three times as much as five years before. Furthermore, three quarters of the households also report a regular fixed-line telephone, a doubling of the share over the five intervening years. More than one third also has a cable TV connection, a service that started only two years earlier. Nine out of every ten households have a washing machine, while nearly half of them have a computer in the house. In the Atolls, the possession of electrical equipment has increased extremely fast due to the expansion of the electricity supply. Three-quarters of the households now have a washing machine and two-thirds own a TV set. Many smaller electrical items are in more than half the households. Mobile phones are available to about one fifth of the households. Personal computers have also started to reach the islands; nearly ten percent of the households reported them. Financial transactions of the households Information was gathered on a limited number of financial transactions that households may be engaged in. These included giving out, obtaining and repaying loans as well as the financing of construction activities. Overall, about one quarter of the households reported to have borrowed and/or given out loans. The estimates show that the balance of borrowing and lending in total is close to zero, with large differences between income groups. Net borrowing is concentrated in the middle income groups with the highest income group providing all resources. The amounts involved are, however very small at less than two percent of household expenditures. Also a quarter of the population had financed construction activities around the house, mostly for additions. Twice as large a proportion of the atoll households had paid for construction as in Male'. On average, construction expenditures in the atolls were equivalent to about six percent of household consumption expenditures. The distribution of construction expenditures over the income groups was radically different between Male' and the atolls. In Male', the three lowest quintiles of the population barely spent any money on construction, while those expenditures for the highest quintile were equivalent to nearly fifteen percent of its household consumption expenditures. In the atolls, expenditures were equivalent to close of six percent of consumption expenditures for all quintiles.
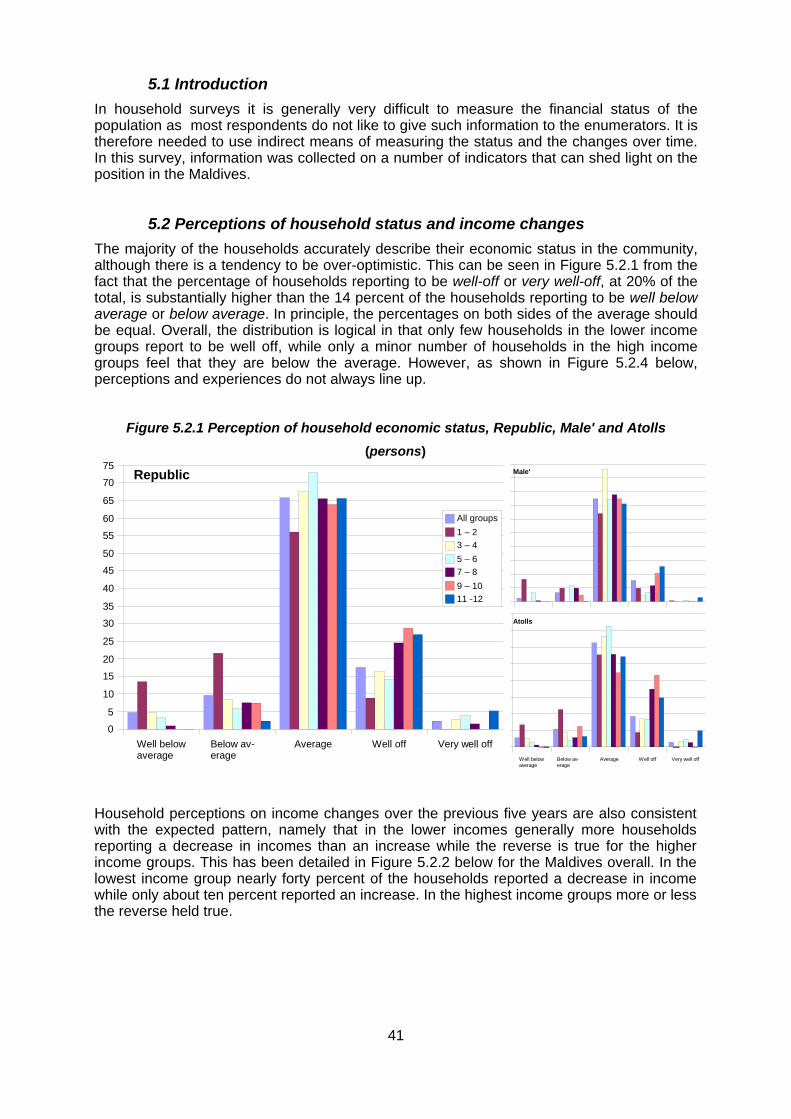
41
5.1 Introduction In household surveys it is generally very difficult to measure the financial status of the population as most respondents do not like to give such information to the enumerators. It is therefore needed to use indirect means of measuring the status and the changes over time. In this survey, information was collected on a number of indicators that can shed light on the position in the Maldives.
5.2 Perceptions of household status and income changes The majority of the households accurately describe their economic status in the community, although there is a tendency to be over-optimistic. This can be seen in Figure 5.2.1 from the fact that the percentage of households reporting to be well-off or very well-off, at 20% of the total, is substantially higher than the 14 percent of the households reporting to be well below average or below average. In principle, the percentages on both sides of the average should be equal. Overall, the distribution is logical in that only few households in the lower income groups report to be well off, while only a minor number of households in the high income groups feel that they are below the average. However, as shown in Figure 5.2.4 below, perceptions and experiences do not always line up.
Figure 5.2.1 Perception of household economic status, Republic, Male' and Atolls (persons)
Household perceptions on income changes over the previous five years are also consistent with the expected pattern, namely that in the lower incomes generally more households reporting a decrease in incomes than an increase while the reverse is true for the higher income groups. This has been detailed in Figure 5.2.2 below for the Maldives overall. In the lowest income group nearly forty percent of the households reported a decrease in income while only about ten percent reported an increase. In the highest income groups more or less the reverse held true.
Well below average
Below av-erage
Average Well off Very well off
0
10
20
30
40
50
60
70
80
90
100Male'
Well below average
Below av-erage
Average Well off Very well off
0
10
20
30
40
50
60
70
80 Atolls
Well below average
Below av-erage
Average Well off Very well off0
5
10
15
20
25
30
35
40
45
50
55
60
65
70
75Republic
All groups1 – 23 – 45 – 67 – 89 – 1011 -12

42
Figure 5.2.2 Perception of decrease and increase in Income by Income Group – Republic (in percentages)
Figure 5.2.3 gives the income changes by quintile for the regions and the Maldives. It clearly shows that in all regions except for the Central region, the poorest income group has experienced a much faster growth in incomes than the richest quintile. Incomes in Male' have increased much faster than those in the Atolls. The income of the poorest quintile increased by 120%, some fifty percent faster than the same income group in the atolls, on average. The increase for the richest quintile in Male' was nearly half that of the poorest in Male', but about three times as high as the increase of about 20% recorded by the richest quintile in the Atolls. It may be noted that these changes are in nominal terms, that is, they are not adjusted for price changes. As detailed in Section 2.2.4, the price changes between 1997/98 and 2002/03 have been small.
Figure 5.2.3 Change in income by region and income quintiles (Expenditure groups, excluding housing rents)
A comparison of these perceptions with the observed changes in incomes between 1997/98 and 2002/03 shows that the poorest income groups are more pessimistic and thereby under-report the improvements in their incomes while the highest income groups systematically
12
11
10
9
8
7
6
5
4
3
2
1
-60% -45% -30% -15% 0% 15% 30% 45% 60%
DecreasedIncreased
Poorest 20% 2nd quintile 3rd quintile 4th quintile Richest 20%-20%
0%
20%
40%
60%
80%
100%
120%
140%RepublicMale'AtollsNorthernCentre NorthernCentralCentre SouthernSouthern
Income group
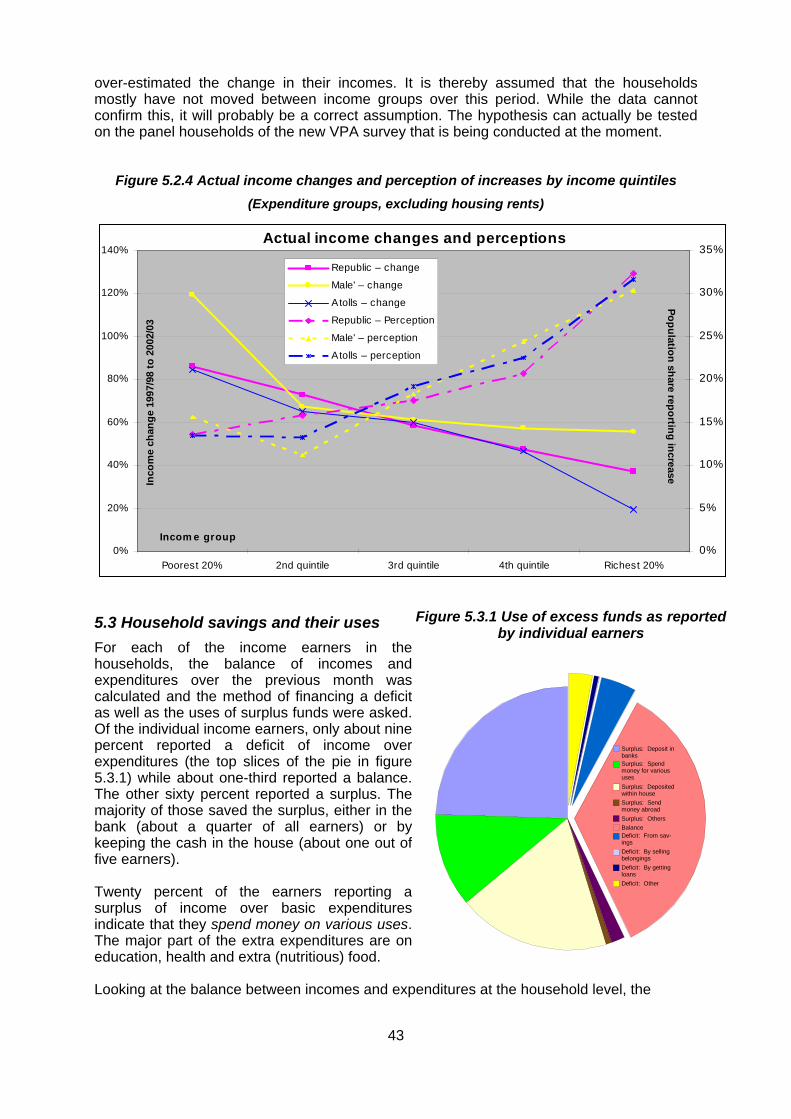
43
over-estimated the change in their incomes. It is thereby assumed that the households mostly have not moved between income groups over this period. While the data cannot confirm this, it will probably be a correct assumption. The hypothesis can actually be tested on the panel households of the new VPA survey that is being conducted at the moment.
Figure 5.2.4 Actual income changes and perception of increases by income quintiles (Expenditure groups, excluding housing rents)
5.3 Household savings and their uses For each of the income earners in the households, the balance of incomes and expenditures over the previous month was calculated and the method of financing a deficit as well as the uses of surplus funds were asked. Of the individual income earners, only about nine percent reported a deficit of income over expenditures (the top slices of the pie in figure 5.3.1) while about one-third reported a balance. The other sixty percent reported a surplus. The majority of those saved the surplus, either in the bank (about a quarter of all earners) or by keeping the cash in the house (about one out of five earners). Twenty percent of the earners reporting a surplus of income over basic expenditures indicate that they spend money on various uses. The major part of the extra expenditures are on education, health and extra (nutritious) food. Looking at the balance between incomes and expenditures at the household level, the
Actual income changes and perceptions
0%
20%
40%
60%
80%
100%
120%
140%
Poorest 20% 2nd quintile 3rd quintile 4th quintile Richest 20%
Incom e group
Inco
me
chan
ge 1
997/
98 to
200
2/03
0%
5%
10%
15%
20%
25%
30%
35%
Population share reporting increase
Republic – change
Male' – change
Atolls – change
Republic – Perception
Male' – perception
Atolls – perception
Figure 5.3.1 Use of excess funds as reported by individual earners
Surplus: Deposit in banksSurplus: Spend money for various usesSurplus: Deposited within houseSurplus: Send money abroadSurplus: OthersBalance Deficit: From sav-ingsDeficit: By selling belongingsDeficit: By getting loansDeficit: Other
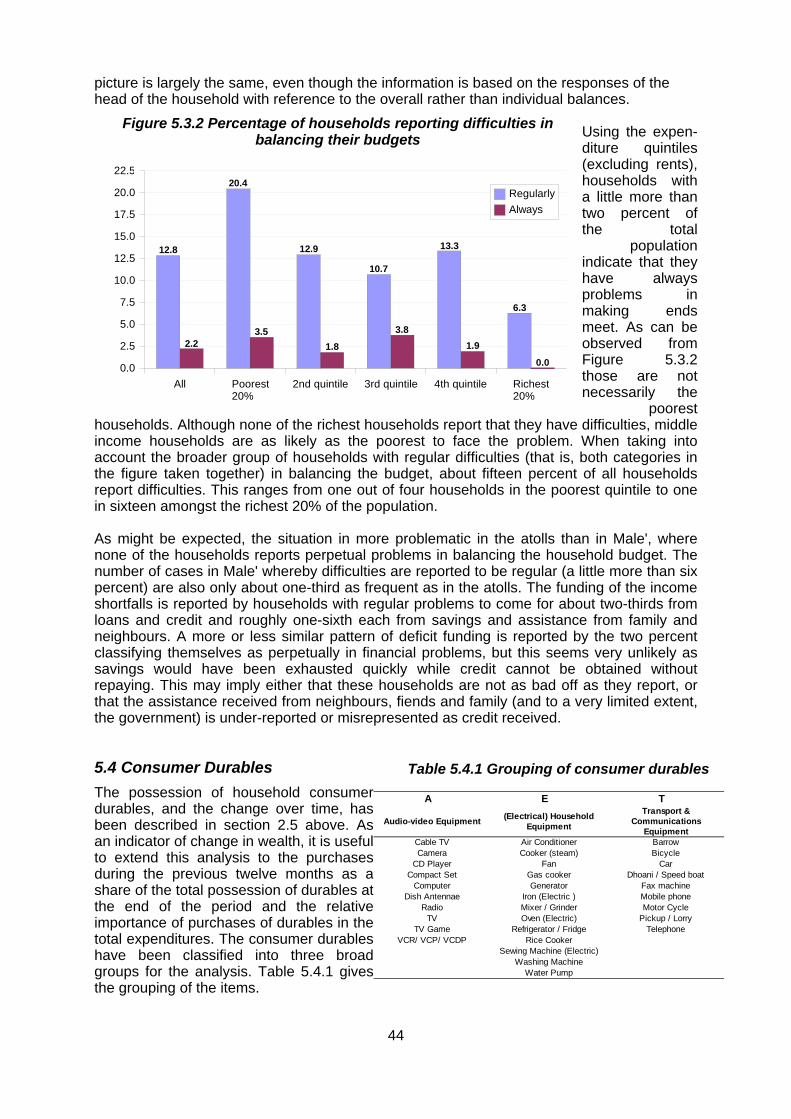
44
picture is largely the same, even though the information is based on the responses of the head of the household with reference to the overall rather than individual balances.
Using the expen-diture quintiles (excluding rents), households with a little more than two percent of the total
population indicate that they have always problems in making ends meet. As can be observed from Figure 5.3.2 those are not necessarily the
poorest households. Although none of the richest households report that they have difficulties, middle income households are as likely as the poorest to face the problem. When taking into account the broader group of households with regular difficulties (that is, both categories in the figure taken together) in balancing the budget, about fifteen percent of all households report difficulties. This ranges from one out of four households in the poorest quintile to one in sixteen amongst the richest 20% of the population. As might be expected, the situation in more problematic in the atolls than in Male', where none of the households reports perpetual problems in balancing the household budget. The number of cases in Male' whereby difficulties are reported to be regular (a little more than six percent) are also only about one-third as frequent as in the atolls. The funding of the income shortfalls is reported by households with regular problems to come for about two-thirds from loans and credit and roughly one-sixth each from savings and assistance from family and neighbours. A more or less similar pattern of deficit funding is reported by the two percent classifying themselves as perpetually in financial problems, but this seems very unlikely as savings would have been exhausted quickly while credit cannot be obtained without repaying. This may imply either that these households are not as bad off as they report, or that the assistance received from neighbours, fiends and family (and to a very limited extent, the government) is under-reported or misrepresented as credit received.
5.4 Consumer Durables The possession of household consumer durables, and the change over time, has been described in section 2.5 above. As an indicator of change in wealth, it is useful to extend this analysis to the purchases during the previous twelve months as a share of the total possession of durables at the end of the period and the relative importance of purchases of durables in the total expenditures. The consumer durables have been classified into three broad groups for the analysis. Table 5.4.1 gives the grouping of the items.
Table 5.4.1 Grouping of consumer durables
A E T
Audio-video Equipment
Cable TV Air Conditioner BarrowCamera Cooker (steam) Bicycle
CD Player Fan CarCompact Set Gas cooker Dhoani / Speed boat
Computer Generator Fax machineDish Antennae Iron (Electric ) Mobile phone
Radio Mixer / Grinder Motor CycleTV Oven (Electric) Pickup / Lorry
TV Game Refrigerator / Fridge TelephoneVCR/ VCP/ VCDP Rice Cooker
Sewing Machine (Electric)Washing Machine
Water Pump
(Electrical) Household Equipment
Transport & Communications
Equipment
Figure 5.3.2 Percentage of households reporting difficulties in balancing their budgets
All Poorest 20%
2nd quintile 3rd quintile 4th quintile Richest 20%
0.0
2.5
5.0
7.5
10.0
12.5
15.0
17.5
20.0
22.5
12.8
20.4
12.9
10.7
13.3
6.3
2.23.5
1.8
3.81.9
0.0
RegularlyAlways

45
On average,
households purchased nearly a quarter extra durables over the quantities that they possessed at the beginning of the year, or nearly one-fifth of the durables at available at the end of the year were purchased during the preceding twelve months. The position is shown in Figure 5.4.2 for
the different groups of consumer durables and income quintiles. The poorest income group only added about fourteen percent during the year; while the richest added double that, or about 27 percent. As a percentage of total household expenditures, spending on consumer durables is still low. On average, slightly more than five percent of household spending went to the purchase of durables. It was less than three percent for the poorest and about seven percent for the richest. The lower income groups spent most on audio and video equipment, such as television, while the highest income groups purchased more on transport and communications equipment, such as motor cycles and mobile phones. Purchases of other
household appliances were lowest for all income groups. The expenditures on consumer durables are about one third higher in Male' than in the atolls, but the distribution over the income groups is rather similar, except for the 2nd quintile. This is shown in Figure 5.4.4.
Figure 5.4.4 Purchases of consumer durables as percentage of household expenditures
Richest 20%
4th quintile
3rd quintile
2nd quintile
Poorest 20%
Average
0% 2% 4% 6% 8%
RepublicMale'Atolls
Figure 5.4.3 Purchases of consumer durables as percentage of total expenditures
(Expenditure groups, excluding housing rents)
Transport & telephone
(Electrical) appliances
Audio & video
All durables
0 2 4 6 8
All groupsPoorest 20%2nd quintile3rd quintile4th quintileRichest 20%
Purchases of durables as percentage of total expenditures
Figure 5.4.2 Purchases of consumer durables as percentage of possessions
Transport & telephone
Electrical) appliances
Audio & video
All durables
0 5 10 15 20 25 30 35
All groupsPoorest 20%2nd quintile3rd quintile4th quintileRichest 20%
Newly purchased as percent of possession at beginning of the year
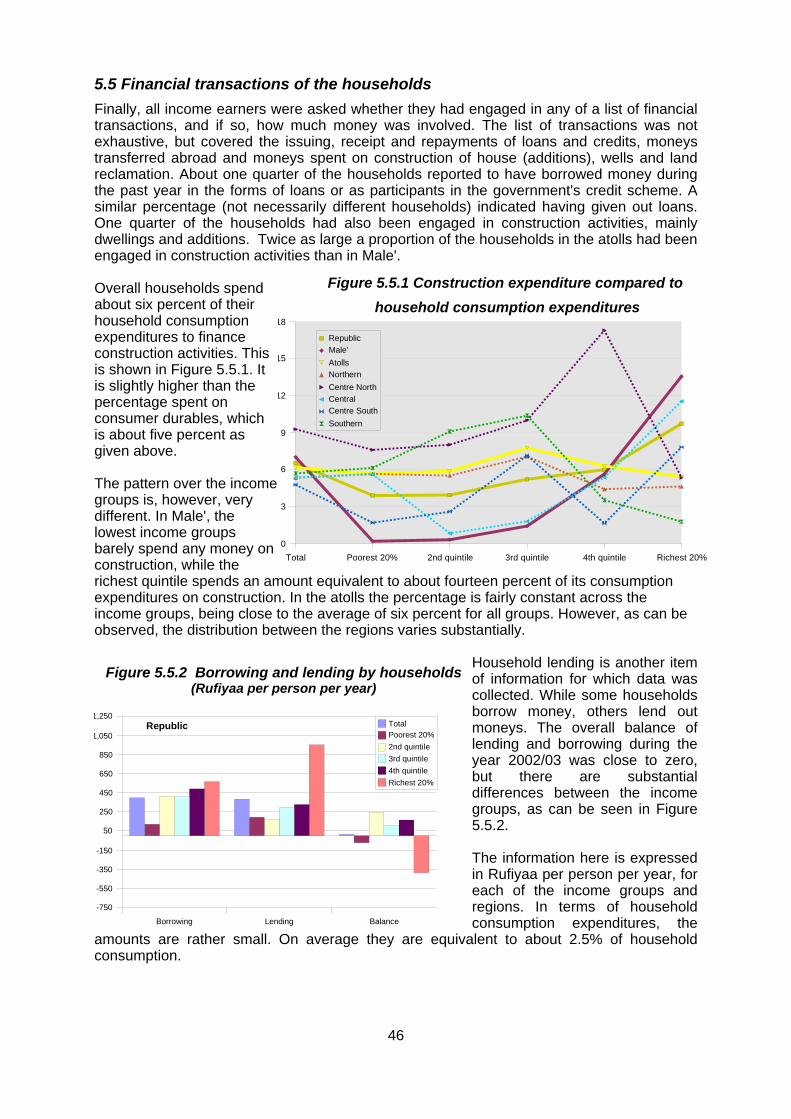
46
5.5 Financial transactions of the households Finally, all income earners were asked whether they had engaged in any of a list of financial transactions, and if so, how much money was involved. The list of transactions was not exhaustive, but covered the issuing, receipt and repayments of loans and credits, moneys transferred abroad and moneys spent on construction of house (additions), wells and land reclamation. About one quarter of the households reported to have borrowed money during the past year in the forms of loans or as participants in the government's credit scheme. A similar percentage (not necessarily different households) indicated having given out loans. One quarter of the households had also been engaged in construction activities, mainly dwellings and additions. Twice as large a proportion of the households in the atolls had been engaged in construction activities than in Male'. Overall households spend about six percent of their household consumption expenditures to finance construction activities. This is shown in Figure 5.5.1. It is slightly higher than the percentage spent on consumer durables, which is about five percent as given above. The pattern over the income groups is, however, very different. In Male', the lowest income groups barely spend any money on construction, while the richest quintile spends an amount equivalent to about fourteen percent of its consumption expenditures on construction. In the atolls the percentage is fairly constant across the income groups, being close to the average of six percent for all groups. However, as can be observed, the distribution between the regions varies substantially.
Household lending is another item of information for which data was collected. While some households borrow money, others lend out moneys. The overall balance of lending and borrowing during the year 2002/03 was close to zero, but there are substantial differences between the income groups, as can be seen in Figure 5.5.2. The information here is expressed in Rufiyaa per person per year, for each of the income groups and regions. In terms of household consumption expenditures, the
amounts are rather small. On average they are equivalent to about 2.5% of household consumption.
Figure 5.5.1 Construction expenditure compared to household consumption expenditures
Total Poorest 20% 2nd quintile 3rd quintile 4th quintile Richest 20%0
3
6
9
12
15
18
RepublicMale'AtollsNorthernCentre NorthCentralCentre SouthSouthern
Figure 5.5.2 Borrowing and lending by households (Rufiyaa per person per year)
Borrowing Lending Balance
-750
-550
-350
-150
50
250
450
650
850
1,050
1,250TotalPoorest 20%2nd quintile3rd quintile4th quintileRichest 20%
Republic

47
An alternative presentation of financial transactions is given in Figure 5.5.3, for the Republic as well as Male' and the atolls separately. Here, the borrowings are compared with the repayments. The data on repayments included interest. For ease of comparison, this interest has been taken out on the basis of the interest receipts on lending reported by the households. It is thereby assumed that the lenders and borrowers are residents of the same region, which may not necessarily be the case.
The borrowing data are the same as in the previous figure, and the overall balance between new borrowing and repaying is also about zero. The distributions and magnitudes of the balances are, however substantially different. In Male', the highest income group has substantial net repayments, while in the atolls it is the second quintile that shows large net repayments. While no direct information is available on savings from the households, the information on consumer durables, construction and financial transactions clearly indicates that the higher income groups have discretionary incomes which they use to purchase consumer durables and to invest in housing construction as well as for lending. The net indebtedness of the households cannot be derived from the available information, but the data suggest that it is not very high, considering the minor amounts of interest received on the outstanding loans. It is clear that overall net indebtedness has not changed during the year as repayments kept pace with new loans contracted.
Figure 5.5.3 Household borrowing and loan repayments during the year (Rufiyaa per person per year)
Borrowing Repaying Balance
-750
-500
-250
0
250
500
750
1,000
1,250 Malé
Borrowing Repaying Balance
-750
-500
-250
0
250
500
750
1,000
1,250Atolls
Borrowing Repaying Balance-750
-500
-250
0
250
500
750
1,000
1,250TotalPoorest 20%2nd quintile3rd quintile4th quintileRichest 20%
Republic
48
Appendices Appendix 1: Sample design Appendix 2: The Measurement of Vulnerability and Poverty ATTACHMENTS A. List of atolls and islands classified by region B. COICOP classification C. Questionnaires D. CD-ROM instructions