malaysia - food and agriculture · pdf filerubber plantation areas planted with rubber tree...
TRANSCRIPT

Malaysia
GLOBAL FOREST RESOURCES ASSESSMENT 2015
COUNTRY REPORT
Rome, 2014
FAO, at the request of its member countries, regularly monitors the world´s forests and theirmanagement and uses through the Global Forest Resources Assessment (FRA). This country reportis prepared as a contribution to the FAO publication, the Global Forest Resources Assessment 2015(FRA 2015).The content and the structure are in accordance with the recommendations and guidelines given byFAO in the document Guide for country reporting for FRA 2015 (http://www.fao.org/3/a-au190e.pdf).These reports were submitted to FAO as official government documents.
The content and the views expressed in this report are the responsibility of the entity submitting thereport to FAO. FAO may not be held responsible for the use which may be made of the informationcontained in this report. After the deadline for reporting to FRA 2015 an updated version of the country report of Malaysia was submitted. To have a copy of the country report please send a message to [email protected].

FRA 2015 – Country Report, Malaysia
3
TABLE OF CONTENTSReport preparation and contact persons...............................................................................................................................41. What is the area of forest and other wooded land and how has it changed over time? ................................................. 62. What is the area of natural and planted forest and how has it changed over time? ..................................................... 163. What are the stocks and growth rates of the forests and how have they changed? .....................................................224. What is the status of forest production and how has it changed over time? .................................................................375. How much forest area is managed for protection of soil and water and ecosystem services? ..................................... 446. How much forest area is protected and designated for the conservation of biodiversity and how has it changed overtime? ................................................................................................................................................................................... 497. What is the area of forest affected by woody invasive species? .................................................................................. 548. How much forest area is damaged each year? ............................................................................................................ 579. What is the forest area with reduced canopy cover? ....................................................................................................6110. What forest policy and regulatory framework exists to support implementation of sustainable forest managementSFM? .................................................................................................................................................................................. 6211. Is there a national platform that promotes stakeholder participation in forest policy development? ............................ 6512. What is the forest area intended to be in permanent forest land use and how has it changed over time? .................. 6813. How does your country measure and report progress towards SFM at the national level? ........................................ 7314. What is the area of forest under a forest management plan and how is this monitored? ........................................... 7615. How are stakeholders involved in the management decision making for publicly owned forests? .............................. 7916. What is the area of forest under an independently verified forest certification scheme? .............................................8017. How much money do governments collect from and spend on forests? .....................................................................8218. Who owns and manages the forests and how has this changed? ..............................................................................8519. How many people are directly employed in forestry? ................................................................................................. 9020. What is the contribution of forestry to Gross Domestic Product (GDP)? .................................................................... 9321. What is forest area likely to be in the future ...............................................................................................................94

FRA 2015 – Country Report, Malaysia
4
Report preparation and contact personsContact personsThe present report was prepared by the following person(s)
Name (FAMILYNAME, first name)
Institution/address Email Tables
Wan Mohd, Wan Hasmah Ministry of Natural ResourcesEnvironment, Wisma SumberAsli, Persiaran Perdana, Presint4, Putrajaya
Subramaniam, Chitra Ministry of Natural ResourcesEnvironment, Wisma SumberAsli, Persiaran Perdana, Presint4, Putrajaya
Abd. Latip, Norsham Ministry of Natural ResourcesEnvironment, Wisma SumberAsli, Persiaran Perdana, Presint4, Putrajaya
Koh, Hock Lye Forestry Department ofPeninsular Malaysia, JalanSultan Salahuddin, 50660Kuala Lumpur
Nawi, Samsu Anuar Forestry Department ofPeninsular Malaysia, JalanSultan Salahuddin, 50660Kuala Lumpur
Abd. Halim, Nor Halizah Forestry Department ofPeninsular Malaysia, JalanSultan Salahuddin, 50660Kuala Lumpur
Simin, Alisah Forestry Department ofPeninsular Malaysia, JalanSultan Salahuddin, 50660Kuala Lumpur
Lohuji, Paul Leo Sabah Forestry Department,Peti Surat 311, Km10, JalanLabuk, 90000 Sandakan.
Mohd. Jaini, Mashor Sabah Forestry Department,Peti Surat 311, Km10, JalanLabuk, 90000 Sandakan.
Mohamad Bohari, AhmadAshrin
Sarawak Forest Department,Bangunan Wisma SumberAlam, Jalan Stadium, PetraJaya, 93660 Kuching
Abang Morni, Abang Ahmad Sarawak Forest Department,Bangunan Wisma SumberAlam, Jalan Stadium, PetraJaya, 93660 Kuching
Parlan, Ismail Forest Research InstituteMalaysia, 52110 Kepong,Selangor Darul Ehsan
[email protected] 17.3, 19.2.3

FRA 2015 – Country Report, Malaysia
5
Tan, Liat Choon Department of Survey andMapping Malaysia, WismaJUPEM, Jalan Semarak, 50578Kuala Lumpur
[email protected] 1.2.3
Mohamad Safaiee, Martini Ministry of PlantationIndustries and Commodities,No. 15, Level 6-13, PersiaranPerdana, Precint 2, 62654Putrajaya
[email protected] 2.2.3
Introductory TextPlace an introductory text on the content of this report
A special committee was set up by the Ministry of Natural Resources and Environment Malaysia to coordinatethe preparation of FRA 2015 Malaysia Report. Members of task force comprise of representatives from releventgovernment agencies. Data and information for the preparation of this report were derived from annual reports,statistical reports, and relevent documents from government agencies. Mini workshops were conducted toharmonise and verify data gathered. Draft FRA 2015 country report were presented to the special committeefor further comment and endorsement.
Desk Study?
Check "yes" if this survey is a Desk Study, "no" otherwise
Desk Study? no

FRA 2015 – Country Report, Malaysia
6
1. What is the area of forest and other wooded land and how has it changed over time?Documents for this question:
• Guide for country reporting FRA 2015• FRA 2015 Terms and Definitions
1.1 Categories and definitions
Category Definition
Forest Land spanning more than 0.5 hectares with trees higher than 5 meters and a canopy cover of more than10 percent or trees able to reach these thresholds in situ. It does not include land that is predominantlyunder agricultural or urban land use.
Other wooded land Land not classified as "Forest" spanning more than 0.5 hectares with trees higher than 5 meters anda canopy cover of 5-10 percent or trees able to reach these thresholds ; or with a combined coverof shrubs bushes and trees above 10 percent. It does not include land that is predominantly underagricultural or urban land use.
Other land All land that is not classified as "Forest" or "Other wooded land".
...of which with tree cover(sub-category)
Land considered as "Other land", that is predominantly agricultural or urban lands use and has patchesof tree cover that span more than 0.5 hectares with a canopy cover of more than 10 percent of trees ableto reach a height of 5 meters at maturity. It includes bothe forest and non-forest tree species.
Inland water bodies Inland water bodies generally include major rivers, lakes and water reservoirs.
Forest expansion Expansion of forest on land that, until then, was not defined as forest.
...of which afforestation(sub-category)
Establishment of forest through planting and/or deliberate seeding on land that, until then, was notdefined as forest.
...of which naturalexpansion of forest (sub-category)
Expansion of forests through natural succession on land that, until then, was under another land use(e.g. forest succession on land previously used for agriculture).
Deforestation The conversion of forest to other land use or the longterm reduction of the tree canopy cover below theminimum 10 percent threshold.
...of which humaninduced (sub-category)
Human induced conversion of forest to other land use or the permanent reduction of the tree canopycover below the minimum 10 percent threshold.
Reforestation Natural regeneration or re-establishment of forest through planting and/or deliberate seeding on landalready in forest land use.
...of which artificialreforestation (sub-category)
Re-establishment of forest through planting and/or deliberate seeding on land already in forest land use.
1.2 National data
1.2.1 Data sources
References to sourcesof information
Variables Years Additional comments
1 Forestry Department OfPeninsular Malaysia. AnnualReport
Forest cover, timber andwood-based industries output.
2006 - 2012 Statistical informationcovering forest cover, timberand wood-based industriesoutput in Peninsular Malaysia

FRA 2015 – Country Report, Malaysia
7
2 Forestry Department OfPeninsular Malaysia. AnnualReport
Reforestation 1988-2012 Statistical informationon reforestation area inPeninsular Malaysia
3 Forestry Department OfPeninsular Malaysia.Statistics Report
Forest cover, timber andwood-based industries output
2006-2012 Statistical informationcovering forest cover, timberand wood-based industriesoutput in Peninsular Malaysia
4 Forestry Department OfPeninsular Malaysia.Statistics Report
Reforestation 1988-2012 Statistical informationon reforestation area inPeninsular Malaysia
5 Sarawak Forest Department Forest cover, timber andwood-based industries output
2006 -2012 Statistical informationcovering forest cover, timberand wood-based industriesoutput and wildlife andnational park statistics inSarawak.
6 Sarawak Forest Department Reforestation 1988-2012 Statistical information onreforestation area in Sarawak.
7 Sabah Forestry Department Forest cover, timber andwood-based industries output.
2006 -2012 Statistical informationcovering forest cover, timberand wood-based industriesoutput and wildlife andnational park statistics inSabah.
8 Sabah Forestry Department Reforestation 1988-2012 Statistical information onreforestation area in Sabah.
9 Department Of Wildlife andNational Parks. Compendium
Wildlife and national parks 2006-2012 Statistical informationcovering wildlife and nationalparks in Peninsular Malaysia.
10 Ministry Of PlantationIndustries and CommoditiesMalaysia. Statistics onCommodities
Wooded and non- woodedTree Crop.
2006 -2012 Statistical informationcovering primary andcommodities based sector inMalaysia.
11 FRA 2010 Pre-filled data N/A N/A
12 FRA 2015 Guidelines FAOSTAT for country area 2013 Country area adjustedaccording to Appendix 2 –List of UN Official CountryAreas
13 Department Of Survey &Mapping Malaysia
Total area for country 2005 Statistical informationcovering land area forPeninsular Malaysia, Sabahand Sarawak
1.2.2 Classification and definitions
National class Definition
Permanent Reserved Forest Forested areas that are gazetted as Permanent Reserved Forestare being managed sustainably for environment and socio-economic purposes.

FRA 2015 – Country Report, Malaysia
8
State Land Forest Natural and planted forests outside Permanent Reserved Forest.
National Parks and Wildlife & Bird Sanctuary Protected natural forest areas designated for the protection ofenvironment and conservation of biological diversity
Rubber Plantation Areas planted with rubber tree crops
Other agriculture crops Areas planted with agricultural crops such as oil palms, coconut,paddy, tobacco, sugar cane, cocoa, tea and coffee
Other lands Urban, mining and others built-up areas
Afforestation N/A
Reforestation Re-establishment of forest through planting and/or deliberateseeding on land classified as forest.
Natural expansion of forest N/A
1.2.3 Original data
Forest area
The information for Question 1 is derived from Annual Reports of Forestry Department of Peninsular Malaysia,Forest Statistics Peninsular Malaysia, Sarawak Forestry Department, Sabah Forestry Department and StatisticsOn Commodities, Ministry of Plantation Industries and Commodities Malaysia. The following table providesthe original information.
National2015Categories
Area ( 1000 Hectares)
1990 2000 2005 2010 2011 2012
(a)PermanentReservedForest(PRF)
- PeninsularMalaysia
4,750 4,800 4,800 4,920 4,912 4,894
- Sabah 3,350 3,600 3,600 3,607 3,607 3,609
- Sarawak 4,500 6,000 6,000 6,000 6,000 6,000
Total PRF 12,600 14,400 14,400 14,526 14,519 14,503

FRA 2015 – Country Report, Malaysia
9
(b) Stateland Forest
6,820 4,640 4,141 4,718 4,630 4,656
(c)NationalParks andWildlife& BirdSanctuary
1,120 1,120 1,120 1,859 1,859 1,859
TotalForestedArea (a+b+c)
20,540 20,160 19,661 21,104 21,009 21,019
(d) Rubberplantation
1,836 1,431 1,229 1,020 1,023 1,042
TotalRubberPlantation(d)
1,836 1,431 1,229 1,020 1,023 1,042
(e) Otherland:
- Oil palm 2,029 3,377 3,802 4,854 5,000 5,077
-AgricultureCrops
1,461 1,007 959 848 861 861
- Urbanand Otheruses
6,844 6,735 7,259 5,022 4955 4,849
TotalOtherLand (e)
10,334 11,119 11,820 10,724 10,816 10,787
Inlandwaterbodies
120 120 120 424 424 424
Total areafor country
32,830 32,830 32,830 33,272 33,272 33,272
Forest expansion, reforestation
The entire forest plantations have been assumed as reforestation areas.

FRA 2015 – Country Report, Malaysia
10
1.3 Analysis and processing of national data
1.3.1 Adjustment
Forest area
Figures on Urban and Other Uses were adjusted to conform to FAOSTAT country area figures.
Area ( 1000 Hectares)National2015Categories 1990 2000 2005 2010 2011 2012
(a)PermanentReservedForest(PRF)
- PeninsularMalaysia
4,750 4,800 4,800 4,920 4,912 4,894
- Sabah 3,350 3,600 3,600 3,607 3,607 3,609
- Sarawak 4,500 6,000 6,000 6,000 6,000 6,000
Total PRF 12,600 14,400 14,400 14,526 14,519 14,503
(b) Stateland Forest
6,820 4,640 4,141 4,718 4,630 4,656
(c)NationalParks andWildlife& BirdSanctuary
1,120 1,120 1,120 1,859 1,859 1,859
TotalForestedArea (a+b+c)
20,540 20,160 19,661 21,104 21,009 21,019
(d) Rubberplantation
1,836 1,431 1,229 1,020 1,023 1,042

FRA 2015 – Country Report, Malaysia
11
TotalRubberPlantation(d)
1,836 1,431 1,229 1,020 1,023 1,042
(e) Otherland:
- Oil palm 2,029 3,377 3,802 4,854 5,000 5,077
-AgricultureCrops
1,461 1,007 959 848 861 861
- Urban andOther uses
6,989 6,880 7,204 5,029 4,963 4,857
TotalOtherLand (e)
10,479 11,264 11,266 10,731 10,824 10,795
Inlandwaterbodies
119 119 119 225 225 225
Total areafor country
32,974 32,974 32,974 33,080 33,080 33,080
1.3.2 Estimation and forecasting
Forest area
• The figures for Permanent Reserved Forest and National Parks for 1990, 2000, 2005, 2010, 2011 and 2012 are available, whilefigure for 2012 has been assumed for 2015.
• The figure for 2015 for Stateland Forest has been forecasted as 4,735 (‘000ha) using linear trend (Stateland Forest, y = 26x – 47,656)• The figure for 2015 for Rubber Plantation has been forecasted as 1,098 (‘000ha) using linear trend (Rubber Plantation, y = 19x
– 37,186 ).
1.3.3 Reclassification
Forest area

FRA 2015 – Country Report, Malaysia
12
Percentage Allocation to a FRA ClassNational Classes
Forests OWL Other Land
Permanent ReservedForest
100
Stateland Forest 100
National Parks andWildlife & BirdSanctuary
100
Rubber Plantation 100
Oil Palm Plantation 100
Other Land: 100
Inland water bodies
This leads to the following,
Area (1000 hectares)FRACategories
1990 2000 2005 2010 2011 2012 2015
Forests
PermanentReservedForest(PRF):
12,600 14,400 14,400 14,526 14,519 14,503 14,503
StatelandForest
6,820 4,640 4,141 4,718 4,630 4,656 4,735
NationalParks andWildlife& BirdSanctuary
1,120 1,120 1,120 1,859 1,859 1,859 1,859
RubberPlantation
1,836 1,431 1,229 1,020 1,023 1,042 1,098
(SubTotal)
22,376 21,591 20,890 22,124 22,031 22,060 22,195

FRA 2015 – Country Report, Malaysia
13
OtherLand:
10,479 11,264 11,965 10,731 10,824 10,795 10,660
Inlandwaterbodies
119 119 119 225 225 225 225
Totalarea forcountry
32,974 32,974 32,974 33,080 33,080 33,080 33,080
1.4 DataTable 1a
Area (000 hectares)Categories
1990 2000 2005 2010 2015
Forest 22376 21591 20890 22124 22195
Other wooded land 0 0 0 0 0
Other land 10479 11264 11965 10731 10660
... of which with tree cover 0 0 0 0 0
Inland water bodies 119 119 119 225 225
TOTAL 32974.00 32974.00 32974.00 33080.00 33080.00
Table 1bAnnual forest establishment /loss (000 hectares per year)
...of which of introducedspecies (000 hectares per year)
Categories
1990 2000 2005 2010 1990 2000 2005 2010
Forest expansion N/A N/A N/A N/A N/A N/A N/A N/A
... of which afforestation N/A N/A N/A N/A N/A N/A N/A N/A
... of which natural
expansion of forest
N/A N/A N/A N/A N/A N/A N/A N/A
Deforestation N/A N/A N/A N/A N/A N/A N/A N/A
... of which human induced N/A N/A N/A 4.175 N/A N/A N/A N/A
Reforestation 0.989 6.839 33.009 134.242 N/A N/A N/A N/A

FRA 2015 – Country Report, Malaysia
14
... of which artificial 0.989 6.839 33.009 134.242 0.94 6.482 31.154 128.487
Tiers
Category Tier for status Tier for reported trend
Forest Tier 3 Tier 3
Other wooded land Tier 1 Tier 1
Forest expansion Tier 1 Tier 1
Deforestation Tier 1 Tier 1
Reforestation Tier 3 Tier 3
Tier criteria
Category Tier for status Tier for reported trend
• Forest• Other wooded land• Afforestation• Reforestation• Natural expansion of forest• Deforestation
Tier 3 : Data sources: Either recent(less than 10 years ago) National ForestInventory or remote sensing, with groundtruthing, or programme for repeatedcompatible NFIs Tier 2 : Data sources:Full cover mapping / remote sensing orold NFI (more than 10 years ago) Tier 1 :Other
Tier 3 : Estimate based on repeatedcompatible tiers 3 (tier for status) Tier 2 :Estimate based on repeated compatible tier2 or combination tier 3 and 2 or 1 (tier forstatus) Tier 1 : Other
1.5 Comments
CategoryComments related todata definitions etc
Comments on the reported trends
Forest Area for rubber plantation has been addedto forest area only for FRA reporting. Thecountry wishes to maintain it separatefrom forest area.
In general the rubber plantation area hasincreased since 2010. While the area forother uses has decreased. This is partlydue to conversion of some state land forestand idle land to rubber plantations.
Other wooded land There may exist an unknown extent ofother wooded land but as it could not beestimated from available data it is includedunder Other land.
N/A
Other land N/A Area for Other land has increased since2010 mainly due to increase in area of oilpalm plantation.
Other land with tree cover N/A N/A
Inland water bodies Inland water bodies generally includemajor rivers, lakes and water reservoirs.
N/A
Forest expansion N/A N/A
Deforestation N/A N/A

FRA 2015 – Country Report, Malaysia
15
Reforestation Does not include mangrove forest areasthat are clear felled and planted withinproduction areas as they are part ofmanagement regime of mangrove forest inMalaysia.
Increasing trend especially in forestplantation establishment.
Other general comments to the table
Response to reviewer's query to Table 1a and 1b: The increase of 71,000 ha (not 41,000 ha) from 2010 to 2015 is mainly due tothe increase in area of rubber plantation. The figure for 2015 was derived through extrapolation (linear trend) using data for 2011and 2012. The calculation of annual forest establishment / loss in Table 1b for year 2010 was based on the average figure for year2008 – 2012. Response to reviewer's query to Table 1a: The increase in the total land area for Malaysia since 2005 was due to theupdating of country land area by the relevent agency. Areas for PRF and National Parks and Wildlife & Bird Sanctuary includeproposed areas for the same purposes. Response to reviewer's query to Table 1a: There is no value for other wooded land categories.

FRA 2015 – Country Report, Malaysia
16
2. What is the area of natural and planted forest and how has it changed over time?Documents for this question:
• Guide for country reporting FRA 2015• FRA 2015 Terms and Definitions
2.1 Categories and definitions
Term Definition
Naturally regeneratedforest
Forest predominantly composed of trees established through natural regeneration.
Naturalized introducedspecies
Other naturally regenerated forest where the tree species are predominantly non-native and do not needhuman help to reproduce/maintain populations over time.
Introduced species A species, subspecies or lower taxon occurring outside its natural range (past or present) and dispersalpotential (i.e. outside the range it occupies naturally or could occupy without direct or indirectintroduction or care by humans).
Category Definition
Primary forest Naturally regenerated forest of native species where there are no clearly visible indications of humanactivities and the ecological processes are not significantly disturbed.
Other naturallyregenerated forest
Naturally regenerated forest where there are clearly visible indications of human activities.
...of which of introducedspecies (sub-category)
Other naturally regenerated forest where the trees are predominantly of introduced species.
...of which naturalized(sub-sub category)
Other naturally regenerated forest where the trees are predominantly of naturalized introduced species.
Planted forest Forest predominantly composed of trees established through planting and/or deliberate seeding.
...of which of introducedspecies (sub-category)
Planted forest where the planted/seeded trees are predominantly of introduced species.
Mangroves Area of forest and other wooded land with mangrove vegetation.
...of which planted (sub-category)
Mangroves predominantly composed of trees established through planting.
2.2 National data
2.2.1 Data sources
References to sourcesof information
Variables Years Additional comments
1 Forestry Department OfPeninsular Malaysia. AnnualReport
Forest categories. 2006-2012 Statistical informationcovering naturallyregenerated forest, forestplantation and mangroves inPeninsular Malaysia.

FRA 2015 – Country Report, Malaysia
17
2 Forestry Department OfPeninsular Malaysia.Statistics Report
Forest categories. 2006-2012 Statistical informationcovering naturallyregenerated forest, forestplantation and mangroves inPeninsular Malaysia.
3 Sabah Forestry Department Forest categories. 2006-2012 Statistical informationcovering naturallyregenerated forest, forestplantation and mangroves inSabah.
4 Sarawak Forest Department Forest categories. 2006-2012 Statistical informationcovering naturallyregenerated forest, forestplantation and mangroves inSarawak.
5 Ministry of PlantationIndustries and CommoditiesMalaysia. Statistics onCommodities
Rubber plantation. 2006 - 2012 Statistical informationcovering rubber plantation inMalaysia
6 FRA 2010 Pre-filled data N/A N/A
2.2.2 Classification and definitions
National class Definition
Primary Protection Forest in PRF, National Parks and Wildlife BirdsSanctuary
Semi-natural Consist of three broad forest types, namely Dipterocarp Forest,Peat Swamp Forest and Mangrove Forest.
Productive plantation Forest plantation planted with fast-growing hardwood species,such as Acacia mangium, Gmelina arborea, and Paraserianthesfalcataria, P. merkusii and Araucaria species. Includes RubberPlantations.
N/A N/A
2.2.3 Original data
Area (1000 hectares)
Forest
NationalCategories
1990 2000 2005 2010 2011 2012

FRA 2015 – Country Report, Malaysia
18
- Forestplantation
120 228 258 603 701 743
- Rubberplantation
1,836 1,431 1,229 1,020 1,023 1,042
Productiveplantation
n.a n.a n.a n.a n.a n.a
Note: Actual data for Total Area of Forest Plantation in Malaysia
Area ('1000 ha)
2006 2007 2010 2011 2012
RubberPlantation
Malaysia 1,232 1,207 1,020 1,023 1,042
ForestPlantation
PeninsularMalaysia
83 105 109 186 198
Sabah 133 181 217 226 239
Sarawak 182 182 277 290 306
Sub Total FP 603 701 743
Total 1,631 1,675 1,623 1,724 1,784
2.3 Analysis and processing of national data
2.3.1 Adjustment
Figures for 2010 have been updated to the actual figures.

FRA 2015 – Country Report, Malaysia
19
2.3.2 Estimation and forecasting
Forest in protected areas is considered as primary forest.
Other naturally regenerated forest is calculated by subtracting the primary forest and planted forest from thetotal forest area.
2.3.3 Reclassification
n.a
2.4 DataTable 2a
Forest area (000 hectares)Categories
1990 2000 2005 2010 2015
Primary forest 3820 4030 4930 4867 5041
Other naturally regeneratedforest
16600 15902 14387 15634 15188
... of which of introducedspecies
0 0 0 0 0
... of which naturalized 0 0 0 0 0
Planted forest 1956 1659 1573 1623 1966
... of which of introducedspecies
0 0 0 1533 1836
TOTAL 22376.00 21591.00 20890.00 22124.00 22195.00
Table 2b
Primary forest converted to (000 ha)
1990-2000 2000-2010 2010-2015
Othernatural
regenerationPlanted Other land
Othernatural
regenerationPlanted Other land
Othernatural
regenerationPlanted Other land
0 0 0 0 0 0 0 0 0
Table 2c
Categories Area (000 hectares)

FRA 2015 – Country Report, Malaysia
20
1990 2000 2005 2010 2015
Mangroves (forest and OWL) 548 529 545 529 521
... of which planted N/A N/A N/A 0.429 0.674
Tiers
Category Tier for status Tier for reported trend
Primary forest Tier 3 Tier 3
Other naturally regenerated forest Tier 3 Tier 3
Planted forest Tier 3 Tier 3
Mangroves Tier 3 Tier 3
Tier Criteria
Category Tier for status Tier for reported trend
Primary forest/Other naturally regeneratedforest/Planted forest
Tier 3 : Data sources: Recent (less than10 years) National Forest Inventory orremote sensing with ground truthing ordata provided by official agencies orprogramme for repeated compatible NFIsTier 2 : Data sources: Full cover mapping/remote sensing or old NFI (more than 10years) Tier 1 : Other
Tier 3 : Estimate based on repeatedcompatible tiers 3 (tier for status) Tier 2 :Estimate based on repeated compatible tier2 or combination tier 3 and 2 or 1 (tier forstatus) Tier 1 : Other
2.5 Comments
CategoryComments related todata definitions etc
Comments on reported trend
Primary forest Data for 2012 is assumed for 2015. Area for primary forest is assumed toremain unchanged for the period 2012 -2015.
Other naturally regenerating forest Data for 2015 is derived fromextrapolation based on year 2011 and2012.
There is a slight decrease in area forother naturally regenerating forest dueto conversion of stateland forest fordevelopment purposes.
Planted forest Data for 2015 is derived fromextrapolation based on year 2011 and2012.
There is increased in area for plantedforest due to increase in the establishmentof fast growing forest plantation.
Mangroves Data for 2015 is derived fromextrapolation based on year 2011 and2012.
Area for mangrove forest is expectedto increase as a result of intensivereforestation programme.
Other general comments to the table

FRA 2015 – Country Report, Malaysia
21
Response to reviewer's query to Table 2a: The figure of primary forest for 2015 was based on the figure for year 2012. Theincrease in the area of primary forest is due to the additional declaration of protected area. Response to reviewer's query to Table 2a:The annual change rate in % is lower than the range +3.00% and -3.00%.

FRA 2015 – Country Report, Malaysia
22
3. What are the stocks and growth rates of the forests and how have they changed?Documents for this question:
• Guide for country reporting FRA 2015• FRA 2015 Terms and Definitions
3.1 Categories and definitions
Category Definition
Growing stock Volume over bark of all living trees with a minimum diameter of 10 cm at breast height (or abovebuttress if these are higher). Includes the stem from ground level up to a top diameter of 0 cm,excluding branches.
Net Annual Increment(NAI)
Average annual volume of gross increment over the given reference period less that of natural losses onall trees, measured to minimum diameters as defined for "Growing stock".
Above-ground biomass All living biomass above the soil including stem stump branches bark seeds and foliage.
Below-ground biomass All biomass of live roots. Fine roots of less than 2 mm diameter are excluded because these often cannotbe distinguished empirically from soil organic matter or litter.
Dead wood All non-living woody biomass not contained in the litter either standing lying on the ground or in thesoil. Dead wood includes wood lying on the surface dead roots and stumps larger than or equal to 10 cmin diameter or any other diameter used by the country.
Carbon in above-groundbiomass
Carbon in all living biomass above the soil including stem stump branches bark seeds and foliage.
Carbon in below-groundbiomass
Carbon in all biomass of live roots. Fine roots of less than 2 mm diameter are excluded because theseoften cannot be distinguished empirically from soil organic matter or litter.
Carbon in dead wood Carbon in all non-living woody biomass not contained in the litter, either standing, lying on the ground,or in the soil. Dead wood includes wood lying on the surface, dead roots and stumps larger than or equalto 10 cm in diameter or any other diameter used by the country.
Carbon in litter Carbon in all non-living biomass with a diameter less than the minimum diameter for dead wood (e.g.10 cm ) lying dead in various states of decomposition above the mineral or organic soil.
Soil carbon Organic carbon in mineral and organic soils (including peat) to a soil depth of 30 cm.
3.2 National data
3.2.1 Data sources
References to sourcesof information
Variables Years Additional comments
1 Forestry Department OfPeninsular Malaysia. ThirdNational Forest InventoryReport.
Growing stock 1991-1993 N/A
2 Forestry Department OfPeninsular Malaysia. FourthNational Forest InventoryReport.
Growing stock 2007 N/A
3 Forestry Department OfPeninsular Malaysia. FifthNational Forest InventoryReport.
Growing stock 2013 N/A

FRA 2015 – Country Report, Malaysia
23
4 FRA 2015 Guidelines Above ground biomass,below ground biomass
2013 Conversion factors fromthe guide lines were useto calculate for the aboveground biomass, belowground biomass
5 FRA 2010 Pre-filled data N/A N/A
3.2.2 Classification and definitions
National class Definition
Virgin forest, good (stratum code 11) Virgin (not yet logged) forests growing in dry-lands whose mainspecies are: Red Merantis, Keruing, Seraya, Kelat, Balau
Virgin forest, poor (stratum code 12) Virgin (not yet logged) forests growing in dry-lands whose mainspecies are: Red Merantis, Medang, Keruing, Kelat, Kedondong
Logged 1991-2003 20 (stratum code 20) Logged over forest.
Logged 1981-1990 (stratum code 21) Logged over forest.
Logged 1971-1980 (stratum code 21) Logged over forest.
Logged before 1971(stratum code 23) Logged over forest.
Peat Swamp Forest (stratum code 31) Virgin
Logged Peat Swamp Forest (stratum code 32) Logged over forest.
Logged Dipterocarp Forest (stratum code 40) In the Stateland Forest
Logged Peat Swamp Forest (stratum code 41) In the Stateland Forest
Protection Forest (stratum code 50) In Permanent Reserved Forest
Biomass stock No National definitions and classes are available for this table.
3.2.3 Original data
Growing stock
A. Peninsular Malaysia
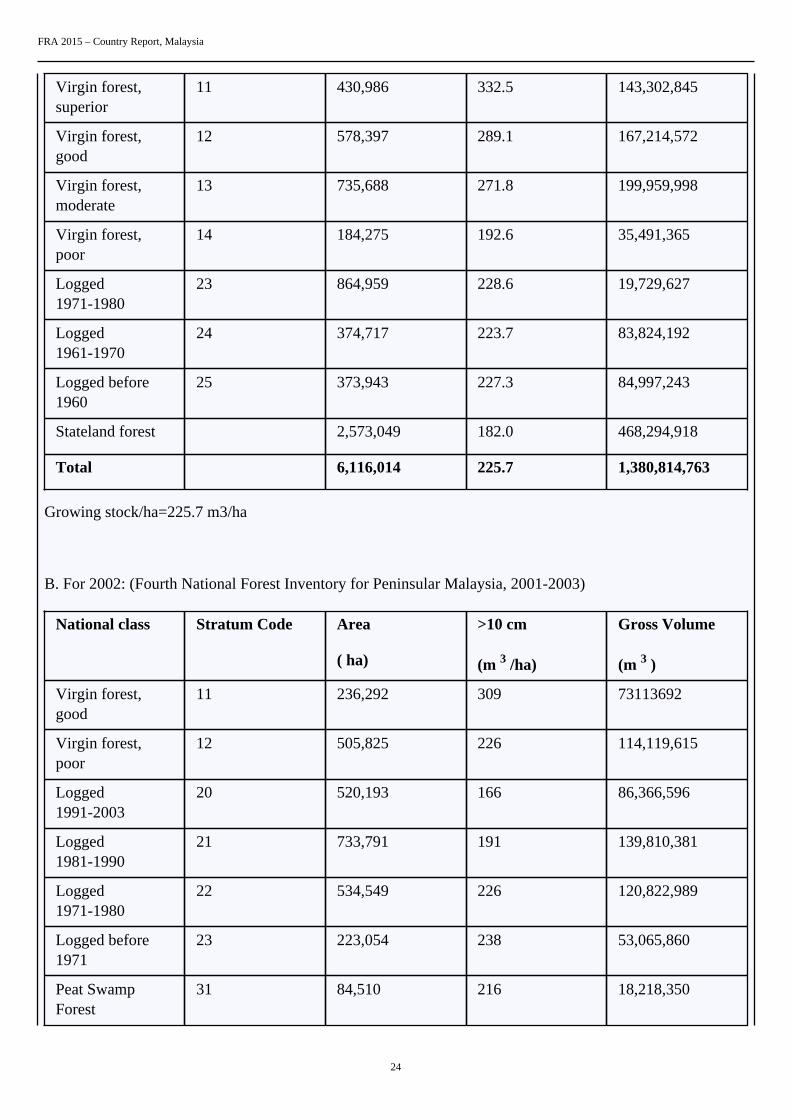
A. For 1992: (Third National Forest Inventory for Peninsular Malaysia, 1991-1993)
National class Stratum Code Area
( ha)
>10 cm
(m 3 /ha)
Gross Volume
(m 3 )
FRA 2015 – Country Report, Malaysia
24
Virgin forest,superior
11 430,986 332.5 143,302,845
Virgin forest,good
12 578,397 289.1 167,214,572
Virgin forest,moderate
13 735,688 271.8 199,959,998
Virgin forest,poor
14 184,275 192.6 35,491,365
Logged1971-1980
23 864,959 228.6 19,729,627
Logged1961-1970
24 374,717 223.7 83,824,192
Logged before1960
25 373,943 227.3 84,997,243
Stateland forest 2,573,049 182.0 468,294,918
Total 6,116,014 225.7 1,380,814,763
Growing stock/ha=225.7 m3/ha
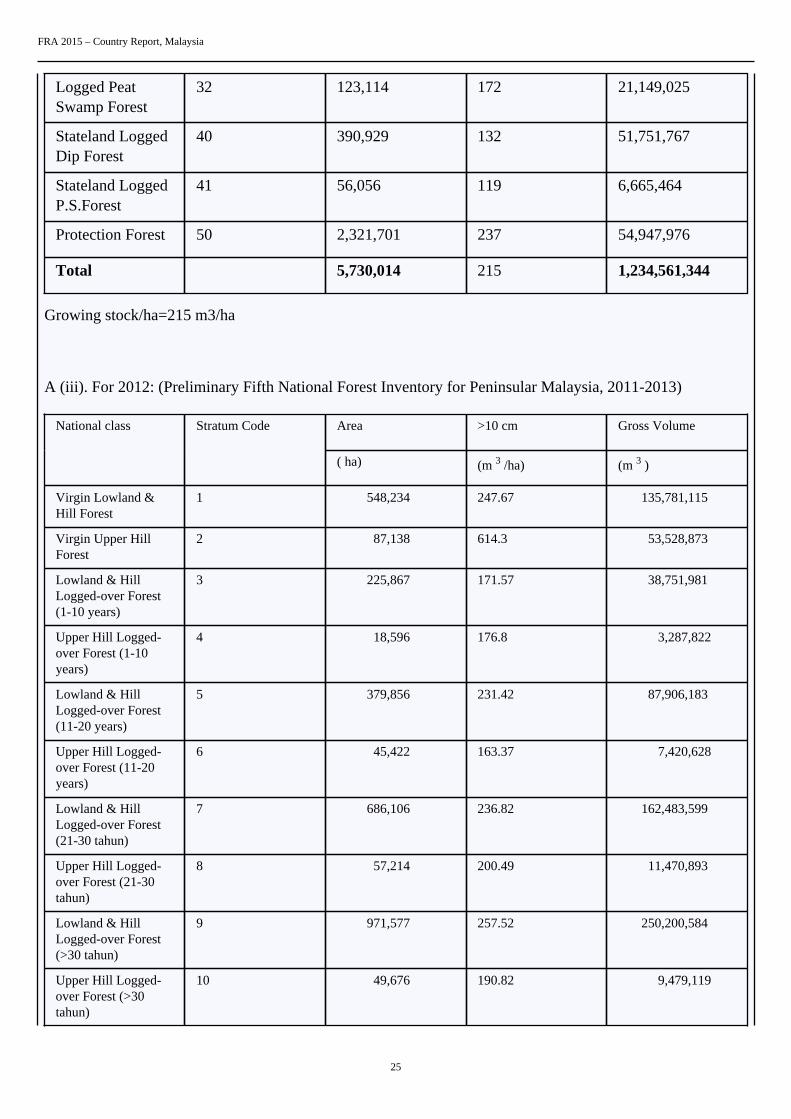
B. For 2002: (Fourth National Forest Inventory for Peninsular Malaysia, 2001-2003)
National class Stratum Code Area
( ha)
>10 cm
(m 3 /ha)
Gross Volume
(m 3 )
Virgin forest,good
11 236,292 309 73113692
Virgin forest,poor
12 505,825 226 114,119,615
Logged1991-2003
20 520,193 166 86,366,596
Logged1981-1990
21 733,791 191 139,810,381
Logged1971-1980
22 534,549 226 120,822,989
Logged before1971
23 223,054 238 53,065,860
Peat SwampForest
31 84,510 216 18,218,350
FRA 2015 – Country Report, Malaysia
25
Logged PeatSwamp Forest
32 123,114 172 21,149,025
Stateland LoggedDip Forest
40 390,929 132 51,751,767
Stateland LoggedP.S.Forest
41 56,056 119 6,665,464
Protection Forest 50 2,321,701 237 54,947,976
Total 5,730,014 215 1,234,561,344
Growing stock/ha=215 m3/ha
A (iii). For 2012: (Preliminary Fifth National Forest Inventory for Peninsular Malaysia, 2011-2013)
Area >10 cm Gross VolumeNational class Stratum Code
( ha) (m 3 /ha) (m 3 )
Virgin Lowland &Hill Forest
1 548,234 247.67 135,781,115
Virgin Upper HillForest
2 87,138 614.3 53,528,873
Lowland & HillLogged-over Forest (1-10 years)
3 225,867 171.57 38,751,981
Upper Hill Logged-over Forest (1-10years)
4 18,596 176.8 3,287,822
Lowland & HillLogged-over Forest(11-20 years)
5 379,856 231.42 87,906,183
Upper Hill Logged-over Forest (11-20years)
6 45,422 163.37 7,420,628
Lowland & HillLogged-over Forest(21-30 tahun)
7 686,106 236.82 162,483,599
Upper Hill Logged-over Forest (21-30tahun)
8 57,214 200.49 11,470,893
Lowland & HillLogged-over Forest(>30 tahun)
9 971,577 257.52 250,200,584
Upper Hill Logged-over Forest (>30tahun)
10 49,676 190.82 9,479,119

FRA 2015 – Country Report, Malaysia
26
Virgin Peat SwampForest
11 97,634 191.67 18,713,595
Peat Swamp Logged-over Forest (#40tahun)
12 113,672 183.67 20,878,193
Peat Swamp Logged-over Forest (#40tahun)
13 5,935 198.1 1,175,749
Non Forest ReserveInland Forest
14 698,786 146.93 102,672,667
Non Forest ReservePeat Swamp Forest
15 176,001 133.9 23,566,479
Lowland & HillProtection Forest
16 1,182,305 230.49 272,509,461
Upper Hill ProtectionForest
17 381,041 264.19 100,667,230
Montane ProtectionForest
18 242,462 218.48 52,973,056
Total 5,967,523 225.46
Growing stock/ha= 225.46 m3/ha
B. Sarawak
Information on growing stock is available only from FAO/UNDP assisted project (Forest Industries
Development) inventory in 1974, which indicated a growing stock density of 135 m 3 /ha of net industrial stemwood under bark volume of trees 45 cm (dbh) and above.
C. Sabah
Information on growing stock of Sabah is quite limited to log over commercial Class II forests. This information
indicates variation of growth stock per ha from 25 m 3 / ha in stratum 4 forest to 150 m 3 /ha in stratum 1 forestsof trees 60 cm dbh and above over bark.
Biomass stock
Based on the FRA 2015 guidelines and the projected growing stock for 2015, the BCEF of 0.95 for humidtropical forests and a root shoot ratio of 0.24 have been applied.
Carbon stock

FRA 2015 – Country Report, Malaysia
27
This table uses biomass data and the conversion factor of 0.47 to calculate carbon in above-ground biomassand carbon in below-ground biomass.
3.3 Analysis and processing of national data
3.3.1 Adjustment
N/A
3.3.2 Estimation and forecasting
Biomass stock
Variables 1990 2000 2005 2010 2015
GrowingStock inforests inmillion m3
5,097 4,696 4,436 4,585 5,034
BCEF 0.95 0.95 0.95 0.95 0.95
AboveGroundBiomassmillion t
4,842 6,105 5,767 4,355 4,782
Root ratio 0.24 0.24 0.24 0.24 0.24
Below groundbiomassmillion t
1,162 1,465 1,384 1,045 1,148
Carbon stock
The default conversion factor (biomass to carbon) factor of 0.47 has been adopted from to estimate carbonstock in forests.
Variables 1990 2000 2005 2010 2015

FRA 2015 – Country Report, Malaysia
28
Above-groundbiomass
4,842 6,105 5,767 4,355 4,782
Default factor 0.47 0.47 0.47 0.47 0.47
Carbon inAbove groundbiomass
2,276 2,869 2,711 2,047 2,248
Below-groundbiomass
1,162 1,465 1,384 1,045 1,148
Default factor 0.47 0.47 0.47 0.47 0.47
Carbon inBelow groundbiomass
546 689 651 491 539
Growing stock
The growing stock has been estimated and forecasted by calculating the growing stock per hectare for thereference years (1990, 2000 and 2005) and multiplying it with related extent of forest in respective years.
A. Growing Stock per hectare
Peninsular Malaysia Region
The growing stock has been estimated and forecasted by calculating the growing stock per hectare for thereference years (1990, 2000 and 2005). For this purpose, the weighted average per hectare growing stock fromnational inventories with reference years of 1992 and 2002 has been interpolated or extrapolated.
Variable
Volume in m 3 /ha
1992 2002 1990 2000 2005 2010 2015
WeightedaverageGrowingStock perhectare
226 215 228 218 212 207 227

FRA 2015 – Country Report, Malaysia
29
Sabah Region
In absence of sufficient information, the above weighted average figures calculated for the peninsular Malaysiaregion have been adopted for the forests in Sabah region.
Sarawak Region
In absence of sufficient information, the above weighted average figures calculated for the peninsular Malaysiaregion have been adopted for the forests in Sarawak region.
B. Growing Stock
Since the growing stock per hectare figure for all the three regions have been assumed to be same hence thesefigures have been multiplied with the total extent of forests reported (including rubber plantations) in Table 1to estimate the total growing stock in forests in Malaysia.
Variables Growing Stock in million m 3
1990 2000 2005 2010 2015
Extent ofForest inTable 1 in 000ha
22,376 21,591 20,890 22,124 22,195
Growing stockper ha
227.79 217.50 212.35 207.23 226.81
TotalGrowingStock in
million m 3
5,097 4,696 4,436 4,585 5,034

FRA 2015 – Country Report, Malaysia
30
The species-wise data is available from The Third and Fourth NFI for the peninsular region only. The averagegrowing stock from this inventory has been applied to Sabah and Sarawak region as well as rubber plantationsareas to calculate the total growing stock. The following species-wise distribution of the growing stock in 1990and 2000 has been developed by using proportionate distribution (excluding rubber plantations) of species inthe growing stock in peninsular region only for 1992. It may therefore not reflect the ground reality. For 2010net growing stock per ha has been estimated by using NFI 4 data.
For FRA 2005, information has been compiled and projected from preliminary results from NFI 4 inventorydata analysis. NFI 4 was carried out between 2002 and 2004. Where else, data for FRA 2010 has been derivedfrom actual NFI 4 report. Malaysia intends to use actual NFI data.
Species distribution based on NFI4 (2001 - 2003)
Scientific name Common name Percent
Eugenia spp. Kelat 14.81%
Cinnamomum spp. Medang 10.80%
Canarium spp. Kedondong 9.15%
Shorea curtisii Meranti seraya 9.02%
Shorea leprosula Meranti tembaga 6.11%
Shorea platyclados Meranti bukit 6.02%
Koompassia Kempas, Tualang 5.07%
Palaquium Nyatoh 4.64%
Shorea ovalis Meranti kepong 4.37%
Shorea pauciflora Meranti nemesu 4.28%
Remaining species 25.72%
Total 100.00%
Species distribution based on NFI5 (2011-2013)

FRA 2015 – Country Report, Malaysia
31
Peninsular Malaysia
Scientific name Common name Percent
Syzygium spp . Kelat 12.41%
Cinnamomum spp . Medang 11.47%
Canarium spp . Kedondong 6.10%
Shorea curtisii. Meranti seraya 3.89%
Shorea leprosula Meranti tembaga 2.63%
Shorea platyclados Meranti bukit 2.19%
Koompassia spp . Kempas, Tualang 1.91%
Palaquium spp . Nyatoh 1.81%
Shorea ovalis Meranti kepong 1.77%
Shorea pauciflora Meranti nemesu 1.67%
Remaining species 54.14%
Total 100.00%
3.3.3 Reclassification
N/A
3.4 Data

FRA 2015 – Country Report, Malaysia
32
Table 3a
Growing stock volume (million m 3 over bark)
Forest Other wooded landCategory
1990 2000 2005 2010 2015 1990 2000 2005 2010 2015
Totalgrowingstock
5097 4696 4436 4585 5034 0 0 0 0 0
... ofwhichconiferous
0 0 0 0 0 0 0 0 0 0
... ofwhichbroadleaved
5097 4696 4436 4585 5034 0 0 0 0 0
Table 3b
Category/Species name Growing stock in forest (million cubic meters)
Rank Scientific name Common name 1990 2000 2005 2010
1 st Syzygium spp. Kelat 755 695 657 679
2 nd Cinnamomumspp.
Medang 551 507 479 495
3 rd Canarium spp. Kedondong 466 430 406 420
4 th Shorea curtisii. Meranti seraya 459 423 400 413
5 th Shorea leprosula Merantitembaga
311 287 271 280
6 th Shoreaplatyclados
Meranti bukit 307 283 267 276
7 th Koompassiaspp.
Kempas,Tualang
259 238 225 233
8 th Palaquium spp. Nyatoh 237 219 206 213
9 th Shorea ovalis Meranti kepong 222 205 194 201
10 th Shoreapauciflora
Meranti nemesu 218 201 190 196
Remaining 1312 1208 1141 1179
TOTAL 5097.00 4696.00 4436.00 4585.00
THE PRE-FILLED VALUES FOR GROWING STOCK REFER TO THE FOLLOWINGTHRESHOLD VALUES (SEE TABLE BELOW)
Item Value Complementary information

FRA 2015 – Country Report, Malaysia
33
Minimum diameter (cm) at breast heightof trees included in growing stock (X)
10 cm N/A
Minimum diameter (cm) at the top end ofstem for calculation of growing stock (Y)
First branch N/A
Minimum diameter (cm) of branchesincluded in growing stock (W)
N/A N/A
Volume refers to above ground (AG) orabove stump (AS)
AG N/A
PLEASE NOTE THAT THE DEFINITION OF GROWING STOCK HAS CHANGED AND SHOULDBE REPORTED AS GROWING STOCK DBH 10 CM INCLUDING THE STEM FROM GROUNDLEVEL UP TO A DIAMETER OF 0 CM, EXCLUDING BRANCHES.
Table 3c
Net annual increment (m 3 per hectare and year)
ForestCategory
1990 2000 2005 2010 2015
Net annualincrement
N/A N/A N/A N/A 9.39
... of whichconiferous
N/A N/A N/A N/A 0
... of whichbroadleaved
N/A N/A N/A N/A 9.39
Table 3d
Biomass (million metric tonnes oven-dry weight)
Forest Other wooded landCategory
1990 2000 2005 2010 2015 1990 2000 2005 2010 2015
Abovegroundbiomass
4842 4461 4214 4355 4782 0 0 0 0 0
Belowgroundbiomass
1162 1071 1011 1045 1148 0 0 0 0 0
Deadwood
0 0 0 0 0 0 0 0 0 0
TOTAL 6004.00 5532.00 5225.00 5400.00 5930.00 .00 .00 .00 .00 .00
Table 3e
Carbon (Million metric tonnes)
CategoryForest Other wooded land

FRA 2015 – Country Report, Malaysia
34
1990 2000 2005 2010 2015 1990 2000 2005 2010 2015
Carbonin abovegroundbiomass
2276 2097 1981 2047 2248 0 0 0 0 0
Carbonin belowgroundbiomass
546 503 475 491 539 0 0 0 0 0
SubtotalLivingbiomass
2822 2600 2456 2538 2787 0 0 0 0 0
Carbonin deadwood
0 0 0 0 0 0 0 0 0 0
Carbonin litter
47 45 44 46 47 0 0 0 0 0
SubtotalDeadwoodand litter
0 0 0 0 0 0 0 0 0 0
Soilcarbon
0 0 0 0 0 0 0 0 0 0
TOTAL 2869.00 2645.00 2500.00 2584.00 2834.00 .00 .00 .00 .00 .00
Tiers
Variable/category Tier for status Tier for trend
Total growing stock Tier 3 Tier 3
Net annual increment Tier 2 Tier 2
Above ground biomass Tier 1 Tier 1
Below ground biomass Tier 1 Tier 1
Dead wood Tier 1 Tier 1
Carbon in above-ground biomass Tier 1 Tier 1
Carbon in below ground biomass Tier 1 Tier 1
Carbon in dead wood and litter Tier 1 Tier 1
Soil carbon Tier 1 Tier 1
Tier criteria
Category Tier for status Tier for reported trend
FRA 2015 – Country Report, Malaysia
35
Total growing stock Tier 3: Data sources Recent 10 yearsNational Forest Inventory or remotesensing with ground truthing orprogramme for repeated compatible NFI10 years Domestic volume functions Tier2: Data sources/registers and statisticsmodelling or old NFI 10 years or partialfield inventory Tier 1: Other data sources
Tier 3: Estimate based on repeatedcompatible tiers 3 (tier for status)Domestic growth functions Tier 2:Estimate based on repeated compatible tier2 or combination tier 3 and 2 or 1 tier forstatus Tier 1: Other
Net annual increment Tier 3: Scientifically tested nationalvolume and growth functions Tier 2:Selection of volume and growth functionsas relevant as possible Tier 1: Other
Tier 3: Confirmation/adjustment offunctions used through scientific workTier 2: Review work done to seekalternative functions Tier: 1 Other
Biomass Tier 3: Country-specific national or sub-national biomass conversion expansionfactors applied or other domestic orotherwise nationally relevant biomassstudies Tier 2: Application of countryspecific national or sub-national biomassconversion factors from other countrywith similar climatic conditions and foresttypes Tier 1: International/regional defaultbiomass expansion factors applied
Tier 3 : Estimate based on repeatedcompatible tiers 3 (tier for status) Tier 2 :Estimate based on repeated compatible tier2 or combination tier 3 and 2 or 1 (tier forstatus) Tier 1 : Other
• Carbon in above ground biomass• Carbon in below ground biomass• Carbon in dead wood and litter• Soil carbon
Tier 3: Country-specific national or sub-national biomass conversion expansionfactors applied Tier 2: Applicationof country specific national or sub-national biomass conversion factorsform from other country with similarclimatic conditions and forest types Tier1: International/regional default biomassexpansion factors applied
Tier 3 : Estimate based on repeatedcompatible tiers 3 (tier for status) Tier 2 :Estimate based on repeated compatible tier2 or combination tier 3 and 2 or 1 (tier forstatus) Tier 1 : Other
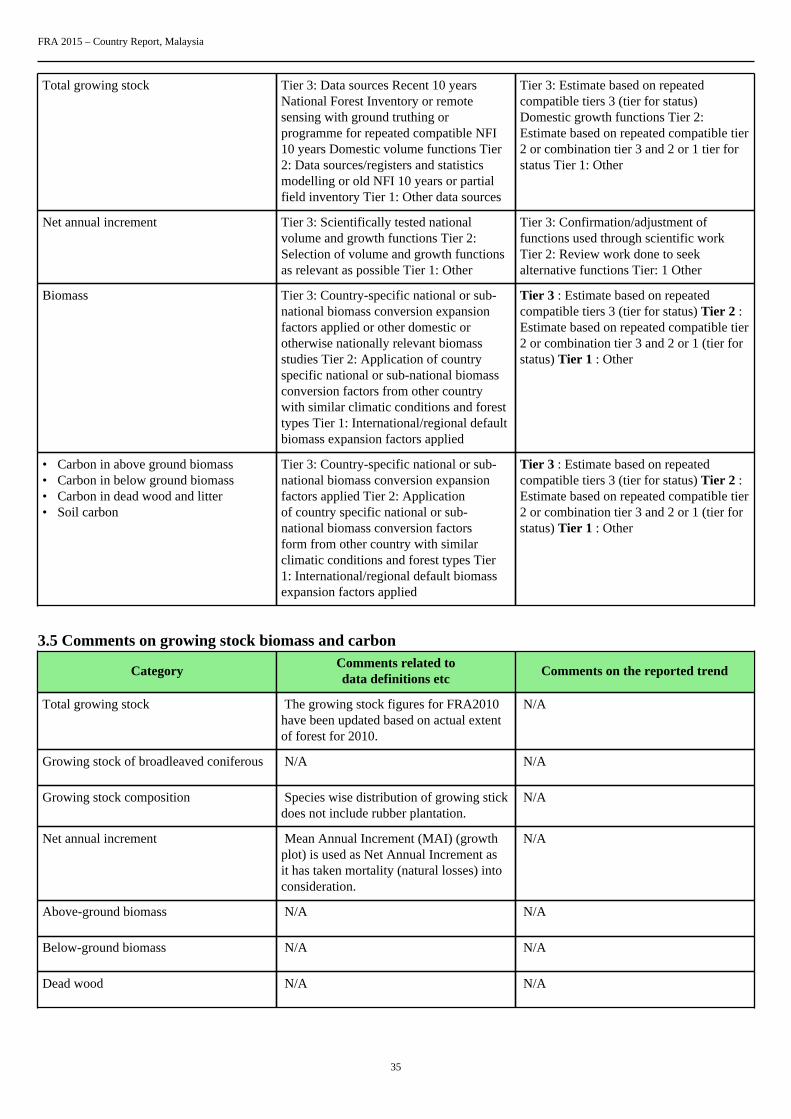
3.5 Comments on growing stock biomass and carbon
CategoryComments related todata definitions etc
Comments on the reported trend
Total growing stock The growing stock figures for FRA2010have been updated based on actual extentof forest for 2010.
N/A
Growing stock of broadleaved coniferous N/A N/A
Growing stock composition Species wise distribution of growing stickdoes not include rubber plantation.
N/A
Net annual increment Mean Annual Increment (MAI) (growthplot) is used as Net Annual Increment asit has taken mortality (natural losses) intoconsideration.
N/A
Above-ground biomass N/A N/A
Below-ground biomass N/A N/A
Dead wood N/A N/A

FRA 2015 – Country Report, Malaysia
36
Carbon in above-ground biomass N/A N/A
Carbon in below-ground biomass N/A N/A
Carbon in dead wood N/A N/A
Carbon in litter N/A N/A
Soil carbon Soil depth for soil carbon estimates notavailable.
N/A
Other general comments to the table
The species distribution of the growing stock has been developed by using proportionate distribution (excluding rubber plantation)of species based on NFI3, NFI4 and NFI5 carried out in Peninsular Malaysia only. Other wooded land is not applicable (N/A) inMalaysia. Response to reviewer's query to Table 3d and 3e: The FRIMS system does not accepted N/A. The figures for "Total"disappear when N/A is keyed in. Response to reviewer's query to Table 3a: There is no value for other wooded land categories.Response to reviewer's query to Table 3e: There is no value for soil carbon category (soil depth for soil carbon estimates notavailable). Response to reviewer's query to Table 3d & 3e: Default factor for Table 3d and 3e using 0.47 as a default factor over theyears.

FRA 2015 – Country Report, Malaysia
37
4. What is the status of forest production and how has it changed over time?Documents for this question:
• Guide for country reporting FRA 2015• FRA 2015 Terms and Definitions
4.1 Categories and definitions
Term Definition
Primary designatedfunction
The primary function or management objective assigned to a management unit either by legalprescription documented decision of the landowner/manager or evidence provided by documentedstudies of forest management practices and customary use.
Non wood forest product(NWFP)
Goods derived from forests that are tangible and physical objects of biological origin other than wood.
Commercial value ofNWFP
For the purpose of this table, value is defined as the commercial market value at the forest gate.
Category Definition
Production forest Forest area designated primarily for production of wood, fibre, bio-energy and/or non-wood forestproducts.
Multiple use forest Forest area designated for more than one purpose and where none of these alone is considered as thepredominant designated function.
Total wood removals The total of industrial round wood removals and woodfuel removals.
...of which woodfuel The wood removed for energy production purposes, regardless whether for industrial, commercial ordomestic use.
4.2 National data
4.2.1 Data sources
References to sourcesof information
Variables Years Additional comments
1 Forestry Department OfPeninsular Malaysia. AnnualReport
Forest categories. 1990-2012 Statistical informationcovering naturallyregenerated forest, forestplantation and mangroves inPeninsular Malaysia.
2 Forestry Department OfPeninsular Malaysia.Statistics Report
Forest categories. 1990-2012 Statistical informationcovering naturallyregenerated forest, forestplantation and mangroves inPeninsular Malaysia.
3 Sabah Forestry Department Forest categories. 1990-2012 Statistical informationcovering naturallyregenerated forest, forestplantation and mangroves inSabah.

FRA 2015 – Country Report, Malaysia
38
4 Sarawak Forest Department Forest categories and totallyprotected areas.
1990-2012 Statistical informationcovering naturallyregenerated forest, forestplantation and mangroves inSarawak.
5 Department of Wildlife andNational Parks PeninsularMalaysia
National Park, Wildlife &Bird Sanctuary & NWFP.
1990-2012 N/A
6 FRA 2010 Pre-filled data. N/A N/A
4.2.2 Classification and definitions
National class Definition
Primary Function - Permanent Reserved Forest Land administered under:- • National Forestry Act, 1984(Peninsular Malaysia); • Forest Ordinance Cap. 126 (1958Edition) (Sarawak); • Forest Enactment,1968 (Sabah).
- National Park Land administered under:- • National Parks Act, 1980(Peninsular Malaysia); • Taman Negara Enactment (Kelantan),1938 • Taman Negara Enactment (Pahang), 1939 • TamanNegara Enactment (Terengganu), 1939 • National ParkCorporation Enactment (Johore) 1989; • State Park CorporationEnactment (Perak) 2003; • National Parks and Nature ReservesOrdinance Cap. 27, 1998 (Sarawak); • Parks Enactment,1984(Sabah).
- Wildlife & Bird Sanctuary Land administered under:- • Wildlife Conservation Act, 2010(Peninsular Malaysia); • Wildlife Protection Ordinance Cap.26, 1998 (Sarawak); • Wildlife Conservation Enactment, 1997(Sabah).
- Stateland Forest - Alienated Land - Plantation Land - Urbanareas
Land administered under:- • National Land Code & StatelandRules, 1965 (Peninsular Malaysia); • Land Code Cap 81, 1958Edition (Sarawak) • Land Ordinance Cap. 68, 1930 (Sabah).
4.2.3 Original data
Forest 1990 2000 2005 2010 2011 2012
ProductionForest in'000ha
- PRF 9,900 11,490 10,590 11,519 11,614 11,321
- Rubberplantation
1,836 1,431 1,229 1,020 1,023 1,042

FRA 2015 – Country Report, Malaysia
39
Protectionin '000ha
- PRF 2,700 2,910 3,810 3,008 2,905 3,182
- NationalPark &wildlife& birdsantuary
1,120 1,120 1,120 1,859 1,859 1,859
Multiplepurposein'000ha
- StatelandForest
6,820 4,640 4,141 4,718 4,630 4,656
TotalForest in'000ha
22,376 21,591 20,890 22,124 22,031 22,060
4.3 Analysis and processing of national data
4.3.1 Adjustment
N/A
4.3.2 Estimation and forecasting
The figures for Permanent Reserved Forest and National Parks for 1990, 2000, 2005, 2010, 2011 and 2012 areavailable, while figure for 2012 has been assumed as 2015. The figure for 2015 for Stateland Forest has beenforecasted as 4,735 (‘000ha) using linear trend (Stateland Forest, y=26x – 47,656).
The figure for 2015 for Rubber Plantation has been forecasted as 1,098 (‘000ha) using linear trend (RubberPlantation, y=19x – 37,186 ).
Forest 1990 2000 2005 2010 2015
ProductionForest in'000ha

FRA 2015 – Country Report, Malaysia
40
- PRF 9,900 11,490 10,590 11,519 11,321
- Rubberplantation
1,836 1,431 1,229 1,020 1,098
Protection in'000ha
- PRF 2,700 2,910 3,810 3,008 3,182
- NationalPark &wildlife &bird santuary
1,120 1,120 1,120 1,859 1,859
Multiplepurposein'000ha
- StatelandForest
6,820 4,640 4,141 4,718 4,735
Total Forest in'000ha
22,376 21,591 20,890 22,124 22,195
4.3.3 Reclassification
N/A
4.4 DataTable 4a
Forest area (000 hectares)Categories
1990 2000 2005 2010 2015
Production forest 11736 12921 11819 12539 12419
Multiple useforest
6820 4640 4141 4718 4735
Table 4b
Rank Name of product Key species
Commercial valueof NWFP removals
2010 (value 1000local currency)
NWFP category

FRA 2015 – Country Report, Malaysia
41
1 st Agarwood Aqualaria malacensis 16052 3
2 nd Bird's nest Erodamus fugifagus(White), Erodamusmaximus (Black)
3426 13
3 rd Wild boar Sus scrofa 1838 12
4 th Bamboo betong andsemantan
Dendrocalamusasper; Gigantochloascortechinii
1712 5
5 th Rattan Calamus spp 1392 5
6 th Phyton Python reticulatus 869 12
7 th Skin (Phyton) Python reticulatus 579 10
8 th Monitor lizard Varanus salvator 254 12
9 th Skin (Monitor lizard) Varanus salvator 61 10
10 th N/A N/A N/A N/A
TOTAL 26183.00
2010
Name of local currency Ringgit Malaysia (RM)
Category
Plant products / raw material
1 Food
2 Fodder
3 Raw material for medicine and aromatic products
4 Raw material for colorants and dyes
5 Raw material for utensils handicrafts construction
6 Ornamental plants
7 Exudates
8 Other plant products
Animal products / raw material
9 Living animals

FRA 2015 – Country Report, Malaysia
42
10 Hides skins and trophies
11 Wild honey and beewax
12 Wild meat
13 Raw material for medicine
14 Raw material for colorants
15 Other edible animal products
16 Other non-edible animal products
Table 4c Pre-filled data from FAOSTAT
FRA 2015 category (1000 m 3 u.b.)Year
Total wood removals ...of which woodfuel
1990 45269.7 4009.7
1991 45311.7 3930.7
1992 48890.5 3852.5
1993 41768.9 3764.9
1994 40114.2 3681.2
1995 39349.1 3596.1
1996 35069.2 3525.2
1997 35996.4 3458.4
1998 26813.6 3413.6
1999 26769.9 3381.9
2000 27725.7 3345.7
2001 23545.5 3285.5
2002 22690.8 3227.8
2003 26529.4 3172.4
2004 28470.3 3119.3
2005 28254.3 3068.3
2006 26190.6 3012.7

FRA 2015 – Country Report, Malaysia
43
2007 27953.2 2959.2
2008 25652.7 2907.7
2009 22985.2 2858.2
2010 22113.5 2810.5
2011 20811 2760
Tiers
Category Tier for status Tier for reported trend
Production forest Tier 3 Tier 3
Multiple use forest Tier 1 Tier 1
Tier Criteria
Category Tier for status Tier for reported trend
Production forest Multiple use forest Tier 3: Updated including fieldverifications national forest mapsincluding functions Tier 2: Forest mapsolder than 6 years including forestfunctions Tier 1: Other
Tier 3 : Estimate based on repeatedcompatible tiers 3 (tier for status) Tier 2 :Estimate based on repeated compatible tier2 or combination tier 3 and 2 or 1 (tier forstatus) Tier 1 : Other
4.5 Comments
CategoryComments related todata definitions etc
Comments on the reported trend
Production forest N/A Area for production forests decreasesslightly since 2010 due to increased inprotection forest.
Multiple use forest N/A Area for multiple use forest (Statelandforest) decreases slightly since 2010 due toconversion for land development includingrubber plantation.
Total wood removals N/A N/A
Commercial value of NWFP N/A N/A
Other general comments to the table
Response to reviewer's query to Table 4a: The value for 2015 has been corrected as highlighted. Response to reviewer's query toTable 4c: The figures for Table 4c was based on the latest data from FAOSTAT.

FRA 2015 – Country Report, Malaysia
44
5. How much forest area is managed for protection of soil and water and ecosystemservices?Documents for this question:
• Guide for country reporting FRA 2015• FRA 2015 Terms and Definitions
5.1 Categories and definitions
Category Definition
Protection of soil andwater
Forest area designated or managed for protection of soil and water
...of which productionof clean water (sub-category)
Forest area primarily designated or managed for water production, where most human uses are excludedor heavily modified to protect water quality.
...of which coastalstabilization (sub-category)
Forest area primarily designated or managed for coastal stabilization.
...of which desertificationcontrol (sub-category)
Forest area primarily designated or managed for desertification control.
...of which avalanchecontrol (sub-category)
Forest area primarily designated or managed to prevent the development or impact of avalanches onhuman life assets or infrastructure.
...of which erosion, floodprotection or reducingflood risk (sub-category)
Forest area primarily designated or managed for protecting communities or assets from the impacts oferosion riparian floods and landslides or for providing flood plain services.
...of which other (sub-category)
Forest area primarily designated or managed for other protective functions.
Ecosystem services,cultural or spiritual values
Forest area primarily designated or managed for selected ecosystem services or cultural or spiritualvalues.
...of which publicrecreation (sub-category)
Forest area designated or managed for public recreation.
...of which carbon storageor sequestration (sub-category)
Forest area designated or managed for carbon storage or sequestration.
...of which spiritual orcultural services (sub-category)
Forest area designated or managed for spiritual or cultural services.
...of which other (sub-category)
Forest area designated or managed for other ecosystem services.
5.2 National data
5.2.1 Data sources
References to sourcesof information
Variables Years Additional comments
1 Forestry Department ofPeninsular Malaysia
Forest area by functionalclasses
2010-2012 N/A

FRA 2015 – Country Report, Malaysia
45
2 Forestry Manual VolumeIII Forestry DepartmentPeninsular Malaysia
Definitions of forestfunctional classes
2003 N/A
3 Sabah Forestry Department Forest area by functionalclasses
2010-2012 N/A
4 Sarawak Forest Department Forest area by functionalclasses
2010-2012 N/A
5.2.2 Classification and definitions
National class Definition
Protection forest Protection forest are forest area designated or managed forprotection of soil and water and ecosystem services.
N/A N/A
N/A N/A
N/A N/A
5.2.3 Original data
N/A
5.3 Analysis and processing of national data
5.3.1 Adjustment
n.a
5.3.2 Estimation and forecasting
The figures for water catchment forest and forest for coastal stabilization for 2010, 2011 and 2012 are available.For water catchment forest and flood control forest, figures for 2012 have been assumed as 2015. In the caseof forest for coastal stabilization, estimation for 2015 is done by extrapolation of figures for 2011 and 2012.
5.3.3 Reclassification
n.a
5.4 DataTable 5a

FRA 2015 – Country Report, Malaysia
46
Forest area (1000 hectares)Categories
1990 2000 2005 2010 2015
Protection of soiland water
N/A N/A N/A 2035 2343
... of whichproduction ofclean water
N/A N/A N/A 1688 1995
... of whichcoastalstabilization
N/A N/A N/A 337 338
... of whichdesertificationcontrol
N/A N/A N/A N/A N/A
... of whichavalanchecontrol
N/A N/A N/A N/A N/A
... of whicherosion, floodprotection orreducing floodrisk
N/A N/A N/A 10 10
... of which other(please specifyin commentsbelow the table)
N/A N/A N/A N/A N/A
Other
N/A
Table 5b
Forest area (1000 hectares)Categories
1990 2000 2005 2010 2015
Ecosystem services,cultural or spiritualvalues
0 0 0 2446 2466
...of which publicrecreation
0 0 0 660 681
...of whichcarbon storage orsequestration
0 0 0 0 0
...of which spiritualor cultural services
0 0 0 0 0

FRA 2015 – Country Report, Malaysia
47
...of which other(please specify incomments belowthe table)
0 0 0 1786 1785
Tiers
Category Tier for reported trend Tier for status
Protection of soil and water Tier 3 Tier 3
Ecosystem services, cultural or spiritualvalues
Tier 3 Tier 3
Tier criteria
Category Tier for status Tier for reported trend
Protection of soil and water Tier 3: High reliability data derived eitherfrom high intensity sample survey or dataobtained from national or state agenciesresponsible for regulations or legislationrelating to soil and water protection. Tier2: Approaches based on low intensityor incomplete sample-based surveys orstudies that provide data for specific areasthat is extrapolated through statisticalanalysis to national level estimates. Tier 1:Other
Tier 3 : Estimate based on repeatedcompatible tiers 3 (tier for status) Tier 2 :Estimate based on repeated compatible tier2 or combination tier 3 and 2 or 1 (tier forstatus) Tier 1 : Other
• Cultural or spiritual values• Public recreation• Spiritual or cultural services• Other
Tier 3: High reliability data derivedeither from high intensity sample surveyor data obtained from national or stateagencies responsible for regulations. Tier2: Approaches based on low intensityor incomplete sample-based surveys orstudies that provide data for specific areasthat is extrapolated through statisticalanalysis to national level estimates. Tier 1:Other
Tier 3 : Estimate based on repeatedcompatible tiers 3 (tier for status) Tier 2 :Estimate based on repeated compatible tier2 or combination tier 3 and 2 or 1 (tier forstatus) Tier 1 : Other
5.5 Comments
CategoryComments related todata definitions etc
Comments on the reported trend
Protection of soil and water N/A N/A
Production of clean water Refers to forest designated for watercatchment purposes.
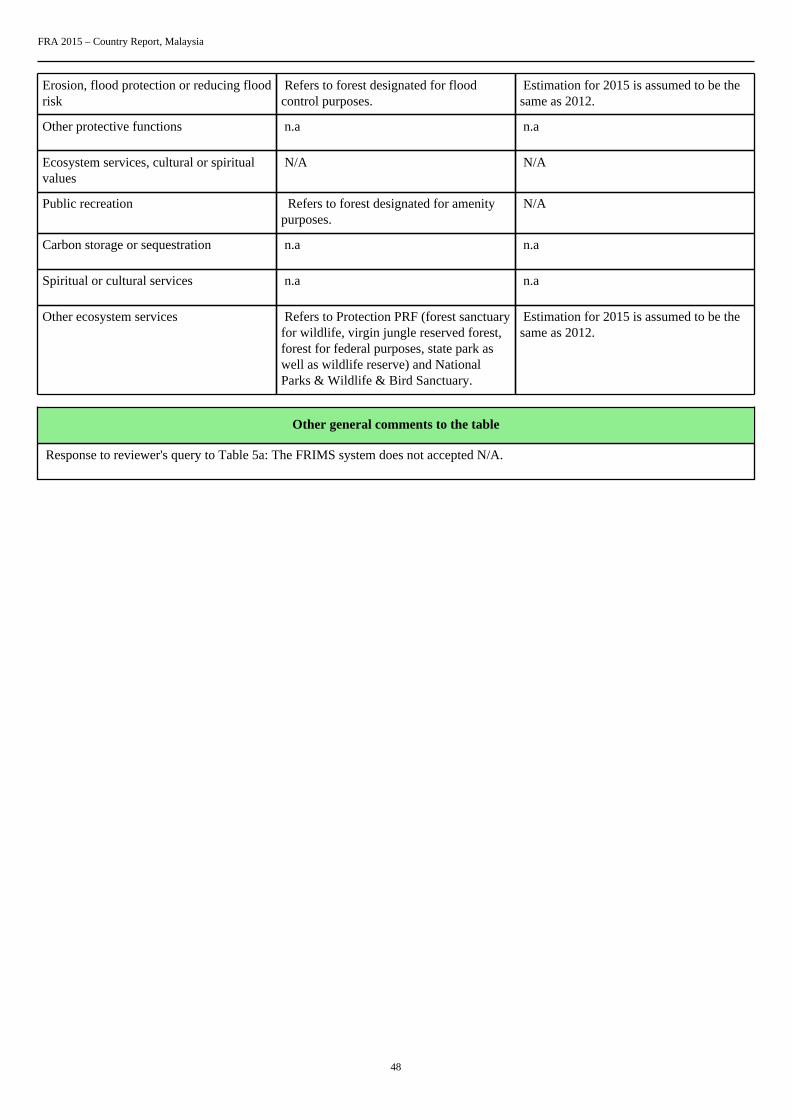
Estimation for 2015 is assumed to be thesame as 2012.
Coastal stabilization Refers to forest designated for coastalstabilization purposes.
Estimation for 2015 is done byextrapolation from figures for 2011 and2012.
Desertification control n.a n.a
Avalanche control n.a n.a
FRA 2015 – Country Report, Malaysia
48
Erosion, flood protection or reducing floodrisk
Refers to forest designated for floodcontrol purposes.
Estimation for 2015 is assumed to be thesame as 2012.
Other protective functions n.a n.a
Ecosystem services, cultural or spiritualvalues
N/A N/A
Public recreation Refers to forest designated for amenitypurposes.
N/A
Carbon storage or sequestration n.a n.a
Spiritual or cultural services n.a n.a
Other ecosystem services Refers to Protection PRF (forest sanctuaryfor wildlife, virgin jungle reserved forest,forest for federal purposes, state park aswell as wildlife reserve) and NationalParks & Wildlife & Bird Sanctuary.
Estimation for 2015 is assumed to be thesame as 2012.
Other general comments to the table
Response to reviewer's query to Table 5a: The FRIMS system does not accepted N/A.

FRA 2015 – Country Report, Malaysia
49
6. How much forest area is protected and designated for the conservation of biodiversityand how has it changed over time?Documents for this question:
• Guide for country reporting FRA 2015• FRA 2015 Terms and Definitions
6.1 Categories and definitions
Category Definition
Conservation ofbiodiversity
Forest area designated primarily for conservation of biological diversity. Includes but is not limited toareas designated for biodiversity conservation within the protected areas.
Forest area withinprotected areas
Forest area within formally established protected areas independently of the purpose for which theprotected areas were established.
6.2 National data
6.2.1 Data sources
References to sourcesof information
Variables Years Additional comments
1 Forestry Department OfPeninsular Malaysia. AnnualReport
Forest categories. 1990-2012 Statistical informationcovering National Park,Wildlife and Bird Sanctuaryin Peninsular Malaysia.
2 Forestry Department OfPeninsular Malaysia.Statistics Report
Forest categories. 1990-2012 Statistical informationcovering National Park,Wildlife and Bird Sanctuaryin Peninsular Malaysia.
3 Sabah Forestry Department Forest categories. 1990-2012 Statistical informationcovering National Park,Wildlife and Bird Sanctuaryin Sabah.
4 Sarawak Forest Department Forest categories. 1990-2012 Statistical informationcovering National Park,Nature Reserve & WildlifeSanctuary in Sarawak.
5 Department of Wildlife andNational Parks PeninsularMalaysia. Compendium
Forest categories. 1990-2012 Statistical informationcovering National Park,Wildlife and Bird Sanctuaryin Peninsular Malaysia.
6 FRA 2010 Pre-filled data 2010 N/A
6.2.2 Classification and definitions
National class Definition
- Permanent Reserved Forest Land administered under:- • National Forestry Act, 1984(Peninsular Malaysia); • Forest Ordinance Cap. 126 (1958Edition) (Sarawak); • Forest Enactment,1968 (Sabah).

FRA 2015 – Country Report, Malaysia
50
National Park Land administered under:- • National Parks Act, 1980(Peninsular Malaysia); • Taman Negara Enactment (Kelantan),1938 • Taman Negara Enactment (Pahang), 1939 • TamanNegara Enactment (Terengganu), 1939 • National ParkCorporation Enactment (Johore) 1989; • State Park CorporationEnactment (Perak) 2003; • National Parks and Nature ReservesOrdinance Cap. 27, 1998 (Sarawak); • Parks Enactment,1984(Sabah).
Wildlife & Bird Sanctuary Land administered under:- • Wildlife Conservation Act, 2010(Peninsular Malaysia); • Wildlife Protection Ordinance Cap.26, 1998 (Sarawak); • Wildlife Conservation Enactment, 1997(Sabah).
- Stateland Forest - Alienated Land - Plantation Land - Urbanareas
Land administered under:- • National Land Code & StatelandRules, 1965 (Peninsular Malaysia); • Land Code Cap 81, 1958Edition (Sarawak) • Land Ordinance Cap. 68, 1930 (Sabah).
6.2.3 Original data
Similar to table 4.2.3.
Forest 1990 2000 2005 2010 2011 2012
ProductionForest in'000ha
- PRF 9,900 11,490 10,590 11,519 11,614 11,321
- Rubberplantation
1,836 1,431 1,229 1,020 1,023 1,042
Protectionin '000ha
- PRF 2,700 2,910 3,810 3,008 2,905 3,182
- NationalPark &wildlife& birdsantuary
1,120 1,120 1,120 1,859 1,859 1,859
Multiplepurposein'000ha
- StatelandForest
6,820 4,640 4,141 4,718 4,630 4,656

FRA 2015 – Country Report, Malaysia
51
TotalForest in'000ha
22,376 21,591 20,890 22,124 22,031 22,060
6.3 Analysis and processing of national data
6.3.1 Adjustment
Figures for 2010 have been adjusted based on actual data available.
6.3.2 Estimation and forecasting
Similar to table 4.3.2
Forest 1990 2000 2005 2010 2011 2012 2015
ProductionForestin'000ha
- PRF 9,900 11,490 10,590 11,519 11,614 11,321 11,321
-Rubberplantation
1,836 1,431 1,229 1,020 1,023 1,042 1,098
Protectionin'000ha
- PRF 2,700 2,910 3,810 3,008 2,905 3,182 3,182
-NationalPark &wildlife& birdsanctuary
1,120 1,120 1,120 1,859 1,859 1,859 1,859
Multiplepurposein'000ha

FRA 2015 – Country Report, Malaysia
52
-StatelandForest
6,820 4,640 4,141 4,718 4,630 4,656 4,735
TotalForestin'000ha
22,376 21,591 20,890 22,124 22,031 22,060 22,195
The figures for Permanent Reserved Forest and National Parks 1990, 2000, 2005, 2010, 2011 and2012 are available, while figures
for 2012 have been assumed for 2015.
6.3.3 Reclassification
N/A
6.4 DataTable 6
Forest area (000 hectares)Categories
1990 2000 2005 2010 2015
Conservation ofbiodiversity
1120 1120 1120 1859 1859
Forest areawithin protectedareas
3820 4030 4930 4867 5041
Tiers
Category Tier for status Tier for reported trend
Conservation of biodiversity Tier 3 Tier 3
Forest area within protected areas Tier 3 Tier 3
Tier criteria
Category Tier for status Tier for reported trend

FRA 2015 – Country Report, Malaysia
53
• Conservation of biodiversity• Forests within protected areas
Tier 3: Data obtained from national orstate agencies responsible for conservationand protected area or legislation relatingto area protection. Tier 2: Studies thatprovide data for specific areas that isextrapolated through statistical analysis tonational level estimates Tier 1 Other
Tier 3 : Estimate based on repeatedcompatible tiers 3 (tier for status) Tier 2 :Estimate based on repeated compatible tier2 or combination tier 3 and 2 or 1 (tier forstatus) Tier 1 : Other
6.5 Comments
CategoryComments related todata definitions etc
Comments on the reported trend
Conservation of biodiversity Does not include forest gazetted forconservation of biodiversity withinthe PRFs. Areas for conservation ofbiodiversity include national parks,wildlife reserves and Totally ProtectedAreas (TPA) of Sarawak which are locatedoutside PRF. These areas are under thepurview of Department of Wildlife andNational Parks of Peninsular Malaysia,Sabah Wildlife Department and SarawakForest Deaprtment. The figure for 2010has been updated based on latest availabledata, while figure for 2012 has beenassumed for 2015
Forest areas designated for conservationof biodiversity are expected to remainconstant in the near future.
Forest area within protected areas Includes forest areas designated for: a.protection of soil and water; b. ecosystemservices
The figures for forest area withinprotected areas increases slightly since2010 due to increase in area for protectionof soil and water.
Other general comments to the table
N/A

FRA 2015 – Country Report, Malaysia
54
7. What is the area of forest affected by woody invasive species?Documents for this question:
• Guide for country reporting FRA 2015• FRA 2015 Terms and Definitions
7.1 Categories and definitions
Category Definition
Invasive species Species that are non-native to a particular ecosystem and whose introduction and spread cause, or arelikely to cause, socio-cultural, economic or environmental harm or harm to human health.
7.2 National data
7.2.1 Data sources
References to sourcesof information
Variables Years Additional comments
1 N/A N/A N/A N/A
2 N/A N/A N/A N/A
3 N/A N/A N/A N/A
4 N/A N/A N/A N/A
7.2.2 Classification and definitions
National class Definition
N/A N/A
N/A N/A
N/A N/A
N/A N/A
7.2.3 Original data
N/A
7.3 Analysis and processing of national data
FRA 2015 – Country Report, Malaysia
55
7.3.1 Adjustment
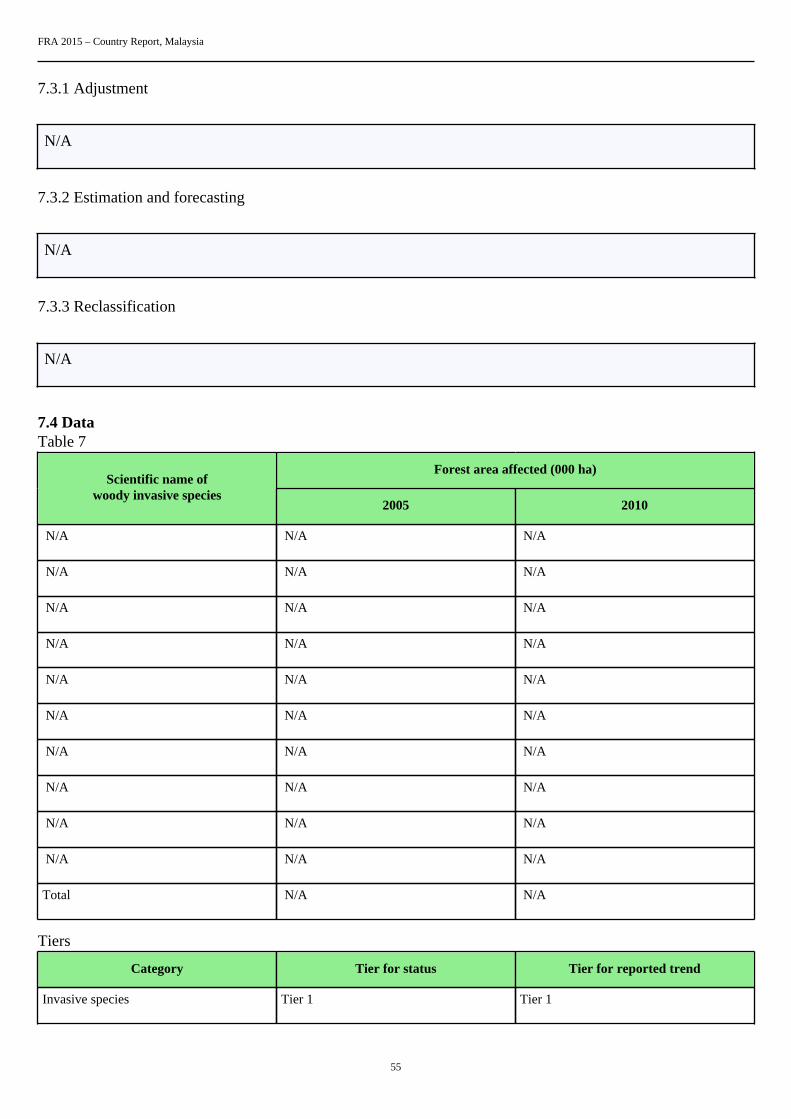
N/A
7.3.2 Estimation and forecasting
N/A
7.3.3 Reclassification
N/A
7.4 DataTable 7
Forest area affected (000 ha)Scientific name of
woody invasive species2005 2010
N/A N/A N/A
N/A N/A N/A
N/A N/A N/A
N/A N/A N/A
N/A N/A N/A
N/A N/A N/A
N/A N/A N/A
N/A N/A N/A
N/A N/A N/A
N/A N/A N/A
Total N/A N/A
Tiers
Category Tier for status Tier for reported trend
Invasive species Tier 1 Tier 1

FRA 2015 – Country Report, Malaysia
56
Tier Criteria
Category Tier for status Tier for reported trend
Invasive species Tier 3: Systematic assessment in forestinventory or other survey (e.g. byconservation department) within the last5 years) Tier 2: Systematic assessment inforest inventory or other survey (e.g. byconservation department conducted morethan 5 years ago) Tier 1: Other
Tier 3 : Estimate based on repeatedcompatible tiers 3 (tier for status) Tier 2 :Estimate based on repeated compatible tier2 or combination tier 3 and 2 or 1 (tier forstatus) Tier 1 : Other
7.5 Comments
CategoryComments related todata definitions etc
Comments on the reported trend
Invasive species N/A N/A
Other general comments to the table
N/A

FRA 2015 – Country Report, Malaysia
57
8. How much forest area is damaged each year?Documents for this question:
• Guide for country reporting FRA 2015• FRA 2015 Terms and Definitions
8.1 Categories and definitions
Category Definition
Number of fires Number of fires per year
Burned area Area burned per year
Outbreaks of insects A detectable reduction in forest health caused by a sudden increase in numbers of harmful insects.
Outbreaks of diseases A detectable reduction in forest health caused by a sudden increase in numbers of harmful pathogens,such as bacteria, fungi, phytoplasma or virus.
Severe weather events Damage caused severe weather events, such as snow, storm, drought, etc.
8.2 National data
8.2.1 Data sources
References to sourcesof information
Variables Years Additional comments
1 Forestry Department ofPeninsular Malaysia
Area affected by fire. 2003 – 2012 N/A
2 Sabah Forestry Department Area affected by fire. 2003 – 2012 N/A
3 Sarawak Forest Department Area affected by fire. 2003 – 2012 N/A
4 N/A N/A N/A N/A
8.2.2 Classification and definitions
National class Definition
Forest fire Fire occurrences in forest area.
N/A N/A
N/A N/A
N/A N/A

FRA 2015 – Country Report, Malaysia
58
8.2.3 Original data
Refer Table 8a & 8b.
8.3 Analysis and processing of national data
8.3.1 Adjustment
N/A
8.3.2 Estimation and forecasting
N/A
8.3.3 Reclassification
N/A
8.4 DataTable 8a
000 ha, number of fires
2003 2004 2005 2006 2007Category
000 ha # 000 ha # 000 ha # 000 ha # 000 ha #
Totalland areaburned
1.32 0 1.3 0 2.23 0 1.33 0 1.35 0
... ofwhichforestareaburned
1.32 0 1.3 0 2.23 0 1.33 0 1.35 0
2008 2009 2010 2011 2012Category
000 ha # 000 ha # 000 ha # 000 ha # 000 ha #
Totalland areaburned
0.06 2 1.54 25 2.48 44 0.01 6 0.45 10

FRA 2015 – Country Report, Malaysia
59
... ofwhichforestareaburned
0.06 2 1.54 25 2.48 44 0.01 6 0.45 10
Table 8b
Outbreak category Description/name Year(s) of latest outbreak Area damaged (000 hectares)
N/A N/A N/A N/A
N/A N/A N/A N/A
N/A N/A N/A N/A
N/A N/A N/A N/A
N/A N/A N/A N/A
N/A N/A N/A N/A
N/A N/A N/A N/A
N/A N/A N/A N/A
N/A N/A N/A N/A
N/A N/A N/A N/A
Outbreak category
1 Insects
2 Diseases
3 Severe weather events
Tiers
Category Tier for status Tier for trend
Area affected by fire Tier 3 Tier 3
• Insects• Diseases• Severe weather events
Tier 1 Tier 1
Tier criteria
Category Tier for status Tier for reported trend

FRA 2015 – Country Report, Malaysia
60
Burned area Tier 3 : National fire monitoring routinesTier 2 : Remote sensing surveys Tier 1 :Other
Tier 3 : Estimate based on repeatedcompatible tiers 3 (tier for status) Tier 2 :Estimate based on repeated compatible tier2 or combination tier 3 and 2 or 1 (tier forstatus) Tier 1 : Other
• Insects• Diseases• Severe weather events
Tier 3 : Systematic survey (e.g. viainventory or aerial damage assessment)Tier 2 : Management records Tier 1 :Other
Tier 3 : Estimate based on repeatedcompatible tiers 3 (tier for status) Tier 2 :Estimate based on repeated compatible tier2 or combination tier 3 and 2 or 1 (tier forstatus) Tier 1 : Other
8.5 Comments
CategoryComments related todata definitions etc
Comments on the reported trend
Burned area Data obtained from field monitoringreport.
Fire incidences mainly occured inpeatswamp forest.
Insects n.a n.a
Diseases n.a n.a
Severe weather events n.a n.a
Other general comments to the table
Response to reviewer's query to Table 8a: The figures for Table 8a were derived from national sources.

FRA 2015 – Country Report, Malaysia
61
9. What is the forest area with reduced canopy cover?Documents for this question:
• Guide for country reporting FRA 2015• FRA 2015 Terms and Definitions
Category Definition
Reduction in canopycover
Forest that has undergone a reduction of canopy cover of more than 20% between the years 2000 and2010 within the forest canopy cover range of 30-80% as detected by the MODIS VCF sensor.
Table 9
Category Area of forest with reduced canopy cover (000 ha)
Reduction in canopycover
5758.73
Tiers
Category Tier for reported trend
Reduction in canopycover
Tier 2
Tier criteria
Category Tier for reported trend
Reduction in canopycover
Tier 3 : Remote sensing with ground truthing and/or Landsat imagery Tier 2 : Remote sensing usingModis (using pre-filled data provided by FAO) Tier 1 : Expert opinion
Comments
Category Comments related to data definitions etc
Reduction in canopycover
Pre-filled data provided by FAOSTAT.
Other general comments

FRA 2015 – Country Report, Malaysia
62
10. What forest policy and regulatory framework exists to support implementation ofsustainable forest management SFM?Documents for this question:
• Guide for country reporting FRA 2015• FRA 2015 Terms and Definitions
10.1 Categories and definitions
Category Definition
Policies supportingsustainable forestmanagement
Policies or strategies that explicitly encourage sustainable forest management.
Legislation andregulations supportingsustainable forestmanagement
Legislation and regulations that govern and guide sustainable forest management, operations and use.
10.2 National data
10.2.1 Data sources
References to sourcesof information
Variables Years Additional comments
1 Forestry DepartmentPeninsular Malaysia
Forest policies, forestlegislation and regulations forPeninsular Malaysia
1978/ 1984 N/A
2 Sabah Forestry Department Forest policies, forestlegislation and regulations forSarawak
1930/ 1954/ 1968/ 1984/1997
N/A
3 Sarawak Forest Department Forest policies, forestlegislation and regulations forSarawak
1954/ 1958/ 1962/ 1997/1998
N/A
4 N/A N/A N/A N/A
10.2.2 Classification and definitions
National class Definition
Policies supporting sustainable forest management 1. National Forestry Policy, 1978 (revised 1992); 2. Statement ofForest Policy 1954, Sabah; 3. State Forest Policy 1954, Sarawak;4. National Policy on Biological Diversity, 1998.
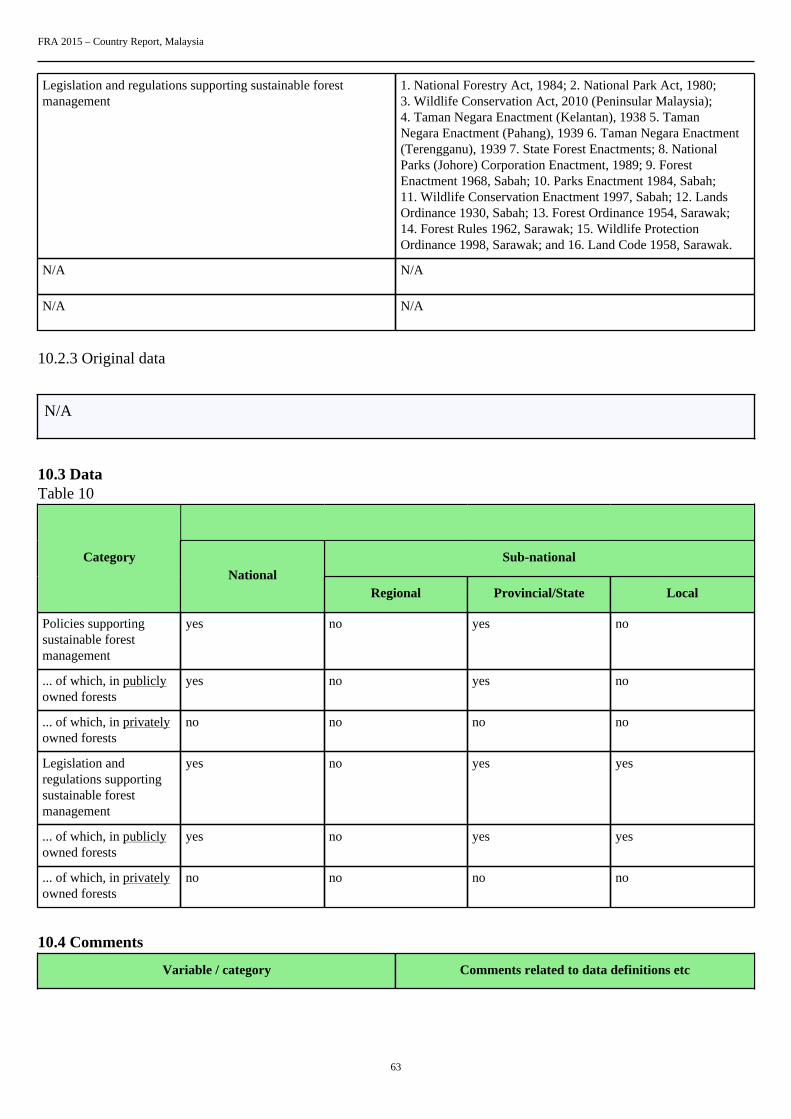
FRA 2015 – Country Report, Malaysia
63
Legislation and regulations supporting sustainable forestmanagement
1. National Forestry Act, 1984; 2. National Park Act, 1980;3. Wildlife Conservation Act, 2010 (Peninsular Malaysia);4. Taman Negara Enactment (Kelantan), 1938 5. TamanNegara Enactment (Pahang), 1939 6. Taman Negara Enactment(Terengganu), 1939 7. State Forest Enactments; 8. NationalParks (Johore) Corporation Enactment, 1989; 9. ForestEnactment 1968, Sabah; 10. Parks Enactment 1984, Sabah;11. Wildlife Conservation Enactment 1997, Sabah; 12. LandsOrdinance 1930, Sabah; 13. Forest Ordinance 1954, Sarawak;14. Forest Rules 1962, Sarawak; 15. Wildlife ProtectionOrdinance 1998, Sarawak; and 16. Land Code 1958, Sarawak.
N/A N/A
N/A N/A
10.2.3 Original data
N/A
10.3 DataTable 10
Sub-nationalCategoryNational
Regional Provincial/State Local
Policies supportingsustainable forestmanagement
yes no yes no
... of which, in publiclyowned forests
yes no yes no
... of which, in privatelyowned forests
no no no no
Legislation andregulations supportingsustainable forestmanagement
yes no yes yes
... of which, in publiclyowned forests
yes no yes yes
... of which, in privatelyowned forests
no no no no
10.4 Comments
Variable / category Comments related to data definitions etc

FRA 2015 – Country Report, Malaysia
64
Policies supporting sustainable forest management All Permanent Reserved Forests (PRFs) are managed undersustainable forest management principle. National ForestryPolicy 1978 (Revised 1992) is currently being reviewed.
Legislation and regulations supporting sustainable forestmanagement
The National Forestry Act 1984 is currently being reviewed.
Other general comments

FRA 2015 – Country Report, Malaysia
65
11. Is there a national platform that promotes stakeholder participation in forest policydevelopment?Documents for this question:
• Guide for country reporting FRA 2015• FRA 2015 Terms and Definitions
11.1 Categories and definitions
Category Definition
National stakeholderplatform
A recognized procedure that a broad range of stakeholders can use to provide opinions, suggestions,analysis, recommendations and other input into the development of national forest policy.
11.2 National data
11.2.1 Data sources
References to sources of information Years Additional comments
1 MC&I (2002) 2002 N/A
2 An outlook of the Malaysian ForestrySector in 2020
2008 N/A
3 N/A N/A N/A
4 N/A N/A N/A
Table 11Is there a national platform that promotes or allows forstakeholder participation in forest policy development?
yes
11.3 Comments
Category Comments related to data definitions etc

FRA 2015 – Country Report, Malaysia
66
National stakeholder platform Stakeholder participation in SFM is carried out through thevarious committees that have been established as follows:- •National Level i. National Land Council chaired by DeputyPrime Minister. Council members include all the State ChiefMinisters, the Minister of Natural Resources and Environment,and other Federal Ministers whose portfolios have an impacton the forestry sector, such as finance; trade; agriculture andagro-based industry; plantation industries and commodities;and science, technology and innovations; and heads of theforestry services of Peninsular Malaysia, Sabah and Sarawak.This council discusses and makes decisions on land andforestry issues including matters on indigenous and/or localcommunities ; and ii. FDPM - Department of Orang AsliDevelopment (JAKOA) Committee jointly chaired by DirectorGeneral of FDPM and JAKOA. Committee members comprisedof all Directors of State Forestry Department and Directors ofState Department of Orang Asli Development. This committeediscusses issues pertaining to the involvement of indigenouspeoples in achieving sustainable forest management (SFM). iii.National Steering Committee on REDD chaired by SecretaryGeneral, Ministry of Natural Resources and Environment,with members comprised of representatives from Ministry ofPlantation Industries and Commodities, Ministry of Finance,Ministry of Agriculture, FDPM, Sabah Forestry Department,Sarawak Forest Department, Department of Wildlife and NaturalParks, Forest Research Institute Malaysia, Malaysian RemoteSensing Agency, State Economic Planning Unit, and FederalEconomic Planning Unit. iv. National Technical Committeeon REDD chaired by Deputy Secretary General, Ministry ofNatural Resources and Environment, with members comprisedof representatives from Ministry of Plantation Industries andCommodities, Ministry of Finance, Ministry of Agriculture,FDPM, Sabah Forestry Department, Sarawak Forest Department,Department of Wildlife and Natural Parks, Forest ResearchInstitute Malaysia, Malaysian Remote Sensing Agency, StateEconomic Planning Unit, and Federal Economic Planning Unit.v. Annual Trilateral Ministerial Meeting on Heart of Borneochaired by Minister of Natural Resources and Environmentof Malaysia, Indonesia and Brunei by rotation. Memberscomprised of representatives from relevent agencies relatedto natural resources and environment. vi. National SteeringCommittee On Implementation of Central Forest Spine (CFS)chaired by Secretary General, Ministry of Natural Resourcesand Environment, with members comprised of representativesfrom FDPM, Forest Research Institute Malaysia, Departmentof Wildlife and Natural Parks, Department of Drainage andIrrigation, Department of Environment, Department of Town andCountry Planning, State Economic Planning Unit and FederalEconomic Planning Unit. vii. National Technical CommitteeOn Implementation of CFS chaired by Director General FDPM,with members comprised of representatives from FDPM, ForestResearch Institute Malaysia, Department of Wildlife and NaturalParks, Department of Drainage and Irrigation, Department ofEnvironment, Department of Town and Country Planning, StateEconomic Planning Unit and Federal Economic Planning Unit.viii. Steering Committee On Planting of Mangrove Speciesand Other Suitable Species On National Coastal Areas chairedby Secretary General, Ministry of Natural Resources andEnvironment. Members comprised of representatives fromMinistry of Natural Resources and Environment, FDPM, StateForestry Departments, Forest Research Institute Malaysia,
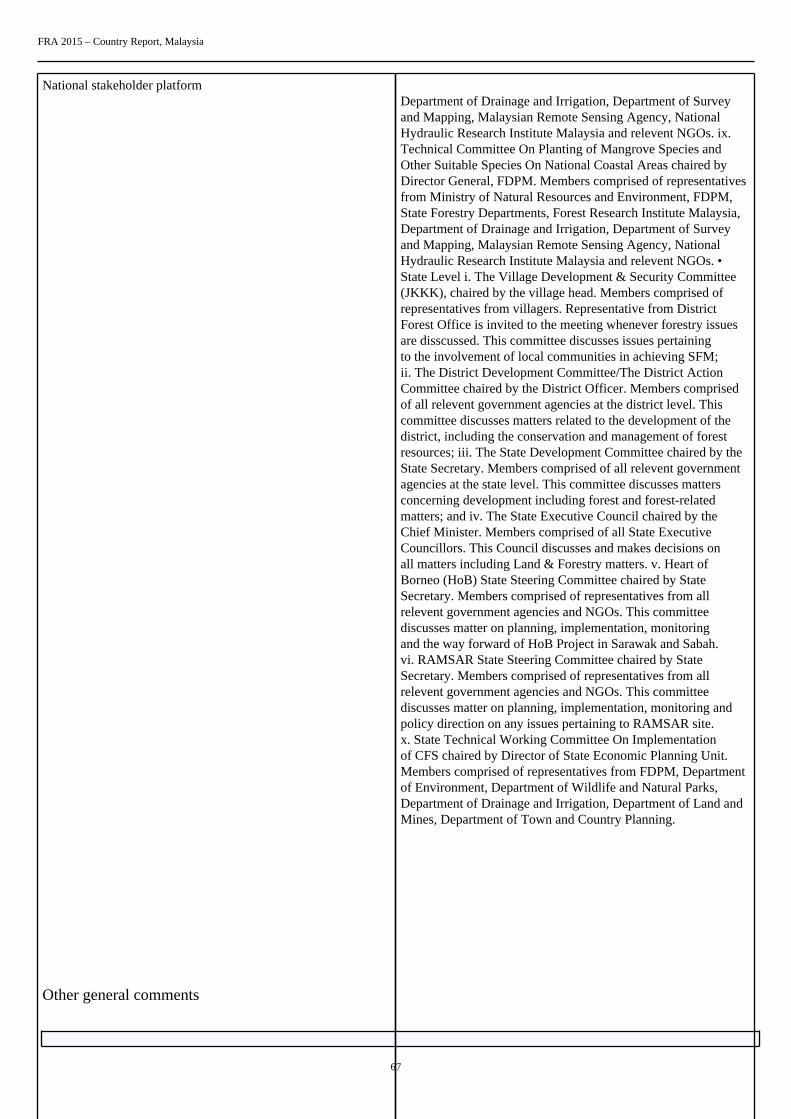
FRA 2015 – Country Report, Malaysia
67
Other general comments
National stakeholder platformDepartment of Drainage and Irrigation, Department of Surveyand Mapping, Malaysian Remote Sensing Agency, NationalHydraulic Research Institute Malaysia and relevent NGOs. ix.Technical Committee On Planting of Mangrove Species andOther Suitable Species On National Coastal Areas chaired byDirector General, FDPM. Members comprised of representativesfrom Ministry of Natural Resources and Environment, FDPM,State Forestry Departments, Forest Research Institute Malaysia,Department of Drainage and Irrigation, Department of Surveyand Mapping, Malaysian Remote Sensing Agency, NationalHydraulic Research Institute Malaysia and relevent NGOs. •State Level i. The Village Development & Security Committee(JKKK), chaired by the village head. Members comprised ofrepresentatives from villagers. Representative from DistrictForest Office is invited to the meeting whenever forestry issuesare disscussed. This committee discusses issues pertainingto the involvement of local communities in achieving SFM;ii. The District Development Committee/The District ActionCommittee chaired by the District Officer. Members comprisedof all relevent government agencies at the district level. Thiscommittee discusses matters related to the development of thedistrict, including the conservation and management of forestresources; iii. The State Development Committee chaired by theState Secretary. Members comprised of all relevent governmentagencies at the state level. This committee discusses mattersconcerning development including forest and forest-relatedmatters; and iv. The State Executive Council chaired by theChief Minister. Members comprised of all State ExecutiveCouncillors. This Council discusses and makes decisions onall matters including Land & Forestry matters. v. Heart ofBorneo (HoB) State Steering Committee chaired by StateSecretary. Members comprised of representatives from allrelevent government agencies and NGOs. This committeediscusses matter on planning, implementation, monitoringand the way forward of HoB Project in Sarawak and Sabah.vi. RAMSAR State Steering Committee chaired by StateSecretary. Members comprised of representatives from allrelevent government agencies and NGOs. This committeediscusses matter on planning, implementation, monitoring andpolicy direction on any issues pertaining to RAMSAR site.x. State Technical Working Committee On Implementationof CFS chaired by Director of State Economic Planning Unit.Members comprised of representatives from FDPM, Departmentof Environment, Department of Wildlife and Natural Parks,Department of Drainage and Irrigation, Department of Land andMines, Department of Town and Country Planning.

FRA 2015 – Country Report, Malaysia
68
12. What is the forest area intended to be in permanent forest land use and how has itchanged over time?Documents for this question:
• Guide for country reporting FRA 2015• FRA 2015 Terms and Definitions
12.1 Categories and definitions
Category Definition
Forest area intended to bein permanent forest landuse
Forest area that is designated or expected to be retained as forest and is highly unlikely to be convertedto other land use.
...of which permanentforest estate (sub-category)
Forest area that is designated by law or regulation to be retained as forest and may not be converted toother land use.
12.2 National data
12.2.1 Data sources
References to sourcesof information
Variables Years Additional comments
1 Forestry Department OfPeninsular Malaysia. AnnualReport
Forest categories. 1990-2012 Statistical informationcovering forest area managedunder SFM.
2 Forestry Department OfPeninsular Malaysia.Statistics Report
Forest categories. 1990-2012 Statistical informationcovering forest area managedunder SFM.
3 Sabah Forestry Department Forest categories. 1990-2012 Statistical informationcovering forest area managedunder SFM.
4 Sarawak Forest Department Forest categories. 1990-2012 Statistical informationcovering forest area managedunder SFM.
5 Department of Wildlife andNational Parks PeninsularMalaysia
Forest categories. 1990-2012 Statistical informationcovering National Park,Wildlife and Bird Sanctuaryin Peninsular Malaysia.
6 FRA 2010 Pre-filled data. N/A N/A
12.2.2 Classification and definitions
National class Definition
Permanent Reserved Forest Land administered under:- • National Forestry Act, 1984(Peninsular Malaysia); • Forest Ordinance Cap. 126 (1958Edition) (Sarawak); • Forest Enactment,1968 (Sabah).

FRA 2015 – Country Report, Malaysia
69
National Park Land administered under:- • National Parks Act, 1980(Peninsular Malaysia); • Taman Negara Enactment (Kelantan),1938 • Taman Negara Enactment (Pahang), 1939 • TamanNegara Enactment (Terengganu), 1939 • National ParkCorporation Enactment (Johore) 1989; • State Park CorporationEnactment (Perak) 2003; • National Parks and Nature ReservesOrdinance Cap. 27, 1998 (Sarawak); • Parks Enactment,1984(Sabah).
Wildlife & Bird Sanctuary Land administered under:- • Wildlife Conservation Act, 2010(Peninsular Malaysia); • Wildlife Protection Ordinance Cap.26, 1998 (Sarawak); • Wildlife Conservation Enactment, 1997(Sabah).
- Stateland Forest - Alienated Land - Plantation Land - Urbanareas
• National Land Code & Stateland Rules, 1965 (PeninsularMalaysia); • Land Code Cap 81, 1958 Edition (Sarawak) • LandOrdinance Cap. 68, 1930 (Sabah).
12.2.3 Original data
(Similar to table 4.2.3)
Forest 1990 2000 2005 2007 2010 2011 2012
ProductionForest in'000ha
- PRF 9,900 11,490 10,590 11,607 11,519 11,614 11,321
- Rubberplantation
1,836 1,431 1,229 1,207 1,020 1,023 1,042
Protectionin '000ha
- PRF 2,700 2,910 3,810 2,694 3,008 2,905 3,182
- NationalPark &wildlife& birdsantuary
1,120 1,120 1,120 1,946 1,859 1,859 1,859
Multiplepurposein'000ha
-StatelandForest
6,820 4,640 4,141 3,416 4,718 4,630 4,656

FRA 2015 – Country Report, Malaysia
70
TotalForest in'000ha
22,376 21,591 20,890 20,870 22,124 22,031 22,060
12.3 Analysis and processing of national data
12.3.1 Adjustment
Figures for 2010 have been adjusted based on actual data available.
12.3.2 Estimation and forecasting
The figures for Permanent Reserved Forest and National Parks for 1990, 2000, 2005, 2010, 2011 and 2012 areavailable, while figure for 2012 has been assumed for 2015. The figure for 2015 for Stateland Forest has beenforecasted as 4,735 (‘000ha) using linear trend (Stateland Forest, y=26x – 47,656).
The figure for 2015 for Rubber Plantation has been forecasted as 1,098 (‘000ha) using linear trend(RubberPlantation, y=19x – 37,186 ).
(Similar to table 4.3.2)
Forest 1990 2000 2005 2010 2011 2012 2015
ProductionForestin'000ha
-PRF
9,900 11,490 10,590 11,519 11,614 11,321 11,321
-Rubberplantation
1,836 1,431 1,229 1,020 1,023 1,042 1,098
Protectionin'000ha
-PRF
2,700 2,910 3,810 3,008 2,905 3,182 3,182

FRA 2015 – Country Report, Malaysia
71
-NationalPark&wildlife&birdsantuary
1,120 1,120 1,120 1,859 1,859 1,859 1,859
Multiplepurposein'000ha
-StatelandForest
6,820 4,640 4,141 4,718 4,630 4,656 4,735
TotalForestin'000ha
22,376 21,591 20,890 22,124 22,031 22,060 22,195
12.3.3 Reclassification
N/A
12.4 DataTable 12
Categories Forest area 2010 (000 ha)
Forest area intended to be in permanentforest land use
16386
... of which permanent forest estate 14526
Tiers
Category Tier for status
Forest area intended to be in permanent forest land use Tier 3
Permanent forest estate Tier 3
Tier Criteria
Category Tier for status

FRA 2015 – Country Report, Malaysia
72
Forest area intended to be in permanent forest land use Tier 3 : National or sub-national land use plans strategydocuments or other reports within the past 10 years Tier 2 :National or sub-national land use plans strategy documents orother reports within the past 20 years Tier 1 : Other
Permanent forest estate Tier 3 : National or sub-national land use plans strategydocuments or other reports within the past 10 years Tier 2 :National or sub-national land use plans strategy documents orother reports within the past 20 years Tier 1 : Other
12.5 Comments
Category Comments related to data definitions etc
Forest area intended to be in permanent forest land use Forest area intended to be in permanent forest land use includesPRFs and National Park & Wildlife & Bird Sanctuary.
Permanent forest estate Permanent forest estates / Permanent Reserved Forests(PRFs) are managed in perpetuity based on sustainable forestmanagement principle in accordance with the definitions ofInternational Tropical Timber Organizations (ITTO).
Other general comments
Response to reviewer's query to Table 12: The figure has been amended to include National Park & Wildlife& Bird Sanctuary.

FRA 2015 – Country Report, Malaysia
73
13. How does your country measure and report progress towards SFM at the nationallevel?Documents for this question:
• Guide for country reporting FRA 2015• FRA 2015 Terms and Definitions
13.1 Categories and definitions
Category Definition
Forest area monitoredunder a national forestmonitoring framework
Forest area monitored by a national monitoring framework or systems that provide measurement basedperiodic monitoring of forest extent and quality.
Forest reporting atnational scale
National reporting of forest extent and characteristics that includes some measure of progress towardsustainable forest management.
13.2 National data
13.2.1 Data sources
References to sourcesof information
Variables Years Additional comments
1 Forestry Department ofPeninsular Malaysia AnnualReport.
Forest categories and forestextent.
2010-2012 N/A
2 Forestry Department ofPeninsular Malaysia Statistics
Forest categories, forestextent, Annual AllowableCut, silviculture treatment.
2010-2012 N/A
3 Forestry Departmentof Peninsular MalaysiaGeographic InformationSystem (GIS).
Remote sensing and GISdata.
2009-2012 N/A
4 Forest ManagementCertification.
Compliance to MC&I. 2002-2012 N/A
5 Sabah Forestry Department Forest categories, forestextent, Annual AllowableCut, silviculture treatment.
2010-2012 N/A
6 Sarawak Forest Department Forest categories, forestextent, Annual AllowableCut, silviculture treatment.
2010-2012 N/A
13.2.2 Classification and definitions
National class Definition
Extent of Forest Status of forest area
Silviculture Treatment Cutting of Lianas, Enrichment Planting, (refer to silviculturetreatment)

FRA 2015 – Country Report, Malaysia
74
Forest Harvesting Forest Harvesting Plan, Monitoring of Forest HarvestingAccording to Annual Allowable Coupe.
Forest Plantation Establishment Status of Forest Plantation Establishment.
13.3 DataTable 13a
Check all boxes that apply
Category% of totalforest area
Mostrecent year
Continuous PeriodicPermanent
groundplots
Temporaryground
plots
Aerial/remotesensingsamplebased
Aerial/remote
sensing fullcoverage
Forestinventory
100 2012 yes yes yes yes yes yes
Other fieldassessments
0.25 2012 no yes no yes no no
Updatesto othersources
N/A N/A no no
Expertestimate
N/A N/A
Table 13b
Type of forest reporting used at national scale Check boxes that apply
1 Criteria and Indicators reporting yes
2 Periodic national state of the forest report yes
3 Other (please document) yes
4 None yes
Other type of forest reporting
• Annual Allowable Coupe – quarterly report • Status of Planting Stock – quarterly report • Status of Silviculture Treatment– quarterly report • Status of Plantation Establishment – quarterly report • ITTO report on achievement of SFM – biannually •Compliance Report to Annual Work Plan – annually (Sabah)
13.4 Comments
Category Comments
Forest Inventory Remote sensing imageries are used to verify strata of selectedinventory plots.
N/A N/A

FRA 2015 – Country Report, Malaysia
75
N/A N/A
Other general comments

FRA 2015 – Country Report, Malaysia
76
14. What is the area of forest under a forest management plan and how is this monitored?Documents for this question:
• Guide for country reporting FRA 2015• FRA 2015 Terms and Definitions
14.1 Categories and definitions
Category Definition
Forest area withmanagement plan
Forest area that has a long-term documented management plan, aiming at defined management goalswhich is periodically revised
...of which for production(sub-category)
Forest management plan mainly focused on production
...of which forconservation (sub-category)
Forest management plan mainly focused on conservation
Monitoring of forestmanagement plans
Government monitoring of forest management plan implementation conducted through field visits oraudits of forest management plan performance
14.2 National data
14.2.1 Data sources
References to sourcesof information
Variables Years Additional comments
1 Forestry Department OfPeninsular Malaysia. AnnualReport
Forest categories. 1990-2012 Statistical informationcovering PRF as well asNational Park, Wildlife andBird Sanctuary in PeninsularMalaysia.
2 Forestry Department OfPeninsular Malaysia.Statistics Report
Forest categories. 1990-2012 Statistical informationcovering PRF as well asNational Park, Wildlife andBird Sanctuary in PeninsularMalaysia.
3 Sabah Forestry Department Forest categories. 1990-2012 Statistical informationcovering PRF as well asNational Park, Wildlife andBird Sanctuary in Sabah.
4 Sarawak Forest Department Forest categories. 1990-2012 Statistical informationcovering PRF as well asNational Park, Wildlife andBird Sanctuary in Sarawak.
5 Department of Wildlife andNational Parks PeninsularMalaysia
Forest categories. 1990-2012 Statistical informationcovering National Park,Wildlife and Bird Sanctuaryin Peninsular Malaysia.
6 FRA 2010 Pre-filled data N/A N/A
14.3 Data

FRA 2015 – Country Report, Malaysia
77
Table 14a
Forest plan type Forest area 2010 (000 ha)
Forest area with management plan 13394
... of which for production 9637
... of which for conservation 3757
Table 14b
Indicate which (if any) of the following are required in forest management plans in your country
1 Soil and water management yes
2 High conservation value forest delineation yes
3 Social considerations community involvement yes
Table 14c
Percent of area under forest management plan that is monitored annually 100
Tiers
Category Tier for status
Forest area with management plan Tier 3
Percent of area under forest management plan that is monitoredannually
Tier 3
Tier criteria
Category Tier for status
Forest area with management plan Tier 3 : Reports that describe national records 5 years old or lessthat contain long-term forest monitoring plans Tier 2 : Industryor other records indicating the presence of a long-term forestmanagement plan Tier 1 : Other
Percent of area under forest management plan that is monitoredannually
Tier 3 : Government documentation of monitoring extent Tier 2: Reports from forest managers or other documental sources Tier1 : Other
14.4 Comments
Category Comments
Forest area with management plan Forest area with management plan includes production forestin PRF, protection forest in PRF as well as National Park &Wildlife & Bird Sanctuary.
Percent of area under forest management plan that is monitoredannually
All forest areas under forest management plan are monitoredannually through aerial surveillance, remote sensing, fieldinspection and quarterly progress report.

FRA 2015 – Country Report, Malaysia
78
N/A N/A
Other general comments
Response to reviewer's query to Table 14c: Yes. All forest area under management plan is monitored by therespective State Forestry Departments every year.
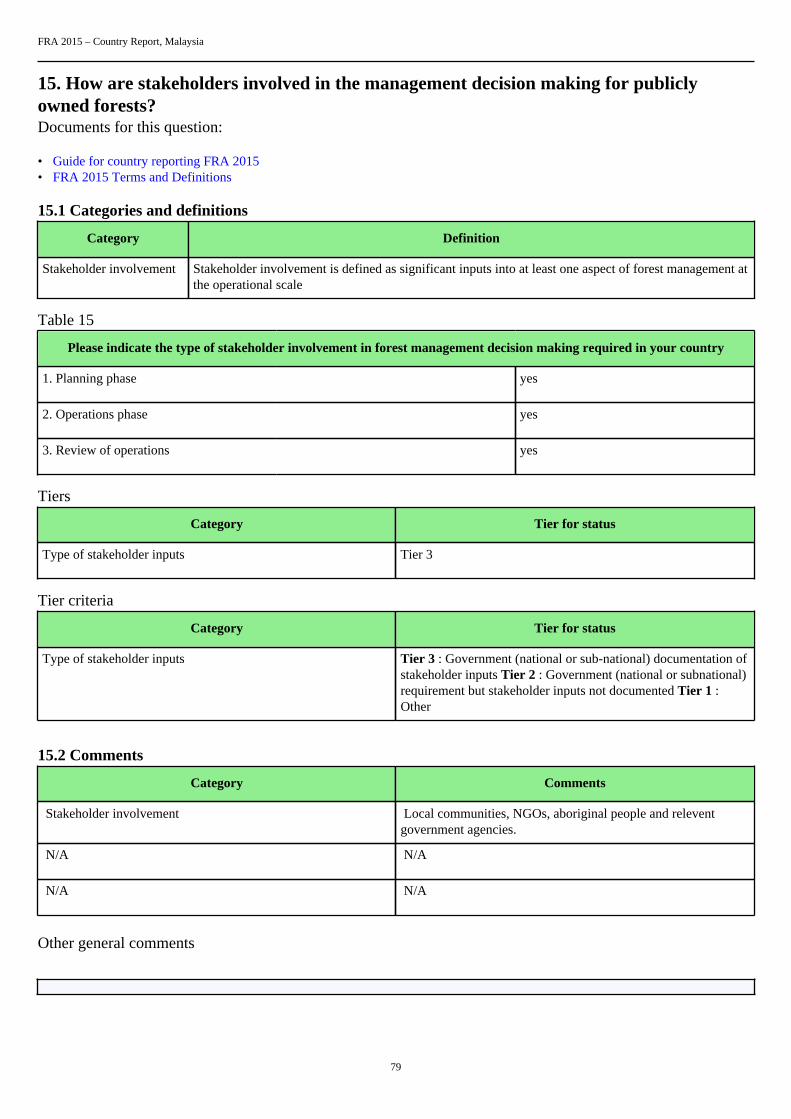
FRA 2015 – Country Report, Malaysia
79
15. How are stakeholders involved in the management decision making for publiclyowned forests?Documents for this question:
• Guide for country reporting FRA 2015• FRA 2015 Terms and Definitions
15.1 Categories and definitions
Category Definition
Stakeholder involvement Stakeholder involvement is defined as significant inputs into at least one aspect of forest management atthe operational scale
Table 15
Please indicate the type of stakeholder involvement in forest management decision making required in your country
1. Planning phase yes
2. Operations phase yes
3. Review of operations yes
Tiers
Category Tier for status
Type of stakeholder inputs Tier 3
Tier criteria
Category Tier for status
Type of stakeholder inputs Tier 3 : Government (national or sub-national) documentation ofstakeholder inputs Tier 2 : Government (national or subnational)requirement but stakeholder inputs not documented Tier 1 :Other
15.2 Comments
Category Comments
Stakeholder involvement Local communities, NGOs, aboriginal people and releventgovernment agencies.
N/A N/A
N/A N/A
Other general comments

FRA 2015 – Country Report, Malaysia
80
16. What is the area of forest under an independently verified forest certification scheme?Documents for this question:
• Guide for country reporting FRA 2015• FRA 2015 Terms and Definitions
16.1 Categories and definitions
Category Definition
FSC certification Forest area certified under the Forest Stewardship Council certification scheme
PEFC certification Forest area certified under the Programme for the Endorsement of Forest Certification scheme
Other international forestmanagement certification
Forest area certified under an international forest management certification scheme with publishedstandards and is independently verified by a third-party, excluding FSC and PEFC certification.
Certified forest areausing a domestic forestmanagement certificationscheme
Area certified under a forest management certification scheme with published standards that arenationally recognized and independently verified by a thirdparty
16.2 DataTable 16a
Forest area (000 ha)International forest
management certification2000 2001 2002 2003 2004 2005 2006
FSC 73.3 73.3 73.3 73.3 73.3 73.3 69.19
PEFC 0 0 0 0 0 0 0
Other 0 0 0 0 0 0 0
2007 2008 2009 2010 2011 2012
FSC 71.66 213.73 203.84 173.04 507.22 507.22
PEFC 0 106.82 164.07 4317.24 4634.91 4634.91
Other 0 0 0 0 0 0
Table 16b
Forest area (000 ha)Domestic forest
management certification2000 2001 2002 2003 2004 2005 2006
Name 0 0 0 0 0 0 0
N/A 0 0 0 0 0 0 0
N/A 0 0 0 0 0 0 0

FRA 2015 – Country Report, Malaysia
81
2007 2008 2009 2010 2011 2012
Name 0 0 0 0 0 0
0 0 0 0 0 0
0 0 0 0 0 0
Tier criteria
Category Tier for status
International forest management certification Tier 3: International forest management scheme recordsmaintained by the certifying organization for the reporting yearTier 2: International forest management scheme records reportedby the certifying organization for a period 2 years prior to thereporting year Tier: 1 Other
Domestic forest management certification Tier 3: National registry reports for domestic forest managementcertification maintained by the certifying organization for thereporting year Tier 2: Domestic forest management schemerecords reported by the certifying organization for a period 2years prior to the reporting year Tier: 1 Other
Tiers
Category Tier for status
International forest management certification Tier 3
Domestic forest management certification Tier 1
16.3 Comments
Category Comments related to data definitions etc
Certified forest area using an international forest managementcertification scheme
Forest areas certified under FSC and PEFC for year 2010,2011 and 2012 had been updated according to the latest recordavailable. Effective 2013, Forest Management Units (FMUs) inPeninsular Malaysia are certified under Malaysia Criteria andIndicators (Natural Forest).
Domestic forest management certification n.a
Other general comments
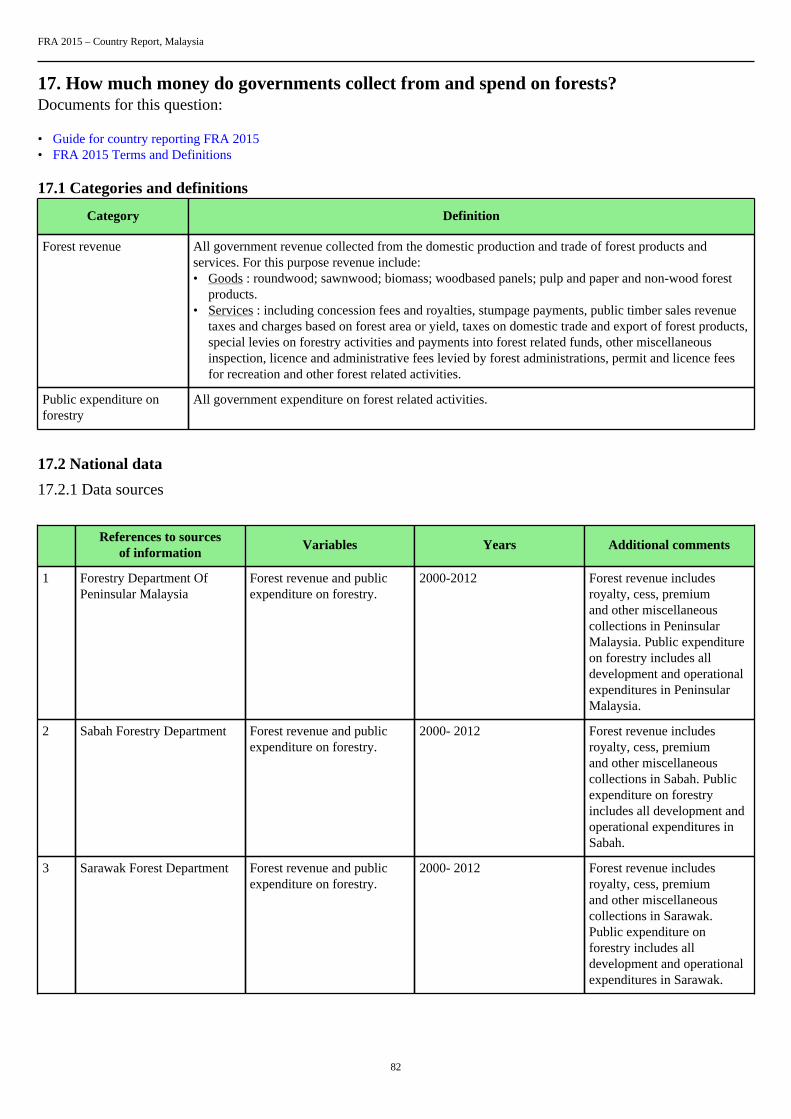
FRA 2015 – Country Report, Malaysia
82
17. How much money do governments collect from and spend on forests?Documents for this question:
• Guide for country reporting FRA 2015• FRA 2015 Terms and Definitions
17.1 Categories and definitions
Category Definition
Forest revenue All government revenue collected from the domestic production and trade of forest products andservices. For this purpose revenue include:• Goods : roundwood; sawnwood; biomass; woodbased panels; pulp and paper and non-wood forest
products.• Services : including concession fees and royalties, stumpage payments, public timber sales revenue
taxes and charges based on forest area or yield, taxes on domestic trade and export of forest products,special levies on forestry activities and payments into forest related funds, other miscellaneousinspection, licence and administrative fees levied by forest administrations, permit and licence feesfor recreation and other forest related activities.
Public expenditure onforestry
All government expenditure on forest related activities.
17.2 National data
17.2.1 Data sources
References to sourcesof information
Variables Years Additional comments
1 Forestry Department OfPeninsular Malaysia
Forest revenue and publicexpenditure on forestry.
2000-2012 Forest revenue includesroyalty, cess, premiumand other miscellaneouscollections in PeninsularMalaysia. Public expenditureon forestry includes alldevelopment and operationalexpenditures in PeninsularMalaysia.
2 Sabah Forestry Department Forest revenue and publicexpenditure on forestry.
2000- 2012 Forest revenue includesroyalty, cess, premiumand other miscellaneouscollections in Sabah. Publicexpenditure on forestryincludes all development andoperational expenditures inSabah.
3 Sarawak Forest Department Forest revenue and publicexpenditure on forestry.
2000- 2012 Forest revenue includesroyalty, cess, premiumand other miscellaneouscollections in Sarawak.Public expenditure onforestry includes alldevelopment and operationalexpenditures in Sarawak.

FRA 2015 – Country Report, Malaysia
83
4 Forest Research InstituteMalaysia
Revenue and publicexpenditure on forestryresearch.
2000- 2012 Revenue includes allresearch grants from FederalGovernment and service feesfrom private sector for thepurpose of forestry research.Research and developmentexpenditure includes alldevelopment and operationalexpenditures on forestryresearch.
17.3 DataTable 17
Revenues / expenditures (000 local currency)Category
2000 2005 2010
Forest revenue 1531084 1606191 1505533
Public expenditure on forestry 285525 373205 842777
2000 2005 2010
Name of Local Currency Ringgit Malaysia (RM) N/A N/A
17.4 Comments
Category Comments related to data definitions etc
Forest revenue All government revenue collected from the domestic productionand trade of forest products and services. For this purpose,forest products include: roundwood; sawnwood; wood-basedpanels; pulp and paper; and non-wood forest products. Thisincludes revenue collected by all levels of government (i.e.central, regional/provincial and municipal level), but excludesthe income of publicly owned business entities. There is adecrease on forest revenue collection since 2005 possibly due todrop in forest premium collection as a result of decrease in woodremovals from forest.
Public expenditure on forestry All government expenditure on public institutions solelyengaged in the forest sector. Where the forest administrationis part of a larger public agency (e.g. department or ministry),this includes the forest sector component of the agency’stotal expenditure. This also includes other institutions (e.g.in research, training and marketing) solely engaged in theforest sector, but it excludes the expenditure of publicly ownedbusiness entities. The significant increase in public expenditureon forestry since 2005 shows that the government is committedto forest conservation and environment protection.
Other general comments N/A
FRA 2015 – Country Report, Malaysia
84
Other general comments

FRA 2015 – Country Report, Malaysia
85
18. Who owns and manages the forests and how has this changed?Documents for this question:
• Guide for country reporting FRA 2015• FRA 2015 Terms and Definitions
18.1 Categories and definitions
Category Definition
Public ownership Forest owned by the State or administrative units of the public administration or by institutions orcorporations owned by the public administration.
...of which owned by thestate at national scale(sub-category)
Forest owned by the State at the national scale or administrative units of the public administration or byinstitutions or corporations owned by the public administration.
...of which owned by thestate at the sub-nationalgovernment scale (sub-category)
Forest owned by the State at the sub-national government scale or administrative units of the publicadministration or by institutions or corporations owned by the public administration.
Private ownership Forest owned by individuals, families, communities, private cooperatives corporations and otherbusiness entities, private, religious and educational institutions, pension or investment funds, NGOs,nature conservation associations and other private institutions.
...of which individuals(sub-category)
Forest owned by individuals and families.
...of which privatebusiness entities andinstitutions (sub-category)
Forest owned by private corporations cooperatives companies and other business entities as well asprivate nonprofit organizations such as NGOs nature conservation associations, and private religiousand educational institutions etc.
...of which local tribal andindigenous communities(sub-category)
Forest owned by a group of individuals belonging to the same community residing within or in thevicinity of a forest area or forest owned by communities of indigenous or tribal people The communitymembers are coowners that share exclusive rights and duties and benefits contribute to the communitydevelopment.
Unknown ownership Forest area where ownership is unknown includes areas where ownership is unclear or disputed.
Categories related tomanagement rights
of public forestsDefinition
Public Administration The Public Administration (or institutions or corporations owned by the Public Administration) retainsmanagement rights and responsibilities within the limits specified by the legislation.
Individuals households Forest management rights and responsibilities are transferred from the Public Administration toindividuals or households through long-term leases or management agreements.
Private companies Forest management rights and responsibilities are transferred from the Public Administration tocorporations, other business entities private cooperatives, private nonprofit institutions and associations,etc., through long-term leases or management agreements.
Communities Forest management rights and responsibilities are transferred from the Public Administration to localcommunities (including indigenous and tribal communities) through long-term leases or managementagreements.
Other form ofmanagement rights
Forests for which the transfer of management rights does not belong to any of the categories mentionedabove.
18.2 National data

FRA 2015 – Country Report, Malaysia
86
18.2.1 Data sources
References to sourcesof information
Variables Years Additional comments
1 Forestry Department OfPeninsular Malaysia.
Public and private ownership. 1990-2012 Statistical information onpublic and private ownershipin Peninsular Malaysia.
2 Sabah Forestry Department Public and private ownership. 1990-2012 Statistical information onpublic and private ownershipin Sabah.
3 Sarawak Forest Department Public and private ownership. 1990-2012 Statistical information onpublic and private ownershipin Sarawak.
4 Department of Wildlife andNational Parks PeninsularMalaysia
Public ownership. 1990-2012 Statistical information onNational Parks and WildlifeReserves in PeninsularMalaysia.
5 Ministry of PlantationIndustries and CommoditiesMalaysia. Statistics onCommodities
Public ownership. 1990-2012 Statistical informationon rubber plantations inMalaysia
6 FRA 2010 Pre-filled data. N/A N/A
18.2.2 Classification and definitions
National class Definition
Private ownership - Rubber plantation • Forest land administered under the National Land Code 1965;and Stateland Rules
Public ownership - Permanent Reserved Forest - National Park -Wildlife and Bird Sanctuary - Stateland
• Land administered under the National Forestry Act 1984;National Land Code, 1965; Land administered under theNational Parks Act 1980; Wildlife Conservation Act, 2010(Peninsular Malaysia); Taman Negara Enactment (Kelantan),1938; Taman Negara Enactment (Pahang), 1939; Taman NegaraEnactment (Terengganu), 1939; State Forest Enactments;National Parks (Johor) Corporation Enactment, 1989; ForestEnactment, 1968; Parks Enactment, 1984; Wildlife ConservationEnactment, 1997; Land Ordinance, 1930, Sabah; ForestOrdinance, 1954, Sarawak; Forest Rules, 1962, Sarawak;Wildlife Protection Ordinance, 1998, Sarawak; State ForestPolicy, 1954, Sarawak; and National Parks and Nature ReservesOrdinance, 1998, Sarawak.
N/A N/A
N/A N/A

FRA 2015 – Country Report, Malaysia
87
18.2.3 Original data
N/A
18.3 Analysis and processing of national data
18.3.1 Adjustment
N/A
18.3.2 Estimation and forecasting
N/A
18.3.3 Reclassification
N/A
18.4 DataTable 18a
Forest area (1000 hectares)Categories
1990 2000 2005 2010
Public ownership 21877 21347 20559 21104
... of which ownedby the state atnational scale
N/A N/A N/A N/A
... of which ownedby the state atthe sub-nationalgovernment scale
21877 21347 20559 21104
Private ownership 499 244 331 1020
... of which ownedby individuals
N/A N/A N/A N/A
... of which ownedby private businessentities andinstitutions
N/A N/A N/A N/A

FRA 2015 – Country Report, Malaysia
88
... of which ownedby local, tribaland indigenouscommunities
N/A N/A N/A N/A
Unknownownership
0 0 0 0
TOTAL 22376.00 21591.00 20890.00 22124.00
Tiers
Category Tier for status Tier for reported trend
Public ownership Tier 3 Tier 3
Private ownership Tier 3 Tier 3
Unknown ownership Tier 1 Tier 1
Tier criteria
Category Tier for status Tier for reported trend
Ownership Tier 3: National forestry statistics registersof land titles or maps on land ownershipor all forest area under one ownershipcategory that is five years old or less. Tier2:National forestry statistics registers ofland titles or maps on land ownership orquestionnaires that are more than fiveyears old. Tier 1: Other
Tier 3 : Estimate based on repeatedcompatible tiers 3 (tier for status) Tier 2 :Estimate based on repeated compatible tier2 or combination tier 3 and 2 or 1 (tier forstatus) Tier 1 : Other
Table 18b - Holder of management rights of public forests
Forest area (000 hectares)Categories
1990 2000 2005 2010
Public Administration 20781 19328 18479 20858
Individuals 0 0 0 0
Private companies 1096 2019 2080 246
Communities 0 0 0 0
Other 0 0 0 0
TOTAL 21877.00 21347.00 20559.00 21104.00
Category Tier for reported trend Tier for status
Public Administration Tier 3 Tier 3

FRA 2015 – Country Report, Malaysia
89
Individuals Tier 1 Tier 1
Private companies Tier 3 Tier 3
Communities Tier 1 Tier 1
Other Tier 1 Tier 1
18.5 Comments
CategoryComments related todata definitions etc
Comments on the reported trend
Public ownership Public ownership refers to PRF, NationalPark & Wildlife & Bird Sanctuary andStateland forest.
Area under public ownership is relativelystable since 2010 and this trend isexpected to remain in the near future.
Private ownership Rubber plantations are under privateownership.
Area under private ownership is alsorelatively stable since 2010 and not muchvariation is expected in the near future.
Unknown ownership N/A N/A
Management rights Data on individuals, communities andother holders of management rights are notavailable.
N/A
Other general comments to the table
Under the Malaysian constitution, forests are owned by the State Authority and managed by each State Forestry Department.

FRA 2015 – Country Report, Malaysia
90
19. How many people are directly employed in forestry?Documents for this question:
• Guide for country reporting FRA 2015• FRA 2015 Terms and Definitions
19.1 Categories and definitions
Category Definition
Full-time equivalents(FTE)
A measurement equal to one person working full-time during a specified reference period.
Employment in forestry Employment in activities related to production of goods derived from forests. This category correspondsto the ISIC/NACE Rev. 4 activity A02 (Forestry and logging).
19.2 National data
19.2.1 Data sources
References to sourcesof information
Variables Years Additional comments
1 Forestry Department OfPeninsular Malaysia.
Full time equivalents (FTE)and employment in forestry.
1990-2012 Statistical information foremployment in loggingindustry and forestrydepartment in PeninsularMalaysia.
2 Sabah Forestry Department Full time equivalents (FTE)and employment in forestry.
1990-2012 Statistical information foremployment in loggingindustry and forestrydepartment in Sabah.
3 Sarawak Forest Department Full time equivalents (FTE)and employment in forestry.
1990-2012 Statistical information foremployment in loggingindustry and forestrydepartment in Sarawak.
4 Malaysian Timber IndustryBoard
Full time equivalents (FTE)and employment in forestry.
1990-2012 Statistical information foremployment in loggingindustry and forestrydepartment in Malaysia.
19.2.2 Classification and definitions
National class Definition
Primary production of goods Employment in the logging sector.
N/A N/A
N/A N/A
N/A N/A
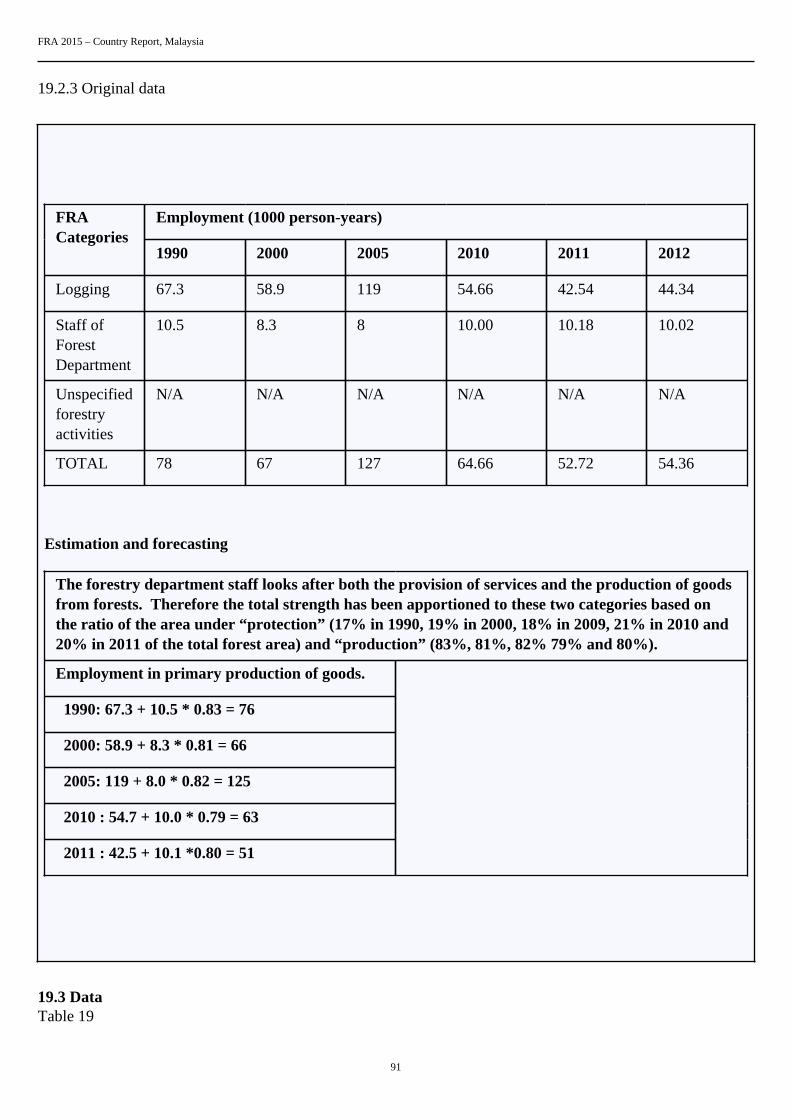
FRA 2015 – Country Report, Malaysia
91
19.2.3 Original data
Employment (1000 person-years)FRACategories
1990 2000 2005 2010 2011 2012
Logging 67.3 58.9 119 54.66 42.54 44.34
Staff ofForestDepartment
10.5 8.3 8 10.00 10.18 10.02
Unspecifiedforestryactivities
N/A N/A N/A N/A N/A N/A
TOTAL 78 67 127 64.66 52.72 54.36
Estimation and forecasting
The forestry department staff looks after both the provision of services and the production of goodsfrom forests. Therefore the total strength has been apportioned to these two categories based onthe ratio of the area under “protection” (17% in 1990, 19% in 2000, 18% in 2009, 21% in 2010 and20% in 2011 of the total forest area) and “production” (83%, 81%, 82% 79% and 80%).
Employment in primary production of goods.
1990: 67.3 + 10.5 * 0.83 = 76
2000: 58.9 + 8.3 * 0.81 = 66
2005: 119 + 8.0 * 0.82 = 125
2010 : 54.7 + 10.0 * 0.79 = 63
2011 : 42.5 + 10.1 *0.80 = 51
19.3 DataTable 19

FRA 2015 – Country Report, Malaysia
92
Employment (000 years FTE)Category
1990 2000 2005 2010
Employment inforestry
76 66 125 63
... of which female N/A N/A N/A N/A
19.4 Comments
CategoryComments related todata definitions etc
Comments on the reported trend
Employment in forestry Employment in the logging sector andstaff of forestry department.
The decrease in employment in forestrysince 2010 is due to decrease in areaopened for forest harvesting.
Other general comments to the table
N/A

FRA 2015 – Country Report, Malaysia
93
20. What is the contribution of forestry to Gross Domestic Product (GDP)?Documents for this question:
• Guide for country reporting FRA 2015• FRA 2015 Terms and Definitions
20.1 Categories and definitions
Category Definition
Gross value added fromforestry (at basic prices)
This category corresponds to the ISIC/NACE Rev. 4 activity A02 (Forestry and logging).
20.2 DataTable 20 (Pre-filled data from UNdata/EUROSTAT)
Category Million CurrencyYear for latest
available information
Gross value added fromforestry (at basic prices)
9268 ringgit 2011
20.3 Comments
Category Comments
Gross value added from forestry (at basic prices). The pre-filled data for 2011 has been amended to 9,268 million.
Other general comments

FRA 2015 – Country Report, Malaysia
94
21. What is forest area likely to be in the futureDocuments for this question:
• Guide for country reporting FRA 2015• FRA 2015 Terms and Definitions
21.1 Categories and definitions
Category Definition
Government target/aspiration for forest area
Government target/aspiration for forest area for a specific year.
Forests earmarked forconversion
Forest area that is allocated/classified or scheduled to be converted into non-forest uses.
21.2 National data
21.2.1 Data sources
References to sourcesof information
Variables Years Additional comments
1 Forestry Department ofPeninsular Malaysia
Forest areas 1990-2012 Statistical information forforest area in PeninsularMalaysia
2 Sabah Forestry Department Forest areas 1990-2012 Statistical information forforest area in Sabah
3 Sarawak Forest Department Forest areas 1990-2012 Statistical information forforest area in Sarawak
4 An Outlook of MalaysianForestry Sector in 2020
Government target/aspirationfor forest area.
2008 Reference for estimation ofgovernment target for forestarea in 2020
21.3 DataTable 21a
Forest area (000 ha)Category
2020 2030
Government target/aspiration for forestarea
N/A N/A
Table 21b
Forest area (000 ha)Category
2013
Forests earmarked for conversion 4656
21.4 Comments

FRA 2015 – Country Report, Malaysia
95
Category Comments
Government target/aspiration for forest area There’s no specific government target or aspiration of forestarea in 2020 and 2030.
Forests earmarked for conversion Stateland forests are earmarked for future land development andconversion.
Other general comments