malawi multi-purpose use of alos palsar-1 data · palsar-1 hh insar dem srtm average h < 5m....
TRANSCRIPT
Science Team meeting #18 – JAXA RESTEC HQ, Tokyo, November 7-10, 2012
Malawi
Multi-purpose use of ALOS PALSAR-1 data
sarmap
and
Forest Research Institute of Malawi (FRIM)
Science Team meeting #18 – JAXA RESTEC HQ, Tokyo, November 7-10, 2012
The objective is to demonstrate, at country-level, the multi-purpose use of ALOS PALSAR-1 data,
particularly of multi-year ALOS PALSAR-1 Intensity data and their synergetic use with other
spaceborne SAR data, conditio sine qua non for the provision of accurate and complementary
products. In this framework, following products are targeted:
•Digital Elevation Model•Forest map•Forest biomass map (to be completed)•Cultivated area map
Objective
Science Team meeting #18 – JAXA RESTEC HQ, Tokyo, November 7-10, 2012
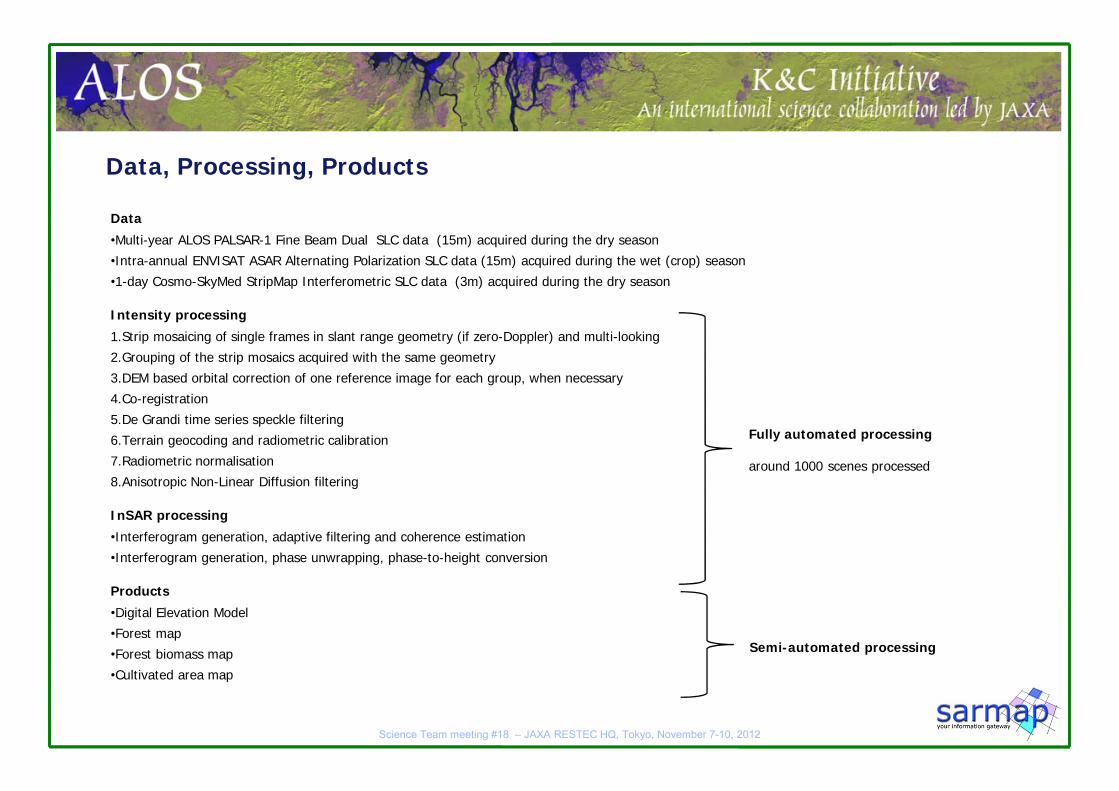
Data
•Multi-year ALOS PALSAR-1 Fine Beam Dual SLC data (15m) acquired during the dry season
•Intra-annual ENVISAT ASAR Alternating Polarization SLC data (15m) acquired during the wet (crop) season
•1-day Cosmo-SkyMed StripMap Interferometric SLC data (3m) acquired during the dry season
Intensity processing
1.Strip mosaicing of single frames in slant range geometry (if zero-Doppler) and multi-looking
2.Grouping of the strip mosaics acquired with the same geometry
3.DEM based orbital correction of one reference image for each group, when necessary
4.Co-registration
5.De Grandi time series speckle filtering
6.Terrain geocoding and radiometric calibration
7.Radiometric normalisation
8.Anisotropic Non-Linear Diffusion filtering
InSAR processing
•Interferogram generation, adaptive filtering and coherence estimation
•Interferogram generation, phase unwrapping, phase-to-height conversion
Products
•Digital Elevation Model
•Forest map
•Forest biomass map
•Cultivated area map
Data, Processing, Products
Fully automated processing
around 1000 scenes processed
Semi-automated processing
Science Team meeting #18 – JAXA RESTEC HQ, Tokyo, November 7-10, 2012
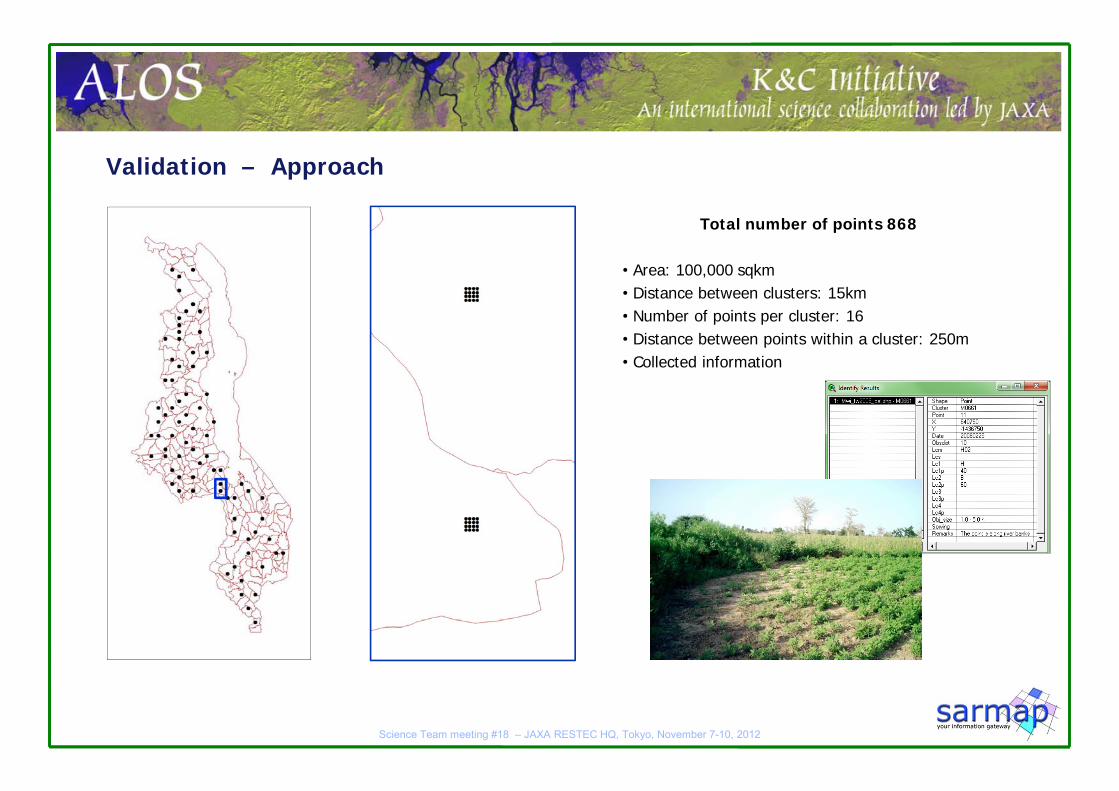
Validation – Approach
Total number of points 868
• Area: 100,000 sqkm• Distance between clusters: 15km• Number of points per cluster: 16 • Distance between points within a cluster: 250m• Collected information
Science Team meeting #18 – JAXA RESTEC HQ, Tokyo, November 7-10, 2012
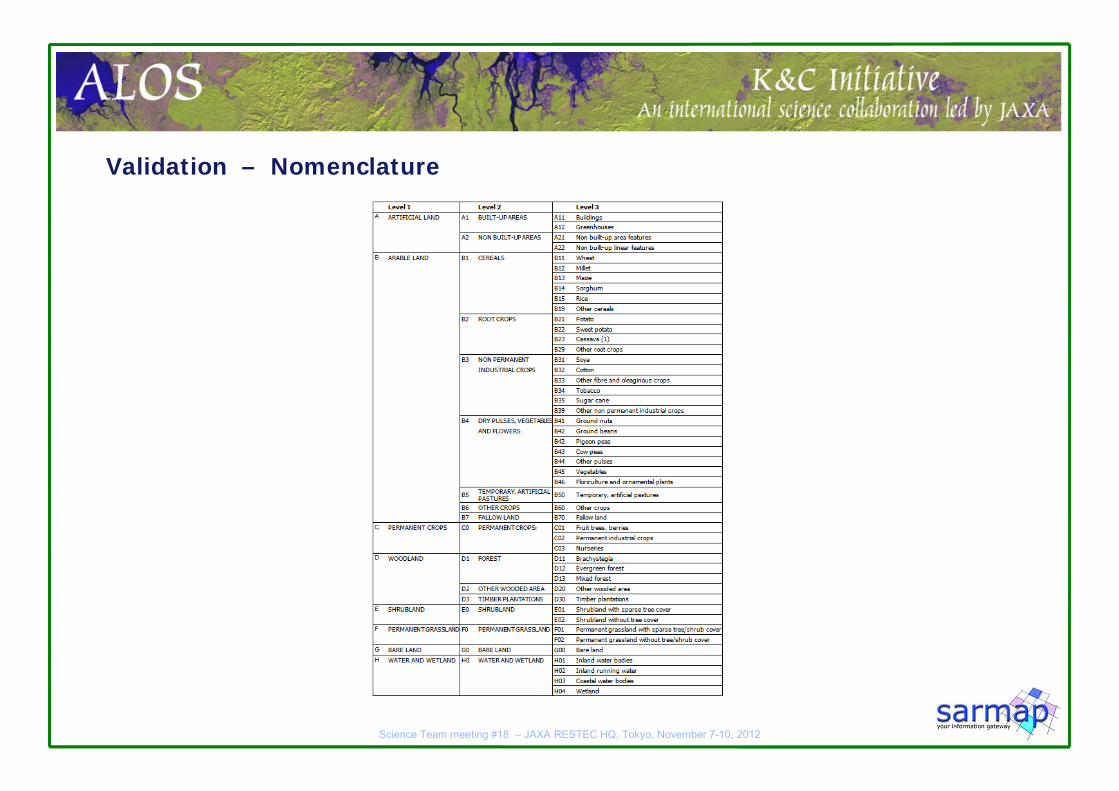
Validation – Nomenclature
Science Team meeting #18 – JAXA RESTEC HQ, Tokyo, November 7-10, 2012
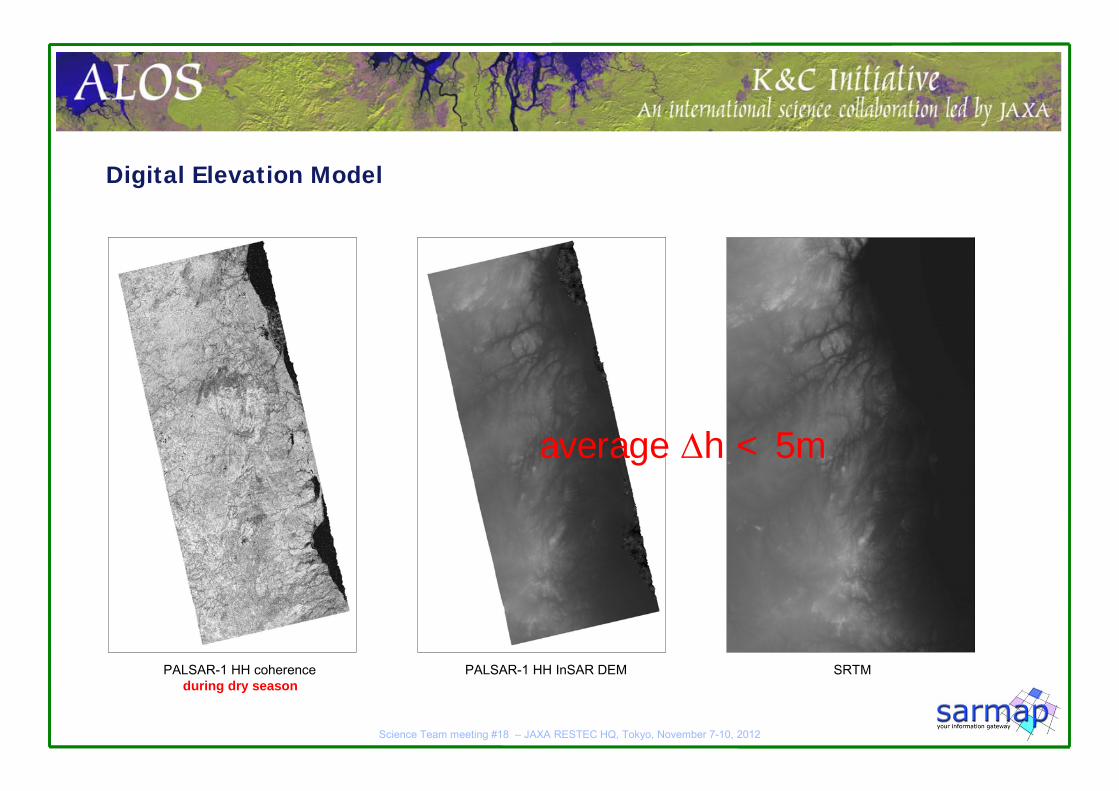
Digital Elevation Model
PALSAR-1 HH coherenceduring dry season
PALSAR-1 HH InSAR DEM SRTM
average h < 5m
Science Team meeting #18 – JAXA RESTEC HQ, Tokyo, November 7-10, 2012
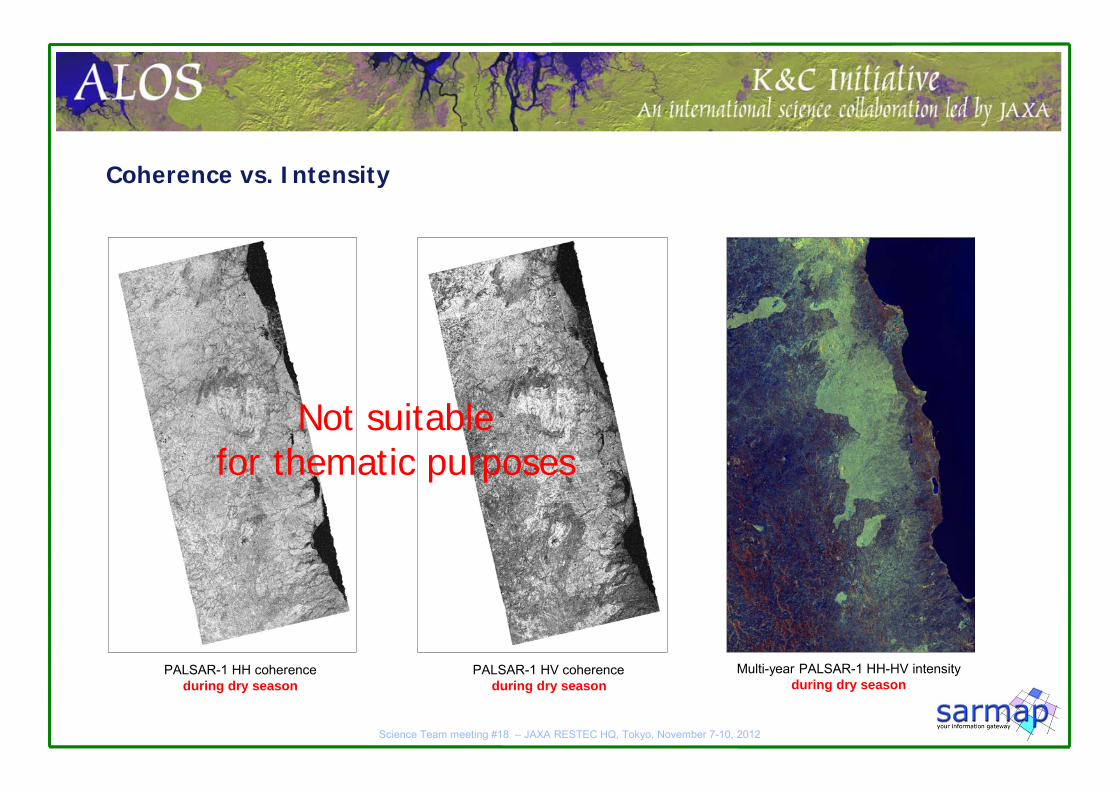
Coherence vs. Intensity
PALSAR-1 HH coherenceduring dry season
PALSAR-1 HV coherenceduring dry season
Not suitable for thematic purposes
Multi-year PALSAR-1 HH-HV intensityduring dry season
Science Team meeting #18 – JAXA RESTEC HQ, Tokyo, November 7-10, 2012
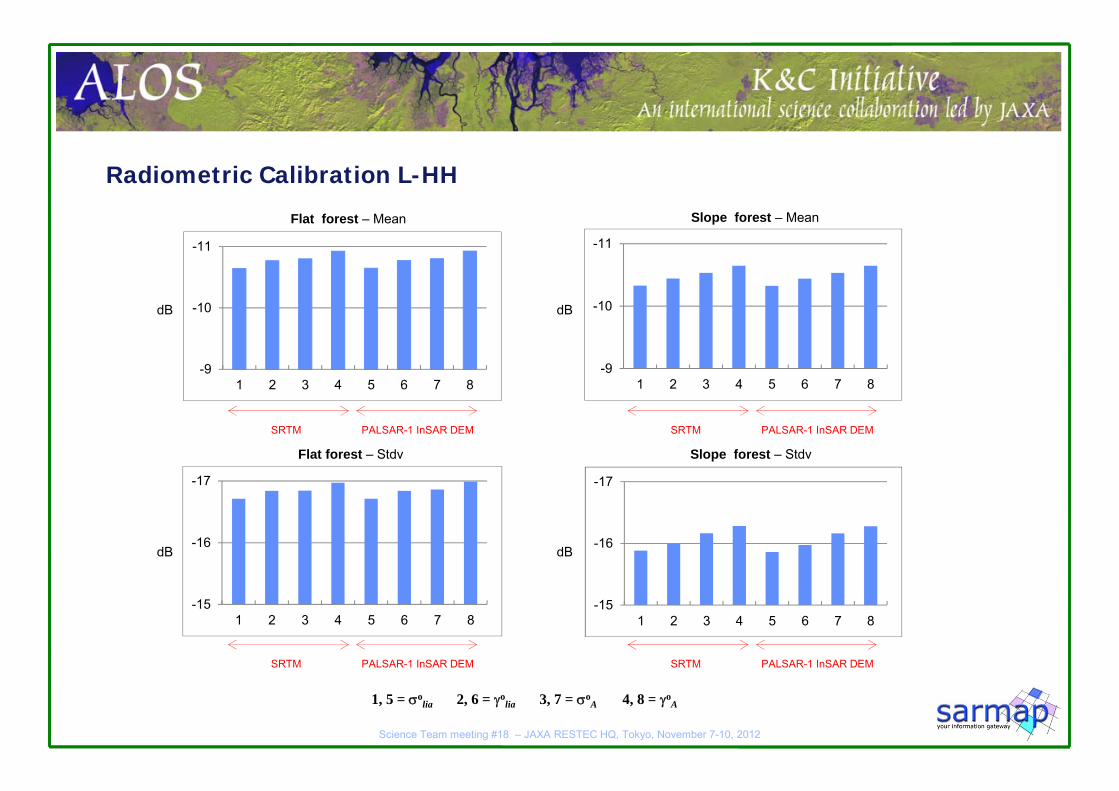
Radiometric Calibration L-HH
-11
-10
-91 2 3 4 5 6 7 8
-11
-10
-91 2 3 4 5 6 7 8
-17
-16
-151 2 3 4 5 6 7 8
-17
-16
-151 2 3 4 5 6 7 8
dB
dB
dB
dB
Flat forest – Mean
Flat forest – Stdv
Slope forest – Mean
Slope forest – Stdv
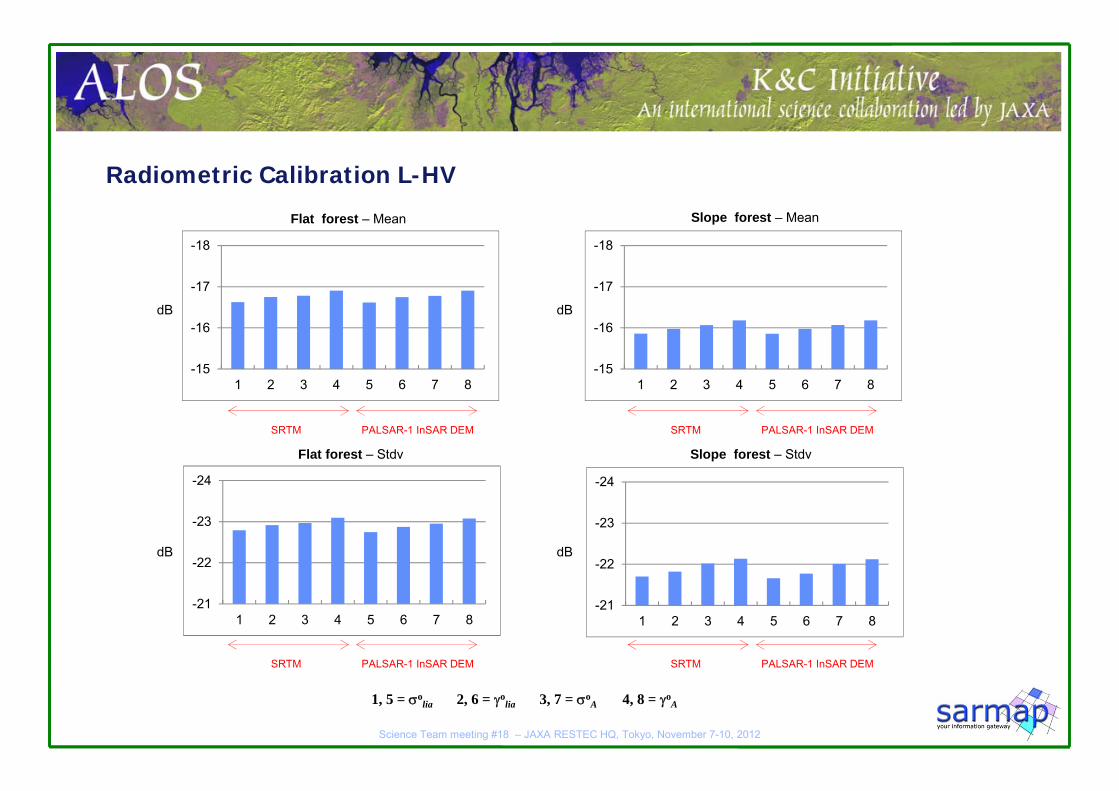
SRTM PALSAR-1 InSAR DEM SRTM PALSAR-1 InSAR DEM
1, 5 = olia 2, 6 = o
lia 3, 7 = oA 4, 8 = o
A
SRTM PALSAR-1 InSAR DEM SRTM PALSAR-1 InSAR DEM
Science Team meeting #18 – JAXA RESTEC HQ, Tokyo, November 7-10, 2012
Radiometric Calibration L-HV
-18
-17
-16
-151 2 3 4 5 6 7 8
-18
-17
-16
-151 2 3 4 5 6 7 8
-24
-23
-22
-211 2 3 4 5 6 7 8
-24
-23
-22
-211 2 3 4 5 6 7 8
dB
dB
dB
dB
SRTM PALSAR-1 InSAR DEM SRTM PALSAR-1 InSAR DEM
Flat forest – Mean
Flat forest – Stdv
Slope forest – Mean
Slope forest – Stdv
SRTM PALSAR-1 InSAR DEM SRTM PALSAR-1 InSAR DEM
1, 5 = olia 2, 6 = o
lia 3, 7 = oA 4, 8 = o
A
Science Team meeting #18 – JAXA RESTEC HQ, Tokyo, November 7-10, 2012
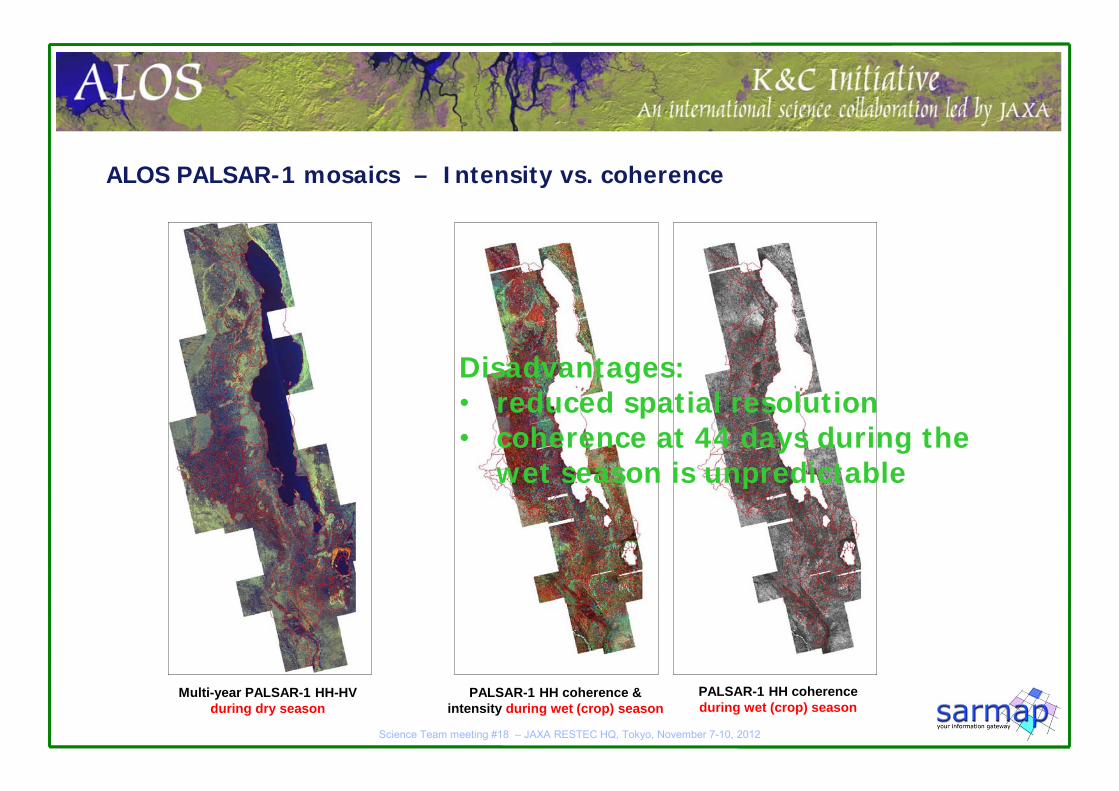
ALOS PALSAR-1 mosaics – Intensity vs. coherence
Multi-year PALSAR-1 HH-HVduring dry season
PALSAR-1 HH coherence &intensity during wet (crop) season
PALSAR-1 HH coherenceduring wet (crop) season
Disadvantages:• reduced spatial resolution• coherence at 44 days during the
wet season is unpredictable
Science Team meeting #18 – JAXA RESTEC HQ, Tokyo, November 7-10, 2012
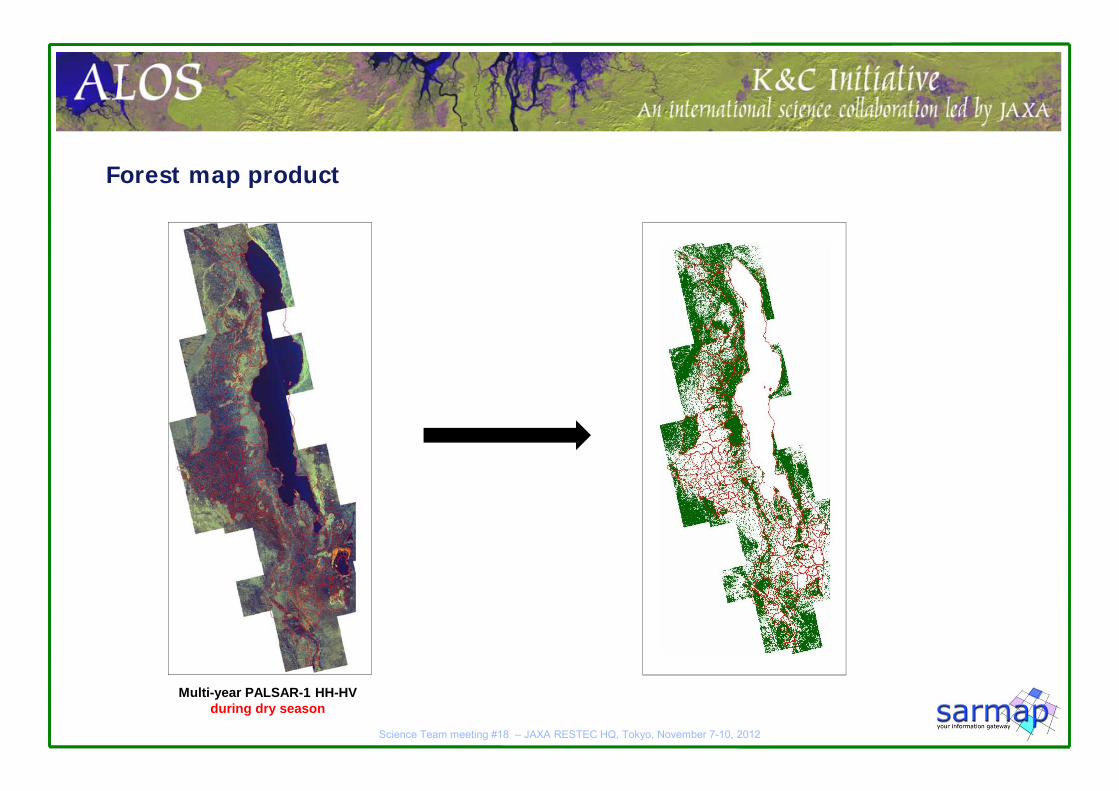
Forest map product
Multi-year PALSAR-1 HH-HVduring dry season
Science Team meeting #18 – JAXA RESTEC HQ, Tokyo, November 7-10, 2012
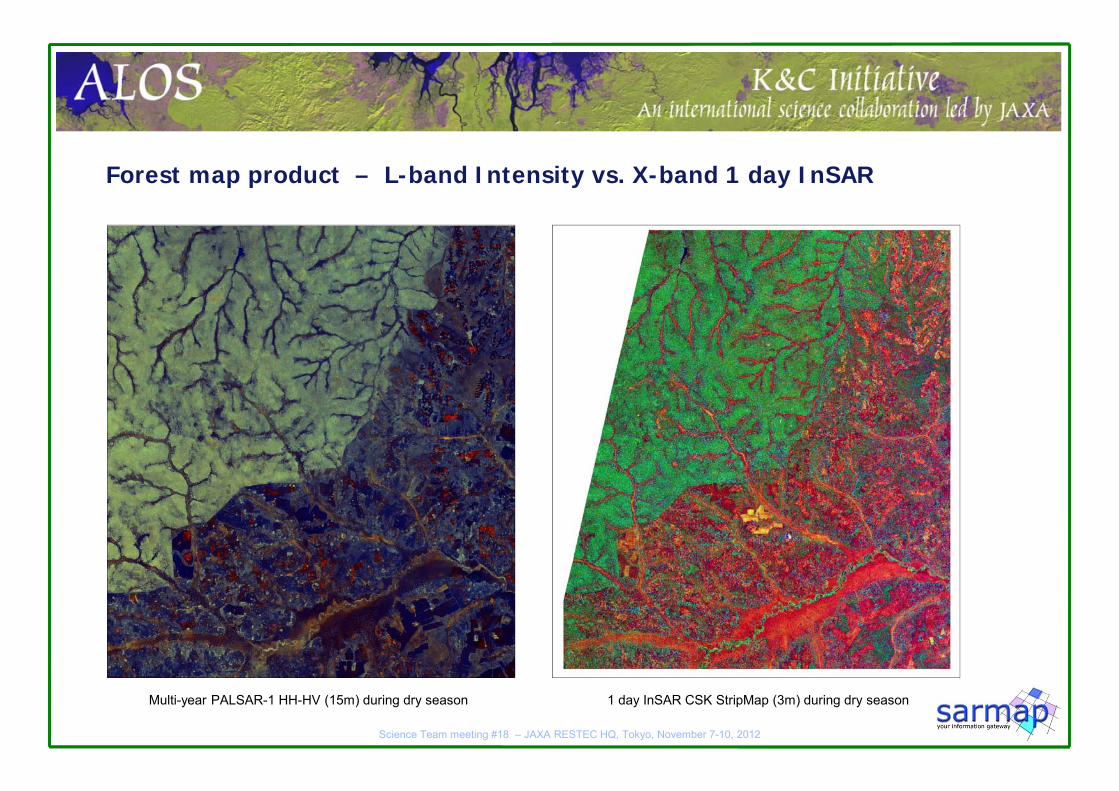
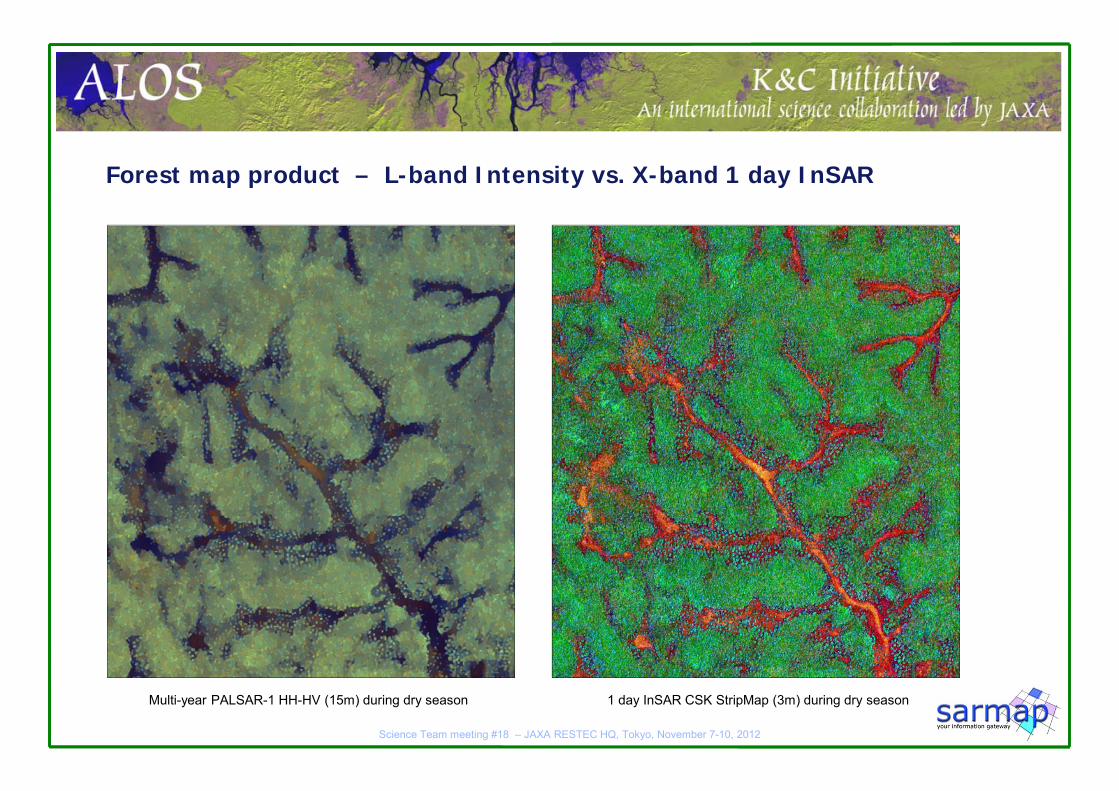
Forest map product – L-band Intensity vs. X-band 1 day InSAR
Multi-year PALSAR-1 HH-HV (15m) during dry season 1 day InSAR CSK StripMap (3m) during dry season
Science Team meeting #18 – JAXA RESTEC HQ, Tokyo, November 7-10, 2012
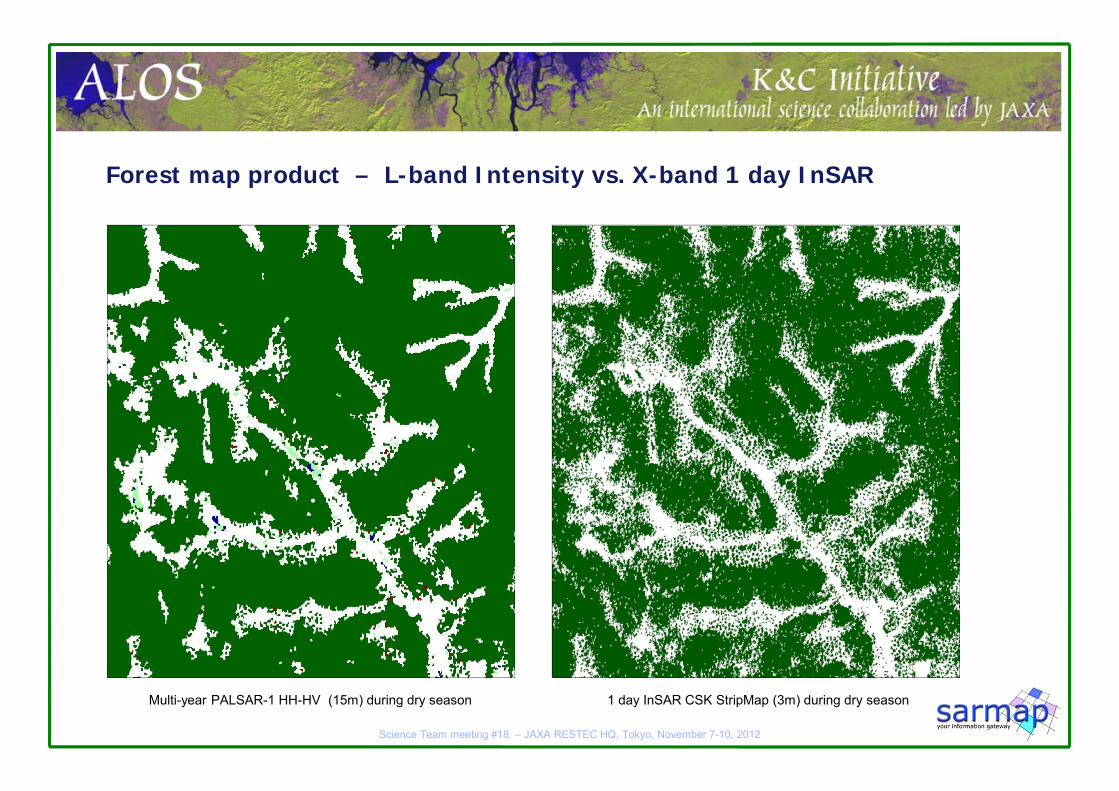
Forest map product – L-band Intensity vs. X-band 1 day InSAR
Multi-year PALSAR-1 HH-HV (15m) during dry season 1 day InSAR CSK StripMap (3m) during dry season
Science Team meeting #18 – JAXA RESTEC HQ, Tokyo, November 7-10, 2012
Forest map product – L-band Intensity vs. X-band 1 day InSAR
Multi-year PALSAR-1 HH-HV (15m) during dry season 1 day InSAR CSK StripMap (3m) during dry season
Science Team meeting #18 – JAXA RESTEC HQ, Tokyo, November 7-10, 2012
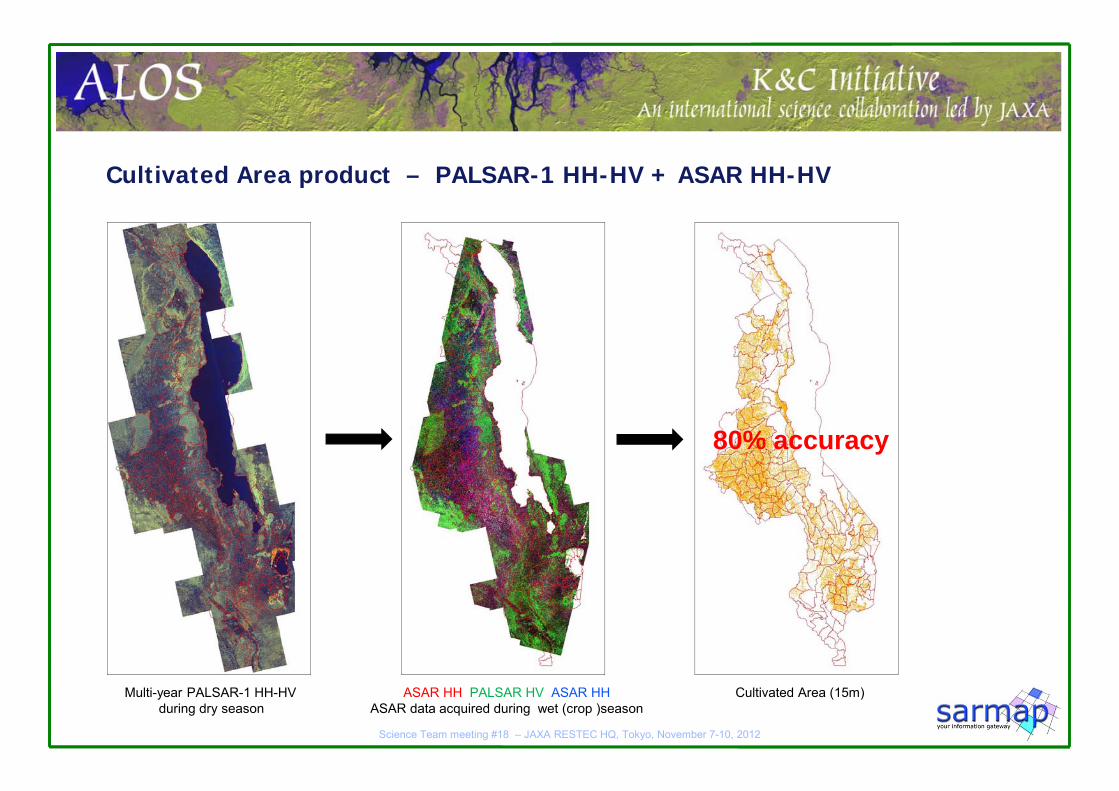
Cultivated Area product – PALSAR-1 HH-HV + ASAR HH-HV
ASAR HH PALSAR HV ASAR HHASAR data acquired during wet (crop )season
Cultivated Area (15m)
80% accuracy
Multi-year PALSAR-1 HH-HVduring dry season
Science Team meeting #18 – JAXA RESTEC HQ, Tokyo, November 7-10, 2012
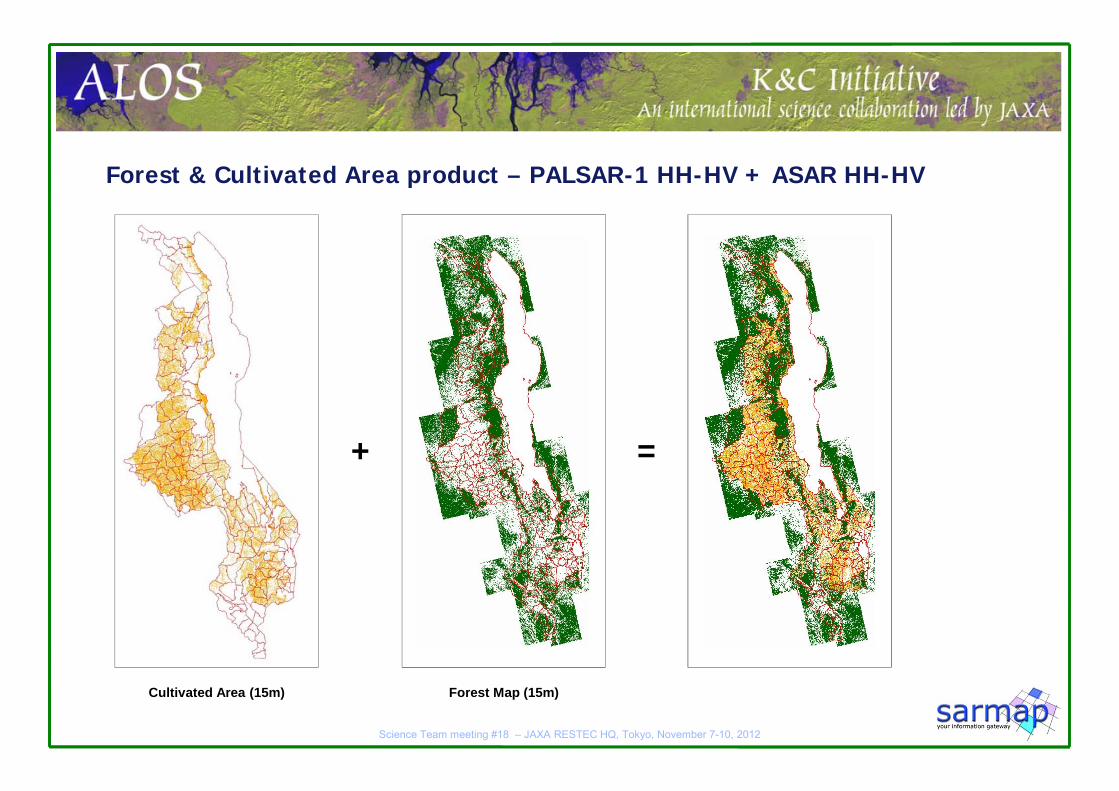
Forest & Cultivated Area product – PALSAR-1 HH-HV + ASAR HH-HV
Cultivated Area (15m) Forest Map (15m)
+ =
Science Team meeting #18 – JAXA RESTEC HQ, Tokyo, November 7-10, 2012
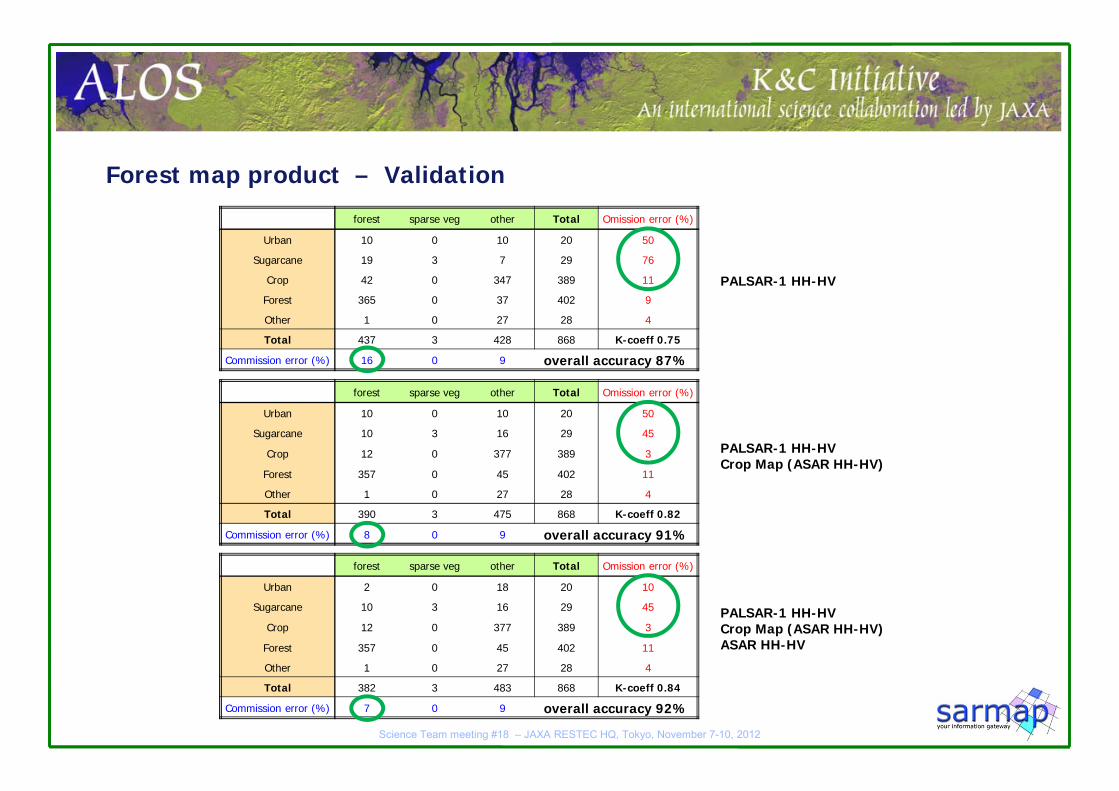
Forest map product – Validation
forest sparse veg other Total Omission error (%)
Urban 10 0 10 20 50
Sugarcane 19 3 7 29 76
Crop 42 0 347 389 11
Forest 365 0 37 402 9
Other 1 0 27 28 4
Total 437 3 428 868 K-coeff 0.75
Commission error (%) 16 0 9 overall accuracy 87%
forest sparse veg other Total Omission error (%)
Urban 10 0 10 20 50
Sugarcane 10 3 16 29 45
Crop 12 0 377 389 3
Forest 357 0 45 402 11
Other 1 0 27 28 4
Total 390 3 475 868 K-coeff 0.82
Commission error (%) 8 0 9 overall accuracy 91%
forest sparse veg other Total Omission error (%)
Urban 2 0 18 20 10
Sugarcane 10 3 16 29 45
Crop 12 0 377 389 3
Forest 357 0 45 402 11
Other 1 0 27 28 4
Total 382 3 483 868 K-coeff 0.84
Commission error (%) 7 0 9 overall accuracy 92%
PALSAR-1 HH-HV
PALSAR-1 HH-HVCrop Map (ASAR HH-HV)
PALSAR-1 HH-HVCrop Map (ASAR HH-HV)ASAR HH-HV
Science Team meeting #18 – JAXA RESTEC HQ, Tokyo, November 7-10, 2012
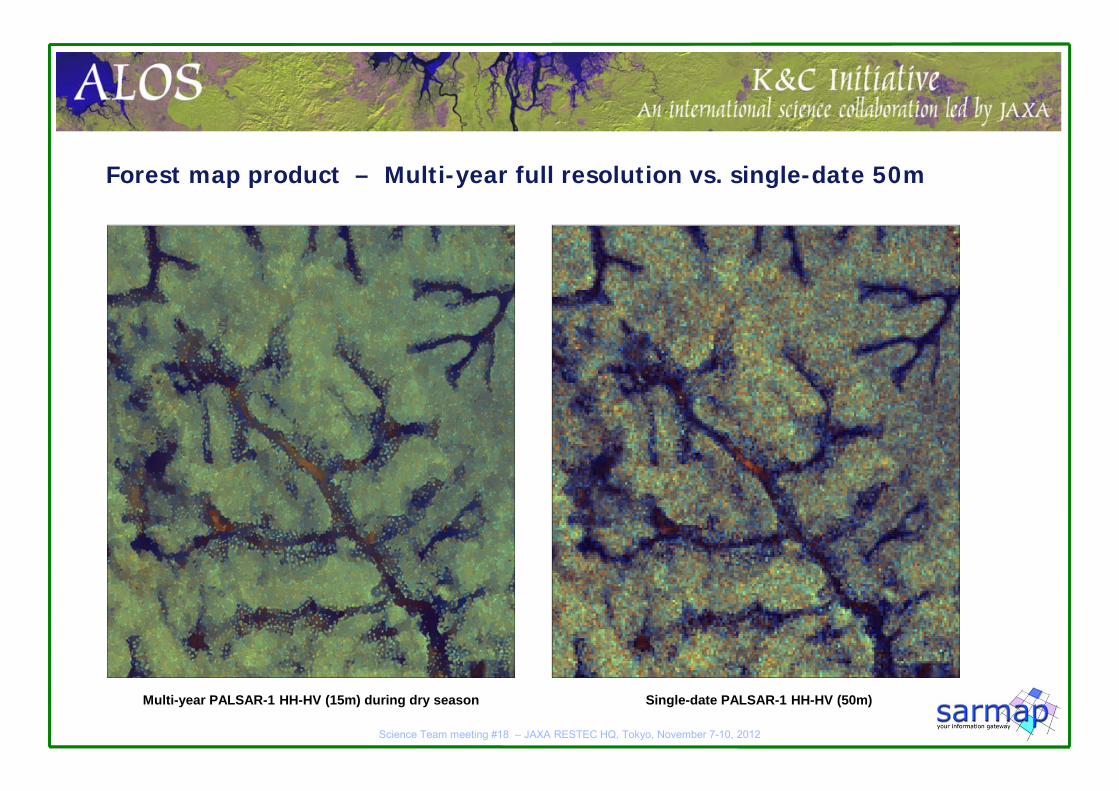
Forest map product – Multi-year full resolution vs. single-date 50m
Multi-year PALSAR-1 HH-HV (15m) during dry season Single-date PALSAR-1 HH-HV (50m)
Science Team meeting #18 – JAXA RESTEC HQ, Tokyo, November 7-10, 2012
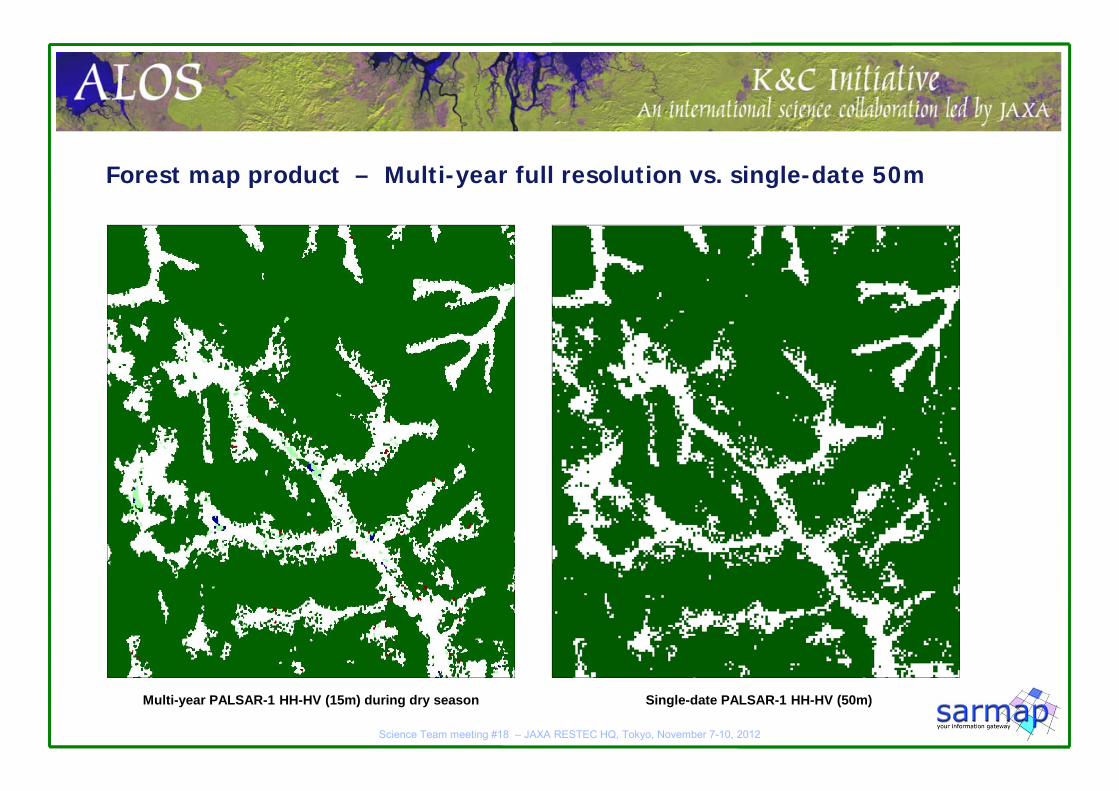
Forest map product – Multi-year full resolution vs. single-date 50m
Multi-year PALSAR-1 HH-HV (15m) during dry season Single-date PALSAR-1 HH-HV (50m)
Science Team meeting #18 – JAXA RESTEC HQ, Tokyo, November 7-10, 2012
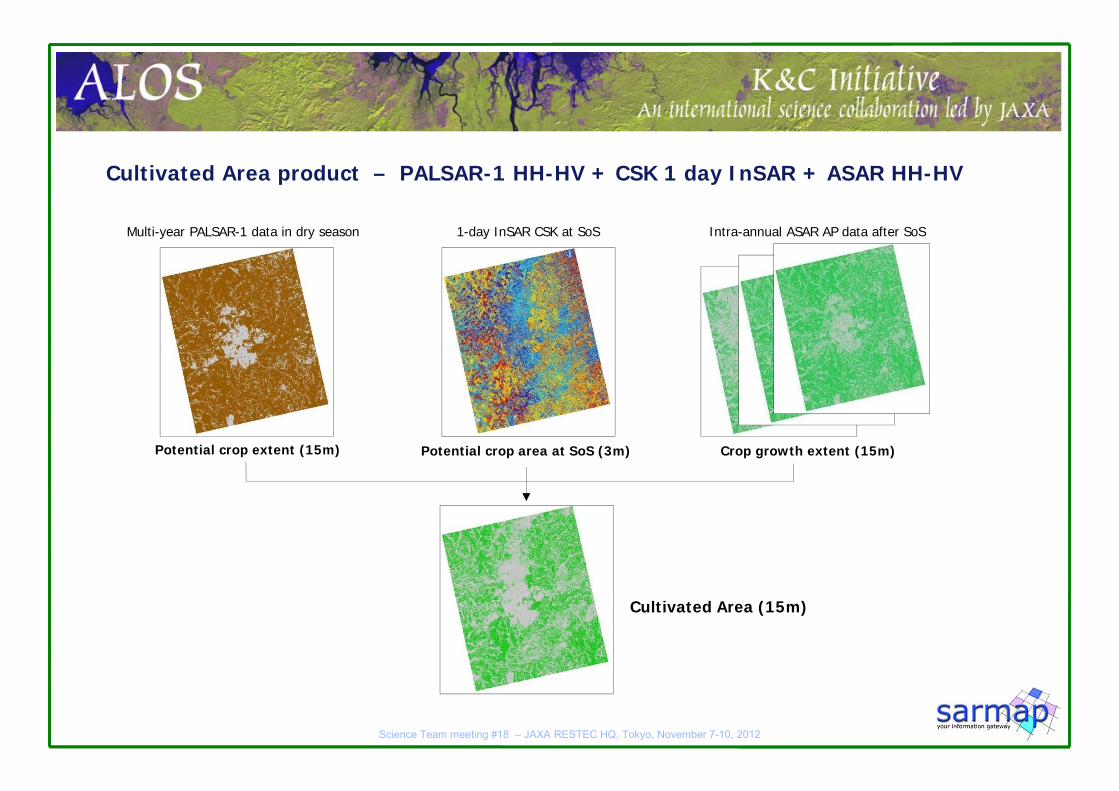
Cultivated Area product – PALSAR-1 HH-HV + CSK 1 day InSAR + ASAR HH-HV
Potential crop extent (15m) Potential crop area at SoS (3m) Crop growth extent (15m)
Cultivated Area (15m)
Multi-year PALSAR-1 data in dry season 1-day InSAR CSK at SoS Intra-annual ASAR AP data after SoS
Science Team meeting #18 – JAXA RESTEC HQ, Tokyo, November 7-10, 2012
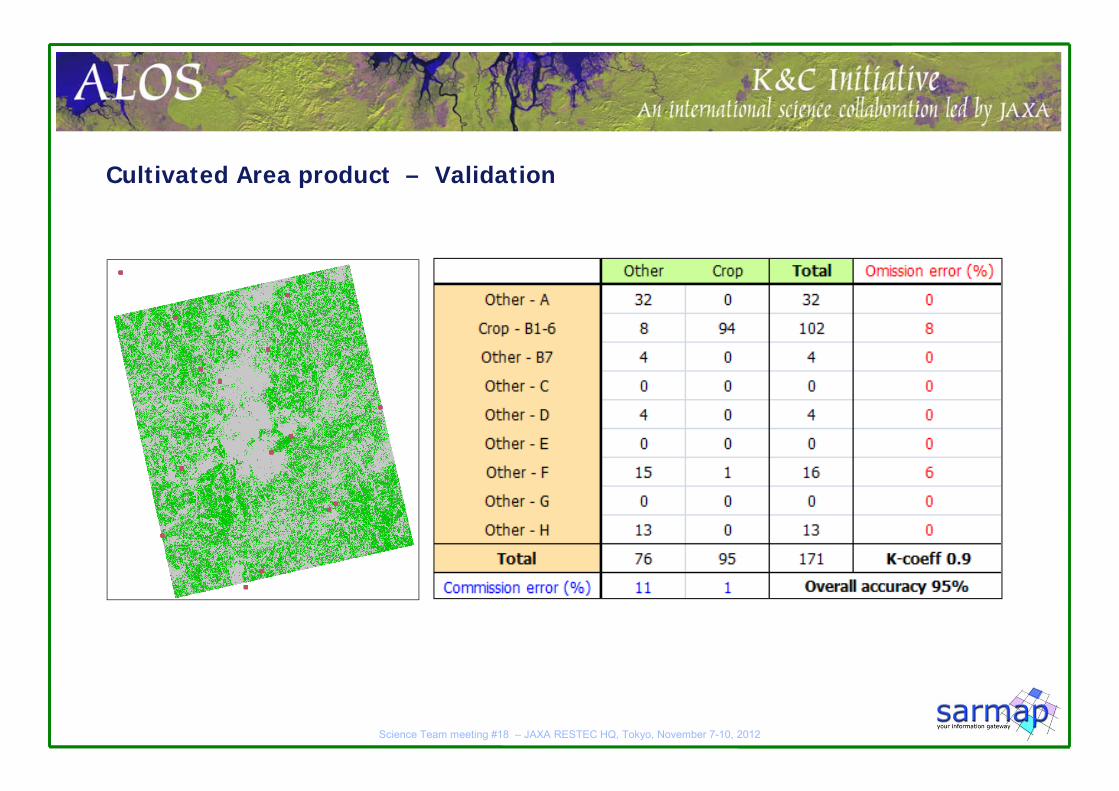
Cultivated Area product – Validation
Science Team meeting #18 – JAXA RESTEC HQ, Tokyo, November 7-10, 2012
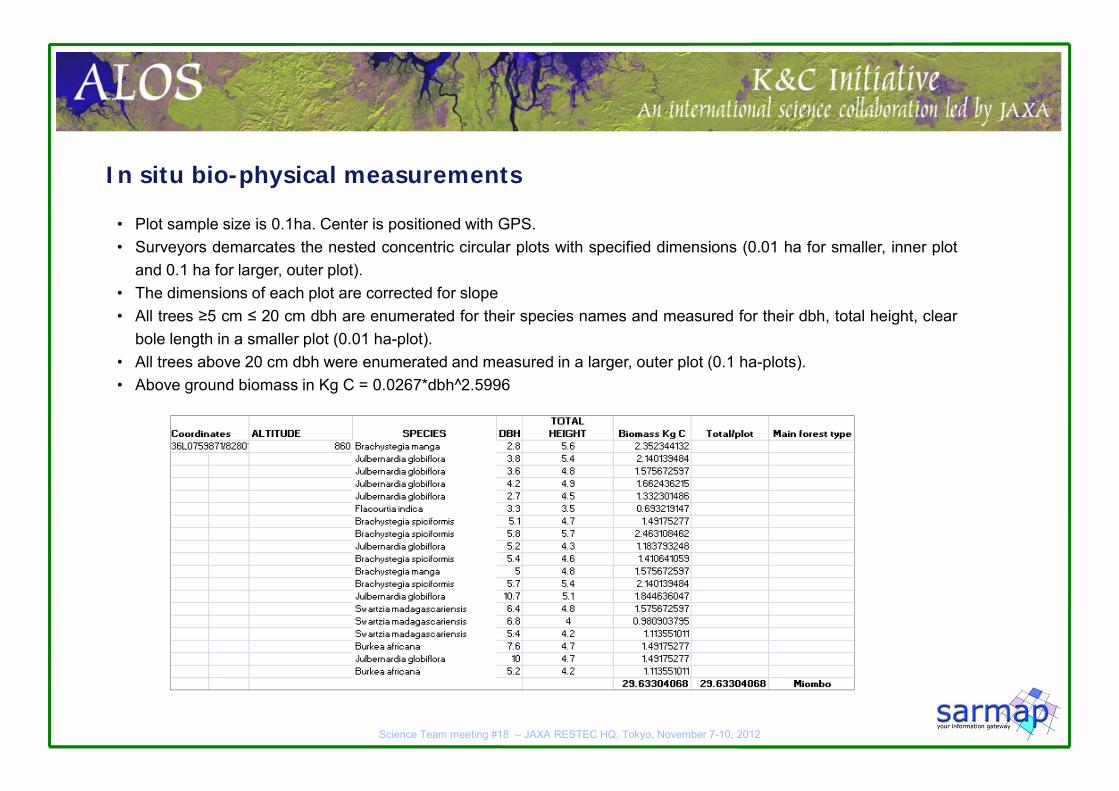
In situ bio-physical measurements
• Plot sample size is 0.1ha. Center is positioned with GPS.• Surveyors demarcates the nested concentric circular plots with specified dimensions (0.01 ha for smaller, inner plot
and 0.1 ha for larger, outer plot).• The dimensions of each plot are corrected for slope• All trees ≥5 cm ≤ 20 cm dbh are enumerated for their species names and measured for their dbh, total height, clear
bole length in a smaller plot (0.01 ha-plot).• All trees above 20 cm dbh were enumerated and measured in a larger, outer plot (0.1 ha-plots).• Above ground biomass in Kg C = 0.0267*dbh^2.5996
Science Team meeting #18 – JAXA RESTEC HQ, Tokyo, November 7-10, 2012
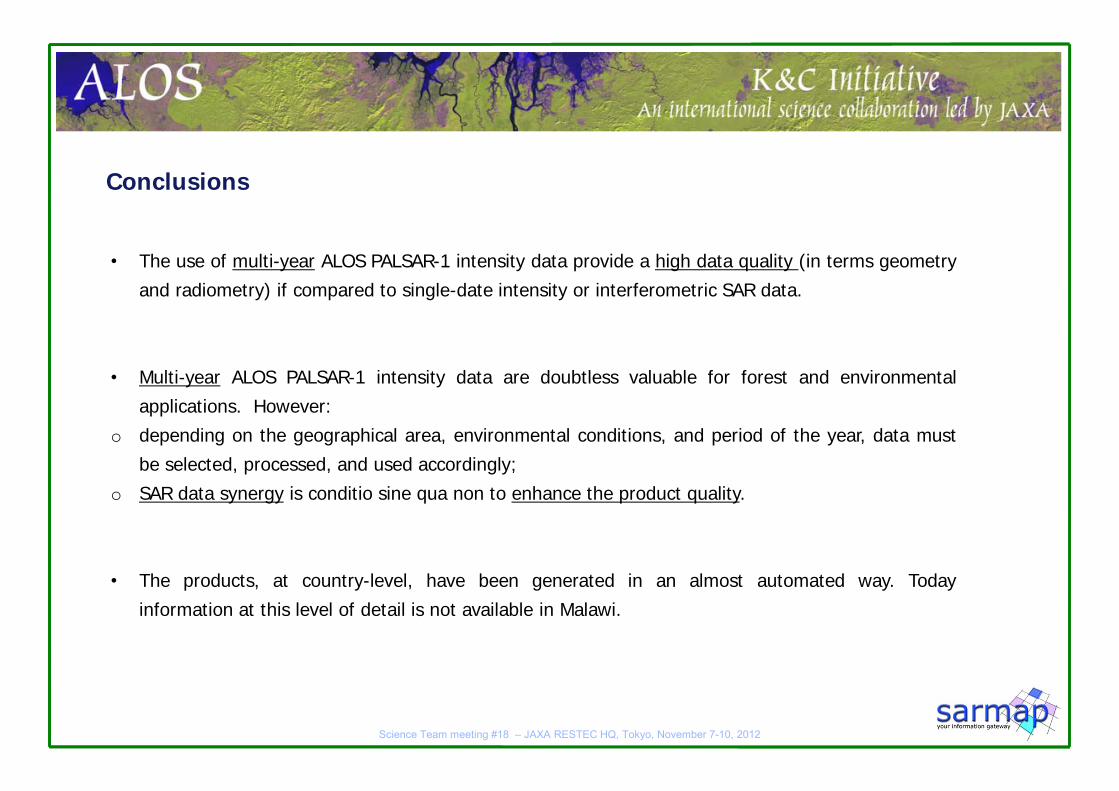
• The use of multi-year ALOS PALSAR-1 intensity data provide a high data quality (in terms geometryand radiometry) if compared to single-date intensity or interferometric SAR data.
• Multi-year ALOS PALSAR-1 intensity data are doubtless valuable for forest and environmentalapplications. However:
o depending on the geographical area, environmental conditions, and period of the year, data mustbe selected, processed, and used accordingly;
o SAR data synergy is conditio sine qua non to enhance the product quality.
• The products, at country-level, have been generated in an almost automated way. Todayinformation at this level of detail is not available in Malawi.
Conclusions
Science Team meeting #18 – JAXA RESTEC HQ, Tokyo, November 7-10, 2012
• The Japanese Aerospace Exploration Agency is acknowledged for the provision
of ALOS PALSAR-1 data.
• The European Space Agency is acknowledged for the provision of ENVISAT ASAR
data.
• The Italian Space Agency is acknowledged for the provision of Cosmo-SkyMed
data.
Acknowledgments
Science Team meeting #18 – JAXA RESTEC HQ, Tokyo, November 7-10, 2012
• Digital Elevation Model
• Forest map
• Forest biomass map
• Cultivated area map
• Validation points
• In situ biophysical data
Deliverables
Science Team meeting #18 – JAXA RESTEC HQ, Tokyo, November 7-10, 2012
2
3
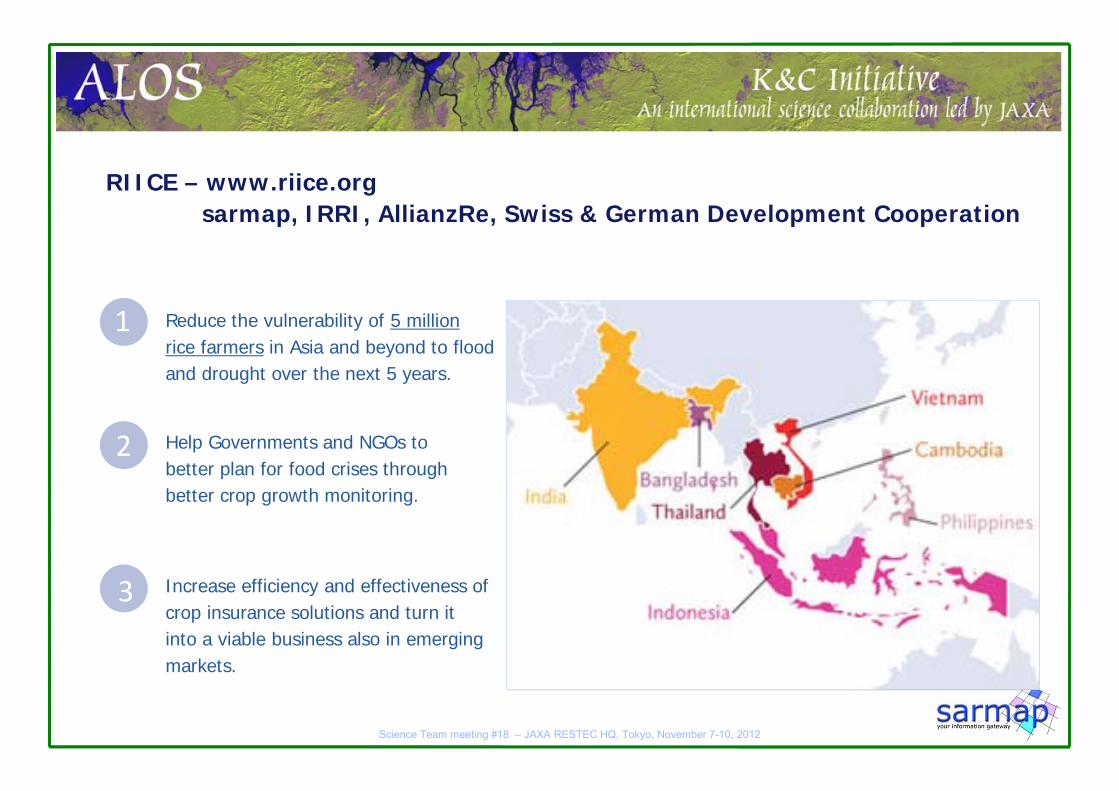
Reduce the vulnerability of 5 millionrice farmers in Asia and beyond to flood and drought over the next 5 years.
Help Governments and NGOs to better plan for food crises through better crop growth monitoring.
Increase efficiency and effectiveness of crop insurance solutions and turn it into a viable business also in emerging markets.
1
RIICE – www.riice.orgsarmap, IRRI, AllianzRe, Swiss & German Development Cooperation
Science Team meeting #18 – JAXA RESTEC HQ, Tokyo, November 7-10, 2012
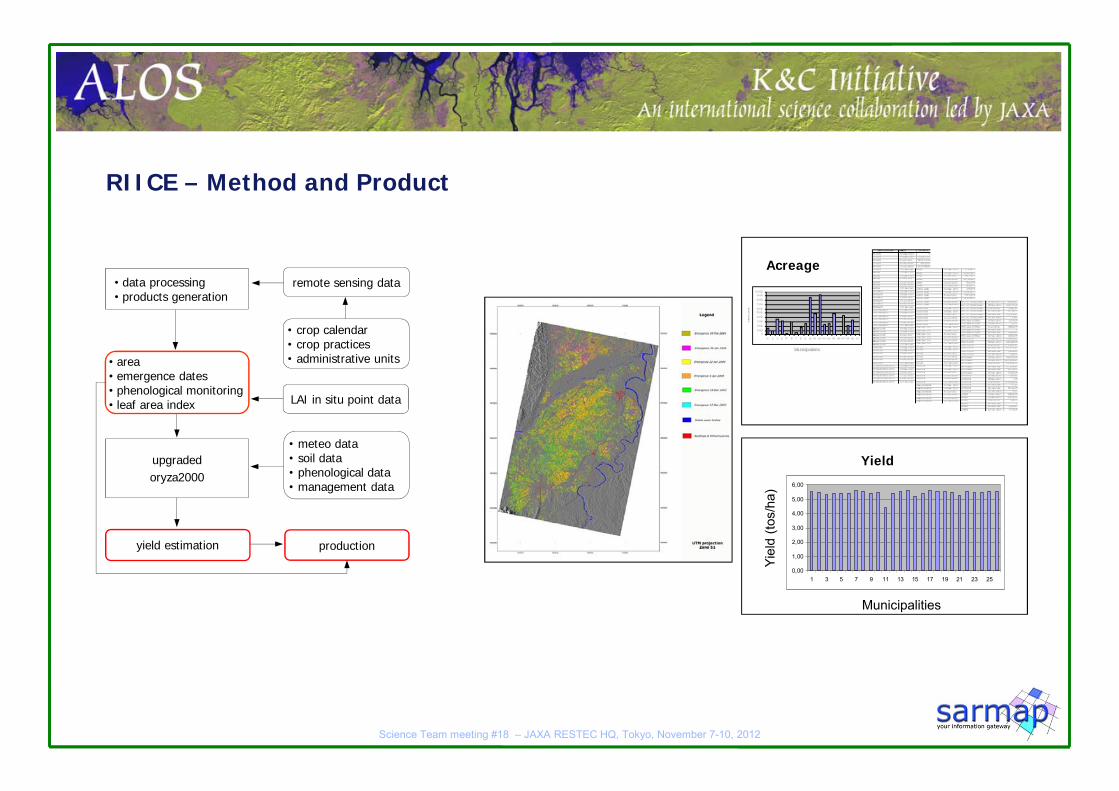
RIICE – Method and Product
• crop calendar• crop practices• administrative units
upgradedoryza2000
• meteo data• soil data• phenological data• management data
yield estimation production
• area• emergence dates• phenological monitoring • leaf area index
• data processing• products generation
remote sensing data
LAI in situ point data
Municipalities
Yiel
d (to
s/ha
)
0,00
1,00
2,00
3,00
4,00
5,00
6,00
1 3 5 7 9 11 13 15 17 19 21 23 25
Acreage
Yield
Science Team meeting #18 – JAXA RESTEC HQ, Tokyo, November 7-10, 2012
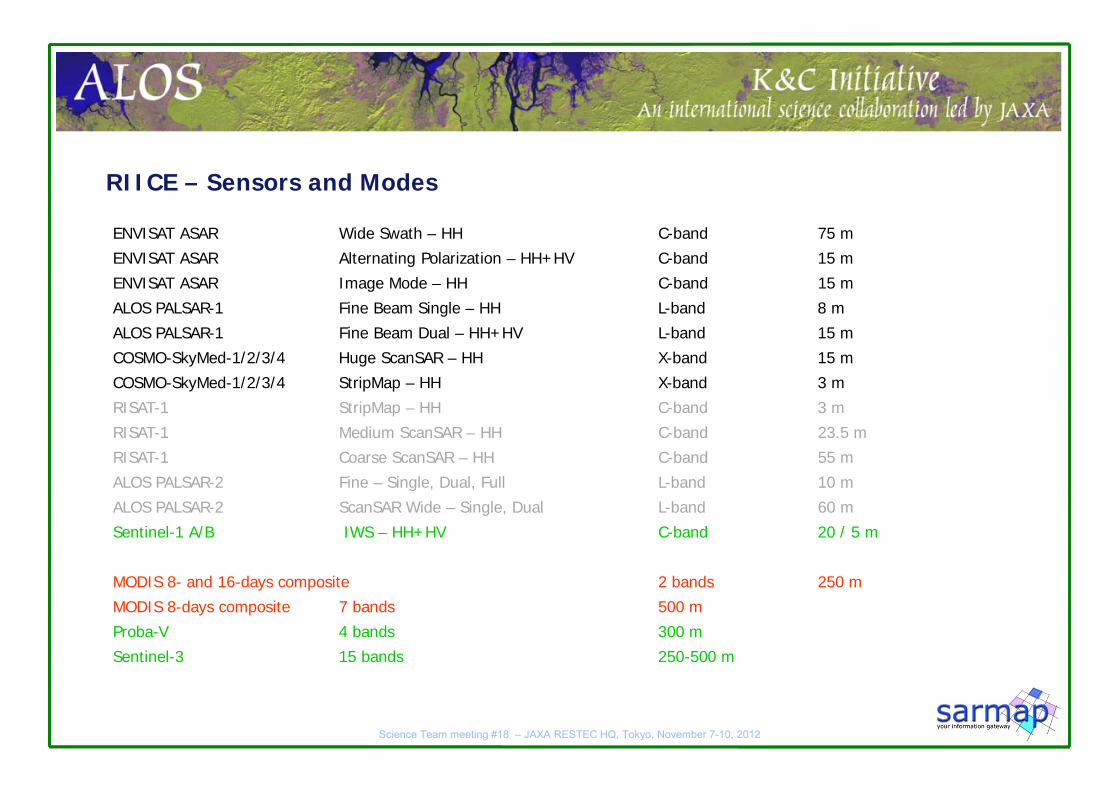
RIICE – Sensors and Modes
ENVISAT ASAR Wide Swath – HH C-band 75 mENVISAT ASAR Alternating Polarization – HH+HV C-band 15 mENVISAT ASAR Image Mode – HH C-band 15 mALOS PALSAR-1 Fine Beam Single – HH L-band 8 mALOS PALSAR-1 Fine Beam Dual – HH+HV L-band 15 mCOSMO-SkyMed-1/2/3/4 Huge ScanSAR – HH X-band 15 mCOSMO-SkyMed-1/2/3/4 StripMap – HH X-band 3 mRISAT-1 StripMap – HH C-band 3 mRISAT-1 Medium ScanSAR – HH C-band 23.5 mRISAT-1 Coarse ScanSAR – HH C-band 55 mALOS PALSAR-2 Fine – Single, Dual, Full L-band 10 mALOS PALSAR-2 ScanSAR Wide – Single, Dual L-band 60 mSentinel-1 A/B IWS – HH+HV C-band 20 / 5 m
MODIS 8- and 16-days composite 2 bands 250 mMODIS 8-days composite 7 bands 500 mProba-V 4 bands 300 mSentinel-3 15 bands 250-500 m
Science Team meeting #18 – JAXA RESTEC HQ, Tokyo, November 7-10, 2012
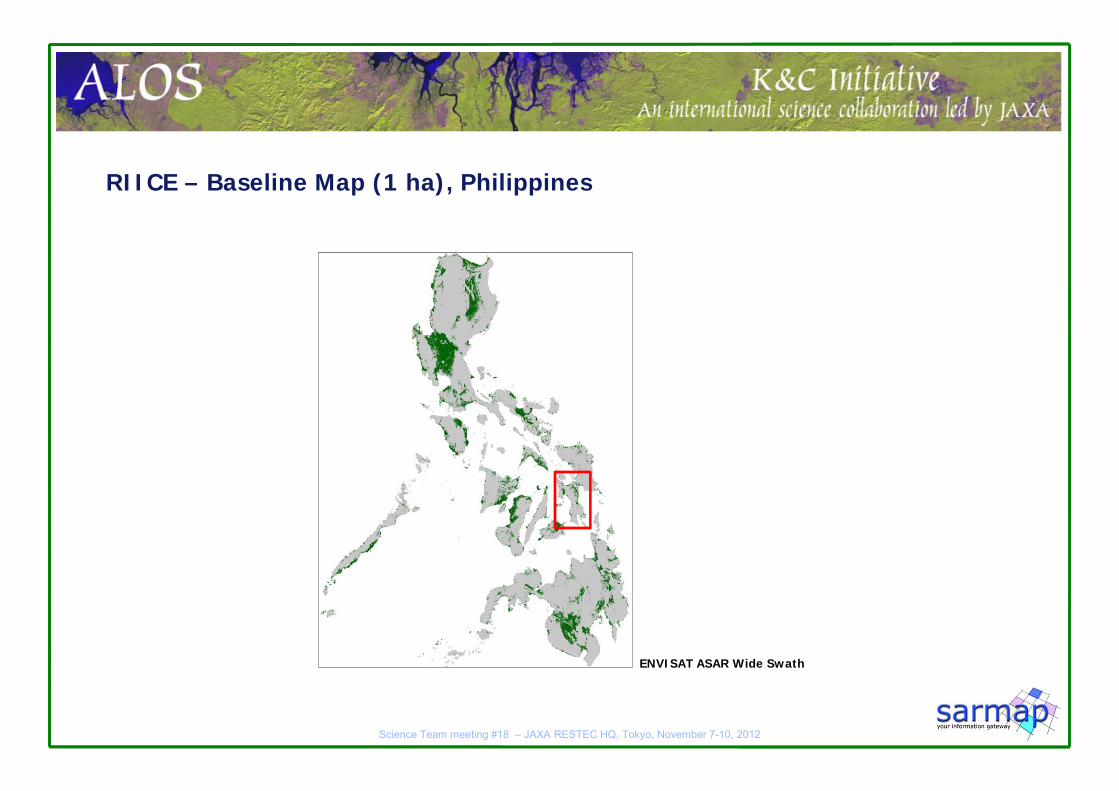
RIICE – Baseline Map (1 ha), Philippines
ENVISAT ASAR Wide Swath
Science Team meeting #18 – JAXA RESTEC HQ, Tokyo, November 7-10, 2012
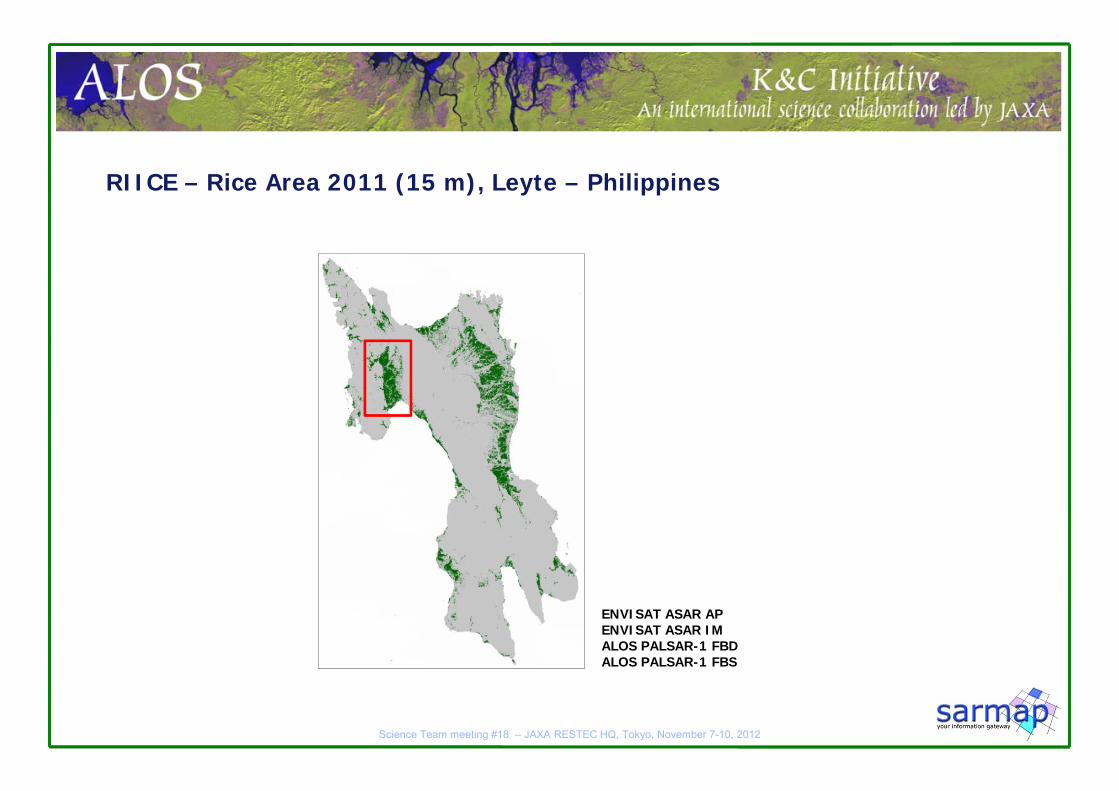
RIICE – Rice Area 2011 (15 m), Leyte – Philippines
ENVISAT ASAR APENVISAT ASAR IMALOS PALSAR-1 FBDALOS PALSAR-1 FBS
Science Team meeting #18 – JAXA RESTEC HQ, Tokyo, November 7-10, 2012
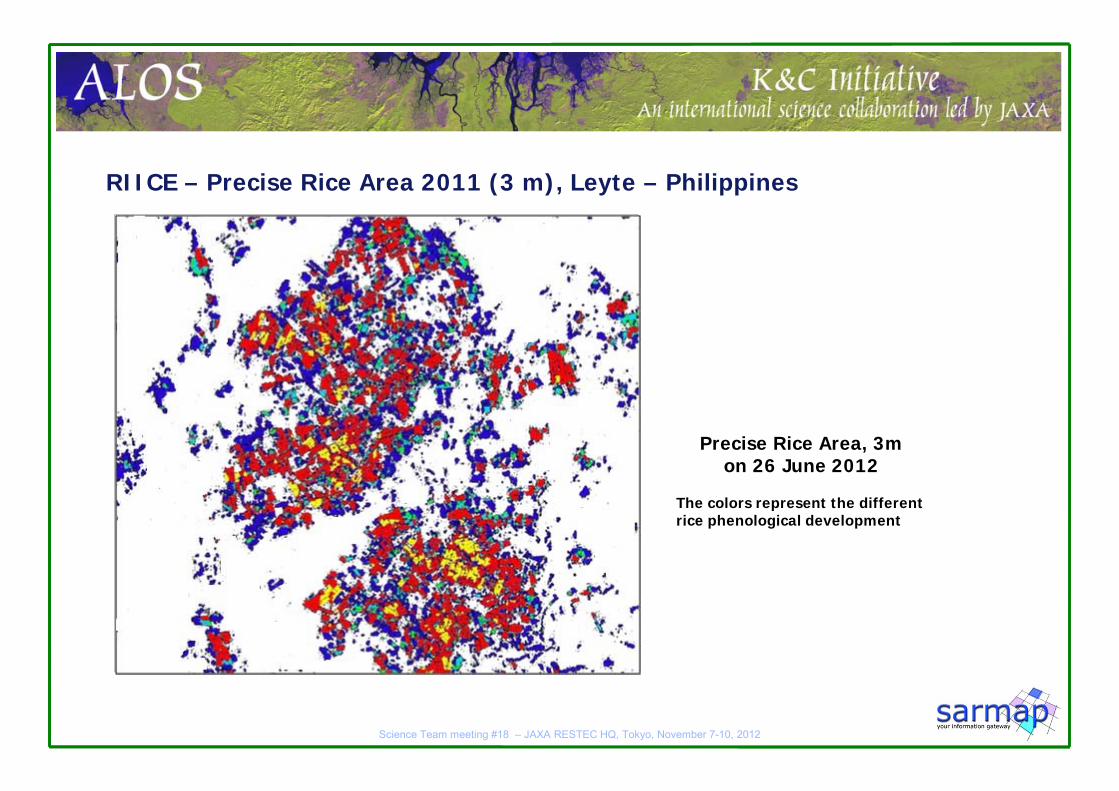
RIICE – Precise Rice Area 2011 (3 m), Leyte – Philippines
Actual Rice Area 2011, 15m
Precise Rice Area, 3m on 26 June 2012
The colors represent the different rice phenological development
Science Team meeting #18 – JAXA RESTEC HQ, Tokyo, November 7-10, 2012
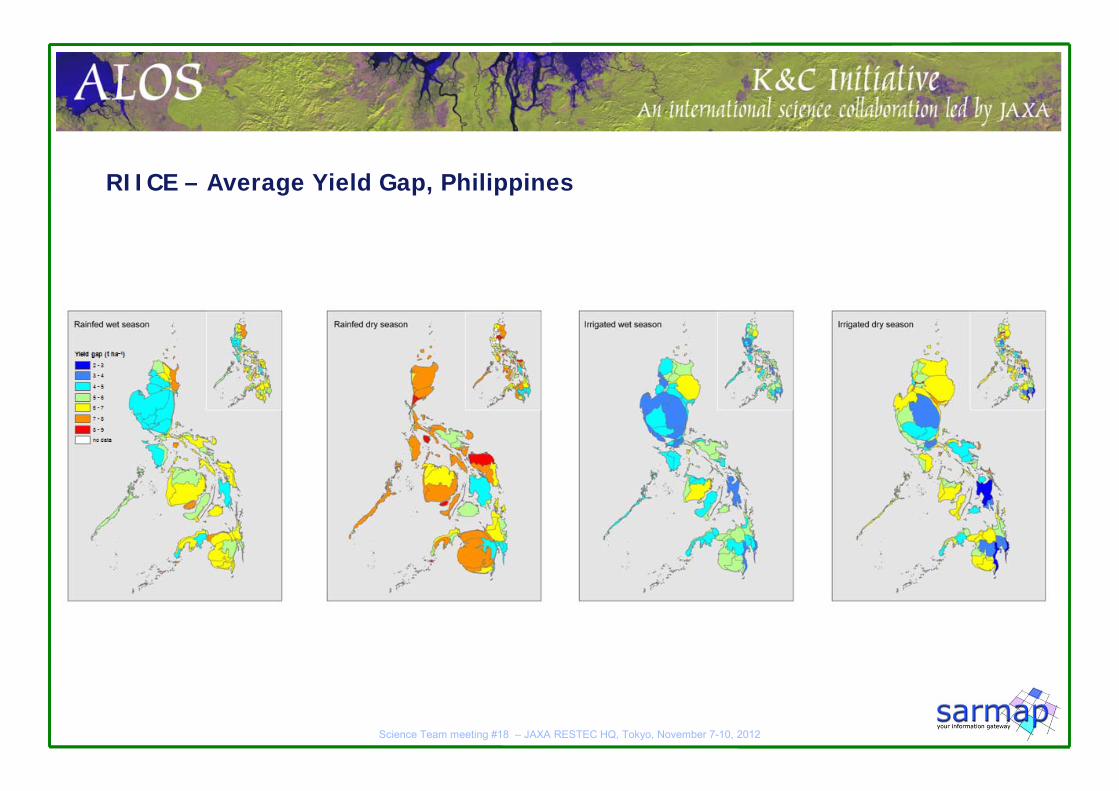
RIICE – Average Yield Gap, Philippines