making the green journey work
DESCRIPTION
Making the Green Journey WorkTRANSCRIPT

Making the Green Journey Work
Optimised pathways to reach 2050 abatement targets with lower costs and improved feasibility
February 2011


This document reports the findings of research undertaken by the European Gas Advocacy Forum, an industry group including Centrica, Eni, E.ON Ruhrgas, Gazprom, GDF SUEZ, Qatar Petroleum, Shell and Statoil.
The information and conclusions contained in this report represent the collective view of the working groups of this study and not that of individual companies or organisations. Any information and conclusions provided in this document are for reference purposes only and are not intended as, nor should they be used as, a substitute for professional advice or judgement in any given circumstance. The companies and organisations involved do not guarantee the adequacy, accuracy, timeliness or completeness of the report’s contents. These companies and organisations therefore disclaim any and all warranties and repre-sentations concerning said contents, express or implied, including any warranties of fitness for a particular purpose or use.
McKinsey & Company, a global management consulting firm, provided analytical support which the Forum considered for this study. McKinsey & Company did not assess any policy options and any conclusions, recommendations or positions reflected in this report are those of the forum, not of McKinsey & Company.
Although this study refers to work done by the European Climate Foundation (ECF), the ECF has not been involved in producing this report.
i


Preface
Previous reports suggest that achieving Europe’s 2050 emission reduction targets will be neither easy nor cheap, and that there may be significant barriers to implementing the changes that will be necessary.
The European Gas Advocacy Forum was formed to contribute new insights to this critical issue. The Forum’s objective for its study was to create an integrated fact-base to support the development of lowest-cost options within the framework of Europe’s 2050 objectives. It represents the collective view of the working groups of this study but does not reflect that of individual companies or organizations.
The study accepts emission reduction targets as ‘given’, even where those targets may be very hard to deliver in practice. It also takes into account several constraints that place upper and lower limits on the pace of implementation and on the mixes of conventional and new technologies for power generation in Europe. The study emphasises cost-effec-tiveness, and offers a technical analysis to support the formulation of the necessary steps to achieving the targets.
This report is intended to facilitate a transparent debate about how to best achieve the emission reductions targeted by the EU. It summarises the findings of the study conducted by the members of the European Gas Advocacy Forum. It provides policy makers and industry players with descriptions of three potential comprehensive pathways (the ‘optimised’ pathways) to achieving the 80% CO2 abatement targets by 2050, and the derived intermediate target by 2030. Comparisons are made between these ‘optimised’ pathways and others that have been published previously.
The power sector has been modelled in the greatest detail; the report also considers the industry, buildings and transport sectors.
iii


Contents
Executive Summary 1
1. Introduction 5
2. Methodology 62.1 Input assumptions 62.2 Methodology 62.3 Reference scenarios 82.4 Key inputs 10
3. Technology mix under optimised pathways 173.1 Power generation 17 3.2 Industry 213.3 Buildings 223.4 Road transport 23
4. Economic and implementation implications of optimised pathways 244.1 The period 2010-2030 244.2 The period 2030-2050 29
5. Potential impact of alternative sector abatement targets 31
6. Implications for gas demand 35
Glossary 38
Endnotes 39
Appendix A: Fact sheet 40
Appendix B: Differences between ECF Roadmap 2050 60% RES scenario and IEA WEO 2009 reference case 41
Appendix C: Carbon capture and storage 43
Appendix D: Alternative power generation pathways 2030-2050 44
Appendix E: Road transport 46
Appendix F: Learning rates for renewable energy sources 47
Appendix G: Resilience to a supply shock 48
v


1
Executive Summary
Europe can reach its 2050 80% greenhouse gas reduction target at lower cost, with less risk, and with less challenging implementation than has been suggested by other recent studies such as that of the European Climate Foundation’s Roadmap 2050.I The solution lies in defining the most economically attractive technology mix to meet the targets in the first twenty years, including the 20/20/20 targets, while avoiding any restriction of the available options or any increase in costs for the continued abatement in the second period to 2050. The pathways developed in this analysis make greater use of low-cost generation technologies in the near term, complemented by a significant proportion of renewable energy sources (RES) in order for emissions goals to be met, with the RES share of the power mix growing steadily to 30-34% by 2050.
Reducing costs
The potential for reducing costs is sizable in comparison with the pathways described in the ECF ‘Roadmap 2050’ 60% RES scenario. For the period 2010-2030, total investment costs in the power sector could be €450-550 bn lower, leading to an improvement in overall power-system costsII of ~€500 bn. Additional cost savings of similar magnitude may be possible for the period 2030-2050 but are much more uncertain (See exhibit 1). Our assessment still includes substantial investment in the grid to cater for the increase in renewables.
Exhibit 1
I ‘Roadmap 2050; A practical guide to a prosperous low-carbon Europe’, European Climate Foundation 2010, available at www.roadmap2050.eu
II Total costs in power generation, including capital costs, fuel and operating costs. These costs exclude CO2 costs, unless otherwise stated
Three optimised pathways have been modelled that achieve abatement targets at €450-550 bn lower capex and €500 bn lower total cost to 2030
Pathway Description
60%-RES▪ ECF roadmap 2050 scenario with 60% RES
production share in 2050 (achieving 80% abatement in 2050)
Business as usual▪ Based on IEA WEO 2009 reference case.
Continued reliance on conventional energy sources
Optimised
High gas price pathway
Low gas price pathway
Low gas price, nuclear sensitivity
▪ Energy mix with lowest cost within CO2constraints (achieving 80% abatement in 2050)– Gas price growth as assumed by IEA
($10.5 / mmbtu in 2010 to $14.8 by 2030)
– Current hub price remains applicable($7.5 / mmbtu)
– Current hub price ($7.5 / mmbtu), and constraint on nuclear build-up
1 Cumulative, Power sector only 2 At IEA gas prices
1,2003,3002
450 500
550 500
500 500
600 400
Capex1 Total cost1
Impact 2010-2030
Savings compared to 60%-RES

On a household level, these improvements would translate into annual cost savings of €150-250. Energy-intensive industries, which employ 20-25 million people in Europe, could avoid an increase of costs that would equal around 5-10% of their profits if they were unable to charge through or otherwise compensate for higher energy costs .
The optimised pathways have final and cumulative CO2 emissions that are very close to the straight line decline between 2010 and 2050.
Reducing implementation risk
Adopting the optimised pathways for 2010-2030 defined by this study would allow Europe more time to select and fine-tune its preferred carbon abatement plans (See exhibit 2).
Exhibit 2
The optimised pathways present less risk during implementation, because of reduced dependence on technological developments from emerging technologies; less need to switch to a new wholesale price-setting mechanism; and more reliance on a gas infra-structure that is already in place. Societal acceptance could be easier as a less extensive build-out of wind and solar generation capacity would be needed. The resulting power-system would require less transmission and back-up capacity to be sufficiently robust, thereby also reducing country interdependence.
There would also be more time for Europe to achieve some of the preparations necessary if, after review, it was nonetheless decided to implement very large shares of intermittent power generation technologies (including, for example, the build-out of international trans-mission grids), the construction of a new regulatory regime for power wholesale markets, or international collaboration in planning and operation of the energy system.
2
Benefits of the optimised pathways are lower costs, less risk, and a reliable and secure energy system
Robust, reliable and secure energy system+Lower risks and easier
implementation
▪ Focus on mature technologies reduces reliance on technological breakthroughs
▪ Easier societal acceptance as a result of less wind and grid build-out
▪ Allows new technologies to mature before implementing
▪ Less aggressive overhaul of wholesale pricing required
▪ Period to 2030 can be used to bring CCS to full maturity
▪ Security of gas supply through growth in reserves, surplus infrastructure and increasing number of suppliers
▪ Robust power system due to a balanced technology mix with lower reliance on intermittent technologies
▪ Lower country interdependence due to lower requirements for cross-border interconnection
▪ €150-250 lower annual cost per household
▪ 5-10% decrease in profit margins could be avoided in energy intensive industries
▪ 20-25 million jobs will not be affected by higher energy costs in energy intensive industries
▪ Up to €450-550 bn less investment necessary
Substantial benefits to society +

3
Increasing robustness of power system and security of supply
The optimised pathways would safeguard the robustness of the power system and security of supply. Through a lower reliance on intermittent technologies, a 25-40% lower build-up of transmission capacity would be necessary. Security of gas supply would be ensured, since proven reserves are large and increasing. As a result of current and planned construction of new LNG capacity and pipelines, there is ample supply capacity and a diversification of the supplier base.
Pathway to realising these benefits
2010-2030: For the first period CO2 abatement is achieved by a build-out of RES, comple-mented by a mix of gas and nuclear capacity (adjusted to gas price) that progressively replaces coal-fired capacity.
2030-2050: Several options exist for the second period, each of which is in the same range or more attractive than the ECF ‘Roadmap 2050’ 60% RES at current price-forecasts. The choice of the pathway in the second period can be delayed until approximately 2025, allowing the emergence of more clarity on the costs and overall attractiveness of each low-/no-carbon power-source: CCS, nuclear, biomass and RES.
Further options to improve feasibility
This report identifies further abatement opportunities that could allow sectoral emission targets to be over-achieved: additional coal to gas and biomass with CCS in power; LNG in shipping and heavy duty vehicles. Such measures would allow the most challenging abatement goals to be relaxed in other sectors. In particular, heat pump penetration in the residential sector could be reduced from 90% to 32%, greatly increasing the feasibility of the abatement pathway, while still achieving overall EU abatement goals.

4

5
1. Introduction
During the G8 meeting in L’Aquila in July 2009, Europe agreed to a target of 80% reduction in emissions by 2050 (compared to 1990 levels) if global action is taken. Then, in October 2009, the European Council set the CO2 abatement objective for Europe at 80-95% below 1990 levels by 2050.
Meeting these abatement targets will be extremely challenging. But recent research by the European Climate Foundation (ECF) and others has concluded that it can be done.
This study builds on the work of the ECF. The objective is to further explore potential pathways to 2050 abatement goals but look more deeply at cost and implementation challenges. Three ‘optimised pathways’ have been developed that meet these EU greenhouse gas abatement objectives in the most economical and feasible way. It draws on a rigorous fact-based analysis to address the significant barriers to successful imple-mentation highlighted in previous reports.
This report addresses the entire sectoral scope of the EU27, Norway and Switzerland, with a major focus on the power sector and minor focus on the industrial, buildings and road transport sectors. The report focuses primarily on CO2 emissions; other greenhouse gases have been included in the ECF baseline scenario, but are not further analysed here.
Two time-periods are distinguished in this study, each covering 20 years. The first period, 2010-2030, has been modelled in the greatest detail and is consitent with 20/20/20 targets. The quantitative results for this period (CO2 abatement, investment needed, etc.) are much more certain than those for the second period. The period 2030-2050 has been assessed primarily to understand which potential pathways are ultimately most attractive and ensure that the choices made in the 2010-2030 period will not be undermined by a restriction of optionality, higher costs, or increased risks in the second period.
The power-generation sector has been modelled in greatest depth. For the 2010-2030 period, technology mixes are optimised on lowest overall costs to reach the stipulated CO2 abatement targets.1 For the second period (2030-2050) a balanced mix of generation technologies has been postulated rather than derived from modelling. This reflects the greater uncertainty about prices and costs so far in the future.
The industry, buildings and road transport sectors have been analysed in less depth but with the goal of optimising the sector technology mix to reach the CO2 abatement targets while accounting for the uncertainties and practical constraints that exist today.
The study does not analyse in detail societal or transition implementation risks (e.g., resistance to nuclear power or to CCS by local communities). These risks could be significant, especially when the required new capacities of controversial technologies become sizable in the later years.

The study’s methodology for constructing the ‘optimised’ pathways is outlined here is three sections: the input assumptions, the methods used, and scenarios and pathways from the ECF report that were used as reference points. Additionally, the ‘key inputs’ that informed the development of the optimised pathways are detailed in this chapter.
2.1 Input assumptions
This study’s input assumptions are to the same as those used in the IEA’s World Energy Outlook 20093 (with the one exception mentioned below) and in the ECF ‘Roadmap 2050’ published in 20104. This is the case for all elements, including the overall economic context (GDP growth, population growth, energy intensity development etc.), energy demand (baseline, and in an 80% abatement world), and technology characteristics (including learning rates of emerging power-generation technologies). For commodity prices, an additional pathway has been modelled in addition to the IEA WEO 2009 price scenarios.
2.2 Methodology
This study models three optimised pathways that minimize the total costs to society of meeting the 2050 CO2 abatement targets. These three pathways capture the uncertainties regarding commodity prices,and the advances of RES and nuclear power technologies. The optimised pathways vary only in the power sector. For the industry, buildings, and road transport sector they are the same. (See exhibit 3).
Exhibit 3
6
2. Methodology
Methodology
Other sectors (Industry, Buildings, Road transport)
Power generation
▪ Three pathways modelled:– Low gas price ($7.5/mmbtu)– High gas price (increase from $10.5-$14.8/mmbtu)– Low gas price, nuclear sensitivity ($7.5/mmbtu, limited construction of nuclear)
▪ Determination of power generation mix 2010-2030:– Optimisation of overall costs– Adaptation of mix to reach CO2 targets
▪ Determination of power generation mix 2030-2050:– Assuming a balanced mix of generation technologies by 2050
(mix of RES, nuclear, coal CCS, gas CCS)
▪ Implementation of efficiency measures:– Based on McKinsey GHG abatement cost curve
▪ Additional abatement measures– Based on ECF Roadmap 2050, taking into account cost and ease of
implementation

7
To ensure as feasible a solution as possible, some boundary conditions have been set, applying to all three optimised pathways:
� Reduction of overall economy-wide GHG (Green House Gas) emissions in EU27 by 80% in 2050 compared to 1990 levels. The CO2 emission reductions required per sector have been taken from the ECF ‘Roadmap 2050’ report. The modelling imposes the requirement that each sector meets its target in 2050, or that a shortfall in one sector is compensated for in another. For simplicity, the 2030 abatement target has been set halfway between the 2010 actual emissions and the 2050 targeted emission-level per sector, as derived from the ECF ‘Roadmap 2050’ report.
� To avoid ‘extreme’ results from modelling, no single generation technology can capture 100% of new-build capacity. Similarly, no generation technology is completely phased out.
� Energy supply has to be secure, and the power system has to be robust.
Methodology in the power sector
Power demand projections are based on the ECF ‘Roadmap 2050’ report. This power demand growth, coupled with the retirement of existing generation assets at the end of their assumed lifetimes, requires a certain amount of new-build generation capacity every year.
For the power sector, three pathways have been modelled and optimised.
� The low gas price pathway assumes a continuation of the current hub prices for gas until 2050, at a constant price of $7.5/mmbtu. This gas price assumption reflects a scenario in which the continued loose supply situation for gas leads to a continuation of current hub prices. All other commodity prices remain the same as in the baseline. Maximum total nuclear capacity is capped at 200GW in 2030 (compared with 140GW in 2010), which is in line with the midpoint of the high and low cases described by the World Nuclear Association.
� The high gas price pathway assumes that the gas price climbs to $14.8/mmbtu in 2030 and stays at that level until 2050, in line with the IEA WEO 2009 prices. All other prices are kept the same as in the ECF ‘Roadmap 2050’. The maximum total nuclear capacity is capped at 200GW in 2030 (compared with 140GW in 2010), which is in line with the midpoint of the high and low cases from the World Nuclear Association.
� The low gas price, nuclear sensitivity pathway uses the same fuel price assumptions as the low gas price pathway. Additionally this pathway assumes that, because of constraints on societal acceptance, the construction of new nuclear capacity is limited by 40% relative to the ‘low gas price’ pathway, or to 30GW by 2030.
For all optimised pathways, in the period 2010-2030 the technology mix of generation-capacity additions is driven by the overall costs (investment + running costs) of each technology in each year (which depend in turn on the fuel-price assumptions). To avoid extreme outcomes, no technology is either fully phased out or can capture 100% of all new-build capacity. Secondly, the generation mix is adapted where needed to meet the CO2
abatement target for the power sector.

For the period 2030-2050, additional generation capacity is added using a balanced technology mix, acknowledging the uncertainty regarding prices and costs in the distant future. The ‘low gas price’ and ‘high gas price’ pathways use roughly equal shares of renewables, nuclear, gas CCS, and coal CCS. The ‘low gas price, nuclear sensitivity’ pathway uses ~65% gas CCS, ~30% RES, ~5% coal CCS, but no nuclear. Additional sensitivities (e.g., with either higher RES or CCS shares) are shown in appendix D.
Methodology in the other sectors
In the other major energy-demand sectors (industry, buildings and road transport), the different levers and technologies for CO2 abatement are assessed.
The first step is an assessment of the energy-efficiency measures that could be imple-mented beyond those already assumed in the baseline scenario. For the identification of these potential measures, the McKinsey GHG abatement cost curves are used.
In the second step, the remaining options for carbon abatement are assessed on the bases of cost and ease of implementation. In industry, buildings and road transport, there is some potential for CO2 abatement by means of a fuel-shift from conventional fuels to non-emitting fuels. In the industry sector, there is an additional potential to reduce emissions through the use of CCS.
2.3 Reference scenarios
Comparisons are made with two ‘reference’ scenarios. The ‘baseline’ reference scenario involves not reaching the 80% emission targets; this is the ‘business as usual’ scenario from the IEA World Energy Outlook 2009 reference case, with the extensions defined in ECF ‘Roadmap 2050’. The ‘60% RES’ scenario, based on the case in the ECF ‘Roadmap 2050’ report, shows the 80% emission targets being realised. Each of these scenarios makes a good reference case as they are comprehensive, they share many assumptions, and together they span the space of likely developments of the energy sector and abatement targets. It should be noted that the ECF ‘Roadmap 2050’ also includes two other scenarios: a 40% and an 80% RES.
Baseline reference scenario
The baseline reference scenario used in this report takes a ‘no new policies’ view, and therefore does not realize the 80% abatement target in 2050. This baseline scenario matches the baseline scenario used in the ECF ‘Roadmap 2050’ report. Its key dimensions are as follows:
� The baseline scenario is based on several sources, mainly the IEA WEO 2009 further extended by Oxford Economics. Growth in demand and emissions in 2030-2050 are extrapolated from similar trends in energy, power and emissions intensity as 2010-2030.
� The scenario assumes that climate policies in force are carried through, but no additional policies are implemented. In practice this means that the 20/20/20 targets are achieved, but no additional policies come into force after that.
8

9
� Overall GDP is assumed to grow from €10 tn in 2010 to €22 tn in 2050, while population remains stable.
� Energy demand is assumed to grow by 10% between 2010 and 2050, delinking from GDP growth on the basis of large efficiency improvements of 1-1.5% per year.
� Power demand increases by 40% between 2010 and 2050. Energy efficiency improves at around 1% per year.
� GHG emissions remain mostly flat until 2050 relative to 2010 levels, as significant emission intensity improvements offset the increase in energy usage.
60% RES scenario
The ‘60% RES’ scenario from the ECF ‘Roadmap 2050’ is used as a reference case in which the EU emission reduction targets are achieved. The 60% RES scenario is based on the IEA WEO 2009 reference case, and uses the same assumptions as the baseline. However, in order to achieve the abatement targets, additional actions are taken:
� In power generation, a 60% share of renewable energy sources is postulated for 2050. Within this 60%, a balanced mix of various technologies is used. The build-up assumes a ~50% renewable share in 2030.
� All sectors implement the complete set of efficiency measures as detailed in the McKinsey Green House Gas abatement cost curve5.
� In industry there is a fuel-shift to heat pumps for low-grade heat (10% of total heating demand) and CCS on 50% of point emissions in industry in 2050.
� In buildings there is a 90% fuel-shift from conventional heating to heat pumps.
� In road transport there is a fuel-shift towards electric power trains (~70% of total km driven), complemented by hybrids (20%), hydrogen (~5%), and biofuels (~5%). By 2050, ~1% of kilometres driven remain powered by fossil fuels.
� In air and sea transport there is a fuel-shift to biofuels of ~30% of total energy used in these sectors.
See appendix B for a more detailed comparison between the reference scenarios and the optimised pathways.

2.4 Key inputs
The key inputs used in the optimised pathways are described below.
Abatement targets per sector
In order to reach the targeted 80% emission reductions in 2050, reductions are necessary in every sector of the economy. For the abatement targets per sector, this study assumes the same targets as the ECF ‘Roadmap 2050’ report, which developed these sector targets as a result of an analysis of the available abatement levers in each sector. It is therefore assumed that abatement targets are 95% for power-generation, 40% for industry, 90% for buildings and for road transport, and 70% for other sectors (air and sea transport, waste, agriculture and forestry). See exhibit 4 for an overview.
Exhibit 4
Oil, gas, coal, nuclear and CO2 prices
For the period until 2030, prices are taken from the IEA WEO 2009. Beyond 2030, prices are assumed to remain flat in real terms. For the gas price, three pathways have been modelled. For the ‘high gas price’ pathway the IEA WEO 2009 prices are used; these are in the range $10.5-14.8/mmbtu, in line with a more resource-constrained potential future (See exhibit 5). The ‘low gas price’ and the ‘low gas price, nuclear sensitivity’ pathways assume that real gas prices remain at the 2010 hub-level of $7.5/mmbtu, representing a potential future with continued abundance of available gas. These gas prices reflect a broad range of possibilities and not two alternatives. Please note that for the calculation of total power-system costs (see chapter 3), no CO2 price has been taken into account. For the investment decisions in the power sector however, CO2 prices are taken into account.
10
The EU target of 80% decarbonisation implies nearly full decarbonisation in power, buildings and road transport, and large reduction in industry
SOURCE: ECF Roadmap 2050
GtCO2e per year
0.9
0.9
1.0
1.2
1990
5.9
1.2
1.2
20500.4 0.1 0.10.7
0.1
2010
5.2
-80%
Series
Other sectors1
Transport (Road)
Buildings
Industry
Power
Power
Industry
Buildings
Transport (Road)
Other sectors1
~95%
~40%
~90%
~90%
~ 70%
Total emissions Abatement target per sector
Addressed in this report
1 Other sectors include air and sea transport, waste, agriculture and forestry.

11
Exhibit 5
Power demand
Power demand is based on that in the ECF ‘Roadmap 2050’ scenarios. Power demand increases by ~40% between 2010 and 2050, from ~3,250 to ~4,800 TWh6. Two opposite effects are driving the demand development: efficiency measures reduce power demand, while electrification of industry, buildings and road transport increases it. The second effect more than offsets the first.
Energy efficiency measures in industry and buildings
In industry, there is a substantial efficiency improvement potential, as identified by the McKinsey GHG global cost curves. However, the full abatement potential of 0.3Gt CO2
from industrial energy-efficiency is already fully included in the baseline scenario and therefore also in the optimised pathways. In the buildings sector, the baseline includes ~10% of total abatement potential from energy efficiency. In the optimised pathways, the full abatement potential in buildings has been assumed (as these are the most cost-effective measures), leading to an additional 0.3Gt CO2 abatement by 2050.
Energy price assumptions
SOURCE: ECF Roadmap 2050; Consensus Economics; Bloomberg; Expert interviews
1 IEA WEO 2009 price forecasts until 2030; held constant to 2050
0
50
100
150
2000 2010 2020 2030 2040 2050
CoalUSD/tonne
0
5
10
15
2000 2010 2020 2030 2040 2050
GasUSD/mmbtu
0
50
100
150
2000 2010 2020 2030 2040 2050
OilUSD/bbl
CO2EUR/tonne
01020304050
2000 2010 2020 2030 2040 2050
$7.5/mmbtu
IEA price path1
Actuals+futures(as at Nov 2010)

Fuel shift in industry and buildings
For industry, the optimised pathways assume a fuel-shift of 10% of energy demand towards heat pumps, representing low-grade heating, similar to the ECF ‘Roadmap 2050.’ In buildings, a 90% fuel-shift is assumed, similar to the ECF ‘Roadmap 2050’ in size in order to achieve the sector-target of 90% CO2 abatement. However, where the ECF ‘Roadmap 2050’ assumes that heat pumps will achieve a 90% market share in all buildings, the optimised pathways assume a 50-70% share in 2050, reflecting barriers to heat pump implementation. This share can be achieved by assuming heat pump implementation in new commercial and residential buildings, and by retrofitting existing commercial buildings: that is, without retrofitting existing residential buildings. The remaining 20-40% will be met by biofuels and biomethane (10-25%) and resistance heating (10-20%). In 2030, the shares are ~30% heat pumps, and ~5% each for biofuels, biomethane and electric resistance heating.
Supply constraints of RES
Biomass supply is assumed to be limited to ~3,500TWh in 2030 and ~4,600TWh in 2050. This includes 20-30% imports. In line with the ECF ‘Roadmap 2050’, the optimised pathways assume that part of this biomass is used in biofuels for transport, leaving ~2,600TWh available for use in heating and power in 2050. In the optimised pathways ~500TWh is used in heating buildings, leaving ~2,100TWh for power generation. Given average biomass plant efficiency rates, this corresponds to a maximum biomass-fired power-production of ~700TWh. The capacity constraints of wind and solar power are not binding, as these are much higher than the assumed levels in the pathways. For large-scale hydro, a maximum capacity of ~190GW in 2050 is assumed.
Carbon capture and storage
Carbon capture and storage (CCS) has been assumed to be a usable technology on a large scale from 2030. In the optimised pathway, all fossil-fired plants will be equipped with CCS in 2050. Plants that are less than 10 years old in 2030 are CCS-retrofitted; older ones are replaced by plants with CCS when they reach the end of their assumed lifetimes. Plants equipped with CCS emit 10% of the CO2 emitted by plants without CCS (this figure could improve with pre-combustion technology). See appendix C for further notes on CCS.
Power-generation technology
The assumptions are the same as those used in the ECF ‘Roadmap 2050’ report. These include current and future construction and operational costs, fuel efficiencies, plant lifetimes, and maximum feasible European capacity levels (see exhibit 6 for the assumption details). Lifetimes are assumed as 25 years for wind and solar PV; 30 years for gas, oil, solar CSP, biomass, geothermal; 40 years for coal, 45 years for nuclear and 50 years for hydro.
12

13
Exhibit 6
New power-generation capacity needs
The assumptions on the need for new power-generation capacity are similar to those in the ECF ‘Roadmap 2050’. Exhibit 7 shows the share of power-generation that will come from newly built capacity. By 2040, nearly all of today’s existing capacity will need to be replaced, with the exception of hydro plants.
1 Percent cost reduction with every doubling of accumulated installed capacity2 Learning rate of 12% applies to CCS part; Learning of coal/gas plant identical to coal/gas 3 starts in 2020, additional to conventional plants for retrofits 4 France starts with lower capex of 2750 €/kWe; LR on Gen II and Gen III separated 5 Hardcoded input based on workshop including storage
60% RES / 20% nuclear / 20% CCS pathway
RES
Intermittent
Fossil
Nuclear
Non-Intermittent
Learning rate1
Percent
3-5
5
15
5
HC5
Coal Conventional
Gas Conventional
Nuclear4
Wind Onshore
Solar PV
Coal CCS2
Gas CCS2
Coal CCS2 retrofit
Gas CCS2 retrofit
Oil
Wind Offshore
Solar CSP
Biomass dedicated
Geothermal
Hydro
Yearly ReductionsPercent
0.5
0.5
12
12
12
12
0.5
1.0
1.0
0.5
Capex 2010€/kW
1,400-1,600
700-800
2,700-2,9003
2,700-3,300
1,000-1,300
3,000-3,600
2,400-2,700
4,000-6,000
2,300-2,600
2,700-3,300
1,800-2,200
750-850
1,500-1,6003
1,250-1,4503
750-9503
1,250-1,450
650-750
2,000-2,200
2,700-3,300
900-1,200
2,000-2,400
1,000-1,400
2,900-3,500
1,600-1,900
2,000-2,400
1,750-2,000
700-800
1,000-1,200
600-800
350-550
Capex 2030€/kW
Capex 2050€/kW
1,150-1,350
600-700
1,750-1,950
2,600-3,200
900-1,200
1,900-2,300
800-1,200
2,200-2,600
1,300-1,600
1,800-2,200
1,500-1,900
600-700
900-1,100
500-700
300-500
Type of generationGenerationtechnologies
Learning rates and capex assumptions
SOURCE: ECF Roadmap 2050
ECF ROADMAP 2050 ASSUMPTIONS

Exhibit 7
Build-up of coal generation capacity
For 2010-2030, none of the pathways assume construction of new coal-fired plants, as they are less economically attractive than gas-fired and nuclear plants for reaching CO2 abatement targets. As a result, coal-fired production declines. Furthermore, some coal capacity is closed down to ensure that CO2 abatement targets are reached in 2030 (for details see chapter 3). It is estimated that compensating the owners of coal-fired plants for the profits they will forego would lead to costs of €0.5-1 bn. To avoid a complete disappearance of coal-fired generation, a lower bound of 150TWh of coal production is maintained. In the ‘low gas price, nuclear sensitivity’ pathway, this limit is set at 80TWh.
After 2030, CCS-equipped coal-fired plants are assumed to become available. The ‘low gas price’ and ‘high gas price’ pathways assume a construction mix such that 25% of the power generation required to satisfy growing demand and to compensate for plant closings comes from new CCS-equipped coal-fired plants. The ‘low gas price, nuclear sensitivity’ pathway assumes that only a minimal amount of coal-fired capacity is built after 2030.
14
Most of the non-hydro plants will be retired by 2040
SOURCE: ECF Roadmap 2050
Existing fossil
Existing nuclear
Existing RES2
Total power demand
4,800
3,700
20502040
4,400
2030
4,100
20202010
3,250~900
Power supply by existing and yet be built power plants and forecasted power demandTWh1
Additional power generation that needs to be build in order to meet 2020 demand
1 Assumes no change in reserve margin from 2010 to 20502 Existing RES mainly hydro; remains in operation until 2050

15
Build-up of renewable generation capacity
2010-2020: The Optimised pathways assume the fulfilment of the 20/20/20 targets, leading to an extensive RES build-up, and reaching a power generation share of RES of over 30% at 1,300TWh in 2020. Of this share, hydro remains quite stable at around 500TWh, while production from non-hydro RES (wind, solar, biomass) more than triples from ~200 to ~800TWh. The main technology used is onshore wind, with a share of over 50% in non-hydro RES, as it is the most economical technology.
2020-2030: On the basis of economics alone, RES would not be built in this period.To reflect likely continued momentum, a continued build-out of RES of 50-300TWh (depending on the pathway) is assumed, leading to a RES share of ~35-40% in 2030 in a power market that has ~10% higher demand than in 2020. This build-up of RES capacity would likely require subsidies to ensure an economically attractive business case for utilities.
2030-2050: The optimised pathways assume a construction mix in which ~30% of the power generation required to satisfy growing demand and to compensate for plant closings comes from new RES plants (along with roughly equal shares of fossil and nuclear production). The use of this balanced mix is a reflection of uncertainty about costs in the far future. Most widely used technologies are onshore wind and biomass. Sensitivities with higher and lower construction shares for RES in this period are given in Appendix D.
Build-up of nuclear generation capacity
For 2010-2030, the optimised pathways build-up is driven by the relative attractiveness of nuclear technology. In the ‘high gas price’ pathway, which builds most new nuclear capacity, a cap on the total amount of nuclear capacity of 200GW is introduced (compared with an installed capacity of 140GW in 2010)7. In the ‘low gas price, nuclear sensitivity’ pathway, new nuclear builds are constrained to 30GW (in contrast with the 50GW in the ‘low gas price’ scenario) to reflect a possibility of limited societal acceptance of nuclear power stations.
In the ‘high’ and ‘low gas price’ pathways, for 2030-2050, the optimised pathways assume a construction mix in which 20% of the power generation required to satisfy growing demand and to compensate for plant closings comes from new nuclear plants. In the ‘low gas price, nuclear sensitivity’ pathway, no new nuclear capacity is assumed to be built after 2030 apart from replacements of existing capacity.
Build-up of gas generation capacity
For 2030-2050, the optimised pathways build-up is driven by the relative attractiveness of gas-fired technology, within CO2 limits. No other limits apply.

Required investments for power transmission and back-up infrastructure
Assumptions on transmission and back-up capacity were determined after the initial construction of the optimised pathways. They are based on the shares of wind and solar in the optimised pathways energy mixes in 2050 in different pathways, and are derived from the investments and required back-up capacity figures for the different pathways in the ECF ‘Roadmap 2050’ report. For the total transmission investments required in 2010-2050, the optimised pathways assume ~€120 bn, ~€150 bn, and ~€160 bn in the ‘high gas price’, ‘low gas price’, and ‘low gas price, nuclear sensitivity’ pathways respec-tively, based on their shares of intermittent technology. In the ECF ‘Roadmap 2050’ 60% RES scenario, the equivalent investments required amount to ~€200 bn.
Power train technologies in transport
The optimised pathways assume a continuation of the current trend of ever increasing power train efficiency, combined with progressively successful fuel shifts to low-/no-carbon emitting technologies. Given the uncertainties in development of the future power train mix, this study takes as input a scenario that allows for coexistence of all technologies with dominance of specific technologies in certain car segments. The optimised pathways assume that battery electric vehicles will become the main technology, especially in the light-duty-vehicle segment, as this appears to be the most cost-effective technology to abate emissions. For alternative scenarios, see appendix E.
In 2050, in the smaller car segment a 65% penetration of battery electric vehicles, 20% hybrids, 10% fuel cell and 5% biofuels is assumed. In the larger car segments a 50% penetration of fuel cell, 30% bio fuel, ~15% plug-in hybrids and ~5% conventional ICE is assumed (see appendix E for more details).
16

17
3. Technology mix under optimised pathways
This chapter describes the optimised pathways’ technology mix for each sector. For the power sector there are separate results for each of the three pathways; for the other sectors only one pathway has been modelled.
3.1 Power generation
The power-generation sector needs to reduce CO2 by 50% by 2030 because of the requirement for almost full decarbonisation of the sector by 2050. At the same time, power demand increases from 3,250TWh in 2010 to 4,100TWh in 2030 and 4,800TWh in 2050. Results are given below for the three pathways modelled in two time periods 2010-2030 and 2030-2050.
Power generation 2010-2030
The optimised pathways assume linear CO2 abatement to 2050, resulting in a targeted reduction of half of the absolute 2010 CO2 emission level of ~1,200Mt by 2030.
In parallel, it is assumed that by 2030 power demand will have increased 25% to 4,100 TWh. The power-generation mix in this period is determined by the relative economic attractiveness of the various technologies and by a set of ‘reality’ and CO2 constraints (See the ‘Inputs’ section in the methodology chapter).
The generation mix in 2010 is 22% RES, 28% nuclear, 26% gas and 24% coal. For each scenario the power mix for 2030 is calculated in a series of steps laid out below.
‘High gas price’ pathway The power mix in 2030 in the ‘high gas price’ pathway is realised as follows:
A. Total demand in 2030 is 4,100TWh, of which ~2,400TWh will be met by generation capacity already in existence in 2010.
B. As in the ‘low gas price’ pathway, non-hydro RES production grows from 200TWh in 2010 to 800TWh in 2020. Hydro does not contribute to meeting demand growth as it has a fixed production at 500TWh.
C. To meet the remaining demand in 2030, the most economical mix of new generation-capacity is built, which in this pathway is mainly nuclear. This leads to an initial mix of 32% RES, 42% nuclear, 19% coal and 7% gas.
D. Finally the 2030 mix is adjusted to incorporate the nuclear constraints and to ensure it meets the 2030 CO2 emission target. The nuclear constraint puts a limit of 200GW of nuclear capacity in 2030, i.e. a reduction of 25GW and a 200 TWh switch to gas-fired production. (See ‘Inputs’ section of the Methodology chapter for details of constraints). To reach the targeted CO2 emissions, total emissions must then be reduced by 270Mt. This is achieved by replacing 400TWh of coal-fired capacity with 120TWh of RES and 280TWh of gas-fired capacity. This replacement is equivalent to shutting down all coal-fired plants older than ~35 years.

The final energy mix in the ‘high gas price’ pathway is 35% RES, 37% nuclear, 9% coal and 19% gas of the total 2030 production of 4,100TWh. Capacities are 450, 200, 60, and 250GW respectively.
‘Low gas price’ pathwayThe power mix in 2030 in the ‘low gas price’ pathway is realised as follows:
A. Total demand in 2030 is 4,100TWh, of which ~2,400TWh will be met by generation capacity already in existence in 2010.
B. Non-hydro RES production is assumed to grow from ~200TWh in 2010 to ~800TWh in 2020. This growth reflects the 20/20/20 targets, which for the power sector require a RES share of ~35% in 2020. From 2020 to 2030, the amount of RES does not grow in this step, because of the higher cost of RES relative to other technologies. Hydro production remains constant at around 500 TWh for the entire 2010-2030 period.
C. To meet the remaining demand in 2030, the most economical mix of new generation-capacity is built, which in this pathway is mainly gas. This leads to a mix of 32% RES, 26% nuclear, 7% coal and 35% gas. This mix does not yet meet the target CO2 emission levels.
D. Finally the 2030 mix is adjusted to ensure it meets the 2030 CO2 emission target. The above steps lead to a CO2 emissions level that is 160 Mt higher than the target of 600Mt, and therefore needs to be reduced. The most economical way to do so is as follows: 160TWh of coal-fired and 80TWh of gas-fired production are replaced with production from RES. As a result, RES production will grow 230TWh between 2020 and 2030. Coal-fired production is reduced to its lower bound of 150TWh. This replacement is equivalent to closing down all coal-fired plants older than ~35 years.
The final energy mix in the ‘low gas price’ pathway is thus 37% RES, 26% nuclear, 4% coal and 33% gas of the total 2030 production of 4,100 TWh. Capacities are 500, 140, 50, and 250 GW respectively. Since this a low share of coal compared with today’s, the coal-fired capacity will be used at low load factor (38%).
‘Low gas price, nuclear sensitivity’ pathway The power mix in 2030 in the ‘low gas price, nuclear sensitivity’ pathway is realised as follows:
A. Total demand in 2030 is 4,100TWh, of which ~2,400TWh will be met by generation capacity already in existence in 2010.
B. As is the case in the ‘low gas price’ and ‘high gas price’ scenarios, non-hydro RES production grows from 200TWh in 2010 to 800TWh in 2020, and hydro remains constant at 500TWh.
C. To meet the remaining demand in 2030, the most economical mix of new generation-capacity is built. This leads to a mix of 32% RES, 26% nuclear, 7% coal and 35% gas, as is the case in the ‘low gas price’ scenario. This mix does not yet meet the target CO2
emission levels.
18

19
D. Finally the 2030 mix is adjusted to incorporate the nuclear constraints and to ensure it meets the 2030 CO2 emission target. The nuclear constraint puts a limit of 30GW of nuclear new-build capacity in 2030, in contrast with the 50GW new-build capacity in the ‘low gas price’ pathway (see the ‘Inputs’ section in the Methodology chapter for details of constraints). Thus 150TWh of nuclear production is replaced with gas. To reach the CO2 emission target of 600Mt in 2030 for the power sector, emissions need to be further reduced by 220Mt. This is achieved by replacing 220TWh of coal-fired production and 100TWh of gas-fired production with RES. This replacement is equivalent to shutting down all coal-fired plants older than ~30 years.
The final energy mix in the ‘low gas price, nuclear sensitivity’ pathway is 39% RES, 22% nuclear, 2% coal and 36% gas of the total 2030 production of 4,100TWh.
Capacities are 520, 120, 30, and 270GW respectively. Since this is a low share of coal compared with today’s, the remaining coal-fired capacity will be used at low load factor (38%).
For an overview of the resulting power mixes, see exhibit 8.
Exhibit 8
Power mix 2030 – Optimised pathways have lower shares of RES and coal in the production mix, compensated by additional gas and nuclear
SOURCE: ECF roadmap 2050, Platts, IEA
BAU 26% 8% 18% 20% 29%
Low gas price,nuclear constraints 32% 7% 22% 2% 36%
Low gas price 30% 7% 26% 4% 33%
High gas price 28% 7% 37% 9% 19%
60%-RES 42% 8% 21% 11% 19%
Production mixTWh
2030
Other RES Biomass Nuclear Coal Gas
20% 2% 28% 26%24%2010
Percent of total

Power generation 2010-2030, CO2 sensitivity
The pathways described above have also been modelled with a much higher CO2 price, climbing to €100/t by 2030. The resulting pathways are very similar to the current pathways in terms of power mixes and overall power system costs. The power mixes do not materially change as the relative attractiveness and other constraints remain similar compared to the original scenarios. Since societal costs do not take into account CO2 costs (as the revenues stay within the society, much like a tax) total power system costs do not change with a change in CO2 price.
Power generation 2030-2050
For 2030-2050, the optimised pathways realise near-full CO2 abatement in each pathway through the phase-out of all conventional fossil-fuel-fired plants (i.e. those without CCS). It assumes a balanced 2030-2050 construction mix of fossil CCS, nuclear, and RES technologies.
For each of the other two pathways, two alternatives are modelled: ‘CCS build-up’ and ‘RES build-up’. These also achieve near-full abatement, but with a different construction mix. ‘CCS build-up’ relies heavily on the wide application of CCS, and ‘RES build-up’ is renewables-heavy. See appendix D for details.
The optimised pathways assume a balanced application of renewables, nuclear, and fossil CCS technologies after 2030. The mixes are postulated rather than calculated.
‘High gas price’ pathway The construction mix for new plants is the same as for the ‘low gas price’ pathway. As the 2030 generation-mix involves a lot of nuclear with associated long lifetimes, the 2050 mix is also more geared towards nuclear. In 2050 the generation-mix shares will be RES 41%, nuclear 38%, coal CCS 7%, and gas CCS 14%. Capacities are 580, 240, 50, and 310GW respectively.
‘Low gas price’ pathway Of new plants built after 2030, 25% are assumed gas CCS, 25% are assumed coal CCS, 20% are assumed nuclear, 30% are assumed RES. Conventional coal and gas plants less than 10 years old in 2030 are retrofitted with CCS. Older ones are closed before 2050. In 2050 the generation-mix shares are RES 43%, nuclear, 29% coal CCS 8%, and gas CCS 19%. Capacities are 640, 180, 50, and 330 GW respectively.
‘Low gas price, nuclear sensitivity’ pathway Of new plants built after 2030, 65% are assumed gas CCS, 5% are assumed coal CCS, 0% are assumed nuclear, 30% are assumed RES. Conventional coal and gas plants less than 10 years old in 2030 are retrofitted with CCS. Older ones are closed before 2050. In 2050 the generation mix shares will be RES 45%, nuclear 19%, coal CCS 2%, and gas CCS 34%. Capacities are 660, 120, 10, and 420GW respectively. (See exhibit 9 for an overview of resulting power mixes in 2050).
20

21
Exhibit 9
3.2 Industry
The IEA WEO 2009 reference case scenario assumes an aggressive implementation of energy efficiency measures. As a result, CO2 emissions remain flat until 2030. The optimised pathways assume that these energy-efficiency measures will be achieved by 2030. Additionally, it is assumed that a start is made with a fuel shift towards heat pumps for low-grade heating (leading to a fuel shift of 5% of total demand in 2030). These two assumptions are equal to the ECF 60% RES scenario.
Beyond 2030, the optimised pathways assume a further implementation of heat pumps for low-grade heating, leading to a 10% shift of total energy demand in industry in 2050.
To further reduce emissions, CCS implementation is required. The optimised pathways assume CCS is implemented with a 10 year delay relative to the ECF ‘Roadmap 2050’ 60% RES scenario, leading to a 40% lower implementation of CCS in 2050. In the optimised pathways, the same CO2 abatement can be reached through either an implementation of measures to reach 40% CO2 abatement in the industrial sector alone, or a shift of 0.2Gt of CO2 abatement targets to the power sector and the implementation of CCS in biomass plants.
Power mix 2050 – Optimised pathways have lower shares of RES and coalin the production mix, compensated by additional gas and nuclear
SOURCE: ECF Roadmap 2050; Platts; IEA
2050
Other RES Biomass Nuclear Coal CCS Gas CCS
20% 2% 28% 24% 26%
Production mixTWh
2010
11% 19% 2% 34%Low gas price,nuclear constraints
BAU 8% 18% 19% 29%25%
34%
Low gas price 32% 11% 29% 8% 19%
High gas price 30% 11% 38% 7% 14%
60%-RES 52% 8% 20% 10% 10%
Percent of total
3.3 Buildings
In the buildings sector, the IEA WEO 2009 reference case scenario assumes implemen-tation of energy efficiency measures, leading to emissions that are more or less flat. In the optimised pathways, further energy efficiency measures will be implemented before 2030. This leads to a significant CO2 abatement of 0.3Gt by 2030. While this assumption is more aggressive than in the baseline scenario, it is equal to that of the 60% RES scenario.
To realise the required additional CO2 abatement following from the sector abatement targets (copied from ECF), a fuel shift in buildings towards more CO2 neutral space heating is required. The optimised pathways assume the replacement of ~45% of conventional boilers by 2030. They will be replaced with heat pumps in areas most suited for this solution, leading to a heat pump penetration of ~30% in 2030, next to combined ~15% of biogas/biomass and resistance heating.
Heat pumps are the most efficient CO2 neutral technology for household heating, since they use heat from the surrounding air or ground as a source. However, implementation of heat pumps can be difficult. First, heat pumps are capex intensive, since they require the installation of a heat source; as a result, payback times are generally long (>5 years). Research has shown that many homeowners are unwilling to make an investment with such a long payback time.8 Second, the space required by either a ground or air heat source will make implementation difficult in densely populated areas. A 2030 heat pump share of ~40% is assumed, which corresponds to implementation in new builds and commercial renovation segments from 2010.
Heating technologies based on biomass could be used as an alternative to electrification. Biomass boilers burn solid fuel, and therefore require an extensive distribution system. As a result, this technology is likely to have a limited potential at a large scale. Another biomass-based heating solution is the creation of biogas. This gas could be upgraded and injected in the conventional gas grid, and in that way creates a CO2-neutral fuel for conven-tional boilers. The economic profile of this technology is currently uncertain, and this will limit adoption on a large scale. Both biomass based technologies compete for a limited supply of biomass that can also be used for other purposes, such as power generation and biofuels in transport.
An alternative technology that relies on electric energy is resistance heating. While this type of heating is generally cheap and easy to install, the low efficiency compared to heat pumps makes it an expensive technology because of its higher operating costs.
A mix of biomass, biogas and resistance heating is assumed to be implemented in the areas where heat pumps are not economical, leading to a combined penetration of ~15%.
Beyond 2030, the optimised pathways assume a further implementation of heat pumps to a share of 50-70%, unless biogas/biomass can increase its share from the assumed 10-25% in 2050. Resistance heating could gain share in areas where heat pumps and biomass/biogas solutions are not attractive, to a total share of up to 20%. Any remaining heat demand will likely be addressed by conventional natural gas boilers. This devel-opment of technologies represents a continuation of the fuel shift from 2010-2030.
22

23
3.4 Road transport
The optimised pathways assume a continuation of the current trend of ever increasing power train efficiency, combined with a progressively successful fuel shift to low-/no-carbon technologies.
In 2030, the road transport sector is assumed to consist of a mix of technologies, reflecting divergent customer needs between and within segments. Following the inputs outlined in the ‘Inputs’ section and appendix E, 50% of vehicles will have shifted to low-/no-carbon fuels in 2030. The smaller car segment will have a ~30% penetration of battery electric vehicles, 10% hybrids, and ~5% each for biofuels and hydrogen. Larger car segments will see a 25% penetration of fuel cell, ~15% bio fuel and ~10% plug-in hybrids.
Beyond 2030, the road transport sector is assumed to have an increasing penetration of electric, hydrogen and (plug-in) hybrid cars, with conventional ICE on biofuel and fossil fuels playing a small role in heavy-duty vehicles only. The smaller car segment will have a 65% penetration of battery electric vehicles, 20% hybrids, 10% fuel cell and 5% biofuels. Larger car segments will see a 50% penetration of fuel cell, 30% bio fuel, ~15% plug-in hybrids and ~5% conventional ICE.

4.1 The period 2010-2030
CO2 abatement
The optimised pathways enable Europe to achieve its ambition of an economy wide 80% reduction in CO2 emissions by 2050. This implies a 40-45% reduction in CO2 emissions by 2030, relative to 2010 emissions levels. Cumulative CO2 emissions are also comparable with the ECF ‘Roadmap 2050’ 60% RES pathway.
Costs and investments
The optimised pathways favour the lowest cost and most reliable measures for CO2
reduction in the period to 2030. Total costs in the power sector could be ~€500bn lower than the ECF ‘Roadmap 2050’ 60% RES pathway. Compared with the IEA WEO 2009 reference case, total power costs (excluding CO2 costs) will be €0-50bn lower (See exhibit 10 for an overview).
Exhibit 10
The optimised pathways require €450-550 bn less cumulative capital expenditure in comparison with the ECF ‘Roadmap 2050’ 60% RES (power sector only). The savings are mainly a result of building fewer renewables, and to a small extent because of a different mix of renewable energy sources. For a discussion of the effect on learning rates, see appendix F. The savings will be spread unevenly across different countries. In terms of capital expenditure, Germany and the UK are expected to save ~€100 bn, while France is expected to save ~€55 bn. Other beneficiaries are expected to be Spain, Ireland, Poland, Portugal and the Netherlands.
24
4. Economic and implementation implications of optimised pathways
The optimised pathway achieves CO2 reduction at lower costsand capexCO2 emissionsGt CO2e
Cumulative capex (power gen)€ trn
Total power costs€ trn
SOURCE: IEA; Platts; ECF Roadmap 2050
Overall gas demandbcm
2010 2020 2030 2040 2050
3
2
1
0
-0.5
-0.8
0123456
2010 2020 2030 2040 2050
-40%-80%
0
200
400
600
2010 2020 2030 2040 2050
+120+95
2010 2020 2030 2040 2050
76543210
-0.5
-0.6
Optimised: Low gas price, nuclear sensitivity
Optimised: Low gas price
Optimised: High gas price
60%-RES
Business-as-usual

25
In the ‘high gas price’ pathway, total required capital investments are €750 bn, mainly driven by new nuclear, wind onshore, and biomass capacity. Required transmission investments are €73 bn. Still it requires €450 bn less investment than the ECF 60% RES pathway and the total power system costs are €500 bn lower (€2,800 bn versus €3,300bn at high gas prices).
In the ‘low gas price’ pathway, total required capital investments are €675 bn, driven mainly by investments in onshore wind, biomass, nuclear, and gas capacity, and include €91 bn investments in transmission. This is €550 bn lower than the investments required in the ECF 60% RES pathway. The advantage in total costs is €500 bn (€2,450 bn versus €2,950 bn at low gas prices), which is lower than the investment advantage due to higher fuel costs in the optimised pathway.
In the ‘low gas price, nuclear sensitivity’ pathway, total required capital investments are mainly driven by investments in onshore wind, biomass, nuclear and gas capacity, and include €94 bn in transmission. This is €500 bn lower than the ECF 60% RES pathway. The total power system costs are €500 bn lower than the ECF 60% RES pathway (€2,450 bn versus €2,950 bn at low gas prices).
Potential impact of the cost savings
Compared to the 60% RES pathway, investment savings in power generation amount to an average of ~€150-250 per European household (a figure derived by dividing the total savings by the number of European households). Energy-intensive industries – which employ 20-25 million in Europe – could avoid a 5-10% decline in profits that would follow increased energy costs assuming that companies could not raise their prices accordingly.9
(See exhibit 11).
Exhibit 11
Effect of the lower energy investment needs on households, industry and economy as a whole are sizable
SOURCE: ECF Roadmap 2050
Households1 Industrials1 JobsConsolidated investments
Impact compared with Roadmap 2050 60%-RES pathway, 2030
€150-250 lower annual cost of
power per household
5-10% decrease in profit margins
could be avoided driven by energy price increases in
alternative renewables-heavy
scenarios
20-25 million jobs will not be affected
by higher energy costs
in energy intensive industries
Investments of up to €450-550 billion will be avoided in 2010-30 relative to
the renewables-intensive pathways, with further savings potential in 2030-50
1 Includes direct and indirect effects of lower costs in power generation

Energy robustness and security
The optimised pathways power system would be robust given a large share of reliable generation, with less dependency on increasingly intensive international collaboration or additional international power transmission lines (See exhibit 12).
Exhibit 12
Security of gas supply is ensured in the optimised pathways, with demand well inside the level that can be reliably supplied:
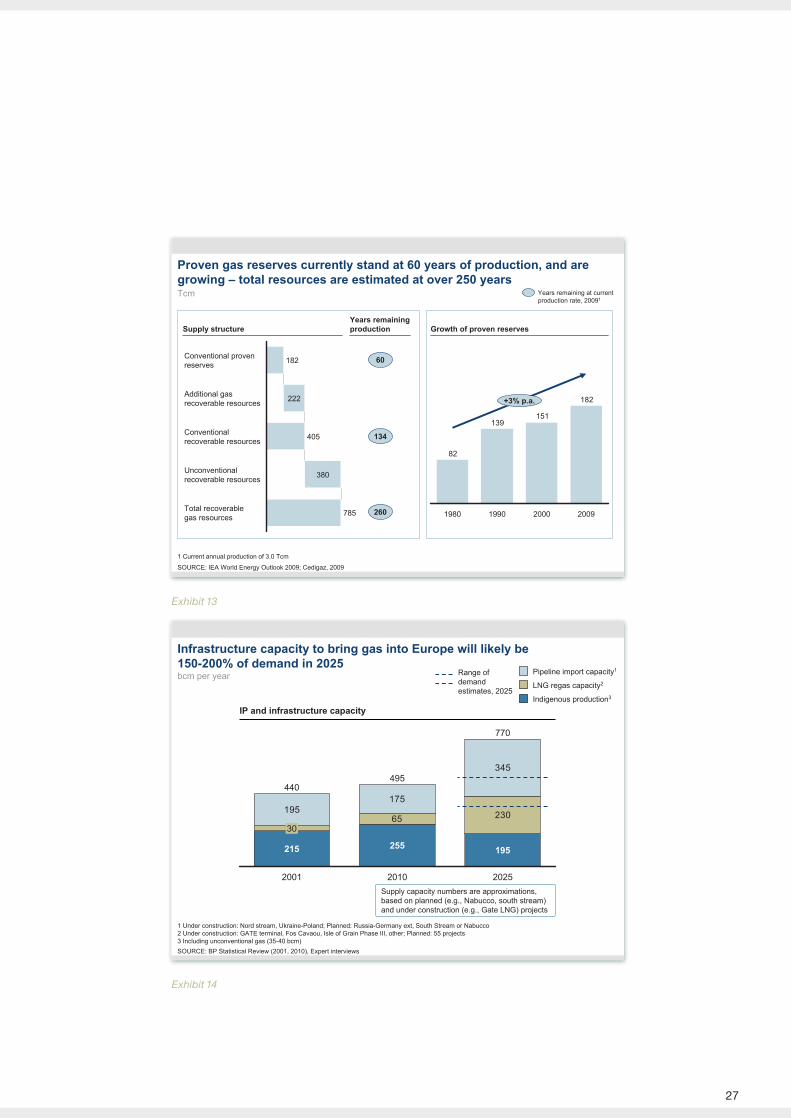
� Gas is an energy source with large proven reserves (>60 years) and total resources estimated at over 250 years. (See exhibit 13). Europe is well positioned to access 70-80% of global reserves.
� Infrastructure capacity to bring gas into Europe will likely be 150-200% of demand, as a result of the flat-to-negative demand and the significant build-out in LNG and piped capacity. (See exhibit 14).
� The number of suppliers to Europe is increasing, thereby decreasing vulnerability against default of any source. Even in the unlikely event of a complete default of the two target import routes, Europe will still have sufficient supply capacity to secure the gas it needs. (See appendix G).
26
Optimised pathways lead to a power system that requires less transmission and back-up capacity
SOURCE: ECF Roadmap 2050
2030 capacity, GW
60
71
68
79
120
-35-45%
25
94
91
73
124
-25-40%
514
177BAU
Low gas price,nuclear constraints 284
Low gas price 253
High gas price 212
60%-RES
-45-60%
SolarOffshorewind
Onshorewind
Intermittent power generationGW
Back-up/balancing capacity requiredGW
Additional transmission build-up€ bn
27
Exhibit 13
Exhibit 14
Proven gas reserves currently stand at 60 years of production, and are growing – total resources are estimated at over 250 years
Total recoverablegas resources 785
Unconventionalrecoverable resources 380
Conventionalrecoverable resources 405
Additional gasrecoverable resources 222
Conventional provenreserves 182
Tcm
1 Current annual production of 3.0 Tcm
SOURCE: IEA World Energy Outlook 2009; Cedigaz, 2009
60
Years remaining at current production rate, 20091
134
260
Years remaining production
182
151139
82
+3% p.a.
2009200019901980
Growth of proven reservesSupply structure
Infrastructure capacity to bring gas into Europe will likely be 150-200% of demand in 2025bcm per year
65 230195175
345
2025
770
195
2010
495
255
2001
440
215
30
Indigenous production3
LNG regas capacity2
Pipeline import capacity1Range of demand estimates, 2025
IP and infrastructure capacity
SOURCE: BP Statistical Review (2001, 2010), Expert interviews
1 Under construction: Nord stream, Ukraine-Poland; Planned: Russia-Germany ext, South Stream or Nabucco2 Under construction: GATE terminal, Fos Cavaou, Isle of Grain Phase III, other; Planned: 55 projects 3 Including unconventional gas (35-40 bcm)
Supply capacity numbers are approximations, based on planned (e.g., Nabucco, south stream) and under construction (e.g., Gate LNG) projects
Supply capacity numbers are approximations, based on planned (e.g., Nabucco, south stream) and under construction (e.g., Gate LNG) projects

Ease and flexibility of implementation
Through the use of mature and easily implementable technologies, the optimised pathways are less reliant on technological developments, transmission build-out, and the need to overcome the corresponding societal concerns than the base scenario. For at least the first period, the optimised pathways require less internationally aligned planning and operation of the power system. Our overview by sector includes a comparison with the ECF ‘Roadmap 2050’.
� Power generation: CO2 targets are reached with a diversified mix of technologies, including (existing) proven technologies that do not rely on pan-European build-out of transmission and back-up capacity:
— Larger share of proven technologies in new-build capacity beyond 2020. — Lower reliance on intermittent generation that requires pan-European build-out of
transmission and cross-grid cooperation/balancing of power. — Potential to use existing assets for CO2 abatement (increase load factor of existing
gas-fired plant to replace coal/lignite production). — ECF 60% RES relies on a large share of emerging, intermittent technologies such
as offshore wind and solar to achieve CO2 abatement.
� Industry: Flexibility to delay and/or shift CCS abatement measures to other sectors (e.g., biomass with CCS in power generation):
— Option of implementing all measures to reach 40% CO2 abatement in industrial sector alone or shifting upto 0.2Gt CO2 of abatement measures to the power sector by implementing CCS at biomass plants instead of at industrial sites.
— ECF 60% RES assumes that a 40% CO2 abatement is reached in industry alone.
� Buildings: Balanced build-up of no-carbon space-heating technologies: — Heat pumps are assumed to be implementable in 50-70% of cases, corresponding
to implementation in all new builds and commercial renovation as of 2010, or alternatively all non-densely-populated areas.
— Remaining heat demand is filled by biomethane, biomass boilers, resistance heating or conventional heating depending on circumstances.
— ECF 60% RES assumes a shift to heat pumps in 90% of cases, which implies implementing heat pumps in situations that are less suitable (e.g., densely-populated areas).
— The potential impact of stranded costs, new technologies and impact on residential sector of carbon offsetting and trading is not considered.
� Road transport: A more balanced low-/no-carbon power train mix assumed in the light-duty vehicles (from 80% electric vehicle penetration in ECF to 65% in optimised pathway by 2050):
— Lower penetration of BEV at 65% (corresponding to light-duty vehicles that do not require long distance travel).
— Remainder accounted for by 20% hybrids, 10% fuel-cell vehicles and 5% biofuels for the light-duty vehicles segment.
— ECF 60% RES scenario assumes an electric vehicles penetration of 80% in 2050 in the light-duty segment, requiring a greater shift away from long-distance travel because of their limited range.
28

29
Using current capacity differently to abate CO2
Currently not all of Europe’s power generation capacity is used, as there is (in general) more capacity than needed to meet demand. Gas plants are expected to have a load-factor of ~45% in 2010-2011, which means that they could produce roughly double their current production if they were to be used at full capacity all year through. Correcting for the fact that gas capacity is needed to meet sudden swings in supply or demand (i.e., to compensate for fluctuations from renewable energy sources), the load-factor of gas plants could be increased to 65-70% while maintaining grid stability. This possibility opens up another way to abate CO2: increasing the load-factor of existing gas plants rather than producing with other, potentially more polluting technologies.
Gas plants in Europe could produce an additional 500-600 TWh, representing a load-factor increase from ~45% to 65-70%. Assuming this production would replace coal-fired production, the CO2 abatement would amount to 250-300 Mt annually (and coal-plant load-factors would decrease from ~60% to 20-25%). This amounts to 20-25% of total power-sector emissions and could be achieved at very short notice, without any capex requirements. The margin loss to coal-plant owners is estimated to be in the order of €15-20 bn compared to the optimised pathways (assuming an average remaining lifetime of coal plants of 10 years).
To achieve a similar CO2 abatement through RES new-builds would require €80-120 bn of capex. As a result, the switch to gas would be the most economical way to reduce CO2 emissions in the power sector, up to a gas price of ~$12.5/mmbtu.
4.2 The period 2030-2050
CO2 abatement
Europe could abate an additional 2 Gt of CO2 (cumulatively) by 2050 beyond the IEA 2009 reference case and reach the 80% abatement target for 2050.
Costs and investments
In the 2030-2050 timeframe, it might be possible to avoid a further €300-350 bn of capital investments, relative to the ECF ‘Roadmap 2050’ 60% RES. Total power-system costs would be equal or slightly better. The numbers for this second period are more uncertain than in 2010-2030 and may be offset by implementation setbacks or other unforeseen costs.
Flexibility of implementation
One of the main benefits of the optimised pathways is that the abatement trajectory in 2030-2050 can be constructed later, i.e. around 2025, rather than at the beginning of the period. This allows for more emerging technologies to come to full fruition, and for capturing the most attractive benefits of a wide variety of technologies, rather than overly relying on a few. This would allow Europe to choose a pathway that best reflects the needs for CO2 abatement, ease of implementation and security of power and energy supply.

The optimised pathways reach the same near complete CO2 abatement in 2050 as does the ECF 60% RES pathway. They do so at €450-550 bn lower capex before 2030, and provide flexibility for the decades ahead. They keep the option of pursuing either a further RES build-up and reach 60% RES share in 2050, a large scale rollout of CCS if this technology turns out to be reliable and easy to implement, or a more balanced mixture of the two open. Even in case of an accelerated 2030-2050 RES ‘catch-up’, the investments required over that period would be comparable with those over the same period in the ECF 60% RES case because of high RES learning rates, the need to rebuild part of the RES capacity built before 2030, and the selection of a cost-optimised RES technology mix.
30
31
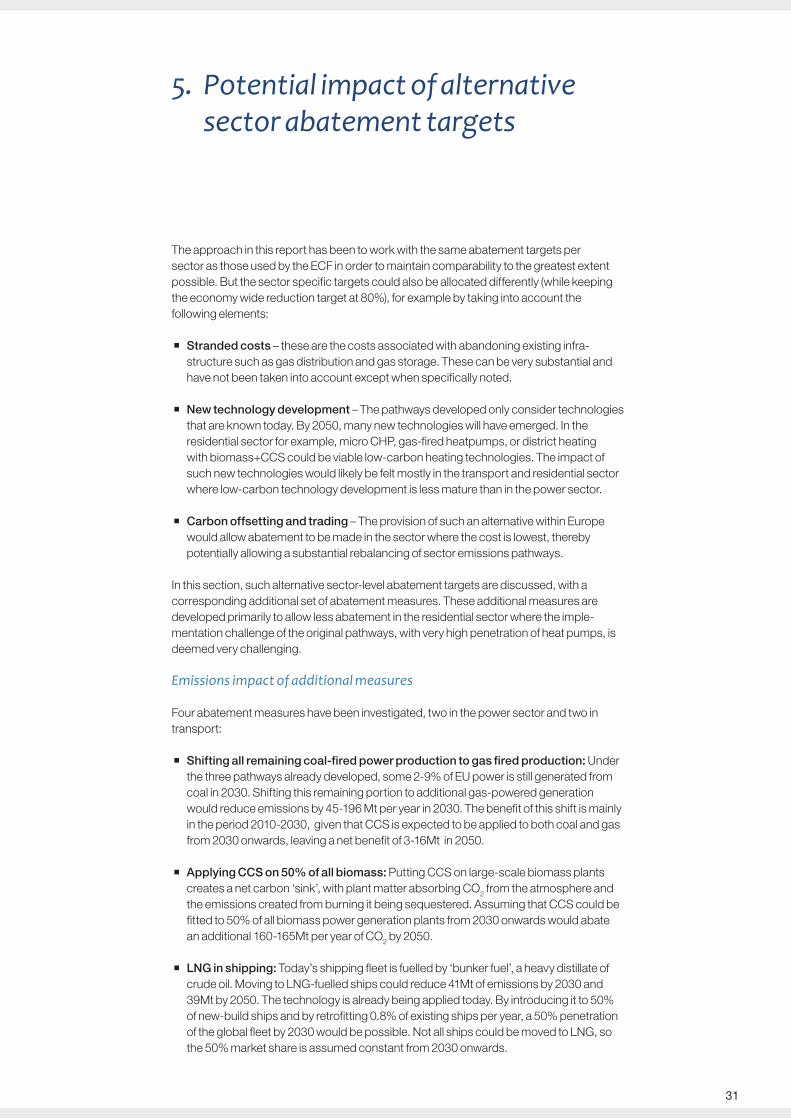
5. Potential impact of alternative sector abatement targets
The approach in this report has been to work with the same abatement targets per sector as those used by the ECF in order to maintain comparability to the greatest extent possible. But the sector specific targets could also be allocated differently (while keeping the economy wide reduction target at 80%), for example by taking into account the following elements:
� Stranded costs – these are the costs associated with abandoning existing infra-structure such as gas distribution and gas storage. These can be very substantial and have not been taken into account except when specifically noted.
� New technology development – The pathways developed only consider technologies that are known today. By 2050, many new technologies will have emerged. In the residential sector for example, micro CHP, gas-fired heatpumps, or district heating with biomass+CCS could be viable low-carbon heating technologies. The impact of such new technologies would likely be felt mostly in the transport and residential sector where low-carbon technology development is less mature than in the power sector.
� Carbon offsetting and trading – The provision of such an alternative within Europe would allow abatement to be made in the sector where the cost is lowest, thereby potentially allowing a substantial rebalancing of sector emissions pathways.
In this section, such alternative sector-level abatement targets are discussed, with a corresponding additional set of abatement measures. These additional measures are developed primarily to allow less abatement in the residential sector where the imple-mentation challenge of the original pathways, with very high penetration of heat pumps, is deemed very challenging.
Emissions impact of additional measures
Four abatement measures have been investigated, two in the power sector and two in transport:
� Shifting all remaining coal-fired power production to gas fired production: Under the three pathways already developed, some 2-9% of EU power is still generated from coal in 2030. Shifting this remaining portion to additional gas-powered generation would reduce emissions by 45-196 Mt per year in 2030. The benefit of this shift is mainly in the period 2010-2030, given that CCS is expected to be applied to both coal and gas from 2030 onwards, leaving a net benefit of 3-16Mt in 2050.
� Applying CCS on 50% of all biomass: Putting CCS on large-scale biomass plants creates a net carbon ‘sink’, with plant matter absorbing CO2 from the atmosphere and the emissions created from burning it being sequestered. Assuming that CCS could be fitted to 50% of all biomass power generation plants from 2030 onwards would abate an additional 160-165Mt per year of CO2 by 2050.
� LNG in shipping: Today’s shipping fleet is fuelled by ‘bunker fuel’, a heavy distillate of crude oil. Moving to LNG-fuelled ships could reduce 41Mt of emissions by 2030 and 39Mt by 2050. The technology is already being applied today. By introducing it to 50% of new-build ships and by retrofitting 0.8% of existing ships per year, a 50% penetration of the global fleet by 2030 would be possible. Not all ships could be moved to LNG, so the 50% market share is assumed constant from 2030 onwards.

� LNG for heavy duty vehicles: Additional penetration of LNG could also be achieved in Europe’s trucking fleet. The pathways presented in the rest of the report assume that 49% of fossil-fuelled vehicles will be replaced by 2030, for the largest part by hydrogen at 25% penetration and biofuel at 16% penetration. Assuming that of the remaining 51% fossil-fuelled vehicles an additional 50% is converted to LNG by 2030, a CO2 reduction of 27Mt/yr would be achieved by 2030. In 2050, assuming that all remaining diesel (4% of the total number of heavy duty vehicles, as the remaining 96 % will be from biofuel, hydrogen and plug-in hybrids) will move to LNG, a further 6Mt per year would be abated.
Exhibit 15 shows the combined emissions impact of these additional abatement measures in the low gas price, nuclear sensitivity pathway.
Exhibit 15
Allocating the emissions budget to the residential sector
In the ECF report, reduction of emissions in the residential sector is achieved mainly by extensive implementation of heat pumps, with 90% penetration of residential space heating by 2050.
Achieving such high penetration of heat pumps is likely to encounter substantial implemen-tation challenges, especially in urban environments given the difficulty of drilling bore holes for ground-source heat pumps. The cost of heat pumps is difficult to foresee given the limited current penetration and rapid growth anticipated. There are a number of significant uncertainties around both cost and performance, with estimates of the coefficient of performance (that is, the heat output relative to the electricity consumed) ranging from as low as 2 to 4 or more.
32
Additional abatement measures save 211Mt of emissions in 2050 relative to the low gas price, nuclear constrained pathwayMtCO2
163
45
LNG-fuelled trucks
LNG-fuelled ships
CCS on 50% of biomass
All remaining coal to gas
2050
2113
2030
113
6
3927
41
0
Power
Transport

33
For this report we have surveyed a range of sources including the ECF, and the UK’s Committee on Climate Change who estimate capex per kW of installed capacity as high as €3000. Based on a range of €600 to 1800 per kW (at the optimistic end of the spectrum), the total cumulative capex cost to reach 14% penetration by 2030 would be roughly €60 to 180 billion.
However, the costs would have to come down by a factor of at least four from today’s costs of €10,000 to 15,000 per household installation in order for heat pumps to have comparable life-time costs as conventional boilers.
If the ‘carbon budget’ created by the additional abatement measures as described above in the power and transport sector would be allocated to the residential sector, the penetration of heat pumps required to meet the (modified) carbon abatement target in the residential sector would decrease to 32% in 2050 from the 90% penetration assumed in the ECF Roadmap and the 60% penetration assumed in the optimized pathways. The remaining residential heat demand would be produced by a mix of biomass/biogas, resistive heating, and conventional heating (see exhibit 16 below), where the last column (‘rebalancing of abatement targets’) shows this additional scenario.
Penetration of resistive heating and biomass/biogas is maintained at the optimised pathways level. Resistive heating and conventional gas boilers are already mature and easily scalable, and increasing biogas to 10 percent penetration would not require any changes within the household.
Exhibit 16
Decreasing the residential abatement target decreases the need for heat pumps to 32% of residential heating demand
ECF Roadmap Optimised pathwaysRebalancing of abatement targets
55
10
100
2050 90
2030 45
20101
10
20
45
10
100
60 10
40 5 10
20
71
38
100
14 5
32 10
Heat pump
Resistive heating
Biomass/biogas
Conventional
% of residential heating demand filled
1 2010 heating mix is approximate. Sales data since 2006 would suggest heat pump penetration of around 1 percent.

Net financial impact
Exhibit 17 shows the net financial impact of applying these additional measures in power and transport and adjusting the space heating mix in the residential sector (excluding stranded costs).
In the low gas price, nuclear sensitivity pathway, power sector costs increase by a total of €50 billion cumulatively by 2030, most of this due to the higher capital cost of replacing the early retiring coal fired power plants with gas plants.
In residential space heating, the cost impact is highly dependent on the learning rate antic-ipated for heat pumps. Assuming a range of €600 to 1,800 capex per kW would suggest overall savings on a cumulative basis to 2030 of around €60 to 180 billion, with an increase in opex of around €80 billion. On balance, this means the net cost impact is likely to be around zero.
Exhibit 17
In 2050 the cumulative net financial impact is similar. Total extra cost of €100 billion in power is balanced by savings of €-35 to 205 billion in residential space heating leaving the overall financial cost roughly unchanged.
Given the significant uncertainty in residential sector costs, it will be important to take a cautious approach in the coming decade, allowing such new technologies such as micro CHP, gas-fired heatpumps or district heating with biomass to develop without making unnecessarily large investments in new technologies such as heat pumps.
34
Much of the additional power sector cost is offset by savings in the residential sector
5045
120
Net cost impact
Opex impact of additional measures
5
Capex impact of additional measures
80-80
-120
0120
Net cost impact
-100
Opex impact of additional measures
Capex impact of additional measures
60
-60-40-20
20406080
Euro bn, 2010-2030
Power Residential
Range of estimates
VS. LOW GAS PRICE NUCLEAR SENSITIVITY

35
6. Implications for gas demand
Gas demand under alternative sector abatement targets
Gas plays a vital role in the optimised pathways, especially in the power sector. In the optimised pathway for the low gas price, nuclear sensitivity pathway and with additional abatement measures applied as described in the previous section, total annual gas demand would be 580bcm in 2030 (compared with ~520bcm now). By 2050, annual gas
demand would fall slightly to 560bcm (See exhibit 18).
Exhibit 18
Gas demand under other scenarios
Exhibit 19 shows the gas demand under the other three pathways analysed in this report. With a low gas price but no limit on nuclear, further nuclear penetration takes the place of gas generation with an attendant impact on gas demand. In the high gas price pathway, the less attractive economic case for gas generation reduces demand to 307bcm per year. (Note in all cases these scenarios exclude the impact of adjusting the sector abatement targets as described in the previous chapter).
0
100
200
300
400
500
600
205020302010
Direct gas demandbcm/year
With additional abatement measures applied, 2030 gas demand would be 580 bcm in 2030 and 560 bcm in 2050, mostly driven from the power sector
1 Indirect gas demand from transport (e.g., through electric vehicles) is included in power generation2 Includes other energy sector as well as statistical differences
SOURCE: ECF Roadmap 2050; Platts; IEA;
Other2Industry
BuildingsTransport
Power generation1 LOW GAS PRICE NUCLEAR SENSITIVITY

Exhibit 19
The figures shown here are based on the sector targets based on ECF assumptions, which, as discussed in the previous section, could be sub-optimal if additional consid-erations such a stranded costs are taken into account. A different perspective on sector targets or technology development could see gas demand remaining significantly stronger, especially in the residential sector.
Power generation
The optimised pathways use a generation mix with a 19-36% production share of gas in 2030 (resulting in 150-280bcm gas demand for power), compared to 26% in 2010. The high end of this range results from the pathways with the current gas prices, which makes gas-fired capacity the most economically attractive. The lower end of this range results from the pathway based on IEA gas prices ($10-15/mmbtu), where gas is the most attractive alternative to nuclear power in terms of economics and CO2 emissions. In the period 2030-2050, much depends on the costs and availability of CCS. With CCS at currently-projected capacity and costs, the share of gas production could be 14-34% in 2050, resulting in a gas demand for power of 125-310bcm.
36
Gas demand1
bcm/yr
Total gas demand in the optimised pathways is flat or declining,depending on the share of gas in power generation
SOURCE: ECF Roadmap 2050; Platts; IEA
0
100
200
300
400
500
600
205020302010
Low gas price, nuclear sensitivity
Low gas price
High gas price
1 Without additional abatement measures

37
Buildings
Gas demand in buildings is very uncertain, but in a society that wants to reduce GHG emissions by 80%, residential natural gas demand will decline from 190-200bcm in 2010 to 70-90bcm in 2030. Under the same assumption it will decline further to 10-20bcm in 2050. This decline will be partly offset by higher gas demand for power generation (see above). Also, potential additional technologies that have not been modelled in detail (such as mini- and micro- CHP, gas-fired heat pumps, fuel cells or district heating with biomass) could influence gas demand.
Industry
Industrial gas demand is fairly stable at 120-130bcm, since the baseline (as described in the IEA WEO 2009 reference case) already includes aggressive energy efficiency measures.
Road transport
Gas demand in transport will reach approximately 50-65bcm in 2050. Gas demand in transport is driven by two key elements. First, fuel cell vehicles consume H2 which can be produced through reformation of natural gas through steam methane reforming (SMR). In the optimised pathways it is assumed that 40% of the 3.7 mn tonnes H2 will come from SMR, requiring ~15bcm of gas. Second, the electrification of transport implies a higher power demand, leading to a higher gas demand in the power sector. With a marginal share of gas in the power sector of 30-40%, this leads to a 30-45bcm higher gas demand.
Compressed natural gas (CNG) as a fuel source can also be a driver of gas demand. It has a potential of 10-25bcm in 2050 but requires promotion of a ‘greener’ CNG image among customers, increase model choice through stronger OEM collaboration, and infrastructure expansion to increase the number of fuelling stations. In the longer run to 2050, CNG must be phased out to avoid breaching the CO2 limits arising from the 80% abatement target.

CCS Carbon capture and storage
ECF European Climate Foundation (http://www.europeanclimate.org/)
ICE Internal combustion engine
IEA International Energy Agency (http://www.iea.org/)
LCoE Levelised cost of electricity
LNG Liquefied natural gas
RES Renewable energy sources
WEO World Energy Outlook (an IEA publication)
38
Glossary

39
Endnotes
1 To avoid an over-reliance on any single technology, the model has been calibrated such that no single technology either ‘takes all’ or, conversely, fully disappears. This approach adds to the overall robustness of the results, and allows individual countries more options to build the power-mix they find most attractive to meet the CO2
abatement targets
2 Total costs in power generation, including capital costs, fuel and operating costs. These costs exclude CO2 costs, unless otherwise stated
3 A high-level analysis has been performed to assess potential changes from using the WEO 2010 baseline instead. Since the 2009 ‘Reference case’ and the 2010 ‘Current policies’ cases from the IEA are very close for the parameters that influence this study most (such as commodity prices, power demand) it has been decided to continue with the WEO 2009 baseline
4 See www.roadmap2050.eu
5 McKinsey Global Greenhouse Gas Abatement cost curves
6 2050 power demand is ~100TWh lower than in ECF’s pathways (~4,800 vs ~4,900), due to lower assumed penetration of electric vehicles, partially offset by higher demand from buildings as a result of electric resistance heating
7 This is based on the midpoint between the high and low cases of the World Nuclear Association. See http://www.world-nuclear.org/outlook/nuclear_century_outlook.html
8 Element Energy: The growth potential for Microgeneration in England, Wales and Scotland
9 Electricity costs of energy-intensive industries estimated at 4-8% of revenues, average profit margins estimated at 6% (source: Eurostat). Optimised pathways estimated to lead to ~10% electricity cost reductions
10 See http://www.world-nuclear.org/outlook/nuclear_century_outlook.html
11 ECF Roadmap 2050 pathways have been calculated with the following technology mix by 2050: 80% battery electric vehicles (BEV) and 20% (plug-in) hybrids for light-duty vehicles (LDV) and medium-duty vehicle (MDV) segment; 45% biofuels, 45% hydrogen, 10% ICE for heavy-duty vehicles (DV)

40
Appendix A: Fact sheet
2010
Baseline Baseline 60% RESOpt low
gas price
Opt low gas price, nuc sens
Opt high gas price Baseline 60% RES
Opt low gas price
Opt low gas price, nuc sens
Opt high gas price
Gas price, $/mmbtu 10.5 14.8 14.8 7.5 7.5 14.8 14.8 14.8 7.5 7.5 14.8CO2 price, €/tonne 15 44 44 44 44 44 44 44 44 44 44
Inputs by sectorPower generationPower demand, TWh 3,250 4,100 4,200 4,100 4,100 4,100 4,800 4,900 4,800 4,800 4,800Production mix, %
Gas 26% 29% 19% 33% 36% 19% 29% 10% 19% 34% 14%Coal 24% 20% 11% 4% 2% 9% 19% 10% 8% 2% 7%
Nuclear 28% 18% 21% 26% 22% 37% 18% 20% 29% 19% 38%Biomass 2% 8% 8% 7% 7% 7% 8% 8% 11% 11% 11%
Other RES 20% 26% 42% 30% 32% 28% 25% 52% 32% 34% 30%Generation capacity, GW
Total 800 950 1,250 950 950 950 1,100 1,700 1,200 1,200 1,200
Gas 25% 33% 23% 27% 29% 26% 37% 20% 27% 35% 27%Coal 23% 12% 5% 5% 3% 6% 11% 4% 4% 1% 4%
Nuclear 17% 10% 10% 15% 13% 21% 10% 7% 15% 10% 20%Biomass 2% 5% 4% 5% 5% 4% 5% 3% 6% 6% 6%
Other RES 32% 40% 58% 48% 51% 42% 37% 66% 47% 48% 43%
Buildings,Heating mix, % heating
Conventional 100% 100% 55% 55% 55% 55% 100% 10% 10% 10% 10%Heat pumps 0% 0% 45% 30% 30% 30% 0% 90% 50-70% 50-70% 50-70%
Biomass 0% 0% 0% 5% 5% 5% 0% 0% 5% 5% 5%Biomethane 0% 0% 0% 5% 5% 5% 0% 0% 5-20% 5-20% 5-20%
Resistance[i] 0% 0% 0% 5% 5% 5% 0% 0% 10-20% 10-20% 10-20%
TransportFuel mix light duty vehicles, % km driven
Fossil Fuels 100% 97% 50% 49% 49% 49% 95% 0% 0% 0% 0%Plug-in Hybrids 0% 0% 10% 10% 10% 10% 0% 20% 20% 20% 20%Battery Electric 0% 1% 40% 33% 33% 33% 2% 80% 65% 65% 65%
Biofuels 0% 1% 0% 3% 3% 3% 2% 0% 5% 5% 5%Hydrogen 0% 1% 0% 5% 5% 5% 1% 0% 10% 10% 10%
OutputsGas demand, BCM 518 610 384 502 532 387 716 261 354 501 302Power generation 164 224 148 254 281 148 266 93 175 312 127Industrials 123 131 124 124 124 124 135 122 122 122 122Buildings 196 206 77 77 77 77 263 16 16 16 16Transport (Road) 0 2 6 9 9 9 4 13 18 18 18Other 36 47 29 39 41 30 47 17 22 32 19
Annual CO2 emissions, GtCO2 5.3 5.3 2.9 3.2 3.2 3.3 5.4 1.1 1.2 1.2 1.2
CO2 emissions, tCO2
cumulative over period 88 44Total power costs,€ trillion, power gen. 2.5 3.2Total capex,€ trillion, power gen. 0.7 0.9
[i] Base in 2010 is heating demand that is not already fulfilled through electric heating (e.g., heat pumps, resistance heating)
2030 2050
2010-2030 2030-2050
111 87 88 88 108 38 44 44
2.9 3.3 2.5 2.8 3.8 3.6 3.2 3.5
0.6 1.2 0.7 1.00.8 0.7 1.3 1.0

41
Differences from ECF Roadmap 2050
The ECF ‘Roadmap 2050’ pathway assumes that Europe meets its 80% emissions-reduction target in 2050. This is achieved by almost fully decarbonizing the power-generation, buildings, road transport, and waste sectors, and by achieving significant savings in all other sectors.
What remains the same
� Most input assumptions have been adopted, the exceptions being gas prices and biomass supply (see below. Therefore the optimised pathways and the ECF ‘Roadmap 2050’ scenarios share the following main inputs:
— Current and projected baseline CO2 emissions — Power demand, including energy efficiency potential and costs — Generation technology costs (including learning rates) and capacity constraints — Transmission and back-up technology needs and costs — Commodity prices (oil, coal, CO2).
Changed assumptions
� Gas prices: In addition to a scenario with the ECF ‘Roadmap 2050’ gas prices (itself based on IEA WEO 2009), a further pathway has been modelled that assumes continuation of the current hub-prices of $7.5/mmbtu until 2050. The outcomes of both pathways represent the high end and the low end in the numbers given. A third pathway is modelled that assumes a continuation of the current hub-price as well as a constraint on nuclear build-out.
� Biomass supply: The optimised pathways assume more import of biomass, leading to a 200TWh increase in availability of biomass in 2050. This additional biomass (over the ECF level) is allocated to power generation and heating buildings.
Changed logic
� Power generation: Instead of postulating a power mix in 2050 and back-casting (the ECF approach), the optimised case models the 2010-2030 period explicitly, using the lowest levelised cost of electricity (LCOE) as a driver. These ‘unconstrained’ economic pathways have then, where necessary, been modified to ensure that abatement targets are met, and that nuclear build-out rates do not exceed the midpoint between the high and low scenarios of the World Nuclear Associationx. For the ‘low gas price, nuclear sensitivity’ pathway, a more stringent constraint is assumed (see ‘methodology’ chapter for details).
� Industry: Delaying CCS measures until the 2030-2050 period (in contrast with a start in 2020 in the ECF scenarios).
Appendix B: Differences between ECF Roadmap 2050 60% RES scenario and IEA WEO 2009 reference case

� Buildings: A balanced build-up of non-emitting space heating technologies, rather than assuming 90% heat pump penetration. Heat pumps are assumed to be implementable in 50-70% of cases, corresponding to implementation in all new builds and commercial renovations as of 2010, or alternatively all non-densely-populated areas. The remaining heat demand is filled by biomethane, biomass boilers, resistance heating or conven-tional heating, according to the circumstances.
� Transport: A more balanced low-/no-carbon technology mix in 2030 and 2050 has been assumed, compared with the 80% BEV penetration in the light-duty segment in the ECF scenarios11. This balanced mix assumes a lower penetration of BEV at 65% (corresponding to light-duty vehicles that do not require long-distance travel), with the rest accounted by 20% hybrids, 10% fuel-cell vehicles and 5% biofuels for the light-duty vehicle segment.
Quantitative differences between ECF 60% RES and Optimised pathway
� The optimised pathways require lower capex than the ECF 60% RES scenario. For the period 2010-2030, this is driven by three factors: the ECF 60% RES scenario requires more rebuilds of old RES plants; the 60% RES scenario builds more RES capacity overall between 2010-2050, which is generally more capex intensive and has a lower load factor; the optimised pathways imply the build-out of lower cost RES types, i.e. biomass, onshore wind, CSP solar.
Differences from the IEA WEO 2009 reference case
� The IEA World Energy Outlook 2009 reference case has been used as a baseline. The reference case does not assume any CO2 abatement measures beyond the 20/20/20 target (which it assumes to be met).
What remains the same
� The results of the Reference case have been copied without amendment for the period 2010-2030.
What inputs have changed
� For two pathways, the gas prices have been kept constant at USD7.5/mmbtu.
What logic has changed
� None.
42
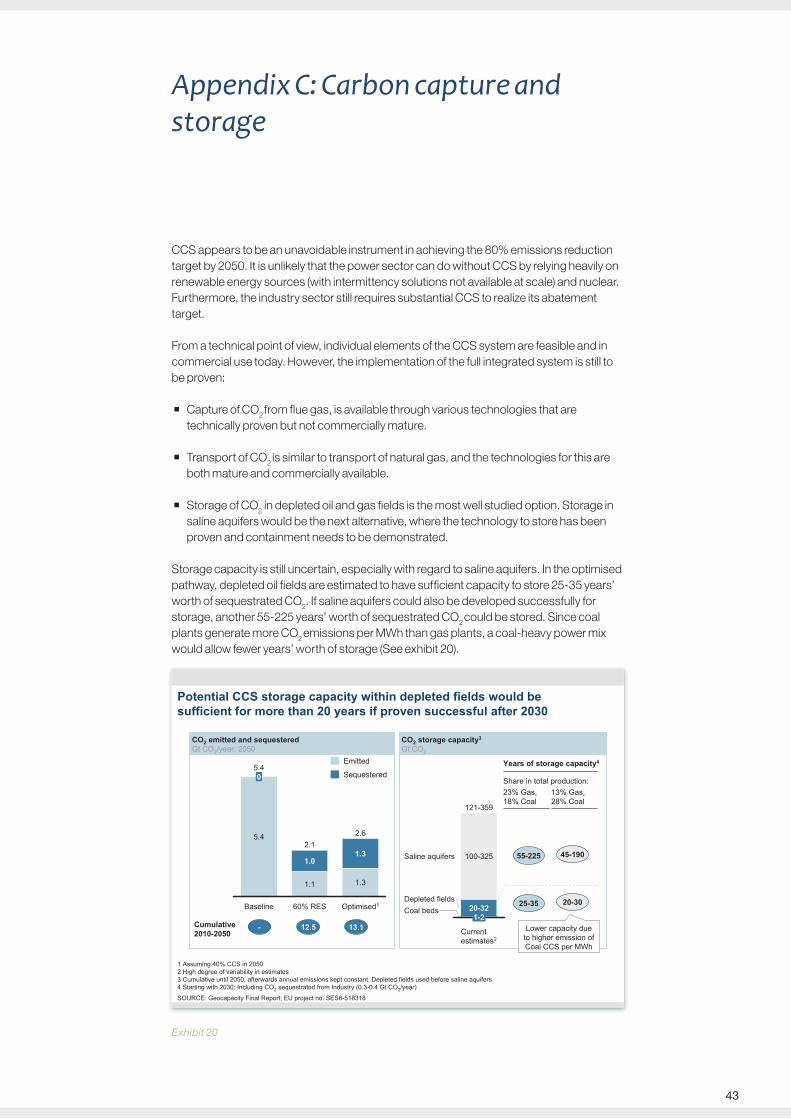
43
Appendix C: Carbon capture and storage
CCS appears to be an unavoidable instrument in achieving the 80% emissions reduction target by 2050. It is unlikely that the power sector can do without CCS by relying heavily on renewable energy sources (with intermittency solutions not available at scale) and nuclear. Furthermore, the industry sector still requires substantial CCS to realize its abatement target.
From a technical point of view, individual elements of the CCS system are feasible and in commercial use today. However, the implementation of the full integrated system is still to be proven:
� Capture of CO2 from flue gas, is available through various technologies that are technically proven but not commercially mature.
� Transport of CO2 is similar to transport of natural gas, and the technologies for this are both mature and commercially available.
� Storage of CO2 in depleted oil and gas fields is the most well studied option. Storage in saline aquifers would be the next alternative, where the technology to store has been proven and containment needs to be demonstrated.
Storage capacity is still uncertain, especially with regard to saline aquifers. In the optimised pathway, depleted oil fields are estimated to have sufficient capacity to store 25-35 years’ worth of sequestrated CO2. If saline aquifers could also be developed successfully for storage, another 55-225 years’ worth of sequestrated CO2 could be stored. Since coal plants generate more CO2 emissions per MWh than gas plants, a coal-heavy power mix would allow fewer years’ worth of storage (See exhibit 20).
Exhibit 20
Potential CCS storage capacity within depleted fields would be sufficient for more than 20 years if proven successful after 2030
Optimised1
2.6
1.3
1.3
Baseline
5.4
60% RES
2.15.4
0
1.1
1.0
Emitted
Sequestered
CO2 emitted and sequesteredGt CO2/year, 2050
CO2 storage capacity3
Gt CO2
SOURCE: Geocapacity Final Report; EU project no. SES6-518318
1 Assuming 40% CCS in 20502 High degree of variability in estimates3 Cumulative until 2050, afterwards annual emissions kept constant. Depleted fields used before saline aquifers4 Starting with 2030; Including CO2 sequestrated from Industry (0.3-0.4 Gt CO2/year)
Cumulative 2010-2050 Current
estimates2
Saline aquifers
Coal bedsDepleted fields
121-359
1-220-32
100-325
25-35 20-30
Lower capacity due to higher emission of Coal CCS per MWh
Years of storage capacity4
23% Gas, 18% Coal
13% Gas, 28% Coal
12.5 13.1-
Share in total production:
55-225 45-190

Two additional optimised pathways have been modelled to investigate the implications of a more aggressive renewables or fossil CCS build-up after 2030. The post-2030 construction mix of new capacity in the ‘optimised RES-build-up pathway’ is chosen to realise a 2050 generation mix as close as possible to that of the ECF 60% RES scenario. It shows the implications of realising the 60% RES target in 2050, having pursued the optimised pathways for the period 2010-2030. The share of RES in the 2050 generation mix naturally becomes 60%. The share of nuclear power will be ~20%, that of gas ~10%, and coal ~10%, each somewhat dependent on the gas price pathway (See exhibit 21).
Exhibit 21
The required investments would be €350-400 bn for the RES-heavy pathway compared to the optimized pathways, and the total power system costs would be €150-200bn higher. Compared to the costs of the 60% RES pathway in the 2030-2050 timeframe the investments are similar (within ~€50 bn), while the total power-system costs are within 3% (or about ~€100bn) of these costs. Given the inherent uncertainties in such far ranging future estimates, and the likely optimisations possible in the next 15 years prior to committing to any of these investments, they can be considered as essentially similar. Therefore the potential decision in 2030 to pursue the same 2050 generation mix as in the ECF 60% RES pathway would preserve most, if not all, of the savings made in 2010-2030.
The 2030-2050 capex figures are very similar in the ‘original’ 60% RES pathway and the scenario in which 60% RES is pursued only from 2030 onwards because of the 25-year lifetimes of solar and wind RES. Almost all RES built before 2030 therefore needs to be rebuilt before 2050. (For the effect on learning rates see Appendix F).
44
Appendix D: Alternative power generation pathways 2030-2050
Beyond 2030, all options are open with potential for further savings
RES-dominated power generation mix development
Optimized mixof different technologies
CCS-dominated power generation mix development2
€ bn, 2030-2050
Power gene-ration mix 2050
60 201010
1 Power sector, compared to ECF 60%-RES pathway2 Mix assumes low gas price path way
RES
Nuclear
Coal CCS
Gas CCS
4329
819
32
23 1827
452
34
4038
714High gas price
Low gas price
Low gas price, nuclear sens.
ROUGH ESTIMATESCapex1
Options
Total costs1
19
Savings compared to 60%-RES
60% RES Scenario 3,6001,30060 20
1010
300 100
400 50
350 150
(50)-0 (100)–(50)
350-450 (50)–(100)
SOURCE: Roadmap 2050, European Climate Foundations

45
In the ‘optimised CCS build-out pathway’, all new capacity built after 2030 is fossil-fired with CCS: 50% gas and 50% coal. Its feasibility depends on technical advances in CCS and on societal acceptance.In 2050 the shares of power-generation are ~28% for gas CCS, ~17% for coal CCS, ~23% for nuclear power, and ~32% for RES, each somewhat dependent on the gas-price pathway. This pathway is comparable to the optimised pathway in terms of investment required, but results in a higher total power-cost because of the need for more fuel.

Decarbonising road transport could be achieved by replacing the current ‘conven-tional’ internal combustion engines with various existing power-train technologies. The technologies considered are battery electric vehicles (BEV), fuel cell engine vehicles (FCEV) and plug-in hybrids (PHEV). These technologies have diverse performance, emissions and economics characteristics.
The most important uncertainties in development of the future power-rain mix are techno-logical progress, regulation and consumer preferences. Various scenarios have therefore been modelled. Compared with the ECF ‘Roadmap 2050’, each modelled scenario has a more balanced mix of power-train technologies that allows for the coexistence of all technologies with a dominance of specific technologies in certain car segments.
These are the three scenarios modelled for the road transport sector:
� ‘BEV World’: assuming strict emissions regulation, fast technology progress in batteries and adapting consumer requirements (shorter trips) to boost battery electric vehicles.
� ‘FCEV World’: strict emissions regulation, and fast technology progress in fuel cells drives down cost, making FCEV the broadly preferred technology.
� ‘PHEV World’: expensive batteries and fuel cells and limited regulatory pressure to restrict emissions will allow for maintained (but ever more efficient) combustion engines for long-distance travel.
For the optimised pathways, the ‘BEV World’ scenario is modelled, since this appears the most cost-effective technology to reduce emissions. (See exhibit 22 for a comparison of the different scenarios in power-train technologies).
Exhibit 22
46
Appendix E: Road transport
SOURCE: ECF Roadmap 2050
60%-RES
BEV-World
FCEV-World
PHEV-World
ICE
Hybrids
Battery electric
Biofuels
Hydrogen
Rationale
Fast technology progress in batteries
Consumer preferences adjust to shorter journeys
Rapid technological advances in fuel cells drives down cost
Preference for longer-drives
Expensive batteries and fuel cells
Preference for long-distance journeys
Several balanced carbon technology mixes have been modelled Fuel mix by total kilometres travelled by car-type, Percent, 2050 Scenario used
in Optimised pathways
Light-duty vehicles Medium-duty vehicles Heavy-duty vehicles
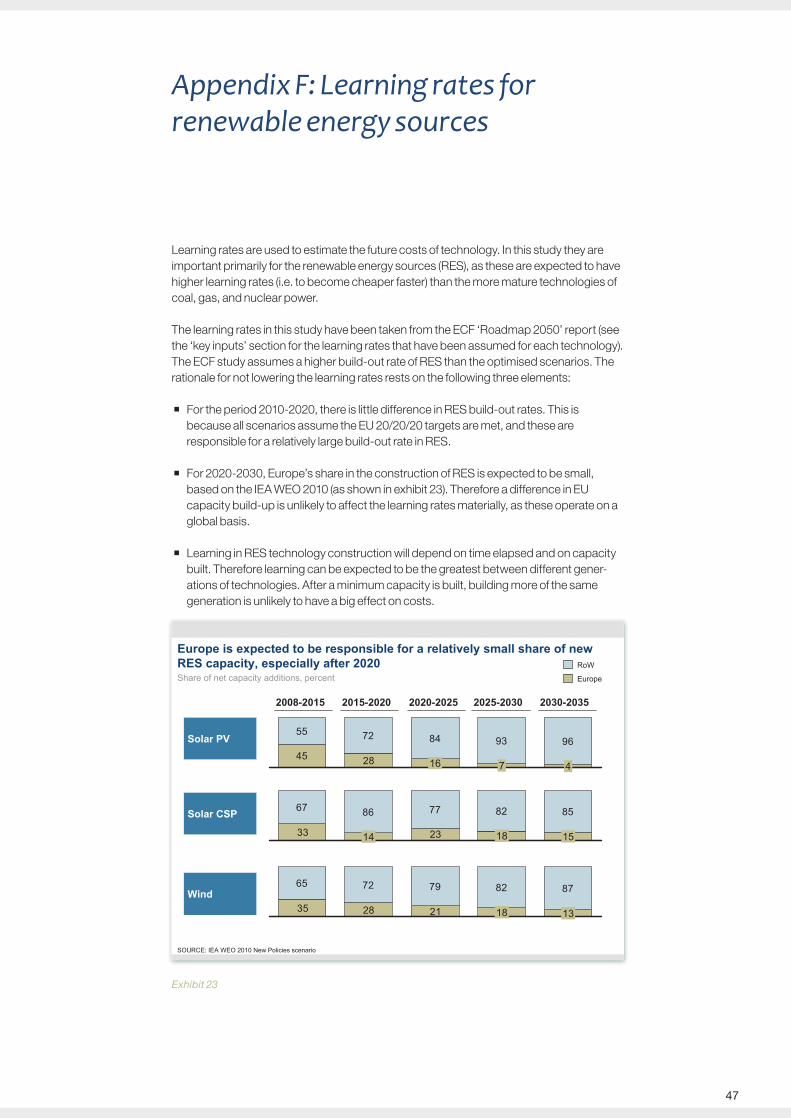
47
Appendix F: Learning rates for renewable energy sources
Learning rates are used to estimate the future costs of technology. In this study they are important primarily for the renewable energy sources (RES), as these are expected to have higher learning rates (i.e. to become cheaper faster) than the more mature technologies of coal, gas, and nuclear power.
The learning rates in this study have been taken from the ECF ‘Roadmap 2050’ report (see the ‘key inputs’ section for the learning rates that have been assumed for each technology). The ECF study assumes a higher build-out rate of RES than the optimised scenarios. The rationale for not lowering the learning rates rests on the following three elements:
� For the period 2010-2020, there is little difference in RES build-out rates. This is because all scenarios assume the EU 20/20/20 targets are met, and these are responsible for a relatively large build-out rate in RES.
� For 2020-2030, Europe’s share in the construction of RES is expected to be small, based on the IEA WEO 2010 (as shown in exhibit 23). Therefore a difference in EU capacity build-up is unlikely to affect the learning rates materially, as these operate on a global basis.
� Learning in RES technology construction will depend on time elapsed and on capacity built. Therefore learning can be expected to be the greatest between different gener-ations of technologies. After a minimum capacity is built, building more of the same generation is unlikely to have a big effect on costs.
Exhibit 23
Europe is expected to be responsible for a relatively small share of new RES capacity, especially after 2020
SOURCE: IEA WEO 2010 New Policies scenario
65 72 79 82 87
212835 18 13
67 86 77 82 85
2333 14 18 15
55 72 84 93 96
284516 7 4
Wind
Solar CSP
Solar PV
2008-2015
Share of net capacity additions, percent
2015-2020 2020-2025 2025-2030 2030-2035
RoW
Europe

European gas supplies are partly indigenously produced and partly imported, though pipes and LNG. This will continue to be the case to 2020 and beyond. A resilient gas supply and transmission system is therefore essential, and will be further strengthened by the October 2010 EU regulation around (amongst others) reverse flow in gas transmission. See also exhibit 24.
Exhibit 24
In 2020, the EU would be resilient to a potential supply disruption of about 200bcm. This amount is significantly larger than the simultaneous loss of the two largest import routes: the Ukrainian transit pipeline (100bcm) plus either North stream (~40bcm) or South stream/Nabucco (~40-50bcm).
48
Appendix G: Resilience to a supply shock
Europe is resilient in the face of a severe disruption of supply
1 Onshore (5-10), Offshore North Sea (10-15), Norway (10), no material unconventional production assumed in this timeframe2 Using spare capacity in seasonal storage (50-60), emergency use of 10% of cushion gas (10-20)3 Assuming global capacity can be increased, and more supply can be redirected to Europe4 Assuming load factor of coal plants can be increased by 20% (switching ~300 TWh)5 Interrupting feedstocks; rough estimateSOURCE: Cedigaz, Global Insight, NPD, expert interviews
Demand measures
Flexible supplybcm, 2020
Sources of supplybcm, 2020
5054
Other (incl. UK)
90-110
QatarNether-lands
50-75
AlgeriaNorway
120-150
Russia
160-215
Europe could withstand a supply disruption of up to ~200 bcm
50
Total
180-235
Indus-try5
10
Power sector4
Piped3
15-20
LNG3
20-40
Storage2
60-80
IP1
25-35
~70
A simultaneous loss of two major routes would result in a loss of maximum ~140 bcm
▪ Ukraine: ~100▪ Nord Stream: ~40▪ South stream: ~44▪ Other: ~35
▪ Spain: ~15▪ Italy: ~40 (incl. Galsi)EU regulation on interconnectivity
to be implemented to minimize local disruptions
Physical available capacity
Estimates of obtainable volumes

49
This resilience is based on an analysis of the likely flexible capacity available to Europe in such an event:
� 25-35bcm from spare capacity of indigenous production (including Groningen, assuming winter conditions)
� 15-20bcm from higher imports through unaffected pipeline supply routes
� 60-80bcm from gas storage that is typically not fully emptied during winter, and including using part of the working gas capacity as an emergency measure
� 20-40bcm from increased imports of LNG, taking into account supplier spare capacity and the relative commercial strength of Europe to attract additional supply in case of need
� 50bcm from measures in the power sector, by increasing the load factor of such alter-natives as coal-fired plants
� 10bcm from interruptible gas contracts in industry. Furthermore it is estimated that a simultaneous loss of two major import routes would result in a loss of maximum ~140bcm. The largest import routes to Europe are via the Ukraine (~100bcm), North stream (~40bcm) and South stream (~44bcm). In the case of the loss of the two largest of these routes, Europe would still have enough flexibility to absorb such a shock.