making the everyday fiskars, gerber, iittala, royal ... · fiskars, gerber, iittala, royal...
TRANSCRIPT

Fiskars Group Financial Statements 2017
Making the everydayextraordinary.
Fiskars, Gerber, Iittala,Royal Copenhagen, Waterford, Wedgwood, Arabia, Gilmour,Royal Albert, Royal Doulton,Rörstrand

2 Fiskars Group 3Financial Statements 2017
Report by the Board of Directors for the year 2017 4 Consolidated Financial Statements, IFRS 18 Notes to the consolidated financial statements 24 Financial indicators 69 Shares 72 Shareholders 73 Parent company financial statements, FAS 75 Notes to the parent company financial statements 80 Board’s proposal for distribution of profits and signatures 90 Auditor’s report 91
Contents

4 Fiskars Group 5Financial Statements 2017
Fiskars is a leading consumer goods company, building a family of iconic lifestyle brands. Fiskars’ vision is to create a positive, lasting impact on the quality of life we live – making the everyday extraordinary.
Fiskars’ business is based on putting the con-sumer at the core of everything. A profound insight and understanding of the consumer is the starting point for the brand as well as product and portfolio development and marketing activities. Consumer insight is critical in order to provide a true omni-chan-nel experience across all the channels and platforms, both physical and digital.
The brand, marketing, and product development are critical in ensuring the offering is relevant to the consumer and represents the uniqueness of Fiskars’ brands. In addition, the brand’s purpose, marketing concepts and activities are defined by brand and marketing in order to present the offering in the most relevant way across all markets and consumer touch-points.
Striving for quality, cost efficiency and sustain-ability, the supply chain plays a critical role in manu-facturing and sourcing. Fiskars has own manufactur-ing units in Asia, Europe and North America, which are complemented by a network of suppliers. The supply chain focuses on ensuring that the product quality, production methods and all the social and environmental aspects live up to the requirements of sustainable ways of working.
Key element in the company’s business model, sales and distribution, is going through a fundamental change all over the world. Traditional channels are facing challenges, new digital platforms are emerging and the roles of various players are shifting. For Fiskars Group, own retail is growing in importance and inter-action directly with consumers happens more often.
Report by theBoard of Directors for the year 2017
Comparable net sales in the Living segment decreased year-on-year, impacted primarily by the negative development in the U.S. and Australia. The Scandinavian Living business consistently delivered during the year and improved its net sales and com-parable EBITA. The Scandinavian Living business closed the year with a strong performance by the Iittala, Royal Copenhagen and Arabia brands. The English & Crystal Living business faced challenges throughout the year, especially as the transformation of the retail sector has continued, mainly in the U.S. In addition, collaboration was discontinued with select customers in the U.S., which has negatively affected the topline, however Fiskars expects this to posi-tively contribute to the gross margin and brand value. With Ulla Lettijeff, the newly appointed President of SBU Living, and her team, the revitalization of the positioning of the English & Crystal Living brands, including Waterford, Wedgwood, Royal Albert and Royal Doulton, will continue, while the improvement of operational excellence remains a high priority in 2018.
The Functional business made solid progress during the year, increasing the comparable net sales and comparable EBITA also during the fourth quarter. The performance in the fourth quarter was supported by increased sales to existing customers as well as the scissors and hardware categories. Net sales decreased in the Outdoor business, primarily due to the challenges in the knife category and sporting goods sector.
Fiskars is gaining further traction from the trans-formation programs, and today, the company operates more efficiently than before. Fiskars has focused on removing internal complexities, aligning ways of working and consistently reducing the number of stock keeping units (SKUs), enabling the company to better focus on the core offering and increasing the value of the brands. This work will continue in the future.
Fiskars has proceeded on its strategic journey, and is progressing towards the long-term financial targets having improved the EBITA margin in 2017. In 2018, the profitable growth is expected to continue and Fiskars expects to increase comparable net sales and comparable EBITA from 2017.
At the same time, Fiskars works closely together with customers (e.g. department stores and DIY chains) to stay relevant as they renew their business models.
Fiskars depends on talented people who con-tribute to the success of the company, and cultivates a culture of collaboration, innovation and creativity. Developing employees’ competences, whether in the field of brand development, R&D, sales, manufacturing or business development, is critical in creating long-term value for stakeholders.
Global megatrends are shaping Fiskars’ posi-tion in the consumer goods business. Digitalization, resource scarcity, and urbanization are transforming the operating environment, creating new opportunities and challenges alike.
During 2017, cash flow from operating activities before financial items and taxes amounted to EUR 130.5 million (120.7). Earnings per share were EUR 2.04 (0.78) and operative earnings per share, exclud-ing the net change in the fair value of the investment portfolio and dividends received were EUR 0.81 (0.56).
Fiskars has transitioned to a biannual dividend distribution policy. For the financial period that ended on December 31, 2017, the Board of Directors pro-poses a total dividend of EUR 0.72 per share to be paid in two installments of EUR 0.36 per share. The first dividend of EUR 0.36 per share is proposed to be paid in March 2018, and the second installment of EUR 0.36 per share to be paid in September 2018.
The year 2017 was marked by many changes at Fiskars. The company took a step forward towards fulfilling its global ambition and shifted from a region-based organization to form two global Strategic Business Units, Living and Functional, and a unified supply chain. Fiskars continued to improve competitiveness with several initiatives, and the outcome of these initiatives supported profitability already in 2017.
Fiskars Group increased its net sales, excluding net sales of businesses divested in 2016, and com-parable EBITA during 2017. Fiskars made progress during the year, the company however also experi-enced challenges in some markets.
EUR MILLION 2017 2016 CHANGE COMPARABLE CHANGE*
Group 1,185.5 1,204.6 -1.6% 1.5%
Living 573.9 598.1 -4.0% -0.4%
Functional 607.8 602.7 0.8% 3.4%
Other 3.8 3.8 -0.4% -0.4%
NET SALES
*Using comparable exchange rates, excluding the divested Spring USA (September 2016) and the divested container gardening busi-nesses in the U.S. (January 2016) and Europe (December 2016).
Year 2017 in brief: Increase in both comparable net sales and comparable EBITA
Group performance
In 2017, Fiskars Group’s organization featured two Strategic Business Units, Living and Functional. The group has three reporting segments: Living, Func-tional, and Other.
The Living segment consists of the English & Crystal Living business, including brands such as Waterford, Wedgwood, Royal Albert, and Royal Doul-ton, and the Scandinavian Living business, including brands such as Iittala, Royal Copenhagen, Rörstrand, and Arabia.
The Functional segment consists of Functional Americas, Functional EMEA and Outdoor businesses, and includes brands such as Fiskars, Gerber, and Gilmour.
Fiskars Group’s Other segment contains the Group’s investment portfolio, the real estate unit, corporate headquarters, and shared services.

6 Fiskars Group 7Financial Statements 2017
Reporting segments and geographies
LIVING SEGMENT IN 2017
*Using comparable exchange rates and excluding the net sales of the divested Spring USA (September 2016), net sales in the Living segment decreased by 0.4% in 2017.
*Using comparable exchange rates and excluding the net sales of the divested container gardening businesses in the U.S (in January 2016) and Europe (in December 2016), net sales in the Functional segment increased by 3.4% in 2017.
FUNCTIONAL SEGMENT IN 2017
OTHER SEGMENT IN 2017
*FVTPL = Fair value through profit or loss
NET SALES BY GEOGRAPHY IN 2017
*Using comparable exchange rates, excluding the divested Spring USA (September 2016) and the divested container gardening busi-nesses in the U.S. (January 2016) and Europe (December 2016).**Geographically unallocated exhange differences.
EUR MILLION 2017 2016 CHANGE
Net sales* 573.9 598.1 -4.0%
Comparable EBITA 70.7 59.4 19%
Capital expenditure 14.0 14.9 -6%
EUR MILLION 2017 2016 CHANGE
Net sales* 607.8 602.7 0.8%
Comparable EBITA 59.7 57.1 5%
Capital expenditure 19.4 21.8 -11%
EUR MILLION 2017 2016 CHANGE
Net sales 3.8 3.8 -0.4%
Comparable EBITA -11.5 -9.5 -21%
Net change in fair value of investments valued at FVTPL* 107.9 6.1
Investments at FVTPL* 572.4 464.4 23%
Capital expenditure 2.0 0.9 112%
EUR MILLION 2017 2016 CHANGECOMPARABLE
CHANGE*
Europe 568.5 555.3 2.4% 5.7%
Americas 463.0 489.9 -5.5% -2.3%
Asia-Pacific 152.8 153.3 -0.3% 1.6%
Unallocated** 1.2 6.2 -80% -79%
Net sales in the Living segment decreased by 4.0% to EUR 573.9 million (2016: 598.1) during the year 2017. Comparable net sales decreased by 0.4%, impacted by the English & Crystal Living business in the U.S. and Australia, while the Scandinavian Living business increased in comparable net sales, especially in the Nordic markets.
Comparable EBITA for the Living segment increased by 19% and totaled EUR 70.7 million (59.4) during the year 2017, driven by the performance of the Scandinavian Living business, offsetting the decline in the English & Crystal Living business.
Fiskars Group’s consolidated net sales decreased by 1.6% to EUR 1,185.5 million (2016: 1,204.6, which included EUR 24.7 million from divested businesses). Comparable net sales increased by 1.5%, supported by an increase in the Functional segment.
The comparable EBITA increased by 11% to EUR 119.0 million (107.1), supported by the performance of both Living and Functional segments. Items affecting comparability in EBITA amounted to EUR -5.8 million (-10.4) during January–December, and were mainly related to the Alignment program. Fiskars Group’s EBITA totaled EUR 113.2 million (96.7) during the year 2017.
Net sales in the Functional segment increased by 0.8% to EUR 607.8 million (2016: 602.7) during the year 2017. Comparable net sales increased by 3.4%, supported by the growth in Functional EMEA and Functional Americas businesses, offsetting the decline in the Outdoor business in the U.S. The net sales increase was supported by scissors sales globally as well as garden and hardware categories in the U.S. In addition, net sales increased in the in-direct e-commerce channel.
Comparable EBITA for the Functional segment increased by 5% and totaled EUR 59.7 million (57.1) during the year 2017, driven by the Functional Americas and Functional EMEA businesses, offsetting the decline in the Outdoor business in the U.S. The increase was supported primarily by the increased volumes and favorable development of the watering category.
The Other segment contains the Group’s investment portfolio, real estate unit, corporate headquarters, and shared services.
Net sales in the segment remained flat and amounted to EUR 3.8 million during the year 2017 (2016: 3.8), and consisted of timber sales and rental income. The comparable EBITA for the Other segment amounted to EUR -11.5 million (-9.5).
At the end of the period, the market value of Fiskars’ active investments was EUR 572.4 million (December 31, 2016: 464.4). This consisted of shares in Wärtsilä, with a closing price of EUR 52.60 (42.68) per Wärtsilä share.
The net change in fair value of investments recorded in the profit and loss statement amounted to EUR 107.9 million (6.1) during 2017.
Net sales in Europe increased by 2.4% and amounted to EUR 568.5 million (2016: 555.3). Comparable net sales increased by 5.7%, driven by both the Living and Functional segments. The Scandinavian Living busi-
ness increased its comparable net sales, especially in the Nordic markets. The increase in the Functional business was supported by increased sales to existing customers.
EUR MILLION 2017 2016 CHANGE
Group 119.0 107.1 11%
Living 70.7 59.4 19%
Functional 59.7 57.1 5%
Other -11.5 -9.5 -21%
COMPARABLE EBITA
Operating environment in 2017 In Europe, the operating environment developed mod-erately positively throughout the year. The retail and consumer confidence increased in many countries,
combined with modest economic growth. In the UK, the decreasing purchasing power and uncertainty around Brexit weighed on consumer confidence.
In the U.S., economic growth was mostly at a good level during the year, although the first quarter of 2017 was significantly weaker. Consumer confidence remained strong throughout the year.
For most of the year development in the Asia-Pa-cific region was subdued, especially regarding con-sumer confidence in Australia. In Japan, economic data showed modest improvement.
The digital transformation impacted the retail sector throughout the course of the year and has caused some consolidation within the sector, most notably affecting the U.S. market. The transformation has continued to impact mainly the department store channel, as well as some outdoor channels.

8 Fiskars Group 9Financial Statements 2017
Net sales in Americas decreased by 5.5% to EUR 463.0 million (489.9). Comparable net sales decreased by 2.3%, impacted by the English & Crystal Living business and the Outdoor business, offsetting the increase in the Functional business.
Net sales in Asia-Pacific remained flat and amounted to EUR 152.8 million (153.3). Comparable net sales increased by 1.6%, driven by both the Living and Functional segments, offsetting the decline in the English & Crystal Living business in Australia.
RESEARCH & DEVELOPMENTIn 2017, the Group’s research and development expen-diture totaled EUR 18.8 million (2016: 18.0), equivalent to 1.6% (1.5%) of net sales.
PERSONNELAt the end of 2017, the Group employed 7,932 (2016: 8,560) employees, of whom 1,126 (1,224) were in Fin-land. The year-on-year change in the Group’s figure was mainly related to the divestments, the Alignment program and unified definitions among retail and manufacturing personnel.
The average number of full-time equivalent employ-ees (FTE) in 2017 in the Functional segment was 2,289 (2016: 2,354), in the Living segment 5,379 (5,609) and in the Other segment 41 (36) in 2017.
Fiskars’ transformation process
by the end of 2017. The targeted annual cost savings were approximately EUR 14 million.
The majority of the program activities were com-pleted by the end of 2017. The rest of the changes will be finalized during 2018, however the remaining costs are not expected to be material. The targeted annual cost savings of EUR 14 million have been achieved, the majority already in 2017.
SUPPLY CHAIN 2017 PROGRAMDuring the third quarter of 2015, Fiskars announced a restructuring program to optimize its global supply chain network in Europe and Asia. The Supply Chain 2017 program aimed to improve the competitiveness of Fiskars’ manufacturing operations and distribution network. The total costs of the program were estimated to be approximately EUR 20 million between 2015 and 2017, reported as items affecting comparabil-ity in EBITA. The targeted annual cost savings were approximately EUR 8 million.
The program was completed by the end of 2017. The total costs of the program were EUR 11.2 million, below the original estimate. The targeted annual cost savings of EUR 8 million have been achieved, the major-ity already in 2017.
(0.78). Operative earnings per share, excluding the net change in the fair value of the investment portfolio and dividends received were EUR 0.81 (0.56).
Fiskars’ vision is to create a positive, lasting impact on the quality of life we live – making the everyday extraordinary. The company has been on a transfor-mation journey to become an integrated consumer goods company with a family of iconic lifestyle brands. The company continued to take steps during 2017 to move this process forward.
ALIGNMENT PROGRAMIn November 2016, Fiskars launched the Alignment program to proceed in the transformation. The program focused on the structural changes in the organiza-tion, proposed headcount reductions, and the full integration of the English & Crystal Living business, acquired in 2015. The net headcount reduction was estimated to be 130 positions globally.
The total costs of the program were estimated to be approximately EUR 15 million in 2016-2017. They were recorded as items affecting comparability in EBITA, of which EUR 14.1 million had been recorded
Along with the rest of the Group’s active investments, the share ownership in the Wärtsilä Corporation is treated as a financial asset at fair value through profit or loss, which has increased the volatility of Fiskars’ net results. At the end of 2017, Fiskars owned 10,881,781 shares in Wärtsilä, representing 5.52% of Wärtsilä’s share capital. The number of shares held in Wärtsilä did not change during 2017.
The net change in the fair value of investments through profit or loss, consisting of the company’s holdings in Wärtsilä, amounted to EUR 107.9 million (2016: 6.1) during the year 2017.
Other financial income and expenses amounted to EUR 11.4 million (4.4) in 2017, including EUR 14.1 million (13.1) in dividends received on Wärtsilä shares, EUR 0.6 million (-0.5) of foreign exchange differences and EUR -5.0 million (-6.9) in interest costs.
Profit before taxes for the year was EUR 217.8 million (92.8). Income taxes in the year 2017 were EUR -50.8 million (-27.4), the change from last year being mainly due to the change in the market value of the Wärtsilä holding. Earnings per share were EUR 2.04
Reporting on non-financial information
ENVIRONMENTThe responsible and reduced use of natural resources, and the careful re-usage and recycling of materials is central to Fiskars Group’s supply chain strategy. Fiskars’ environmental and energy approach is guided by two main principles: supporting long-term com-petitiveness and reducing negative impacts.
New business models around circular economy, such as extending material cycles, provide opportunities to create value and support Fiskars in reducing the use of non-renewable materials. Fiskars is committed to promoting efficiency and identifying new solutions throughout the value chain.
Policies and commitmentsFiskars published its Environmental Policy for the Supply Chain in 2017 to highlight the common targets and to align the ways of working across the company’s own manufacturing units. In 2018, the policy will be expanded to cover the entire Fiskars Corporation, including office spaces and own retail stores. The Supplier Code of Conduct outlines the expectations regarding suppliers’ environmental conditions, and every supplier must sign and commit to it in order to do business with Fiskars.
Targets and actions International standards and guidelines, such as ISO 14001, create an important foundation for Fiskars’ approach to environmental management. Along with the environmental standards and guidelines, the long-term and the short-term targets that have been set in 2017 have driven many improvement initiatives in Fiskars’ manufacturing units and distribution centers.
Fiskars has published a set of long-term targets for 2027 and is starting to track the progress made in meeting them. The base year for the targets has been set as 2017. During the course of 2017, Fiskars estab-lished short-term targets for the 2017–2020 period to support the efforts in achieving the long-term targets.
Financial items and net result in 2017
Cash flow, balance sheet, and financing in 2017
During 2017, cash flow from operating activities before financial items and taxes amounted to EUR 130.5 million (2016: 120.7). The increase was primarily due to improvements in profitability. Cash flow from finan-cial items and taxes amounted to EUR -26.7 million (-37.0). Cash flow from investing activities was EUR -12.4 million (78.8, including the positive cash flow of EUR 61.7 million from the sale of investments in short-term interest rate funds and EUR 46.1 million from the sale of non-current assets held for sale), including capital expenditure on fixed assets of EUR -32.8 million, positive cash flow from the sale of property of EUR 9.5 million and received dividends of EUR 14.1 million. Cash flow from financing activities was EUR -78.0 million (-164.1) during the year 2017, including the positive cash flow of EUR 2.0 million from the money market investments, EUR -87.0 million (-58.7) in payment of dividends and a EUR 7.3 million (-78.0) increase in current debt.
Capital expenditure for 2017 totaled EUR 35.4 million (37.6), mainly relating to expansions, IT solu-tions, and efficiency investments. Depreciation, amor-tization, and impairment were EUR 38.8 million (37.4).
Fiskars’ working capital totaled EUR 195.9 million (217.8) at the end of December. The decrease was primarily related to decreased inventories. The equity ratio was 69% (69%) and net gearing was 12% (12%).
Cash and cash equivalents at the end of the period totaled EUR 31.1 million (17.7). Net interest-bear-ing debt amounted to EUR 147.7 million (152.4). In addition, the shares in Wärtsilä were valued at EUR 572.4 million (464.4) at the end of the year.
Short-term borrowing totaled EUR 48.5 million (10.9) and long-term borrowing totaled EUR 151.4 million (182.4). Short-term borrowing mainly consisted of commercial papers. In addition, Fiskars had EUR 300.0 million (300.0) in unused, committed long-term credit facilities with Nordic banks.

10 Fiskars Group 11Financial Statements 2017
TARGET 2027: EMPLOYEES ARE OFFERED EQUAL OPPORTUNITIES TO DEVELOP REGARDLESS OF THEIR AGE OR TENURE
GRI 405-1 Diversity of governance bodies and employees 2017DIVERSITY AND EQUAL OPPORTUNITIES
BOARD OF DIRECTORS
By age group
<30 0%
30–50 30%
>50 70%
By gender
Female 40%
Male 60%
EXECUTIVE LEADERSHIP TEAM
By age group
<30 0%
30–50 17%
>50 83%
By gender
Female 50%
Male 50%
MANAGERS
By age group
<30 2%
30–50 66%
>50 32%
By gender
Female 45%
Male 55%
GRI 302-1 Energy consumption within the organization, TJ 2017
ENERGY Direct energy consumption: non renewable 774Direct energy consumption: renewable 6Indirect energy consumption 340Total energy consumption 1,120
GRI 305-1 Direct (Scope 1) GHG emissions, t CO2 2017
EMISSIONSScope 1 emissions 43,000
GRI 306-2 Waste by type and disposal method, t 2017
WASTEWaste to landfill 3,926
Total waste 18,458
GRI 305-2 Energy indirect (Scope 2) GHG emissions, t CO2 2017
EMISSIONS
Scope 2 emissions
Market based 43,000
Location based 34,000
TARGET 2027: GROUP-WIDE ENERGY CONSUMPTION OF OWN PRODUCTION REDUCED BY 30%
TARGET 2027: GROUP-WIDE CO2 EMISSIONS FROM OUR OWN PRODUCTION REDUCED BY 50%
TARGET 2027: 100% OF WASTE GENERATED IN MANUFACTURING IS RECOVERABLE OR RECYCLABLE, NO WASTE TO LANDFILL
a culture of zero harm in order to increase safety and hazard awareness. A continuing focus on reducing incidents and near-miss reporting are vital in devel-oping and retaining a team of people engaged and enabled to do their best.
Policies and commitments Fiskars has outlined a set of policies and guidelines related to social and employee-related matters to guide leadership, employees, and partners in their everyday work.
The Fiskars Code of Conduct provides a detailed description of Fiskars’ approach to doing business in an ethical and sustainable manner. In 2017 Fiskars defined its Commitment to Inclusion and Diversity to create a foundation for the efforts to build a globally collaborative culture with people from different back-grounds and cultures.
Ensuring the safety and wellbeing of the employ-ees and people involved in Fiskars’ value chain is a key priority. In 2017 Fiskars published the Occupational
Fiskars has implemented a new global platform to gather environmental data from the manufacturing units and distribution centers to track the development in a more robust way, with a clear audit trail for the data reported.
Fiskars reports in accordance with the GRI Stan-dards, and the KPI’s are aligned with the GRI.
SOCIAL AND EMPLOYEE-RELATED MATTERS
Fiskars is committed to inspiring and empowering people to learn, develop as professionals, and bring in new ideas, skills, and views. Fiskars is building a globally collaborative culture, and needs a diverse team to be able to serve consumers in the best possi-ble way. Fiskars’ long-term target is to attract, develop and retain a diverse team of high-performing people with different backgrounds and cultures.
One of the key priorities in Fiskars’ operations is to ensure the safety and wellbeing of employees and people involved in the value chain. Fiskars promotes
Health and Safety Policy for its supply chain to support creating a culture of zero harm. Fiskars’ Supplier Code of Conduct included health and safety topics such as workplace safety, emergency preparedness, and management and communication on health and safety.
Targets and actions Fiskars organizes regular mandatory training sessions to help all employees implement the principles and guidelines outlined in the Code of Conduct in their everyday work. The most recent training took place in 2017, which 98% of people completed compared to a target of 100%.
Every supplier must sign and commit to Fiskars’ Supplier Code of Conduct in order to do business
with Fiskars. As a result of the Supplier Code of Conduct, Fiskars has a comprehensive process in place to manage suppliers’ sustainability. The process includes regular audits to follow the performance of Fiskars’ suppliers in terms of their commitment to social responsibility and human rights. As part of the process, Fiskars works together with its suppliers and supports their development through training sessions, workshops and mutual development projects.
To ensure the necessary focus and implement the policies, Fiskars has set long-term targets for 2027. In addition, Fiskars has created short-term targets and action plans for the 2017–2020 period to support the efforts in managing the social and employee-related matters that are material for the company.

12 Fiskars Group 13Financial Statements 2017
TARGET 2027: REACH A HIGHER LEVEL OF DIVERSITY IN OUR WORKFORCE We want to attract, develop and retain a diverse team of high-performing people and to prolong the Fiskars career path of young talents by 25%
TARGET 2027: EQUAL OPPORTUNITIES Women and men are equally enabled & engaged with women’s enablement and engagement improved to the high-performing norm level (55% in 2016)
The average length of the career of the young talents (35 or under)Office Operative Retail
By gender
Female 3.87 4.68 2.54
Male 4 .10 6.80 3.07
Women and men enablement & engagement in employee survey 2016 2017Women 48% 48%
Men 55% 57%
HUMAN RIGHTS AND ANTI-CORRUPTION & BRIBERY
Fiskars has an important opportunity to influence peo-ple’s lives throughout the value chain. Fiskars respects human rights and recognizes the equality of people.
Fiskars is committed to the highest possible stan-dards of integrity, accountability and honesty in all its activities with employees and third parties. This is in line with the commitment Fiskars expects of its employees, and people involved in the value chain, to act impartially and in good faith at all times. Integrity is one of Fiskars’ four values, and every leader and employee is expected to demonstrate integrity in their everyday work.
Policies and commitments Fiskars’ commitment to human rights is deeply ingrained in its values and articulated in Fiskars’ poli-cies. The Fiskars Code of Conduct provides a detailed
description of Fiskars’ approach to doing business in an ethical and sustainable manner, including working conditions, labor rights, anti-corruption and bribery, and safety at work.
The Fiskars’ Supplier Code of Conduct outlines the same expectations for suppliers. Every supplier must sign and commit to the Fiskars’ Supplier Code of Conduct in order to do business with Fiskars.
Fiskars is a signatory to the United Nations Global Compact, by which Fiskars has committed to mitigate adverse human rights impacts and work against cor-ruption and bribery. To support Fiskars’ commitment, the Fiskars Anti-Corruption and Anti-Bribery policy outlines expectations towards Fiskars employees, and all others that the company deals with, to act impartially and in good faith at all times. The policy covers every individual working in or with Fiskars, at any level or grade and wherever they are located. Fiskars also expects that all of its business partners
should be governed by the same or similar principles as stipulated in this Policy. Fiskars expects all business partners ensure that those principles are communi-cated to their employees and sub-contractors.
Targets and actions Fiskars’ approach to human rights and anti-corruption and bribery is defined in Fiskars’ policies, which are also the foundation for the implementation and tar-gets. Fiskars has set long-term targets for 2027 and created short-term targets and action plans for the 2017–2020 period to support the efforts in enforcing human rights and anti-corruption and bribery through-out the value chain.
Fiskars is currently measuring the awareness and commitment to human rights and anti-corruption and bribery by measuring the percentage of employees that have participated in Code of Conduct training. In 2017, 98% of Fiskars employees completed the training compared to a target of 100%.
In early 2018, the Fiskars Whistle Blower system will be in place replacing older channels to provide employees and all those involved in the value chain an easy and anonymous way to report any suspected misconducts.
The performance of Fiskars’ suppliers is followed through regular audits, and Fiskars supports their development through training sessions and work-shops. In addition, Fiskars has organized training sessions on the Supplier Code of Conduct and the process of managing suppliers’ sustainability in order to raise awareness among Fiskars employees across different functions.
Fiskars Audit Program is a key tool to track sup-pliers’ performance in human rights. During 2017 Fiskars audited one third of all active finished goods suppliers under global sourcing.
RISKSRisks related to environmental, social and employ-ee-related matters and human rights are described in more detail in the Corporate Governance Statement. The overall objective of Fiskars’ risk management is to identify, evaluate, and manage risks that may jeopar-dize the achievement of Fiskars’ business goals and the fulfillment of its commitments. The most import-ant topics are examined and the most material risks for Fiskars have been identified. Fiskars has several management processes in place to manage risks, such as supplier risk management processes and strategic initiatives to lower emissions and reduce energy consumption.
Climate change, resource scarcity, and changing consumer preferences bring many new strategic,
operative and financial risks as well as opportunities for Fiskars. The cost of emissions, non-renewable materials and waste is expected to increase in the future. Consumers are increasingly interested in new business and service models based around the circular economy, such as renting and take-back concepts.
Human rights, anti-corruption and bribery related risks are mainly seen as compliance, reputational and financial risks but Fiskars also sees them as an operative risk. The main risks for the company are a lack of compliance from the management of suppliers and the inability to also cover their suppliers’ health and safety throughout the value chain and ensuring zero tolerance of corruption and bribery.
On February 10, 2017 Fiskars appointed Sari Pohjonen, M.Sc. (Econ) as Chief Financial Officer of Fiskars Group and a member of the Executive Leadership Team.
On February 15, 2017 Kari Kauniskangas, Presi-dent and CEO of Fiskars Corporation, announced his resignation from the position. The Board of Directors appointed Teemu Kangas-Kärki, the deputy to the CEO and Fiskars’ Chief Operating Officer, as interim President and CEO.
On March 31, 2017 Fiskars appointed Paul Ton-nesen, MBA, B.Sc. (Marketing) as President, SBU Func-tional and a member of the Executive Leadership Team.
On June 20, 2017, the Board of Directors of Fiskars Corporation appointed M.Sc. (Chem. Eng) Jaana Tuominen as President and CEO of Fiskars Corporation. Her starting date was October 9, 2017.
GRI 405-1 Diversity of governance bodies and employees 2017DIVERSITY AND EQUAL OPPORTUNITIES
EMPLOYEE CATEGORY Office Operative Retail
By age group
<30 19% 52% 30%
30–50 35% 52% 13%
>50 32% 43% 24%
By gender
Female 31% 37% 32%
Male 32% 63% 4%
Changes in organization and management

14 Fiskars Group 15Financial Statements 2017
Other significant events during 2017
Shares and shareholders Board authorizations Board and Board Committees
On February 8, 2017 Fiskars established long-term financial targets that cover four areas: growth, prof-itability, capital structure and dividend:
• Growth: The average annual net sales growth to exceed 5%, through a combination of organic growth and targeted acquisitions
• Profitability: EBITA margin to exceed 10%• Capital structure: Net gearing* below 100%• Dividend: Fiskars aims to distribute
a stable, over time increasing dividend, to be paid biannually
*Net gearing ratio is the ratio of interest-bearing debt, less interest-bearing receivables and cash and bank equivalents, divided by total equity.
Corporate GovernanceFiskars complies with the Finnish Corporate Gover-nance Code issued by the Securities Market Asso-ciation, which came into force on January 1, 2016. Fiskars’ Corporate Governance Statement for 2017 in accordance with Reporting requirements of the Code will be published in week 8 of 2018 as a sep-arate report.
Ultimate decision-making power is vested in the Annual General Meeting of shareholders, which elects the members of the Board of Directors. Members of the Board are appointed until the end of the following Annual General Meeting. The Board of Directors is responsible for appointing, and if necessary, dismissing the President and CEO. Fiskars’ Articles of Association do not contain matters that could materially affect a public tender offer of the company’s securities.
Fiskars Corporation has one share series (FSKRS). All shares carry one vote and equal rights. The number of shares in the Corporation totals 81,905,242. Fiskars Corporation held 191,467 of its own shares at the end of 2017. The share capital remained unchanged at EUR 77,510,200.
Fiskars shares are traded in the Large Cap seg-ment of Nasdaq Helsinki. The volume weighted aver-age share price during 2017 was EUR 20.75 (2016: 16.98). At the end of December, the closing price was EUR 23.96 (EUR 17.60) per share and Fiskars had a market capitalization of EUR 1,957.9 million (1,438.2). The number of shares traded on Nasdaq Helsinki and in alternative market places from January to December was 5.2 million (3.0), which represents 6.4% (3.7%) of the total number of shares.
The total number of shareholders was 19,536 (18,643) at the end of December 2017.
FLAGGING NOTIFICATIONSDuring the review period January–December 2017, Fiskars was informed of the following changes among its shareholders:
On December 29, 2017, Fiskars received a notification that Turret Oy Ab and Holdix Oy Ab as well as certain closely associated persons have on December 29, 2017, entered into a co-operation concerning their ownership in Fiskars Corporation. The co-operation comprises a shareholders’ agree-ment between Turret Oy Ab and Holdix Oy Ab which the closely associated persons have undertaken to comply with as applicable. The closely associated persons comprise Paul Ehrnrooth, Jacob Ehrnrooth and Sophia Ehrnrooth, all of whom are closely asso-ciated with Turret Oy Ab, as well as Elsa Fromond, Louise Fromond and Anna Fromond, all of whom are closely associated with Holdix Oy Ab. The direct and indirect ownership of Turret Oy Ab and Holdix Oy Ab has exceeded the 25% threshold. The threshold was exceeded on December 29, 2017. Turret Oy Ab, Holdix Oy Ab and the closely associated persons hold in total 23 883 711 shares in Fiskars Corporation, which corresponds to 29.16% of all shares and votes in Fiskars Corporation. The parties have no intention of making a tender offer for Fiskars Corporation and the aggregate ownership will, in accordance with the current strategy, remain below 30%.
PURCHASE OF OWN SHARESFiskars did not purchase any own shares during 2017.
AUTHORIZING THE BOARD OF DIRECTORS TO DECIDE ON THE ACQUISITION OF THE COMPANY’S OWN SHARES
The Annual General Meeting decided to authorize the Board to decide on the acquisition of a maximum of 4,000,000 own shares, in one or several instalments, using the unrestricted shareholders’ equity of the com-pany. The company’s own shares may be acquired in public trading on Nasdaq Helsinki Ltd at a price formed in public trading on the date of the acquisition. The authorization may be used to acquire shares to be used for the development of the capital structure of the company, as consideration in corporate acquisitions or industrial reorganizations and as part of the company’s incentive system and otherwise for further transfer, retention or cancellation. The Board of Directors is authorized to decide on all other terms and conditions regarding the acquisition of the company’s own shares. Based on the authorization the acquisition of the com-pany’s own shares may be made otherwise than in proportion to the share ownership of the shareholders (directed acquisition). The authorization is effective until June 30, 2018 and cancelled the corresponding autho-rization granted to the Board by the Annual General Meeting on March 9, 2016. The Board of Directors has not utilized this authorization during 2017.
AUTHORIZING THE BOARD OF DIRECTORS TO DECIDE ON THE TRANSFER OF THE COMPANY’S OWN SHARES
The Annual General Meeting decided to authorize the Board to decide on the transfer of own shares (share issue) held as treasury shares of a maximum of 4,000,000 shares, in one or several instalments, either against or without consideration. The company’s own shares held as treasury shares may be transferred for example as consideration in corporate acquisitions or industrial reorganizations or for the development of the capital structure of the company, or as part of its incentive system. The Board of Directors is authorized to decide on all other terms and conditions regarding the transfer of own shares held as treasury shares. The transfer of own shares may also be carried out in deviation from the shareholders’ pre-emptive rights to the company’s shares (directed issue). The authorization is effective until June 30, 2018 and cancelled the corresponding authorization granted to the Board by the Annual General Meeting on March 9, 2016. The Board of Directors has not utilized this authorization during 2017.
The Annual General Meeting decided that the Board of Directors shall consist of ten members. Paul Ehrn-rooth, Alexander Ehrnrooth, Ingrid Jonasson Blank, Louise Fromond, Gustaf Gripenberg, Jyri Luoma-koski, Inka Mero, Fabian Månsson, Peter Sjölander and Ritva Sotamaa were re-elected. The term of the Board members will expire at the end of the Annual General Meeting in 2018.
Convening after the Annual General Meeting held on March 9, 2017 the Board of Directors elected Paul Ehrnrooth as its Chairman and and Alexander Ehrnrooth as the Vice Chairman. The Board decided to establish an Audit Committee, a Compensation Committee and a Nomination Committee.
The Board appointed Jyri Luomakoski (Chair-man), Alexander Ehrnrooth, Louise Fromond, Gustaf Gripenberg and Ritva Sotamaa as members of the Audit Committee. Paul Ehrnrooth (Chairman), Ingrid Jonasson Blank, Inka Mero and Peter Sjölander were appointed as the members of the Compensation Com-mittee. The Board appointed Paul Ehrnrooth (Chair-man), Alexander Ehrnrooth and Fabian Månsson as the members of the Nomination Committee.
The Annual General Meeting decided to pay dividend of EUR 1.06 per share for the financial period that ended on December 31, 2016. The dividend was paid in two instalments. The first instalment of EUR 0.71 per share was paid on March 20, 2017. The second instalment of EUR 0.35 was paid on September 18, 2017.
Fiskars’ business, net sales, and financial performance may be affected by several uncertainties. Fiskars Group has detailed the overall business risks and risk management in its Annual Report and on the company’s website www.fiskarsgroup.com/investors.
Consumer confidence has been improving in several major markets which are important to Fiskars. However, a decrease in consumer confidence e.g. due to an uncertain geopolitical environment could have an adverse impact on the Group’s net sales and profit.
Demand for some of the Group’s products is dependent on the weather, particularly garden tools and watering products during the spring and snow tools during the winter. Unfavorable weather condi-tions such as cold and rainy weather during spring or no snow in the winter can have a negative impact on the sale of these products. The sale of homeware products is heavily geared towards the last quarter of the year, and any negative issues related to product
Dividend for the financial year 2016
Risks and business uncertainties
16 Fiskars Group 17Financial Statements 2017
availability or demand during this quarter could affect the full-year result of this business significantly.
Fiskars has its own manufacturing operations in several locations, and most of its suppliers are located outside Fiskars’ key markets. Disturbances at the source of supply or in the logistics chain could prevent the orderly delivery of products to customers.
A complex and changing legal and regulatory environment and tax legislation may expose the com-pany to compliance and litigation risks, including competition compliance, anti-corruption, human rights, security and data privacy and create uncertainties relating to tax obligations towards various authorities.
Failure to meet demands on performance and safety could expose Fiskars to the risk of product recall and even liability for damages in the event that its prod-ucts cause injury to consumers or damage to property.
Fiskars is increasingly dependent on centralized information technology systems, and breaches, mal-functions or disruptions can prevent the execution of the required business processes either regionally or globally. Cyberattacks and fraud may cause signifi-cant financial losses.
Fiskars Group entities are subject to tax audits in several countries. It is possible that tax audits may lead to reassessment of taxes. The tax reassessment claim raised by the Finnish Large Taxpayers’ Office in 2016, which obliged the company to pay a total of EUR 28.3 million in additional tax, interest expenses and punitive tax increases, has been appealed against by the company to the Board of Adjustment in the
Events after the reporting period
Outlook for 2018
Finnish Large Taxpayers’ Office. Fiskars will continue the appeal process in court, if necessary, in which case the process may take years. The dispute con-cerns intra-group loans forgiven by the company in 2003 and their tax treatment in subsequent tax years.
In December 2017, the U.S. tax reform was signed into law. The legislation includes, among other things, a reduction in the U.S. federal corporate income tax rate from 35% to 21%. The change is expected to have a slightly positive impact on Fiskars’ net result from 2018 onwards.
Fiskars operates globally with a considerable part of its business in the U.S. and in other countries outside of the euro zone. Weakening of the U.S. dollar or other currencies relative to the euro may have a material impact on the reported financial figures due to the translation exposure. Less than 20% of Fiskars’ commercial cash flows are exposed to fluctuations in foreign exchange rates.
Fiskars’ financial investment portfolio consists of shares in Wärtsilä and of other financial investments. The financial investment portfolio may lose value for several reasons.
On January 11, 2018, Fiskars announced the renewal and expansion of its group leadership team. At the same time, Fiskars discontinued the Extended Lead-ership Team and the Corporate Office to simplify its leadership structure. Fiskars appointed Ulla Lettijeff (M.Sc.Tech) as President, SBU Living and a member of the Fiskars Group Leadership Team. In addition, Fiskars will appoint a Chief Growth Officer (CGO) to the Group Leadership Team. The following new members have also been appointed to the Group Leadership Team: Chief Supply Chain Officer Risto Gaggl (M.Sc.Tech), General Counsel Päivi Timonen (LL.M.) and VP, Corporate Communications and Sustainability Maija Taimi (M.Sc.Econ). Fiskars has also appointed CFO Sari Pohjonen as the Deputy to the CEO.
Chief Operating Officer Teemu Kangas-Kärki, Chief Human Resources Officer Nina Ariluoma and Presi-dent, SBU Living Ulrik Garde Due leave the company. Nina Ariluoma will continue in her role as Chief Human Resources Officer until the end of March 2018. Fiskars will start the recruitment process for the Chief Growth Officer and a new Chief Human Resources Officer. After these changes the Fiskars Group Leadership Team consists of nine members:
• Jaana Tuominen, President and CEO • Sari Pohjonen, Chief Financial
Officer and Deputy to the CEO • Risto Gaggl, Chief Supply Chain Officer • Ulla Lettijeff, President, SBU Living • Maija Taimi, VP, Corporate
Communications and Sustainability • Päivi Timonen, General Counsel • Paul Tonnesen, President, SBU Functional • Nina Ariluoma, Chief Human Resources
Officer (until the end of March 2018. Successor to be appointed later)
• Chief Growth Officer, to be appointed later
would leave EUR 876.2 million (910.5) of distributable earnings in the parent company.
No material changes have taken place in the financial position of the company since the end of the financial period. The financial standing of the company is good and, according to the Board of Directors’ assessment, distributing the proposed dividend will not compromise the company’s solvency
Helsinki, Finland, February 6, 2018
FISKARS CORPORATIONBoard of Directors
Fiskars’ aim is to distribute a stable, over time increas-ing dividend, to be paid biannually. According to the balance sheet of the parent company at the end of the financial period 2017, the distributable equity of the parent company was EUR 935.1 million (2016: EUR 997.1 million).
The Board of Directors proposes to the Annual General Meeting that a dividend of EUR 0.72 per share shall be paid for the financial period that ended on December 31, 2017. The dividend shall be paid in two instalments. The ex-dividend date for the first instalment of EUR 0.36 per share shall be on March 15, 2018. The first instalment shall be paid to a share-holder who is registered in the shareholders’ register of the company maintained by Euroclear Finland Ltd on the dividend record date March 16, 2018. The pay-ment date proposed by the Board for this instalment is March 23, 2018.
The second instalment of EUR 0.36 per share shall be paid in September 2018. The second instal-ment shall be paid to a shareholder who is regis-tered in the shareholders’ register of the company maintained by Euroclear Finland Ltd on the divi-dend record date, which, together with the payment date, shall be decided by the Board of Directors in its meeting scheduled for September 7, 2018. The ex-dividend date for the second instalment would be September 10, 2017, the dividend record date for the second instalment would be September 11, 2018 and the dividend payment date September 18, 2018, at the latest.
On the date of this financial statement release, the number of shares entitling their holders to a div-idend was 81,713,775. The proposed distribution of dividends would thus be EUR 58.8 million (86.6). This
In 2018, Fiskars expects the Group’s comparable net sales and comparable EBITA to increase from the year 2017.
The comparable net sales excludes the impact of exchange rates, acquisitions and divestments. Items affecting comparability in EBITA excludes restructuring costs, impairment charges, integration related costs, acquisitions and divestments, and gain and loss from the sale of businesses.
Proposal for distribution of dividend

18 Fiskars Group 19Financial Statements 2017
Consolidated Financial Statements, IFRSConsolidated income statement Consolidated statement of comprehensive income
EUR MILLION NOTE 2017 2016
Net sales 2 1,185.5 1,204.6
Cost of goods sold 6 -673.3 -701.8
Gross profit 512.2 43% 502.9 42%
Other operating income 5 7.1 18.5
Sales and marketing expenses 6 -300.2 -298.3
Administration expenses 6 -99.9 -115.0
Research and development costs 6 -18.8 -18.0
Other operating expenses 6 -2.5 -7.4
Operating profit (EBIT) 97.9 8% 82.7 7%
Change in fair value of biological assets 13 0.7 -0.5
Investments at fair value through profit or loss – net change in fair value 8 107.9 6.1
Other financial income and expenses 8 11.4 4.4
Profit before taxes 217.8 18% 92.8 8%
Income taxes 9 -50.8 -27.4
Profit for the period 167.1 14% 65.4 5%
Attributable to:
Equity holders of the parent company 166.4 64.1
Non-controlling interest 0.7 1.3
Earnings for equity holders of the parent company per share, euro (basic and diluted) 10 2.04 0.78
EUR MILLION NOTE 2017 2016
Profit for the period 167.1 65.4
Other comprehensive income for the period
Items that may be reclassified subsequently to profit or loss
Translation differences -29.4 25.1
Cash flow hedges 0.6 -0.3
Items that will not be reclassified to profit or loss
Defined benefit plan, actuarial gains (losses), net of tax 20 0.2 -0.3
Other comprehensive income for the period, net of tax -28.6 24.5
Total comprehensive income for the period 138.5 89.9
Attributable to:
Equity holders of the parent company 137.8 88.5
Non-controlling interest 0.7 1.4
The notes are an integral part of these consolidated financial statements.

20 Fiskars Group 21Financial Statements 2017
Consolidated balance sheetEUR MILLION NOTE DEC 31, 2017 DEC 31, 2016
ASSETS
Non-current assets
Goodwill 11 221.9 229.7
Other intangible assets 11 279.5 296.3
Property, plant & equipment 12 155.1 159.7
Biological assets 13 41.6 40.9
Investment property 14 3.9 4.9
Financial assets
Financial assets at fair value through profit or loss 15 21.7 20.4
Other investments 15 8.7 9.7
Deferred tax assets 9 29.2 30.2
Non-current assets total 761.7 41% 791.7 45%
Current assets
Inventories 16 205.2 224.6
Trade and other receivables 17 214.4 203.6
Income tax receivables 33.2 35.9
Interest-bearing receivables 15 20.0 22.0
Investments at fair value through profit or loss 15 572.4 464.4
Cash and cash equivalents 15 31.1 17.7
Current assets total 1,076.2 59% 968.3 55%
Assets total 1,837.9 100% 1,760.1 100%
EUR MILLION NOTE DEC 31, 2017 DEC 31, 2016
EQUITY AND LIABILITIES
Equity
Equity attributable to the equity holders of the parent company 1,269.4 1,218.1
Non-controlling interest 2.8 1.9
Equity total 18 1,272.1 69% 1,220.1 69%
Non-current liabilities
Interest-bearing liabilities 19 151.4 182.4
Other liabilities 7.3 9.9
Deferred tax liabilities 9 73.2 52.7
Pension liability 20 13.3 14.1
Provisions 21 6.9 7.1
Non-current liabilities total 252.0 14% 266.2 15%
Current liabilities
Interest-bearing liabilities 19 48.5 10.9
Trade and other payables 22 246.9 237.8
Income tax liabilities 10.0 8.6
Provisions 21 8.4 16.6
Current liabilities total 313.7 17% 273.8 16%
Equity and liabilities total 1,837.9 100% 1,760.1 100%
The notes are an integral part of these consolidated financial statements.

22 Fiskars Group 23Financial Statements 2017
Consolidated statement of cash flows Statement of changes in consolidated equityEUR MILLION 2017 2016
CASH FLOW FROM OPERATING ACTIVITIES
Profit before taxes 217.8 92.8
Adjustments for
Depreciation, amortization and impairment 38.8 37.4
Gain/loss on sale and loss on scrap of non-current assets -4.3 -8.2
Investments at fair value through profit or loss – net change in fair value -107.9 -6.1
Other financial items -11.2 -4.4
Change in fair value of biological assets -0.7 0.5
Change in provisions and other non-cash items -8.5 -20.5
Cash flow before changes in working capital 124.0 91.4
Changes in working capital
Change in current assets, non-interest bearing -23.8 7.2
Change in inventories 8.5 24.0
Change in current liabilities, non-interest bearing 21.8 -1.9
Cash flow from operating activities before financial items and taxes 130.5 120.7
Financial income received and costs paid -0.7 23.2
Taxes paid -26.0 -60.2
Cash flow from operating activities (A) 103.8 83.8
CASH FLOW FROM INVESTING ACTIVITIES
Investments in financial assets -1.9 -6.6
Capital expenditure on fixed assets -32.8 -37.6
Proceeds from sale of fixed assets 9.5 2.1
Proceeds from sale of non-current assets held for sale -1.3 34.1
Proceeds from sale of subsidiary shares 0.0 12.0
Proceeds from sale of investments at fair value through profit or loss 0.0 61.7
Other dividends received 14.1 13.1
Cash flow from other investments 0.0 0.0
Cash flow from investing activities (B) -12.4 78.8
CASH FLOW FROM FINANCING ACTIVITIES
Purchase of treasury shares -0.1 -3.2
Change in current receivables 2.0 -22.0
Borrowings of non-current debt 0.9 0.0
Repayment of non-current debt -1.3 -0.9
Change in current debt 7.3 -78.0
Payment of finance lease liabilities -0.6 -1.4
Cash flow from other financing items 0.7 0.0
Dividends paid -87.0 -58.7
Cash flow from financing activities (C) -78.0 -164.1
Change in cash and cash equivalents (A+B+C) 13.5 -1.5
Cash and cash equivalents at beginning of period 17.7 19.7
Translation difference -0.1 -0.5
Cash and cash equivalents at end of period 31.1 17.7
EQUITY ATTRIBUTABLE TO SHAREHOLDERS OF THE PARENT COMPANY
EUR MILLIONSHARE
CAPITALTREASURY
SHARES
CUMUL. TRANSL.
DIFF.
FAIR VALUE
RESERVE
ACTUARIAL GAINS AND
LOSSESRETAINED EARNINGS
NON- CONTROLLING
INTEREST TOTAL
Dec 31, 2015 77.5 7.3 -1.0 -4.3 1,111.2 3.3 1,194.0
Translation differences 25.0 0.1 25.1
Cash flow hedges -0.3 -0.3
Defined benefit plan, actuarial gains (losses), net of tax -0.3 -0.3
Other comprehensive income for the period, net of tax, total 0.0 0.0 25.0 -0.3 -0.3 0.0 0.1 24.5
Profit for the period 64.1 1.3 65.4
Total comprehensive income for the period 0.0 0.0 25.0 -0.3 -0.3 64.1 1.4 89.9
Changes due to divestments 0.0 -0.6 -1.3 -1.9
Purchase of treasury shares -3.2 -3.2
Dividends paid -57.3 -1.5 -58.8
Dec 31, 2016 77.5 -3.2 32.3 -1.2 -4.6 1,117.3 1.9 1,220.1
Translation differences -29.3 -0.1 -29.4
Cash flow hedges 0.6 0.6
Defined benefit plan, actuarial gains (losses), net of tax 0.2 0.2
Other comprehensive income for the period, net of tax, total 0.0 0.0 -29.3 0.6 0.2 0.0 -0.1 -28.6
Profit for the period 166.4 0.7 167.1
Total comprehensive income for the period 0.0 0.0 -29.3 0.6 0.2 166.4 0.6 138.5
Capital injected by non-controlling interest 0.7 0.7
Purchase of treasury shares -0.1 -0.1
Dividends paid -86.6 -0.4 -87.0
Dec 31, 2017 77.5 -3.2 3.0 -0.6 -4.4 1,197.1 2.8 1,272.1
Non-cash changes on interest bearing net debt amounted to EUR 0.3 million arising from unrealized foreign exchange differences.The notes are an integral part of these consolidated financial statements.
The notes are an integral part of these consolidated financial statements.
24 Fiskars Group 25Financial Statements 2017
Notes to the consolidated financial statements1. Accounting principles for the consolidated financial statements, IFRS
Fiskars Corporation is a Finnish public limited liability company listed on Nasdaq Helsinki and domiciled in Raasepori, Finland. The registered address of Fiskars Corporation is Hämeentie 135 A, Helsinki, Finland. Fiskars Corporation is the parent company of the group. The group manufactures and markets branded consumer goods globally. Fiskars’ primary reporting segments are Living, Functional and Other. In addition, Fiskars reports group-level net sales for three geogra-phies: Europe, Americas, and Asia-Pacific. The Other segment contains Group’s investment portfolio, the real estate unit, corporate headquarters and shared services. Fiskars serves consumers and customers around the world with globally recognized brands including Fiskars, Gerber, Iittala, Royal Copenhagen, Waterford, and Wedgwood
The financial statements are authorized for issue by the Board of Directors of Fiskars Corporation. According to the Finnish Limited Liability Companies’ Act, the shareholders have a possibility to approve or reject or make a decision on altering the financial statements in the Annual General Meeting to be held after the publication of the financial statements.
BASIS OF PREPARATIONThe consolidated financial statements of Fiskars Corpo-ration (“Fiskars” or “the group”) are prepared in accor-dance with International Financial Reporting Standards (IFRS) in force at December 31, 2017 as adopted by the European Union. International Financial Reporting Standards, referred to in the Finnish Accounting Act and in ordinances issued based on the provisions of this Act, are standards and their interpretations adopted in accordance with the procedure laid down in regulation (EC) No 1606/2002 of the European Parliament and of the Council. The notes to the consolidated financial statements also comply with the Finnish accounting and corporate legislation.
The consolidated financial statements are pre-pared on historical cost basis except for financial assets and financial liabilities which are presented at
fair value through profit or loss, and biological assets as well as assets and liabilities related to defined benefit pension plans that are measured at fair value.
Items included in the financial statements of each of the group’s entity are measured using the currency of the primary economic environment in which the entity operates (‘the functional currency’). The consolidated financial statements are presented in euro, which is the parent company’s functional currency. The presentation is in millions of euro with one decimal. Figures presented have been rounded and therefore the sum of individual figures might differ from the presented total figure.
USE OF ESTIMATESThe preparation of financial statements in conformity with IFRS requires the management to make judg-ments and assumptions that affect the recognition and measurement of financial statement items. These estimates and associated assumptions are based on historical experience and other justified assumptions that are believed to be reasonable under the circum-stances at the end of the reporting period. These estimates form the basis for judgments of the items in the financial statements. Development of markets and general economic situation may affect the variables underlying the estimates and actual results may differ significantly from these estimates. Such estimates mainly relate to the assumptions made in• impairment testing (Note 11),• amount of obsolete inventory (Note 16),• recognition of impairment losses
on trade receivables (Note 17),• restructuring provisions (Note 21),• determination of defined benefit
pension obligations (Note 20),• value appraisement of biological
assets (Note 13) and• the probability of deferred tax
assets being recovered against future taxable profits (Note 9).
CONSOLIDATED FINANCIALSTATEMENTS
The consolidated financial statements include the parent company, Fiskars Corporation, and all the subsidiaries in which it holds, directly or indirectly, over 50% of the voting rights or over which it other-wise has control. Acquired or established subsidiaries are included in the consolidated financial statements from the date control commences until the date that control ceases.
Subsidiaries are consolidated using the acquisition method. Intra-group transactions, profit distribution, receivables, liabilities and unrealized gains between group companies are eliminated in consolidation. The profit or loss for the financial year attributable to the owners and non-controlling interest is presented in the income statement and the total comprehensive income for the financial year attributable to the owners and non-controlling interest is presented in the statement of comprehensive income. The non-controlling interest in equity is presented within equity, separately from the equity of the owners of the parent.
Investments in associates in which Fiskars has a significant influence but not control are accounted for using the equity method. Significant influence usually exists when the group holds over 20% of the voting power of the entity or when the group otherwise has significant influence but not control.
TRANSLATION OF FOREIGN CURRENCY ITEMS
Transactions in foreign currenciesForeign currency transactions are translated using the exchange rates prevailing at the dates of the trans-actions. At the end of the reporting period monetary assets and liabilities are translated using the exchange rate prevailing at the end of the reporting period. Exchange differences arising from translation are recognized in the income statement and presented under financial items, except for exchange differences related to trade receivables and trade payables that are presented within operating profit. Non-monetary items denominated in foreign currencies are translated using the exchange rate at the date of the transaction, except for those items carried at fair value that are translated using rates prevailing at the date when the fair value was determined.
Translation of financial statements of foreign subsidiaries
In the consolidated financial statements income statements, statements of comprehensive income and cash flows of foreign subsidiaries are translated
into the parent company’s currency at the average exchange rates for the period. Their balance sheet items are translated at exchange rates prevailing at the end of the reporting period. The resulting exchange differences are recognized in other comprehensive income and presented under translation differences in equity. Exchange differences resulting from the translation of profit or loss and comprehensive income at the average rate in the income statement and in the statement of comprehensive income, and the balance sheet at the closing rate, are recognized in other comprehensive income and they are included under translation differences in equity. The effective portions of the gains or losses on those financial instruments hedging net investments in foreign operations are recognized similarly. When the group disposes of all, or part of that subsidiary, the translation differences accumulated in equity are transferred to profit or loss as part of the gain or loss on disposal.
NET SALES AND REVENUE RECOGNITION PRINCIPLES
Net sales are shown net of indirect taxes, rebates, and exchange differences on trade receivables denom-inated in foreign currencies. Revenue from the sale of goods is recognized when all significant risks and rewards of ownership have been transferred to the buyer, i.e. when a product has been delivered to the cli-ent in accordance with the terms of delivery. Revenue related to the Myiittala loyalty program is allocated between the loyalty program and other components of the sale. The amount allocated to the loyalty program is recognized as revenue when customers use the vouchers or when it is apparent that the vouchers will no longer be redeemed. There are no such long-term projects in the group for which the revenue would be recognized using the percentage-of-completion (POC) method.
OTHER OPERATING INCOME AND EXPENSES
Other operating income includes income other than that associated with the sale of goods or services, such as gain on disposal or sale of fixed assets, rental income, releases of certain provisions and other sim-ilar income not classified to revenue. Other operating expenses as well include losses on the disposal or sale of fixed assets, integration costs and other similar expenses not classified to other cost items.
PENSION OBLIGATIONS Group companies have various pension plans in accordance with local conditions and practices in the countries in which they operate. The plans are clas-

26 Fiskars Group 27Financial Statements 2017
sified as either defined contribution plans or defined benefit plans. Under a defined contribution plan the group pays fixed contributions into a separate entity. If the entity does not hold sufficient assets to pay all employees the benefits in question, the group will have no legal or constructive obligation to pay further contributions. All other plans not meeting the above criteria are classified as defined benefit plans. Most of the plans that group com-panies have are classified as defined contribution plans and related contributions are charged to the income statement in the year in which the payment obligation has arisen.
The costs for defined benefit pension plans are calculated and recognized under the terms of the plan based on actuarial calculations. Pension costs are recognized as expenses over the employees’ service period. The pension obligation is measured as the present value of the estimated future contributions deducted by the fair value of plan assets at the end of the reporting period. Changes in the estimates in the actuarial calculations may influence the reported pension obligations and pension costs. Actuarial gains and losses are recognized in other comprehensive income.
OPERATING PROFITIAS 1 Presentation of Financial Statements does not give a definition for operating profit. In Fiskars the operating profit (EBIT) is the net of revenues and other operating income, material purchases and change of inventories, production for own use, employee benefits, depreciations, amortizations and possible impair-ments and other operating expenses. The operating profit includes operating results of Fiskars’ primary reporting segments Living, Functional and Other. The net change in fair value of investments through profit and loss, consisting of Fiskars’ holdings in Wärt-silä, and change in fair value of biological assets are presented as separate line items below EBIT in the income statement.
INTANGIBLE ASSETSAn intangible asset is initially capitalized in the balance sheet at cost if the cost can be measured reliably and it is probable that the expected future economic benefits that are attributable to the asset will flow to the group. Residual values and expected useful lives are reassessed at least at each financial year-end and, if necessary, are adjusted to reflect changes in the expected future economic benefits. Those bor-rowing costs directly attributable to the acquisition, construction or production of a qualifying asset are capitalized as part of the cost of that asset.
GoodwillGoodwill represents the group’s share of difference between the cost of the acquisition and the fair value of the net identifiable assets, liabilities, and contingent liabilities acquired measured at the acquisition date. Goodwill is stated at historical cost less any accumu-lated impairment losses. Goodwill is not amortized but is tested for impairment at least annually. For this purpose goodwill has been allocated to cash-generating units or, in case of an associate, the goodwill is included within the carrying amount of the associate in question. The recoverable amount of the unit is compared annually or more often if there are indications of impairment, with its carrying amount to determine potential impairment.
Contingent consideration will be measured at fair value and subsequently re-measured through profit or loss. All acquisition-related costs, such as experts’ fees, will be expensed instead of capitalization. There is a choice on an acquisition-by-acquisition basis to measure the non-controlling interest in the acquiree either at fair value or at the non-controlling interest’s proportionate share of the acquiree’s net assets.
Research and development costsResearch and development costs are expensed as they are incurred, except for those development costs that are capitalized if the criteria in IAS 38 are met. Capitalized development costs consisting of mainly direct labor costs and external services are recognized as intangible assets.
Intangible assets not yet available for use are tested annually for impairment. Subsequent to initial recog-nition capitalized development costs are measured at cost less accumulated amortization and accumulated impairment losses. They are amortized on a straight-line basis over their useful lives, from 3 to 6 years.
Other intangible assetsOther intangible assets include among other patents, capitalized development costs, software, as well as trademarks and customer relationships acquired in business combinations. Intangible assets are stated at cost less accumulated amortization and any accu-mulated impairment. Intangible assets in this class are amortized on a straight-line basis over their known or expected useful lives. Residual values and expected useful lives are reassessed at least at each financial year-end and, if necessary, are adjusted to reflect changes in the expected future economic benefits. The estimated useful lives are as follows:
• Software 3–10 years• Customer relationships 5–15 years• Other 3–10 years
Intangible assets with an indefinite useful life such as trademarks or brand names acquired in business combinations are not amortized but they are tested at least annually for impairment.
PROPERTY, PLANT AND EQUIPMENTProperty, plant, and equipment are stated at his-torical cost less accumulated depreciation and any accumulated impairment losses, if applicable. Those borrowing costs directly attributable to the acquisition, construction or production of a qualifying asset are capitalized as part of the cost of that asset.
Depreciation is charged to the income statement on a straight-line basis over the estimated useful lives of the assets. Residual values and expected useful lives are reassessed at least at each financial year-end and, if necessary, are adjusted to reflect changes in the expected future economic benefits. The estimated useful lives are as follows:
• Buildings 20–40 years• Machinery and equipment 3–10 years• Land and water No depreciation
Gains and losses on sales and disposals of items of property, plant, and equipment are presented under other operating income and other operating expenses.
LEASESLeases, in which the group takes over from the lessor substantially all the risks and rewards of ownership, are classified as finance leases. Assets leased under finance leases are recognized under property, plant, and equipment at amounts equal to the fair value of the leased assets or, if lower, the present value of the minimum lease payments at the commencement of the lease term. The associated obligations are recognized in interest-bearing financial liabilities. The lease payments are divided into finance cost and amortization of the lease liability.
Leases in which a significant portion of the risks and rewards of ownership are retained by the lessor are accounted for as operating leases. Lease payments made under an operating lease are recognized as an expense on a straight-line basis over the lease term.
INVESTMENT PROPERTYThe properties that are not used in the group’s oper-ations or which are held to earn rental revenue or increase in value are classified as investment property. These properties are measured at cost less accu-mulated depreciation and impairment. Investment properties are depreciated over 20–40 years. Land is not depreciated.
IMPAIRMENT OF PROPERTY, PLANT AND EQUIPMENT AND INTANGIBLE ASSETS
The group operations have been divided into cash- generating units (CGU) that are similar to the pri-mary reporting segments. The carrying amounts of the assets relating to these CGUs are reviewed for impairment indicators annually at the end of the reporting period. The recoverable amounts of the following assets are also estimated annually irrespec-tive whether there is any indication for impairment: goodwill, intangible assets with indefinite useful lives and unfinished intangible assets.
To determine a potential impairment the carry-ing amount of the asset is compared or the carrying amounts of the CGU’s net assets are compared against the recoverable amount of that asset or CGU. The recoverable amount is the higher of the present value of the future cash flows (value in use) and the fair value less costs to sell. An impairment loss is recognized for an asset when its carrying amount exceeds its recover-able amount. An impairment loss previously recognized for items of property, plant, and equipment as well as for intangible assets other than goodwill is reversed subsequently only if there has been a change in the estimates used to determine the asset’s recoverable amount since the last impairment loss was recognised. An impairment loss is reversed only to the extent that the asset’s carrying amount does not exceed the car-rying amount that would have been determined, net of amortization or depreciation, if no impairment loss had been recognized for the asset in prior years. An impairment loss recognized for goodwill is not reversed.
BIOLOGICAL ASSETSBiological assets consist of standing timber in the group’s forests in Finland. These assets are measured at fair value less estimated point-of-sale costs. The fair value resulting from both net growth and change in the market value of standing timber is presented as a separate line item in the income statement after operating profit (EBIT). The revenue from the sale of standing timber is presented in the income statement within the operating profit.
For valuing biological assets Fiskars applies a three year rolling average price of standing tim-ber, based on the statistics provided by the Natural Resources Institute Finland, and multiplied by the esti-mated volume of standing timber, taking into account the costs and risks relating to sales.
NON-CURRENT ASSETS HELD FOR SALE AND DISCONTINUED OPERATIONS
A non-current asset (or a disposal group) as well as assets and liabilities associated with a discontinued

28 Fiskars Group 29Financial Statements 2017
operation are classified as held for sale if their carrying amount will be recovered principally through a sale transaction rather than through continuing use. The recognition criteria are regarded to be met when a sale is highly probable, the asset (or a disposal group) is available for immediate sale in its present condition subject only to terms that are usual and customary, the management is committed to the plan to sell the asset and the sale is expected to take place within one year from the date of classification.
As from classification date a non-current asset (or a disposal group) held for sale is measured at the lower of its carrying amount and fair value less costs to sell, and it is not depreciated or amortized any more. Assets classified as held for sale, disposal groups, items recognized in other comprehensive income associated with the assets classified as held for sale as well as liabilities included in the disposal group are presented separately in the balance sheet.
A discontinued operation is a component of the group’s business that has been disposed of or will be disposed of in accordance with a coordinated plan. It represents a separate major line of business or geographical area of operations. The profit or loss of a discontinued operation is reported separately from the continuing operations in the consolidated statement of comprehensive income.
INVENTORIESInventories are carried at the lower of cost and net realizable value. Cost is determined using the first-in first-out (FIFO) method. The cost of finished goods and work-in-progress comprise direct purchase and manufacturing cost, other direct costs and a propor-tion of the related production overheads based on normal operating capacity. Net realizable value is the estimated amount that can be realized from the sale in normal course of business less the estimated costs of completion and the estimated costs neces-sary to make the sale. Inventories are presented net of an impairment loss recognized for obsolete and slow-moving inventories.
FINANCIAL INSTRUMENTS
Financial assetsFiskars classifies its financial assets in the following categories: financial assets at fair value through profit or loss, loans and receivables and available-for-sale financial assets. Financial assets are classified at initial recognition based on their purpose of use. For investments not at fair value through profit or loss, the directly attributable transaction costs are included in the original costs of the financial assets.
All purchases or sales of financial assets are recog-nized or derecognized using trade date accounting. The group derecognizes financial assets when it has lost its right to receive the cash flows or when it has transferred substantially all the risks and rewards to an external party.
Financial assets at fair value through profit or loss
In this category are classified such financial assets that are held for trading or are designated as finan-cial assets at fair value through profit or loss upon initial recognition (the fair value option). In Fiskars this category comprises the investments in listed securities and those derivative instruments that do not meet the hedge accounting criteria or for which hedge accounting is not applied.
These financial assets are measured at fair value both at initial recognition and subsequently. The fair values of the listed securities are based on quoted rates at the end of the reporting period and fair value changes, both realized and unrealized gains and losses are recognized in the income statement under financial items. The fair value measurement principles of derivative instruments are described below under Derivatives and hedge accounting.
Loans and other receivablesLoans and other receivables are non-derivative finan-cial assets with fixed or determinable payments that are not quoted in an active market. The group does not hold them for trading or designate them as avail-able for sale upon initial recognition. This category comprises trade receivables and other receivables under current receivables as well as non-current loan receivables that are presented under the item Other investments in the consolidated balance sheet.
Loans and other receivables are measured at amortized cost. The estimate made for doubtful receivables is based on the risks of individual items. Resulting from this assessment the carrying amounts of receivables are adjusted to measure their probable value. Loans and receivables are included in current or non-current assets based on their nature; in the latter class for maturities greater than 12 months after the end of the reporting period.
Available-for-sale financial assetsAvailable-for-sale financial assets are those non-de-rivative financial assets that are designated as avail-able for sale or are not classified as either loans and receivables, held-to-maturity investments or financial assets at fair value through profit or loss. In Fiskars this category comprises the investments in unlisted
securities. If their fair values cannot be determined reliably, they are measured at cost. Available-for-sale financial assets are included in non-current assets unless the group intends to dispose of them within 12 months of the end of the reporting period in which case they are included in current assets.
Cash and cash equivalentsThe balance sheet item Cash and cash equivalents includes cash, i.e. cash in hand and deposits held at call with banks, and cash equivalents. Cash equivalents comprise highly liquid investments that are readily convertible to a known amount of cash and subject to an insignificant risk of changes in value. The items included in cash equivalents have original maturities of maximum three months from the date of acquisition. Bank overdrafts are included within current interest-bearing financial liabilities.
Financial liabilities and borrowing costsFiskars classifies its financial liabilities in the fol-lowing categories: financial liabilities at fair value through profit or loss (includes derivative liabilities) and financial liabilities measured at amortized cost. A financial liability is recognized initially at fair value. For financial liabilities measured at amortized cost, the directly attributable transaction costs are included in the original cost. Subsequently financial liabilities are carried at amortized cost using the effective interest method, except for derivative liabilities that are measured at fair value. Financial liabilities are classified as non-current or current; the latter group comprises all those financial liabilities for which the group does not have an unconditional right to defer settlement of the liability for at least 12 months after the end of the reporting period. The group removes a financial liability (or a part of it) from its balance sheet only when it is extinguished, i.e. when the obligation specified in the contract is discharged or cancelled or expires.
Credit fees related to loan commitments are treated as transaction costs to the extent it is likely that the loans will not be drawn down. Remaining credit fees are amortized over the expected loan term.
Derivatives and hedge accountingDerivatives not designated as hedging instruments are recognized at fair value through profit and loss. Derivatives are initially valued at cost and subsequently at fair value determined at the end of each reporting period. The fair value of derivatives is based on pre-vailing market rates or rates derived from the prevailing market rates at the end of the reporting period. Fair value changes are recognized in financial items.
Fiskars has applied hedge accounting to changes in the fair value of derivatives designated, qualify-ing, and effective as cash flow hedges. The changes are recognized in Other comprehensive income. On balance sheet date, such derivatives consisted of interest derivatives hedging certain loans.
Fair value categoriesHierarchy level 1 includes financial assets that are pub-licly quoted in an active market. This category includes listed shares. Level 2 includes financial assets and liabilities measured using directly observable market inputs. All interest bearing debts and derivatives fall within this category. Level 3 includes financial assets and liabilities measured using non-market observable inputs. The asset classes in this category are unlisted equity investments and funds.
PROVISIONS AND CONTINGENT LIABILITIES
A provision is recognized when the group as a result of a past event has a present legal or constructive obligation, it is probable that the obligation will be realized and a reliable estimate can be made of the amount of the obligation. A provision for restructur-ing is recognized when a detailed formal plan has been prepared and when there is a valid expectation relating those affected that the plan will be carried out. The amount recognized as a provision is the best estimate of the expenditure required to settle the present obligation at the end of the reporting period. If it is possible to receive compensation for part of the obligation from a third party, the compensation is recognized as a separate asset, but only when receipt of the compensation is virtually certain.
The group may be a party to lawsuits and legal processes concerning the group’s business opera-tions. A related provision is recognized in the financial statements when the amount of the expenditure can be estimated reliably and it is more likely than not that they will be realized. Otherwise these contingent liabilities are disclosed in the notes.
INCOME TAXESThe group’s tax expense comprises current tax based on group companies’ taxable profit for the period and the change of deferred taxes. The current tax charge is calculated using the tax rate enacted or substantively enacted at the end of the reporting period. Deferred tax liabilities or deferred tax assets are provided for temporary differences between the carrying amounts of assets and liabilities for finan-cial reporting purposes and the amounts used for taxation purposes using tax rates enacted or sub-

30 Fiskars Group 31Financial Statements 2017
stantively enacted at the end of the reporting period. Temporary differences arise, inter alia, from tax loss carry-forwards, depreciation differences, provisions, defined benefit pension plans, fair value measurement of derivative financial instruments, biological assets, and eliminated intra-group inventory margins as well as from the fair value adjustments made to assets and liabilities in business combinations. A deferred tax liability is recognized on the undistributed prof-its of subsidiaries and associates if the distribution of profit is probable and it will result in tax conse-quences. A deferred tax liability is recorded to its full amount and a deferred tax asset is recognized at the amount of the estimated probable tax benefit. Income tax is recognized in profit or loss, unless it relates to items recognized in other comprehensive income. In such case any related tax effects are also recognized similarly.
DIVIDENDSDividends proposed by the Board of Directors are not recorded in the financial statements until they have been approved by the shareholders at the Annual General Meeting.
NEW AND AMENDED STANDARDS APPLIED IN FINANCIAL YEAR ENDED
As from January 1, 2017 the group has applied the following new or amended standards that have come into effect:• Amendments to IAS 7: Disclosure Initiative
(effective for financial years beginning on or after January 1, 2017). The amendment comes with the objective that entities shall provide disclosures that enable users of financial statements to evaluate changes in liabilities arising from financing activities. The amendments are estimated not to have any impact on the consolidated financial statements but will increase cash flow information to be provided.
• Amendments to IAS 12: Recognition of Deferred Tax Assets for Unrealised Losses (effective for financial years beginning on or after January 1, 2017). The amendments clarify that unrealized losses on debt instruments measured at fair value in the financial statements but a cost for tax purposes can give rise to deductible temporary differences. The amendments are estimated not to have a material impact on the consolidated financial statements.
Other new or amended standards or interpretations had no impact on the consolidated financial state-ments.
• IFRS 9 Financial Instruments and subsequent amendments (effective for financial years beginning on or after January 1, 2018). The Standard includes requirements for recognition and measurement, impairment, derecognition and general hedge accounting and replaces current IAS 39. The impairment model in IFRS 9 is based on the premise of providing for expected losses.
During Q4 2017, Fiskars has finalized an impact analysis and summarized impacts of the standard. Action has also been taken to implement the standard and supporting documentation has been prepared before the standard effective date. Fiskars will start reporting according to IFRS 9 during Q1 2018. No restatement of prior periods is required by the new standard. The new standard will primarily cause changes in the accounting principles of financial items and the evaluation of their impairment according to the new expected credit loss model (ECL).
It enables to book the change in fair value of investments at fair value either in income statement or in other comprehensive income, and from these two options, Fiskars has chosen to start applying reporting the change in fair value of investments at fair value in other comprehensive income. This change will transfer the change in fair value of such investments from the income statement to other comprehensive income including deferred taxes. The change will not impact the treatment of those items’ balance sheet classification or dividends in the income statement. In case Fiskars would already have applied this OCI treatment to investments at fair value in 2017, the profit for the period would have been EUR 86 million smaller and total comprehensive income for the period would have remained the same.
In addition, Fiskars has observed that there will be moderate impacts on the bad debt provisions of trade receivables because of the expected credit loss model introduced by standard. Fiskars has finalized the impact assessment of the standard during the fourth quarter and the implementation of the new ECL model will lead to EUR 1 million increase in bad debt provisions, which will initially be recognised through retained earnings. Fiskars has designed an ECL model where the largest customers globally, representing a significant portion of trade receivables, are aggregated and separately valued with credit rating data and the rest are valued with an average rating data. For aging receivables, the percentages are rising based
on best estimates regarding the increased risk of expected credit loss and for the receivables over 180 days past due, 100% are written off.
• IFRS 16 Leases (effective for financial years beginning on or after January 1, 2019). According to the current Leases standard, IAS17, a lessee has to separate leases into finance lease agreements booked on the balance sheet and operating lease agreements classified as off-balance sheet items. According to the forthcoming standard IFRS16, all of the lessees lease agreements will be booked as fixed assets in the balance sheet, except for short-term contracts under 12 months and immaterial contracts. The new standard transfers off-balance sheet commitments to the balance sheet, which results in an increase of fixed assets and liabilities and moves former lease expenses to Depreciation and Interest expenses. The amount of commitments was EUR 96 million on 31st December 2017. Agreements treated as commitments however differ from the lease agreements determined by IFRS16 and thus the amount of agreements that will be booked on balance sheet can differ from these commitments.
Based on Fiskars’ industry and business model, it acts mostly as lessee in numerous contracts. Major part of the contracts that will be booked on balance sheet consist of the lease contracts of stores, offices and warehouses as well as some machinery and equipment. Fiskars has continued with standard workshops and impact analysis during the fourth quarter and will launch a more specified assessment of standard impacts during the first quarter of 2018, as it has been observed that the variety of contracts in the scope of the standard is comprehensive. Fiskars expects that there will be an impact on both accounting principles and reported figures. This change will also impact financial indicators which are based on the balance sheet, such as gearing. Fiskars is planning to use Cumulative Catch-up as its transition method to IFRS 16.
• Amendments to IFRS 4: Applying IFRS 9 Financial Instruments with IFRS 4 Insurance Contracts (effective for financial years beginning on or after January 1, 2018). The amendment provides two optional solutions for applying IFRS 9 Financial Instruments with IFRS 4 Insurance Contracts. The amendments are estimated not to have any impact on the consolidated financial statements.
ADOPTION OF NEW AND AMENDED STANDARDS AND INTERPRETATIONS APPLICABLE IN FUTURE FINANCIAL YEARS
Fiskars has not yet adopted the following new and amended standards and interpretations already issued by the IASB. The group will adopt them as of the effective date or, if the date is other than the first day of the financial year, from the beginning of the subsequent financial year.
These new or amended standards have been endorsed for use by the European Union:• IFRS 15 Revenue from Contracts with Customers
including amendments (effective for financial years beginning on or after January 1, 2018). The standard introduces a five-step model for recognizing revenue. Based on IFRS15 standard, revenues are allocated in an amount that reflects the consideration to which the entity expects to be entitled in exchange for those separately identified goods or services. Recognizing revenue occurs as time passes or at a given moment and the key criterion is the transfer of control. Fiskars has finalized the impact evaluation and summarized results of the standard, has taken necessary actions for standard implementation and prepared needed documentation before standard effective date. Fiskars will start reporting according to IFRS15 during Q1 2018. Fiskars and its external advisors have observed that the standard causes smaller changes in the accounting principles of certain items that could occur in the future, but changes compared to current reported figures are not identified. Major revenue types and their related items are either similarly treated according to the new standard or the changes do not affect in a way that would change Fiskars’ current reported figures. It has been observed that the standard could change consignment arrangement treatment, free of charge items allocation on stand-alone selling prices and timing of recognizing license and royalty income if major changes in underlying business or its volume would occur. It was settled that the new standard does not bring any material expected changes in recognizing license and royalty income, services purchased from customers where distinct services are expected to be separately recognized as selling costs based on fair value of the service or in service-type warranties in circumstances where extra warranties or long guarantee periods are provided by Fiskars.

32 Fiskars Group 33Financial Statements 2017
These new or amended standards have not been endorsed for use by the European Union yet:• IFRIC 22 Foreign Currency Transactions and
Advance Consideration (effective for financial years beginning on or after January 1, 2018). The interpretation clarifies the accounting for transactions that include the receipt or payment of advance consideration in a foreign currency. Fiskars expects the interpretation to cause changes in the accounting principles, but material changes in reported figures are not expected. The group is currently further evaluating the effects of the interpretation.
• IFRIC 23 Uncertainty over Income Tax Treatments (effective for financial years beginning on or after January 1, 2019). Interpretation clari fies how to apply the recognition and measurement requirements in IAS 12 when there is uncertainty over income tax treatments. In such a circums-tance, an entity shall recognise and measure its current or deferred tax asset or liability applying the requirements in IAS 12 based on taxable profit (tax loss), tax bases, unused tax losses, unused tax credits and tax rates determined applying this Interpretation. Fiskars expects the interpretation to cause changes in the accounting principles, but material changes in reported figures are not expected. The group is currently further evaluating the effects of the interpretation.
• Annual Improvements to IFRS Standards 2014–2016 Cycle (effective for financial years beginning on or after January 1, 2018). The annual improvements process provides a mechanism for minor and non-urgent amendments to IFRSs to be grouped together and issued in one package annually. Their impacts vary standard by standard but are not significant.
• Annual Improvements to IFRS Standards 2015–2017 Cycle (effective for financial years beginning on or after January 1, 2019). The annual improvements process provides a mechanism for minor and non-urgent amendments to IFRSs to be grouped together and issued in one package annually. Their impacts vary standard by standard but are not significant.
• Amendments to IFRS 2: Classification and Measurement of Share-based Payment Trans-actions (effective for financial years be ginning on or after January 1, 2018). The amendments are intended to eliminate diversity in three main areas: the effects of vesting conditions on the measurement of a cash-settled share based payment transaction, the classification of a share-based payment transaction with net settlement
REPORTING BY OPERATING SEGMENT2017
EUR MILLION LIVING FUNCTIONAL OTHERGROUP
TOTAL
Net sales 573.9 607.8 3.8 1,185.5
EBITA excl. Items affecting comparability in operating profit 70.7 59.7 -11.5 119.0
Items affecting comparability in EBITA* -2.6 -1.2 -2.0 -5.8
EBITA 68.1 58.5 -13.4 113.2
Amortization -15.3
Change in fair value of biological assets 0.7 0.7
Financial income and expenses 122.0 119.3
Profit before taxes 217.8
Income taxes -50.8
Profit for the period 167.1
Capital expenditure 14.0 19.4 2.0 35.4
Depreciations, amortizations and impairment 21.3 16.5 1.0 38.8
* Fiskars Group has discontinued following adjusted EBIT and begun following comparable EBITA which is EBITA excl. items affect-ing comparability in EBITA. Please see the bridge calculation in more details on note 3. Includes EUR 1.2 million related to sale of boats business, EUR 0.7 million costs related to the divestment of the Ebertsankey container gardening business and EUR 5.7 million related to Alignment Program as well as some other adjustments.
2. Segment information Business activities between the segments are not significant. Inter-segment sales are made on an arm’s length basis. The real estate unit owns real estates in Finland and leases them to subsidiaries in Finland e.g. for use as production facilities.
President and CEO monitors the operating results of the segments separately for the purpose of making decisions. Financial income and costs and income taxes are managed on group basis and accordingly not allocated to operating segments. Compared to the segment information from 2016, assets and liabilities as total figures are not followed by the new segments.
Fiskars reports net sales for three geographical areas: Europe, Americas, and Asia-Pacific. In the Americas the Fiskars branded products’ distribution and logistics are managed and consumer preferences followed centrally. In the Europe and Asia-Pacific the markets and distribution are more diversified, but from the customer point of view the business units operate in a common environment.
UNALLOCATED ITEMSThe unallocated items of the Income Statement contain amortization, financial income and expenses, other than Wärtsilä related, and income taxes.
No single customer of Fiskars accounts for more than 10% share of the Group’s total net sales.
Fiskars’ organizational structure features two Stra-tegic Business Units (SBU): Living and Functional. As of January 1, 2017 Fiskars Group’s three primary reporting segments are Living, Functional, and Other. In addition, Fiskars reports net sales for three geo-graphical areas: Europe, Americas, and Asia-Pacific.
OPERATING SEGMENTSSBU Living offers premium and luxury products for tabletop, giftware and interior décor. It consists of the English & Crystal Living and Scandinavian Living businesses. English & Crystal Living business includes brands such as Waterford, Wedgwood, Royal Albert, and Royal Doulton. Scandinavian Living business includes brands such as Iittala, Royal Copenhagen, Rörstrand, and Arabia.
SBU Functional provides tools for use in and around the house as well as outdoors. SBU Functional consists of Functional Americas, Functional EMEA and Outdoor businesses, and includes brands such as Fiskars, Gerber, and Gilmour.
The Other segment contains the Group’s invest-ment portfolio, the real estate unit, corporate head-quarters and shared services.
features for withholding tax obligations and the accounting where a modification to the terms and conditions of a share-based payment transaction changes its classification from cash-settled to equity-settled. Fiskars expects the amendment to cause changes in the accounting principles, but material changes in reported figures are not expected. The group is currently further evaluating the effects of the amendment.
• Amendments to IAS 40: Transfers of Investment Property (effective for financial years beginning on or after January 1, 2018). The amendments relate to entities going to transfer a property to, or from, investment property when, and only when, there is evidence of a change in use. A change of use occurs if property meets, or ceases to meet, the definition of investment property. A change in management’s intentions for the use of a property by itself does not constitute evidence of a change in use. Fiskars expects the amendment to cause changes in the accounting principles, but material changes in reported figures are not expected. The group is currently further evaluating the effects of the amendment.
• Amendments to IFRS 9: Prepayment Features with Negative Compensation (effective for financial years beginning on or after January 1, 2019). The amendment covers two issues: What financial assets may be measured at amortised cost and how to account for the modification of a financial liability. Fiskars expects the amendment to cause changes in the accounting principles, but material changes in reported figures are not expected. The group is currently further evaluating the effects of the amendment.
• Amendments to IAS 28: Long-term Interests in Associates and Joint Ventures (effective for financial years beginning on or after January 1, 2019). The amendments relate to clarifications as an entity applies IFRS 9 including its impairment requirements, to long-term interests in an associate or joint venture that form part of the net investment in the associate or joint venture but to which the equity method is not applied. Fiskars expects the amendment to cause changes in the accounting principles, but material changes in reported figures are not expected. The group is currently further evaluating the effects of the amendment.
Other new or amended standards or interpretations are not expected to impact the consolidated financial statements.

34 Fiskars Group 35Financial Statements 2017
NET SALES BY GEOGRAPHY
ADDITIONAL INFORMATION ABOUT GEOGRAPHICAL AREAS
EUR MILLION 2017 2016
Europe 568.5 555.3
Americas 463.0 489.9
Asia-Pacific 152.8 153.3
Unallocated* 1.2 6.2
Total 1,185.5 1,204.6
EUR MILLION 2017 2016*
Net sales in Finland 112.5 102.6
Net sales in the U.S. 445.1 482.0
Net sales from other countries 628.0 620.0
Total 1,185.5 1.204.6
EUR MILLION 2017 2016
Operating profit (EBIT) 97.9 82.7
Amortization -15.3 -14.0
EBITA 113.2 96.7
Items affecting comparability in EBITA
Supply Chain 2017 program 0.0 -4.7
Sale of boats business 1.2 3.8
Ebertsankey related provisions and impairments -0.7 -4.4
Sale of Spring USA 0.0 6.0
Sale of container gardening business and related goodwill impairment 2.1
Alignment program -5.7 -14.5
Other items affecting comparability in operating profit -0.6 1.4
Total items affecting comparability in EBITA -5.8 -10.4
Comparable EBITA 119.0 107.1
EUR MILLION 2017 2016
Assets in Finland* 213.1 209.1
Assets in the U.S.* 122.6 139.7
Assets in other countries* 396.9 412.7
Total 732.7 761.6
Fiskars reports group-level net sales for three geographical reporting segments: Europe, Americas and Asia-Pacific.
3. Alternative performance measures
savings of EUR 8 million have been achieved, the majority already in 2017.
ALIGNMENT PROGRAMIn November 2016, Fiskars launched the Alignment program to proceed in the transformation. The program focused on the structural changes in the organiza-tion, proposed headcount reductions, and the full integration of the English & Crystal Living business, acquired in 2015. The net headcount reduction was estimated to be 130 positions globally.
The total costs of the program were estimated to be approximately EUR 15 million in 2016–2017. They were recorded as items affecting compara-bility in EBITA, of which EUR 14.1 million had been recorded by the end of the fourth quarter of 2017. The targeted annual cost savings were approximately EUR 14 million.
The majority of the program activities were com-pleted by the end of 2017. The rest of the changes will be finalized during 2018, however the remaining costs are not expected to be material. The targeted annual cost savings of EUR 14 million have been achieved, the majority already in 2017.
OTHER ITEMS AFFECTING COMPARABILITY IN EBITA IN 2017
Alignment program costs in 2017 amounted to EUR -5.7 million, sale of the boats business amounted to EUR 1.2 million and Ebertsankey related provisions and impairments EUR -0.7 million. Other items affect-ing comparability in operating profit totalled EUR -0.6 million in 2017.
REPORTING BY OPERATING SEGMENT2016
EUR MILLION LIVING FUNCTIONAL OTHERGROUP
TOTAL
Net sales 598.1 602.7 3.8 1,204.6
EBITA excl. Items affecting comparability in EBITA 59.4 57.1 -9.5 107.1
Items affecting comparability in EBITA* -1.7 -11.4 2.8 -10.4
EBITA 57.7 45.7 -6.7 96.7
Amortization -14.0
Change in fair value of biological assets -0.5 -0.5
Other financial income and expenses 18.9 10.5
Profit before taxes 92.8
Income taxes -27.4
Profit for the period 65.4
Capital expenditure 14.9 21.8 0.9 37.6
Depreciations, amortizations and impairment 20.9 15.4 1.2 37.4
* Fiskars Group has discontinued following adjusted EBIT and begun following comparable EBITA which is EBITA excl.items affecting comparability in EBITA. Please see the bridge calculation in more details on note 3. Includes EUR 6.0 million relating to sale of Spring USA, EUR 3.8 million related to sale of boats business, EUR 2.1 million related to container gardening business, EUR -4.4 million pro-visions and impairments related to the divestment of the Ebertsankey container gardening business, EUR -4.7 million related to the Supply Chain 2017 program and EUR -14.5 million related to the Alignment program and other minor adjustments.
* Geographically unallocated exchange rate differences.
* Non-current assets other than deferred tax assets based on asset locations.
* 2016 geographical allocation has been revised.
EBITA = Operating profit + amortization + impairmentAdditionally, Fiskars has presented an Alternative Performance Measure of Operative EPS.Operative EPS = Earnings per Share excluding net change in the fair value of the investment portfolio and dividends received.
Exceptional and material transactions outside the ordi-nary course of business are treated as items affecting comparability in EBITA. These include items such as gains and losses on disposal of business operations, impairments, costs of discontinued significant business operations, restructuring costs and costs of integrating acquired businesses, major product recalls and fines and penalties. Gains and losses are presented in the income statement as an income or expense on the relevant line item and function. Impairments have been presented in the income statement in depreciation, amortization and impairment of the relevant function or on line impairment when the impairment concerns goodwill. Write-downs are presented in other operating expenses.
SUPPLY CHAIN 2017 PROGRAMDuring the third quarter of 2015, Fiskars announced a restructuring program to optimize its global supply chain network in Europe and Asia. The Supply Chain 2017 program aimed to improve the competitiveness of Fiskars’ manufacturing operations and distribution network. The total costs of the program were estimated to be approximately EUR 20 million between 2015 and 2017, reported as items affecting comparabil-ity in EBITA. The targeted annual cost savings were approximately EUR 8 million.
The program was completed by the end of 2017. The total costs of the program were EUR 11.2 million, below the original estimate. The targeted annual cost

36 Fiskars Group 37Financial Statements 2017
5. Other operating income
6. Total expenses
FEES PAID TO COMPANIES’ AUDITORS
TOTAL EXPENSES BY NATURE
DEPRECIATION, AMORTIZATION AND IMPAIRMENT BY ASSET CATEGORY
OTHER OPERATING EXPENSES
EUR MILLION 2017 2016
Divestment of business 12.7
Release of provision related to rented facilities 1.2 2.4
Net gain on disposal of fixed assets 3.9 0.9
Rental income 0.3 0.3
Other income 1.7 2.3
Total 7.1 18.5
EUR MILLION 2017 2016
Audit fees 1.2 1.3
Audit related fees 0.0 0.0
Tax consultation 0.9 0.8
Other non-audit fees 0.2 0.3
Total 2.2 2.5
EUR MILLION 2017 2016
Materials and supplies 542.7 573.2
Change in inventory 5.2 0.7
External services 52.6 54.6
Employee benefits 315.3 337.1
Depreciation and amortization 38.8 37.4
Impairment 0.0 0.0
Other costs 140.1 137.4
Total 1,094.8 1 140.5
EUR MILLION 2017 2016
Loss on sale of fixed assets 0.4 0.4
Loss on scrap of fixed assets 0.5 2.5
Alignment program 0.1 1.7
Other costs 1.5 2.8
Total 2.5 7.4
EUR MILLION 2017 2016
Buildings 4.2 4.8
Machinery and equipment 19.3 18.4
Intangible assets 14.9 13.9
Investment property 0.4 0.4
Total 38.8 37.4
The appointed auditor for the financial years 2017 and 2016 was KPMG. KPMG Oy Ab has provided non-audit services to the entities of Fiskars Group in total of EUR 0.8 million during the financial year 2017.
EMPLOYEE BENEFITS
EUR MILLION 2017 2016
Wages and salaries 256.2 267.7
Other compulsory personnel costs 36.3 40.8
Pension costs, defined contribution plans 17.3 18.2
Pension costs, defined benefit plans 1.0 1.2
Other post employment benefits 1.6 1.7
Termination benefits 2.9 7.6
Total 315.3 337.1
7. Employee benefits and number of personnel
4. Acquisitions and divestments
included the container gardening brand American Designer Pottery and related manufacturing and dis-tribution facilities in Florida, U.S. The sale generated a positive effect on cash flow, however it did not have a significant impact on Fiskars Corporation’s financial position or result during 2016.
DIVESTMENT OF TWO BUSINESSESIn September 2016, Fiskars entered into an agreement to divest its European Ebertsankey container gar-dening business to Good(s) Factory BV, a member of the Elho Group, European market leader in synthetic pottery and related products. In addition, Fiskars sold Spring USA, the U.S.-based provider of foodservice equipment, to an affiliate of ShoreView Industries.
The divestment of Spring USA generated a positive effect on cash flow during the third quarter of 2016. The divestment of Ebertsankey was completed during the Q4 2016. The divestments did not have a significant impact on Fiskars Corporation’s financial position or results during 2016.
2017No acquisitions or divestments were carried out in 2017.
2016
DIVESTMENT OF THE BOATS BUSINESSOn January 4, 2016, Fiskars Corporation completed the sale of its boats business to Yamaha Motor Europe N.V., announced on November 11, 2015. The sale included shares in Inha Works Ltd. as well as the Buster brand and related factory real estate in Ähtäri, Finland. The sale generated a positive effect on cash flow. However, it did not have a significant impact on Fiskars Corporation’s financial position or result during 2016.
DIVESTMENT OF THE CONTAINER GARDENING BUSINESS IN THE U.S.
On January 22, 2016, Fiskars sold its container garden-ing business in the U.S. to Bloem, LLC. The transaction

38 Fiskars Group 39Financial Statements 2017
EUR MILLION 2017 2016
Dividends received from investments at fair value through profit and loss 14.1 13.1
Interest income on cash and bank 0.0 0.0
Net change in fair value of current investments at fair value through profit or loss 107.9 6.1
Net change in fair value of other investments at fair value through profit or loss 2.1 0.0
Derivative revaluation gains, at fair value through profit or loss 0.0 0.8
Exchange gains on commercial hedges 0.9 0.8
Other exchange gains 0.0 0.0
Financial income total 125.1 20.8
Interest expenses on debt at amortized cost -5.0 -6.8
Interest cost on finance leasing at amortized cost 0.0 -0.1
Net change in fair value of other investments at fair value through profit or loss 0.0 -1.1
Exchange losses on commercial hedges 0.0 0.0
Other exchange losses -0.3 -1.3
Other financial expenses -0.4 -0.9
Financial expense total -5.7 -10.3
Financial income and expenses total 119.3 10.6
8. Financial income and expenses
INCOME TAXES IN THE INCOME STATEMENT
EUR MILLION 2017 2016
Current year income taxes -31.6 -22.1
Prior year income taxes 1.1 5.6
Change in deferred taxes -20.3 -10.9
Income taxes total -50.8 -27.4
9. Income taxes
In July 2016, Fiskars received a tax reassessment decision from the Finnish Large Taxpayers’ Office, which obliged the company to pay a total of EUR 28.3 million in additional tax, interest expenses and punitive tax increases as a result of a tax audit carried out in 2014. Fiskars and its external advisors consider the decision unfounded and did not recognize the related taxes and other costs in the income statement in 2016. An appeal against the reassessment decision is pending at the Board of Adjustment in the Finnish Large Taxpayers’ Office.
RECONCILIATION OF INCOME TAXES
TAXES IN OTHER COMPREHENSIVE INCOME2017
2016
EUR MILLION 2017 2016
Tax rate for the parent company 20.0% 20.0%
Profit before taxes 217.8 92.8
Income tax using the tax rate for the parent company -43.6 -18.6
Effect of tax rates in foreign jurisdictions -4.5 -7.2
Prior year income taxes 1.1 5.6
Tax exempt income 3.3 7.7
Non-deductible expenses -1.3 -1.3
Effect of change of tax rates -4.4 -1.6
Tax recognized against unrecognized tax assets and unrecognized tax on loss -3.9 -4.6
Change in valuation of tax assets 4.0 -1.8
Other items -1.4 -5.6
Income taxes recognized in profit and loss -50.8 -27.4
EUR MILLION TOTAL TAX NET
Translation differences -27.9 -27.9
Cash flow hedges 0.8 -0.2 0.6
Defined benefit plan actuarial gains (losses) 0.5 -0.3 0.2
Other comprehensive income for the period, total -26.7 -0.5 -27.1
EUR MILLION TOTAL TAX NET
Translation differences 25.1 25.1
Cash flow hedges -0.3 0.1 -0.3
Defined benefit plan actuarial gains (losses) -0.3 0.0 -0.3
Other comprehensive income for the period, total 24.4 0.1 24.5
PERSONNEL AT THE END OF PERIOD
PERSONNEL (FTE) IN AVERAGE
2017 2016
Finland 1,126 1,224
Slovenia 918 903
UK 585 654
Other Europe 1,410 1,488
USA 1,018 1,127
Indonesia 1,074 1,152
Thailand 619 566
Other 1,182 1,446
Total 7,932 8,560
2017 2016
Direct 5,008 5,215
Indirect 2,702 2,785
Total 7,709 8,000
Fiskars has adopted the following definitions for employee reporting:Personnel, end of period = active employees in payroll at the end of periodPersonnel (FTE), average = full-time equivalent number of employees according to worked volume during the periodDirect = production staffIndirect = other employees than production staff

40 Fiskars Group 41Financial Statements 2017
DEFERRED INCOME TAXES IN THE BALANCE SHEET, 2017 DEFERRED INCOME TAXES IN THE BALANCE SHEET, 2016
*Consist mainly of adjustments to fair value in acquisitions. *Consist mainly of adjustments to fair value in acquisitions.
DEFERRED TAX ASSETS
DEFERRED TAX ASSETS
DEFERRED TAX LIABILITIES DEFERRED TAX LIABILITIES
EUR MILLIONJAN 1,
2017
RECOGNIZED IN
INCOME STATEMENT
RECOGNIZED IN OTHER
COMPREHEN-SIVE INCOME
TRANSFERS AND
TRANSLATION DIFFERENCES
ACQUISITIONS AND
DIVESTMENTSDEC 31,
2017
Post-employment benefit 4.7 -0.4 -0.1 -0.4 3.8
Provisions and accruals 18.7 -4.8 -1.1 12.8
Effects on consolidation and eliminations 17.1 -0.5 -0.7 15.9
Property, plant & equipment 3.6 -0.3 -0.5 2.7
Tax losses and credits carried forward net of valuation allowance 10.7 3.9 0.4 15.0
Other temporary differences -0.2 1.1 -0.2 -0.1 0.6
Total deferred tax assets 54.5 -0.9 -0.3 -2.4 50.9
Offset against deferred tax liabilities -24.3 2.2 -0.0 0.5 -21.6
Net deferred tax assets 30.2 1.2 -0.3 -1.9 29.2
EUR MILLIONJAN 1,
2016
RECOGNIZED IN
INCOME STATEMENT
RECOGNIZED IN OTHER
COMPREHEN-SIVE INCOME
TRANSFERS AND
TRANSLATION DIFFERENCES
ACQUISITIONS AND
DIVESTMENTSDEC 31,
2016
Post-employment benefit 3.9 -0.1 0.0 0.8 -0.0 4.7
Provisions and accruals 34.7 -9.8 -6.0 -0.2 18.7
Effects on consolidation and eliminations 17.4 -3.1 2.8 17.1
Property, plant & equipment 3.6 0.6 -0.6 -0.1 3.6
Tax losses and credits carried forward net of valuation allowance 9.0 -1.4 3.2 -0.1 10.7
Other temporary differences 1.3 -1.1 0.1 -0.6 -0.2
Total deferred tax assets 70.0 -14.9 0.1 -0.4 -0.4 54.5
Offset against deferred tax liabilities -32.3 5.5 2.4 -24.3
Net deferred tax assets 37.7 -9.4 0.1 2.1 -0.4 30.2
EUR MILLIONJAN 1,
2017
RECOGNIZED IN
INCOME STATEMENT
RECOGNIZED IN OTHER
COMPREHEN-SIVE INCOME
TRANSFERS AND
TRANSLATION DIFFERENCES
ACQUISITIONS AND
DIVESTMENTSDEC 31,
2017
Property, plant & equipment 9.6 -1.6 -0.8 7.2
Fair value adjustments 15.5 21.6 37.1
Effects on consolidation and eliminations* 43.6 -0.4 -0.4 42.9
Other temporary differences 8.3 -0.3 0.0 -0.4 7.6
Total deferred tax liabilities 77.0 19.3 0.0 -1.5 94.8
Offset against deferred tax assets -24.3 2.2 -0.0 0.5 -21.6
Net deferred tax liabilities 52.7 21.5 0.0 -1.0 73.2
Deferred tax assets (+)/ liabilities (-), net -22.5 -43.9
EUR MILLIONJAN 1,
2016
RECOGNIZED IN
INCOME STATEMENT
RECOGNIZED IN OTHER
COMPREHEN-SIVE INCOME
TRANSFERS AND
TRANSLATION DIFFERENCES
ACQUISITIONS AND
DIVESTMENTSDEC 31,
2016
Property, plant & equipment 12.9 -2.6 -0.6 9.6
Fair value adjustments 14.8 0.7 0.0 15.5
Effects on consolidation and eliminations* 32.7 -2.2 13.2 43.6
Other temporary differences* 21.8 0.2 -13.8 -0.0 8.3
Total deferred tax liabilities 82.2 -4.0 -1.2 -0.0 77.0
Offset against deferred tax assets -32.3 5.5 2.4 -24.3
Net deferred tax liabilities 50.0 1.5 1.2 -0.0 52.7
Deferred tax assets (+) / liabilities (-), net -12.2 -22.5
Deferred tax assets and liabilities are offset when there is a legally enforceable right to offset current tax assets against current tax liabilities and when the deferred taxes relate to the same fiscal authority. The Group has full control of the timing of dividend distribution in subsidiaries and therefore no deferred tax liability has been recorded on retained earnings of subsidiaries.
Taxes relating to cash flow hedges and actuarial gains and losses have been recorded into other com-prehensive income.
The deferred tax asset on tax losses carried for-ward, net of valuation allowance, amounted to EUR 15.0 million (10.7) at the end of the financial year. Deferred tax allowance is recorded to offset deferred tax assets in order to recognize the deferred tax assets only to the extent that it is probable that future taxable profits will be available. The tax losses carried forward on the basis of which the deferred tax asset is recognized will not expire in the following five years. Income taxes recorded in the income statement and in other com-prehensive income are specified earlier in this note 9.

42 Fiskars Group 43Financial Statements 2017
10. Earnings per shareThe basic earnings per share is the annual net profit attributable to ordinary shareholders of the parent company divided by the weighted average number of shares outstanding during the year. Fiskars Corporation
2017 2016
Net profit attributable to the ordinary shareholders of the parent company, EUR million 166.4 64.1
Number of shares 81,905,242 81,905,242
Weighted average number of shares outstanding 81,713,775 81,825,369
Earnings per share, EUR (basic and diluted) 2.04 0.78
does not have any current share option programs or other diluting financial instruments, so the diluted earnings per share is the same as basic.
11. Intangible assets2017
EUR MILLION GOODWILL
TRADEMARKS,PATENTS AND
DOMAIN NAMES SOFTWARE
OTHERINTANGIBLE
ASSETS
CONSTRUC- TION IN
PROGRESS TOTAL
Historical cost, Jan 1 236.2 249.9 68.6 64.9 9.7 629.2
Translation differences -8.5 -6.9 -3.6 -3.2 -0.0 -22.3
Additions 0.5 2.8 0.1 3.5 6.9
Decreases 0.0 -0.6 -0.2 -0.0 -0.8
Transfers between asset groups 9.2 0.0 -9.2 0.0
Historical cost, Dec 31 227.7 243.5 76.4 61.5 4.0 613.0
Accumulated amortization and impairment, Jan 1 6.5 4.4 49.6 42.8 0.0 103.3
Translation differences -0.8 0.2 -3.6 -0.7 -4.8
Amortization for the period 0.7 11.4 1.5 13.6
Impairment for the period 0.0 0.0
Decreases 0.0 -0.1 -0.3 -0.5
Accumulated amortization and impairment, Dec 31 5.7 5.3 57.3 43.3 111.5
Net book value, Dec 31 221.9 238.2 19.1 18.3 4.0 501.5
Investment commitments for intangible assets 2.5
EUR MILLION GOODWILL
TRADEMARKS,PATENTS AND
DOMAIN NAMES SOFTWARE
OTHERINTANGIBLE
ASSETS
CONSTRUC- TION IN
PROGRESS TOTAL
Historical cost, Jan 1 244.5 247.6 62.0 74.7 10.9 639.6
Translation differences -2.4 1.8 -0.7 -0.4 -0.0 -1.7
Acquisitions and divestments -5.8 0.0 -5.9
Additions 0.5 3.8 0.1 1.8 6.3
Decreases 0.0 -0.0 -9.5 -9.6
Transfers between asset groups 3.5 0.0 -3.1 0.4
Historical cost, Dec 31 236.2 249.9 68.6 64.9 9.7 629.2
Accumulated amortization and impairment, Jan 1 7.1 4.1 38.5 49.2 99.0
Translation differences -0.6 -0.1 0.1 0.1 -0.4
Acquisitions and divestments 0.0 0.0 0.0
Amortization for the period 0.3 10.7 2.9 13.9
Decreases 0.0 0.0 -9.5 -9.5
Transfers between asset groups 0.3 0.3
Accumulated amortization and impairment, Dec 31 6.5 4.4 49.6 42.8 103.3
Net book value, Dec 31 229.7 245.5 19.0 22.1 9.7 526.0
Investment commitments for intangible assets 0.0
2016
IMPAIRMENT TESTS
EUR MILLION 2017 2016
Living 216.8 224.6
Functional 5.1 5.1
Total 221.9 229.7
On the basis of the impairment calculations made, there has been no need for other impairment of good-will for any CGU for the period ended December 31, 2017 and 2016.
Fiskars has 10 trademarks whose aggregate car-rying amount is EUR 217.3 million (2016: 231.1). Since the benefits from trademarks are indefinite, they are not amortized but are tested at least annually for impairment using a relief from royalty method. An exception for this principle is trademark Hackman for which amortization has begun during 2017. Cash flows attributable to trademarks are derived by iden-tifying revenues from sales of products belonging to each trademark. The value in use of trademarks
Goodwill from acquisitions is allocated to Cash Generating Units (CGU). The primary reporting seg-ments, which form the CGUs, are Living and Func-tional. The recoverable amounts from CGUs are determined with value in use method, using five-year discounted cash flow projections, based on strategic plans approved by management. Cash flows for the period extending over the planning period are calcu-lated using the terminal value method. The discount rate is the weighted average post-tax cost of capital (WACC) as defined by Fiskars. The components of the WACC are risk-free rate, market risk premium, company-specific risk premium, industry specific equity beta, cost of debt and debt to equity ratio.
Goodwill is not amortized but is tested at least annually for impairment. Goodwill has been allocated to cash-generating units as follows:

44 Fiskars Group 45Financial Statements 2017
KEY PARAMETERS APPLIED IN IMPAIRMENT TESTING
2017 2016
% GOODWILL* TRADEMARKS** GOODWILL* TRADEMARKS**
Increase in net sales on average 1.0 1.0 1.0 1.0
Steady growth rate in projecting terminal value 2.0 2.0 2.0 2.0
Discount rate, pre-tax, average 8.7 9.0 8.1 9.0
SENSITIVITY ANALYSESSensitivity analyses of goodwill have been carried out for the valuation of each CGU by making down-side scenarios for key parameters. The management views that no reasonably possible change in any of the key parameters would lead to impairment as the recoverable amounts exceed the carrying amounts considerably.
Sensitivity analyses of trademarks have been carried out for the valuation of each trademark by making downside scenarios for key parameters. The management views that excluding the Gingher trade-mark, no reasonably possible change in any of the key parameters would lead to impairment. The recoverable amount of the Gingher trademark currently exceeds its carrying amount of EUR 3.3 million by EUR 0.4 mil-lion, and a decrease of 1.0% in terminal growth or an increase of 1.0% point in pre-tax discount rate would result in the recoverable amount being lower than the carrying amount.
* The increases in net sales, used in impairment testings, are on average more moderate than strategic plans for the planning period. The EBIT used in impairment testing is the CGU’s actual three previous years average EBIT-% of sales. This is consistently used for all periods in the five year discounted cash flow projections.** Used one percentage point higher risk premium than in goodwill testing.
2017
12. Property, plant and equipment
EUR MILLION
LANDAND
WATER BUILDINGS
LEASED REAL
ESTATE
MACHINERYAND
EQUIPMENT
CONSTRUC-TION IN
PROGRESS TOTAL
Historical cost, Jan 1 23.1 102.3 17.9 167.6 11.4 322.5
Translation differences -0.5 -1.9 -2.2 -10.4 -0.5 -15.5
Additions 1.2 11.1 15.8 28.2
Decreases -0.5 -16.2 -15.8 -36.6 -1.6 -70.7
Transfers between asset groups 0.4 2.0 8.6 -11.0 0.0
Historical cost, Dec 31 22.4 87.5 0.0 140.4 14.2 264.5
Accumulated depreciation and impairment, Jan 1 0.8 37.6 17.9 106.4 162.8
Translation differences -0.7 -2.2 -8.2 -11.0
Depreciation for the period 4.2 18.5 22.7
Impairment for the period -0.1 -0.1
Decreases -13.7 -15.8 -35.5 -65.0
Transfers between asset groups 0.0 0.0
Accumulated depreciation and impairment, Dec 31 0.8 27.4 0.0 81.1 109.4
Net book value, Dec 31 21.6 60.1 0.0 59.3 14.2 155.1
Investment commitments for tangible assets 9.1
is determined on a discounted cash flow method basis, derived from five-year cash flow projections, based on strategic plans approved by the manage-ment. Cash flows for the period extending over the planning period are calculated using the terminal value method.
On the basis of the impairment calculations made there has been no need for impairment of trademarks for the periods ended December 31, 2017 and 2016.

46 Fiskars Group 47Financial Statements 2017
2016
EUR MILLION 2017 2016
Fair value, Jan 1 40.9 41.4
Increase due to growth 1.8 2.0
Change in wood prices 0.4 -0.2
Harvested timber -1.5 -2.2
Fair value, Dec 31 41.6 40.9
13. Biological assets
Fiskars owns around 11,000 hectares of forest and land in Finland. For valuing biological assets Fiskars applies a three year rolling average price of stand-ing timber, based on the statistics provided by the Natural Resources Institute Finland, and multiplied by the estimated volume of standing timber, taking into account the costs and risks relating to sales.
The fair value measurements of biological assets are categorized within level 3 of the fair value hierarchy.
EUR MILLION 2017 2016
Historical cost, Jan 1 11.3 13.3
Translation differences 0.0 0.1
Additions 0.0 0.4
Decreases 0.0 -2.5
Reclassification from property, plant and equipment -0.6 0.0
Historical cost, Dec 31 10.6 11.3
Accumulated depreciation, Jan 1 6.3 8.4
Translation differences 0.0 0.1
Depreciation and impairment for the period 0.4 0.4
Decreases 0.0 -2.5
Accumulated depreciation and impairment, Dec 31 6.7 6.3
Net book value, Dec 31 3.9 4.9
14. Investment property
Investment Property comprises the parent company’s buildings and zoned and unbuilt lots for detached houses in Fiskars Village, Finland.
FAIR VALUEProperties in Fiskars Village are unique in their cultural and historical values. Therefore it is not possible to determine a comparable market value on those prop-erties. The book value of these properties, only located in Finland, were EUR 3.9 million (2016: 4.9) in 2017.
FINANCIAL ASSETS AT FAIR VALUE THROUGH PROFIT OR LOSS
Investments at fair value through profit or loss comprise listed shares and unlisted funds. Listed shares have been recognized at their fair value based on quotation at the end of the reporting period (fair value hierarchy level 1). Level 1 investments consist mainly of 10,881,781 shares in Wärtsilä. A 10% change in the Wärtsilä share
LEVEL 1 LEVEL 3
EUR MILLION 2017 2016 2017 2016
Book value, Jan 1 464.4 520.0 20.4 14.9
Additions 1.9 7.2
Decreases -61.7 -0.7
Change in fair value through profit or loss 107.9 6.1 -0.5 -1.1
Book value, Dec 31 572.4 464.4 21.7 20.4
15. Financial assets
price would have an impact of EUR 57.2 million in the results before taxes. Risk associated to investments into short interest rate funds are considered to be low. The fair value of unlisted funds is based on the market value reported by the funds (level 3). Changes in the fair value are recognized in the income statement.
EUR MILLION
LANDAND
WATER BUILDINGS
LEASED REAL
ESTATE
MACHINERYAND
EQUIPMENT
CONSTRUC-TION IN
PROGRESS TOTAL
Historical cost, Jan 1 24.1 107.1 17.4 194.7 9.9 353.3
Translation differences -0.1 -2.0 0.6 3.8 0.0 2.3
Acquisitions and divestments 0.0 -0.1 0.0 -0.1
Additions 0.1 4.6 14.6 13.6 33.0
Decreases -1.0 -10.2 -54.4 0.0 -65.5
Transfers between asset groups 0.0 2.7 9.0 -12.2 -0.4
Historical cost, Dec 31 23.1 102.3 17.9 167.7 11.4 322.5
Accumulated depreciation and impairment, Jan 1 0.8 42.1 17.1 135.8 195.8
Translation differences 0.7 0.6 3.8 5.0
Depreciation for the period 4.5 0.3 18.6 23.3
Impairment for the period 0.0 0.0
Acquisitions and divestments 0.0 0.0 0.0
Decreases -9.9 -51.3 -61.2
Transfers between asset groups 0.3 -0.5 -0.2
Accumulated depreciation and impairment, Dec 31 0.8 37.6 17.9 106.4 162.8
Net book value, Dec 31 22.3 64.7 0.0 61.3 11.4 159.7
Investment commitments for tangible assets 7.4

48 Fiskars Group 49Financial Statements 2017
OTHER INVESTMENTS
CASH AND CASH EQUIVALENTS
Other financial assets comprise listed and unlisted shares as well as non-current receivables. Listed shares have been recognized at their fair value
*Other current investments consist of commercial papers.
LEVEL 1 LEVEL 3
EUR MILLION 2017 2016 2017 2016
Book value, Jan 1 0.4 0.4 9.3 6.6
Additions 2.7
Other changes 0.0 0.0 -0.8 0.0
Book value, Dec 31 0.4 0.4 8.5 9.3
EUR MILLION 2017 2016
Cash at bank 31.1 17.7
Other current investments* 20.0 22.0
Total, Dec 31 51.1 39.7
based on quotation at the end of the reporting period (level 1). Unlisted shares and other investments are measured at the lower of cost and fair value (level 3).
EUR MILLION 2017 2016
Raw materials and consumables 21.8 25.5
Work in progress 20.3 19.7
Finished goods 190.0 211.3
Advance payments 0.0 0.1
Gross value of inventories 232.1 256.6
Inventory provision to the carrying value -26.9 -32.0
Total, Dec 31 205.2 224.6
16. Inventories
AGING OF TRADE RECEIVABLES
TRADE RECEIVABLES IN CURRENCIES
Trade receivables are widely spread geographically. The biggest customers are major retailers with solid credit ratings. Credit loss risks are estimated to be
EUR MILLION 2017 2016
Not fallen due 154.5 156.8
1–30 days past due 22.5 18.1
31–60 days past due 3.1 0.5
61–90 days past due 1.5 0.6
91–120 days past due 1.1 0.9
Over 120 days past due 5.8 2.8
Less provision for bad debts, Dec 31 -4.7 -4.7
Total, Dec 31 183.7 175.1
EUR MILLION 2017 2016
US Dollars (USD) 69.1 73.4
Euros (EUR) 39.6 38.7
Danish Krones (DKK) 23.4 18.7
United Kingdom Pounds (GBP) 9.7 4.9
Swedish Kronas (SEK) 8.8 8.5
Japanese Yens (JPY) 6.9 8.3
Australian Dollars (AUD) 5.5 5.4
Norwegian Krones (NOK) 4.8 5.1
Other currencies 15.9 12.1
Total, Dec 31 183.7 175.1
17. Trade and other receivables
18. Share capitalSHARE CAPITAL AND TREASURY SHARES
2017 2016 2017 2016
PCS 1,000 PCS 1,000 EUR MILLION EUR MILLION
Share capital, Jan 1 81,905.2 81,905.2 77.5 77.5
Share capital, Dec 31 81,905.2 81,905.2 77.5 77.5
Treasury shares, Jan 1 187.8 3.2
Change 3.6 187.8 0.1 3.2
Treasury shares, Dec 31 191.5 187.8 3.2 3.2
moderate. The maximum exposure to credit risk is the carrying amount of the trade receivables.
EUR MILLION 2017 2016
Trade receivables 183.7 175.1
Derivatives 0.1 1.4
Other receivables 10.2 4.8
Prepaid expenses and accrued income 20.4 22.3
Total, Dec 31 214.4 203.6

50 Fiskars Group 51Financial Statements 2017
NON-CURRENT INTEREST BEARING DEBT
All interest-bearing debts are valued at amortized cost. The fair values of interest-bearing debts have been calculated by discounting the cash flow of the
debt by the market rate at the end of reporting period (fair value hierarchy level 2).
2017 2016
EUR MILLIONFAIR
VALUECARRYING
AMOUNTFAIR
VALUECARRYING
AMOUNT
Loans from credit institutions 150.9 150.9 181.0 181.0
Financial leasing debt 0.4 0.4 1.4 1.4
Total, Dec 31 151.4 151.4 182.4 182.4
19. Finance
FINANCE LEASE DEBT
CURRENT INTEREST BEARING DEBT
2017
2017 2016
EUR MILLIONFAIR
VALUECARRYING
AMOUNTFAIR
VALUECARRYING
AMOUNT
Bank overdrafts 17.1 17.1 9.6 9.6
Loans from credit institutions 30.0 30.0
Commercial papers
Finance leasing debt 0.3 0.3 0.4 0.4
Other 1.0 1.0 0.8 0.8
Total, Dec 31 48.5 48.5 10.9 10.9
EUR MILLION 2017 2016
Finance lease liabilities are payable as follows:
Less than one year 0.3 0.5
Between one and five years 0.4 1.5
More than five years 0.1
Minimum lease payments, total 0.7 2.1
Present value of minimum lease payments:
Less than one year 0.3 0.4
Between one and five years 0.4 1.3
More than five years 0.1
Present value of minimum finance lease payments, total 0.7 1.8
Future finance charges 0.0 0.3
MATURITY OF LIABILITIES
EUR MILLION 2018 2019 2020 2021 2022 LATER TOTAL
Bank overdrafts 17.1 17.1
Other debt 1.0 1.0
Loans from credit institutions 30.0 100.0 50.0 180.0
interests 1.3 1.2 1.2 0.5 0.5 4.7
Finance leasing 0.3 0.3 0.1 0.7
interests 0.0 0.0 0.0 0.0
Trade payables 89.2 89.2
Derivative liabilities 1.3 1.3
Total, Dec 31 140.2 1.5 101.3 0.5 50.5 0.0 294.0
47.7% 0.5% 34.5% 0.2% 17.2% 0.0% 100.0%
EUR MILLION 2017 2018 2019 2020 2021 LATER TOTAL
Bank overdrafts 9.6 9.6
Other debt 0.8 0.8
Loans from credit institutions 31.0 100.0 50.0 181.0
interests 1.4 1.4 1.3 1.3 1.0 0.5 6.9
Finance leasing 0.4 0.3 0.3 0.3 0.3 0.1 1.8
interests 0.1 0.1 0.1 0.0 0.0 0.0 0.3
Trade payables 85.4 85.4
Derivative liabilities 1.6 1.6
Total, Dec 31 99.4 32.8 1.7 101.7 1.4 50.6 287.5
34.6% 11.4% 0.6% 35.4% 0.5% 17.6% 100.0%
As of December 31, 2017 the Group has unused credit facilities EUR 300 million (300) at its disposal to guar-antee its liquidity. The average maturity of the credit limit agreements as of December 31, 2017 was 2.7 years (2.5). Agreements concerning credit facilities
and long term loans include among others covenants for the solidity. Non-compliance with the covenants would lead to a premature expiry of the agreements. Potential default would require material deterioration of the solidity from the current.
2016
SENSITIVITY ANALYSIS OF CURRENCY EXPOSURE
The exchange rate sensitivity analysis in accordance with IFRS 7 has been carried out by examining how the profit before taxes or consolidated group equity would be impacted by a 10% devaluation of a cur-rency against all other currencies. Impact from a 10% appreciation of a currency against all other currencies would be opposite. The analysis of impact on profit includes internal and external foreign cur-rency denominated financial items of the parent
company in the selected currencies. Commercial cash flows consist of net foreign currency flows of purchases and sales estimated to take place during the following year by the business units and hedged internally. Financial items include foreign currency denominated loans, deposits and external derivatives. The selected currencies represent approximately 90% of the commercial net foreign currency flows. The sensitivity analysis on the group consolidated equity illustrates translation risk related to the foreign currency denominated equity.
NUMBER OF SHARES AND VOTES
DEC 31, 2017 DEC 31, 2016
NUMBER OFSHARES
NUMBER OFVOTES
SHARE CAPITALEUR
NUMBER OFSHARES
NUMBER OFVOTES
SHARE CAPITALEUR
Shares (1 vote/share) 81,905,242 81,905,242 77,510,200 81,905,242 81,905,242 77,510,200
Total 81,905,242 81,905,242 77,510,200 81,905,242 81,905,242 77,510,200
Fiskars Corporation has a single class of shares. Shares have no nominal value.

52 Fiskars Group 53Financial Statements 2017
2017
2017 2016
IMPACT ON RESULT BEFORE TAXES IMPACT ON RESULT BEFORE TAXES
EUR MILLION
ESTIMATEDCOMMERCIALCASH FLOWS
OTHER FINANCIAL
ITEMS
IMPACTON GROUP
EQUITY
ESTIMATEDCOMMERCIALCASH FLOWS
OTHER FINANCIAL
ITEMS
IMPACTON GROUP
EQUITY
AUD -2.4 2.4 -1.3 -2.6 2.6 -1.3
CAD -1.5 1.5 -1.0 -1.7 1.7 -0.8
IDR 1.3 -1.3 0.0 1.5 -1.5 0.0
JPY -1.6 1.6 -0.5 -2.5 2.5 -1.8
NOK -0.9 0.9 -1.1 1.3 -1.3 -1.4
SEK -2.4 2.4 -2.3 -2.3 2.3 -4.6
THB 3.8 -3.8 -0.7 3.8 -3.8 -0.5
USD 1.3 -1.3 -20.6 -0.2 0.2 -23.4
2016
EUR MILLION EUR USD GBP DKK OTHER TOTAL
External loans and deposits 142.3 3.7 0.0 0.0 1.7 147.7
Currency derivatives -52.6 10.0 10.1 17.5 15.0 0.0
Net debt and currency derivatives 89.7 13.7 10.1 17.5 16.7 147.7
Average interest rate on loans (p.a.) 1.0% 3.0%
Interest rate sensitivity 0.4 0.1 0.1 0.2 0.1 0.9
EUR MILLION EUR USD GBP DKK OTHER TOTAL
External loans and deposits 161.1 5.7 0.8 0.9 -16.1 152.4
Currency derivatives -73.9 0.7 8.8 34.3 30.1 0.0
Net debt and currency derivatives 87.2 6.4 9.6 35.2 14.0 152.4
Average interest rate on loans (p.a.) 1.0% 3.0%
Interest rate sensitivity 0.1 0.1 0.1 0.4 0.1 0.7
AVERAGE INTEREST RATES AND SENSITIVITY ANALYSIS OF INTEREST
The sensitivity of interest expenses on changes in inter-est rates has been presented by simulating a permanent one percentage unit raise in interest rates at the end of the reporting year. The Group’s net interest bearing debt as of December 31, 2017 was EUR 147.7 million (152.4) and the average interest reset period was 11
months (15). A permanent one percentage point raise in all interest rates would increase the corporation’s annual interest costs by EUR 0.9 million (0.7) assuming no change in the amount of the net debt.
The table below shows the Group’s net interest bearing debt, currency derivatives, average interest rates on loans and interest rate sensitivity by major currencies.
NOMINAL AMOUNTS OF DERIVATIVES
FAIR VALUE OF DERIVATIVES
EUR MILLION 2017 2016
Derivatives not designated in hedge accounting:
Foreign exchange forwards and swaps 184.9 212.0
Electricity forward agreements 1.0 0.4
Cash flow hedges:
Interest rate swaps 80.0 80.0
EUR MILLION 2017 2016
Derivatives not designated in hedge accounting:
Foreign exchange forwards and swaps -0.4 1.3
Electricity forward agreements -0.9 0.1
Cash flow hedges:
Interest rate swaps 0.1 -1.6
Derivatives have been valued at fair value, which has been determined by using generally accepted valua-tion techniques supported by observable market data
(fair value hierarchy level 2). Derivatives are recognised at fair value through profit and loss except for cash flow hedges, which are recorded in equity.
EUR MILLION 2018 2019 LATER TOTAL
Foreign exchange forwards and swaps 184.9 184.9
Electricity forward agreements 0.8 0.2 1.0
Interest rate swaps 30.0 50.0 80.0
Total, Dec 31 215.7 0.2 50.0 265.9
MATURITY OF DERIVATIVES2017
2016
FAIR VALUE OF FINANCIAL INSTRUMENTS 2017
2016
For the definition of fair value category levels please see the accounting principles in note 1.
EUR MILLION 2017 2018 LATER TOTAL
Foreign exchange forwards and swaps 212.0 212.0
Electricity forward agreements 0.4 0.4
Interest rate swaps 30.0 50.0 80.0
Total, Dec 31 212.4 30.0 50.0 292.4
EUR MILLION LEVEL 1 LEVEL 2 LEVEL 3 TOTAL
Investments at fair value through profit or loss 572.4 21.7 594.1
Other investments 0.4 8.5 8.9
Derivative assets 0.1 0.1
Total assets 572.8 0.1 30.2 603.1
Derivative liabilities 1.3 1.3
Total liabilities 1.3 1.3
EUR MILLION LEVEL 1 LEVEL 2 LEVEL 3 TOTAL
Investments at fair value through profit or loss 464.4 20.4 484.8
Other investments 0.4 9.3 9.7
Derivative assets 1.4 1.4
Total assets 464.8 1.4 29.7 495.8
Derivative liabilities 1.6 1.6
Total liabilities 1.6 1.6

54 Fiskars Group 55Financial Statements 2017
FINANCIAL RISK MANAGEMENTFinancial risks are managed by the corporate treasury, in accordance with a set of risk management principles approved by the Board of Directors.
Currency riskCurrency risk is linked to changes in the value of Fiskars’ cash flows, its balance sheet, and/or its competitive-ness resulting from changes in exchange rates. Fiskars’ currency position is split between its transaction posi-tion and translation position, both of which are managed separately.
Transaction riskTransaction risk results from the possibility that the value of expected cash flow denominated in a particular currency may change as a result of changes in exchange rates. The objective of Fiskars’ approach to managing its transaction risk is to reduce the impact of changes in exchange rates on the Group’s budgeted profitability and cash flows. Business units are respon-sible for managing the currency risks associated with their projected and agreed commercial cash flows. Units hedge their exposure using currency forwards with the corporate treasury.
Transaction risk is measured by net of the Group’s commercial and financial receivables and liabilities denominated in foreign currencies. The net position is hedged by currency derivatives in accordance with the treasury policy approved by the Board of Directors. Currency forwards and swaps are the most widely used instruments in hedging currency risks.
Less than 20% of Fiskars’ commercial cash flows are exposed to fluctuations in foreign exchange rates. The most significant risks relate to appreciation of THB and depreciation of JPY, AUD and SEK. Higher levels of imports indirectly expose Fiskars to risks linked to changes in the local currencies of its suppliers, of which the most important is the Chinese renminbi.
Fiskars does not apply hedge accounting as defined under IAS 39 for transaction risk purposes. All gains and losses made on currency derivatives are booked in the income statement. Had hedge account-ing been applied to currency derivatives Fiskars’ con-solidated profit before tax for 2017 would have been EUR 0.8 million below the reported figure (0.8 million below reported in 2016).
Translation riskTranslation risk refers to the impact that changes in exchange rates can have on the consolidated income statement, consolidated statement of cash flows and consolidated balance sheet, and which can affect the value of balance sheet assets, equity, and debt
liabilities. In addition to balance sheet values, changes in exchange rates can also result in changes in key indicators, such as equity ratio and gearing. The potential adverse impact on reported consolidated financials arising from changes in foreign exchange rates is left unhedged.
Interest rate riskInterest rate risk refers to possible changes in cash flow or in the value of assets or liabilities resulting from changes in interest rates. Interest rate risk is measured by the average reset period of interest rates of financial assets and liabilities. The average reset period reflects the time it takes on average for the change in interest rates to effect on the interest costs of net debt portfolio. The risk is quantified in monetary terms as the change in interest costs during the observation period caused by a permanent one percentage point rise in interest rates. The shorter the average reset period, the more unpredictable are the interest costs and thus the higher the interest rate risk.
Derivatives are used in the management of inter-est rate risks. The objective is to maintain the average reset period within the agreed limits of 4 to 18 months as set in the treasury policy. As of December 31, 2017 the nominal amount of outstanding interest rate deriv-atives was EUR 80.0 million (2016: 80.0). The Group’s interest-bearing net debt as of December 31, 2017 was EUR 147.7 million (152.4). 59% (46%) of debt was linked to variable interest rates. Taking into con-sideration the effect of interest rate derivatives, 41% (54%) of debt was linked to fixed interest rates. The average interest rate reset period of interest-bearing debt was 11 months (15).
Sensitivity of interest expenses on changes in market rates has been calculated by assuming perma-nent one percentage unit increase change in market rates and assuming no change in net debt during the year. The calculated impact on the consolidated result before tax would be EUR 0.9 million (0.7) in 2018.
At the end of the year Fiskars held investments amounting to EUR 20.0 million (22.0) in commercial papers that mature during the first quarter of 2018.
Liquidity and re-financing risk
Liquidity risk refers to the possibility of the Group’s financial assets proving insufficient to cover its business needs or a situation in which arranging such funding would result in substantial additional costs. The objec-tive of liquidity management is to maintain an optimal amount of liquidity to fund the business operations of the Group at all times while minimizing interest costs. Liquidity is considered to be the sum of cash and cash equivalents and available committed credit lines.
Re-financing risk refers to the possibility of such a large amount of liabilities falling due over such a short space of time that the re-financing needed might be unavailable or prohibitively expensive. The objective is to minimize the re-financing risk by diversifying the maturity structure of the debt portfolio.
The Group has extensive unused credit facilities at its disposal to guarantee its liquidity. As of the end of the year, the unutilized committed revolving credit facilities totaled EUR 300.0 million (2016: 300.0) and overdraft facilities EUR 27.9 million (38.4). In addition, the Group’s parent company in Finland has a commer-cial paper program amounting to EUR 400.0 million, of which none was utilized as of the end of the year (2016: EUR 400.0 million).
Commodity riskFiskars may use derivatives to hedge its exposure to commodity price fluctuations where appropriate. At the end of the year, the Group held no commodity derivative contracts other than electricity futures with a nominal value of EUR 1.0 million (0.4) recognized at fair value through the income statement.
Credit riskCorporate treasury is responsible for evaluating and monitoring financial counterparty risk. The Group minimizes this risk by limiting its counterparties to a limited number of major banks and financial institutions and by working within agreed counterparty limits. Business units are responsible for monitoring customer credit risks. The Group’s clientele is extensive and even the largest customers represent less than 10% of the outstanding receivables. As of the end of the year, the Group’s trade receivables totaled EUR 183.7 million (175.1), and the financial statements include provisions for bad debt related to trade receivables totaling EUR 4.7 million (4.7).
Management of capitalFiskars is not subject to any externally imposed cap-ital requirements (other than possible local company law requirements effective in the jurisdictions where Fiskars Group companies are active).
The Group’s objectives when managing capital are:• to safeguard the Corporation’s capacity
to fund its operations and take care of its obligations under all business conditions
• to maintain a balanced business and investment portfolio that provides return both on short and long term to its shareholders
• to maintain possibilities to act on potential investment opportunities
20. Employee defined benefit obligations
Most of Fiskars Group’s pension plans are defined contribution plans. The English & Crystal Living busi-ness has defined benefit plans in Indonesia, Japan and Slovenia. The defined benefit plans in the U.S., the UK and Germany are closed plans, and future pay increases will not impact the valuation. The Group also has supplementary pension plans in Finland which are classified as defined benefit plans. Each plan is operated in accordance with local conditions and practices of the respective country. Authorized actuaries have performed the actuarial calculations for the defined benefit plans.
The main unfunded plans are in the U.S., Ger-many, Indonesia, Japan and Slovenia. Plans in Finland and Norway are taken care of by local pension insur-ance companies. The Group estimates its contribu-tions to the plans during 2018 to be EUR 0.9 milj. (1.5) million.
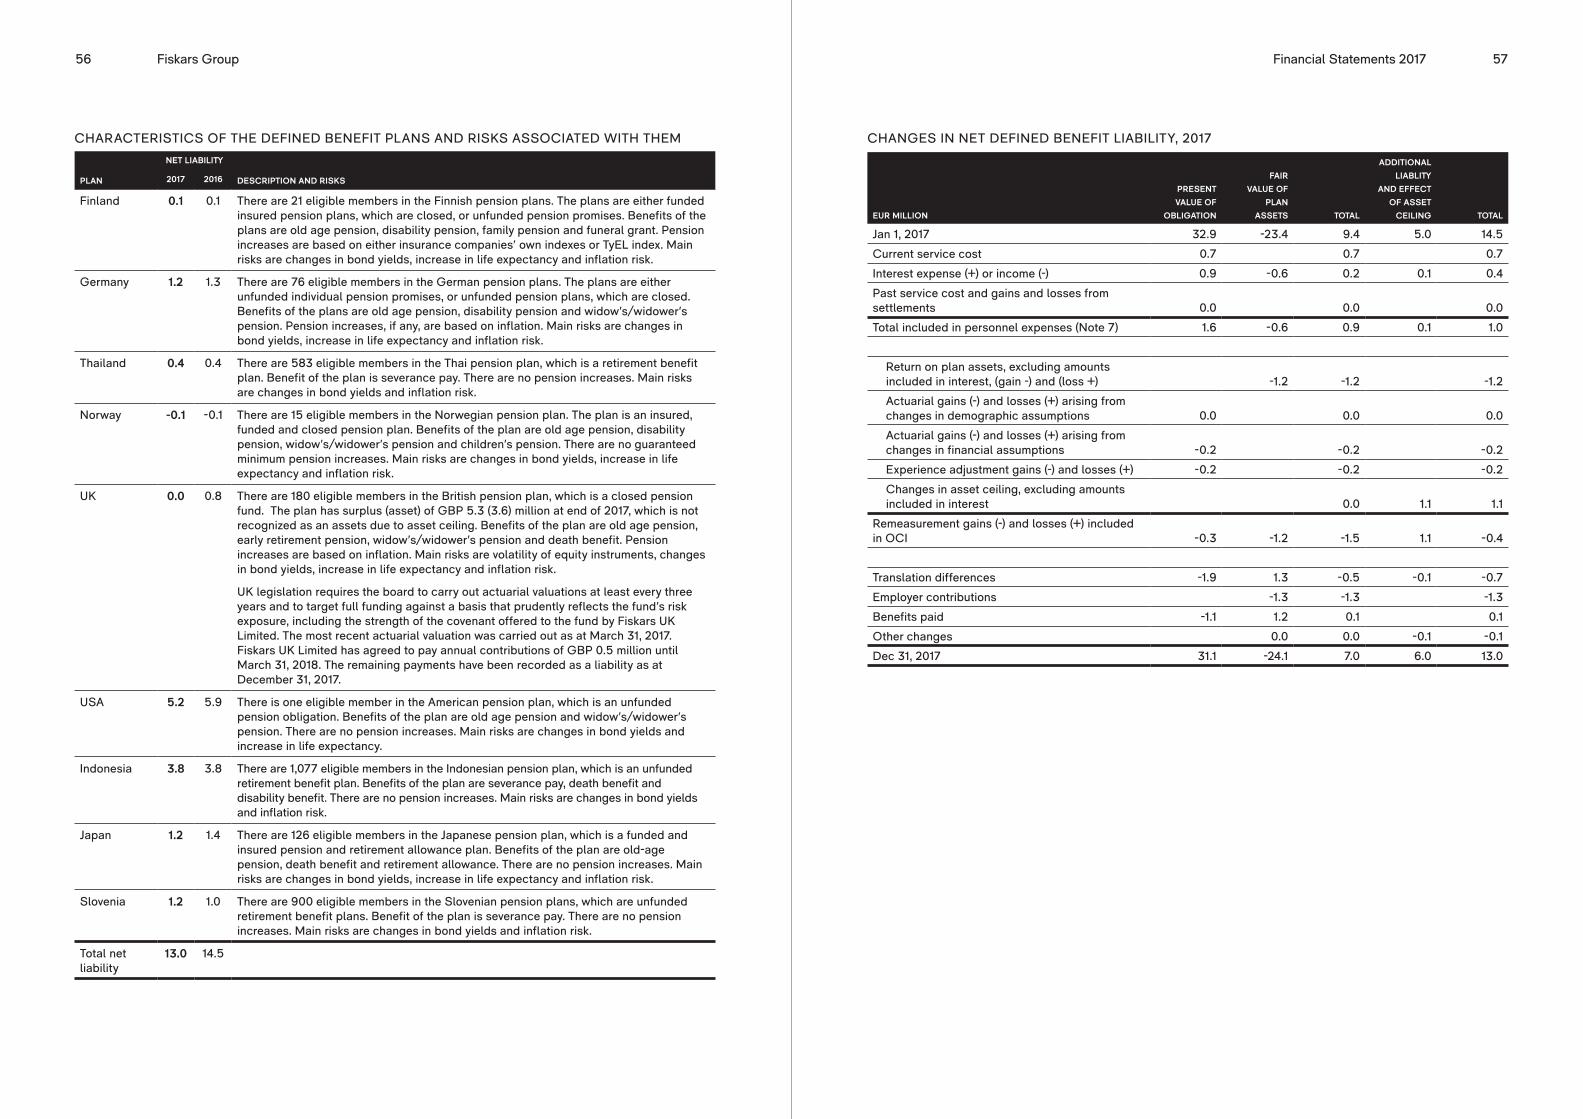
56 Fiskars Group 57Financial Statements 2017
NET LIABILITY
PLAN 2017 2016 DESCRIPTION AND RISKS
Finland 0.1 0.1 There are 21 eligible members in the Finnish pension plans. The plans are either funded insured pension plans, which are closed, or unfunded pension promises. Benefits of the plans are old age pension, disability pension, family pension and funeral grant. Pension increases are based on either insurance companies’ own indexes or TyEL index. Main risks are changes in bond yields, increase in life expectancy and inflation risk.
Germany 1.2 1.3 There are 76 eligible members in the German pension plans. The plans are either unfunded individual pension promises, or unfunded pension plans, which are closed. Benefits of the plans are old age pension, disability pension and widow’s/widower’s pension. Pension increases, if any, are based on inflation. Main risks are changes in bond yields, increase in life expectancy and inflation risk.
Thailand 0.4 0.4 There are 583 eligible members in the Thai pension plan, which is a retirement benefit plan. Benefit of the plan is severance pay. There are no pension increases. Main risks are changes in bond yields and inflation risk.
Norway -0.1 -0.1 There are 15 eligible members in the Norwegian pension plan. The plan is an insured, funded and closed pension plan. Benefits of the plan are old age pension, disability pension, widow’s/widower’s pension and children’s pension. There are no guaranteed minimum pension increases. Main risks are changes in bond yields, increase in life expectancy and inflation risk.
UK 0.0 0.8 There are 180 eligible members in the British pension plan, which is a closed pension fund. The plan has surplus (asset) of GBP 5.3 (3.6) million at end of 2017, which is not recognized as an assets due to asset ceiling. Benefits of the plan are old age pension, early retirement pension, widow’s/widower’s pension and death benefit. Pension increases are based on inflation. Main risks are volatility of equity instruments, changes in bond yields, increase in life expectancy and inflation risk.
UK legislation requires the board to carry out actuarial valuations at least every three years and to target full funding against a basis that prudently reflects the fund’s risk exposure, including the strength of the covenant offered to the fund by Fiskars UK Limited. The most recent actuarial valuation was carried out as at March 31, 2017. Fiskars UK Limited has agreed to pay annual contributions of GBP 0.5 million until March 31, 2018. The remaining payments have been recorded as a liability as at December 31, 2017.
USA 5.2 5.9 There is one eligible member in the American pension plan, which is an unfunded pension obligation. Benefits of the plan are old age pension and widow’s/widower’s pension. There are no pension increases. Main risks are changes in bond yields and increase in life expectancy.
Indonesia 3.8 3.8 There are 1,077 eligible members in the Indonesian pension plan, which is an unfunded retirement benefit plan. Benefits of the plan are severance pay, death benefit and disability benefit. There are no pension increases. Main risks are changes in bond yields and inflation risk.
Japan 1.2 1.4 There are 126 eligible members in the Japanese pension plan, which is a funded and insured pension and retirement allowance plan. Benefits of the plan are old-age pension, death benefit and retirement allowance. There are no pension increases. Main risks are changes in bond yields, increase in life expectancy and inflation risk.
Slovenia 1.2 1.0 There are 900 eligible members in the Slovenian pension plans, which are unfunded retirement benefit plans. Benefit of the plan is severance pay. There are no pension increases. Main risks are changes in bond yields and inflation risk.
Total net liability
13.0 14.5
CHARACTERISTICS OF THE DEFINED BENEFIT PLANS AND RISKS ASSOCIATED WITH THEM
EUR MILLION
PRESENT VALUE OF
OBLIGATION
FAIR VALUE OF
PLAN ASSETS TOTAL
ADDITIONAL LIABLITY
AND EFFECT OF ASSET
CEILING TOTAL
Jan 1, 2017 32.9 -23.4 9.4 5.0 14.5
Current service cost 0.7 0.7 0.7
Interest expense (+) or income (-) 0.9 -0.6 0.2 0.1 0.4
Past service cost and gains and losses from settlements 0.0 0.0 0.0
Total included in personnel expenses (Note 7) 1.6 -0.6 0.9 0.1 1.0
Return on plan assets, excluding amounts included in interest, (gain -) and (loss +) -1.2 -1.2 -1.2
Actuarial gains (-) and losses (+) arising from changes in demographic assumptions 0.0 0.0 0.0
Actuarial gains (-) and losses (+) arising from changes in financial assumptions -0.2 -0.2 -0.2
Experience adjustment gains (-) and losses (+) -0.2 -0.2 -0.2
Changes in asset ceiling, excluding amounts included in interest 0.0 1.1 1.1
Remeasurement gains (-) and losses (+) included in OCI -0.3 -1.2 -1.5 1.1 -0.4
Translation differences -1.9 1.3 -0.5 -0.1 -0.7
Employer contributions -1.3 -1.3 -1.3
Benefits paid -1.1 1.2 0.1 0.1
Other changes 0.0 0.0 -0.1 -0.1
Dec 31, 2017 31.1 -24.1 7.0 6.0 13.0
CHANGES IN NET DEFINED BENEFIT LIABILITY, 2017

58 Fiskars Group 59Financial Statements 2017
CHANGES IN NET DEFINED BENEFIT LIABILITY, 2016
PLAN ASSETS BY ASSET CATEGORY
PRINCIPAL ACTUARIAL ASSUMPTIONS AT THE BALANCE SHEET DATE
2017 2016
EUR MILLION QUOTED UNQUOTED QUOTED UNQUOTED
Equity instruments 14.9 14.7
Bonds 5.1 4.9
Property 0.3 0.4
Insurance contracts 3.5 3.1
Cash and cash equivalents 0.2 0.2
Other 0.0 0.0
Total 20.6 3.5 20.2 3.1
% 2017 2016
Discount rate
UK 2,7 2,7
Other countries 0.4–7.39 0.4–7.54
Future salary increases
UK n/a n/a
Other countries n/a / 0.0–5.0 n/a / 0.0–5.0
Future pension increases
UK 0.0–3.3 0.0–3.3
Other countries n/a / 0.0–5.0 n/a / 0.0–5.0
SENSITIVITY ANALYSIS
A reasonably possible change to one of the relevant actuarial assumptions at the reporting date holding
other assumptions constant, would have affected the defined benefit obligation as shown below.
The weighted average of the duration of the defined benefit obligation: 12.1 (12.7)
Although the analysis does not take account of the full distribution of cash flows expected under the plan, it does provide an approximation of the sensitivity of the assumptions shown.
2017 2016
DEFINED BENEFIT OBLIGATION DEFINED BENEFIT OBLIGATION
EUR MILLION INCREASE DECREASE INCREASE DECREASE
UK
Discount rate (0.5% change) -1.1 1.0 -1.1 1.2
Future salary (0.5% change) n/a n/a n/a n/a
Future pension (0.25% change) 0.2 -0.2 0.1 -0.1
Other Group companies, total
Discount rate (0.5% change) -0.8 0.8 -0.8 0.9
Future salary (0.5% change) 0.5 -0.5 0.1 -0.1
Future pension (0.25% change) 0.0 -0.0 0.1 -0.1
21. ProvisionsWarranty provisions relate to products sold and are reviewed and adjusted regularly to reflect the esti-mated cash outflows to settle the warranty claims. Restructuring provisions mainly relate to the Alignment program. Other provisions include, among others, provisions for legal expenses and estimated costs for refurbishment of premises.
EUR MILLION
PRESENT VALUE OF
OBLIGATION
FAIR VALUE OF
PLAN ASSETS TOTAL
ADDITIONAL LIABLITY
AND EFFECT OF ASSET
CEILING TOTAL
Jan 1, 2016 30.8 -22.9 7.9 5.9 13.9
Current service cost 0.7 0.7 0.7
Interest expense (+) or income (-) 1.0 -0.7 0.3 0.2 0.5
Past service cost and gains and losses from settlements 0.0 0.0 0.0
Total included in personnel expenses (Note 7) 1.7 -0.7 1.0 0.2 1.2
Return on plan assets, excluding amounts included in interest, (gain -) and (loss +) -2.2 -2.2 -2.2
Actuarial gains (-) and losses (+) arising from changes in demographic assumptions -0.1 -0.1 -0.1
Actuarial gains (-) and losses (+) arising from changes in financial assumptions 3.1 3.1 3.1
Experience adjustment gains (-) and losses (+) 0.2 0.2 0.2
Changes in asset ceiling, excluding amounts included in interest 0.0 -0.3 -0.3
Remeasurement gains (-) and losses (+) included in OCI 3.1 -2.2 1.0 -0.3 0.7
Translation differences -1.5 2.5 1.1 -0.6 0.4
Employer contributions -1.5 -1.5 -1.5
Benefits paid -1.4 1.3 0.0 0.0
Other changes 0.0 -0.1 -0.1
Dec 31, 2016 32.9 -23.4 9.4 5.0 14.5

60 Fiskars Group 61Financial Statements 2017
CURRENT PROVISIONS
CURRENT PROVISIONS
EUR MILLIONWARRANTYPROVISION
RESTRUCTURINGPROVISION
ONEROUS CONTRACTS AND
OTHER PROVISIONS TOTAL
Provisions, Jan 1 3.9 10.8 1.9 16.6
Translation differences -0.2 -0.2 -0.1 -0.5
Additions 0.1 0.4 0.2 0.7
Used provisions -0.0 -8.1 -0.2 -8.3
Change in estimates -0.0 -0.0
Reversals -0.1 -0.1
Provisions, Dec 31 3.7 2.8 1.9 8.4
EUR MILLIONWARRANTYPROVISION
RESTRUCTURINGPROVISION
ONEROUS CONTRACTS AND
OTHER PROVISIONS TOTAL
Provisions, Jan 1 3.5 3.9 3.0 10.5
Translation differences 0.1 0.0 0.1 0.2
Additions 0.1 10.0 0.7 10.9
Used provisions -0.0 -3.3 -1.8 -5.0
Change in estimates 0.2 -0.1 0.2
Reversals -0.0 -0.0
Provisions, Dec 31 3.9 10.8 1.9 16.6
EUR MILLION 2017 2016
Trade payables 89.2 85.4
Other debt 17.1 20.3
Accrued expenses and deferred income:
Interests 2.0 2.2
Wages, salaries and social costs 46.0 48.5
Customer rebates and commissions 33.0 35.8
Other 59.6 45.7
Total, Dec 31 246.9 237.8
22. Trade and other payables
Other accrued expenses and deferred income com-prise periodization of bought materials and supplies, annual rebates for clients and other accrued items.
2017
2016
NON-CURRENT PROVISIONS
NON-CURRENT PROVISIONS
EUR MILLIONWARRANTYPROVISION
RESTRUCTURINGPROVISION
ONEROUSCONTRACTS AND
OTHER PROVISIONS TOTAL
Provisions, Jan 1 0.4 0.1 6.6 7.1
Translation differences -0.0 -0.0 -0.3 -0.3
Additions 0.0 0.8 1.0 1.8
Used provisions -1.6 -1.6
Change in estimates 0.0 0.0
Provisions, Dec 31 0.4 0.9 5.6 6.9
EUR MILLIONWARRANTYPROVISION
RESTRUCTURINGPROVISION
ONEROUSCONTRACTS AND
OTHER PROVISIONS TOTAL
Provisions, Jan 1 0.4 0.1 4.1 4.6
Translation differences 0.0 -0.0 0.0 0.0
Additions 0.0 4.2 4.2
Used provisions -1.1 -1.1
Change in estimates
Reversals -0.7 -0.7
Provisions, Dec 31 0.4 0.1 6.6 7.1
EUR MILLION 2017 2016
Payments next year 25.9 27.8
Payments between one and five years 56.7 67.5
Payments later 13.9 21.3
Total, Dec 31 96.4 116.6
EUR MILLION 2017 2016
Guarantees 19.9 19.1
Lease commitments 96.4 116.6
Other contingencies* 11.8 15.3
Total pledged assets and contingencies, Dec 31 128.1 151.0
23. Commitments
* Other contingencies include a commitment of USD 13 million to invest in private equity funds.
OPERATING LEASE OBLIGATIONS
CONTINGENCIES AND PLEDGED ASSETS
LITIGATIONFiskars is involved in a number of legal actions, claims and other proceedings. The final outcome of these matters cannot be predicted. Taking into account all available information to date the outcome is not expected to have material impact on the financial position of the Group.
Fiskars Group entities are subject to tax audits in several countries. It is possible that tax audits may lead to reassessment of taxes. The tax reassess-ment claim raised by the Finnish Large Taxpayers’
Office in 2016, which obliged the company to pay a total of EUR 28.3 million in additional tax, inter-est expenses and punitive tax increases, has been appealed against by the company to the Board of Adjustment in the Finnish Large Taxpayers’ Office. Fiskars will continue the appeal process in court, if necessary, in which case the process may take years. The dispute concerns intra-group loans forgiven by the company in 2003 and their tax treatment in subsequent tax years.

62 Fiskars Group 63Financial Statements 2017
EUR MILLION 2017 2016
Rent 0.2 0.2
Capital loan 0.2 0.2
SHAREHOLDINGS OF THE BOARD AND KEY MANAGEMENT, DECEMBER 31
Includes also holding of corporations under controlling power together with a family member.
OWN HOLDINGS
2017HOLDINGS OF CONTROLLED
CORPORATIONS TOTALOWN
HOLDINGS
2016HOLDINGS OFCONTROLLED
CORPORATIONS TOTAL
Ehrnrooth Alexander 855,000 12,650,000 13,505,000 855,000 12,650,000 13,505,000
Ehrnrooth Paul* 0 9,330,961 9,330,961 0 9,330,961 9,330,961
Fromond Louise* 601,135 10,165,537 10,766,672 1,250,705 8,541,612 9,792,317
Gripenberg Gustaf 243,320 4,057,289 4,300,609 243,320 4,057,289 4,300,609
Jonasson Blank Ingrid 0 0 0 0 0 0
Luomakoski Jyri1) 0 0 0 0 0 0
Mero Inka 0 0 0 0 0 0
Månsson Fabian 0 2,000 2,000 0 2,000 2,000
Sjölander Peter 0 0 0 0 0 0
Slotte Karsten3)
Sotamaa Ritva 1,000 0 1,000 1,000 0 1,000
Ariluoma Nina 0 0 0 0 0 0
Enckell Thomas 2,300 0 2,300 2,300 0 2,300
Gaeta Matteo4)
Gaggl Risto 0 0 0 0 0 0
Kangas-Kärki Teemu 6,000 0 6,000 6,000 0 6,000
Kass Robert8) 0 0 0
Garde Due Ulrik2) 0 0 0 0 0 0
Kauniskangas Kari7) 34,097 0 34,097
Tuominen Jaana6) 22,000 0 22,000
Matt Alexander 0 0 0 0 0 0
Pohjonen Sari5) 170 0 170
Taimi Maija9) 0 0 0
Valsta Leni9) 0 0 0
Tonnesen Paul 0 0 0 0 0 0
Ziegler Eva9) 0 0 0
Westerlund Frans10) 0 0 0
* Turret Oy Ab and Holdix Oy Ab as well as certain closely associated persons have on December 29, 2017, entered into a co-opera-tion concerning their ownership in Fiskars Corporation. The parties have entered into the co-operation with the purpose of acting as an engaged owner with a long-term ownership horizon focused on further developing Fiskars’ operations and shareholder value.The co-operation comprises a shareholders’ agreement between Turret Oy Ab and Holdix Oy Ab which the closely associated persons have undertaken to comply with as applicable. The closely associated persons comprise Paul Ehrnrooth, Jacob Ehrnrooth and Sophia Ehrnrooth, all of whom are closely associated with Turret Oy Ab, as well as Elsa Fromond, Louise Fromond and Anna Fromond, all of whom are closely associated with Holdix Oy Ab.
1) Member of the Board of Directors as of March 8, 20162) Member of the Extended Leadership Team as of January 18, 20163) Member of the Board of Directors until March 9, 20164) Member of the Extended Leadership Team until October 7, 20165) Member of the Extended Leadership Team as of February 10, 20176) Member of the Extended Leadership Team as of October 9, 20177) Member of the Extended Leadership Team until February 15, 20178) Member of the Extended Leadership Team until November 29, 20179) Member of the Extended Leadership Team as of January 1, 201710) Member of the Extended Leadership Team until July 31, 2017
Fiskars’ related parties are members of the Fiskars Board of Directors and Executive Board, other key management persons, and individual shareholders with control or significant influence over the company,
24. Related party transactions
as well as entities controlled or significantly influ-enced by them or their family members. In addition, associated companies of Fiskars are also regarded as related parties.
Fiskars Finland Oy Ab rents real estate from its associate Koy Iittalan Lasimäki and has granted a capital loan to the company at inception.
Fiskars had no significant transactions, liabilities or receivables with related parties during 2017.

64 Fiskars Group 65Financial Statements 2017
EUR THOUSANDSALARIES AND
FEES
2017STATUTORY
PENSIONSUPPLEMEN-
TARY PENSION*SALARIES AND
FEES
2016STATUTORY
PENSIONSUPPLEMEN-
TARY PENSION*
Ehrnrooth Alexander 78.3 75.0
Ehrnrooth Paul 135.0 120.0
Fromond Louise 61.0 57.0
Gripenberg Gustaf 61.0 57.8
Jonasson Blank Ingrid 93.0 77.0
Luomakoski Jyri 67.8 47.3
Mero Inka 65.3 56.3
Månsson Fabian 79.0 75.0
Sjölander Peter 99.0 75.0
Slotte Karsten 13.5
Sotamaa Ritva 80.0 77.0
Kauniskangas Kari** 623.8 105.0 98.2 1,248.4 194.1 94.5
Kangas-Kärki Teemu** 801.9 135.0 62.5
Tuominen Jaana** 203.6 34.3 23.9
Extended Leadership Team excl. President & CEO 3,511.8 78.0 82.5 4,693.2 375.6 221.5
Total 5,960.4 352.3 267.1 6,672.3 569.7 316.0
* The key management has a collective supplementary pension insurance, which includes an old-age pension at the retirement age of 60 years, vested rights under certain conditions and indemnity payable at death. The amount of pension income is based on the insurance savings. The employer’s contribution to the insurance plan is 20% of the preceding year’s base salary of the CEO and 16–20% of the preceding year’s base salary of the Executive Board excl. the CEO.** The President & CEO of the company has been Kari Kauniskangas until February 15, 2017, interim President & CEO Teemu Kan-gas-Kärki as of February 15, 2017 to October 8, 2017 and President & CEO Jaana Tuominen as of October 9, 2017.
The Directors and the CEO do not have any debts to the company; nor has the company given pledges or taken on other responsibilities in their names. The shareholdings of the Board and key management represent in total 46.4% of the outstanding shares of the company.
The key management appointed in the Extended Leadership Team as of January 1, 2017, but no longer employed by the company on December 31, 2017, are not included in the list. This consists of Alexander Giftthaler who left the company on November 21, 2017.
REMUNERATION OF THE BOARD AND KEY MANAGEMENT
The key management consists of the Board of Direc-tors, the President & CEO and the members of the
Corporate Management Team (Extended Leader-ship Team). The figures are presented on an accrual basis. Corporate management team belongs to the long-term incentive plans to which participants are selected by the Board of Directors annually. Targets are based on the company’s consolidated net sales and EBIT during the vesting period. There are three plans in place, 2015–2017, 2016–2018, 2017–2019. No reward will be paid if targets are not met or if the participant’s employment ends before reward payment. The expense recorded during the financial year for the corporate management team is EUR 1.9 million, amount is included in the salaries and fees figures below.
25. Share based payments
2017–2019 PLAN 2016–2018 PLAN 2015–2017 PLAN
Maximum number of shares granted 19,606 12,901 19,550
Grant date Mar 9, 2017 Feb 8, 2016 Feb 5, 2015
Grant date share price, EUR 20.20 17.02 19.50
Estimated realization of share price after vesting and restriction period 22.90 18.83 22.12
Expense recorded during the financial year (EUR million) 0.2 0.1 0.2
Liability at the end of the financial year (EUR million) 0.1 0.1 0.3
Vesting period starts Mar 9, 2017 Feb 8, 2016 Feb 5, 2015
Vesting period ends Dec 31, 2019 Dec 31, 2018 Dec 31, 2017
Estimated realization of earnings criteria at the beginning of earning period, % 100% 100% 100%
Number of participants in the plan 3 2 3
AMOUNT OF SHARE INCENTIVES AND TERMS AND ASSUMPTIONS IN THE FAIR VALUE CALCULATION
performance in 2015 will therefore be paid during the first quarter of 2018, bonuses for 2016 in the first quarter of 2019 and bonuses for 2017 in the first quarter of 2020.
If the targets of the plan are reached, rewards will be paid to participants after the end of the vesting period. The reward will be paid in company’s shares and as a cash payment which is intended to cover taxes and tax-related costs arising from the share reward. If all targets are reached, the maximum reward payable in shares on the basis of the 2017–2019 vest-ing period would amount to 19,606 shares, 2016–2018 vesting period would amount to 12,901 shares and the 2015–2017 vesting period would amount to 19,550 shares in the company. Shares to be awarded under the plan will be acquired in public trading arranged by Nasdaq Helsinki, and thus the share plan is not expected to have a diluting effect on the ownership of the company’s shareholders.
LONG-TERM INCENTIVE PLANS 2017–2019, 2016–2018 AND 2015–2017, SETTLED IN SHARES AND CASH
In February 2015, The Board of Directors decided on a new long-term incentive plan for the Group’s Chief Executive Officer and Chief Operating Officer. The targets for the plan are based on the company’s total shareholder return. No reward will be paid if targets are not met or if the participant’s employment ends before reward payment. Similar plans were instituted for 2016 and 2017.
The vesting period for the long-term incentive plan is three years. The bonus will be paid during the quarter following the vesting period. The bonuses for
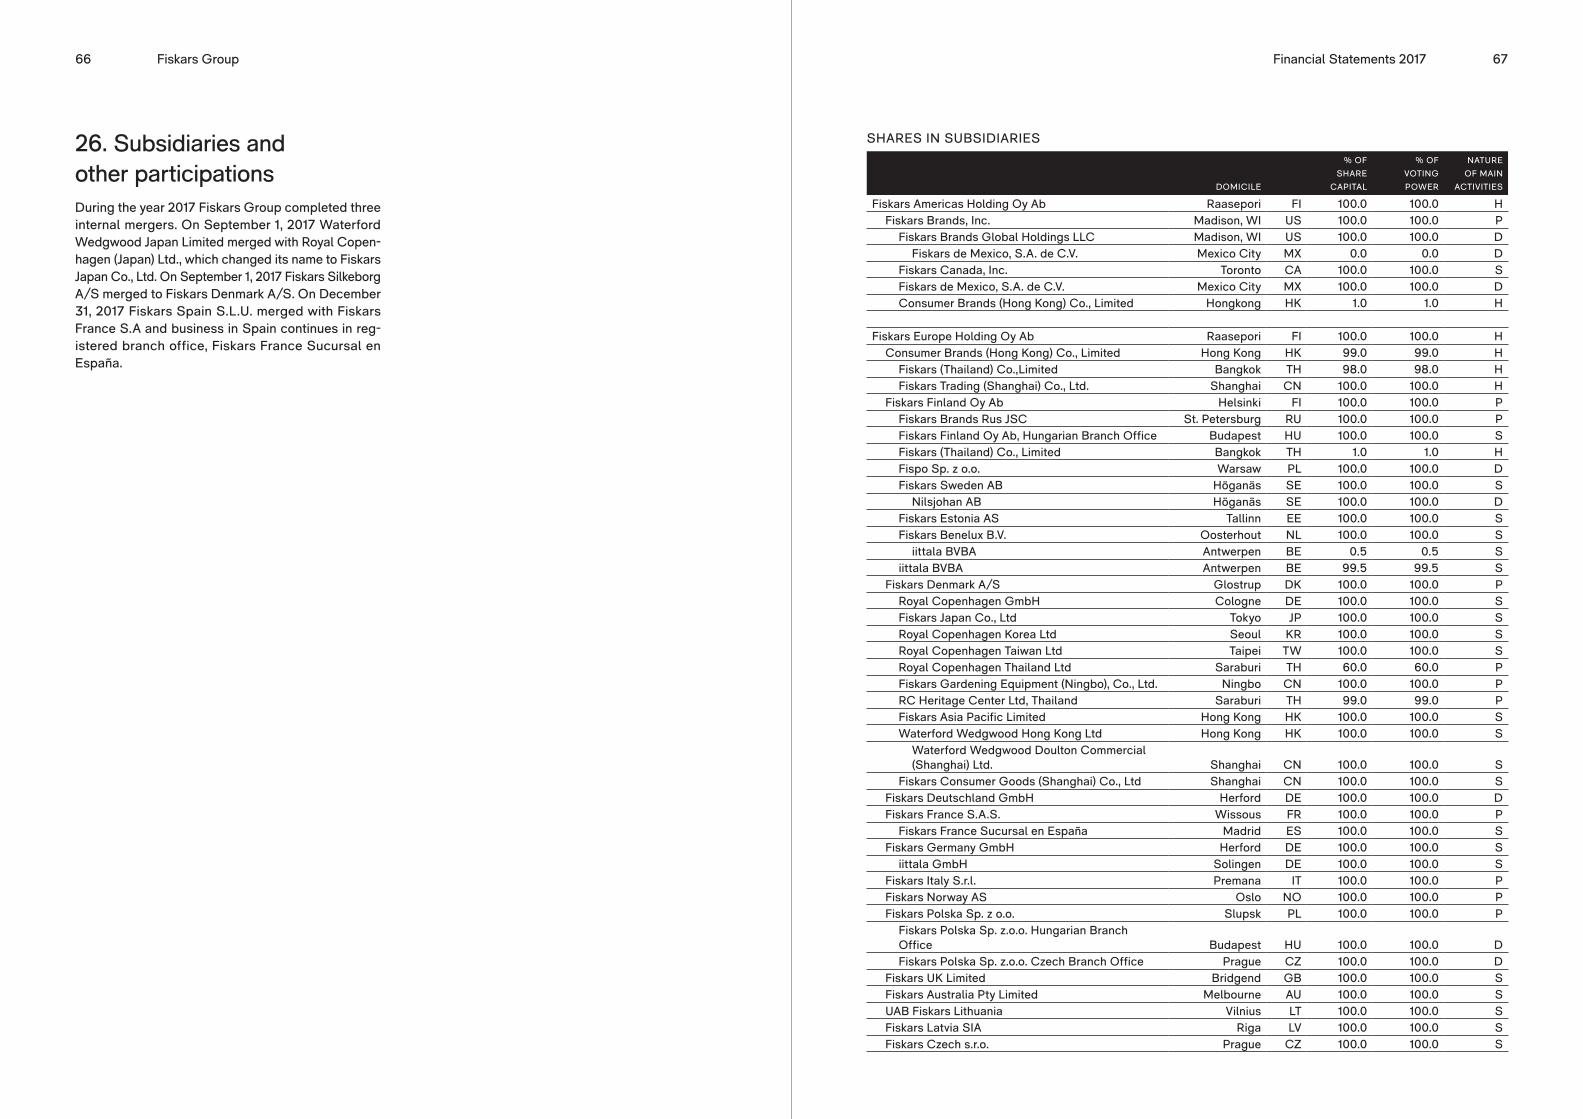
66 Fiskars Group 67Financial Statements 2017
SHARES IN SUBSIDIARIES
DOMICILE
% OF SHARE
CAPITAL
% OF VOTINGPOWER
NATUREOF MAIN
ACTIVITIES
Fiskars Americas Holding Oy Ab Raasepori FI 100.0 100.0 HFiskars Brands, Inc. Madison, WI US 100.0 100.0 P
Fiskars Brands Global Holdings LLC Madison, WI US 100.0 100.0 DFiskars de Mexico, S.A. de C.V. Mexico City MX 0.0 0.0 D
Fiskars Canada, Inc. Toronto CA 100.0 100.0 SFiskars de Mexico, S.A. de C.V. Mexico City MX 100.0 100.0 DConsumer Brands (Hong Kong) Co., Limited Hongkong HK 1.0 1.0 H
Fiskars Europe Holding Oy Ab Raasepori FI 100.0 100.0 HConsumer Brands (Hong Kong) Co., Limited Hong Kong HK 99.0 99.0 H
Fiskars (Thailand) Co.,Limited Bangkok TH 98.0 98.0 HFiskars Trading (Shanghai) Co., Ltd. Shanghai CN 100.0 100.0 H
Fiskars Finland Oy Ab Helsinki FI 100.0 100.0 PFiskars Brands Rus JSC St. Petersburg RU 100.0 100.0 PFiskars Finland Oy Ab, Hungarian Branch Office Budapest HU 100.0 100.0 SFiskars (Thailand) Co., Limited Bangkok TH 1.0 1.0 HFispo Sp. z o.o. Warsaw PL 100.0 100.0 DFiskars Sweden AB Höganäs SE 100.0 100.0 S
Nilsjohan AB Höganäs SE 100.0 100.0 DFiskars Estonia AS Tallinn EE 100.0 100.0 SFiskars Benelux B.V. Oosterhout NL 100.0 100.0 S
iittala BVBA Antwerpen BE 0.5 0.5 Siittala BVBA Antwerpen BE 99.5 99.5 S
Fiskars Denmark A/S Glostrup DK 100.0 100.0 PRoyal Copenhagen GmbH Cologne DE 100.0 100.0 SFiskars Japan Co., Ltd Tokyo JP 100.0 100.0 SRoyal Copenhagen Korea Ltd Seoul KR 100.0 100.0 SRoyal Copenhagen Taiwan Ltd Taipei TW 100.0 100.0 SRoyal Copenhagen Thailand Ltd Saraburi TH 60.0 60.0 PFiskars Gardening Equipment (Ningbo), Co., Ltd. Ningbo CN 100.0 100.0 PRC Heritage Center Ltd, Thailand Saraburi TH 99.0 99.0 PFiskars Asia Pacific Limited Hong Kong HK 100.0 100.0 SWaterford Wedgwood Hong Kong Ltd Hong Kong HK 100.0 100.0 S
Waterford Wedgwood Doulton Commercial (Shanghai) Ltd. Shanghai CN 100.0 100.0 S
Fiskars Consumer Goods (Shanghai) Co., Ltd Shanghai CN 100.0 100.0 SFiskars Deutschland GmbH Herford DE 100.0 100.0 DFiskars France S.A.S. Wissous FR 100.0 100.0 P
Fiskars France Sucursal en España Madrid ES 100.0 100.0 SFiskars Germany GmbH Herford DE 100.0 100.0 S
iittala GmbH Solingen DE 100.0 100.0 SFiskars Italy S.r.l. Premana IT 100.0 100.0 PFiskars Norway AS Oslo NO 100.0 100.0 PFiskars Polska Sp. z o.o. Slupsk PL 100.0 100.0 P
Fiskars Polska Sp. z.o.o. Hungarian Branch Office Budapest HU 100.0 100.0 DFiskars Polska Sp. z.o.o. Czech Branch Office Prague CZ 100.0 100.0 D
Fiskars UK Limited Bridgend GB 100.0 100.0 SFiskars Australia Pty Limited Melbourne AU 100.0 100.0 SUAB Fiskars Lithuania Vilnius LT 100.0 100.0 SFiskars Latvia SIA Riga LV 100.0 100.0 SFiskars Czech s.r.o. Prague CZ 100.0 100.0 S
26. Subsidiaries and other participations During the year 2017 Fiskars Group completed three internal mergers. On September 1, 2017 Waterford Wedgwood Japan Limited merged with Royal Copen-hagen (Japan) Ltd., which changed its name to Fiskars Japan Co., Ltd. On September 1, 2017 Fiskars Silkeborg A/S merged to Fiskars Denmark A/S. On December 31, 2017 Fiskars Spain S.L.U. merged with Fiskars France S.A and business in Spain continues in reg-istered branch office, Fiskars France Sucursal en España.

68 Fiskars Group 69Financial Statements 2017
Financial indicatorsFIVE YEARS IN FIGURES
* EBITA has been published only since 2016, no figures for 2013–2014 available
2017 2016 2015 2014 2013
Net sales EUR million 1,185.5 1,204.6 1,107.1 767.5 798.6of which outside Finland EUR million 1,073.1 1,102.0 849.4 632.8 657.6in percent of net sales % 90.5 81.1 76.7 82.5 82.3export from Finland EUR million 22.8 24.3 57.1 61.8 66.2
Percentage change of net sales % -1.6 8.8 44.3 -3.9 6.8Gross profit EUR million 512.2 502.9 420.2 310.4 323.2
in percent of net sales % 43.2 41.7 38.0 40.4 40.5EBITA* EUR million 113.2 96.7 62.1
in percent of net sales % 9.5 8.0 5.6Comparable EBITA* EUR million 119.0 107.1 75.7Share of profit from associate EUR million 30.0 50.8Change in fair value of biological assets EUR million 0.7 -0.5 -0.2 -0.3 0.7Financial items net EUR million 119.3 10.5 79.3 714.3 -4.2
in percent of net sales % 10.1 0.9 7.2 93.1 -0.5Profit before taxes EUR million 217.8 92.8 125.5 786.7 108.3
in percent of net sales % 18.4 7.7 11.3 102.5 13.6Income tax EUR million -50.8 -27.4 -39.2 -13.4 -14.3
Profit for the period attributable to the equity holders of the company EUR million 166.4 64.1 85.1 773.1 93.7
in percent of net sales % 14.0 5.3 7.7 100.7 11.7Non-controlling interests' share of profit EUR million 0.7 1.3 1.2 0.2 0.3Employee benefits EUR million 315.3 337.1 291.3 209.8 202.1Depreciation, amortization and impairment EUR million 38.8 37.4 42.8 28.5 29.2
in percent of net sales % 3.3 3.1 3.9 3.7 3.7Cash flow from operating activities EUR million 103.8 83.8 47.6 87.0 81.0Capital expenditure EUR million 32.8 37.6 32.4 35.0 37.5
in percent of net sales % 2.8 3.1 2.9 4.6 4.7
Research and development costs in income statement EUR million 18.8 18.0 18.0 14.6 13.3
in percent of net sales % 1.6 1.5 1.6 1.9 1.7Capitalized development costs EUR million 0.0 0.0 0.0 0.5 0.7
Equity attributable to equity holders of the company EUR million 1,269.4 1,218.1 1,190.8 1,151.9 631.8Non-controlling interest EUR million 2.8 1.9 3.3 1.3 0.9Equity total EUR million 1,272.1 1,220.1 1,194.0 1,153.2 632.7Net interest bearing liabilities EUR million 147.7 152.4 249.4 121.3 152.6Working capital EUR million 195.9 217.8 190.5 93.3 88.3Balance sheet total EUR million 1,837.9 1,760.1 1,833.3 1,589.5 1,039.1Return on investment % 15.4 6.8 8.4 73.8 15.1Return on equity % 13.4 5.4 7.4 86.6 15.0Equity ratio % 69.3 69.3 65.1 72.6 60.9Net gearing % 11.6 12.5 20.9 10.5 24.1Personnel (FTE), average 7,709 8,000 6,303 4,243 4,087Personnel, end of period 7,932 8,560 9,003 4,832 4,330
of which outside Finland 6,806 7,336 7,715 3,300 2,748
DOMICILE
% OF SHARE
CAPITAL
% OF VOTINGPOWER
NATUREOF MAIN
ACTIVITIES
Ab Åbo Båtvarf – Turun Veneveistämö Oy Turku FI 100.0 100.0 D
Avlis AB Stockholm SE 100.0 100.0 H
Fiskars (Thailand) Co.,Limited Bangkok TH 1.0 1.0 H
WWRD LuxCo S.à.r.l. Luxembourg LU 100.0 100.0 HWWRD Canada, Inc New Brunswick CA 100.0 100.0 SWWRD UK/Ireland, Ltd. Stoke-on-Trent GB 100.0 100.0 DWWRD Ireland IPCo LLC Wilmingtom, DE US 100.0 100.0 HWWRD IPCo. LLC Wilmingtom, DE US 100.0 100.0 HWedgwood/Doulton USA Acqco 1 Inc. Wilmingtom, DE US 100.0 100.0 H
Wedgwood/Doulton USA Acqco 2 Inc. Wilmingtom, DE US 100.0 100.0 HWWRD US, LLC Wilmingtom, DE US 100.0 100.0 S
WWRD United Kingdom, Ltd. Stoke-on-Trent GB 100.0 100.0 PWWRD United Kingdom, Ltd., Beijing Branch Office Beijing CN 100.0 100.0 HWWRD IPCO UK LLC Wilmingtom, DE US 100.0 100.0 H
WWRD Ireland Limited Waterford IE 100.0 100.0 PWWRD IPCO I LLC Wilmingtom, DE US 100.0 100.0 H
Steklarna Rogaška d.o.o. Rogaška Slatina SI 100.0 100.0 PSteklarski HRAM d.o.o. Rogaška Slatina SI 100.0 100.0 SRogaška Kristal d.o.o. Zagreb HR 100.0 100.0 SRogaska America Inc New York US 100.0 100.0 S
WWRD Netherlands MidCo B.V. Amsterdam NL 100.0 100.0 H
WWRD Australia Pty LtdArndell Park,
NSW AU 100.0 100.0 SWWRD Australia Pty Ltd, New Zealand Branch Auckland NZ 100.0 100.0 S
Josiah Wedgwood & Sons Pty LtdArndell Park,
NSW AU 100.0 100.0 DWaterford Wedgwood Australia Limited Stoke-on-Trent GB 100.0 100.0 D
Waterford Wedgwood Trading Singapore Pte Limited Singapore SG 100.0 100.0 H
Wedgwood Consulting Shanghai Ltd. PRC Shanghai CN 100.0 100.0 DWaterford Wedgwood (Taiwan) Limited Taipei TW 100.0 100.0 S
PT Doulton (Indonesia) Tangerang ID 96.2 96.2 P
Holding, management or services HProduction and sales P
Sales SDormant D
After the balance sheet date, no significant events have taken place within the Group.
27. Subsequent events

70 Fiskars Group 71Financial Statements 2017
Earnings before interest, taxes and amortization = Operating profit + amortization + impairment
Return on investment in % =
Profit for the period + income taxes + interest and other financial expenses
x100Equity, total + interest-bearing liabilities (average of beginning and end of year amounts)
Return on equity in % =Profit for the period
x100Equity, total(average of beginning and end of year amounts)
Equity ratio in % =Equity, total
x100Balance sheet total
Net gearing in % =
Interest-bearing liabilities – interest-bearing receivables – cash and bank
x100Equity, total
Earnings per share =Profit attributable to equity holders of the company
Weighted average number of outstanding ordinary shares
Operative earnings per share =
Profit attributable to equity holders of the company excl. gain on sale and revaluation of Wärtsilä (2014) and changes in the fair value of investments at fair value through profit or loss
Weighted average number of outstanding ordinary shares
Equity per share =Equity attributable to equity holders of the company
Number of outstanding ordinary shares
Adjusted average share price =Value of shares traded during the period
Number of shares traded during the period, adjusted for emissions
Market capitalization = Number of outstanding ordinary shares Dec 31 x market quotation Dec 31
Price per earnings (P/E) =Market quotation per share, Dec 31
Earnings per share
Dividend per earnings in % =Dividend paid
x100Profit attributable to equity holders of the company
Dividend per share =Dividend paid
Number of outstanding shares, Dec 31
Dividend yield in % =Dividend per share
x100Market quotation, Dec 31 adjusted for emissions
CALCULATION OF FINANCIAL INDICATORS
2017 2016 2015 2014 2013
Share capital EUR million 77.5 77.5 77.5 77.5 77.5
Earnings per share (basic and diluted) EUR/share 2.04 0.78 1.04 9.44 1.14
Operative earnings per share EUR/share 0.81 0.56 0.35 0.76 1.14
Dividend per share EUR/share 0.72* 0.71+0.35 0.70 0.68 3.27
Dividend EUR million 58.8 86.6 57.3 55.7 267.8
Equity per share EUR/share 15.53 14.91 14.54 14.06 7.71
Adjusted average price EUR/share 20.84 17.11 18.69 20.35 18.20
Adjusted lowest price per share EUR/share 17.67 15.00 17.30 17.33 16.20
Adjusted highest price per share EUR/share 24.00 18.74 21.07 22.30 19.70
Adjusted price per share, Dec 31 EUR/share 23.96 17.60 18.74 17.99 19.55
Market value of shares EUR million 1,957.9 1,438.2 1,534.9 1,473.5 1,601.2
Number of shares 1,000 pcs 81,905.2 81,905.2 81,905.2 81,905.2 81,905.2
Number of treasury shares 1,000 pcs 191.5 187.8
Number of shares traded 1,000 pcs 5,217.9 2,838.0 6,185.3 6,898.3 3,042.1
Price per earnings 11.8 22.5 18.0 1.9 17.1
Dividend per earnings percent 35.4 135.5 67.4 7.2 286.8
Dividend yield percent 3.0 6.0 3.7 3.8 16.7
Number of shareholders, Dec 31 19,536 18,643 18,426 17,828 16,352
SHARE RELATED FIGURES
* Board’s proposal.
Basic and diluted earnings per share are equal, as the company has no potential ordinary shares.

72 Fiskars Group 73Financial Statements 2017
ShareholdersFiskars Corporation had 19,536 (18,643) shareholders as of the end of the year. Approximately 3.2% (2.9) of the share capital was owned by shareholderss outside Finland or nominee-registered shareholders.
MANAGEMENT SHAREHOLDINGOn December 31, 2017, the Board members, the Presi-dent & CEO and the CFO and their controlled entities and their managed entities together with a family member, owned a total of 37,936,712 (36,974,284) shares corresponding to 46.4% (45.2) of the Com-pany’s shares and votes. The Company did not have any share option programs.
SHARE OWNERSHIP, DECEMBER 31, 2017NUMBER
OF SHAREHOLDERS %
NUMBER OF SHARES
AND VOTES %
Private companies 596 3.05 36,834,001 44.97
Financial and insurance institutions 21 0.11 1,721,174 2.10
Public sector organizations 8 0.04 3,690,019 4.51
Non-profit organizations 234 1.20 9,340,725 11.40
Households 18,565 95.03 27,704,382 33.83
Outside Finland 102 0.52 269,539 0.33
Nominee registered 10 0.05 2,345,402 2.86
Total 19,536 100.00 81,905,242 100.00
DISTRIBUTION OF SHARES, DECEMBER 31, 2017
NUMBER OF SHARESNUMBER OF
SHAREHOLDERS %
NUMBER OF SHARES
AND VOTES %
1–100 8,419 43.10 435,193 0.53
101–500 7,146 36.58 1,865,766 2.28
501–1,000 1,848 9.46 1,417,588 1.73
1,001–10,000 1,866 9.55 5,108,464 6.24
10,001–100,000 193 0.99 5,318,432 6.49
100,001–1,000,000 53 0.27 19,312,380 23.58
1,000,001– 11 0.06 48,447,419 59.15
Total 19,536 100.00 81,905,242 100.00
SharesFiskars Corporation’s shares are traded in the Large Cap segment of Nasdaq Helsinki. The Company has one series of shares FSKRS. All shares carry one vote each and have equal rights.
SHARE DETAILS
NUMBER OF SHARES, VOTES AND SHARE CAPITAL
Market Nasdaq HelsinkiISIN FI0009000400
Trading code FSKRS
Segment Large Cap
Industry 3000 Consumer Goods
Supersector 3700 Personal & Household Goods
Shares as of Dec 31, 2017 81,905,242
The total number of shares at the end of 2017 81,905,242 (81,905,242). The share capital remained unchanged in 2017 at EUR 77,510,200.
TREASURY SHARESAs of the end of the year, Fiskars owned 191,467 trea-sury shares, corresponding to 0.2% of the Corpora-tion’s shares and votes. The Company has acquired the shares at the Nasdaq Helsinki in accordance with the authorizations of the general meetings of the shareholders. The acquisitions have been made from March 2016 through December 2016.
BOARD AUTHORIZATIONSThe Annual General Meeting for 2017 decided to authorize the Board to acquire and convey a maximum 4,000,000 of Fiskars’ own shares. Both authorizations will remain in force until June 30, 2018.
FISKARS SHARE PRICE DEVELOPMENT, EUR, JAN 1, 2013–DEC 31, 2017
OMXH25-index
TOTAL
Total shares, Dec 31, 2013 81,905,242
Total shares, Dec 31, 2014 81,905,242
Total shares, Dec 31, 2015 81,905,242
Total shares, Dec 31, 2016 81,905,242
Total shares, Dec 31, 2017 81,905,242
Treasury shares Dec 31, 2017 191,467
CHANGES IN THE NUMBER OF SHARES, 2013–2017
FSKRS
2013 2014 2015 2016 2017
5,000
4,000
3,000
2,000
Index
25
20
15
EUR

74 Fiskars Group 75Financial Statements 2017
Parent company financialstatements, FAS
Parent company income statementEUR NOTE 2017 2016
Net sales 2 78,774,465.97 138,312,057.80
Cost of goods sold 4 -4,083,883.87 -67,483,965.52
Gross profit 74,690,582.10 95% 70,828,092.28 51%
Administration expenses 4 -54,686,247.82 -52,944,614.44
Other operating income 3 5,605,538.18 6,396,555.54
Other operating expenses 4 -42,663.81 -13,232.25
Operating profit (loss) 25,567,208.65 32% 24,266,801.13 18%
Financial income and expenses 7 1,109,946.83 612,428.56
Profit (loss) before appropriations and taxes 26,677,155.48 24,879,229.69
Appropriations
Change in cumulative accelerated depreciation 8 509,301.44 191,025.00
Group contribution -298,243.00 3,700,000.00
Income taxes 9 -2,964,523.66 -401,609.12
Profit (loss) for the financial year 23,923,690.26 28,368,645.57
MAJOR SHAREHOLDERS, DECEMBER 31, 2017TOTAL
SHARES% OF SHARES
AND VOTES
1 Virala Oy Ab 12,650,000 15.44
2 Holdix Oy Ab1) 10,165,537 12.41
3 Turret Oy Ab1) 9,330,961 11.39
4 I.A. von Julins Sterbhus 2,689,120 3.28
5 Oy Julius Tallberg Ab 2,554,350 3.12
6 Sophie von Julins Foundation 2,543,038 3.10
7 Varma Mutual Pension Insurance Company 2,469,326 3.01
8 Ehrnrooth Jacob Robert Göran1) 1,626,929 1.99
9 Ehrnrooth Sophia1) 1,558,630 1.90
10 Ilmarinen Mutual Pension Insurance Company 1,130,000 1.38
11 Wrede Anna Helena Sophie 928,684 1.13
12 Ehrnrooth Albert 855,372 1.04
13 Ehrnrooth Alexander 855,000 1.04
14 Hartwall Peter 748,450 0.91
15 Lindsay von Julin & Co Ab 733,320 0.90
16 Therman Anna Maria Elisabeth 722,436 0.88
17 Åberg Albertina 711,063 0.87
18 Gripenberg Gerda Margareta Lindsay 628,974 0.77
19 Fromond Louise1) 601,135 0.73
20 Fromond Anna1) 600,518 0.73
20 major shareholders 54,102,843 66.02
1) Turret Oy Ab and Holdix Oy Ab as well as certain closely associated persons have on December 29, 2017, entered into a co-operation concerning their ownership in Fiskars Corporation. The parties have entered into the co-operation with the purpose of acting as an engaged owner with a long-term ownership horizon focused on further developing Fiskars’ operations and shareholder value.
The co-operation comprises a shareholders’ agreement between Turret Oy Ab and Holdix Oy Ab which the closely associated persons have undertaken to comply with as applicable. The closely associated persons comprise Paul Ehrnrooth, Jacob Ehrnrooth and Sophia Ehrnrooth, all of whom are closely associated with Turret Oy Ab, as well as Elsa Fromond, Louise Fromond and Anna Fromond, all of whom are closely associated with Holdix Oy Ab.

76 Fiskars Group 77Financial Statements 2017
EUR NOTE DEC 31, 2017 DEC 31, 2016
SHAREHOLDERS’ EQUITY AND LIABILITIES
Shareholders' equity 17
Share capital 77,510,200.00 77,510,200.00
Revaluation reserve 3,747,203.44 3,774,707.40
Fair value reserve -879,829.69 -1,642,199.00
Treasury shares -3,241,742.32 -3,178,176.50
Other reserves 3,204,313.18 3,204,313.18
Retained earnings 915,257,123.97 973,505,079.90
Profit (loss) for the financial year 23,923,690.26 28,368,645.57
Shareholders’ equity total 1,019,520,958.84 75% 1,081,542,570.55 74%
Appropriations 18 509,301.44
Liabilities
Non-current 19
Loans from credit institutions 150,463,734.88 180,152,803.98
Non-current liabilities total 150,463,734.88 180,152,803.98
Current
Loans from credit institutions 37,667,335.08 4,582,389.90
Trade payables 4,413,973.37 2,320,519.43
Liabilities to subsidiaries 20 138,642,936.00 167,929,356.49
Other payables 11,077,181.24 9,134,706.39
Accruals and deferred income 21 7,511,508.44 8,057,084.91
Current liabilities total 199,312,934.13 192,024,057.12
Liabilities total 349,776,669.01 26% 372,176,861.10 26%
Shareholders’ equity and liabilities total 1,369,297,627.85 100% 1,454,228,733.09 100%
EUR NOTE DEC 31, 2017 DEC 31, 2016
ASSETS
Non-current assets
Intangible assets 10 27,005,350.97 37,568,188.42
Tangible assets 11
Land and water 36,034,654.47 15,975,550.91
Buildings 11,166,379.38 11,793,808.60
Machinery and equipment 1,721,913.57 1,296,560.30
Construction in progress 1,219,062.27 620,368.87
Tangible assets total 50,142,009.69 29,686,288.68
Investments 12
Holdings in subsidiaries 554,132,559.43 554,128,319.26
Receivables from subsidiaries 5,268,938.65 5,133,972.22
Other shares 15,472,330.86 13,592,093.80
Investments total 574,873,828.94 572,854,385.28
Non-current assets total 652,021,189.60 48 % 640,108,862.38 44%
Current assets
Inventories 13 438,575,319.06 458,736,841.98
Non-current loan receivables 79,508.74 37,368.58
Current receivables
Trade receivables 277,191.71 145,499.29
Receivables from subsidiaries 14 214,613,953.71 298,915,220.88
Other receivables 47,870,475.40 50,002,653.68
Prepayments and accrued income 15 7,442,651.61 6,225,275.59
Current receivables total 270,204,272.43 355,288,649.44
Cash and cash equivalents 16 8,417,338.02 57,010.71
Current assets total 717,276,438.25 52 % 814,119,870.71 56%
Assets total 1,369,297,627.85 100 % 1,454,228,733.09 100%
Parent company balance sheet

78 Fiskars Group 79Financial Statements 2017
EUR 2017 2016
CASH FLOW FROM INVESTING ACTIVITIES
Investments in other subsidiaries 0.00 -150,000,000.00
Proceeds from sale of subsidiaries -4,240.17 8,121,803.03
Dividends from subsidiaries, Avlis AB 0.00 400,000.00
Investments in financial assets -1,880,237.06 -6,562,806.86
Investments in intangible assets and property, plant & equipment -7,188,557.06 -6,531,637.13
Proceeds from sale of property, plant & equipment and other investments 9,597,365.70 1,976,334.99
Change in long term loan receivables -134,966.43 -133,972.22
Cash flow from investing activities (B) 389,364.98 -152,730,278.19
CASH FLOW FROM FINANCING ACTIVITIES
Purchase of treasury shares -63,565.82 -3,178,176.50
Change of non-current debt 387,384.92
Change in current debt -25,654,970.21 -30,923,248.85
Change in current receivables 80,832,053.71 185,137,508.66
Dividends paid -86,616,601.50 -57,333,669.40
Group contribution received/paid 3,401,757.00 3,941,938.00
Cash flow from financing activities (C) -27,713,941.90 97,644,351.91
Change in cash and cash equivalents (A+B+C) 8,360,327.31 -325,179.93
Cash and cash equivalents at beginning of period 57,010.71 382,190.64
Cash and cash equivalents at end of period 8,417,338.02 57,010.71
EUR 2017 2016
CASH FLOW FROM OPERATING ACTIVITIES
Profit (loss) before appropriations and taxes 26,677,155.48 24,879,229.69
Adjustments for
Depreciation, amortization and impairment 11,778,178.05 11,690,759.04
Investment income -5,141,604.69 -5,241,522.86
Interest income and dividends -16,863,741.04 -18,446,052.46
Unrealised exchange gains and losses -3,101,138.90 275,628.10
Interest expenses and other financial costs 4,107,732.36 3,867,087.18
Impairment of shares in and receivables from subsidiaries 600,885.45 632,771.42
Group contributions 298,243.00 -3,700,000.00
Change in provisions and other non-cash items 569,991.97 -952,913.66
Cash flow before changes in working capital 18,925,701.68 16,704,986.45
Changes in working capital
Change in current assets, non-interest bearing 3,568,278.79 -1,359,700.37
Change in inventories 20,161,522.92 61,030,968.99
Change in current liabilities, non-interest bearing -15,801,400.05 -3,251,056.53
Cash flow from operating activities before financial items and taxes 26,854,103.34 73,125,198.54
Dividends received 14,146,393.30 13,058,212.20
Financial income received 3,093,618.87 5,141,873.78
Financial expenses paid -4,196,564.16 -3,813,201.78
Taxes paid -4,212,647.12 -32,751,336.39
Cash flow from operating activities (A) 35,684,904.23 54,760,746.35
Parent company statement of cash flows

80 Fiskars Group 81Financial Statements 2017
TANGIBLE AND INTANGIBLE ASSETS AND OTHER LONG-TERM INVESTMENTS
Tangible and intangible assets are stated at cost less accumulated depreciation according to plan. Certain land holdings have been revalued.
Revaluations are based on market values at time of the revaluation. Revaluation reserves are adjusted for decreases in the market value of land holdings. When revalued real estate is sold, the respective share in the revaluation reserve is transferred to retained earnings.
Tangible and intangible assets are depreciated and amortized over their expected useful lives. The fol-lowing expected useful lives are applied:
• Intangible assets 3–10 years• Buildings 20–40 years• Vehicles 4 years• Machinery and equipment 3–10 years• Land and water No depreciation
Investments in subsidiaries are stated in the balance sheet at cost or at net realizable value if the net real-izable value is significantly and permanently impaired. An impairment loss may be reversed until the original acquisition cost, when the value of the investment has been restored.
2. Net sales
3. Other operating income
INVENTORIESInventories are stated at the lower of cost and net realizable value. Cost includes both direct and indi-rect costs. Cost is determined on a first-in first-out (FIFO) basis. Net realizable value is the estimated selling price in the ordinary course of business less the estimated costs of completion and the estimated costs necessary to make the sale. Financial assets in inventories are stated at the lower of cost and fair value.
RECEIVABLESReceivables are valued at the lower of book value and recoverable value.
PROVISIONSProvisions are recognised when the group has a present legal or constructive obligation as a result of past events, it is probable that an outflow of resources will be required to settle the obligation and a reliable estimate of the amount of the obligation can be made. These are booked as provisions in Balance sheet and as corresponding items in Income statement.
APPROPRIATIONSAppropriations in the parent company balance sheet consist of depreciation in excess of plan and possible given or received group contributions.
EUR 2017 2016
Sale of financial assets in inventories 61,738,835.02
Dividends from financial assets in inventories 14,146,315.30 13,058,137.20
IC Service fee 35,032,214.28 34,653,063.00
Royalties 23,941,542.64 23,900,217.67
Lease income 1,851,807.52 1,838,835.51
Other 3,802,586.23 3,122,969.40
Total 78,774,465.97 138,312,057.80
EUR 2017 2016
Net gain on sale of property, plant and equipment 3,960,475.50 549,503.48
Net gain on sale of subsidiary shares and related provisions 1,223,793.00 4,702,101.89
Merger result from Ferraria Ab and Danskog Gård Ab 977,059.45
Other income 421,269.68 167,890.72
Total 5,605,538.18 6,396,555.54
Notes to the parent company financial statements
The financial statements of Fiskars Corporation have been prepared in accordance with the Finnish Accounting Act and Ordinance and other statutes regulating the preparation of financial statements (Finnish Accounting Standards, FAS). The financial statements are presented in euro.
The preparation of financial statements in confor-mity with regulations in force and generally accepted accounting principles requires management to make estimates and assumptions that affect the valuation of assets and liabilities and reported amounts of revenues and expenses. Actual results could differ from those estimates.
COMPARABILITY OF THE PREVIOUS FINANCIAL YEAR DATA
On December 31, 2016, Ferraria Oy Ab and Kiinteistö Oy Danskog Gård, subsidiaries of Fiskars Corporation, merged into the parent company, which has an impact on the comparability of the balance sheet. Forests have been transferred from inventories to tangible assets between 2016 and 2017.
TRANSACTIONS IN FOREIGN CURRENCIES
Transactions in foreign currencies are recorded at the rates of exchange prevailing at the date of the trans-action. At the end of the reporting period balances in foreign currencies are translated using the exchange rate prevailing at the end of the reporting period. For-eign exchange derivatives are recognized at market values and changes in market values are recognized in the income statement.
NET SALESNet sales are defined as invoiced amount less indirect taxes, rebates and exchange rate differences related to sales. Revenue is recognized when all significant risks and rewards of ownership have been transferred to the buyer, i.e. when a product has been delivered
to the client in accordance with the terms of delivery. Royalty income from trademarks held by Fiskars Cor-poration is recorded as net sales. Revenue from the sale of securities, dividends and other correspond-ing income from securities classified as inventories and other income such as service revenue are also recorded as net sales.
LEASING ARRANGEMENTSLease payments are expensed as incurred. Future leasing payment obligations are reported as contin-gent liabilities. Rent income, when the company acts as a lessor, is recorded as net sales.
PENSION BENEFIT PLANSThe statutory and possible supplementary pension plans for the Finnish companies’ employees are funded through payments to independent pension insurance companies.
INCOME TAXESIncome taxes consist of the aggregate current tax expense based on the Finnish tax rules and adjust-ments to prior year taxes. The parent company does not account for deferred taxes as a stand-alone entity.
DERIVATIVES AND HEDGE ACCOUNTINGDerivatives not designated as hedging instruments are recognized at fair value through profit and loss. Deriva-tives are initially valued at cost and subsequently at fair value determined at the end of each reporting period. The fair value of derivatives is based on prevailing market rates or rates derived from the prevailing mar-ket rates at the end of the reporting period. Fair value changes are recognized in financial items.
Fiskars has applied hedge accounting to changes in the fair value of derivatives designated, qualifying, and effective as cash flow hedges. The changes are recog-nized in fair value reserve in equity. On balance sheet date, such derivatives consisted of interest derivatives hedging certain loans.
1. Parent companyaccounting principles, FAS

82 Fiskars Group 83Financial Statements 2017
EUR 2017 2016
Dividend income
From group companies 400,000.00
From other parties 78.00 75.00
Dividend income, total 78.00 400,075.00
Interest and financial income from non-current investments
From group companies 3,691,482.69 6,990,816.31
Interest and financial income from non-current investments, total 3,691,482.69 6,990,816.31
Other interest and financial income
From other parties 2,909,159.00 716,738.05
Other interest and financial income, total 2,909,159.00 716,738.05
Interest and financial income, total 6,600,641.69 7,707,554.36
Interest and other financial expenses
To subsidiaries
Interest expenses -308,343.75 -238,309.55
Change in provisions for credit losses -600,885.45 -632,771.42
Interest and other financial expenses to other parties -4,581,543.66 -6,624,119.83
Interest and other financial expenses, total -5,490,772.86 -7,495,200.80
Total financial income and expenses 1,109,946.83 612,428.56
Net exchange gains and losses included in financial items 3,101,138.90 -275,628.10
EUR 2017 2016
Change in cumulative accelerated depreciation 509,301.44 191,025.00
Group contribution received 3,700,000.00
Group contribution paid -298,243.00
Total 211,058.44 3,891,025.00
EUR 2017 2016
Current year taxes for profit before appropriations -2,877,649.11 -1,274,957.42
Tax for approriations -42,211.69 -778,205.00
Income tax for previous periods -44,662.86 1,651,553.30
Income taxes per income statement -2,964,523.66 -401,609.12
7. Financial income and expenses
8. Appropriations
9. Income taxes
EUR 2017 2016
Materials and supplies -37,630.63 -9,671.60
Change in inventory -61,030,968.99
Employee benefits -17,002,118.09 -19,794,206.91
Depreciation, amortization and impairment -11,778,178.00 -11,690,759.04
IT expenses -10,999,897.24 -7,751,931.31
Consulting fees -6,269,723.39 -6,429,293.55
External services -2,901,666.28 -2,835,266.84
Other -9,780,918.06 -10,886,481.72
Total -58,770,131.69 -120,428,579.96
EUR 2017 2016
Audit fees -140,000.00 -120,000.00
Tax consultation -659,250.66 -552,186.63
Other -135,817.20 -145,413.87
Total -935,067.86 -817,600.50
EUR 2017 2016
Wages and salaries -14,107,224.32 -16,045,477.50
Pension costs -2,259,553.78 -2,773,109.60
Other personnel costs -635,339.99 -975,619.81
Total -17,002,118.09 -19,794,206.91
EUR 2017 2016
Average (FTE) 165 182
End of period 157 187
EUR 2017 2016
Loss on sale of property. plant and equipment -28,575.87 -10.082.51
Scrap of fixed assets -14,087.94
To subsidiaries -3.149.74
Total -42,663.81 -13.232.25
TOTAL EXPENSES BY NATURE
PERSONNEL COSTS
NUMBER OF EMPLOYEES
OTHER OPERATING EXPENSES
4. Total expenses
5. Fees paid to the company’s auditors
6. Personnel costs and number of employees

84 Fiskars Group 85Financial Statements 2017
12. Investments
EUR
HOLDINGSIN
SUBSIDIARIES
RECEIVABLESFROM
SUBSIDIARIESOTHER
SHARES TOTAL
Historical cost, Jan 1 646,528,319.26 5,133,972.22 14,396,815.26 666,059,106.74
Additions 0.00 134,966.43 1,880,237.06 2,015,203.49
Decreases 4,240.17 0.00 0.00 4,240.17
Historical cost, Dec 31 646,532,559.43 5,268,938.65 16,277,052.32 668,078,550.40
Write-downs, Jan 1 -92,400,000.00 0.00 -804,721.46 -93,204,721.46
Write-downs, Dec 31 -92,400,000.00 0.00 -804,721.46 -93,204,721.46
Net book value, Dec 31, 2017 554,132,559.43 5,268,938.65 15,472,330.86 574,873,828.94
EUR
LANDAND
WATER BUILDINGS
MACHINERYAND
EQUIPMENT
CONSTRUCTIONIN
PROGRESS TOTAL
Historical cost, Jan 1 5,863,753.70 37,063,651.28 5,717,308.75 529,817.78 49,174,531.51
Transferred in a merger* 343,622.23 487,069.99 830,692.22
Additions 54,909.05 430,305.46 178,328.81 298,850.45 962,393.77
Decreases -15,810.46 -5,860,690.83 -324,017.18 -6,200,518.47
Transfers 27,629.99 53,768.05 106,267.62 -208,299.36 -20,633.70
Historical cost, Dec 31 6,274,104.51 32,174,103.95 5,677,888.00 620,368.87 44,746,465.33
Accumulated depreciation and impairment, Jan 1 23,507,505.86 4,468,747.32 27,976,253.18
Transferred in a merger* 355,750.20 355,750.20
Depreciation for the period 1,003,130.91 201,829.19 1,204,960.10
Decreases -4,486,091.62 -289,248.81 -4,775,340.43
Accumulated depreciation and impairment, Dec 31 20,380,295.35 4,381,327.70 24,761,623.05
Revaluation, Jan 1 9,713,182.38 9,713,182.38
Decreases -11,735.98 -11,735.98
Revaluation, Dec 31 9,701,446.40 9,701,446.40
Book value Dec 31, 2016 15,975,550.91 11,793,808.60 1,296,560.30 620,368.87 29,686,288.68
2017
2016
* Ferraria Oy Ab and Kiinteistö Oy Danskog gård, subsidiaries of Fiskars Corporation, merged to Fiskars Corporation on December 31, 2016.
EUR 2017 2016
Historical cost, Jan 1 70,401,314.87 64,761,719.48
Transferred in a merger* 49,718.33
Additions 5,316,447.96 5,569,243.36
Decrease -7,249,799.33
Transfers 3,833.56 20,633.70
Historical cost, Dec 31 68,471,797.06 70,401,314.87
Accumulated amortization and impairment, Jan 1 32,833,126.45 22,347,327.51
Amortization for the period 10,417,923.94 10,485,798.94
Decrease -1,784,604.32
Accumulated amortization and impairment, Dec 31 41,466,446.07 32,833,126.45
Net book value, Dec 31 27,005,350.97 37,568,188.42
10. Intangible assets
11. Tangible assets
* Ferraria Oy Ab and Kiinteistö Oy Danskog gård, subsidiaries of Fiskars Corporation, merged to Fiskars Corporation on December 31, 2016.
EUR
LANDAND
WATER BUILDINGS
MACHINERYAND
EQUIPMENT
CONSTRUCTIONIN
PROGRESS TOTAL
Historical cost, Jan 1 6,274,104.51 32,174,103.95 5,677,888.00 620,368.87 44,746,465.33
Additions 775,978.26 1,096,130.84 1,872,109.10
Decreases -74,915.40 -107,386.13 -331,016.70 -513,318.23
Transfers 20,161,522.92 463,369.79 30,234.09 -497,437.44 20,157,689.36
Historical cost, Dec 31 26,360,712.03 32,530,087.61 6,153,083.65 1,219,062.27 66,262,945.56
Accumulated depreciation and impairment, Jan 1 20,380,295.35 4,381,327.70 24,761,623.05
Depreciation for the period 1,088,990.99 271,263.07 1,360,254.06
Decreases -105,578.11 -221,420.69 -326,998.80
Accumulated depreciation and impairment, Dec 31 21,363,708.23 4,431,170.08 25,794,878.31
Revaluation, Jan 1 9,701,446.40 9,701,446.40
Decreases -27,503.96 -27,503.96
Revaluation, Dec 31 9,673,942.44 9,673,942.44
Book value Dec 31, 2017 36,034,654.47 11,166,379.38 1,721,913.57 1,219,062.27 50,142,009.69
2017

86 Fiskars Group 87Financial Statements 2017
*Financial assets in inventories consist of Wärtsilä shares.
EUR 2017 2016
Finished goods 20,161,522.92
Financial assets* 438,575,319.06 438,575,319.06
Total, Dec 31 438,575,319.06 458,736,841.98
EUR 2017 2016
Trade receivables 5,232,906.45 7,175,667.22
Loan receivables 108,268,904.05 124,330,098.93
Other receivables 99,072,610.62 161,021,390.82
Prepayments and accrued income 2,039,532.59 6,388,063.91
Total, Dec 31 214,613,953.71 298,915,220.88
EUR 2017 2016
Prepaid and accrued interest 1,430,983.54 1,798,917.04
Other prepayments and accruals 6,011,668.07 4,426,358.55
Total, Dec 31 7,442,651.61 6,225,275.59
EUR 2017 2016
Cash and cash equivalents 8,417,338.02 57,010.71
Total, Dec 31 8,417,338.02 57,010.71
EUR 2017 2016
Market value of financial assets in inventories 572,381,680.60 464,434,413.08
Book value of financial assets in inventories 438,575,319.06 438,575,319.06
Difference 133,806,361.54 25,859,094.02
13. Inventories
14. Receivables from subsidiaries
15. Prepayments and accrued income
16. Cash and cash equivalents
EUR
HOLDINGSIN
SUBSIDIARIES
RECEIVABLESFROM
SUBSIDIARIESOTHER
SHARES TOTAL
Historical cost, Jan 1 516,742,031.96 5,000,000.00 7,796,431.02 529,538,462.98
Additions 149,031,217.22 133,972.22 6,562,806.86 155,727,996.30
Decreases -1,080,701.14 -1,080,701.14
Changes due to merger* -18,164,228.78 37,577.38 -18,126,651.40
Historical cost, Dec 31 646,528,319.26 5,133,972.22 14,396,815.26 666,059,106.74
Write-downs, Jan 1 -92,400,000.00 -804,721.46 -93,204,721.46
Write-downs, Dec 31 -92,400,000.00 -804,721.46 -93,204,721.46
Net book value, Dec 31, 2016 554,128,319.26 5,133,972.22 13,592,093.80 572,854,385.28
NUMBEROF
SHARES DOMICILE
% OF SHARE
CAPITAL
% OF VOTINGPOWER
BOOK VALUE
Avlis AB 25,641,347 Stockholm SE 100.0 100.0 375,994.66
Fiskars Americas Holding Oy Ab 1,000 Raasepori FI 100.0 100.0 110,071,862.76
Fiskars Europe Holding Oy Ab 1,000 Raasepori FI 100.0 100.0 163,678,555.99
Fiskars (Thailand) Co., Ltd. 100 Bangkok TH 1.0 1.0 2,409.12
WWRD LuxCo S.à.r.l. 10,000 Luxembourg LU 100.0 100.0 280,001,214.08
Ab Åbo Båtvarf – Turun Veneveistämö Oy 150 Turku FI 100.0 100.0 2,522.82
Total Dec 31, 2017 554,132,559.43
BOOK VALUE
Other shares and funds owned by the parent company 15,472,330.86
Total, Dec 31, 2017 15,472,330.86
2016
SHARES IN SUBSIDIARIES
OTHER SHARES
* Ferraria Oy Ab and Kiinteistö Oy Danskog gård, subsidiaries of Fiskars Corporation, merged to Fiskars Corporation on December 31, 2016.

88 Fiskars Group 89Financial Statements 2017
EUR 2017 2016
Trade payables 1,314,457.31 412,507.33
Other liabilities 137,016,199.83 167,461,374.97
Accruals and deferred income 312,278.86 55,474.19
Total, Dec 31 138,642,936.00 167,929,356.49
EUR 2017 2016
Interests 1,322,053.42 1.419.374.75
Wages, salaries and social costs 3,299,683.16 5.247.416.79
Other 2,889,771.86 1.390.293.37
Total, Dec 31 7,511,508.44 8.057.084.91
EUR 2017 2016
Payments next year 1,942,973.41 1,061,703.13
Payments later 5,421,007.21 7,941,250.24
Total, Dec 31 7,363,980.62 9,002,953.37
EUR 2017 2016
As security for own commitments 10,861,000.00 14,136,000.00
Lease commitments 7,363,980.62 9,002,953.37
Guarantees as security for subsidiaries' commitments 19,918,070.00 19,110,000.00
Total, Dec 31 38,143,050.62 42,248,953.37
NOMINAL VALUE, EUR 2017 2016
Foreign exchange forwards and swaps 470,420,548.56 542,780,845.04
Interest rate swaps 80,000,000.00 80,000,000.00
Total, Dec 31 550,420,548.56 622,780,845.04
FAIR VALUE, EUR 2017 2016
Foreign exchange forwards and swaps -2,539,498.89 527,577.93
Interest rate swaps -879,829.69 -1,642,198.52
Total, Dec 31 -3,419,328.58 -1,114,620.59
20. Liabilities to subsidiaries
21. Accruals and deferred income
22. Lease obligations
23. Contingencies and pledged assets
24. Derivative contracts
EUR 2017 2016
Share capital, Jan 1 77,510,200.00 77,510,200.00
Share capital, Dec 31 77,510,200.00 77,510,200.00
Revaluation reserve, Jan 1 3,774,707.40 3,786,443.38
Decrease -27,503.96 -11,735.98
Revaluation reserve, Dec 31 3,747,203.44 3,774,707.40
Fair value reserve, Jan 1 -1,642,199.00 0.00
Decrease 762,369.31 -1,642,199.00
Fair value reserve, Dec 31 -879,829.69 -1,642,199.00
Treasury shares, Jan 1 -3,178,176.50 0.00
Increase -63,565.82 -3,178,176.50
Treasury shares, Dec 31 -3,241,742.32 -3,178,176.50
Other reserves, Jan 1 3,204,313.18 3,204,313.18
Other reserves, Dec 31 3,204,313.18 3,204,313.18
Retained earnings, Jan 1 1,001,873,725.47 1,030,815,329.73
Dividends -86,616,601.50 -57,333,669.40
Other changes 23,419.57
Net profit 23,923,690.26 28,368,645.57
Retained earnings, Dec 31 939,180,814.23 1,001,873,725.47
Distributable earnings, Dec 31 935,059,242.22 997,053,349.97
Shareholders' equity total, Dec 31 1,019,520,958.84 1,081,542,570.55
EUR 2017 2016
Loans from credit institutions payable
between one and five years 120,463,734.88 130,152,803.98
in more than five years 30,000,000.00 50,000,000.00
Loans from credit institutions, total 150,463,734.88 180,152,803.98
Non-current liabilities, total 150,463,734.88 180,152,803.98
EUR 2017 2016
Depreciation in excess of plan, Jan 1 509,301.44 700,326.44
Changes during the year -509,301.44 -191,025.00
Depreciation in excess of plan, Dec 31 0.00 509,301.44
17. Shareholders’ equity
19. Non-current liabilities
18. Appropriations
The deferred tax liabilities, 20.0% from appropriations, have not been recognized.

90 Fiskars Group 91Financial Statements 2017
Board’s proposal fordistribution of profitsand signaturesThe distributable earnings of the parent company at the end of the 2017 fiscal year were EUR 935.1 million (2016: 997.1). The Board of Directors proposes to the Annual General Meeting that a dividend of EUR 0.72 per share shall be paid for 2017. The number of shares entitling to a dividend totaled 81,713.775. The proposed distribution of dividend would thus be EUR 58.8 million. This would leave EUR 876.2 million of distributable earnings at the parent company.
No material changes have taken place in the financial position of the company since the end of the fiscal year. The financial standing of the company is good and, according to the Board of Directors’ assessment, dis-tributing the proposed dividend will not compromise the company’s solvency.
Helsinki, February 6, 2018
ALEXANDER EHRNROOTH
LOUISE FROMOND
INGRID JONASSON BLANK
INKA MERO
PETER SJÖLANDER
JAANA TUOMINENPresident and CEO
PAUL EHRNROOTH
GUSTAF GRIPENBERG
JYRI LUOMAKOSKI
FABIAN MÅNSSON
RITVA SOTAMAA
SIGNATURES TO THE FINANCIAL STATEMENTS AND THE BOARD OF DIRECTORS’ REPORT
THE AUDITOR’S NOTEOur auditor’s report has been issued today.
Helsinki, February 6, 2018KPMG Oy Ab
VIRPI HALONENAuthorized Public Accountant, KHT
Auditor’s ReportTo the Annual General Meeting of Fiskars Corporation
REPORT ON THE AUDIT OF THE FINANCIAL STATEMENTS
OpinionWe have audited the financial statements of Fiskars Corporation (business identity code 0214036-5) for the year ended 31 December, 2017. The finan-cial statements comprise the consolidated balance sheet, income statement, statement of comprehensive income, statement of changes in equity, statement of cash flows and notes, including a summary of significant accounting policies, as well as the parent company’s balance sheet, income statement, state-ment of cash flows and notes.
In our opinion• the consolidated financial statements give a true
and fair view of the group’s financial position, financial performance and cash flows in accor-dan ce with International Financial Reporting Stan d ards (IFRS) as adopted by the EU
• the financial statements give a true and fair view of the parent company’s financial performance and financial position in accordance with the laws and regulations governing the preparation of financial statements in Finland and comply with statutory requirements.
Our opinion is consistent with the additional report submitted to the Audit Committee.
Basis for OpinionWe conducted our audit in accordance with good auditing practice in Finland. Our responsibilities under good auditing practice are further described in the Auditor’s Responsibilities for the Audit of the Financial Statements section of our report.
We are independent of the parent company and of the group companies in accordance with the eth-ical requirements that are applicable in Finland and are relevant to our audit, and we have fulfilled our other ethical responsibilities in accordance with these requirements.
In our best knowledge and understanding, the non-audit services that we have provided to the parent
company and group companies are in compliance with laws and regulations applicable in Finland regarding these services, and we have not provided any pro-hibited non-audit services referred to in Article 5(1) of regulation (EU) 537/2014. The non-audit services that we have provided have been disclosed in note 6 to the consolidated financial statements.
We believe that the audit evidence we have obtained is sufficient and appropriate to provide a basis for our opinion.
MaterialityThe scope of our audit was influenced by our appli-cation of materiality. The materiality is determined based on our professional judgement and is used to determine the nature, timing and extent of our audit procedures and to evaluate the effect of identified mis-statements on the financial statements as a whole. The level of materiality we set is based on our assessment of the magnitude of misstatements that, individually or in aggregate, could reasonably be expected to have influence on the economic decisions of the users of the financial statements. We have also taken into account misstatements and/or possible misstatements that in our opinion are material for qualitative reasons for the users of the financial statements.
Key Audit MattersKey audit matters are those matters that, in our pro-fessional judgment, were of most significance in our audit of the financial statements of the current period. These matters were addressed in the context of our audit of the financial statements as a whole, and in forming our opinion thereon, and we do not provide a separate opinion on these matters. The significant risks of material misstatement referred to in the EU Regulation No 537/2014 point (c) of Article 10(2) are included in the description of key audit matters below.
We have also addressed the risk of management override of internal controls. This includes consider-ation of whether there was evidence of management bias that represented a risk of material misstatement due to fraud.

92 Fiskars Group 93Financial Statements 2017
THE KEY AUDIT MATTER HOW THE MATTER WAS ADDRESSED IN THE AUDIT
REVENUE RECOGNITION – CONSOLIDATED ACCOUNTING PRINCIPLES AND NOTE 2
• The Group’s net sales (2017: €1,186 million) is a significant item in the financial statements consisting of a large number of transactions as well as diverse pricing and rebate agreements.
• Revenue from the sale of goods is recognized when all significant risks and rewards of ownership have been transferred to the buyer, i.e. when a product has been delivered to the client in accordance with the terms of delivery.
• Revenue recognition includes the risk of revenue being recognized in incorrect period as well as management judgments on appropriate accounting for adjustments related to both customer and sales campaign specific rebates and provisions.
• We have evaluated the appropriateness of the company’s revenue recognition policies with relation to the principles of revenue recognition determined in IFRS.
• We have reviewed relevant IT systems and the internal control environment in the sales process to ensure appropriateness of recognizing sales transactions and price changes.
• In addition, we have performed substantive procedures to different revenue streams in the perspective of completeness and accuracy and assessed the transactions, which require management judgment.
Responsibilities of the Board of Directors and the President and CEO for the Financial Statements
The Board of Directors and the President and CEO are responsible for the preparation of consolidated financial statements that give a true and fair view in accordance with International Financial Report-ing Standards (IFRS) as adopted by the EU, and of financial statements that give a true and fair view in accordance with the laws and regulations governing the preparation of financial statements in Finland and comply with statutory requirements. The Board of Directors and the President and CEO are also responsible for such internal control as they determine is necessary to enable the preparation of financial statements that are free from material misstatement, whether due to fraud or error.
In preparing the financial statements, the Board of Directors and the President and CEO are responsible for assessing the parent company’s and the group’s ability to continue as going concern, disclosing, as applicable, matters relating to going concern and using the going concern basis of accounting. The financial statements are prepared using the going concern basis of accounting unless there is an inten-tion to liquidate the parent company or the group or cease operations, or there is no realistic alternative but to do so.
Auditor’s Responsibilities for the Audit of Financial Statements
Our objectives are to obtain reasonable assurance on whether the financial statements as a whole are free from material misstatement, whether due to fraud or
error, and to issue an auditor’s report that includes our opinion. Reasonable assurance is a high level of assurance, but is not a guarantee that an audit con-ducted in accordance with good auditing practice will always detect a material misstatement when it exists. Misstatements can arise from fraud or error and are considered material if, individually or in aggregate, they could reasonably be expected to influence the economic decisions of users taken on the basis of the financial statements.
As part of an audit in accordance with good audit-ing practice, we exercise professional judgment and maintain professional skepticism throughout the audit. We also:
• Identify and assess the risks of material misstate-ment of the financial statements, whether due to fraud or error, design and perform audit proce-dures responsive to those risks, and obtain audit evidence that is sufficient and appropriate to provide a basis for our opinion. The risk of not detecting a material misstatement resulting from fraud is higher than for one resulting from error, as fraud may involve collusion, forgery, intentional omissions, misrepresentations, or the override of internal control.
• Obtain an understanding of internal control relevant to the audit in order to design audit procedures that are appropriate in the circum-stances, but not for the purpose of expressing an opinion on the effectiveness of the parent company’s or the group’s internal control.
• Evaluate the appropriateness of accounting
THE KEY AUDIT MATTER HOW THE MATTER WAS ADDRESSED IN THE AUDIT
VALUATION OF GOODWILL – CONSOLIDATED ACCOUNTING PRINCIPLES AND NOTE 11
• The goodwill in the consolidated balance sheet totals to €222 million due to significant acquisitions in previous years.
• Goodwill is tested for impairment annually. Estimating future cash flows in impairment tests involves a significant amount of management judgment particularly on growth in net sales, profitability and discount rates.
• The Company prepares impairment testing of goodwill for the financial statements on a discounted cash flow method basis with sensitivity analyses.
• We have assessed critically management’s judgments and assumptions, which have been used to prepare the cash flow projections for the coming years.
• We have used our valuation specialists for evaluating the appropriateness of used discount rate and the technical correctness of the calculations as well as used assumptions with relation to market and industry-specific information.
• In addition, we have evaluated the adequacy of sensitivity analyses and the appropriate presentation of notes related to impairment testing of goodwill in the notes of financial statements.
VALUATION OF TRADEMARKS – CONSOLIDATED ACCOUNTING PRINCIPLES AND NOTE 11
• Trademarks arisen from acquisitions amount to €217 million in the consolidated balance sheet.
• Based on company’s determination, the benefits from trademarks are indefinite and thus they are not amortized but are tested at least annually for impairment.
• The Company prepares impairment testing of trademarks for the financial statements using “relief from royalty” method. Estimating future cash flows in impairment tests involves a significant amount of management judgment particularly on trademark-specific sales and discount rates.
• We have assessed critically management’s judgments and assumptions, which have been used to prepare the cash flow projections for the coming years.
• We have used our valuation specialists for eva-luating the appropriateness of used assumptions and the discount rate as well as the technical correctness of the calculations.
• In addition, we have evaluated the adequacy of sensitivity analyses and the appropriate presentation of notes related to impairment testing of trademarks in the notes of financial statements.
VALUATION OF INVENTORY – CONSOLIDATED ACCOUNTING PRINCIPLES AND NOTE 16
• The Group manufactures and sells consumer products and is subject to changing consumer demands.
• Valuation of inventories requires management judgment on future sales and to assess the appropriate level of provisioning for products which may be destroyed or sold below cost as a result of a change in consumer demand.
• For both finished goods and raw materials, we have evaluated the basis for the valuation of inventory, the consistency of applying accounting policies and practices as well as the rationale for the recording of individual inventory provisions.
• Based on aforementioned procedures, we have assessed whether both finished goods and raw materials inventory provisions have been prepared in line with group policy and are supportable on the basis of historical trends as well as management’s expectations on future sales.

94 Fiskars Group 95Financial Statements 2017
policies used and the reasonableness of accounting estimates and related disclosures made by management.
• Conclude on the appropriateness of the Board of Directors’ and the President and CEO’s use of the going concern basis of accounting and based on the audit evidence obtained, whether a material uncertainty exists related to events or conditions that may cast significant doubt on the parent company’s or the group’s ability to continue as a going concern. If we conclude that a material uncertainty exists, we are required to draw attention in our auditor’s report to the related disclosures in the financial statements or, if such disclosures are inadequate, to modify our opinion. Our conclusions are based on the audit evidence obtained up to the date of our auditor’s report. However, future events or conditions may cause the parent company or the group to cease to continue as a going concern.
• Evaluate the overall presentation, structure and content of the financial statements, including the disclosures, and whether the financial statements represent the underlying transactions and events so that the financial statements give a true and fair view.
• Obtain sufficient appropriate audit evidence regarding the financial information of the entities or business activities within the group to express an opinion on the consolidated financial statements. We are responsible for the direction, supervision and performance of the group audit. We remain solely responsible for our audit opinion.
We communicate with those charged with governance regarding, among other matters, the planned scope and timing of the audit and significant audit findings, including any significant deficiencies in internal control that we identify during our audit.
We also provide those charged with governance with a statement that we have complied with relevant ethical requirements regarding independence, and com-municate with them all relationships and other matters that may reasonably be thought to bear on our inde-pendence, and where applicable, related safeguards.
From the matters communicated with those charged with governance, we determine those mat-ters that were of most significance in the audit of the financial statements of the current period and are therefore the key audit matters. We describe these matters in our auditor’s report unless law or regulation precludes public disclosure about the matter or when, in extremely rare circumstances, we determine that
a matter should not be communicated in our report because the adverse consequences of doing so would reasonably be expected to outweigh the public interest benefits of such communication.
OTHER REPORTING REQUIREMENTS
Information on our audit engagementWe were appointed as auditors by the annual general meeting and we have been the company’s auditors for at least 50 years. Virpi Halonen, Authorised Public Accountant, KHT, has been the responsible auditor since the Annual General Meeting March 16, 2011.
Other InformationThe Board of Directors and the President and CEO are responsible for the other information. The other information comprises the report of the Board of Directors and the information included in in the Annual Report, but does not include the financial statements and our auditor’s report thereon. We have obtained the report of the Board of Directors prior to the date of this auditor’s report, and the Annual Report is expected to be made available to us after that date. Our opinion on the financial statements does not cover the other information.
In connection with our audit of the financial state-ments, our responsibility is to read the other information identified above and, in doing so, consider whether the other information is materially inconsistent with the financial statements or our knowledge obtained in the audit, or otherwise appears to be materially misstated. With respect to the report of the Board of Directors, our responsibility also includes considering whether the report of the Board of Directors has been prepared in accordance with the applicable laws and regulations.
In our opinion, the information in the report of the Board of Directors is consistent with the information in the financial statements and the report of the Board of Directors has been prepared in accordance with the applicable laws and regulations.
If, based on the work we have performed on the other information that we obtained prior to the date of this auditor’s report, we conclude that there is a material misstatement of this other information, we are required to report that fact. We have nothing to report in this regard.
Helsinki 6 February, 2018KPMG OY AB
VIRPI HALONENAuthorised Public Accountant, KHT
Fiskars Group
FISKARS CORPORATIONHämeentie 135 A, P.O. Box 130FI-00561 Helsinki, Finland
Telephone +358 204 3910