making a quantum leap with continuous analytics-based qa
TRANSCRIPT
Making a Quantum Leap with Continuous Analytics-Based QA By correlating analytics data across the IT lifecycle, enterprises can design and implement a level of testing that improves predictive mechanisms and anticipates ever-changing business needs.
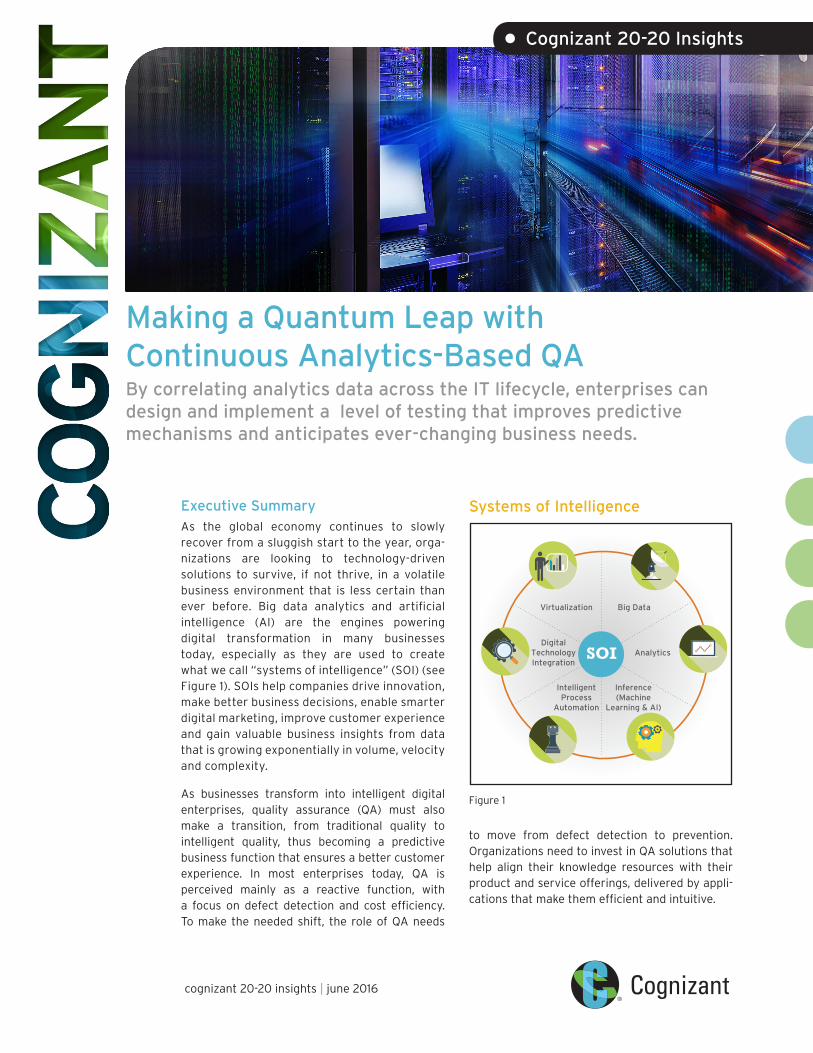
Executive SummaryAs the global economy continues to slowly recover from a sluggish start to the year, orga-nizations are looking to technology-driven solutions to survive, if not thrive, in a volatile business environment that is less certain than ever before. Big data analytics and artificial intelligence (AI) are the engines powering digital transformation in many businesses today, especially as they are used to create what we call “systems of intelligence” (SOI) (see Figure 1). SOIs help companies drive innovation, make better business decisions, enable smarter digital marketing, improve customer experience and gain valuable business insights from data that is growing exponentially in volume, velocity and complexity.
As businesses transform into intelligent digital enterprises, quality assurance (QA) must also make a transition, from traditional quality to intelligent quality, thus becoming a predictive business function that ensures a better customer experience. In most enterprises today, QA is perceived mainly as a reactive function, with a focus on defect detection and cost efficiency. To make the needed shift, the role of QA needs
to move from defect detection to prevention. Organizations need to invest in QA solutions that help align their knowledge resources with their product and service offerings, delivered by appli-cations that make them efficient and intuitive.
cognizant 20-20 insights | june 2016
• Cognizant 20-20 Insights
Systems of Intelligence
SOI
Virtualization Big Data
Analytics
Inference(Machine
Learning & AI)
IntelligentProcess
Automation
DigitalTechnologyIntegration
Figure 1
cognizant 20-20 insights 2
According to the Standish Group’s 2015 Chaos Report, 24% of medium-sized software projects are likely to fail, and 17% of large ini-tiatives are likely to miss their targets.1 In many ways, this statistic could be seen as synonymous with traditional software QA, where teams work in different groups on various activities, with each unit relying on its predecessor and successor to complete a set of tasks. Traditional QA models, however, are giving
way to modern techniques, in which enterprises capture information and data across multiple customer interactions and harvest the data for insights. The result: sophisticated QA workflow automation techniques that reduce human effort and greatly improve the likelihood of software project success.
Data and information empower organizations to interact rapidly, change course, address critical business challenges and implement a responsive QA strategy for a seamless customer experience – all of which were impossible until recently. This white paper offers an explanation for how data can be leveraged for intelligent and predictive QA, which we refer to as quality insight (QI).
Quality Insight Powers Transformative QA SolutionsQI is a transformative approach to QA that optimizes testing by identifying and focusing on predicted failure modes and unearthing potential defects that were not previously anticipated.
Recent incidents that have affected businesses punctuate the need for QI:
• In late August 2015, HSBC suffered a system failure that resulted in 275,000 individual payments not being made, leaving many people without pay during a critical holiday weekend.2 Less than a week into 2016, a two-day outage at the bank left millions of customers unable to access their accounts online.3
• Juniper Networks reported in December 2015 the discovery of unauthorized software in an operating system functioning inside its firewalls.4
• Automotive majors Nissan and Toyota recalled more than 11 million vehicles globally (through May 2015) due to defective airbags supplied by partner Takata.5
These types of incidents can be averted through the use of QI, which turns testing and quality engineering into a predictive business function that ensures a superior customer experience and drives desired business outcomes. Analytics can help detect quality deficiencies at an early stage of the project and predict their impact so that corrective steps can be made in advance. In the application lifecycle, QI is leveraged for better test planning, optimized test execution, early defect detection and defect prediction, which changes how QA is performed.
As digital businesses are transformed by new-age concepts such as Agile and DevOps – in which reducing the cost of quality is an imperative – the QA function needs to be able to predict code quality. (For more on Agile and DevOps, please see our whitepaper “Jump-starting DevOps with Continuous Testing.”) As a result, QA will need to shift left, shift right and shift deep to support organizational goals.
• Shift left is the practice of focusing on quality from day one of a project in order to identify and fix defects as they arise. It also indicates the continuous involvement of QA in the early phases of the software development lifecycle.
• Shift right is the practice of focusing on quality post-deployment by collaborating with the operations function. This helps the organi-zation understand customer-facing issues and use feedback to predict and prevent issues in early phases of the lifecycle.
• Shift deep refers to QI, wherein QA teams use root-cause analysis to perform functions such as examining the relationship between defect detection and independent variables. By combining these concepts and driving analytics across the lifecycle, enterprises can accelerate time-to-market and reduce manual effort.
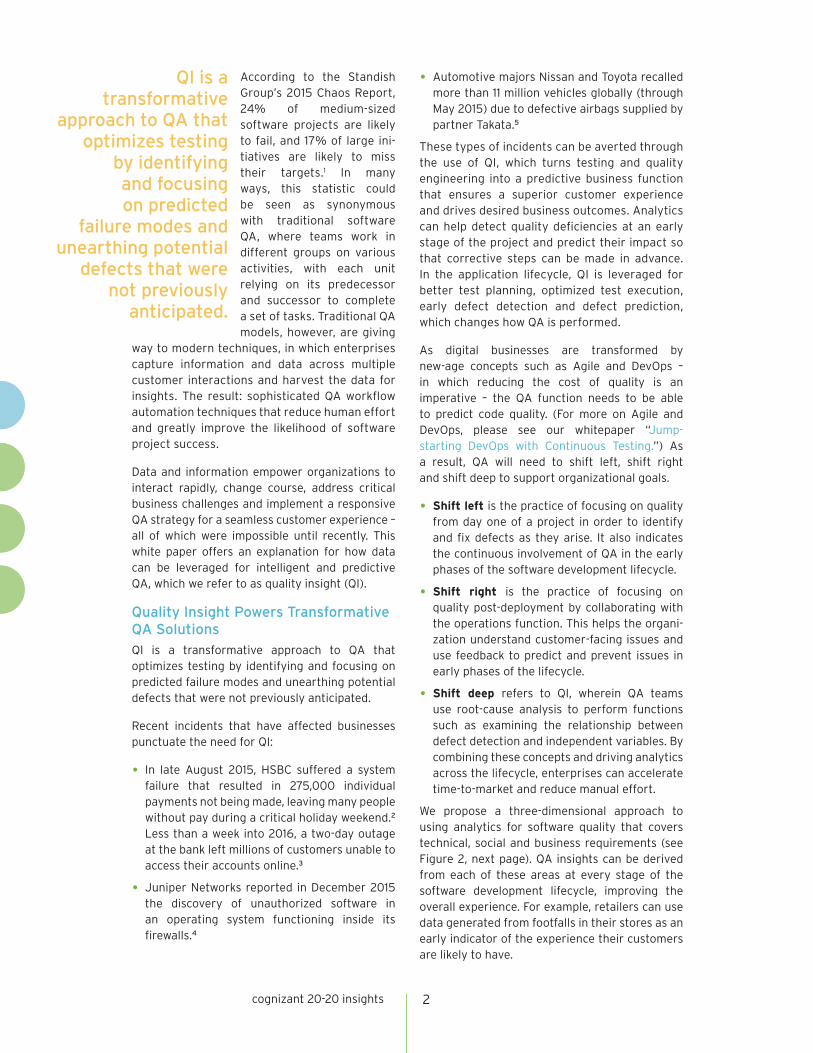
We propose a three-dimensional approach to using analytics for software quality that covers technical, social and business requirements (see Figure 2, next page). QA insights can be derived from each of these areas at every stage of the software development lifecycle, improving the overall experience. For example, retailers can use data generated from footfalls in their stores as an early indicator of the experience their customers are likely to have.
QI is a transformative
approach to QA that optimizes testing
by identifying and focusing on predicted
failure modes and unearthing potential
defects that were not previously
anticipated.
cognizant 20-20 insights 3
Comprehending Technical InsightsSoftware development is continuously evolving, and developers are always seeking new ways to improve software delivery. Modern techniques such as machine learning can help to gather buried insights from swaths of data, often in voluminous technical minutiae.
In the real world, Google Car and Netflix are examples of applications that deploy machine learning technology. Technical insights include gathering, analyzing and visualizing information from multiple data sources, employing machine learning techniques, and using them to improve productivity.
For example, code visualization techniques can help unearth violations of best practices during
the coding process and reduce bugs before deployment in live applications. Below, we lay out the various aspects of technical insights.
Insights Gleaned from Software Development
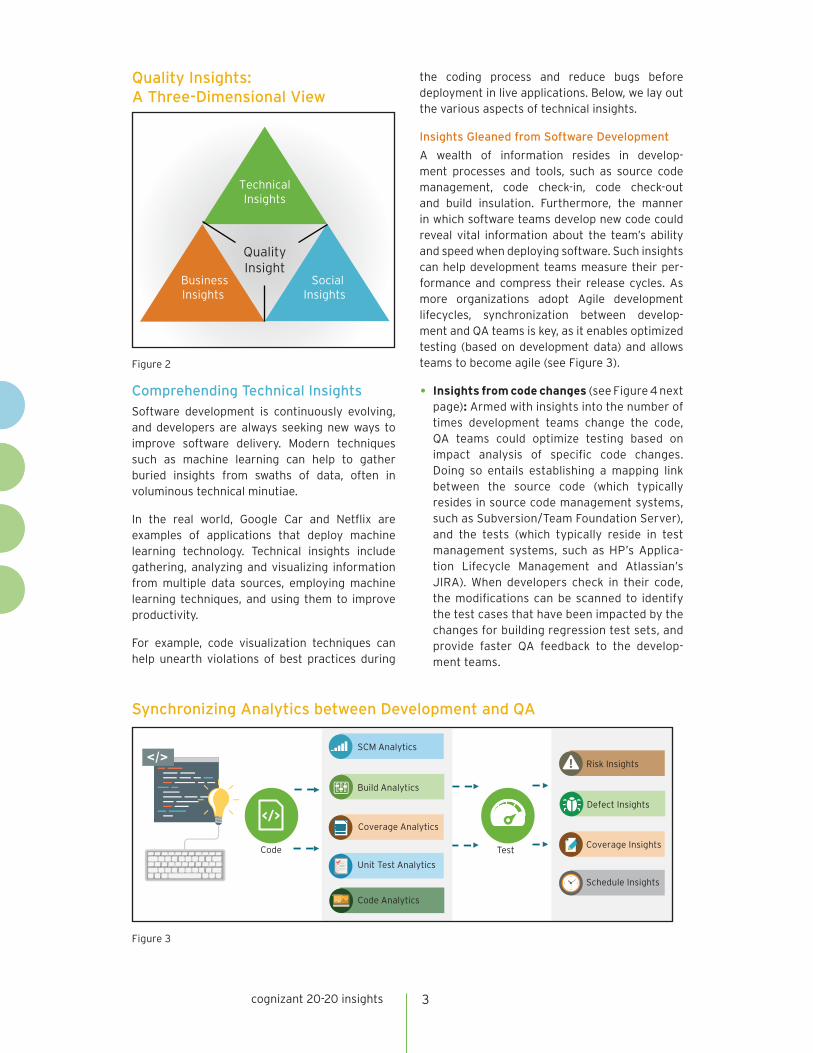
A wealth of information resides in develop-ment processes and tools, such as source code management, code check-in, code check-out and build insulation. Furthermore, the manner in which software teams develop new code could reveal vital information about the team’s ability and speed when deploying software. Such insights can help development teams measure their per-formance and compress their release cycles. As more organizations adopt Agile development lifecycles, synchronization between develop-ment and QA teams is key, as it enables optimized testing (based on development data) and allows teams to become agile (see Figure 3).
• Insights from code changes (see Figure 4 next page): Armed with insights into the number of times development teams change the code, QA teams could optimize testing based on impact analysis of specific code changes. Doing so entails establishing a mapping link between the source code (which typically resides in source code management systems, such as Subversion/Team Foundation Server), and the tests (which typically reside in test management systems, such as HP’s Applica-tion Lifecycle Management and Atlassian’s JIRA). When developers check in their code, the modifications can be scanned to identify the test cases that have been impacted by the changes for building regression test sets, and provide faster QA feedback to the develop-ment teams.
Synchronizing Analytics between Development and QA
Figure 3
SCM Analytics
Build Analytics
Coverage Analytics
Unit Test Analytics
Code Analytics
Risk Insights
Defect Insights
Coverage Insights
Schedule Insights
</>
Code Test
TechnicalInsights
BusinessInsights
SocialInsights
QualityInsight
Quality Insights: A Three-Dimensional View
Figure 2
cognizant 20-20 insights 4
• Insights from build systems: Build systems such as Jenkins can reveal information on the size of the build, the number of components in the build, and successful deployment of the build from the code. QA analysts can draw insights from the build log on the number of build failures and trends, and visualize software delivery pipelines. This can help the QA team design effective test cases and enable continuous delivery.
• Insights from source code management: Source code management systems, such as Subversion/Team Foundation Server, can be leveraged for analytics. This entails gathering data on the number of configuration items impacted, the history of past defects from such configuration items, and relationships (or lack thereof) of changes to code with initial drivers, such as requirements or defects. Furthermore, the team can examine source code check-in and check-out logs to design optimized test suites.
Insights captured from all three stages provide QA teams with a fine-grained view of code quality from a white-box perspective, in a way that does
not disturb the work of developers, as well as for fine-tuning black-box testing. This is especially true in projects that implement continuous inte-gration processes.
Scaling Testing Insights
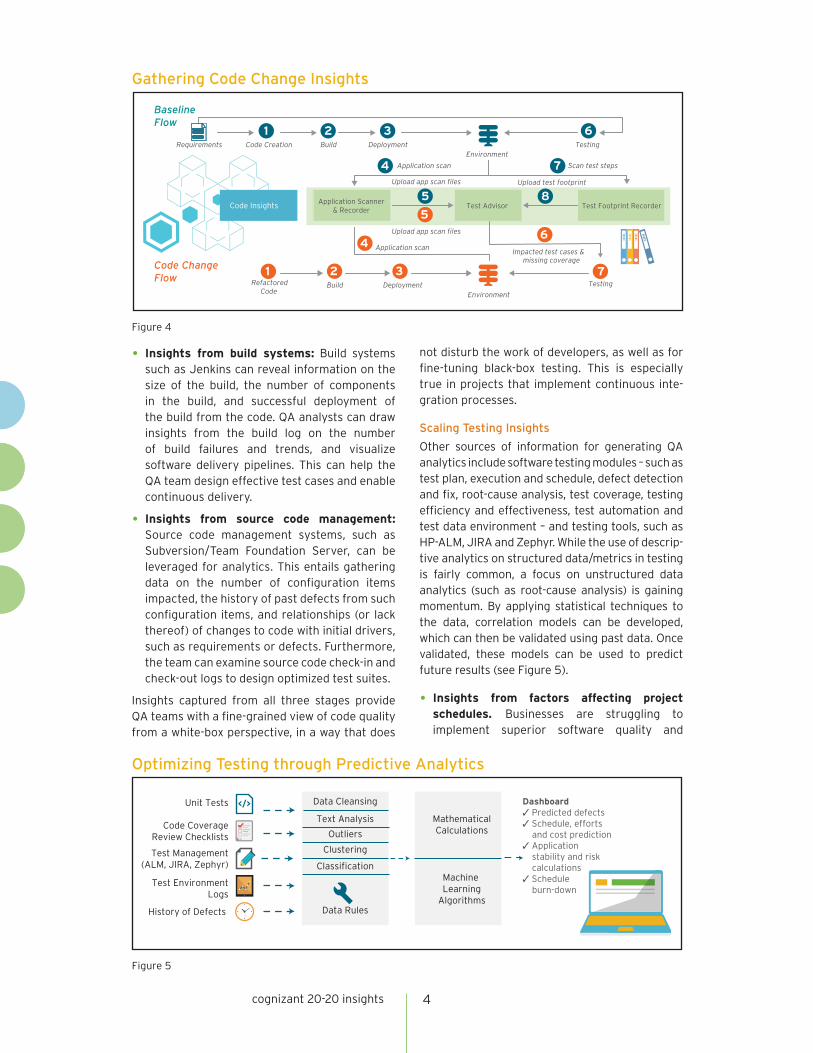
Other sources of information for generating QA analytics include software testing modules – such as test plan, execution and schedule, defect detection and fix, root-cause analysis, test coverage, testing efficiency and effectiveness, test automation and test data environment – and testing tools, such as HP-ALM, JIRA and Zephyr. While the use of descrip-tive analytics on structured data/metrics in testing is fairly common, a focus on unstructured data analytics (such as root-cause analysis) is gaining momentum. By applying statistical techniques to the data, correlation models can be developed, which can then be validated using past data. Once validated, these models can be used to predict future results (see Figure 5).
• Insights from factors affecting project schedules. Businesses are struggling to implement superior software quality and
Gathering Code Change Insights
Figure 4
Requirements Code Creation Build Deployment Environment
Testing
Application scan
Application Scanner& Recorder
Test Advisor
Upload app scan files Upload test footprint
Scan test steps
Refactored Code
Build Deployment Environment
Testing
Application scan
Upload app scan files
Impacted test cases & missing coverage
Code ChangeFlow
Code Insights Test Footprint Recorder
1 2 3
5
6
4 7
8
1 2 3
4
5
6
7
BaselineFlow
Optimizing Testing through Predictive Analytics
Figure 5
</>
Outliers
Text Analysis
Clustering
Classification
Data Rules
Machine Learning
Algorithms
Data Cleansing
MathematicalCalculationsCode Coverage
Review Checklists
Test Management(ALM, JIRA, Zephyr)
Unit Tests
Test EnvironmentLogs
History of Defects
Dashboard✓ Predicted defects ✓ Schedule, efforts
and cost prediction✓ Application
stability and risk calculations
✓ Schedule burn-down
cognizant 20-20 insights 5
speed time to market at a reduced cost. By efficiently managing key factors (such as frequent changes in requirements, environment/application downtime, code drop delays, code quality, defects and retesting), they can realize invaluable oppor-tunities, but they are often not within the control of testing teams.
Using prior test execution history (e.g., from systems such as HP-ALM or JIRA), QA teams can derive models of how all key factors affect test schedules. These models can then help them perform a what-if analysis and provide early indications of schedule over-runs, as well as prescriptive suggestions for remediating such issues.
• Insights from defects. Inputs such as defect history data, unit test, build, code review and test management data can be used to create the best algorithms to leverage as the statisti-cal model for predicting defects. The algorithm also takes into account the frequency of these defects, and captures recurring patterns of defects to predict defect occurrence. Appli-cation stability is influenced by a variety of factors, such as code quality, requirements and test coverage, environment topology and defect density. It can be a tedious and error-prone process to correlate these factors to identify their impact on application stability. However, teams can use statistical analysis to derive the appropriate combination of factors or influencers that will have the maximum impact on application stability.
• Insights from test optimizations. Tradi-tional test optimization techniques based on orthogonal arrays or graph theory techniques have given way to advanced AI techniques,
such as natural language processing (NLP). This is effective when creating legacy unstruc-tured or manual test cases, which are scanned and reverse-engineered using NLP to generate the optimal number of structured test cases that provide maximum test coverage with minimal test steps. These optimized test cases could then be converted into automated test cases for future recurring use.
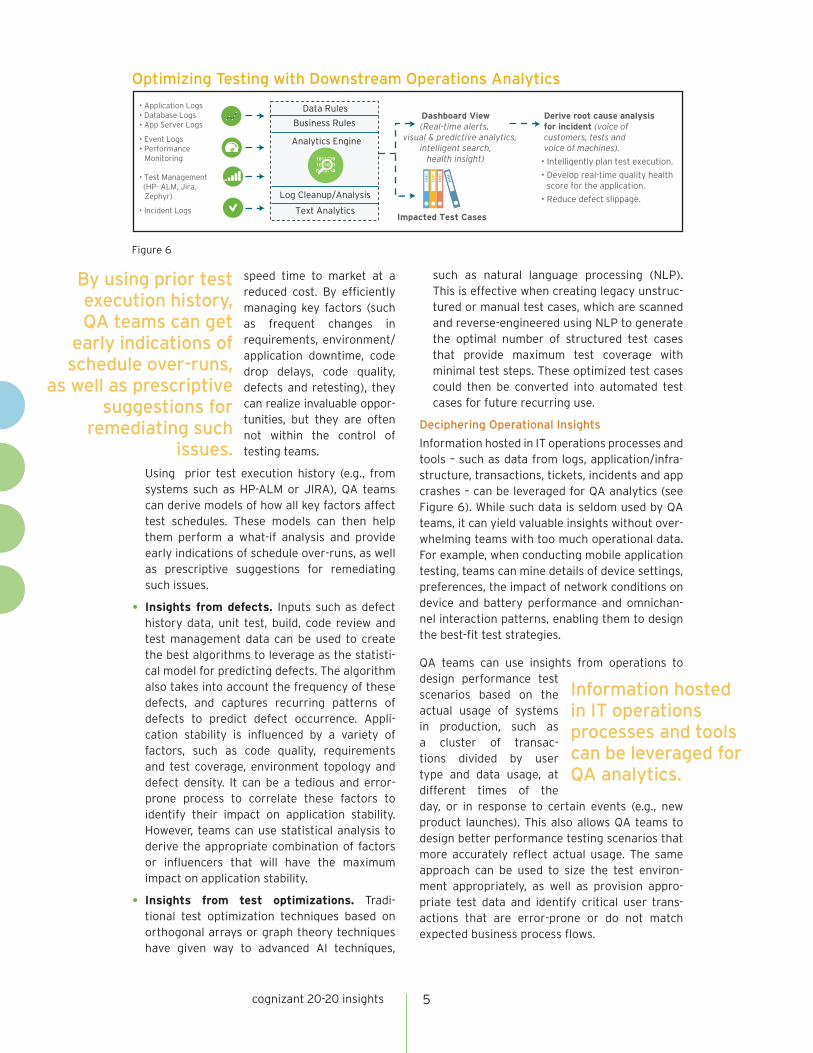
Deciphering Operational Insights
Information hosted in IT operations processes and tools – such as data from logs, application/infra-structure, transactions, tickets, incidents and app crashes – can be leveraged for QA analytics (see Figure 6). While such data is seldom used by QA teams, it can yield valuable insights without over-whelming teams with too much operational data. For example, when conducting mobile application testing, teams can mine details of device settings, preferences, the impact of network conditions on device and battery performance and omnichan-nel interaction patterns, enabling them to design the best-fit test strategies.
QA teams can use insights from operations to design performance test scenarios based on the actual usage of systems in production, such as a cluster of transac-tions divided by user type and data usage, at different times of the day, or in response to certain events (e.g., new product launches). This also allows QA teams to design better performance testing scenarios that more accurately reflect actual usage. The same approach can be used to size the test environ-ment appropriately, as well as provision appro-priate test data and identify critical user trans-actions that are error-prone or do not match expected business process flows.
Optimizing Testing with Downstream Operations Analytics
Figure 6
• Application Logs• Database Logs• App Server Logs
• Event Logs• Performance
Monitoring
• Test Management (HP- ALM, Jira,
Zephyr)
• Incident Logs
Data Rules
Business Rules
Log Cleanup/Analysis
Text Analytics
Analytics Engine
Dashboard View(Real-time alerts,
visual & predictive analytics, intelligent search,
health insight)
Impacted Test Cases
Derive root cause analysis for incident (voice of customers, tests and voice of machines).
• Intelligently plan test execution.
• Develop real-time quality health score for the application.
• Reduce defect slippage.
By using prior test execution history, QA teams can get
early indications of schedule over-runs,
as well as prescriptive suggestions for
remediating such issues.
Information hosted in IT operations processes and tools can be leveraged for QA analytics.
cognizant 20-20 insights 6
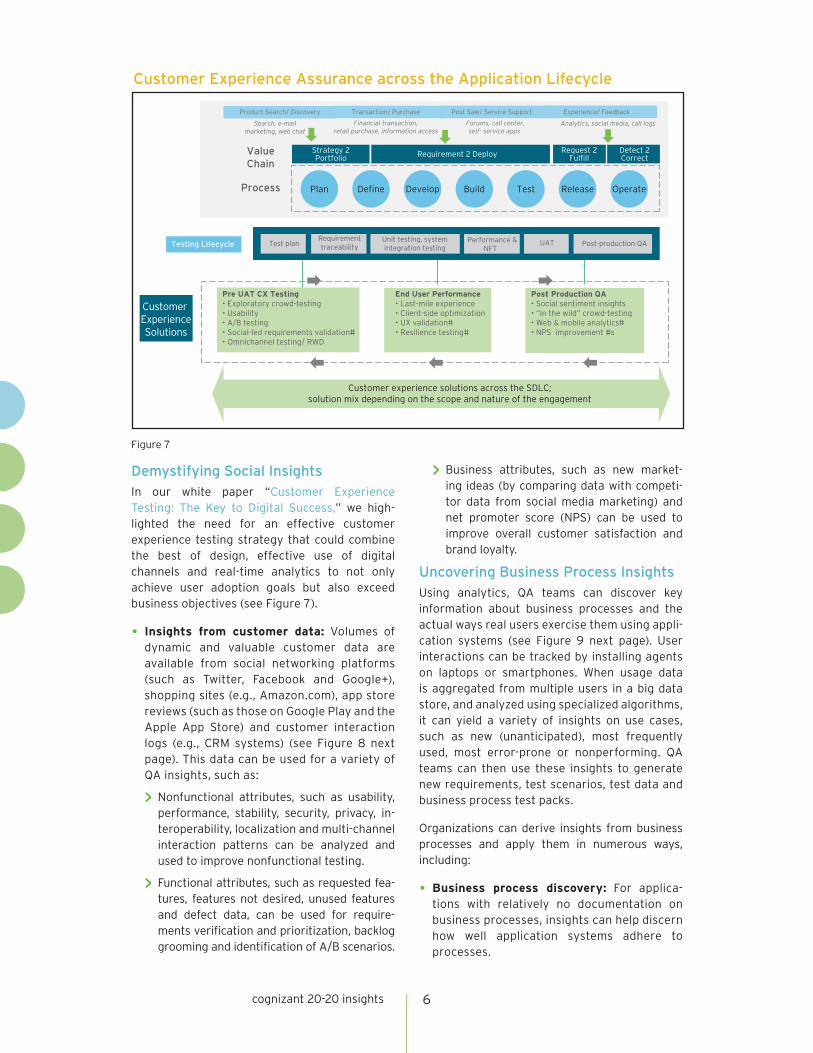
Demystifying Social InsightsIn our white paper “Customer Experience Testing: The Key to Digital Success,” we high-lighted the need for an effective customer experience testing strategy that could combine the best of design, effective use of digital channels and real-time analytics to not only achieve user adoption goals but also exceed business objectives (see Figure 7).
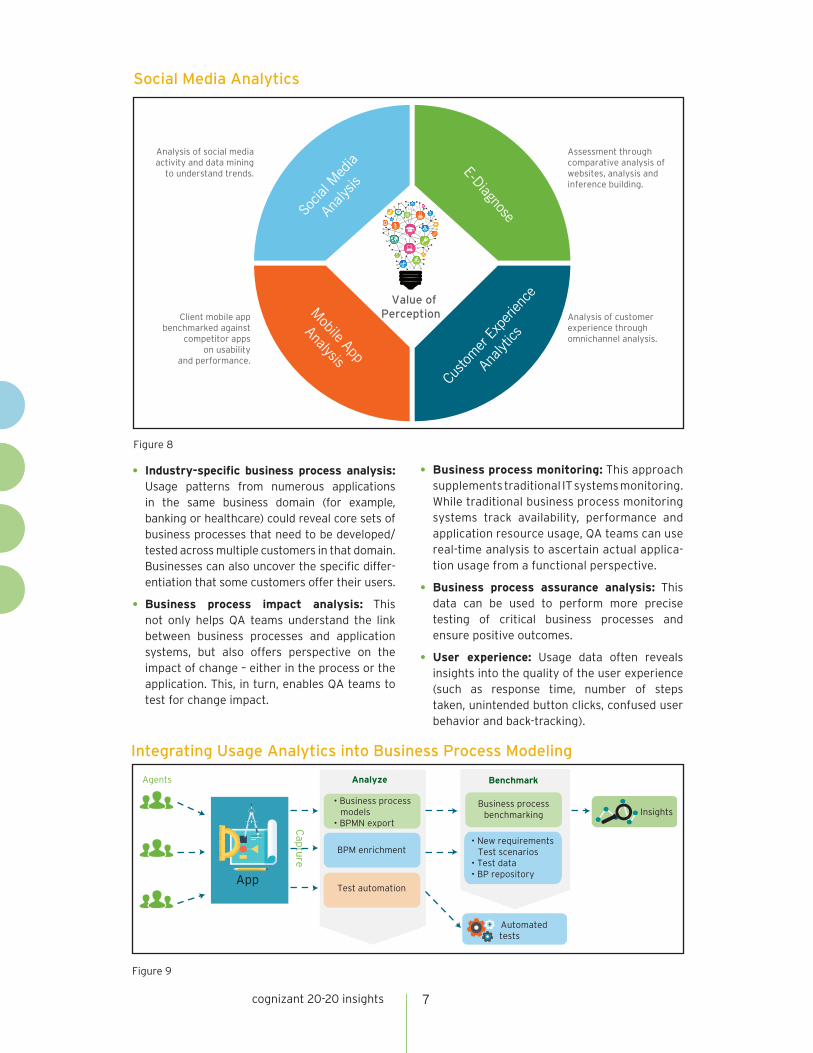
• Insights from customer data: Volumes of dynamic and valuable customer data are available from social networking platforms (such as Twitter, Facebook and Google+), shopping sites (e.g., Amazon.com), app store reviews (such as those on Google Play and the Apple App Store) and customer interaction logs (e.g., CRM systems) (see Figure 8 next page). This data can be used for a variety of QA insights, such as:
> Nonfunctional attributes, such as usability, performance, stability, security, privacy, in-teroperability, localization and multi-channel interaction patterns can be analyzed and used to improve nonfunctional testing.
> Functional attributes, such as requested fea-tures, features not desired, unused features and defect data, can be used for require-ments verification and prioritization, backlog grooming and identification of A/B scenarios.
> Business attributes, such as new market-ing ideas (by comparing data with competi-tor data from social media marketing) and net promoter score (NPS) can be used to improve overall customer satisfaction and brand loyalty.
Uncovering Business Process InsightsUsing analytics, QA teams can discover key information about business processes and the actual ways real users exercise them using appli-cation systems (see Figure 9 next page). User interactions can be tracked by installing agents on laptops or smartphones. When usage data is aggregated from multiple users in a big data store, and analyzed using specialized algorithms, it can yield a variety of insights on use cases, such as new (unanticipated), most frequently used, most error-prone or nonperforming. QA teams can then use these insights to generate new requirements, test scenarios, test data and business process test packs.
Organizations can derive insights from business processes and apply them in numerous ways, including:
• Business process discovery: For applica-tions with relatively no documentation on business processes, insights can help discern how well application systems adhere to processes.
Customer Experience Assurance across the Application Lifecycle
Figure 7
Product Search/ Discovery Post Sale/ Service Support Experience/ Feedback Transaction/ Purchase
Test plan Unit testing, systemintegration testing
Performance &NFT
Requirementtraceability
UAT Post-production QA
Post Production QA• Social sentiment insights• “In the wild” crowd-testing• Web & mobile analytics# • NPS improvement #s
End User Performance • Last-mile experience • Client-side optimization• UX validation#• Resilience testing#
Pre UAT CX Testing• Exploratory crowd-testing• Usability• A/B testing• Social-led requirements validation#• Omnichannel testing/ RWD
Testing Lifecycle
Customer ExperienceSolutions
ValueChain
Process
Customer experience solutions across the SDLC; solution mix depending on the scope and nature of the engagement
Test Release OperatePlan
Strategy 2Portfolio Requirement 2 Deploy Request 2
FulfillDetect 2Correct
Define Develop Build
Analytics, social media, call logsForums, call center,self- service apps
Financial transaction,retail purchase, information access
Search, e-mailmarketing, web chat
cognizant 20-20 insights 7
• Industry-specific business process analysis: Usage patterns from numerous applications in the same business domain (for example, banking or healthcare) could reveal core sets of business processes that need to be developed/tested across multiple customers in that domain. Businesses can also uncover the specific differ-entiation that some customers offer their users.
• Business process impact analysis: This not only helps QA teams understand the link between business processes and application systems, but also offers perspective on the impact of change – either in the process or the application. This, in turn, enables QA teams to test for change impact.
• Business process monitoring: This approach supplements traditional IT systems monitoring. While traditional business process monitoring systems track availability, performance and application resource usage, QA teams can use real-time analysis to ascertain actual applica-tion usage from a functional perspective.
• Business process assurance analysis: This data can be used to perform more precise testing of critical business processes and ensure positive outcomes.
• User experience: Usage data often reveals insights into the quality of the user experience (such as response time, number of steps taken, unintended button clicks, confused user behavior and back-tracking).
Integrating Usage Analytics into Business Process Modeling
Figure 9
Insights
Automated tests
Analyze Agents
BPM enrichment
Test automation
Cap
ture
• Business processmodels
• BPMN export
Business processbenchmarking
Benchmark
• New requirementsTest scenarios
• Test data• BP repository App
Social Media Analytics
Figure 8
Socia
l Med
ia
Analy
sisE-Diagnose
Custo
mer
Expe
rienc
e
Analy
tics
Mobile App
Analysis
Analysis of social mediaactivity and data mining
to understand trends.
Assessment through comparative analysis of websites, analysis and inference building.
Analysis of customer experience throughomnichannel analysis.
Client mobile appbenchmarked against
competitor appson usability
and performance.
Value ofPerception
cognizant 20-20 insights 8
Looking Forward: Integrated Insights to Connect the Dots While each of the dimensions in our triad of insights is impactful in its own way, businesses can glean even more positive results by leveraging them via SOI by correlating data across the software lifecycle. For example, social analytics can provide insights into new feature requirements that can be correlated with devel-opment and test data on similar features to prescribe a suitable level of testing and predict quality risk in advance. This approach enables QA teams to provide support for frictionless process automation. In this case, process automation is supported by analytics-driven dynamic decisions that are made by intelligent robots. For instance, businesses can largely automate the delivery of a software build from development to the testing environment by using dynamic test sets (as described by insights into the software develop-ment stage), combined with automated testing and deployment processes.
Businesses can derive numerous benefits by taking this unified approach of collecting insights from the entire IT software lifecycle
and using analytics to improve QA. A predictive QA strategy ensures better business outcomes, improves IT resilience, reduces the cost of quality, shrinks deployment timelines and provides a robust QA decision support system for business and IT teams.
By integrating analytics across the IT lifecycle, encompassing business and operations, organiza-tions can also provide a combined view for real-time monitoring of key projects. Moreover, this approach helps simulate business require ments and enable what-if scenarios that can be played out for improving predictions. The combina-tion of analytics (intelli-gent QA) with autonomics (intelligent QA automation) facilitates a culture of continuous, frictionless QA across the entire lifecycle.
Predictive QA ensures better business outcomes, improves IT resilience, reduces the cost of quality, shrinks deployment timelines and provides a robust QA decision support system for business and IT teams.
Footnotes1 Shane Hastie, Stephane Wojewoda, “Standish Group 2015 Chaos Report - Q&A with Jennifer Lynch,” InfoQ,
Oct. 4, 2015, https://www.infoq.com/articles/standish-chaos-2015.
2 Lisa Bachelor and Patrick Collinson, “HSBC System Failure Leaves Thousands Facing Bank Holiday without Pay,” The Guardian, Aug. 28, 2015, http://www.theguardian.com/money/2015/aug/28/many-hsbc-custom-ers-facing-payday-without-pay.
3 Marion Dakers, “HSBC’s Online Banking Platform Goes Down,” The Telegraph, Jan. 5, 2016, http://www.telegraph.co.uk/finance/newsbysector/banksandfinance/12082198/hsbc-online-bank-platform-payments-are-down-glitch.html.
4 Kim Zetter, “Secret Code Found in Juniper’s Firewalls Shows Risk of Government Backdoors,” Wired, Dec. 18, 2015, https://www.wired.com/2015/12/juniper-networks-hidden-backdoors-show-the-risk-of-govern-ment-backdoors/.
5 Jenni Ryall, “Toyota and Nissan Recall Millions of Vehicles Due to Faulty Airbags,” Mashable, May 13, 2015, http://mashable.com/2015/05/13/toyota-nissan-airbag-recall/#.6JcMQO1XmqB.
About Cognizant
Cognizant (NASDAQ: CTSH) is a leading provider of information technology, consulting, and business process services, dedicated to helping the world’s leading companies build stronger businesses. Head-quartered in Teaneck, New Jersey (U.S.), Cognizant combines a passion for client satisfaction, technol-ogy innovation, deep industry and business process expertise, and a global, collaborative workforce that embodies the future of work. With over 100 development and delivery centers worldwide and approxi-mately 233,000 employees as of March 31, 2016, Cognizant is a member of the NASDAQ-100, the S&P 500, the Forbes Global 2000, and the Fortune 500 and is ranked among the top performing and fastest growing companies in the world. Visit us online at www.cognizant.com or follow us on Twitter: Cognizant.
World Headquarters500 Frank W. Burr Blvd.Teaneck, NJ 07666 USAPhone: +1 201 801 0233Fax: +1 201 801 0243Toll Free: +1 888 937 3277Email: [email protected]
European Headquarters1 Kingdom StreetPaddington CentralLondon W2 6BDPhone: +44 (0) 20 7297 7600Fax: +44 (0) 20 7121 0102Email: [email protected]
India Operations Headquarters#5/535, Old Mahabalipuram RoadOkkiyam Pettai, ThoraipakkamChennai, 600 096 IndiaPhone: +91 (0) 44 4209 6000Fax: +91 (0) 44 4209 6060Email: [email protected]
© Copyright 2016, Cognizant. All rights reserved. No part of this document may be reproduced, stored in a retrieval system, transmitted in any form or by any means, electronic, mechanical, photocopying, recording, or otherwise, without the express written permission from Cognizant. The information contained herein is subject to change without notice. All other trademarks mentioned herein are the property of their respective owners.
Codex 2062
About the AuthorsShamim Ahmed is a Lead for Digital Assurance, QA Product and Platforms, and Emerging Quality Engi-neering solutions within Cognizant’s Quality Engineering & Assurance business unit. Shamim leads the BU’s Quality Intelligence initiative, which leverages the power of big data analytics, autonomics and cognitive sciences. He is a thought leader in application lifecycle management and has more than 15 years of experience in large-scale application design and development, software product development and R&D, application quality assurance, organizational quality management, IT consulting and practice management. Prior to Cognizant, Shamim was a CTO for applications solutions in HP Software, where he led the development of enterprise solutions in mobility, DevOps, scaled agility and ALM consulting and application testing business. Shamim holds three U.S. patents and has received HP’s Innovator of the Year award. He previously held technical and management positions at Schlumberger Corp., where he led the development of several software products. Shamim has worked with companies in the telecom, oil and gas, automotive, financial services and e-commerce industries. He holds graduate degrees in computer science from the Massachusetts Institute of Technology, Cambridge, and a bachelor of technology from Indian Institute of Technology, Kharagpur. He can be reached at [email protected].
Anu Thothathri is leading the effort on the solution architecture for Quality Intelligence and predictive quality analytics within Cognizant’s Quality Engineering & Assurance business unit. QualityInsight is a key initiative that she drives as part of her focus on digital assurance transformation. Anu has 15-plus years of experience in solution architecture, experimental design, Agile and Lean transforma-tion, product management, technical product planning, product innovation and market research on enterprise software products. Prior to joining Cognizant, Anu was a Senior Product Manager/CTO for DataTracks, a purveyor of XBRL data analytics. Previously, as a Senior Solution Architect, Anu led efforts at HP on Agile and DevOps transformation, helping companies across the telecom, automotive, banking and financial services industries. She also spent 11 years at Nationwide Insurance, holding a variety of technical, architecture and management positions. She has a master’s degree in computer science from AD University and a degree in international business strategy from Indian Institute of Foreign Trade. Anu can be reached at [email protected].